Higher Education Management Information System …ppcollege.org.in/Higher Education Management...
16
Transcript of Higher Education Management Information System …ppcollege.org.in/Higher Education Management...

Higher Education Management Information System (HEMIS)
(For College & Universities in Odisha)
(Date Should be updated annually for submission of information as and when required. It must be
reflected in the institution website every year.)
Basic Information
1. Name of the College:- Panchayat Prahallad College.
2. I) College Code.:- 07142305
ii) State:- Odisha
iii) District:- Cuttack
iv) Name of the Block:- Nischintakoili
v) Name of the Gram Panchayat (for rural area)/Ward (for urban area):-Nischintakoili
vi) Website:- www.ppcollege.org.in
Vii) Total Area:- 7.82 Acr.
Viii) Total constructed Area:- 21.084.99 sq.mtr.
3. a) Complete postal address of the College
Post Office:-Nischintakoili Pin:-754207
Telephone number of the College (with STD Code:- 0671-2353626
b) Status of the College: Whether UGC 2f/12b status.:- 2f and 12b
Accreditation Status:- Accredited
If accredited, mention grade and validity period:
4. a. Nodal Officer Details: (For UGC)
i. Name:- Madan Mohan Jena
ii. Designation:- Reader in History
iii. Contact No:- 9437442726
iv. E-mail Id:-
b. Nodal Officer Details: (For RUSA)
i. Name:- Pratap Keshari Mohapatra.
ii. Designation:- Reader in History
iii. Contact No:- 9437990391
iv. E-mail Id:-
c. Nodal Officer Details: (For NAAC )
j. Name:- Pratap Keshari Mohapatra
v. Designation:- Reader in History
vi. Contact No:- 9437990391
vii. E-mail Id:-
5. University to which affiliated:- Utkal University, Vani Vihar,
Bhubaneswar. 6. The Statutory body through which reconized: UGC/AICTE/NCTE:-UGC
7. Year of affiliation with university:- 1984-1985
8. Whether College is Autonomous:- No
9. Status of the College:- UGC2f/12B
10. Accreditation Status:- Accredited
11. Validity of Accreditation:- 2005 to 2010

A. College Profile
1. What category of institution is this?
(Junior College=1, Degree College=2, Degree College with +2 level=3
P.G. College with +3 Levels=4, P.G. College
With +2 and +3 levels=5, others=6)
2. a. Year of establishment of the College
b. Year of recognition of the College:
c. if upgraded to a degree college, mention the year of
Up-gradation, Otherwise put zeroes in the boxes.
(if not applicable put 0001 in the boxes)
3. Status and source of funding of the College
(Recognized and fully funded by the state govt. =1, Recognized aided=2
Recognized but no aided by the govt. (i.e. Private un-aided)=3
Block Grant=4, Others=5)
4. Management of the College
(Govt.=1, Aided=2
Tribal welfare dept.=3, Social welfare dept.=4, Public Sector=5,
Private bodies such as Trusts/Missionaries/NGOs=6
Block grant=7, Unaided=8)
5. Type of College: (Boys only=1, Girls only=2, Co-edn=3)
6. Is it a College exclusively for students with special
Needs(CWNS)? (Yes=1, No=2)
7. Stream wise number of sections in the college:
Stream Whether Exists
(Yes=1, No=2)
No. of Sections in
UG
No. of Sections in PG
Arts 1 2
Science 1
Commerce
Self-Financing Courses
Professional Courses
Total 2 2
8. a. Area in which the college is located
(Rural=1, Urban=2)
b. Whether the College is located is hilly area:
(Yes-1, No=2)
c. whether the College functions in Own building? Yes/No:-Yes
9. Staff quarters available:-No
Category Number
Teaching Staff N.A
Non-Teaching Staff N.A
Total N.A
3
1979
1981
1981
2
2
3
2
1
2

10. i. Does the College has Students’ hostel? Yes/No.:-No
ii. Number of hostels: Boys: Girls:
SL. No. Hostel Type Name of Hostel Intake
Capacity
No. of Students
Residing
11. Programme Details:
Faculty Programme Subject Intake No . of
Students
Admitted
Programme
duration
Arts B.A. 256 244 03
M.A.
Science B.Sc. PCBM 64 56 03
M.Sc.
Commerce B.Come
M.Com
Self-financing
Professional
Certificate/Deploma/Vocational

B. College Enrolment (Year Wise)
1. Number of Students enrolled in the College:
Similarly you can enter data for B.sc./B. Com/M.A./M.Sc./M.Com/S.F. Courses/Professional Courses/Vocational/Certificate/Deploma
Courses respectively.
C. Staff Information (Teaching and Non-Teaching)
1. Total Number of Teachers
Sl.
No.
Department/Subject Sanctioned
Strength
No. of Regular Teachers in
Posting M /F total
No. of Part Time/
Temporary/Contractual/Guest
Teachers in postion M/F Total
Grand Total M/F Total
Male Female Total Male Female Total Male Female Total
1 English 4 3 1 4 3 1 4
2 Odia 5 1 1 2 1 1 2
3 History 4 2 1 3 2 1 3
4 Economics 3 2 1 3 2 1 3
5 Pol. Sc. 4 2 2 2 2
6 Philosophy 2 1 1 1 1
7 Sociology 2 1 1 1 1
Faculty Progra
mme
Subject Type(Ge
neral/S.F
./Prof/Vo
cational)
Year
on Roll
General
Boys/Girls/Total
Sc
Boys/Girls/Total
St
Boys/Girls/Total
OBC
Boys/Girls/Total
Minority
Boys/Girls/Total
Boys Girls Total Boys Girls Total Boys Girls Total Boys Girls Total Boys Girls Total
+3 1st Year
Arts
General
5 14 19 36 16 52 83 77 160 8 5 13
+3 2nd Year
Arts
General
9 8 17 32 16 48 71 26 97 8 1 9
+3 3rd Year
Arts
General
10 8 18 12 9 21 40 49 89 8 7 15
+3 1st Year
Science
General
4 2 6 4 5 9 21 17 38 3 0 3
+3 2nd Year
Science
General
2 3 5 2 5 7 11 20 31 1 2 3
+3 3rd Year
Science
General
0 7 7 1 1 2 15 23 38 1 0 1

8 Psychology 2 1 1 1 1
9 Physics 2 1 1 1 1
10 Chemistry 2 1 1 1 1 1 1 2
11 Mathematics 2 1 1 1 1
12 Botany 2 1 1 1 1 2 2
13 Zoology 2 1 1 1 1 2 2
14 Education 5 2 1 3 2 1 3
15 Physical education 1 1 1 1 1
16 Demoster 3 3 3 3 3
2. Training Status:
Sl# Name Department Educational
Qualification
No. of Refresher
Courses
Attended
No of
Training/Workshops
attended
No. of Papers
Published
No. of Books
published
1 Kalpana Mohanty English M.A. 04 02
2 Pallab Chakravarty English M.A,M.Phil
,PGDES 04 03
3 Asutosh Satapathy English M.A 02
4 Rajesh Kumar Panda English M.A
5 Dr. Prasant Kumar Rout Odia M.A, Ph.D 04
6 Dr Debajani Sinha Odia MA ,Ph.D
7 Madan Mohan Jena History MA, M. Phil 04 01
8 Pratap Keshari Mohapatra History M.A., M. Phil. 04 04
9 Sumitra Sahoo History MA
10 Sarojini Pattnayak Economics MA 04 04
11 Swadhinananda Parida Economics MA 02
12 Padmalochana Rout Economics MA ,LLB 01 10 04
13 Golak Chandra Mohapatra Political science MA 02
14 Pravakar Samal Political science MA 04 01
15 Dr Manmohan Pattnayak Education MA,M.Phill,Ph.D 02 01 02
16 Dr Tarulata Devi Education MA,M.Phill,Ph.D 04 15 02
17 Dr Alekha Chandra Samal Education MA, Ph.D 02
18 Nilakantha Sahoo Philosophy MA 01
19 Alaka Mohanty Sociology MA , B.ED 04
20 Amrish Swain Sociology MA,B.ED

21 Firdosh Ara Begum Psychology MA,Ph.d 01 01 07
22 Prasanta Bharati Physics M.Sc 02
23 Rashmi Ranjan Pattnayak Chemistry M.Sc 04
24 Padmaprava Swain Chemistry M.Sc 03
25 Swyangprava Samal Mathematics M.Sc
26 Sunil Kumar Dash Botany M.Sc 04
27 Depaka Kumar Dwvedy Botany M.Sc
28 Bijaya Kumar Mishra Zoology M.Sc 01
29 Sisir Kumar Sahoo Zoology M.Sc
3. No. of Ph.D.’s/M.Phil.
Sl# Name Department Year of award of Ph.D. Topic Male/Female
01 Pallab Chakravarty English M. Phill 1996 Metaphysical poetry and 17th century science Male
02 Dr Prasanta Kumar Rout Odia Ph.D 1993 IWò@û C_^ýûi ùe cû^aaû\ú Pò«û]ûeû Male
03 Dr. Debajani Sinha Odia Ph.D 2008
C}k i¹òk^ú c]êiê\^ I IWò@û iûjòZý GK
@¤d^ Female
04 Madana Mohana Jena History M. Phill 2001
Historiography of freedom movement in
Odisha Male
05 Pratap Keshari Mohapatra History M. Phill 1984
Ancient History of Orissa till the rise of
Kharabala Male
06 Dt. Manmohan Pattnayak Education Ph.D/M Phill 2016
Sri satysais philosophy of child Development
Education and care Male
07 Dr. Tarulata Devi Education Ph.D /M Phill 2007
A study of distance Education system in
Odisha Female
08 Dr. Alekha Chandra Samal
Education 2015
Variation in achievement level of class VII
students in relation to gender, social category
and students attendance
Male
09 Dr. Firdosh Ara Begum Psychology 2012
Psychology , social factors of well being the
elderly Female
10 Depaka Kumar Dwvedy Botany M. Phill 2012
4. Out of Total, number of teachers with disability:-
5. Out of total number of teacher belonging to religious minority community.
Non-Teaching Staff:
a. Total Number of Non-Teaching Staff:- Male Female
0
20 4
2

b. Out of Total, number of PWD (person with disability):
c. Out of total, number of teachers belonging to religious minority community:
d. Number of contractual/temporary staff Male: Female
6. Special achievement by the individual teacher/institution as a whole:
D. Infrastructure and Teaching-Learing Facilities
1. a. Does the College has its own building?
(Yes=1, No=2)
b. If Yes, the total covered area (in sq.) of the college building
Covering all the floors.
c. Area (in sq.m.) of vacant space in the college which can be
used for expansion of infrastructure facilities
d. Total area of the College in acress
2. Type of the College building.
(Pucca=1, partly pucca=2, kuchcha=3, tent=4, others=5)
3. Number and area of classrooms and others rooms in usable condition in the college(for
Each dept/office/common room/toilet/library etc.)
Sl. No. Dept./Lib/CR/Toilet/Office Number & Type of
rooms
Area(in sq.m) Remarks
1 Department & Lab 08 (Pucca) 3391 sq.m.
2 Library 01(Pucca) 1480 sq.m.
3 Class Room 14(Pucca) 8240 sq.m.
4 Toilet 09 (Pucca) 720 sq.m.
5 Office 03 (Pucca) 1580 sq.m.
6 Staff Common Room 01 (Pucca) 420 sq.m.
7 Union Office 01 (Pucca) 399 sq.m.
8 Store Room 02 (Pucca) 679 sq.m.
9 Athletic Room 01 (Pucca) 380 sq.m.
10 Ladies Common Room 02 (Pucca) 560 sq.m.
11 NSS 01 (Pucca) 140 sq.m.
12 +2 cultural Office 01 (Pucca) 100 sq.m.
13 College Canteen 01 (Pucca) 100 sq. m.
0 2
4 1
1
21.084.99 SQ. FT.
6.00
7.82
1

4. Does the College has the following facilities? (Yes=1,No=2)
a) Separate room for Principal
b) Separate room for vice-principal
c) Auditorium
d) Separate common room for girls
e) Separate common room for boys
f) Staff room for teachers
g) Separate room for female teachers
h) No. of library rooms.
i) No. of laboratory rooms
j) Room for indoor games
k) Co-curricular/activity room
l) NCC/NSS/Scout & Guide room.
m) First aid/Sick room
n) Room to store sports equipment
o) Guidance and counselling room
p) Room for chowkidar/watchman
q) Canteen
r) Botanical garden/social forestry
1
2
2
1
1
1
2
1
6
1
0
1
0
1
1
1
1
1
1

s) Playground
t) Conference hall
u) Health centre
v) Gymnasium/fitness centre
w) Indoor stadium
x) Computer centre
y) Guest house
z) Toilets: (boys=1, girls=2, with running water=3, without running water=4) Give details
In numbers for each category.
Boys Girls With Running Water
5. a) Does the college has boundary walls? (Yes=1, No=2)
b) if yes what kind of boundary walls does the college have?
(Pucca=1, Kuchcha=2, Partially Pucca=3, Pucca but Broken=4
Barbered wire fence=5, Green Fence=6, does not exist=7)
6. a) Does the College has electricity connection? (Yes=1, No=2)
b) Does the college has Generator set as a backup or substitute
for electricity facility? (Yes1, No=2)
7. Number of computers in working condition available in the College
a) For teaching & learning purposes
b) For use in college office
c) For use in library
d) For use in examination section
1
0
1
0
1
0
1, 4 2, 5 3 1
1
1
1
5
04
02
1

8. a) Does the College has Internet connectivity?
(Yes=1, No=2, not applicable=3)
b) if yes, what is the bandwidth?(if it is a broadband connection)
( Less than 256 kbps=1, more than 256 kbps=2, not applicable=3)
9. a) Does the college has drinking water facility available to students
Within the College premises? (Yes=1, No=2)
b) if yes, how many of the following sources of drinking water are available in the college?
Source of Drinking water Number
Tap 22
Hand Pump 3
Well 0
Bucket/Pot 6
E. Examination Results (Program wise/subject wise/Year wise)
Year Programme Total Students Appeared Total Student’s Passed % of pass
Boys Girls Total Boys Girls Total Boys Girls Total
2012 B.A. 30 29 59 22 27 49 73.33% 93.10% 83%
B.Sc. 15 11 26 7 9 16 46.66% 81.81% 61.05%
2013 B.A. 41 58 99 31 49 80 75.60% 84.48% 81%
B.Sc. 6 19 25 5 12 17 83.33% 63.15% 68%
2014 B.A. 31 47 78 22 37 59 71% 79% 75%
B.Sc. 14 18 32 9 16 25 64.28% 88.88% 80.64%
2015 B.A. 48 52 100 16 29 45 33.33% 55.76% 45%
B.Sc. 11 19 30 4 13 17 36.36% 68.42% 56%
2016 B.A. 41 57 98 24 36 60 58.53% 63.15% 61%
B.Sc. 12 24 36 5 21 26 41.66% 87.5% 72%
(Keep Data for at least five years)
1
2
1
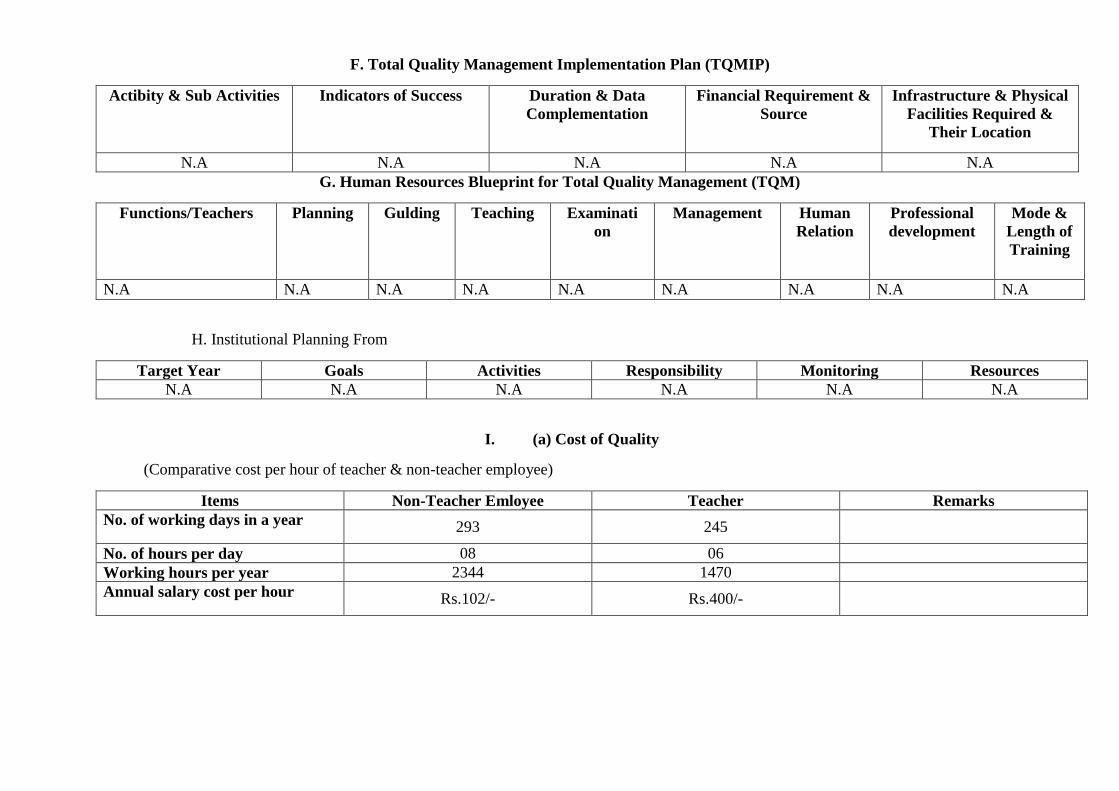
F. Total Quality Management Implementation Plan (TQMIP)
Actibity & Sub Activities Indicators of Success Duration & Data
Complementation
Financial Requirement &
Source
Infrastructure & Physical
Facilities Required &
Their Location
N.A N.A N.A N.A N.A
G. Human Resources Blueprint for Total Quality Management (TQM)
Functions/Teachers Planning Gulding Teaching Examinati
on
Management Human
Relation
Professional
development
Mode &
Length of
Training
N.A N.A N.A N.A N.A N.A N.A N.A N.A
H. Institutional Planning From
Target Year Goals Activities Responsibility Monitoring Resources
N.A N.A N.A N.A N.A N.A
I. (a) Cost of Quality
(Comparative cost per hour of teacher & non-teacher employee)
Items Non-Teacher Emloyee Teacher Remarks
No. of working days in a year 293 245
No. of hours per day 08 06
Working hours per year 2344 1470
Annual salary cost per hour Rs.102/- Rs.400/-

(b) Average cost of course by College
College Name Birect Indirect Total % of Student tution share
of direct cost
Science Nil
Arts Nil
Commerce
Self-financing courses
Physical education
Engineering
Fine Arts
J. (i) Financial Analysis (For University Only)
a. Expnditure:
Table: Approved Budget and actual expenditure (Year Wise)
Sl. No. Categories Bdgeted Actual % Spent
b. Income:
1. Government Subsidy:
2. Other Sources of Income
3. Past Trends and constraints

c. Table: Financial Indicators:
Sl. No. Description of the financial indicators
1 Average cost per faculty member
2 Average cost per administrative staff member
3 Average cost per student (includes capital expenditure)
4 Average cost per student(Excludes capital expenditure)
5 Expenditure for academic staff as a percentage of total expenditure
6 Expenditure for administrative staff as a percentage of total expenditure
7 Running and administrative expenditure as a percentage of total expenditure
8 Capital expenditure as a percentage of total expenditure
d. Structure of financial management.
1. The budget process
2. Basis of distributing internal resources
Resources are allocated internally taking into account the following factors
i. Number of academic staff per department
ii. Number of students per department
iii. Other specific needs
3. The latitude of departments to spend
The latitude of the departments to spend governmental resources is restricted by
i. Availability of funds
ii. Type of expense items
iii. Internal rules and control systems
iv. Allocation of funds for capital items is restricted to library books and
periodicals and laboratory equipments. All other expenditures may be
Controlled centrally.
v. The distribution of expenses on various expenditure object.
ii) The Cost of education activities at University:
The analysis of the cost of education at University for the Fiscal Year should be based on the criteria of cost per course/student.
Data should be collected from the finance section, and registrar, utilizing information derived from the computerized system of
expenditures and revenues.
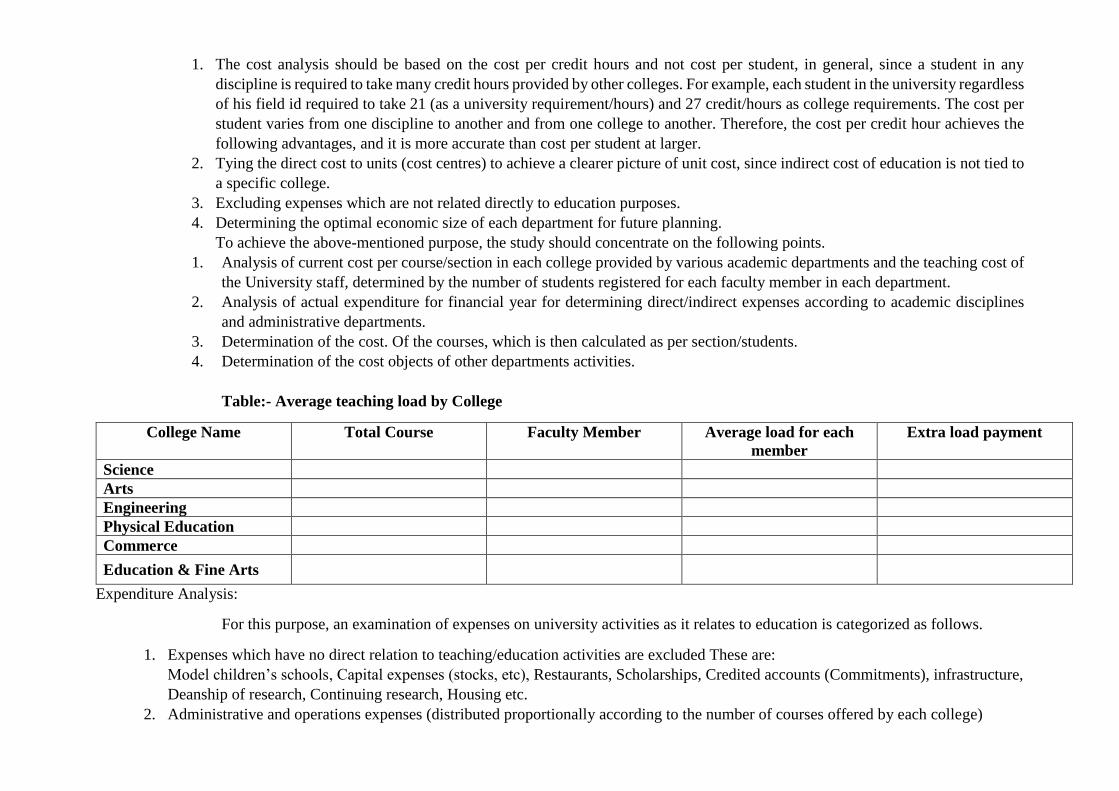
1. The cost analysis should be based on the cost per credit hours and not cost per student, in general, since a student in any
discipline is required to take many credit hours provided by other colleges. For example, each student in the university regardless
of his field id required to take 21 (as a university requirement/hours) and 27 credit/hours as college requirements. The cost per
student varies from one discipline to another and from one college to another. Therefore, the cost per credit hour achieves the
following advantages, and it is more accurate than cost per student at larger.
2. Tying the direct cost to units (cost centres) to achieve a clearer picture of unit cost, since indirect cost of education is not tied to
a specific college.
3. Excluding expenses which are not related directly to education purposes.
4. Determining the optimal economic size of each department for future planning.
To achieve the above-mentioned purpose, the study should concentrate on the following points.
1. Analysis of current cost per course/section in each college provided by various academic departments and the teaching cost of
the University staff, determined by the number of students registered for each faculty member in each department.
2. Analysis of actual expenditure for financial year for determining direct/indirect expenses according to academic disciplines
and administrative departments.
3. Determination of the cost. Of the courses, which is then calculated as per section/students.
4. Determination of the cost objects of other departments activities.
Table:- Average teaching load by College
College Name Total Course Faculty Member Average load for each
member
Extra load payment
Science
Arts
Engineering
Physical Education
Commerce
Education & Fine Arts
Expenditure Analysis:
For this purpose, an examination of expenses on university activities as it relates to education is categorized as follows.
1. Expenses which have no direct relation to teaching/education activities are excluded These are:
Model children’s schools, Capital expenses (stocks, etc), Restaurants, Scholarships, Credited accounts (Commitments), infrastructure,
Deanship of research, Continuing research, Housing etc.
2. Administrative and operations expenses (distributed proportionally according to the number of courses offered by each college)
Central administration, computer Centre, Public relations, Student deanships, Library, Admission and register, projects
office, auditing officer, Finance, Services, Social, Security, Insurance, Personnel, Development Office, Production, Supply, Security,
Building, Tender Office, Total
Data Analysis should be carried on:
i. Cost share of college employees in social security for each faculty’s teaching expenses
ii. The cost share of college employees of overload expenses
iii. College share of saving fund for their employees
iv. College share of cost on health insurance, investment, department
production and maintance.
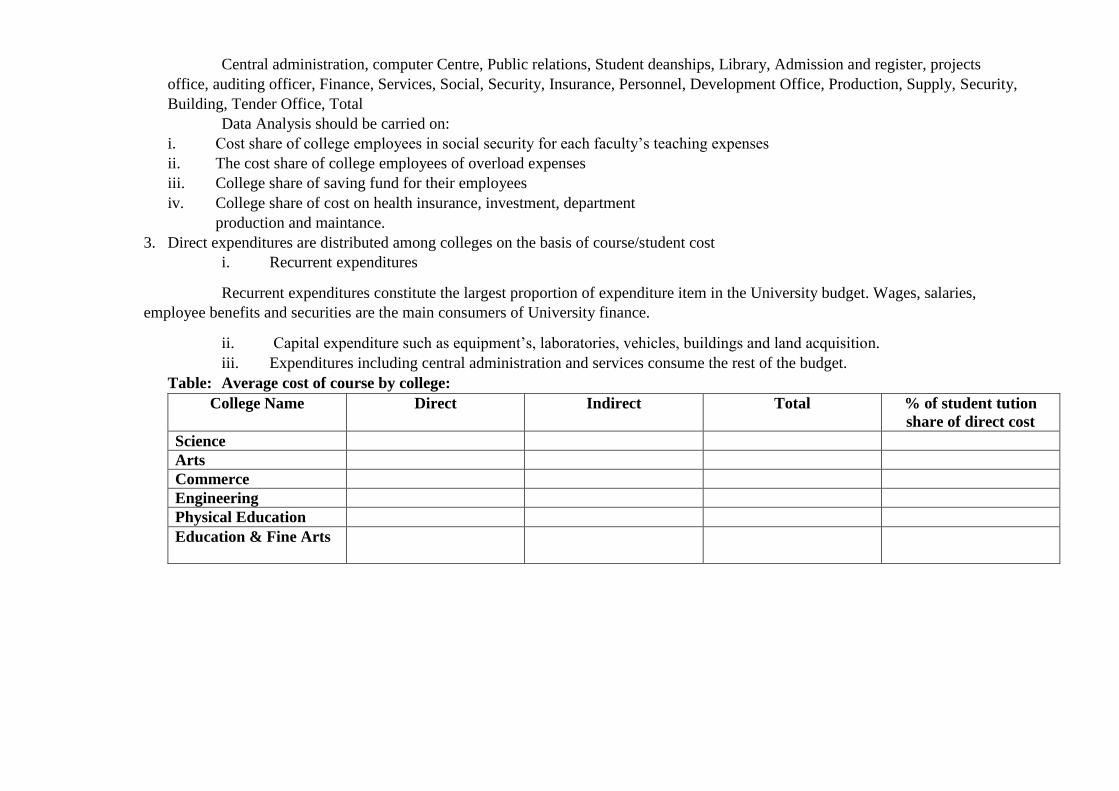
3. Direct expenditures are distributed among colleges on the basis of course/student cost
i. Recurrent expenditures
Recurrent expenditures constitute the largest proportion of expenditure item in the University budget. Wages, salaries,
employee benefits and securities are the main consumers of University finance.
ii. Capital expenditure such as equipment’s, laboratories, vehicles, buildings and land acquisition.
iii. Expenditures including central administration and services consume the rest of the budget.
Table: Average cost of course by college:
College Name Direct Indirect Total % of student tution
share of direct cost
Science
Arts
Commerce
Engineering
Physical Education
Education & Fine Arts