COLLABORATIVE GIS ENVIRONMENT FOR DISASTER MANAGEMENT
81
COLLABORATIVE GIS ENVIRONMENT FOR DISASTER MANAGEMENT: TOOLS AND ANALYSIS _______________ A Thesis Presented to the Faculty of San Diego State University _______________ In Partial Fulfillment of the Requirements for the Degree Master of Science in Homeland Security _______________ by Victor Alan Cordez Spring 2012
Transcript of COLLABORATIVE GIS ENVIRONMENT FOR DISASTER MANAGEMENT
COLLABORATIVE GIS ENVIRONMENT FOR DISASTER
MANAGEMENT: TOOLS AND ANALYSIS
_______________
A Thesis
Presented to the
Faculty of
San Diego State University
_______________
In Partial Fulfillment
of the Requirements for the Degree
Master of Science
in
Homeland Security
_______________
by
Victor Alan Cordez
Spring 2012


iii
Copyright © 2012
by
Victor Alan Cordes
All Rights Reserved
iv
ABSTRACT OF THE THESIS
Collaborative GIS Environment for Disaster Management: Tools and Analysis
by Victor Alan Cordes
Master of Science in Homeland Security San Diego State University, 2012
Deploying collaborative Geographic Information System (GIS) environments that are hosted in the cloud and facilitate crowdsourcing is one strategy for communities to adopt in the aftermath of disasters, such as tsunamis and earthquakes. The use of GIS in disaster management is critical to attain comprehensive situational awareness. The ability to fully understand the consequences of disasters enables responders to more efficiently distribute limited available resources. This paper analyzes popular tools, ranging from web services to mobile applications, that are currently employed for accomplishing the task of information collection and visualization. It then consolidates their various strengths and develops a single functional prototype application that offers a model for virtual incident command systems.
v
TABLE OF CONTENTS
PAGE
ABSTRACT ............................................................................................................................. iv
LIST OF TABLES .................................................................................................................. vii
LIST OF FIGURES ............................................................................................................... viii
ACKNOWLEDGEMENTS .......................................................................................................x
ACRONYMS ........................................................................................................................... xi
CHAPTER
1 INTRODUCTION .........................................................................................................1
The History & Evolution of “The Cloud”................................................................2
Geographic Information System ..............................................................................3
Application Programming Interface ........................................................................4
Crowdsourcing .........................................................................................................6
Current Applications in Use.....................................................................................7
Sahana ................................................................................................................8
Ushahidi .............................................................................................................9
OpenStreetMap ................................................................................................11
CrisisCommons ................................................................................................13
2 DATA ANALYSIS & SCENARIOS ..........................................................................15
Sahana ....................................................................................................................15
Ushahidi .................................................................................................................18
OpenStreetMap ......................................................................................................20
CrisisCommons ......................................................................................................26
Reflection ...............................................................................................................28
3 EMBEDDING FEATURES ON DATA ANALYSIS SPATIAL HUB ......................32
Emergency Relief DASH .......................................................................................33
User Interface .........................................................................................................34
Incident Mapping ...................................................................................................34
Incident Reporting .................................................................................................35

vi
Media Resources ....................................................................................................36
Map Editing Tools .................................................................................................36
Mobile Application Integration..............................................................................37
Embedded Communication & Information ...........................................................38
4 APPLICATION ON EXERCISE 24 ...........................................................................40
X24 DASH .............................................................................................................40
DASH User Interface .............................................................................................41
DASH Incident Mapping .......................................................................................43
DASH Incident Reporting......................................................................................50
DASH Media Resources ........................................................................................51
DASH Map Editing................................................................................................53
DASH Communication & Information ..................................................................54
5 FUTURE APPLICATIONS AND DEVELOPMENT ................................................62
Feature Enhancement .............................................................................................62
User Interface ...................................................................................................62
Incident Mapping .............................................................................................62
Incident Reporting ...........................................................................................63
Media Resources ..............................................................................................63
Map Editing Tools ...........................................................................................64
Embedded Communication & Information .....................................................64
Code Modification .................................................................................................65
Analytics ................................................................................................................65
Conclusion .............................................................................................................67
REFERENCES ........................................................................................................................68

vii
LIST OF TABLES
PAGE
Table 1. DCS Progressive Stages .............................................................................................66

viii
LIST OF FIGURES
PAGE
Figure 1. Visualization of the cloud. ..........................................................................................2
Figure 2. Google Map example – San Diego State University. .................................................5
Figure 3. Google Earth example – City of San Diego. ..............................................................5
Figure 4. Sahana home page. .....................................................................................................8
Figure 5. Original version of Ushahidi ....................................................................................10
Figure 6. Port-au-Prince - Google Maps. .................................................................................12
Figure 7. Port-au-Prince – OpenStreetMap. ............................................................................12
Figure 8. Oil reporter main screen. ..........................................................................................14
Figure 9. Sahana components and description. ........................................................................16
Figure 10. Sahana main interface.............................................................................................16
Figure 11. Sahana additional components. ..............................................................................17
Figure 12. Sahana component architecture. .............................................................................18
Figure 13. Ushahidi main interface. .........................................................................................19
Figure 14. Ushahidi map displaying death incidents. ..............................................................20
Figure 15. Ushahidi map filtering riot incidents. .....................................................................21
Figure 16. Ushahidi incident reports.. ......................................................................................21
Figure 17. Ushahidi SMS reporting. ........................................................................................22
Figure 18. OSM main interface. ..............................................................................................23
Figure 19. OSM in edit mode. .................................................................................................23
Figure 20. Frozen Potlatch 2 map editor. .................................................................................24
Figure 21. Potlatch 2 embedded video tutorial. .......................................................................25
Figure 22. OSM integrated into Ushahidi. ...............................................................................27
Figure 23. Oil reporter report interface. ...................................................................................28
Figure 24. Oil report web interface. .........................................................................................29
Figure 25. Oil reporter detailed submission. ............................................................................30
Figure 26. Oil tracker integrated into Ushahidi. ......................................................................31
Figure 27. DASH three-column layout. ...................................................................................42
ix
Figure 28. DASH header..........................................................................................................42
Figure 29. DASH tab navigator. ..............................................................................................44
Figure 30. DASH mapping interface. ......................................................................................45
Figure 31. Google Maps with GIS data. ..................................................................................45
Figure 32. Map state accordion child. ......................................................................................47
Figure 33. Expanded panels. ....................................................................................................47
Figure 34. Traffic layer. ...........................................................................................................48
Figure 35. Google Earth accordion child. ................................................................................48
Figure 36. Google Earth application state................................................................................49
Figure 37. Building layer of Downtown, San Diego. ..............................................................49
Figure 38. USGS KML loaded into DASH. ............................................................................50
Figure 39. DASH incident reporting. .......................................................................................51
Figure 40. Updated map. ..........................................................................................................52
Figure 41. DASH video. ..........................................................................................................52
Figure 42. Map state drawing tools..........................................................................................53
Figure 43. Drawing overlays....................................................................................................54
Figure 44. Overlay details. .......................................................................................................55
Figure 45. Drawing tab details view. .......................................................................................55
Figure 46. Save map feature. ...................................................................................................56
Figure 47. Select and upload file to resource library. ..............................................................56
Figure 48. Custom map loaded into DASH. ............................................................................57
Figure 49. Right column content. ............................................................................................58
Figure 50. DASH chat..............................................................................................................59
Figure 51. DASH localization..................................................................................................59
Figure 52. Accordion menu in English. ...................................................................................60
Figure 53. DASH accordion in Spanish. ..................................................................................61

x
ACKNOWLEDGEMENTS
It is a pleasure to thank the people who made this thesis possible:
Above all, I would like to thank Dr. Eric Frost, Dr. Sam Kassegne, and Akshay
Pottathil for their enthusiasm, encouragement, instruction, and inspiration throughout this
entire process.
I would also like to extend my appreciation to the Center for Information and
Technology and her staff, whose warm and hospitable atmosphere provided the serenity
required to accomplish such an undertaking.

xi
ACRONYMS
• AMF Action Message Format
• API Application Programming Interface
• DASH Data Analysis Spatial Hub
• DCS Digital Communication Surveillance
• FOSS Free and Open Source Community
• GIS Geographic Information Sources
• GIS Geographic Information Systems
• GPS Global Positions Satellite
• ICS Incident Command System
• JOSM Java OpenStreetMap Editor
• KML Keyhole Markup Language
• LAMP Linux, Apache, MySql, PHP
• NGO Non-Governmental Organization
• OSM OpenStreetMap
• RIA Rich Internet Application
• RSS Really Simple Syndication
• SAFER Spatial Analysis for Emerging Risk
• SaaS Software as a Service
• SMS Short Message Service
• UI User Interface
• X24 Exercise 24

1
CHAPTER 1
INTRODUCTION
Natural and synthetic disasters have and will continue to pose a considerable threat to
the human capital and infrastructure of the United States. Floods, earthquakes, tsunamis,
terrorist attacks, etc. all serve to disrupt society as it frantically attempts to cope with the
inherent chaos and disarray of these events that ultimately lead to death and destruction. An
effective response policy must deploy all efficient tools at its disposable so as to reinforce the
first and subsequent waves of core emergency services—such as first responders—in order to
negate or greatly diminish the consequences of these disasters. This necessarily implies
ameliorating organization, situational awareness, communication, management, and
decision-making.
As with any worthwhile endeavor in the 21st century the correct application of
information technology—defined as any interconnected system used in the automated
acquisition, storage, manipulation, display, and interchange of data or information1
1 “National Defense Authorization Act for Fiscal Year 1996,” U.S. Govermenting Printing Office,
Accessed March 5, 2012, http://www.gpo.gov/fdsys/pkg/PLAW-104publ106/pdf/PLAW-104publ106.pdf.
—can
contribute towards a solution in a relatively significant way. The realm of emergency
management is no exception. As the World Wide Web continues to evolve into a viable, and
even preferred, platform that can service increasingly powerful technologies, communities
are presented with many new possibilities to resolve disaster relief’s most vexing problems.
In fact, this is precisely the current trend. Various online tools leverage the power of the
Internet to combat the devastating effects of disasters. By deploying virtualization software
in the cloud and combining the benefits of geographic information sources (GIS) with open
application programming interfaces (API) and crowdsourcing techniques, developers have
effectively laid the foundation for a viable long-term solution that will prove indispensible to
the emergency relief community. The challenge is to refine this solution by developing
efficient variants that incorporate the more useful aspects of the currently available products.
2
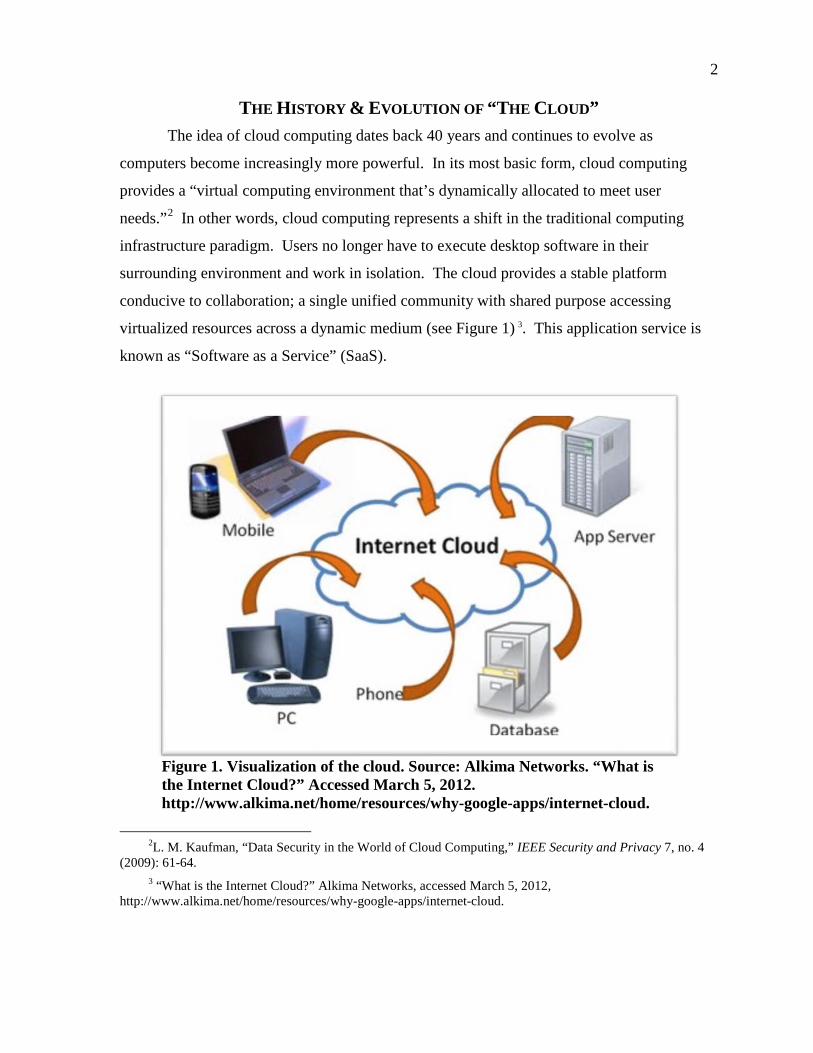
THE HISTORY & EVOLUTION OF “THE CLOUD” The idea of cloud computing dates back 40 years and continues to evolve as
computers become increasingly more powerful. In its most basic form, cloud computing
provides a “virtual computing environment that’s dynamically allocated to meet user
needs.”2 In other words, cloud computing represents a shift in the traditional computing
infrastructure paradigm. Users no longer have to execute desktop software in their
surrounding environment and work in isolation. The cloud provides a stable platform
conducive to collaboration; a single unified community with shared purpose accessing
virtualized resources across a dynamic medium (see Figure 1) 3
. This application service is
known as “Software as a Service” (SaaS).
Figure 1. Visualization of the cloud. Source: Alkima Networks. “What is the Internet Cloud?” Accessed March 5, 2012. http://www.alkima.net/home/resources/why-google-apps/internet-cloud.
2L. M. Kaufman, “Data Security in the World of Cloud Computing,” IEEE Security and Privacy 7, no. 4
(2009): 61-64. 3 “What is the Internet Cloud?” Alkima Networks, accessed March 5, 2012,
http://www.alkima.net/home/resources/why-google-apps/internet-cloud.
3
Moreover, because access to the cloud occurs over the Internet, cloud computing is
far more flexible in terms of location of access than its desktop variant.4 Any node5
GEOGRAPHIC INFORMATION SYSTEM
that is
connected to the Internet can contact the cloud and thus interact with its virtual software.
This is advantageous to the disaster relief community as near real-time information from the
affected area can be relayed to the cloud, effectively informing the connected community of
developments as they occur in the area. Cloud computing satisfies basic criteria of efficient
disaster response including communication and organization.
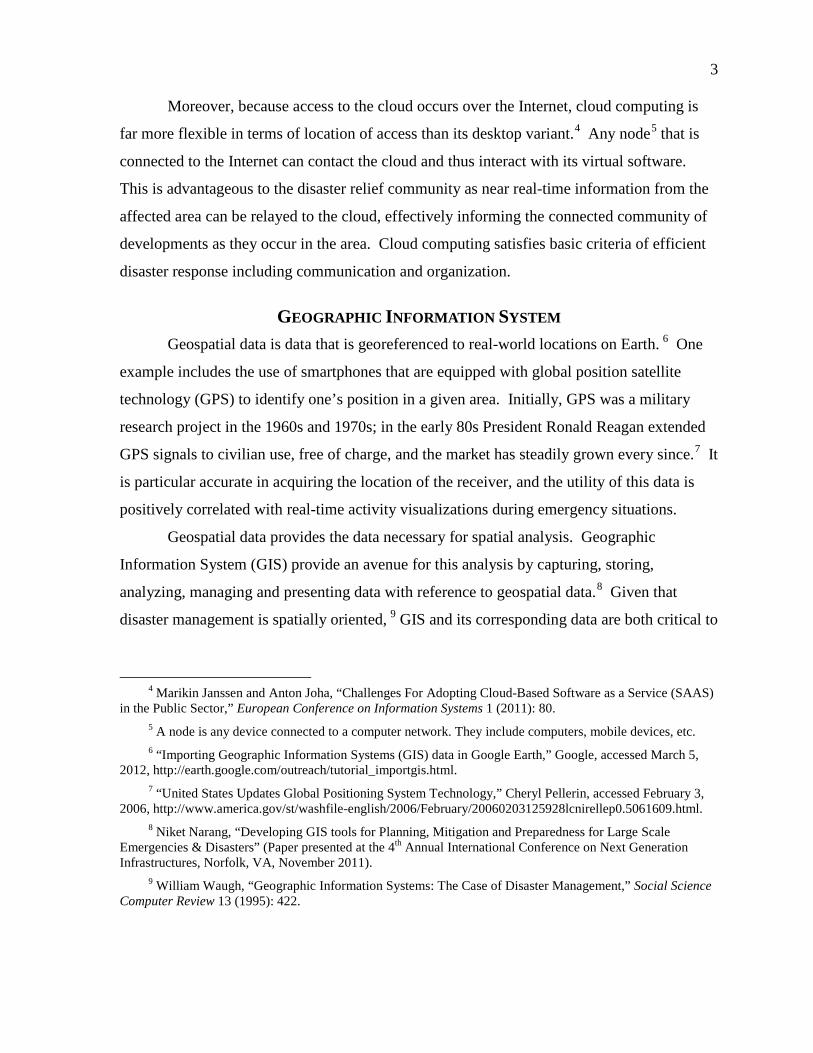
Geospatial data is data that is georeferenced to real-world locations on Earth. 6 One
example includes the use of smartphones that are equipped with global position satellite
technology (GPS) to identify one’s position in a given area. Initially, GPS was a military
research project in the 1960s and 1970s; in the early 80s President Ronald Reagan extended
GPS signals to civilian use, free of charge, and the market has steadily grown every since.7
Geospatial data provides the data necessary for spatial analysis. Geographic
Information System (GIS) provide an avenue for this analysis by capturing, storing,
analyzing, managing and presenting data with reference to geospatial data.
It
is particular accurate in acquiring the location of the receiver, and the utility of this data is
positively correlated with real-time activity visualizations during emergency situations.
8 Given that
disaster management is spatially oriented, 9
4 Marikin Janssen and Anton Joha, “Challenges For Adopting Cloud-Based Software as a Service (SAAS)
in the Public Sector,” European Conference on Information Systems 1 (2011): 80.
GIS and its corresponding data are both critical to
5 A node is any device connected to a computer network. They include computers, mobile devices, etc. 6 “Importing Geographic Information Systems (GIS) data in Google Earth,” Google, accessed March 5,
2012, http://earth.google.com/outreach/tutorial_importgis.html. 7 “United States Updates Global Positioning System Technology,” Cheryl Pellerin, accessed February 3,
2006, http://www.america.gov/st/washfile-english/2006/February/20060203125928lcnirellep0.5061609.html. 8 Niket Narang, “Developing GIS tools for Planning, Mitigation and Preparedness for Large Scale
Emergencies & Disasters” (Paper presented at the 4th Annual International Conference on Next Generation Infrastructures, Norfolk, VA, November 2011).
9 William Waugh, “Geographic Information Systems: The Case of Disaster Management,” Social Science Computer Review 13 (1995): 422.
4
effective disaster response in that they can be molded into a format that contributes to better
decision-making and improved communication.
In order for the data to be of any use to emergency responders it must be processed
into an output that is easily decipherable. After all, data as a series of geographic
coordinates stored as individual records in large multi-row multi-column tables will dissuade
committed volunteers from engaging the problem. Mapping applications bridge this gap by
overlaying GIS data onto existing maps (satellite imagery, street maps, etc.). The end result
is increased situational awareness: users can acquire a more specific understanding of a
disaster stricken area and focus their efforts where they are most needed.
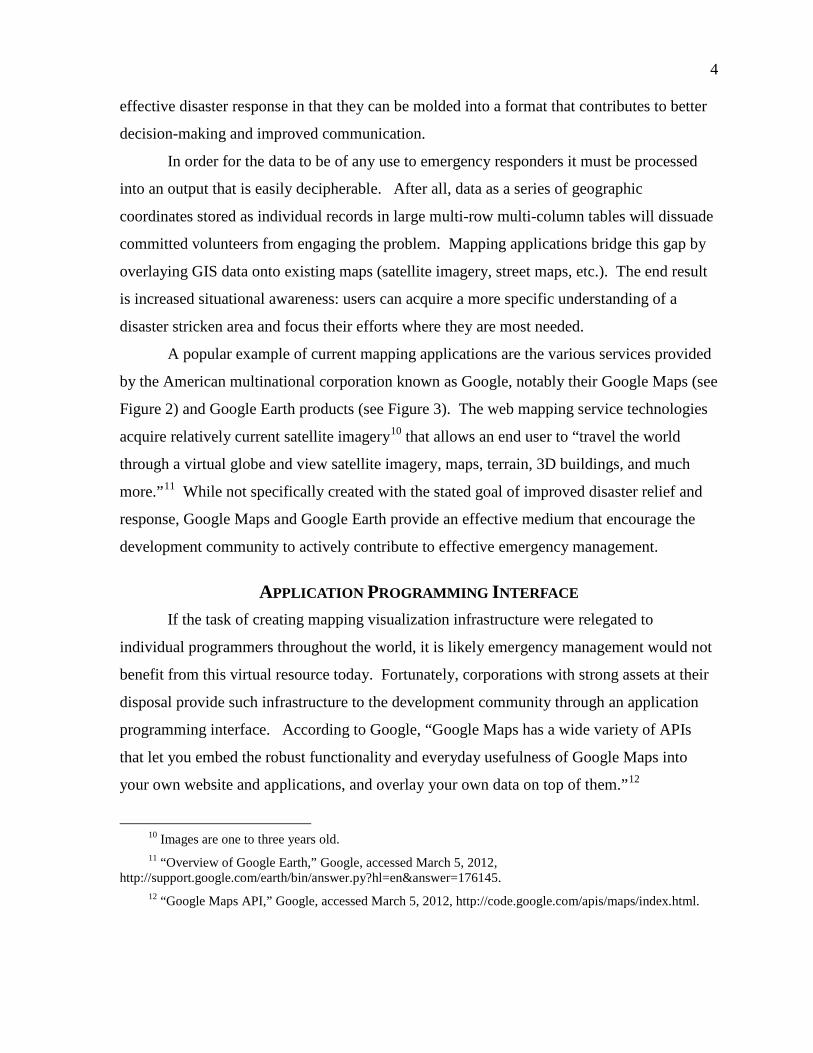
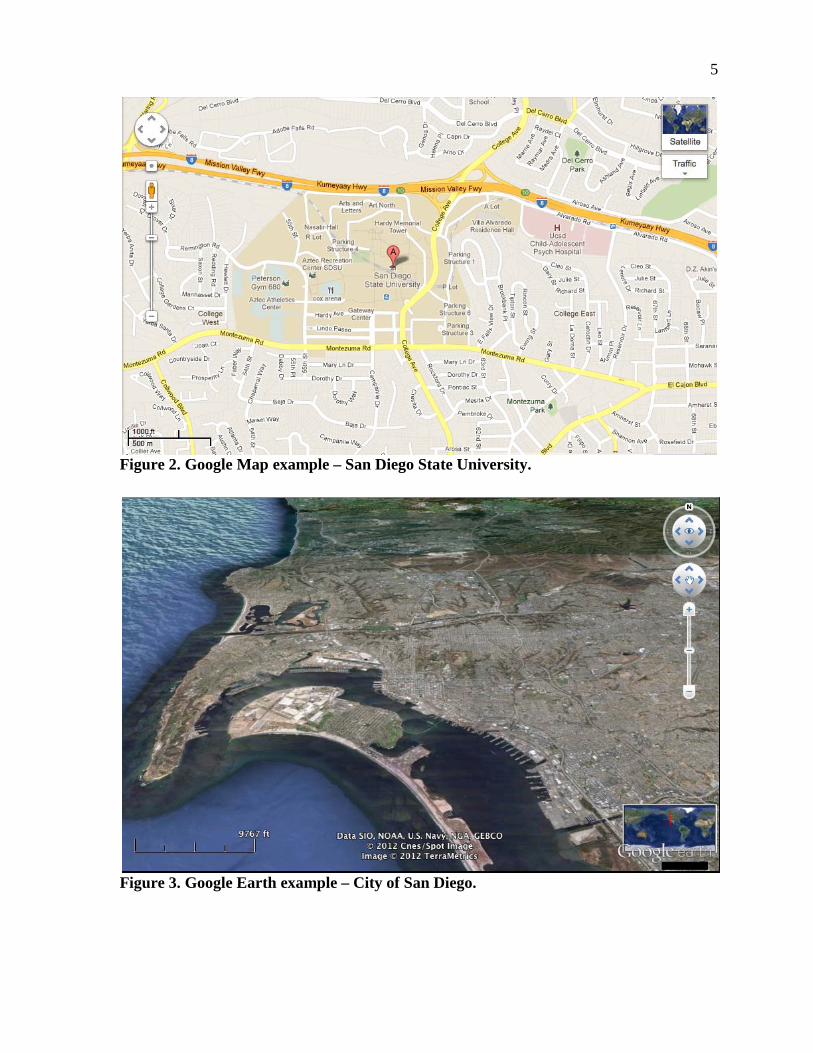
A popular example of current mapping applications are the various services provided
by the American multinational corporation known as Google, notably their Google Maps (see
Figure 2) and Google Earth products (see Figure 3). The web mapping service technologies
acquire relatively current satellite imagery10 that allows an end user to “travel the world
through a virtual globe and view satellite imagery, maps, terrain, 3D buildings, and much
more.”11
APPLICATION PROGRAMMING INTERFACE
While not specifically created with the stated goal of improved disaster relief and
response, Google Maps and Google Earth provide an effective medium that encourage the
development community to actively contribute to effective emergency management.
If the task of creating mapping visualization infrastructure were relegated to
individual programmers throughout the world, it is likely emergency management would not
benefit from this virtual resource today. Fortunately, corporations with strong assets at their
disposal provide such infrastructure to the development community through an application
programming interface. According to Google, “Google Maps has a wide variety of APIs
that let you embed the robust functionality and everyday usefulness of Google Maps into
your own website and applications, and overlay your own data on top of them.”12
10 Images are one to three years old.
11 “Overview of Google Earth,” Google, accessed March 5, 2012, http://support.google.com/earth/bin/answer.py?hl=en&answer=176145.
12 “Google Maps API,” Google, accessed March 5, 2012, http://code.google.com/apis/maps/index.html.
5
Figure 2. Google Map example – San Diego State University.
Figure 3. Google Earth example – City of San Diego.
6
Technically, an API allows for communication over a network between two computer
applications using a common language.13 It permits third party developers to make
standardized requests for access to data and services from the interface provider in order to
create custom applications for end users that might not otherwise be possible. Developers
can initiate such requests within the source code14
The beauty of API is that the provider only exposes choice data and/or functionality
to the developer. In this sense, a developer need not be concerned with the inner workings of
how a Google Map is created and displayed on screen. The only care is that when a request
is made to generate a map object within a custom application said map appears and is
available at all times.
of their applications.
15
CROWDSOURCING
This enables third party developers to only focus on the content they
wish to create rather than getting bogged down by technicalities they are uninterested in. On
the flipside, APIs are also beneficial to the provider as they can extend the value and purpose
of a product beyond the initial intent, thus increasing the exposure and popularity of the
company across the World Wide Web. Ultimately, APIs such as Google Maps play a key
role in providing the imagery infrastructure necessary to visualize GIS data. Consolidating
these resources and exposing them over a cloudlike infrastructure affords communities the
opportunity to positively contribute and collaborate towards disaster relief operations.
Jeff Howe and Mark Robinson first coined the term crowdsourcing in 2006; it
represented a new web-based business model for facilitating problem solving.16
13 Daniel Jacobson, Greg Brail, and Dan Woods, APIS: A Strategy Guide (Sebastopol: O’Reilly, 2011), 5.
Deploying
collaborative software on the cloud for people of all backgrounds to access and manipulate
towards a common end goal is the essence of crowdsourcing. In its most basic form,
14 Code written by a programmer that is eventually processed and executed by a computer. 15 The utility of APIs is directly correlated to its stability. For example, few would deploy Google Maps
API if it was consistently unavailable during x and y hours of the week. This is especially true for the disaster relief community as disasters are prone to strike at any given moment and can last for long periods of time.
16 Daren C. Brabham, “Crowdsourcing as a Model for Problem Solving: An Introduction and Cases,” Convergence 14 (2008): 76.

7
crowdsourcing is shorthand for a diverse range of activities over the Internet.17
If crowdsourcing is reliant upon a network of people to resolve various tasks, then it
follows that the Internet—a network of networks—is the greatest facilitator for aggregating
relevant services with heterogeneous human capital to enable fluidity of collaboration and
data sharing. By developing stable and flexible software on the cloud that effectively
leverages the power of various APIs with the accuracy of GIS data, crowdsourcing and
disaster relief operations can coalesce to become a viable emergency relief vector. As we
have already observed, all of the necessary components already exist. The ongoing challenge
is to consolidate the disparate elements and fuse them together into a single all-encompassing
application.
The “crowd”
is outsourced a variety of tasks that upon completion contribute to a solution for a given
problem. In our context, mass collaboration by a group of contributors can provide unique
and diversified insight into the problem of how to efficiently respond to a disaster relief
situation. Ultimately the quality of the solution is reinforced, which directly translates into
saved lives by more efficiently dispersing available resources.
CURRENT APPLICATIONS IN USE The development of emergency relief software has seen considerable investment in
the past several years, spurred on by both rapid technological advancements (i.e. wide
availability of computers and cheaper GPS units)18
17 J. G. Davis, “From Crowdsourcing to Crowdservicing,” Institute of Electrical and Electronics Engineers
15, no. 3 (2011): 92-94.
and the rate at which the 21st century has
been plagued by a multitude of disasters. It is necessary to analyze these applications in
order to provide context towards a refined solution. Four initiatives—Sahana, Ushahidi,
OpenStreetMap, and CrisisCommons—will be briefly discussed below. A more in depth
analysis of their features will be discussed in the following chapter.
18 Matthew Zook, Mark Graham, Taylor Shelton, and Sean Gorman, “Volunteered Geographic Information and Crowdsourcing Disaster Relief: A Case Study of the Haitian Earthquake,” World Medical & Health Policy 2, no. 2 (2010): Artcile 2.
8
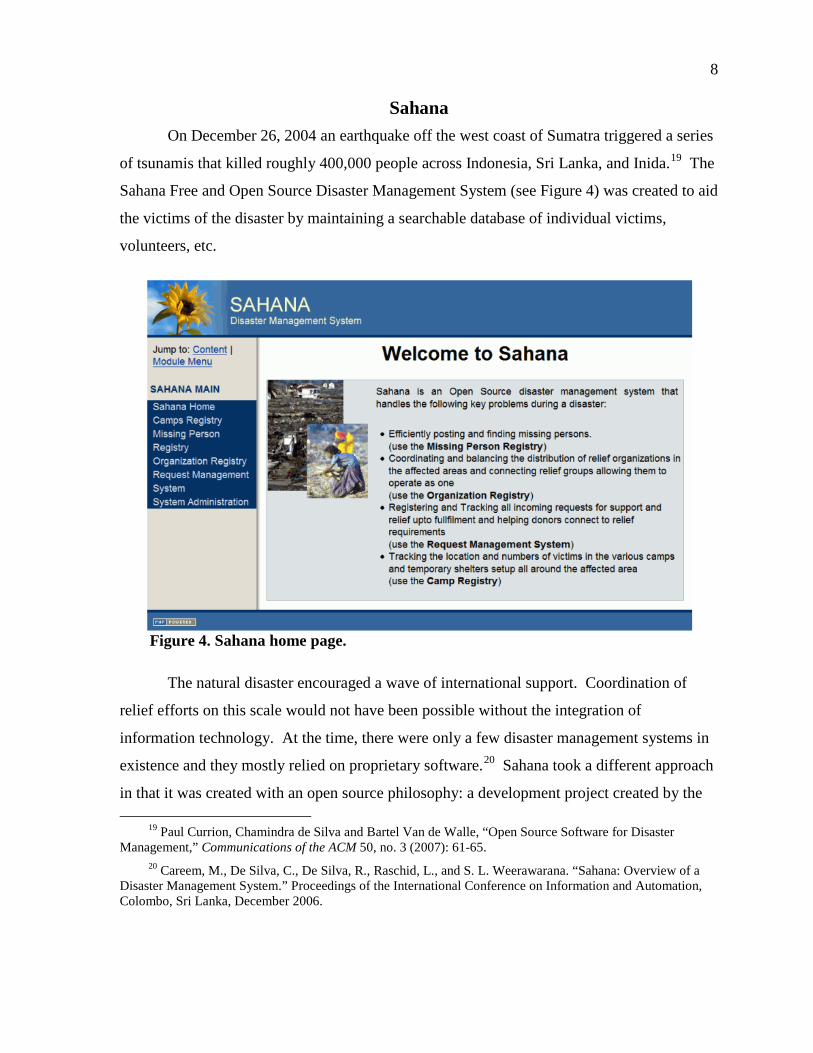
Sahana On December 26, 2004 an earthquake off the west coast of Sumatra triggered a series
of tsunamis that killed roughly 400,000 people across Indonesia, Sri Lanka, and Inida.19
The
Sahana Free and Open Source Disaster Management System (see Figure 4) was created to aid
the victims of the disaster by maintaining a searchable database of individual victims,
volunteers, etc.
Figure 4. Sahana home page.
The natural disaster encouraged a wave of international support. Coordination of
relief efforts on this scale would not have been possible without the integration of
information technology. At the time, there were only a few disaster management systems in
existence and they mostly relied on proprietary software.20
19 Paul Currion, Chamindra de Silva and Bartel Van de Walle, “Open Source Software for Disaster
Management,” Communications of the ACM 50, no. 3 (2007): 61-65.
Sahana took a different approach
in that it was created with an open source philosophy: a development project created by the
20 Careem, M., De Silva, C., De Silva, R., Raschid, L., and S. L. Weerawarana. “Sahana: Overview of a Disaster Management System.” Proceedings of the International Conference on Information and Automation, Colombo, Sri Lanka, December 2006.
9
people for the benefit of the people that encouraged free redistribution. It was not developed
for commercial purposes. As such, its source code is publicly available for anyone to
acquire, study, and improve upon. In other words, Sahana is completely transparent—an
important attribute for community embracement and acceptance.
Due to its success, Sahana was deployed in subsequent disasters such as the October
2005 Pakistan earthquake, the 2006 Philippines mudslides, and the 2006 Yogyakatra
earthquake in Indonesia.21 Sahana effectively brought efficiency to disaster coordination and
response. Throughout the years it has gained increased support from the Free and Open
Source Community (FOSS) and has received recognition for its novelty.22 Additionally,
Sahana deployments have received support from the private sector, such as IBM crisis
response teams.23
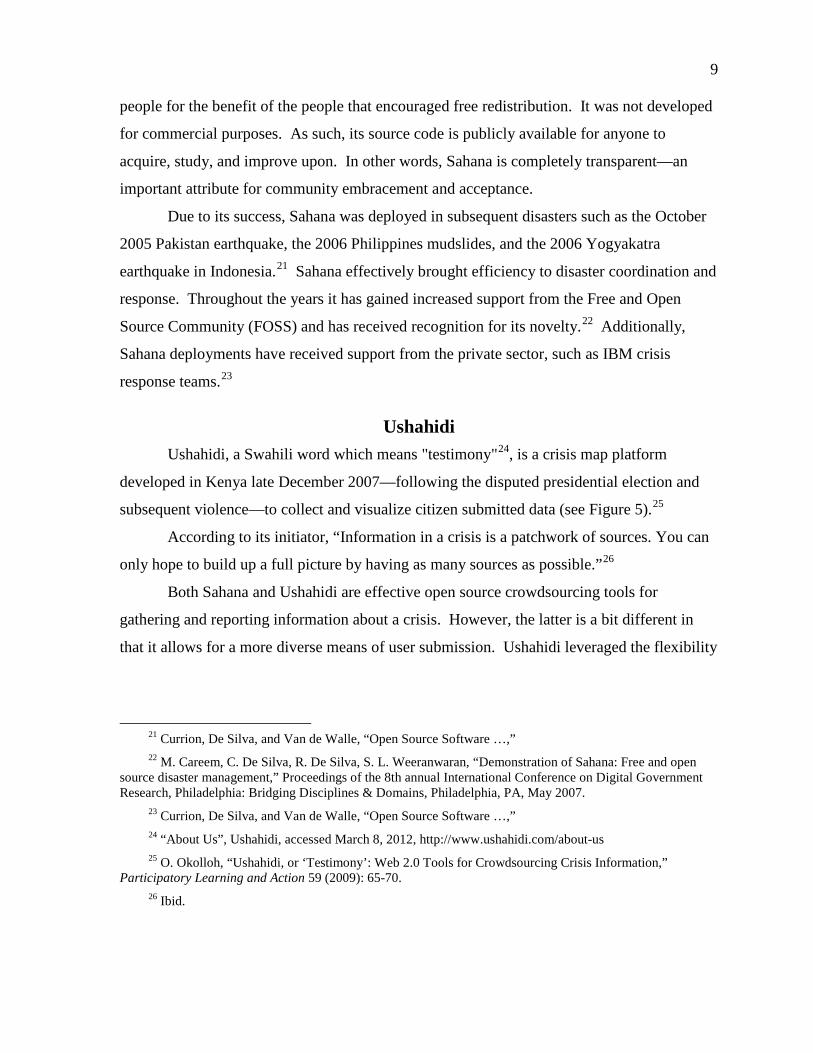
Ushahidi
Ushahidi, a Swahili word which means "testimony"24, is a crisis map platform
developed in Kenya late December 2007—following the disputed presidential election and
subsequent violence—to collect and visualize citizen submitted data (see Figure 5).25
According to its initiator, “Information in a crisis is a patchwork of sources. You can
only hope to build up a full picture by having as many sources as possible.”
26
Both Sahana and Ushahidi are effective open source crowdsourcing tools for
gathering and reporting information about a crisis. However, the latter is a bit different in
that it allows for a more diverse means of user submission. Ushahidi leveraged the flexibility
21 Currion, De Silva, and Van de Walle, “Open Source Software …,” 22 M. Careem, C. De Silva, R. De Silva, S. L. Weeranwaran, “Demonstration of Sahana: Free and open
source disaster management,” Proceedings of the 8th annual International Conference on Digital Government Research, Philadelphia: Bridging Disciplines & Domains, Philadelphia, PA, May 2007.
23 Currion, De Silva, and Van de Walle, “Open Source Software …,” 24 “About Us”, Ushahidi, accessed March 8, 2012, http://www.ushahidi.com/about-us 25 O. Okolloh, “Ushahidi, or ‘Testimony’: Web 2.0 Tools for Crowdsourcing Crisis Information,”
Participatory Learning and Action 59 (2009): 65-70. 26 Ibid.
10
Figure 5. Original version of Ushahidi. Source: Ushahidi. “Incident Map.” Accessed March 19, 2012, http://www.legacy.ushahidi.com.
and wider availability of mobile technology among the population to create a more complete
understanding of events as they were occurring. Its website made possible reporting of
incidents via short message service (SMS) and the website itself.27
One of the more significant advantages of cell-phone based submissions is the ability
to leverage GPS technology to geo-tag the location of a report. Acquiring this geographic
data is important as it can be converted into a format displayable on an online map.
In short, Ushahidi could
integrate data from a variety of sources.
27 Ibid.
11
Situational awareness of the disaster was greatly enhanced and the project “could direct
people to locations in which relief actions were needed.”28
Ushahidi was a success. As it became increasingly popular among the public, its
utility was expanded upon and utilized in other crisis situations around the globe. The
software was deployed during the 2010 Pakistan floods, the H1N1 viral outbreak of 2009, the
ongoing violence in Gaza, etc. As was the case with Sahana, the increased exposure led to
new and additional sources of funding. For example, in December 2009 Ushahidi received a
$1.4M grant from Omidyar Network, an organization that “invests in and helps scale
innovative organizations to catalyze economic and social change.”
29
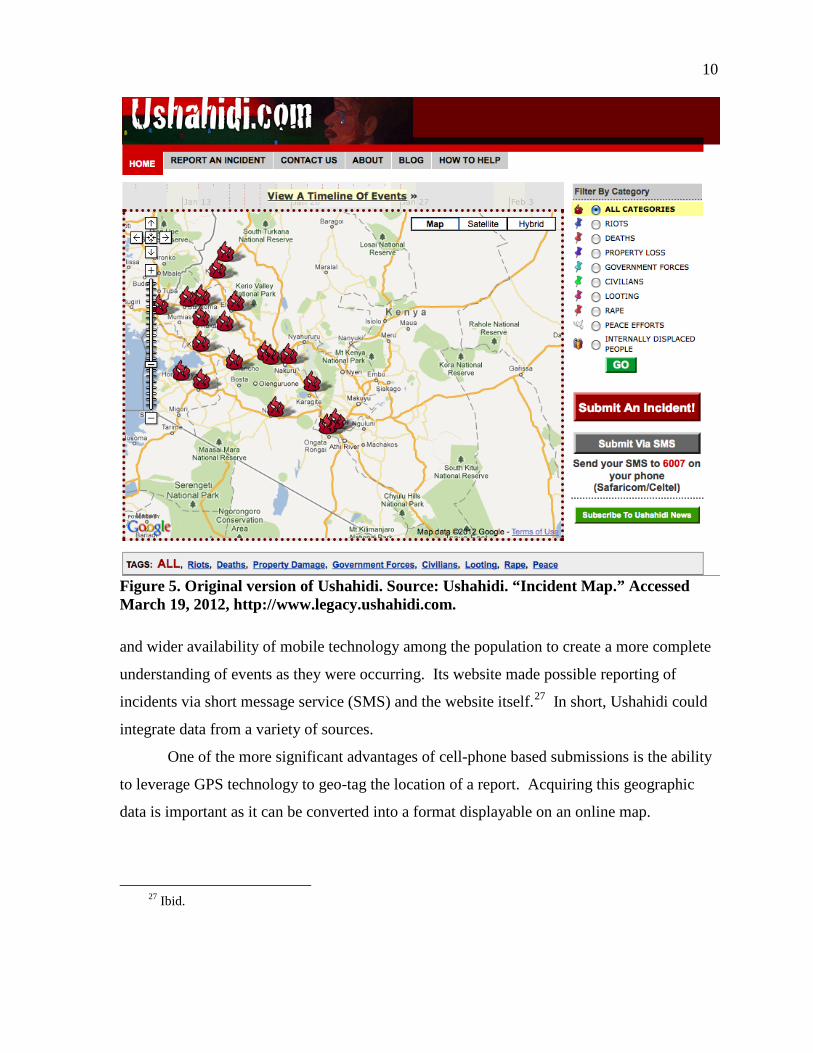
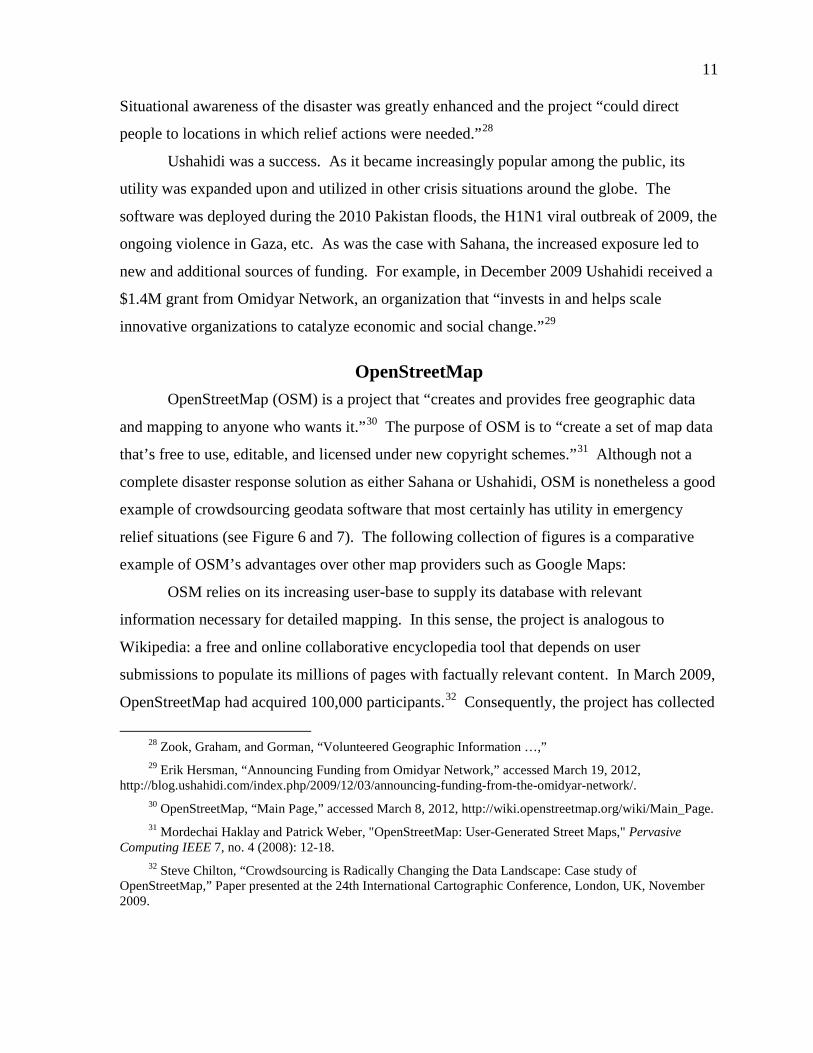
OpenStreetMap
OpenStreetMap (OSM) is a project that “creates and provides free geographic data
and mapping to anyone who wants it.”30 The purpose of OSM is to “create a set of map data
that’s free to use, editable, and licensed under new copyright schemes.”31
OSM relies on its increasing user-base to supply its database with relevant
information necessary for detailed mapping. In this sense, the project is analogous to
Wikipedia: a free and online collaborative encyclopedia tool that depends on user
submissions to populate its millions of pages with factually relevant content. In March 2009,
OpenStreetMap had acquired 100,000 participants.
Although not a
complete disaster response solution as either Sahana or Ushahidi, OSM is nonetheless a good
example of crowdsourcing geodata software that most certainly has utility in emergency
relief situations (see Figure 6 and 7). The following collection of figures is a comparative
example of OSM’s advantages over other map providers such as Google Maps:
32
28 Zook, Graham, and Gorman, “Volunteered Geographic Information …,”
Consequently, the project has collected
29 Erik Hersman, “Announcing Funding from Omidyar Network,” accessed March 19, 2012, http://blog.ushahidi.com/index.php/2009/12/03/announcing-funding-from-the-omidyar-network/.
30 OpenStreetMap, “Main Page,” accessed March 8, 2012, http://wiki.openstreetmap.org/wiki/Main_Page. 31 Mordechai Haklay and Patrick Weber, "OpenStreetMap: User-Generated Street Maps," Pervasive
Computing IEEE 7, no. 4 (2008): 12-18. 32 Steve Chilton, “Crowdsourcing is Radically Changing the Data Landscape: Case study of
OpenStreetMap,” Paper presented at the 24th International Cartographic Conference, London, UK, November 2009.
12
Figure 6. Port-au-Prince - Google Maps.
Figure 7. Port-au-Prince – OpenStreetMap.
13
“more detailed mapping than traditional mapping suppliers.”33
CrisisCommons
OSM has obvious benefits to
emergency relief situations as multiple non-governmental organizations (NGO) and
volunteers can enter into a disaster stricken area and create new maps reflective of the new
situation.
CrisisCommons is a diverse representation of volunteers who “want to connect
people with the technology and data that can be vital in times of crisis.”34 Since its inception
in 2009 CrisisCommons has established numerous “CrisisCamps” across the globe: barcamp
events to “connect crisis management and global development practitioners to the technology
volunteer community.”35
CrisisCommons is another example of community collaboration and crowdsourcing.
By consolidating the experience and knowledge of their CrisisCamp members, unique
solutions and approaches to global challenges are developed in ways never before seen.
These solutions invariably contribute to post-disaster needs, such as Oil Reporter: an open
data initiative of CrisisCommons.
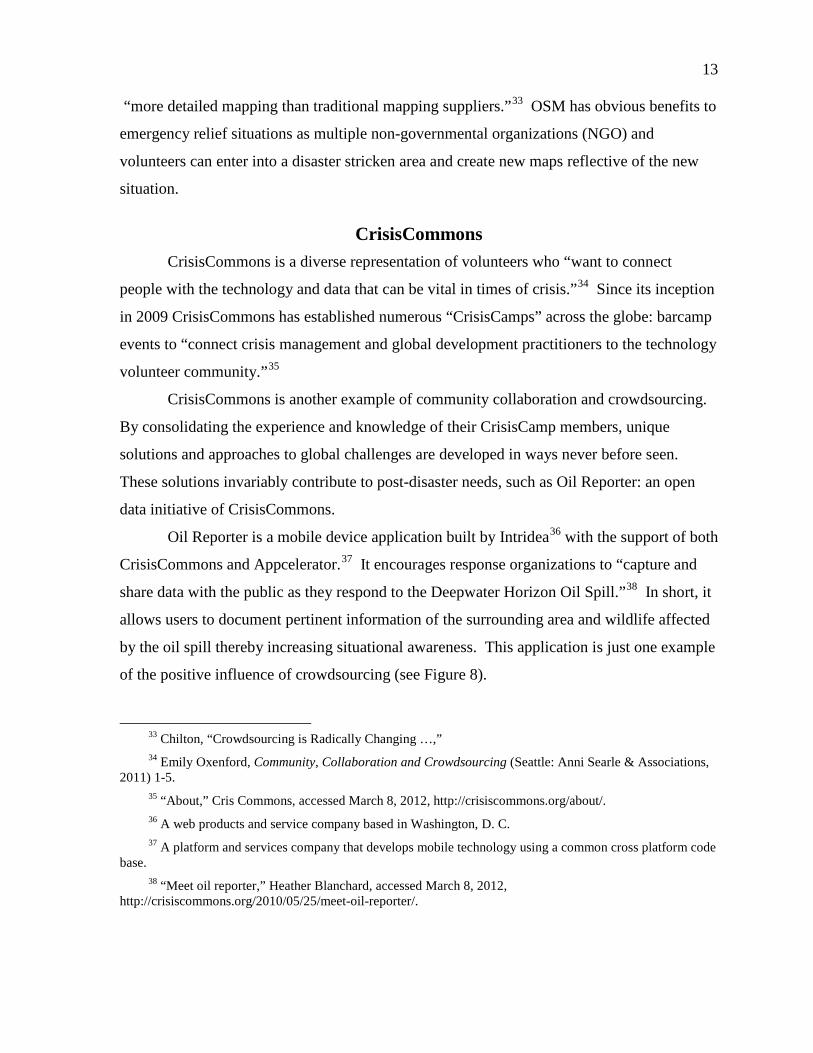
Oil Reporter is a mobile device application built by Intridea36 with the support of both
CrisisCommons and Appcelerator.37 It encourages response organizations to “capture and
share data with the public as they respond to the Deepwater Horizon Oil Spill.”38
allows users to document pertinent information of the surrounding area and wildlife affected
by the oil spill thereby increasing situational awareness. This application is just one example
of the positive influence of crowdsourcing (see Figure 8).
In short, it
33 Chilton, “Crowdsourcing is Radically Changing …,” 34 Emily Oxenford, Community, Collaboration and Crowdsourcing (Seattle: Anni Searle & Associations,
2011) 1-5. 35 “About,” Cris Commons, accessed March 8, 2012, http://crisiscommons.org/about/. 36 A web products and service company based in Washington, D. C. 37 A platform and services company that develops mobile technology using a common cross platform code
base. 38 “Meet oil reporter,” Heather Blanchard, accessed March 8, 2012,
http://crisiscommons.org/2010/05/25/meet-oil-reporter/.
14
Figure 8. Oil reporter main screen.
15
CHAPTER 2
DATA ANALYSIS & SCENARIOS
This chapter will further deconstruct the four initiatives into their unique
characteristics. This should allow for a more thorough understanding of crowdsourcing and
its versatility in the 21st century. Additionally, it should become apparent that there exists a
vast array of tools available to the disaster relief community as well as the auspiciousness of
the relationship between information technology and emergency response.
SAHANA The hallmark of large-scale natural or synthetic disasters is their ability to quickly
overwhelm the surrounding environment by devastating local resources. As such, the
developers of Sahana “identified scale as the primary cause of coordination problems.”39
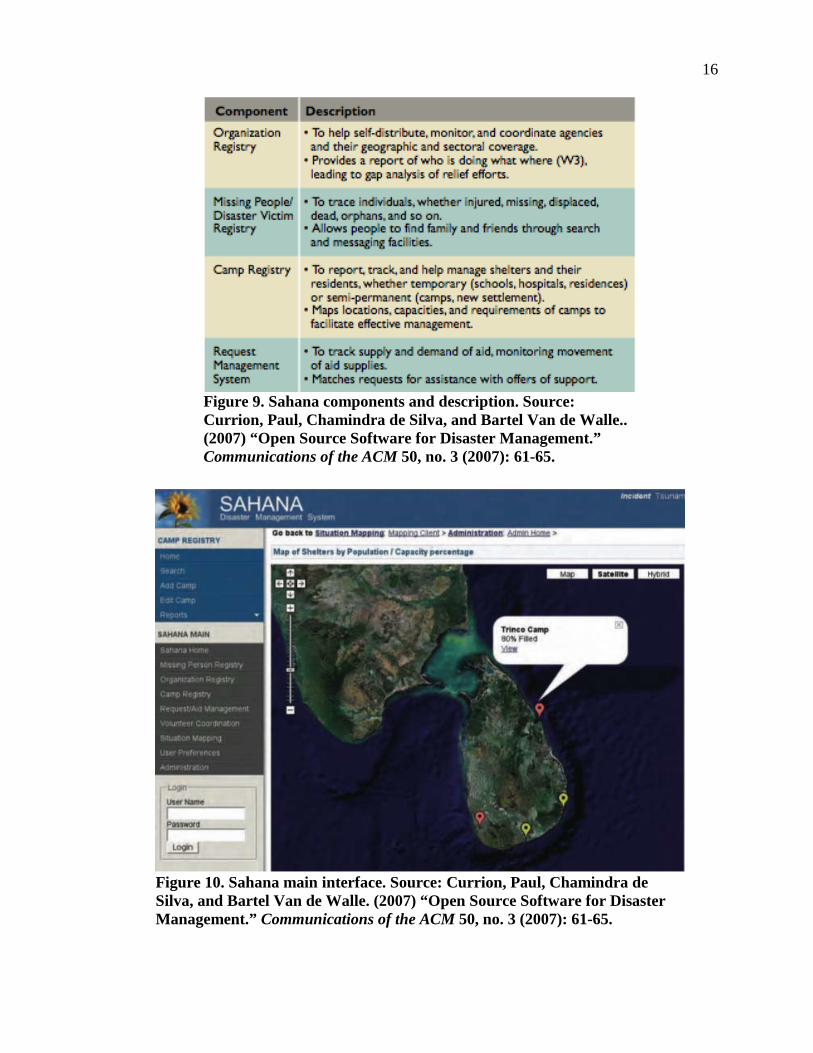
Sahana’s primary functions include aiding the search for missing persons and
coordinating relief efforts, among others. It features a variety of independent components
(see Figure 9)
Thus, the purpose of the project was to consolidate relevant information and disperse it to
various relief entities. This would effectively counter one of the challenges created by
disasters.
40, interconnected via a common interface, that work together to provide a host
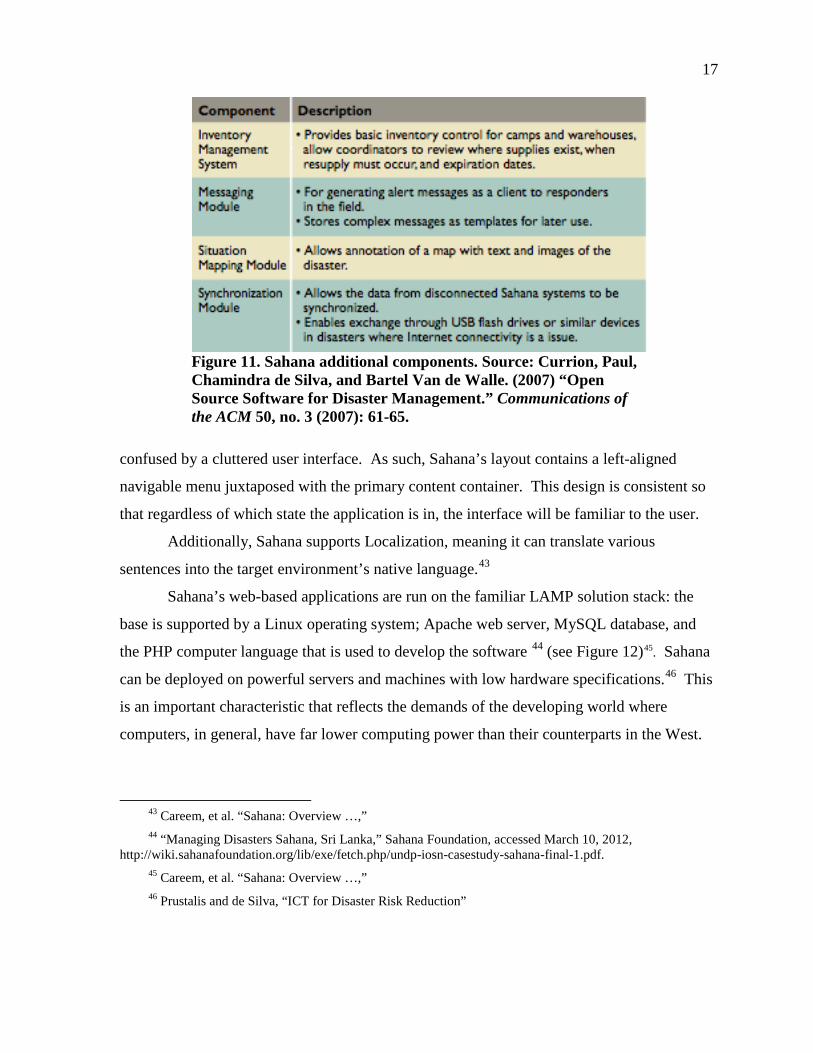
of Web-based services (see Figure 10).41 Sahana is also flexible. Depending on the needs of
the community in the aftermath of a disaster, tailored modules can be added on top of the
core framework (see Figure 11).42
The interface was designed with an ethos that simplicity and organization are central
to usability. Responders accessing this system—during a time of crisis—cannot afford to be
39 Mark Prustalis, and Chamindra de Silva, “ICT for Disaster Risk Reduction,” accessed March 10, 2012,
http://www.unapcict.org/ecohub/ict-for-disaster-risk-reduction-1/at_download/attachment1. 40 Currion, De Silva, and Van de Walle, “Open Source Software …,” 41 Ibid. 42 Ibid.
16
Figure 9. Sahana components and description. Source: Currion, Paul, Chamindra de Silva, and Bartel Van de Walle.. (2007) “Open Source Software for Disaster Management.” Communications of the ACM 50, no. 3 (2007): 61-65.
Figure 10. Sahana main interface. Source: Currion, Paul, Chamindra de Silva, and Bartel Van de Walle. (2007) “Open Source Software for Disaster Management.” Communications of the ACM 50, no. 3 (2007): 61-65.
17
Figure 11. Sahana additional components. Source: Currion, Paul, Chamindra de Silva, and Bartel Van de Walle. (2007) “Open Source Software for Disaster Management.” Communications of the ACM 50, no. 3 (2007): 61-65.
confused by a cluttered user interface. As such, Sahana’s layout contains a left-aligned
navigable menu juxtaposed with the primary content container. This design is consistent so
that regardless of which state the application is in, the interface will be familiar to the user.
Additionally, Sahana supports Localization, meaning it can translate various
sentences into the target environment’s native language.43
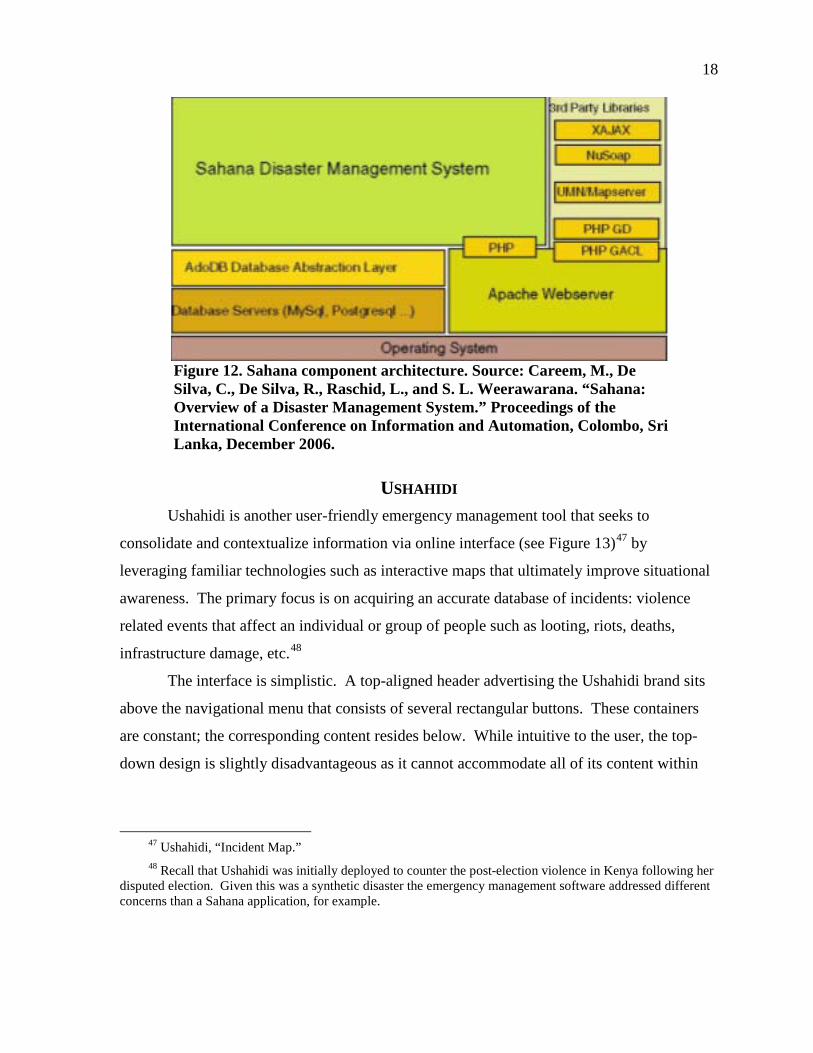
Sahana’s web-based applications are run on the familiar LAMP solution stack: the
base is supported by a Linux operating system; Apache web server, MySQL database, and
the PHP computer language that is used to develop the software
44 (see Figure 12)45. Sahana
can be deployed on powerful servers and machines with low hardware specifications.46
This
is an important characteristic that reflects the demands of the developing world where
computers, in general, have far lower computing power than their counterparts in the West.
43 Careem, et al. “Sahana: Overview …,” 44 “Managing Disasters Sahana, Sri Lanka,” Sahana Foundation, accessed March 10, 2012,
http://wiki.sahanafoundation.org/lib/exe/fetch.php/undp-iosn-casestudy-sahana-final-1.pdf. 45 Careem, et al. “Sahana: Overview …,” 46 Prustalis and de Silva, “ICT for Disaster Risk Reduction”
18
Figure 12. Sahana component architecture. Source: Careem, M., De Silva, C., De Silva, R., Raschid, L., and S. L. Weerawarana. “Sahana: Overview of a Disaster Management System.” Proceedings of the International Conference on Information and Automation, Colombo, Sri Lanka, December 2006.
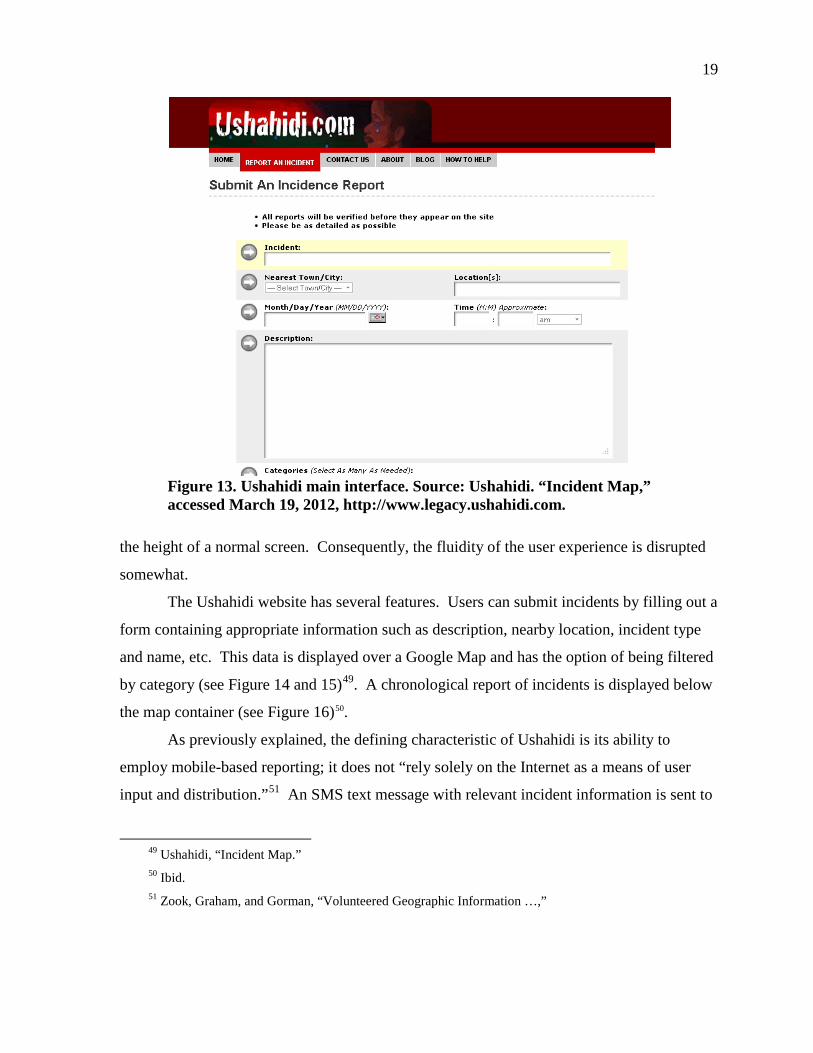
USHAHIDI Ushahidi is another user-friendly emergency management tool that seeks to
consolidate and contextualize information via online interface (see Figure 13)47 by
leveraging familiar technologies such as interactive maps that ultimately improve situational
awareness. The primary focus is on acquiring an accurate database of incidents: violence
related events that affect an individual or group of people such as looting, riots, deaths,
infrastructure damage, etc.48
The interface is simplistic. A top-aligned header advertising the Ushahidi brand sits
above the navigational menu that consists of several rectangular buttons. These containers
are constant; the corresponding content resides below. While intuitive to the user, the top-
down design is slightly disadvantageous as it cannot accommodate all of its content within
47 Ushahidi, “Incident Map.” 48 Recall that Ushahidi was initially deployed to counter the post-election violence in Kenya following her
disputed election. Given this was a synthetic disaster the emergency management software addressed different concerns than a Sahana application, for example.
19
Figure 13. Ushahidi main interface. Source: Ushahidi. “Incident Map,” accessed March 19, 2012, http://www.legacy.ushahidi.com.
the height of a normal screen. Consequently, the fluidity of the user experience is disrupted
somewhat.
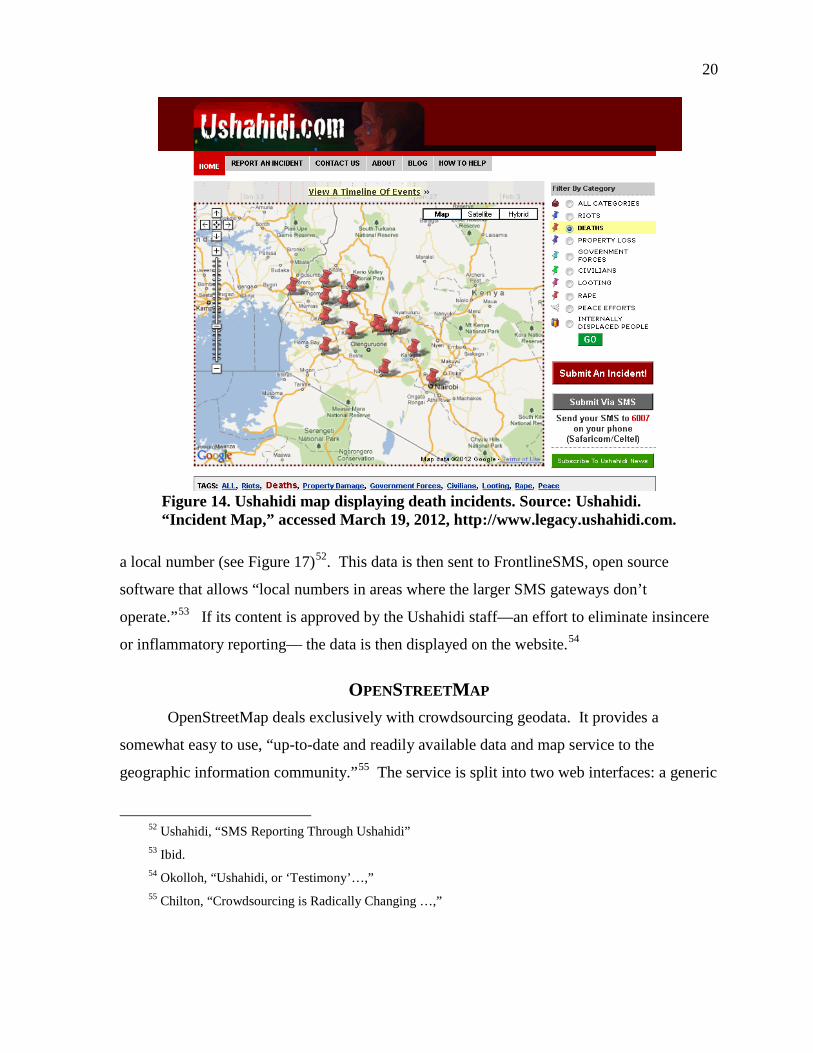
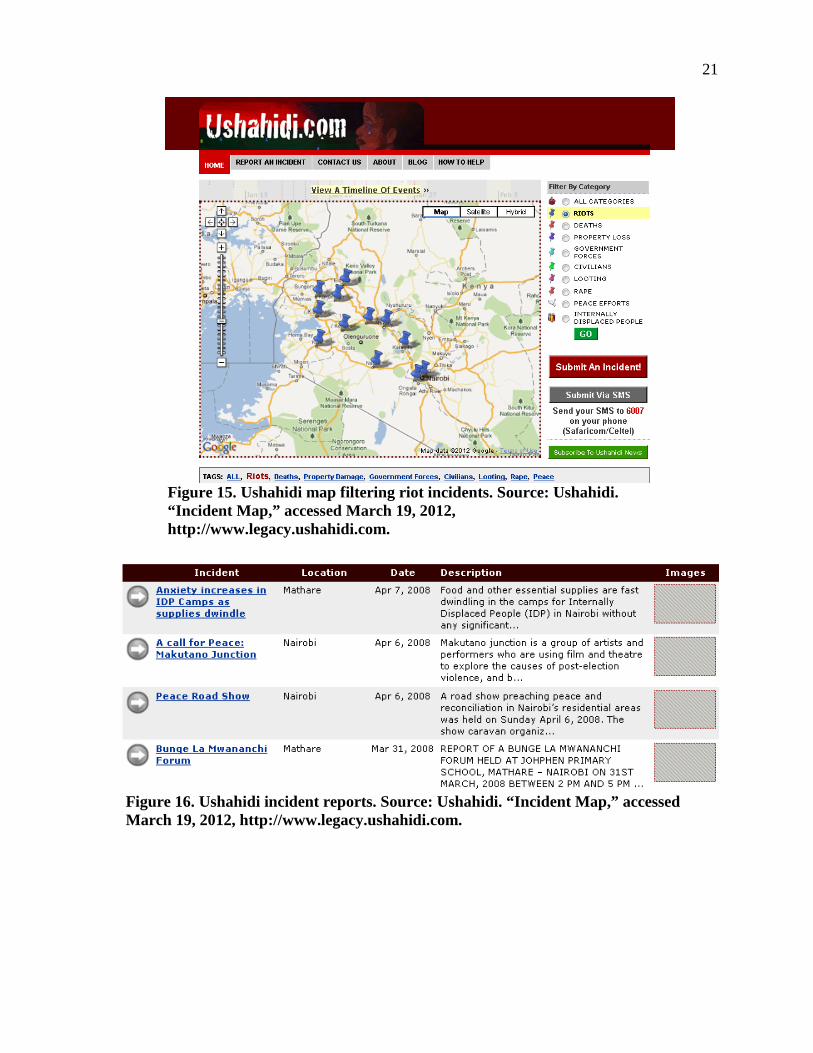
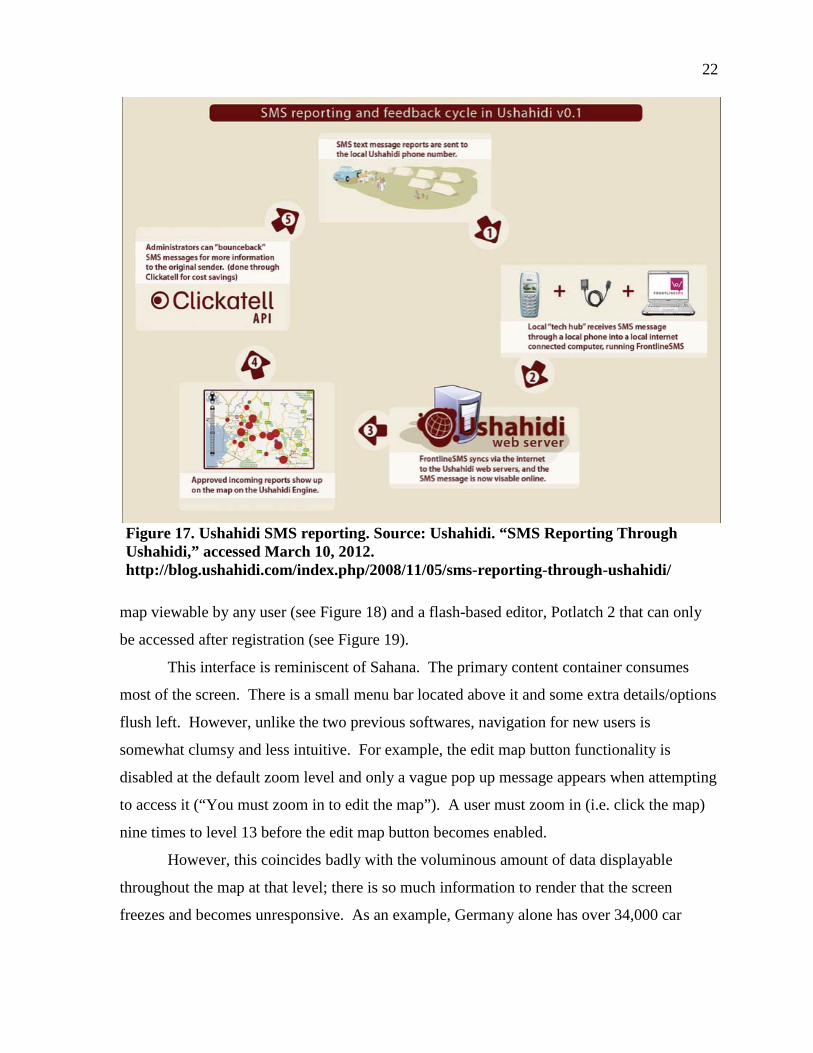
The Ushahidi website has several features. Users can submit incidents by filling out a
form containing appropriate information such as description, nearby location, incident type
and name, etc. This data is displayed over a Google Map and has the option of being filtered
by category (see Figure 14 and 15)49. A chronological report of incidents is displayed below
the map container (see Figure 16)50
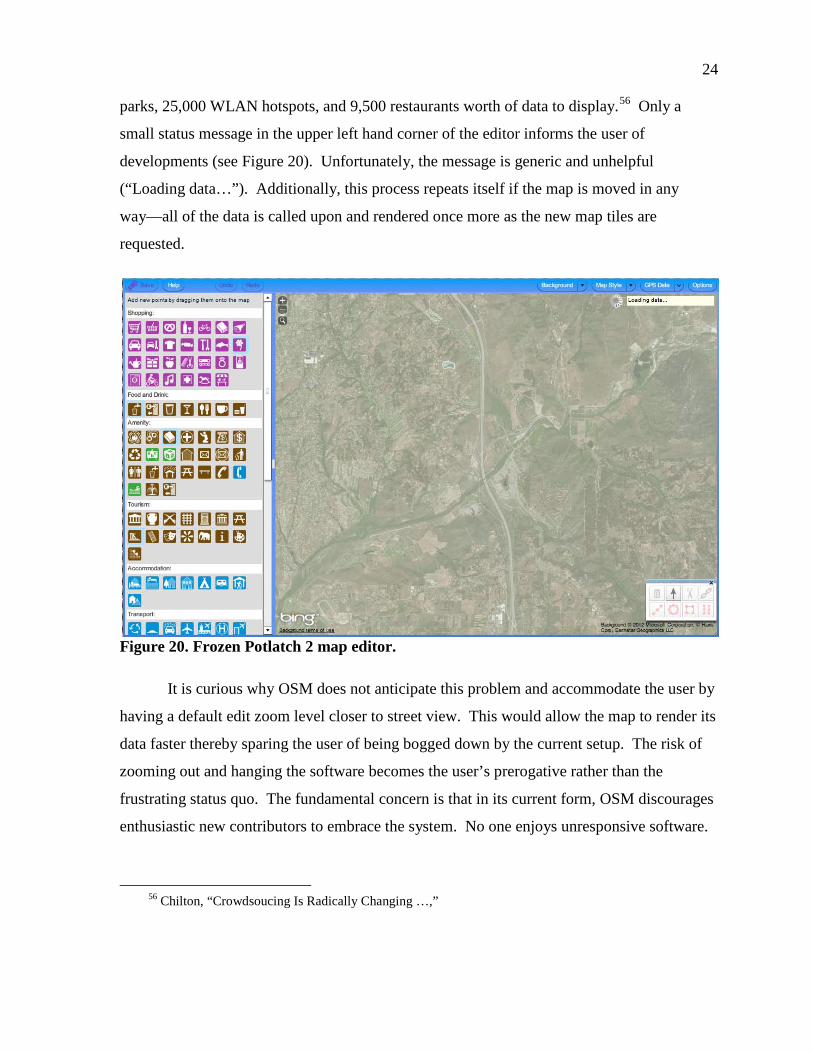
As previously explained, the defining characteristic of Ushahidi is its ability to
employ mobile-based reporting; it does not “rely solely on the Internet as a means of user
input and distribution.”
.
51
49 Ushahidi, “Incident Map.”
An SMS text message with relevant incident information is sent to
50 Ibid. 51 Zook, Graham, and Gorman, “Volunteered Geographic Information …,”
20
Figure 14. Ushahidi map displaying death incidents. Source: Ushahidi. “Incident Map,” accessed March 19, 2012, http://www.legacy.ushahidi.com.
a local number (see Figure 17)52. This data is then sent to FrontlineSMS, open source
software that allows “local numbers in areas where the larger SMS gateways don’t
operate.”53 If its content is approved by the Ushahidi staff—an effort to eliminate insincere
or inflammatory reporting— the data is then displayed on the website.54
OPENSTREETMAP
OpenStreetMap deals exclusively with crowdsourcing geodata. It provides a
somewhat easy to use, “up-to-date and readily available data and map service to the
geographic information community.”55
52 Ushahidi, “SMS Reporting Through Ushahidi”
The service is split into two web interfaces: a generic
53 Ibid. 54 Okolloh, “Ushahidi, or ‘Testimony’…,” 55 Chilton, “Crowdsourcing is Radically Changing …,”
21
Figure 15. Ushahidi map filtering riot incidents. Source: Ushahidi. “Incident Map,” accessed March 19, 2012, http://www.legacy.ushahidi.com.
Figure 16. Ushahidi incident reports. Source: Ushahidi. “Incident Map,” accessed March 19, 2012, http://www.legacy.ushahidi.com.
22
Figure 17. Ushahidi SMS reporting. Source: Ushahidi. “SMS Reporting Through Ushahidi,” accessed March 10, 2012. http://blog.ushahidi.com/index.php/2008/11/05/sms-reporting-through-ushahidi/
map viewable by any user (see Figure 18) and a flash-based editor, Potlatch 2 that can only
be accessed after registration (see Figure 19).
This interface is reminiscent of Sahana. The primary content container consumes
most of the screen. There is a small menu bar located above it and some extra details/options
flush left. However, unlike the two previous softwares, navigation for new users is
somewhat clumsy and less intuitive. For example, the edit map button functionality is
disabled at the default zoom level and only a vague pop up message appears when attempting
to access it (“You must zoom in to edit the map”). A user must zoom in (i.e. click the map)
nine times to level 13 before the edit map button becomes enabled.
However, this coincides badly with the voluminous amount of data displayable
throughout the map at that level; there is so much information to render that the screen
freezes and becomes unresponsive. As an example, Germany alone has over 34,000 car

23
Figure 18. OSM main interface.
Figure 19. OSM in edit mode.
24
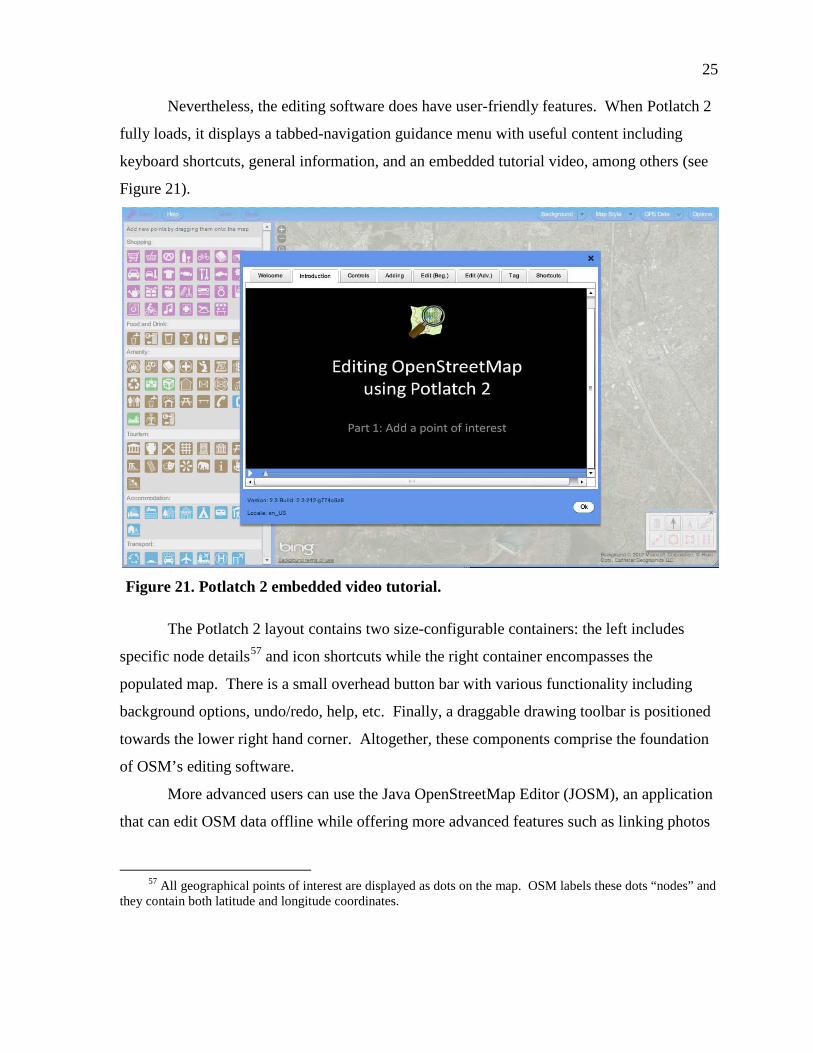
parks, 25,000 WLAN hotspots, and 9,500 restaurants worth of data to display.56
Only a
small status message in the upper left hand corner of the editor informs the user of
developments (see Figure 20). Unfortunately, the message is generic and unhelpful
(“Loading data…”). Additionally, this process repeats itself if the map is moved in any
way—all of the data is called upon and rendered once more as the new map tiles are
requested.
Figure 20. Frozen Potlatch 2 map editor.
It is curious why OSM does not anticipate this problem and accommodate the user by
having a default edit zoom level closer to street view. This would allow the map to render its
data faster thereby sparing the user of being bogged down by the current setup. The risk of
zooming out and hanging the software becomes the user’s prerogative rather than the
frustrating status quo. The fundamental concern is that in its current form, OSM discourages
enthusiastic new contributors to embrace the system. No one enjoys unresponsive software.
56 Chilton, “Crowdsoucing Is Radically Changing …,”
25
Nevertheless, the editing software does have user-friendly features. When Potlatch 2
fully loads, it displays a tabbed-navigation guidance menu with useful content including
keyboard shortcuts, general information, and an embedded tutorial video, among others (see
Figure 21).
Figure 21. Potlatch 2 embedded video tutorial.
The Potlatch 2 layout contains two size-configurable containers: the left includes
specific node details57
towards the lower right hand corner. Altogether, these components comprise the foundation
of OSM’s editing software.
and icon shortcuts while the right container encompasses the
populated map. There is a small overhead button bar with various functionality including
background options, undo/redo, help, etc. Finally, a draggable drawing toolbar is positioned
More advanced users can use the Java OpenStreetMap Editor (JOSM), an application
that can edit OSM data offline while offering more advanced features such as linking photos
57 All geographical points of interest are displayed as dots on the map. OSM labels these dots “nodes” and
they contain both latitude and longitude coordinates.
26
and audio notes. JOSM allows bulk uploads through the OSM API and supports data conflict
resolutions.58
OpenStreetMap data is stored in a central 1.5 terabyte PostegreSQL database and
“exchanged and exported in a self-made geodata format OSM XML format.”
Additionally, users can develop custom plug-ins for the system.
59
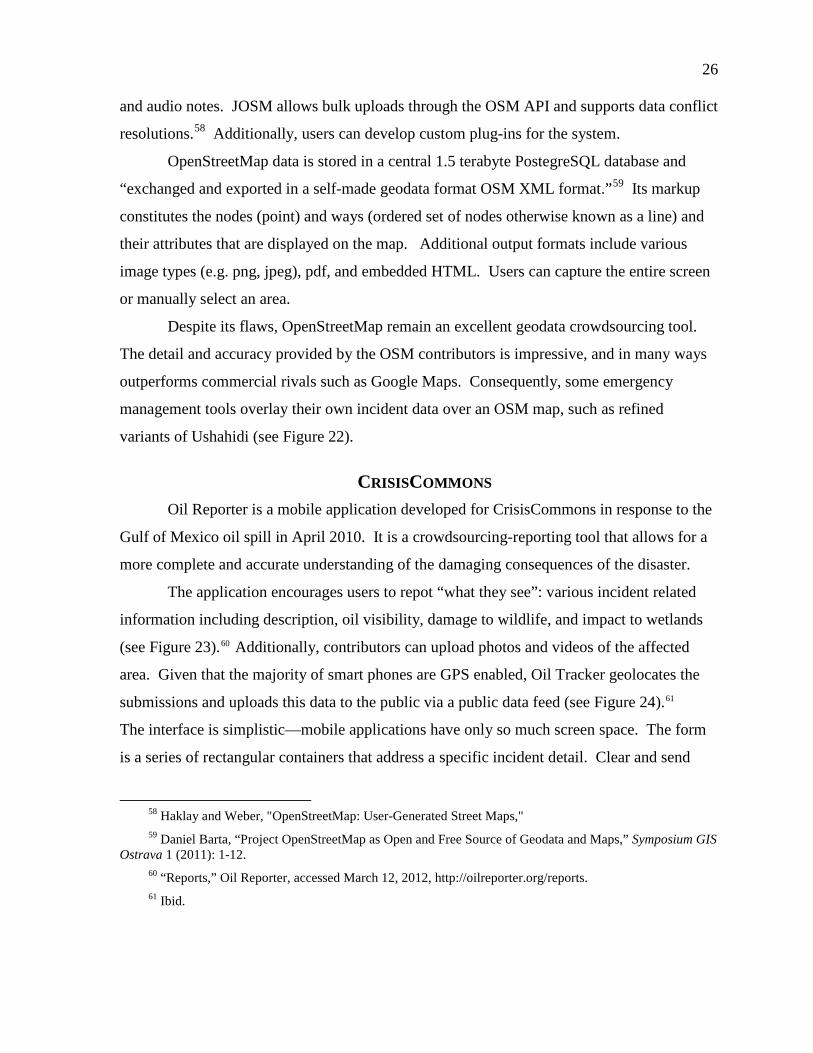
Despite its flaws, OpenStreetMap remain an excellent geodata crowdsourcing tool.
The detail and accuracy provided by the OSM contributors is impressive, and in many ways
outperforms commercial rivals such as Google Maps. Consequently, some emergency
management tools overlay their own incident data over an OSM map, such as refined
variants of Ushahidi (see Figure 22).
Its markup
constitutes the nodes (point) and ways (ordered set of nodes otherwise known as a line) and
their attributes that are displayed on the map. Additional output formats include various
image types (e.g. png, jpeg), pdf, and embedded HTML. Users can capture the entire screen
or manually select an area.
CRISISCOMMONS Oil Reporter is a mobile application developed for CrisisCommons in response to the
Gulf of Mexico oil spill in April 2010. It is a crowdsourcing-reporting tool that allows for a
more complete and accurate understanding of the damaging consequences of the disaster.
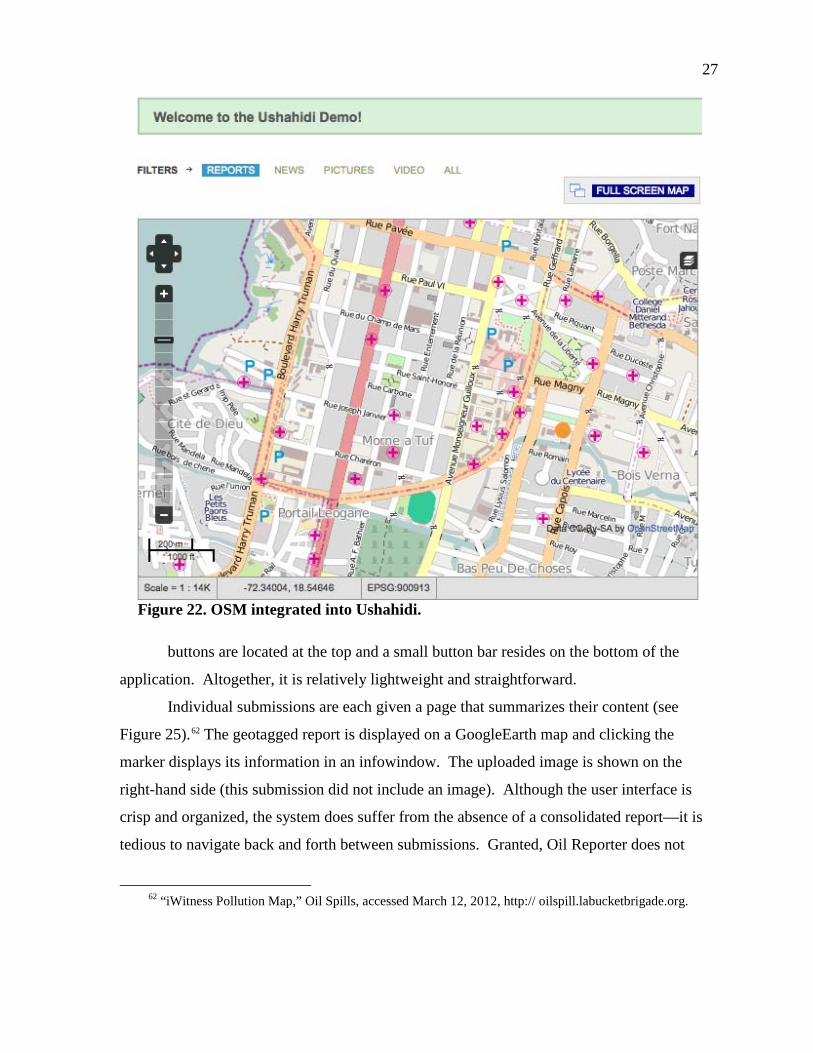
The application encourages users to repot “what they see”: various incident related
information including description, oil visibility, damage to wildlife, and impact to wetlands
(see Figure 23).60 Additionally, contributors can upload photos and videos of the affected
area. Given that the majority of smart phones are GPS enabled, Oil Tracker geolocates the
submissions and uploads this data to the public via a public data feed (see Figure 24).61
The interface is simplistic—mobile applications have only so much screen space. The form
is a series of rectangular containers that address a specific incident detail. Clear and send
58 Haklay and Weber, "OpenStreetMap: User-Generated Street Maps," 59 Daniel Barta, “Project OpenStreetMap as Open and Free Source of Geodata and Maps,” Symposium GIS
Ostrava 1 (2011): 1-12. 60 “Reports,” Oil Reporter, accessed March 12, 2012, http://oilreporter.org/reports. 61 Ibid.
27
Figure 22. OSM integrated into Ushahidi.
buttons are located at the top and a small button bar resides on the bottom of the
application. Altogether, it is relatively lightweight and straightforward.
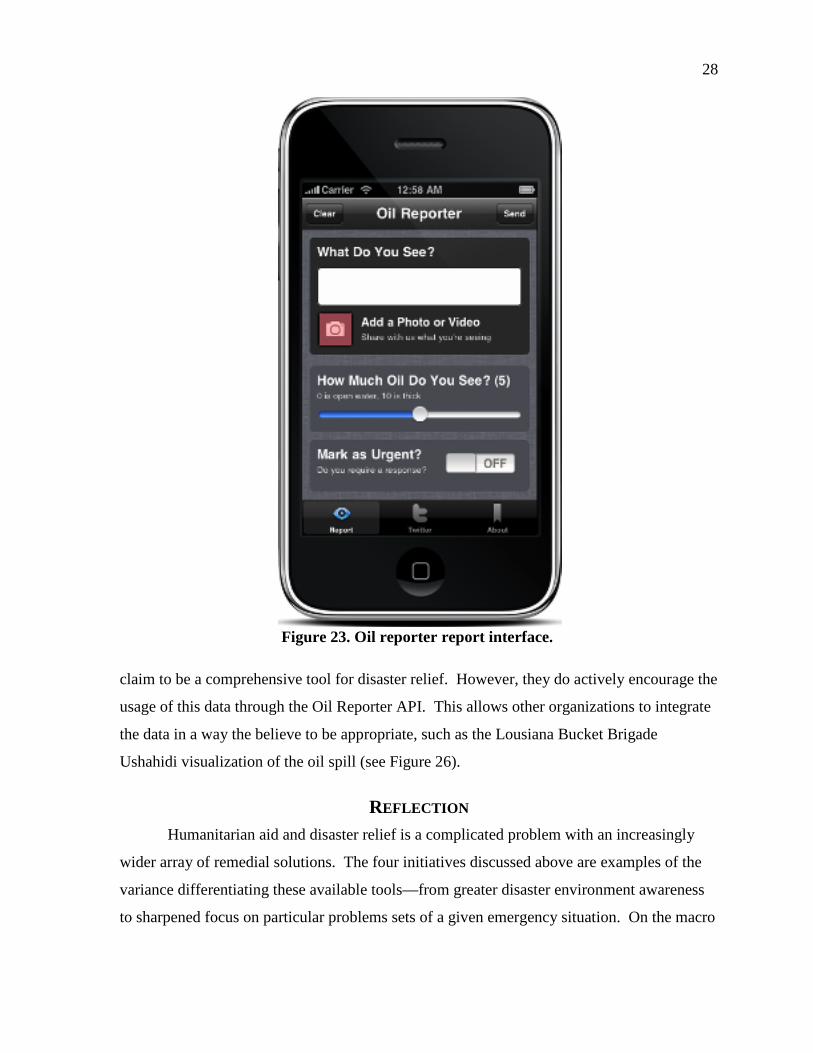
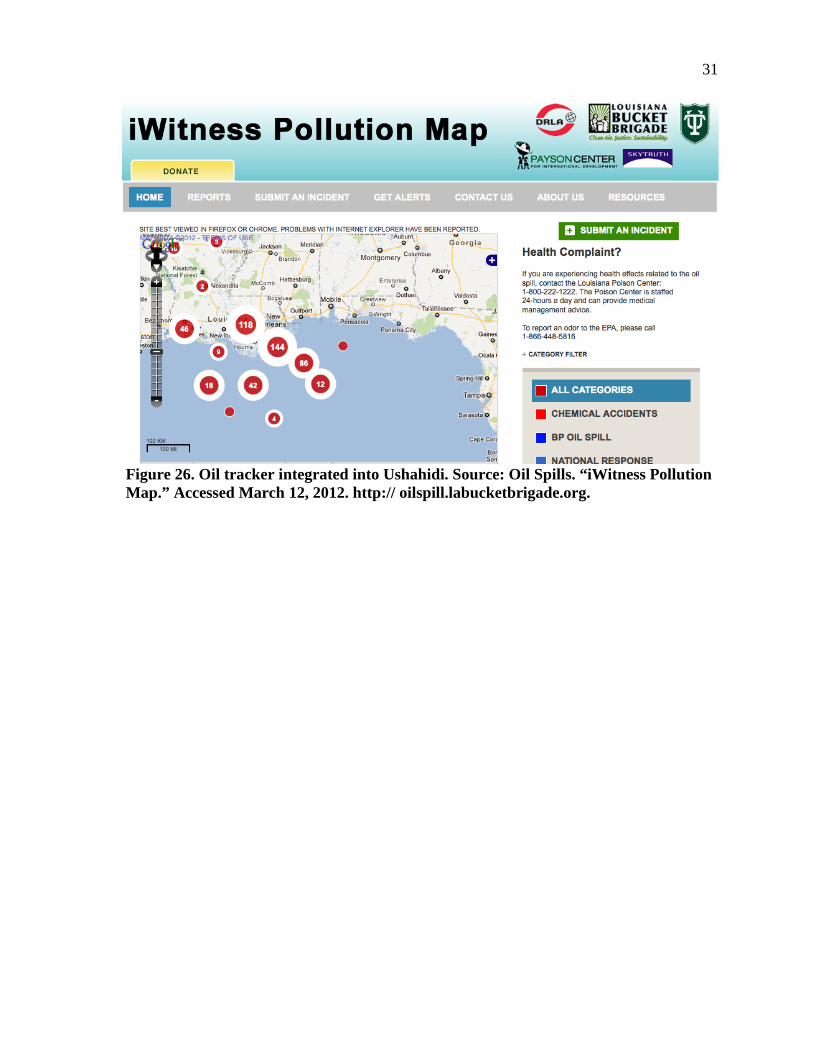
Individual submissions are each given a page that summarizes their content (see
Figure 25).62
62 “iWitness Pollution Map,” Oil Spills, accessed March 12, 2012, http:// oilspill.labucketbrigade.org.
The geotagged report is displayed on a GoogleEarth map and clicking the
marker displays its information in an infowindow. The uploaded image is shown on the
right-hand side (this submission did not include an image). Although the user interface is
crisp and organized, the system does suffer from the absence of a consolidated report—it is
tedious to navigate back and forth between submissions. Granted, Oil Reporter does not
28
Figure 23. Oil reporter report interface.
claim to be a comprehensive tool for disaster relief. However, they do actively encourage the
usage of this data through the Oil Reporter API. This allows other organizations to integrate
the data in a way the believe to be appropriate, such as the Lousiana Bucket Brigade
Ushahidi visualization of the oil spill (see Figure 26).
REFLECTION Humanitarian aid and disaster relief is a complicated problem with an increasingly
wider array of remedial solutions. The four initiatives discussed above are examples of the
variance differentiating these available tools—from greater disaster environment awareness
to sharpened focus on particular problems sets of a given emergency situation. On the macro

29
Figure 24. Oil report web interface. Source: Oil Reporter. “Reports.” Accessed March 8, 2012. http://oilreporter.org/reports.
level, Shana and Ushahidi demonstrated the utility of website driven crowdsourcing that
provide first responders with an overhead understanding of a disaster. Conversely,
OpenStreetMap and Oil Reporter’s service was specific to one aspect of the emergency relief
process. Together, the macro and micro can coalesce to fill the gap of relying on disparate
tools from various sources; user focus can remain inside singular software that is both rich
and immersive. The succeeding chapter will discuss an initiative to accomplish this.
30
Figure 25. Oil reporter detailed submission. Source: Oil Reporter. “Reports.” Accessed March 8, 2012. http://oilreporter.org/reports.
31
Figure 26. Oil tracker integrated into Ushahidi. Source: Oil Spills. “iWitness Pollution Map.” Accessed March 12, 2012. http:// oilspill.labucketbrigade.org.
32
CHAPTER 3
EMBEDDING FEATURES ON DATA ANALYSIS
SPATIAL HUB
On September 10, 2010 In-Q-Tel hosted a conference on complex analytics. In-Q-
Tel is a not-for-profit venture capital firm whose is tasked with keeping various United States
intelligence agencies informed of the latest technological innovations emerging from the
private sector.63
DASH is user-friendly application that helps integrate, query, and visualize diverse
databases using a combination of commercial and open-source tools, visualization
approaches, and communication methods. In other words, DASH is an interactive suite of
tools designed to absorb large amounts of diverse input and produce sensible output for
varied purposes. It is intended to be a desktop application.
On that day, Akshay Pottathil, a co-director of San Diego State’s
Visualization Center (VizCenter), presented two abstract concepts to the conference
attendees: Data Analysis Spatial Hub (DASH) and Spatial Analysis for Emerging Risk
(SAFER). Both of these innovations have applicability in humanitarian aid and disaster
relief environments.
SAFER is a mobile application built in a highly flexible and expandable format to
integrate multiple analysis tools and features. A key goal of the system is to provide the
basis for predictive modeling to assist with policy decisions about emerging trends for a
variety of environments. The intent is to deliver quantitative and geospatially related
guidance for planning and policymaking to its consumer base.
DASH and SAFER reinforce each other to produce a powerful solution with far-
reaching implications. SAFER can interpret and transmit data from localized sources that
DASH can then incorporate and output to a wide centralized user base for further processing.
Although presented to an intelligence-minded community, Mr. Pottathil’s software has
definite utility in emergency relief scenarios as it represents a blueprint for virtual incident
63 “History,” In-Q-Tel, accessed March 22, 2012, http://www.iqt.org/about-iqt/history.html.
33
command systems (ICS), defined as systematic tools used for the command, control, and
coordination of emergency responses.64
EMERGENCY RELIEF DASH
The following iteration of web-based humanitarian aid and disaster relief
crowdsourcing software should resemble an incident command system and embrace Rich
Internet Application (RIA) technology. By definition, RIAs deliver rich features to the user
that result in a more engaging experience; the goal is to create naturally flowing software on
the Internet. Rich Internet Applications can deploy a stateful client that is embedded inside
of a Web browser. This means that the majority of application data are stored in the client’s
memory, thereby lessening the reliance on the server. Consequently, backend logic is
asynchronous; data services occur behind the scenes and do not prevent the user from
continuing to engage the interface, thus resulting in uninterrupted work.65 Additionally, it is
the responsibility of the client to interpret (i.e. display) the information received from the
server. Accordingly, the server only retrieves and sends actual data which helps to reduce
the size of requests and makes the application more responsive.66
As an application, as opposed to a web site, DASH should incorporate many different
features geared towards effective emergency response. The previously discussed initiatives
had several characteristics in common that should be included. Relevant components are
contained, in no particular order, in the following list:
In short, RIAs approach a
seamless experience reminiscent of desktop applications.
• Rich user interface
• Incident mapping
• Incident reporting
• Media resources
64 “Glossary: Simplified Guide to the Incident Command System for Transportation Professionals,” U.S.
Department of Transportation, accessed March 29, 2012, http://ops.fhwa.dot.gov/publications/ics_guide/glossary.htm
65 “What is RIA?” Andrew Trice, accessed March 20, 2012, http://www.whatisria.info/definitions/andrew-trice/.
66 Ibid.

34
• Map Editing Tools
• Mobile Application Integration
• Embedded communication
• Embedded disaster information
• Localization
USER INTERFACE Rich usability is key to a consistent and reliable user experience. RIA technology
will allow DASH, and all of its functionality, to be contained within a single page; refreshes
will not be necessary. The entire content of this page should fit, regardless of resolution, in
one screen size. This would avoid the problem with the aforementioned top-down approach
utilized by Ushahidi. Additionally, the application body should resize and reorder itself
accordingly with the Web browser container.
The visual interface design should leverage graphically appealing widgets that
contribute to a more user-friendly experience. DASH should feel alive; smooth transitions
from one application state to the other coupled with highly responsive interaction contribute
to that natural flow alluded to earlier. The user should feel as though they were employing
desktop software as opposed to a collection of interdependent web documents loosely
connected by various hyperlinks.
INCIDENT MAPPING It is clear that a complete disaster relief system must overlay GIS data atop a map to
provide users with the situational awareness needed during a disaster situation. Like Sahana
and Ushahidi before it, DASH will leverage Goolge Maps API for this purpose. One of the
advantages of this option is that Google is committed to its Maps API and continually
produces new and exciting features that offer plenty of utility in our context. Some of these
features include:
• Layers: layers generally reflect collections of objects that you add on top of the map to designate a common association.67
67 “Google Maps Javascript API v3 Developer’s Guide,” Google, accessed March 21, 2012,
One such example includes a traffic layer capable of displaying traffic conditions directly on the map.
35
• Services: Google Maps offers a variety of services that enhance the functionality of the map. Examples include direction and elevation requests. Of particular concern is the street view service that provides panoramic 360-degree views from designated roads.68
INCIDENT REPORTING
Additionally, geocoding is a highly useful resource that converts geographic coordinates into physical addresses and vice versa. This allows a user to quickly navigate the map to choice areas anywhere in the world.
A Google Map has to be accompanied by appropriate disaster information to be
useful to the emergency relief community. Thus, DASH should devote a section of the
application to reporting. That is, users will have an option to fill out a form with relevant
fields about a particular incident, such as name, description, type, etc. A location field will
accept an address of the occurrence and use the abovementioned geocoding service to
translate the physical location into appropriate latitude and longitude coordinates. This will
allow the incident to appear on the map shortly after submission, typically as an interactive
icon.
Additionally, Google Charts API will be leveraged to style the icons. A few
specifications passed to Google Charts infographics can return a variety of customized
callouts, bubbles, pins, etc. This is useful in quickly separating various incidents from
others, for example incident category.
This interaction necessarily implies backend logic and communication with the
server. Given the asynchronous nature of RIAs, submission should occur without locking out
the rest of the user interface but still occur quickly enough so that the user base can consume
this newly submitted information in an acceptable timeframe. Accordingly, data transfer
should be encoded in the action message format (AMF). AMF is a compact binary format
that allows two endpoints to communicate with each other, in this case the server and the
client. The process of serialization turns an object into a sequence of bytes, which contains
all required information about the structure of the original object.69
https://developers.google.com/maps/documentation/javascript/layers.
In short, the AMF
68 Ibid. 69 Yakov Fain, Victor Rasputnis, and Anatole, Tratakovsky, Enterprise Development with Flex
(Sebastopol: O'Reilly, 2010)
36
protocol offers very fast transfer because the data is compressed binary. On average, a 7
column and 20000 row table of data can be retrieved and generated in a grid on the client
side in under five seconds.70
MEDIA RESOURCES
Embedding media resources, such as video capability, will add another layer of
collaboration to DASH; the richness of the application is further enhanced by multimedia
interaction. Crowdsourcing encourages contribution from a diverse pool of individuals of
varying backgrounds. Easily accessible streaming videos that are instructional in nature can
help to ensure that every participating volunteer has a common foundational skillset from
which to rely on during an emergency situation. For example, this section could include a
tutoring video on how to effectively use DASH, or basic incident command principles, etc.
At the very least, users are in a position to help themselves rather than having to distract
others for basic information.
MAP EDITING TOOLS Quite recently, Google Maps added another dimension of interactivity to its service
with its Drawing Library. This feature “provides a toolbox which enables users to draw
markers, lines, and shapes on the map, much as they would in any drawing application.”71
This feature is an attempt to emulate the utility of OpenStreeMap without inheriting
its drawbacks. There are three primary differences that differentiate DASH’s approach from
OSM. The first is obvious: the feature is one of many included in the application. Editing
In
other words, users can analyze a map populated with disaster related GIS data and edit it as
they see fit. For example, a relief agency representative may wish to circle and annotate all
of their camps nearby the epicenter of a disaster, or trace the best evacuation route from point
x to destination y. In effect, the map is transformed into a digital whiteboard whose value is
only limited by the resourcefulness and creativity of the user’s manipulating it.
70 This test originates from Census RIA Benchmark. It is a data loading and rendering performance
comparison for RIA technologies. The test can be located at http://www.jamesward.com/census2/. 71 “Google Geo Developers Blog,” Enoch Lau, accessed November 15, 2011,
http://googlegeodevelopers.blogspot.com/2011/11/make-your-map-interactive-with-shape.html.

37
occurs directly within the embedded map. This is consistent with DASH’s overall
philosophy: web-based humanitarian aid and disaster relief crowdsourcing software should
resemble an incident command system and embrace RIA technology. Engaging two separate
resources in two different locations, one for incident reporting/viewing and one for map
editing, is counter-productive.
Secondly, this method is likely to evade the OSM problem of an unresponsive
interface incurred by voluminous amounts of displayable data. Aside from the overlayed
GIS data, the Google Map is a clean canvas. Only relevant annotations related to the
emergency have to be included in custom drawings. OSM was not created specifically for
disaster relief; it is a general-purpose data and map service to the geographic information
community. Consequently, it encourages as much descriptive data as possible. Clearly, not
all of it is relevant in emergency relief, such as the number of park benches in a particular
area. These trivial details add up.
Thirdly, although registered users input data into OSM, the final product is
anonymous. As long as the information is correct, neither OSM nor its consumer base
particular care about the submission origin. This is not necessarily the case in emergency
relief situations. For example, there is a difference between data constructed by the local
Red Cross and another NGO offering different relief services. Assuming DASH correctly
organizes the data, the Google Maps drawing library specifically allows for the kind of
compartmentalization that its user base can manipulate to produce more efficient
humanitarian aid operations. For example, instead of displaying all available data in one
mapping instance, individuals can choose between Red Cross illustrations displaying medical
outposts and government designated evacuation routes from a specific location within the
disaster.
MOBILE APPLICATION INTEGRATION Earlier, we established that DASH and SAFER work together to produce a more
puissant solution. The parallels with the previously discussed initiatives are clear: DASH
represents the cloud-based crowdsourcing software (i.e. Sahana, Ushahidi) while SAFER is
the mobile vector that allows users to document pertinent information of the surrounding area
(i.e. Oil Reporter).
38
The crucial difference is that these two solutions work in tandem. One of the
criticisms of Oil Reporter was the lack of consolidated reporting from the various mobile
submissions. Granted, it provides an API that Ushahidi-like software can absorb and display,
but this nonetheless introduces an extra step that is not necessarily needed. Additionally,
there are limitations with any API. Given that DASH accesses many different databases, it
follows that the application can pull data from the one that SAFER stores its information.
This implies that updates from SAFER can be directly visualized onto DASH to the benefit
of the disaster relief process.
EMBEDDED COMMUNICATION & INFORMATION As a comprehensive solution on the cloud, it is important that users have a way of
communicating with one another within the context of the virtual command system. For
example, a certain incident shown on the map has vague information and thus an inquiry is
made to the user base asking for clarification. This is one feature absent from both Sahana
and Ushahidi. However, it is crucial to incorporate given the collaborative nature of
humanitarian aid and disaster relief. Furthermore, it should be present on the interface at all
times. It would be counterproductive to the natural flow if communication were stashed
away in a remote location of the RIA that required a sequence of interaction to access.
Although the goal is to consolidate many different components into a single
application to increase efficiency and productivity of volunteers during a crisis, total isolation
from exterior sources is a bad idea. During a disaster, news is gathered and outputted for
public consumption. It is important that DASH’s user base stay informed of these
developments. Consequently, the interface will embed various RSS feeds that directly link
users to corresponding publications.
RSS, or really simple syndication, is a standardized format for delivering regularly
changing web content.72
72 “The Office of Instructional and Research Technology,” Rugters University, accessed March 21, 2012,
http://oirt.rutgers.edu/training-consultation/tool-pages/really-simple-syndication-rss/.
RSS documents, or feeds, are published by a variety of sources,
including news websites, blog entries, etc. In other words, aggregated RSS feeds allow an
individual to be informed of latest developments for whatever subject they are particularly
39
interested in. In our case, DASH will collect and output various news feeds of a targeted
disaster. More importantly, RSS saves a considerable amount of time. It would be a great
disadvantage if users had to regularly visit each site individually to stay up-to-date as
disaster-related events unfolded.
Similar to embedded communication, RSS has to be easily accessible to the user; it
cannot be effective if buried somewhere in the interface. Fortunately, the asynchronous
nature of our RIA will enable the user to periodically update the various RSS feeds without
detracting from their current work. If a particular headline is of interest, DASH will connect
them to the story on the originating site in a new window thereby retaining the current state
of the application.
In the following chapter, DASH will be realized into working prototype and
incorporate many of the features discussed above.
40
CHAPTER 4
APPLICATION ON EXERCISE 24
On September 24-25, 2010, the VizCenter hosted a virtual humanitarian and disaster
relief event called “Exercise 24” that involved dozens of nations and organizations from
around the world.73 X24 is described as a “collaborative environment using crowdsourcing,
social media, and cloud computing applications.”74 Earlier this year, the third iteration of
Exercise 24 concentrated on a series of natural disasters (earthquake, volcanic eruption, etc.)
targeting Mexico City. A primary focus of X24 Mexico was to “demonstrate the use of
crowdsourcing and collaboration web tools to gather, coordinate, and share actionable real-
time information to build situational awareness to help victims of a natural disaster and help
save lives.”75
X24 DASH
These goals coincide well with everything discussed up to this point regarding
disaster and emergency relief. Consequently, a prototype of DASH was developed for X24
Mexico. The rest of the chapter will summarize and analyze the various components as they
were realized in DASH.
DASH was developed using Adobe Flex, an open-source application framework that
facilitates the development of web applications for the browser agnostic Flash platform.76 As
the Flex product line was continually refined following its release in 2004,77 it became easier
for developers to create cutting edge Rich Internet Applications that maximized
productivity.78
73 “Mexico,” Viz Center, accessed March 26, 2012, http://vizcenter.net/x24/more.html.
Additionally, the Flash Platform is installed on more than one billion
74 Ibid. 75 Ibid. 76 Michael Labriola and Jeff Tapper, Adobe Flex 4.5 Fundamentals: Training from the Source (Berkeley:
Adobe Press, 2011). 77 Ibid. 78 Ibid.
41
devices.79
Flex is composed of two languages: MXML and ActionScript 3.0. The former is an
XML based markup language that “allows for the simplified creation and maintenance of
user interfaces.”
For these reasons, and others beyond the scope of this thesis (e.g. comparative
analysis of alternative RIA technologies and their advantages/disadvantages), Flex was
chosen to create DASH.
80 ActionScript is an object-oriented programming language that “advances
the capabilities of the Flash Platform.”81
The Google Maps API is primarily designed for JavaScript, the programming
language of the Web; all modern web browsers include JavaScript interpreters.
Together, the languages form a harmonious
compliment that accelerates the development of powerful, rich, and efficient applications.
82
DASH USER INTERFACE
Fortunately, Flex provides an avenue to communicate with JavaScript: the ExternalInterface
class. In short, any worthwhile data accessible to Flex can be made available to JavaScript,
and vice versa. This allows a Flex application to manipulate a JavaScript Google Map at
will. Beyond this simplified explanation, the inner-workings of this process are not relevant
for this discussion; suffice it to say the ExternalInterface class allows DASH to leverage both
technologies to its advantage to produce a more complete solution.
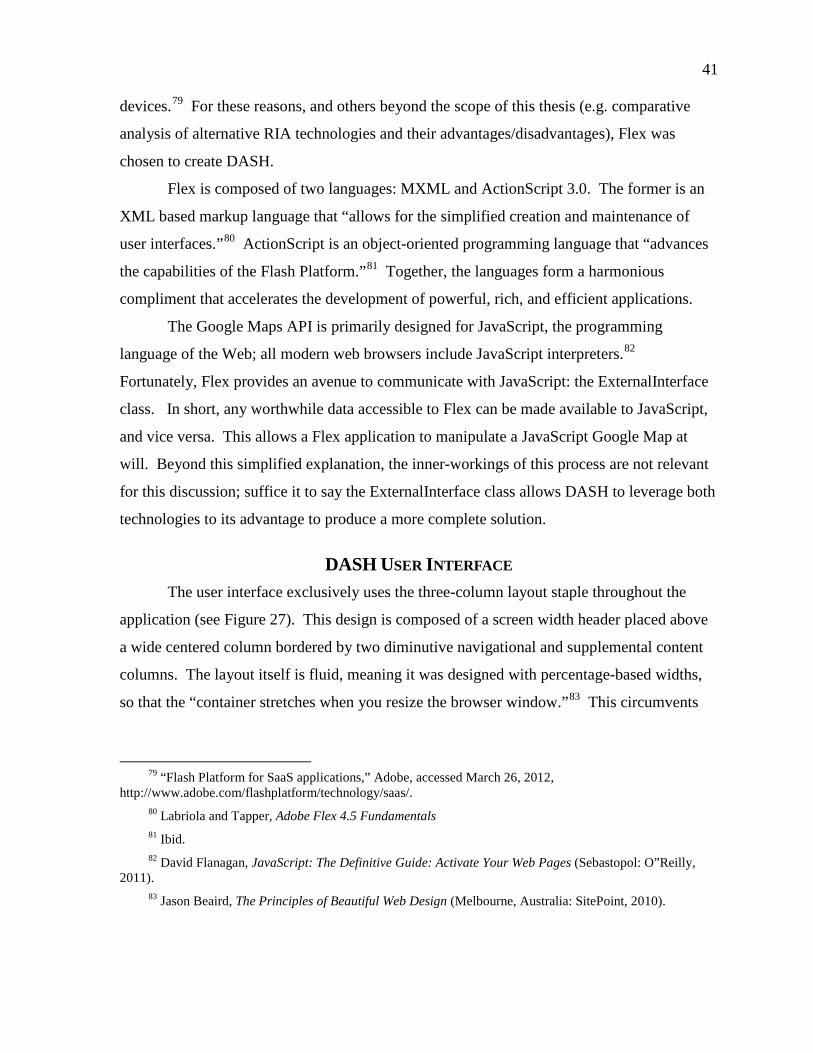
The user interface exclusively uses the three-column layout staple throughout the
application (see Figure 27). This design is composed of a screen width header placed above
a wide centered column bordered by two diminutive navigational and supplemental content
columns. The layout itself is fluid, meaning it was designed with percentage-based widths,
so that the “container stretches when you resize the browser window.”83
79 “Flash Platform for SaaS applications,” Adobe, accessed March 26, 2012,
http://www.adobe.com/flashplatform/technology/saas/.
This circumvents
80 Labriola and Tapper, Adobe Flex 4.5 Fundamentals 81 Ibid. 82 David Flanagan, JavaScript: The Definitive Guide: Activate Your Web Pages (Sebastopol: O”Reilly,
2011). 83 Jason Beaird, The Principles of Beautiful Web Design (Melbourne, Australia: SitePoint, 2010).
42
Figure 27. DASH three-column layout.
burdening the user with horizontal/vertical scrollbars that typically appear in non-maximized
web browser windows.
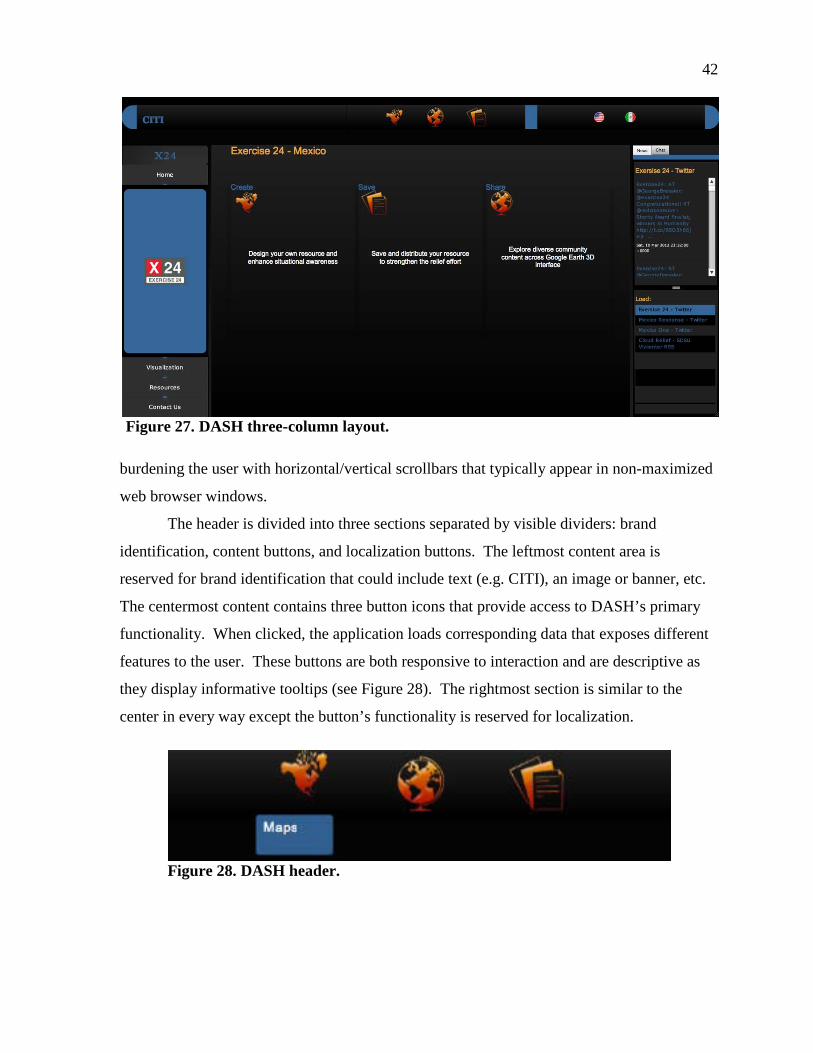
The header is divided into three sections separated by visible dividers: brand
identification, content buttons, and localization buttons. The leftmost content area is
reserved for brand identification that could include text (e.g. CITI), an image or banner, etc.
The centermost content contains three button icons that provide access to DASH’s primary
functionality. When clicked, the application loads corresponding data that exposes different
features to the user. These buttons are both responsive to interaction and are descriptive as
they display informative tooltips (see Figure 28). The rightmost section is similar to the
center in every way except the button’s functionality is reserved for localization.
Figure 28. DASH header.
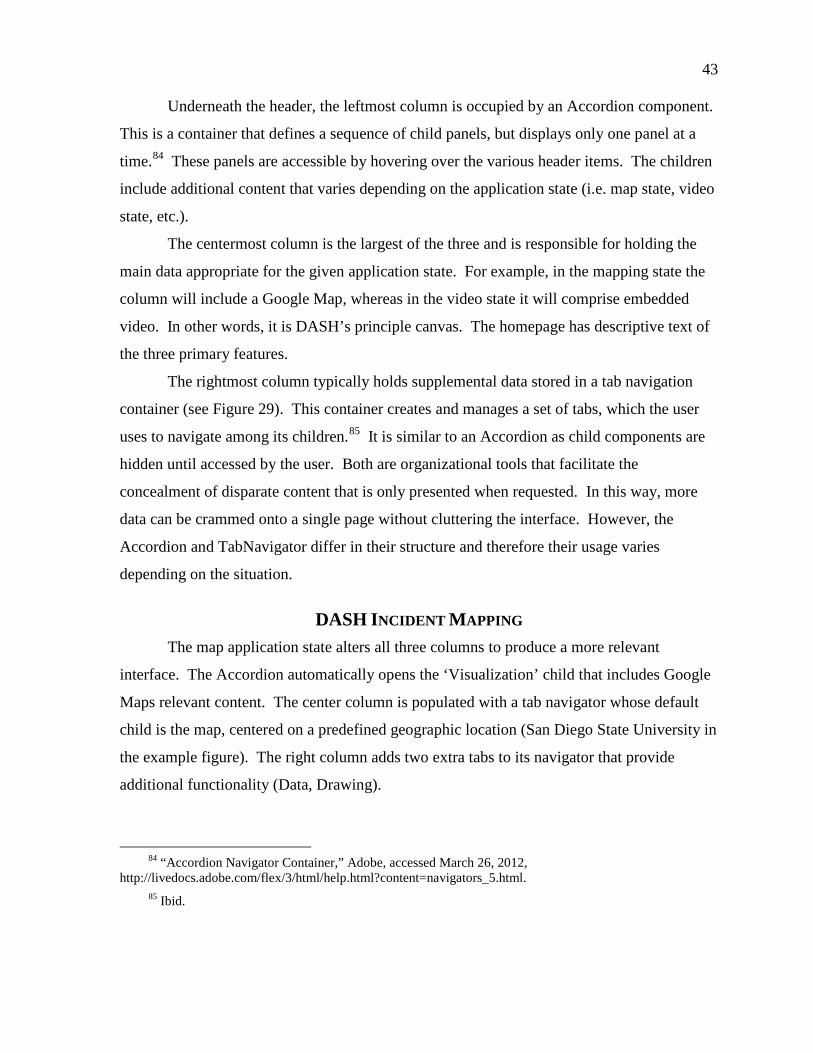
43
Underneath the header, the leftmost column is occupied by an Accordion component.
This is a container that defines a sequence of child panels, but displays only one panel at a
time.84
The centermost column is the largest of the three and is responsible for holding the
main data appropriate for the given application state. For example, in the mapping state the
column will include a Google Map, whereas in the video state it will comprise embedded
video. In other words, it is DASH’s principle canvas. The homepage has descriptive text of
the three primary features.
These panels are accessible by hovering over the various header items. The children
include additional content that varies depending on the application state (i.e. map state, video
state, etc.).
The rightmost column typically holds supplemental data stored in a tab navigation
container (see Figure 29). This container creates and manages a set of tabs, which the user
uses to navigate among its children.85
DASH INCIDENT MAPPING
It is similar to an Accordion as child components are
hidden until accessed by the user. Both are organizational tools that facilitate the
concealment of disparate content that is only presented when requested. In this way, more
data can be crammed onto a single page without cluttering the interface. However, the
Accordion and TabNavigator differ in their structure and therefore their usage varies
depending on the situation.
The map application state alters all three columns to produce a more relevant
interface. The Accordion automatically opens the ‘Visualization’ child that includes Google
Maps relevant content. The center column is populated with a tab navigator whose default
child is the map, centered on a predefined geographic location (San Diego State University in
the example figure). The right column adds two extra tabs to its navigator that provide
additional functionality (Data, Drawing).
84 “Accordion Navigator Container,” Adobe, accessed March 26, 2012,
http://livedocs.adobe.com/flex/3/html/help.html?content=navigators_5.html. 85 Ibid.

44
Figure 29. DASH tab navigator.
This is the common structure of DASH. Whenever a user clicks one of the three icon
buttons in the header, the application will reveal appropriate features for that particular
application state and hide the others (see Figure 30). As a design principle, this behavior is
consistent with Hick’s Law that states, “The time required to make a decision is a function of
the number of available options.”86
A fully rendered Google Map occupies the map state interface, and it is automatically
populated with GIS data retrieved from the central database (see Figure 31). The icons
In other words, if DASH maximized the available
options irrespective of the application state (e.g. Google Map options in Google Earth state)
the user interface would become far more complex. As a result, response times would
increase and user errors would abound. Both consequences are problematic during time-
critical humanitarian aid and disaster relief tasks. Hence, they should be avoided if possible.
86 William Lidwell, Kritina Holden, and Jill Butler, Universal Principles of Design (Minneapolis:
Rockport Publishers, 2003).
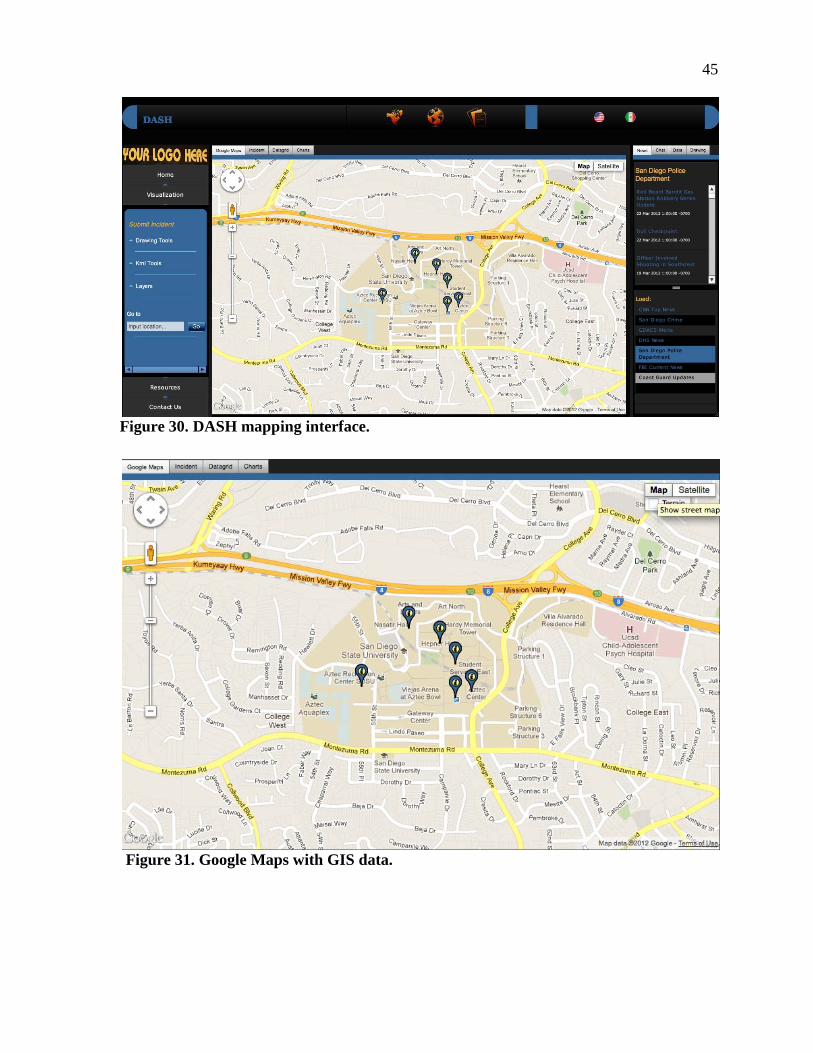
45
Figure 30. DASH mapping interface.
Figure 31. Google Maps with GIS data.
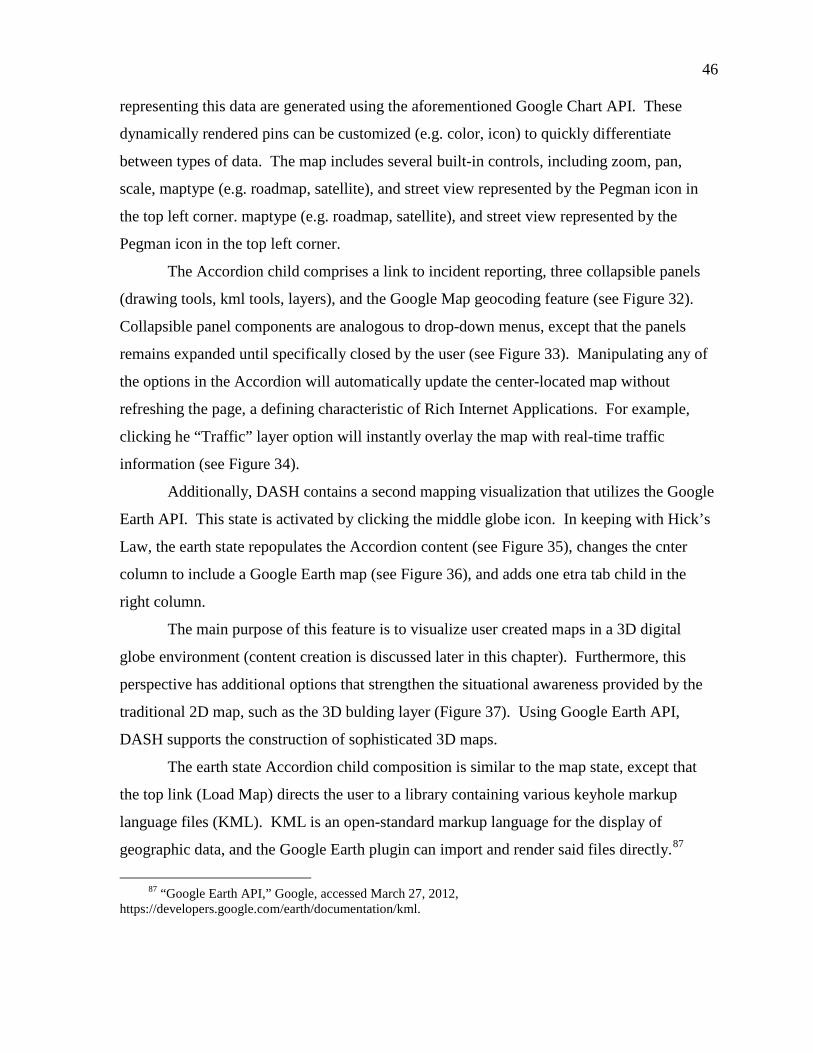
46
representing this data are generated using the aforementioned Google Chart API. These
dynamically rendered pins can be customized (e.g. color, icon) to quickly differentiate
between types of data. The map includes several built-in controls, including zoom, pan,
scale, maptype (e.g. roadmap, satellite), and street view represented by the Pegman icon in
the top left corner. maptype (e.g. roadmap, satellite), and street view represented by the
Pegman icon in the top left corner.
The Accordion child comprises a link to incident reporting, three collapsible panels
(drawing tools, kml tools, layers), and the Google Map geocoding feature (see Figure 32).
Collapsible panel components are analogous to drop-down menus, except that the panels
remains expanded until specifically closed by the user (see Figure 33). Manipulating any of
the options in the Accordion will automatically update the center-located map without
refreshing the page, a defining characteristic of Rich Internet Applications. For example,
clicking he “Traffic” layer option will instantly overlay the map with real-time traffic
information (see Figure 34).
Additionally, DASH contains a second mapping visualization that utilizes the Google
Earth API. This state is activated by clicking the middle globe icon. In keeping with Hick’s
Law, the earth state repopulates the Accordion content (see Figure 35), changes the cnter
column to include a Google Earth map (see Figure 36), and adds one etra tab child in the
right column.
The main purpose of this feature is to visualize user created maps in a 3D digital
globe environment (content creation is discussed later in this chapter). Furthermore, this
perspective has additional options that strengthen the situational awareness provided by the
traditional 2D map, such as the 3D bulding layer (Figure 37). Using Google Earth API,
DASH supports the construction of sophisticated 3D maps.
The earth state Accordion child composition is similar to the map state, except that
the top link (Load Map) directs the user to a library containing various keyhole markup
language files (KML). KML is an open-standard markup language for the display of
geographic data, and the Google Earth plugin can import and render said files directly.87
87 “Google Earth API,” Google, accessed March 27, 2012,
https://developers.google.com/earth/documentation/kml.
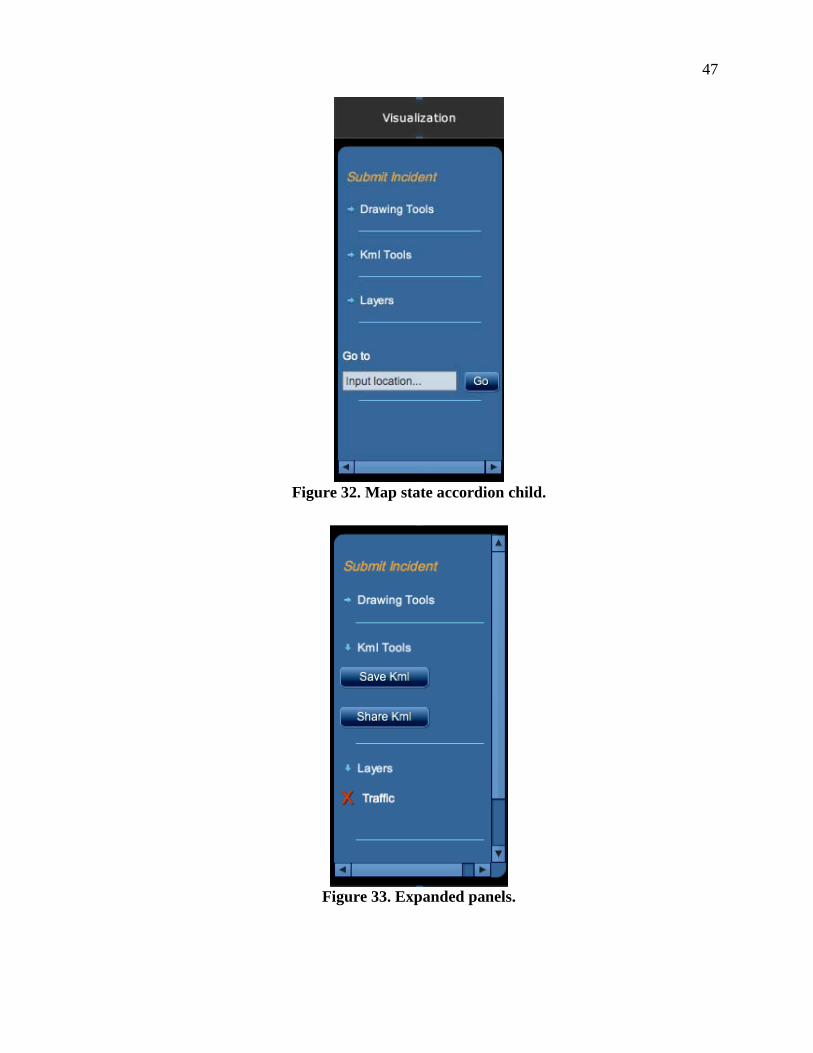
47
Figure 32. Map state accordion child.
Figure 33. Expanded panels.

48
Figure 34. Traffic layer.
Figure 35. Google Earth accordion child.
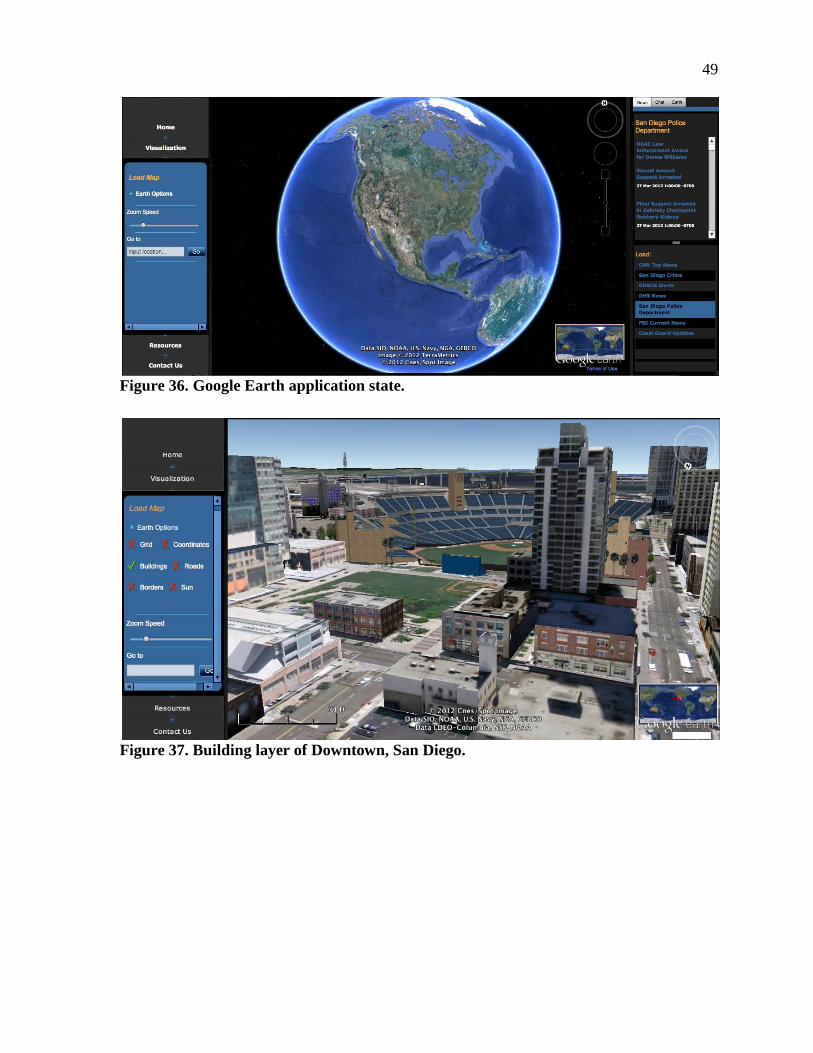
49
Figure 36. Google Earth application state.
Figure 37. Building layer of Downtown, San Diego.
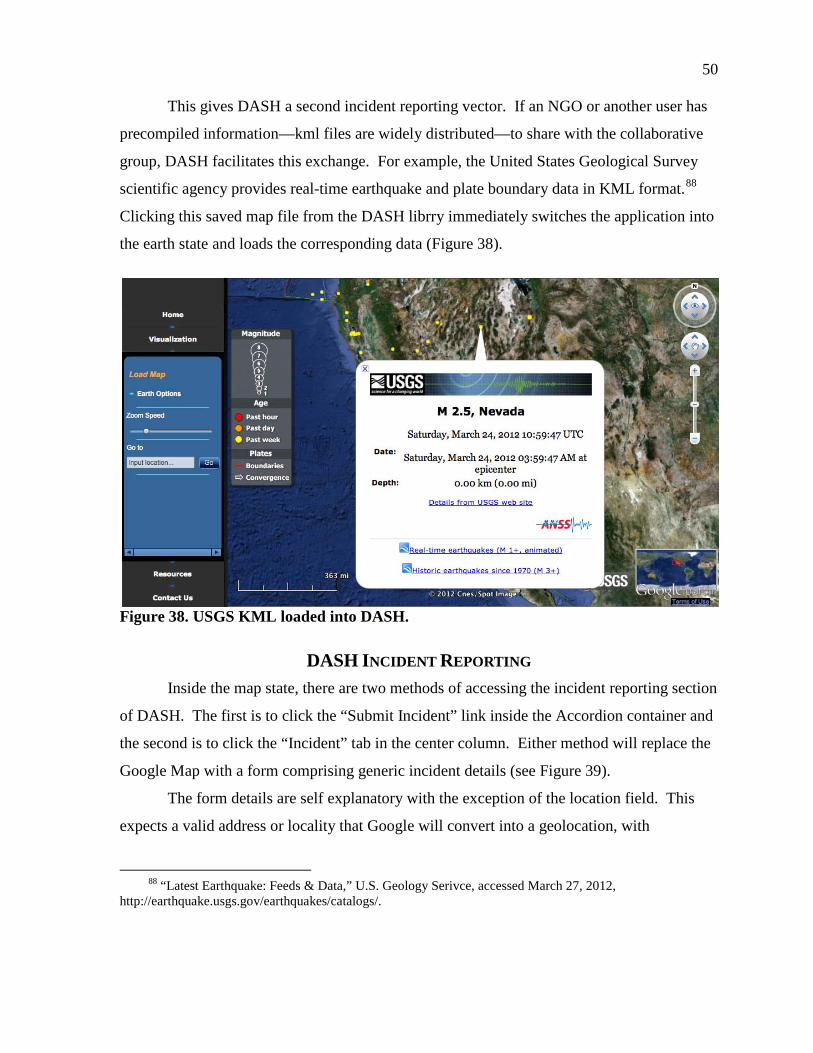
50
This gives DASH a second incident reporting vector. If an NGO or another user has
precompiled information—kml files are widely distributed—to share with the collaborative
group, DASH facilitates this exchange. For example, the United States Geological Survey
scientific agency provides real-time earthquake and plate boundary data in KML format.88
Clicking this saved map file from the DASH librry immediately switches the application into
the earth state and loads the corresponding data (Figure 38).
Figure 38. USGS KML loaded into DASH.
DASH INCIDENT REPORTING Inside the map state, there are two methods of accessing the incident reporting section
of DASH. The first is to click the “Submit Incident” link inside the Accordion container and
the second is to click the “Incident” tab in the center column. Either method will replace the
Google Map with a form comprising generic incident details (see Figure 39).
The form details are self explanatory with the exception of the location field. This
expects a valid address or locality that Google will convert into a geolocation, with
88 “Latest Earthquake: Feeds & Data,” U.S. Geology Serivce, accessed March 27, 2012,
http://earthquake.usgs.gov/earthquakes/catalogs/.
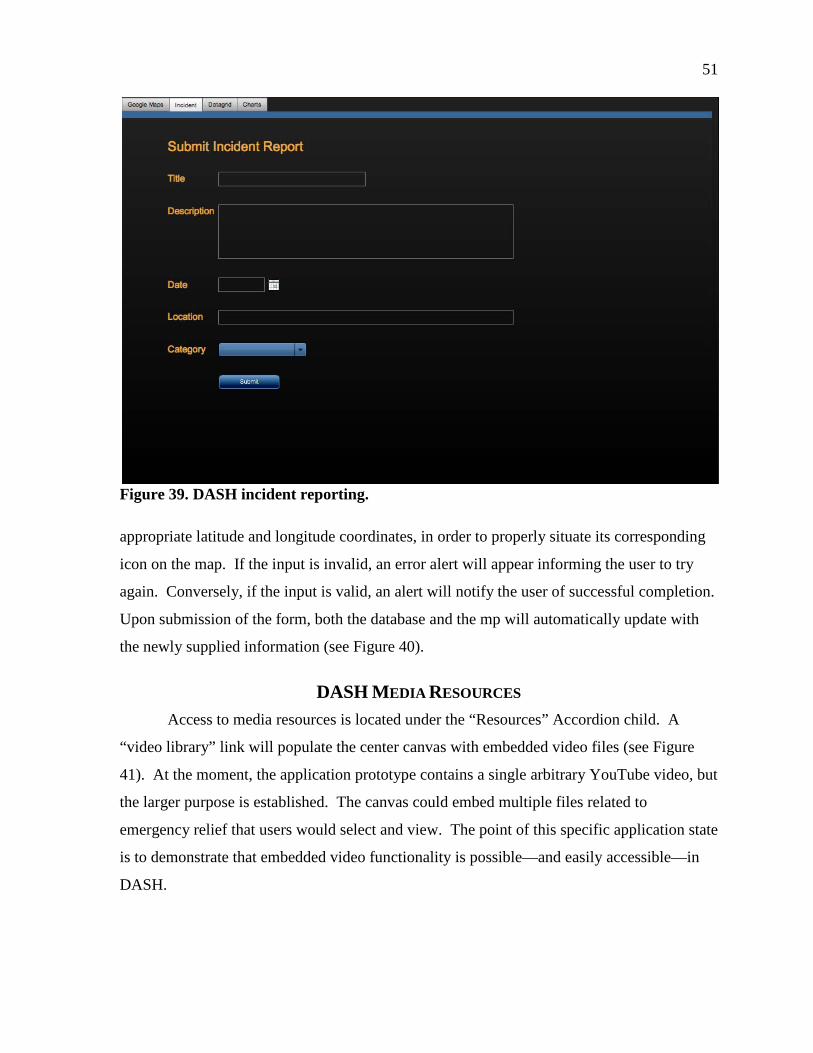
51
Figure 39. DASH incident reporting.
appropriate latitude and longitude coordinates, in order to properly situate its corresponding
icon on the map. If the input is invalid, an error alert will appear informing the user to try
again. Conversely, if the input is valid, an alert will notify the user of successful completion.
Upon submission of the form, both the database and the mp will automatically update with
the newly supplied information (see Figure 40).
DASH MEDIA RESOURCES Access to media resources is located under the “Resources” Accordion child. A
“video library” link will populate the center canvas with embedded video files (see Figure
41). At the moment, the application prototype contains a single arbitrary YouTube video, but
the larger purpose is established. The canvas could embed multiple files related to
emergency relief that users would select and view. The point of this specific application state
is to demonstrate that embedded video functionality is possible—and easily accessible—in
DASH.
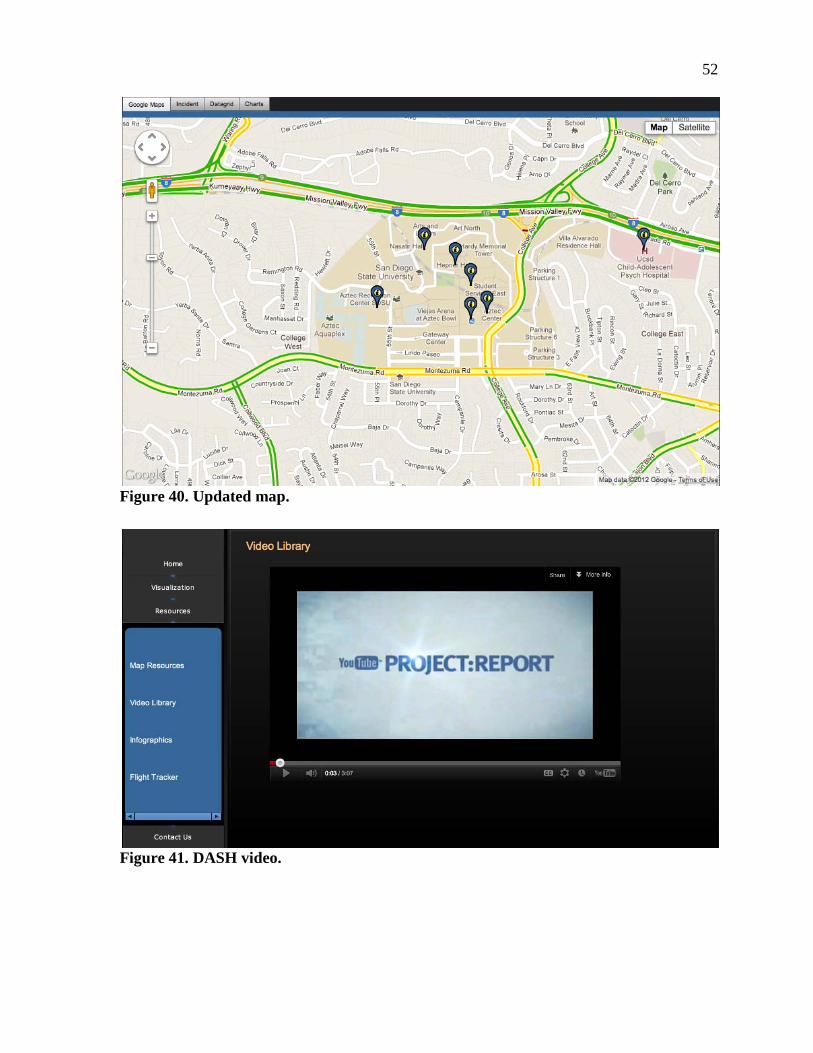
52
Figure 40. Updated map.
Figure 41. DASH video.
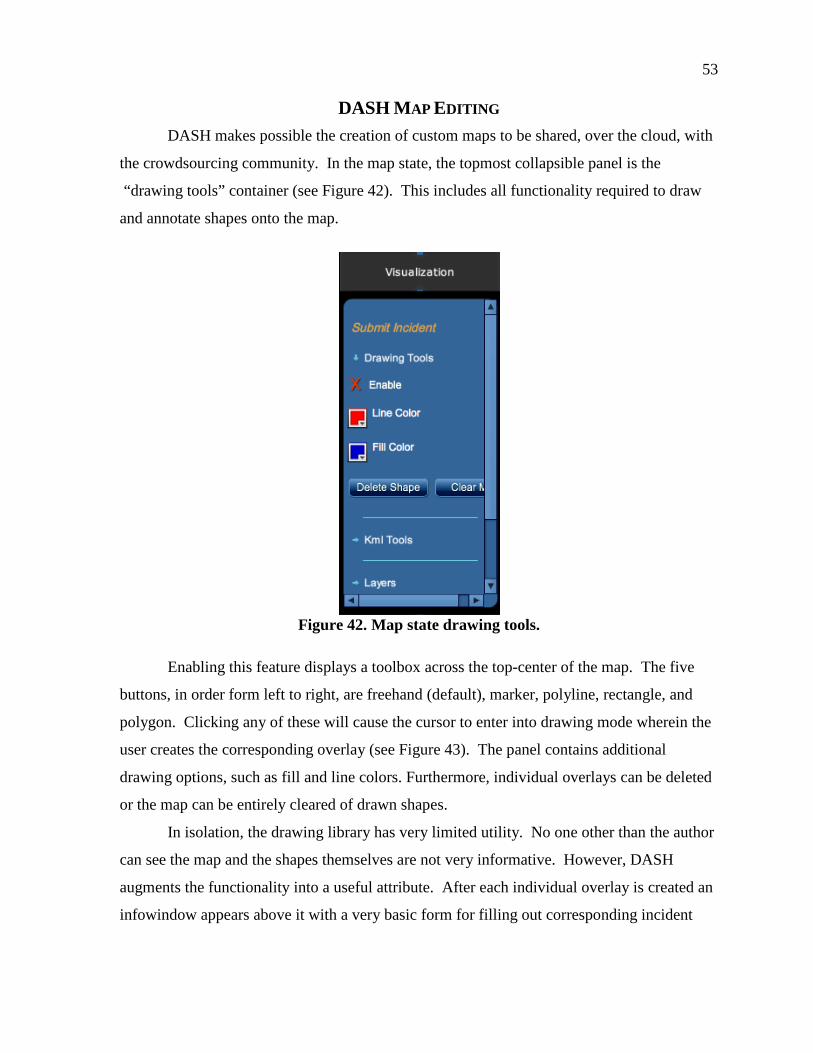
53
DASH MAP EDITING DASH makes possible the creation of custom maps to be shared, over the cloud, with
the crowdsourcing community. In the map state, the topmost collapsible panel is the
“drawing tools” container (see Figure 42). This includes all functionality required to draw
and annotate shapes onto the map.
Figure 42. Map state drawing tools.
Enabling this feature displays a toolbox across the top-center of the map. The five
buttons, in order form left to right, are freehand (default), marker, polyline, rectangle, and
polygon. Clicking any of these will cause the cursor to enter into drawing mode wherein the
user creates the corresponding overlay (see Figure 43). The panel contains additional
drawing options, such as fill and line colors. Furthermore, individual overlays can be deleted
or the map can be entirely cleared of drawn shapes.
In isolation, the drawing library has very limited utility. No one other than the author
can see the map and the shapes themselves are not very informative. However, DASH
augments the functionality into a useful attribute. After each individual overlay is created an
infowindow appears above it with a very basic form for filling out corresponding incident

54
Figure 43. Drawing overlays.
details (see Figure 44). Immediately, each overlay has contextual meaning within the custom
map. Furthermore, shape details can be reviewed in the right column tab navigation under
the “drawing” child so that the user can keep track of hisprogress when managing larger
projects (see Figure 45).
In the background, DASH deconstructs these shapes and generates corresponding
KML code that includes its type, fill and line color, name, description, and geocoordinates.
These are typically an array of latitude and longitude coordinates that can be
extracted from any overlay using exposed methods made available by the Google Maps API.
In other words, as users draw individual shapes on the map DASH compiles their unique
KML code and exports this collection into a fully constructed KML file. This file is saved
onto the author’s hard drive at their discretion (see Figure 46), which can then be uploaded
into DASH via the aforementioned resource library (see Figure 47). At this point, the
drawing becomes avaiable to the collective and anybody can view it inside he immersive 3D
Google Earth container (see Figure 48).
DASH COMMUNICATION & INFORMATION The rightmost column of the layout provides key functionality that is primarily
concerned with disseminating supplemental information to the user base. Irrespectie of the
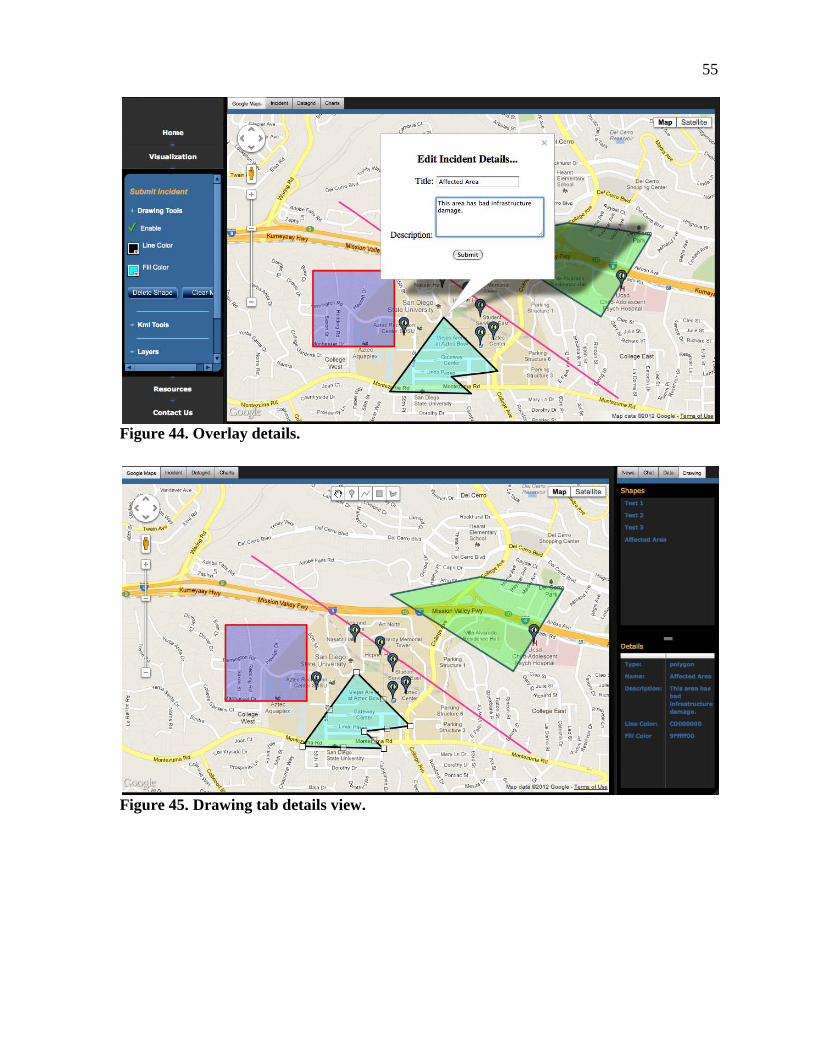
55
Figure 44. Overlay details.
Figure 45. Drawing tab details view.

56
Figure 46. Save map feature.
Figure 47. Select and upload file to resource library.
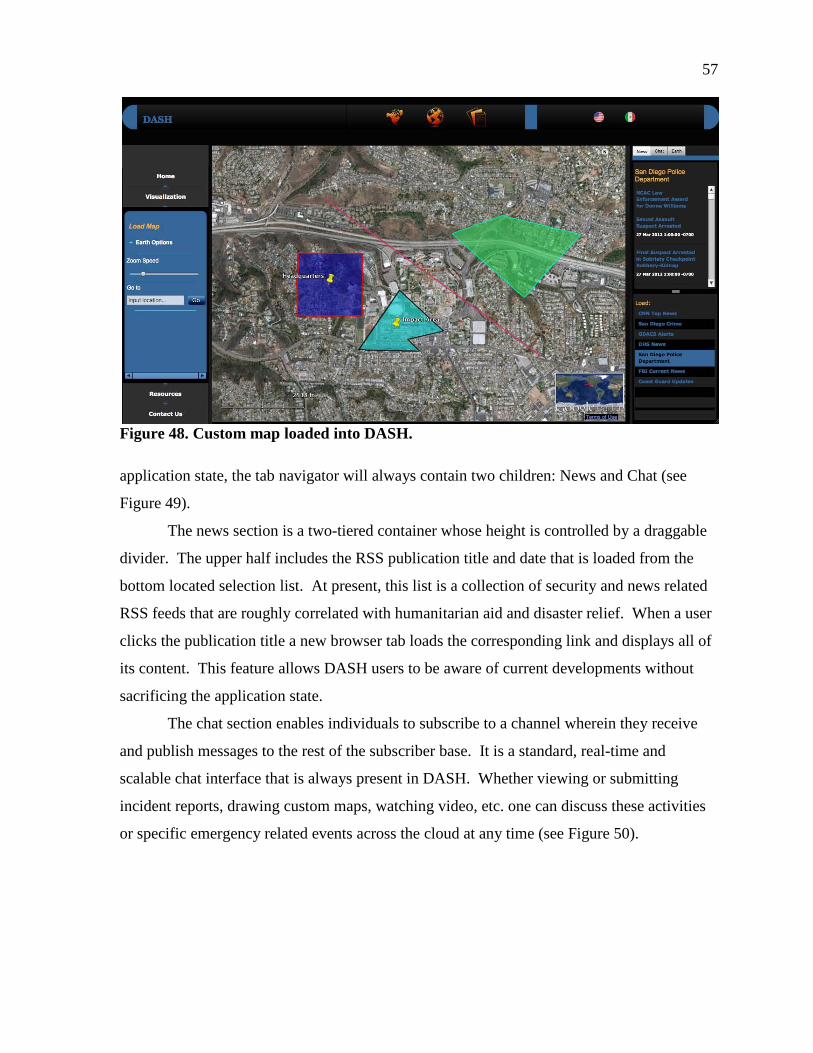
57
Figure 48. Custom map loaded into DASH.
application state, the tab navigator will always contain two children: News and Chat (see
Figure 49).
The news section is a two-tiered container whose height is controlled by a draggable
divider. The upper half includes the RSS publication title and date that is loaded from the
bottom located selection list. At present, this list is a collection of security and news related
RSS feeds that are roughly correlated with humanitarian aid and disaster relief. When a user
clicks the publication title a new browser tab loads the corresponding link and displays all of
its content. This feature allows DASH users to be aware of current developments without
sacrificing the application state.
The chat section enables individuals to subscribe to a channel wherein they receive
and publish messages to the rest of the subscriber base. It is a standard, real-time and
scalable chat interface that is always present in DASH. Whether viewing or submitting
incident reports, drawing custom maps, watching video, etc. one can discuss these activities
or specific emergency related events across the cloud at any time (see Figure 50).
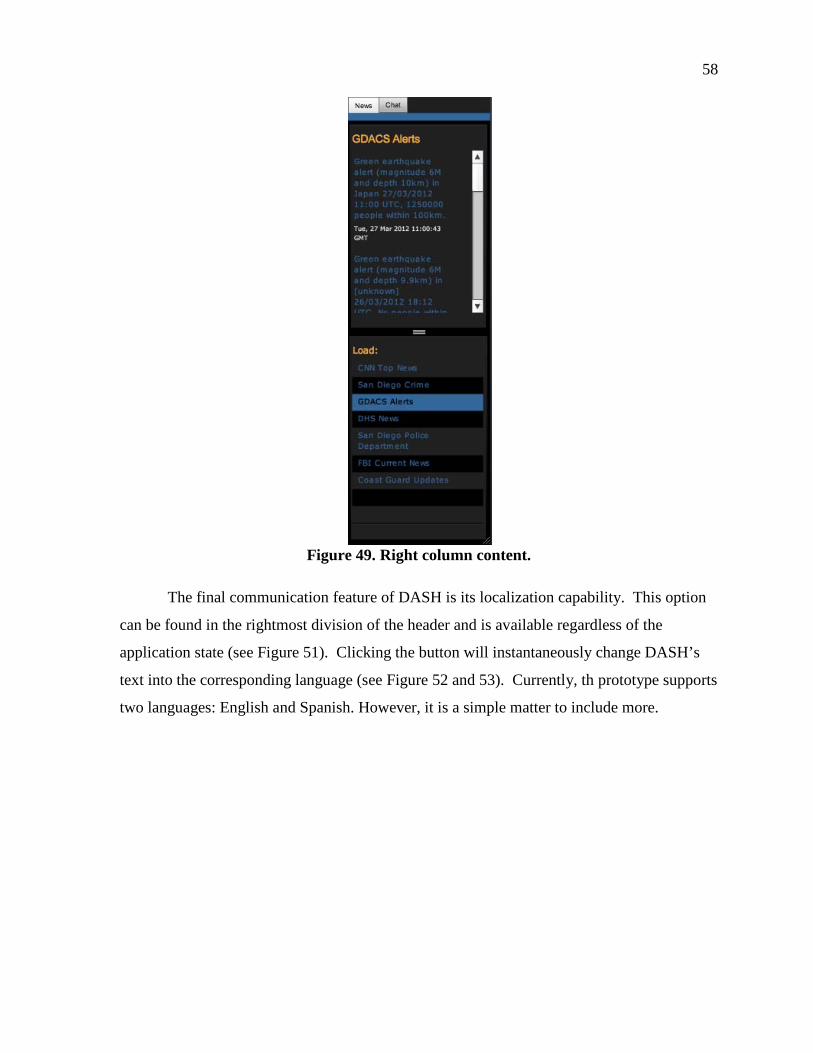
58
Figure 49. Right column content.
The final communication feature of DASH is its localization capability. This option
can be found in the rightmost division of the header and is available regardless of the
application state (see Figure 51). Clicking the button will instantaneously change DASH’s
text into the corresponding language (see Figure 52 and 53). Currently, th prototype supports
two languages: English and Spanish. However, it is a simple matter to include more.
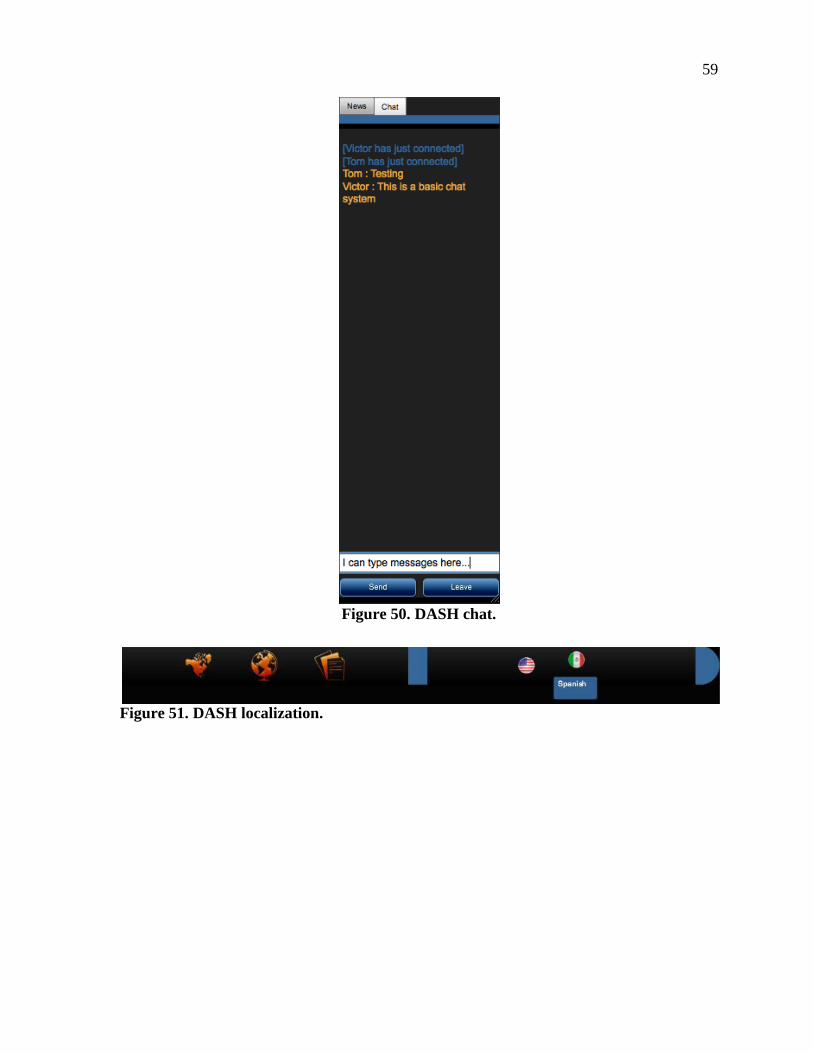
59
Figure 50. DASH chat.
Figure 51. DASH localization.
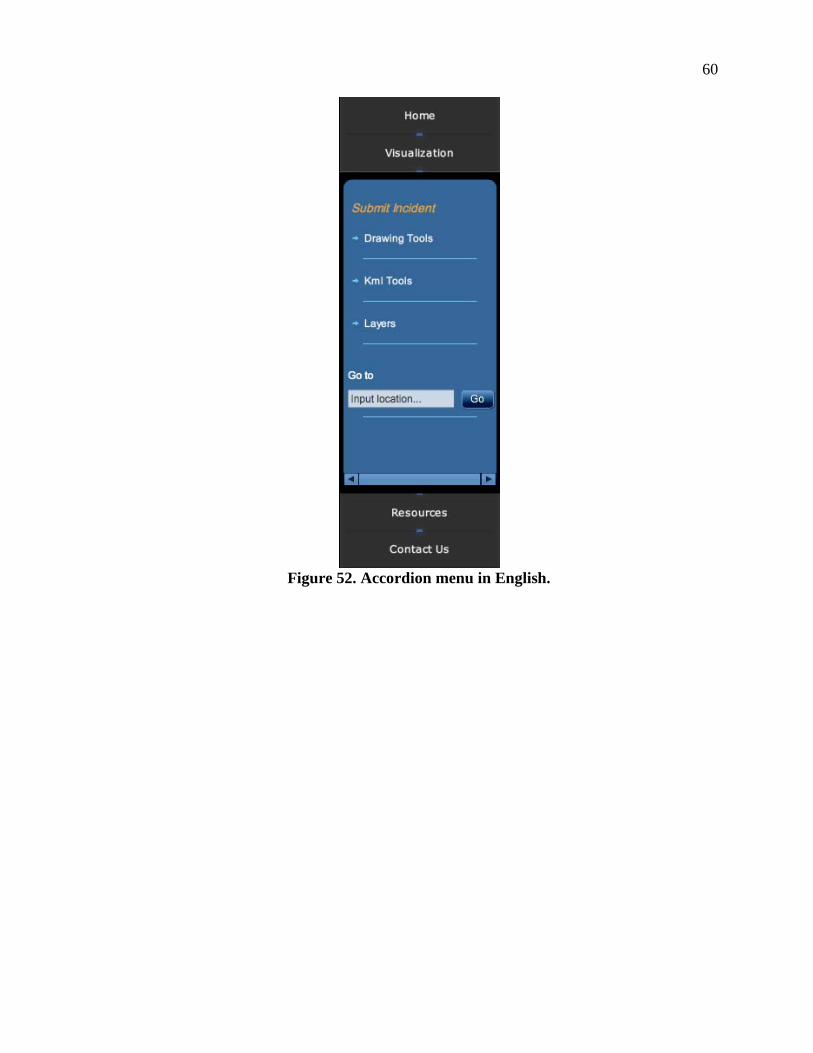
60
Figure 52. Accordion menu in English.
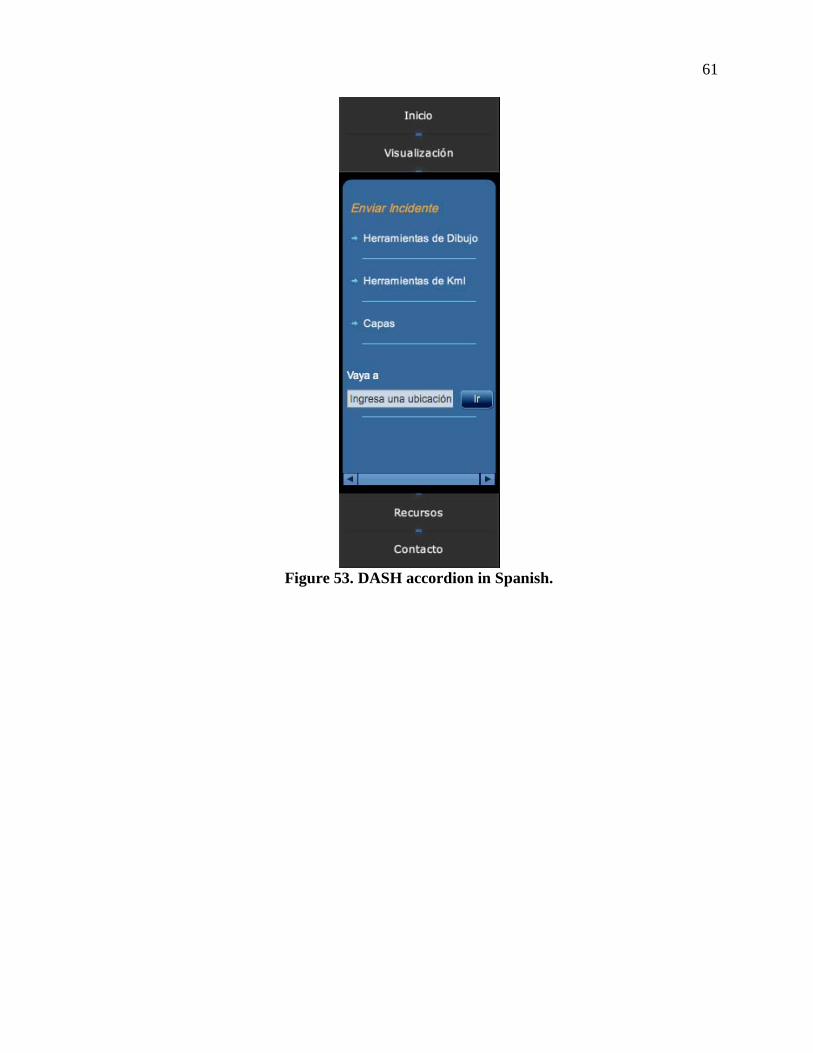
61
Figure 53. DASH accordion in Spanish.
62
CHAPTER 5
FUTURE APPLICATIONS AND DEVELOPMENT
In its totality, DASH is a prototype of a virtual incident command system that
incorporates features from established crowdsourcing software while adding some of its own
unique abilities. As an early example, there is clearly room for improvement. The following
three aspects will be further analyzed: enhancing current feature set, code modification, and
incorporation of analytics.
FEATURE ENHANCEMENT DASH is a diverse collection of tools with a focus on humanitarian aid and disaster
relief. Some of the features were more developed than others, but they can all be improved
in future iterations. An exhaustive list of all possibilities is unnecessary. Rather, a few basic
examples will be described to illustrate the potential future direction of the application.
These will be broken down according to the organization established in the previous two
chapters.
User Interface The UI can continually be refined where needed in order to more closely approximate
desktop software, or better encompass the natural workflow encouraged by RIAs. For
example, fade transitions between application states can be included. Additional mouse-over
hover tooltips can be added in ambiguous areas of the interface so that the user is not left
guessing about functionality. An engaging preloader can introduce DASH as Flex loads its
assets (as opposed to the default generic and uninformative progress bar currently
implemented). Furthermore, the typography can be re-evaluated. There are plenty of
adjustments to the UI that can be made as determined by designers or feedback from
usability testing.
Incident Mapping The map state of DASH should be enhanced to include data filtering. This feature
would be best located in the right column tab navigator under the “data” child (Figure 30).

63
Therein, users could filter emergency GIS data (i.e. map pins) according to category, a
required input field in the incident submission form. This would allow users to immediately
focus on the data they are most concerned with rather than being overburdened by the entire
data set, which can be sizeable in large-scale emergency situations.
Similarly, the earth state can benefit from enhanced organization of the data it
processes, namely kml files. Currently, only one document can be loaded into the plugin.
DASH would be better served if multiple files could be rendered and controlled as individual
layers. Again, a tab navigator child in the right column would contain this functionality
(Figure 35). Its major benefit would be the indirect inclusion of pattern recognition, albeit
primitive. For example, suppose an NGO created custom maps of hourly looting incidents in
a disaster stricken area and uploaded them into the DASH library. The crowdsourcing
community could then load each file atop one another into the Google Earth plugin. Users
toggling the visibility of independent layers would better identify the movement of said
looters (e.g. north to south, east to west). Thus, relief operations are in a better position to
anticipate the next strike and can proceed accordingly.
Incident Reporting Currently, DASH supports a single form with a few fields for submitting an incident.
Improvements can focus on expanding this form to be more detailed. Additionally, rather
than inputting an address or locality to be geolocated by Google’s API, users can manipulate
an embedded miniaturized map by dragging an icon precisely to the location of the incident.
This way, the user does not have to blindly trust the system. Furthermore, the reporting
process could benefit from validation. Prior to submission to the server, the client would
ensure the numerous fields are correctly filled (i.e. they do not contain invalid or
inappropriate content).
Media Resources Probably the most underdeveloped feature of the prototype, the video library section
can be refined in a number of ways. For example, the video state could either include a
preloaded set of useful clips ranging from emergency relief to basic ICS principles, or it
could utilize a manageable library, similar to the resource file section that contains the
64
various kml documents. Users would select and upload content they believe to be relevant to
the current emergency with the rest of the crowdsourcing base. In either case, the user
interface for this particular application state would vary depending on the approach.
Map Editing Tools The map editing process suffers from the same incomplete quality of the incident
reporting feature. The overlay completion form only has two fields: name and description.
This can be expanded. Currently, once the form is submitted the overlay’s details cannot be
modified. The only option is to delete the shape and start over. To rectify this, the right
column tab navigator child (drawing) that includes overlay information should be editable.
Users could then select a row of data (e.g. name) and alter its content. This event would
trigger an update of the kml generation for the affected shape, thus retaining the integrity and
accuracy of the mapping file.
Embedded Communication & Information Different users are likely to be interested in different types of outside information. It
would be advantageous if they could add a specific RSS feed as they use DASH. The bottom
half divider (Figure 49) should include a button that accepts a valid RSS URL and appends it
to the list. Additionally, the preloaded content can be diversified to include Twitter feeds
from key disaster relief organizations. As for localization, the application could always
benefit from additional language options.
The most important enhancement to the chat system is compartmentalization. At
present, every user logs into the same channel; a single published message reaches all
subscribers. DASH should include a handful of “rooms” to choose from, such as general
emergency information, incident reporting, map editing, etc. This would help to organize
content while dispersing information so that one single channel is not overwhelmed by the
entirety of the user base.
Regardless of what changes are deemed necessary for DASH, it is important that
future iterations remain mindful of Hick’s Law (The time required to make a decision is a
function of the number of available options). For instance, the chat system could be
“enhanced” to include a variety of customization options ranging from font type/size to
65
background color. However, these are clearly not useful additions. Worse yet, they are
likely to distract the user from the purpose of DASH and to the detriment of the affected
community.
CODE MODIFICATION Due to palpable time restraints, DASH was developed relatively quickly.
Consequently, the Flex source code architecture should be revised to promote better
organization that would ultimately make the process of maintenance and reusability easier.
Similarly, the JavaScript source can benefit from alteration to reduce bad practices such as
the presence of global variables. Also, the inclusion of libraries designed to mitigate cross-
browser issues, such as jQuery, should be used to create a more consistent user experience
while reducing repetitive code.
ANALYTICS The suggestions above certainly help to improve DASH, but they do nothing to alter
its fundamentally reactive nature. Currently, DASH is a virtual incident command system
that exists to facilitate humanitarian aid and disaster relief operations by consolidating a
diverse array of technologies disposable to those employing the software. However, DASH
is dumb; it is completely dependent on the user to give its abilities any life. Future iterations
of the application should strive to incorporate techniques that foster proactivity.
Digital Communication Surveillance (DCS) is broadly defined as analysis of any type
of digital data; it includes data gathering from various sources to provide a visual information
landscape.89 In other words, DCS provides the ability to search the web, accumulate
material, and analyze the aggrega90te to provide patterns of information about events, such
as epidemics or other disaster related incidents.91 This occurs in three stages (see Table 1) 92
89 Cezar M. Ornatowski and Akshay Pottathil, “Digital Communications Surveillance: A Challenge for
Rhetoric Studies,” African Yearbook of Rhetoric 3, no. 1 (2012): 13-22.
.
90 Ibid. 91 Ibid. 92 Ibid.
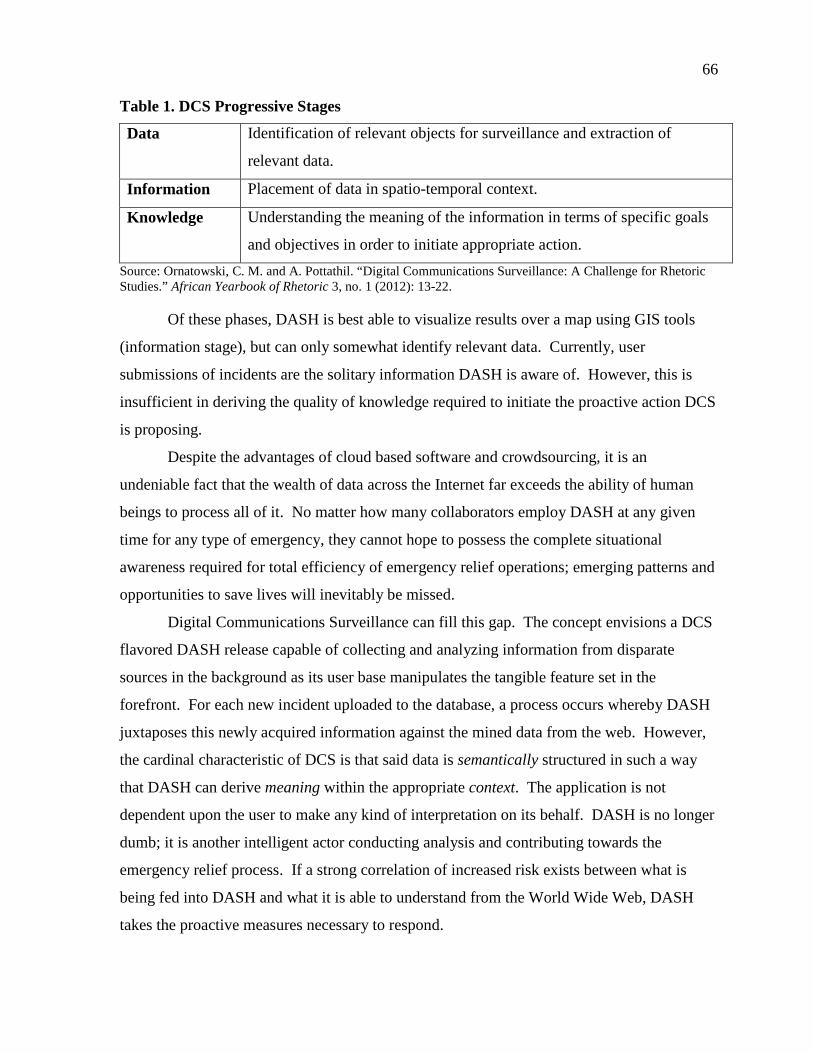
66
Table 1. DCS Progressive Stages
Data Identification of relevant objects for surveillance and extraction of
relevant data.
Information Placement of data in spatio-temporal context.
Knowledge Understanding the meaning of the information in terms of specific goals
and objectives in order to initiate appropriate action. Source: Ornatowski, C. M. and A. Pottathil. “Digital Communications Surveillance: A Challenge for Rhetoric Studies.” African Yearbook of Rhetoric 3, no. 1 (2012): 13-22.
Of these phases, DASH is best able to visualize results over a map using GIS tools
(information stage), but can only somewhat identify relevant data. Currently, user
submissions of incidents are the solitary information DASH is aware of. However, this is
insufficient in deriving the quality of knowledge required to initiate the proactive action DCS
is proposing.
Despite the advantages of cloud based software and crowdsourcing, it is an
undeniable fact that the wealth of data across the Internet far exceeds the ability of human
beings to process all of it. No matter how many collaborators employ DASH at any given
time for any type of emergency, they cannot hope to possess the complete situational
awareness required for total efficiency of emergency relief operations; emerging patterns and
opportunities to save lives will inevitably be missed.
Digital Communications Surveillance can fill this gap. The concept envisions a DCS
flavored DASH release capable of collecting and analyzing information from disparate
sources in the background as its user base manipulates the tangible feature set in the
forefront. For each new incident uploaded to the database, a process occurs whereby DASH
juxtaposes this newly acquired information against the mined data from the web. However,
the cardinal characteristic of DCS is that said data is semantically structured in such a way
that DASH can derive meaning within the appropriate context. The application is not
dependent upon the user to make any kind of interpretation on its behalf. DASH is no longer
dumb; it is another intelligent actor conducting analysis and contributing towards the
emergency relief process. If a strong correlation of increased risk exists between what is
being fed into DASH and what it is able to understand from the World Wide Web, DASH
takes the proactive measures necessary to respond.
67
In a fictitious scenario, the aftermath of a natural disaster inspires a Twitter
movement encouraging able-bodied volunteers to meet at urban location x within the affected
area. Soon after, an earthquake of relative strength occurs and users of the DASH system
upload this incident into the database. The crowdsourcing community determines that an
appropriate course of action would be to deploy relief assets nearby the epicenter of this
event. However, DCS enabled DASH has correctly ascertained that said area is likely to
have an increased volume of people due to the aforementioned Twitter trend, and the
application correctly compensates by adjusting the amount of deployed resources. This is
one example of how future iterations of DASH become proactive.
CONCLUSION Deploying collaborative GIS environments that are hosted in the cloud and facilitate
crowdsourcing is one strategy for communities to adopt in the aftermath of disasters, such as
tsunamis and earthquakes. The use of GIS in disaster management is critical to attain
comprehensive situational awareness. The ability to fully understand the consequences of
disasters enables responders to more efficiently distribute limited available resources.
The attempt to emulate desktop software over the cloud is the present trend that
parallels the evolution of the Internet. This is the future of virtual disaster relief. There is a
unique correlation between software and the developments of the infrastructure on which it
resides. As the latter progresses, so too should the former. Currently, Internet applications
are developed to be collaborative and encourage interactivity beyond the simple retrieval of
information; they are participation platforms that benefit from the collective intelligence of
the user base employing it. DASH is a prototype of a virtual incident command system that
incorporates features from established crowdsourcing software while adding some of its own
unique abilities. It embodies the participatory characteristics and assists with decisions based
on geospatially and temporally related data streams to the benefit of the disaster relief
community.
68
REFERENCES
Adobe. “Flash Platform for SaaS Applications.” Accessed March 26, 2012. http://www.adobe.com/flashplatform/technology/saas/.
Adobe. “Accordion Navigator Container.” Accessed March 26, 2012. http://livedocs.adobe.com/flex/3/html/help.html?content=navigators_5.html.
Alkima Networks. “What is the Internet Cloud?” Accessed March 5, 2012. http://www.alkima.net/home/resources/why-google-apps/internet-cloud.
Barta, D. “Project OpenStreetMap as Open and Free Source of Geodata and Maps.” Symposium GIS Ostrava 1 (2011): 1-12
Beaird, J. The Principles of Beautiful Web Design. Melbourne, Australia: Sitepoint, 2010.
Blanchard, H. “Meet Oil Reporter.” Accessed March 8, 2012. http://crisiscommons.org/2010/05/25/meet-oil-reporter/.
Brabham, Daren. C. “Crowdsourcing as a Model for Problem Solving: An Introduction and Cases.” Convergence 14 (2008): 75–90.
Careem, M., De Silva, C., De Silva, R., Raschid, L., and S. L. Weerawarana. “Sahana: Overview of a Disaster Management System.” Proceedings of the International Conference on Information and Automation, Colombo, Sri Lanka, December 2006.
Careem, M., De Silva, C., De Silva, R., Raschid, L., and S. L. Weerawarana. “Demonstration of Sahana: free and open source disaster management.” Proceedings of the 8th Annual International Conference on Digital Government Research: Bridging Disciplines & Domains, Philadelphia, PA, May 2007.
Chilton, S. “Crowdsourcing is Radically Changing the Data Landscape: Case Study of OpenStreetMap.” Paper presented at 24th International Cartographic Conference, London, UK, November 2009.
Crisis Commons. “About.” Accesed March 8, 2012. http://crisiscommons.org/about.
Currion, Paul, Chamindra de Silva, and Bartel Van de Walle. (2007) “Open Source Software for Disaster Management.” Communications of the ACM 50, no. 3 (2007): 61-65.
Davis, J. G. “From Crowdsourcing to Crowdservicing.” Institute of Electrical and Electronics Engineers 15, no. 3 (2011): 92-94.
Fain, Y., V. Rasputnis, and A. Tartakovsky. Enterprise Development with Flex. Sebastopol: O'Reilly, 2010.
Flanagan, D. JavaScript: The Definitive Guide: Activate Your Web Pages. Sebastopol: O’Reilly, 2011.
Google. “Overview of Google Earth.” Accessed March 5, 2012. http://support.google.com/earth/bin/answer.py?hl=en&answer=176145.
69
Google. “Importing Geographic Information Systems (GIS) data in Google Earth.” Accessed March 5, 2012. http://earth.google.com/outreach/tutorial_importgis.html.
Google. “Google Maps Javascript API v3 Developer’s Guide.” Accessed March 21, 2012. https://developers.google.com/maps/documentation/javascript/layers.
Google. “Google Earth API.” Accessed March 27, 2012. https://developers.google.com/earth/documentation/kml.
Google. “Google Maps API.” Accessed March 5, 2012. http://code.google.com/apis/maps/index.html.
Haklay, M., and P. Weber. “OpenStreetMap: User-Generated Street Maps.” Pervasive Computing IEEE 7, no. 4 (2008): 12-18.
Hersman, E. “Announcing Funding from Omidyar Network.” Accessed March 19, 2012. http://blog.ushahidi.com/index.php/2009/12/03/announcing-funding-from-the-omidyar-network/.
In-Q-Tel. “History.” Accessed March 22, 2012. http://www.iqt.org/about-iqt/history.html
Janssen, M., and A. Joha. “Challenges For Adopting Cloud-Based Software as a Service (SAAS) in the Public Sector.” European Conference on Information Systems 1 (2011): 80.
Jacobson, D., G. Brail, and D. Woods. APIS: A Strategy Guide. Sebastopol: O’Reilly, 2011.
Kaufman, L. M. “Data Security in the World of Cloud Computing.” IEEE Security and Privacy 7, no. 4 (2009): 61-64.
Labriola, M., and J. Tapper. Adobe Flex 4.5 Fundamentals: Training from the Source. Berkeley: Adobe Press, 2011.
Lau, E. “Google Geo Developers Blog.” Accessed November 15, 2011. http://googlegeodevelopers.blogspot.com/2011/11/make-your-map-interactive-with-shape.html.
Lidwell, W., K. Holden, and J. Butler. Universal Principles of Design. Minneapolis: Rockport Publishers, 2003.
Narang, N. “Developing GIS tools for Planning, Mitigation and Preparedness for Large Scale Emergencies & Disasters.” Paper presented at the 4th Annual International Conference on Next Generation Infrastructures, Norfolk, VA, November 2011.
Oil Reporter. “Reports.” Accessed March 8, 2012. http://oilreporter.org/reports.
Oil Spills. “iWitness Pollution Map.” Accessed March 12, 2012. http:// oilspill.labucketbrigade.org.
Ornatowski, C. M. and A. Pottathil. “Digital Communications Surveillance: A Challenge for Rhetoric Studies.” African Yearbook of Rhetoric 3, no. 1 (2012): 13-22.
Okolloh, O. “Ushahidi, or ‘Testimony’: Web 2.0 Tools for Crowdsourcing Crisis Information.” Participatory Learning and Action 56 (2009): 65-70.
70
OpenStreetMap. “Main Page.” Accessed March 8, 2012. http://wiki.openstreetmap.org/wiki/Main_Page.
Oxenford, E. Community, Collaboration and Crowdsourcing. Seattle: Anni Searle & Associations, 2011.
Pellerin, C. “United States Updates Global Positioning System Technology.” Accessed February 3, 2006. http://www.america.gov/st/washfile-english/2006/February/20060203125928lcnirellep0.5061609.html.
Prustalis, M., and C. de Silva. “ICT for Disaster Risk Reduction.” Accessed March 10, 2012. http://www.unapcict.org/ecohub/ict-for-disaster-risk-reduction-1/at_download/attachment1.
Rutgers University. “The Office of Instructional and Research Technology.” Accessed March 21, 2012. http://oirt.rutgers.edu/training-consultation/tool-pages/really-simple-syndication-rss/.
Sahana Foundation. “Managing Disasters Sahana, Sri Lanka.” Accessed Mar. 10 2012. http://wiki.sahanafoundation.org/lib/exe/fetch.php/undp-iosn-casestudy-sahana-final-1.pdf.
Trice, A. “What is RIA?” Accessed March 20, 2012. http://www.whatisria.info/definitions/andrew-trice/.
U. S. Department of Transportation. “Glossary: Simplified Guide to the Incident Command System for Transportation Professionals.” Accessed March 29, 2012. http://ops.fhwa.dot.gov/publications/ics_guide/glossary.htm.
U. S. Geology Service. “Latest Earthquake: Feeds & Data.” Accessed March 27, 2012. http://earthquake.usgs.gov/earthquakes/catalogs/.
U.S. Government Printing Office. “National Defense Authorization Act for Fiscal Year 1996.” Accessed March 5, 2012. http://www.gpo.gov/fdsys/pkg/PLAW-104publ106/pdf/PLAW-104publ106.pdf.
Ushahidi. “About us.” Accessed March 8, 2012. http://www.ushahidi.com/about-us.
Ushahidi. “Incident Map.” Accessed March 19, 2012, http://www.legacy.ushahidi.com.
Ushahidi. “SMS Reporting Through Ushahidi.” Accessed March 10, 2012. http://blog.ushahidi.com/index.php/2008/11/05/sms-reporting-through-ushahidi/.
Viz Center. “Mexico.” Accessed March 26, 2012. http://vizcenter.net/x24/more.html.
Waugh, W. “Geographic Information Systems: The Case of Disaster Management.” Social Science Computer Review 13, no. 4 (1995): 422.
Zook, M., M. Graham, T. Shelton, and S. Gorman. “Volunteered Geographic Information and Crowdsourcing Disaster Relief: A Case Study of the Haitian Earthquake.” World Medical & Health Policy 2, no. 2 (2010): Article 2.