Cohesive Traction-Separation Laws for Tearing of Ductile ...
30
Cohesive Traction-Separation Laws for Tearing of Ductile Metal Plates Citation Nielsen, K. L., and John W. Hutchinson. 2012. Cohesive traction–separation laws for tearing of ductile metal plates. International Journal of Impact Engineering 48:15-23. Published Version doi:10.1016/j.ijimpeng.2011.02.009 Permanent link http://nrs.harvard.edu/urn-3:HUL.InstRepos:10163031 Terms of Use This article was downloaded from Harvard University’s DASH repository, and is made available under the terms and conditions applicable to Open Access Policy Articles, as set forth at http:// nrs.harvard.edu/urn-3:HUL.InstRepos:dash.current.terms-of-use#OAP Share Your Story The Harvard community has made this article openly available. Please share how this access benefits you. Submit a story . Accessibility
Transcript of Cohesive Traction-Separation Laws for Tearing of Ductile ...

Cohesive Traction-Separation Laws for Tearing of Ductile Metal Plates
CitationNielsen, K. L., and John W. Hutchinson. 2012. Cohesive traction–separation laws for tearing of ductile metal plates. International Journal of Impact Engineering 48:15-23.
Published Versiondoi:10.1016/j.ijimpeng.2011.02.009
Permanent linkhttp://nrs.harvard.edu/urn-3:HUL.InstRepos:10163031
Terms of UseThis article was downloaded from Harvard University’s DASH repository, and is made available under the terms and conditions applicable to Open Access Policy Articles, as set forth at http://nrs.harvard.edu/urn-3:HUL.InstRepos:dash.current.terms-of-use#OAP
Share Your StoryThe Harvard community has made this article openly available.Please share how this access benefits you. Submit a story .
Accessibility

1
Cohesive Traction-Separation Laws for Tearing of Ductile Metal Plates
K.L. Nielsen1,2 and J.W. Hutchinson2 * 1Department of Mechanical Engineering, Solid Mechanics, Technical University of Denmark,
DK-2800 Kgs. Lyngby, Denmark
2School of Engineering and Applied Sciences, Harvard University, Cambridge, MA, United States
Abstract – The failure process ahead of a mode I crack advancing in a ductile thin metal plate or
sheet produces plastic dissipation through a sequence of deformation steps that include necking well
ahead of the crack tip and shear localization followed by a slant fracture in the necked region
somewhat closer to the tip. The objective of this paper is to analyze this sequential process to
characterize the traction-separation behavior and the associated effective cohesive fracture energy
of the entire failure process. The emphasis is on what is often described as plane stress behavior
taking place after the crack tip has advanced a distance of one or two plate thicknesses. Traction-
separation laws are an essential component of finite element methods currently under development
for analyzing fracture of large scale plate or shell structures. The present study resolves the
sequence of failure details using the Gurson constitutive law based on the micromechanics of the
ductile fracture process, including a recent extension that accounts for damage growth in shear. The
fracture process in front of an advancing crack, subject to overall mode I loading, is approximated
by a 2D plane strain finite element model, which allows for an intensive study of the parameters
influencing local necking, shear localization and the final slant failure. The deformation history
relevant to a cohesive zone for a large scale model is identified and the traction-separation relation
is determined, including the dissipated energy. For ductile structural materials, the dissipation
generated during necking prior to the onset of shear localization is the dominant contribution; it
scales with the plate thickness and is mesh-independent in the present numerical model. The energy
associated with the shear localization and fracture is secondary; it scales with the width of the shear
band, and inherits the finite element mesh dependency of the Gurson model. The cohesive traction-
separation laws have been characterized for various material conditions.
Keywords: Cohesive zone model, Gurson model, Shear localization, Slant fracture, Ductile plates.
This paper is dedicated to Professor S. R. Reid on the occasion of his 65th birthday in celebration of
his contributions to the deformation and failure of ductile metal components and structures.
* Corresponding author:
3
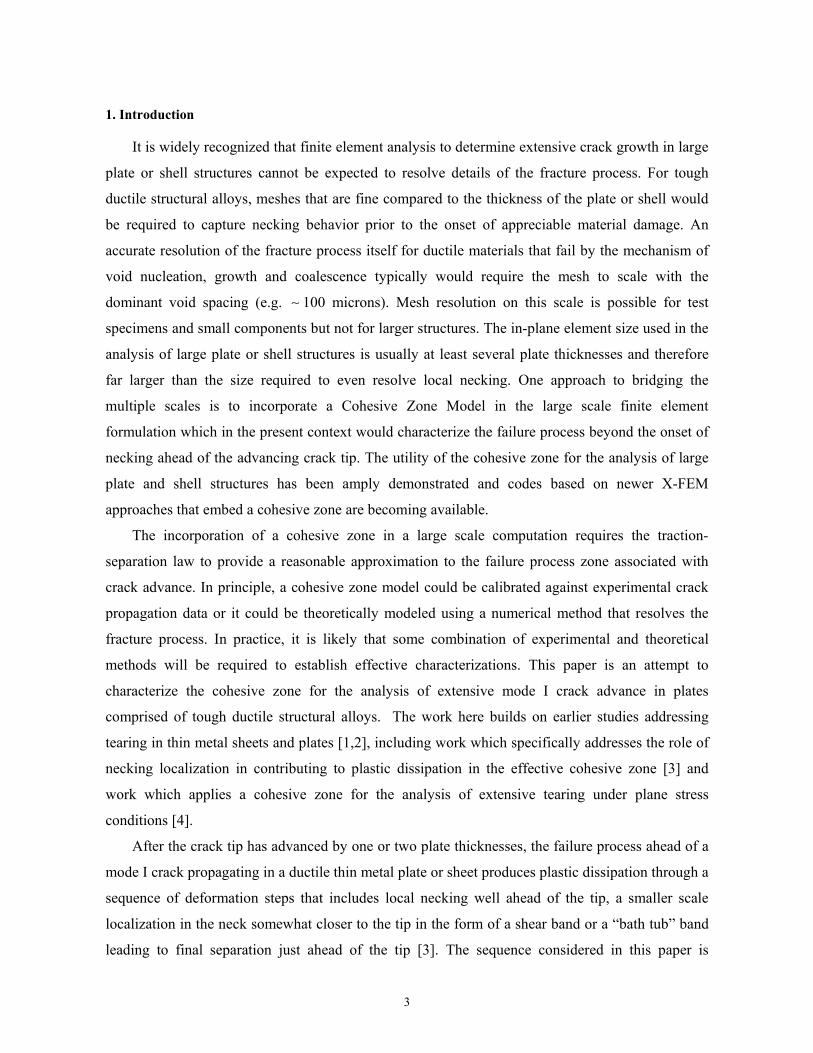
1. Introduction
It is widely recognized that finite element analysis to determine extensive crack growth in large
plate or shell structures cannot be expected to resolve details of the fracture process. For tough
ductile structural alloys, meshes that are fine compared to the thickness of the plate or shell would
be required to capture necking behavior prior to the onset of appreciable material damage. An
accurate resolution of the fracture process itself for ductile materials that fail by the mechanism of
void nucleation, growth and coalescence typically would require the mesh to scale with the
dominant void spacing (e.g. 100 microns). Mesh resolution on this scale is possible for test
specimens and small components but not for larger structures. The in-plane element size used in the
analysis of large plate or shell structures is usually at least several plate thicknesses and therefore
far larger than the size required to even resolve local necking. One approach to bridging the
multiple scales is to incorporate a Cohesive Zone Model in the large scale finite element
formulation which in the present context would characterize the failure process beyond the onset of
necking ahead of the advancing crack tip. The utility of the cohesive zone for the analysis of large
plate and shell structures has been amply demonstrated and codes based on newer X-FEM
approaches that embed a cohesive zone are becoming available.
The incorporation of a cohesive zone in a large scale computation requires the traction-
separation law to provide a reasonable approximation to the failure process zone associated with
crack advance. In principle, a cohesive zone model could be calibrated against experimental crack
propagation data or it could be theoretically modeled using a numerical method that resolves the
fracture process. In practice, it is likely that some combination of experimental and theoretical
methods will be required to establish effective characterizations. This paper is an attempt to
characterize the cohesive zone for the analysis of extensive mode I crack advance in plates
comprised of tough ductile structural alloys. The work here builds on earlier studies addressing
tearing in thin metal sheets and plates [1,2], including work which specifically addresses the role of
necking localization in contributing to plastic dissipation in the effective cohesive zone [3] and
work which applies a cohesive zone for the analysis of extensive tearing under plane stress
conditions [4].
After the crack tip has advanced by one or two plate thicknesses, the failure process ahead of a
mode I crack propagating in a ductile thin metal plate or sheet produces plastic dissipation through a
sequence of deformation steps that includes local necking well ahead of the tip, a smaller scale
localization in the neck somewhat closer to the tip in the form of a shear band or a “bath tub” band
leading to final separation just ahead of the tip [3]. The sequence considered in this paper is

4
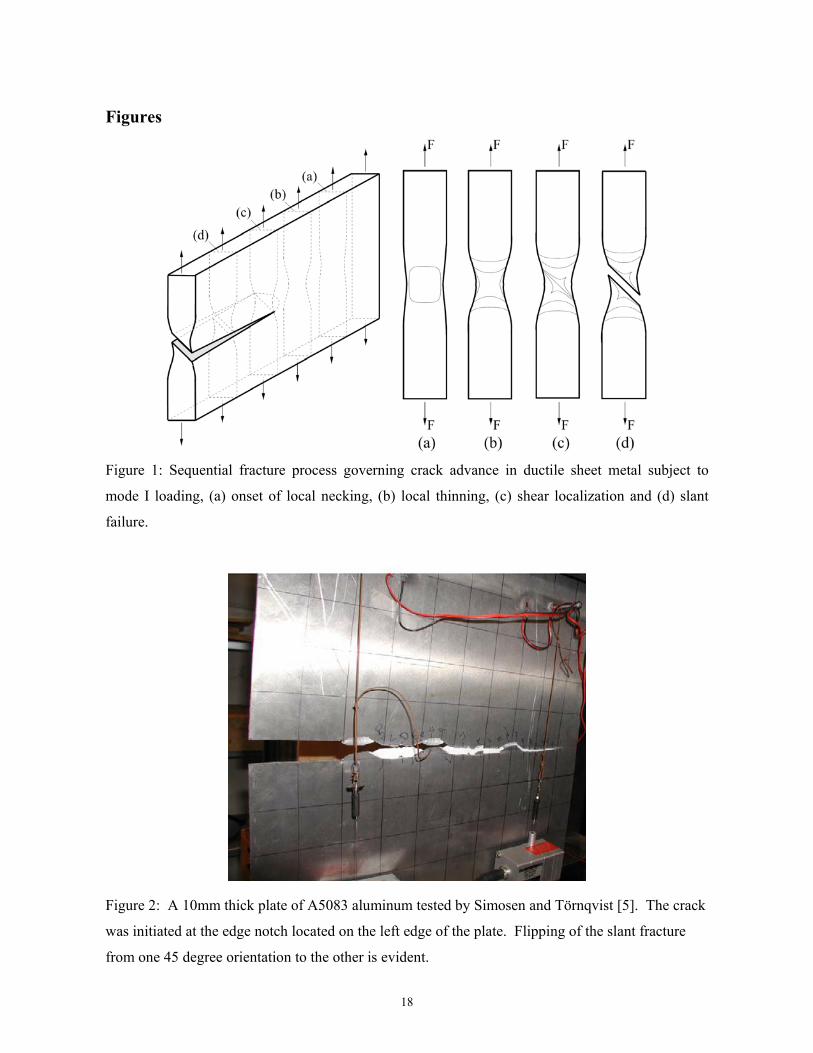
depicted in Fig. 1 and gives rise to the commonly observed slant fracture. The final slant fracture of
a tearing test is seen in Fig. 2. This picture was taken from the paper by Simonsen and Törnqvist
[5] who carried out a set of large scale tests for mode I crack advance in ductile aluminum and steel
plates with cracks propagating up to 30-40 times the plate thickness. The objective of this paper is
to analyze the sequential process governing this failure mode and thereby characterize the traction-
separation behavior and associated cohesive fracture energy of the entire failure process. The
phenomenon seen in Fig. 2 in which the fracture slant “flips” back and forth from one roughly 45
degree orientation to the other, after growth on the order of 10 times the plate thickness, has not
been resolved in the present study. However, the numerical results will show a second “inactive”
shear-band co-existing with the band governing the crack advance which may be relevant.
The initiation of crack advance from a blunted tip is not addressed in this paper. Rather, it is
imagined that the crack tip has already advanced by several plate thicknesses such that the steady-
state deformation/fracture sequence ahead of the tip depicted in Fig. 1 is fully established. The
present study resolves the sequence of failure details using a finite strain version of the Gurson [6]
constitutive law for the ductile damage process, including a recent extension accounting for damage
growth in shear [7]. The fracture process in front of an advancing crack, subject to mode I loading,
is approximated by a 2D plane strain finite element model. The portion of the deformation history
relevant to the cohesive zone for a large scale model is identified and the traction-separation
relation and the dissipated energy are determined. In addition, two distinct contributions to the
dissipated energy will be indentified and computed: the first due to necking, and the second due to
shear localization and fracture. For ductile structural plate materials, the dissipation generated
during necking prior to the onset of shear localization will be found to be the dominant contribution.
It is significant that this contribution will be seen to be mesh-independent in the numerical model
and to scale precisely with the plate thickness. The smaller dissipation contribution associated with
shear localization and shear fracture scales with the element size, and this mesh sensitivity will be
addressed.
The paper is structured as follows. The material model and the plane strain finite element
model are outlined in Section 2. Results are presented in Section 3, including a comparison of the
onset of shear localization from the finite element analysis and that from an analytical shear band
analysis. Conclusions are given in Section 4 along with discussion of information that will be
required to implement cohesive zone modeling in addition to the present results.
2. Material and finite element models

5
Finite strain, plane strain finite element simulations have been reported in the literature for
many years. The present work builds upon simulations of necking, shear band localization and
fracture of ductile metals under tensile loading, as addressed, for example, in [8-13], with specific
application to the characterization of cohesive zones for plates and shells as described in the
Introduction. Where clarity of the paper is not sacrificed, previously published details of the
constitutive model and the finite strain elastic-plastic formulation will be omitted and cited.
2.1. Material model
The central features of the model presented by Gurson [6] and extended in [7] to account for
damage growth in shear are as follows. The model is an isotropic formulation that employs the three
invariants of the Cartesian components of the Cauchy (true) stress, ij : the mean stress,
/ 3m kk , the effective stress, 23 3 / 2e ij ijJ s s , where 13ij ij kk ijs is the stress
deviator, and a third invariant defined below in Eq. (4). The yield surface is specified by
2
221 1
3, , 2 cosh 1 ( )
2e m
e mM M
qF f q f q f
(1)
where the current state is characterized by f , the damage parameter which can be interpreted as an
effective void volume fraction, and M is the current effective true stress governing flow of the
damage-free base material which is specified below. The fitting parameters, q1 and q2, were
introduced in [8,14]. All quantities not labeled with the subscript M represent overall quantities
associated with the damaged material. Normality implies that the plastic strain rate, PijD , is given by
1P
ij ij kl klD P Ph
(2)
where
1 2 22
3 3sinh
2ij m
ij ijij M M M
sF fq q qP
(3)
In finite strain formulations, ij is identified with the Cartesian components of the Jaumann rate of
stress. The expression for the hardening modulus, h , is given in the references cited above.
The original Gurson model predicts no damage growth and monotonic hardening in pure shear.
The extension outlined below was proposed in [7] to account for damage growth and softening in
shear. In addition to m and e , the extended model employs the third stress invariant

6
3
1det( ) ( )( )( )
3 ij ik jk I m II m III mJ s s s s (4)
where the expression on the right is couched in terms of principal stresses, assumed to be ordered as
I II III . The non-dimensional invariant,
2
33
27( ) 1
2 e
J
σ , (5)
lies in the range, 0 1 , with 0 for all axi-symmetric stress states,
orI II III I II III , (6)
and 1 for all states comprised of a pure shear stress plus a hydrostatic contribution,
, , ( 0)I m II m III m (7)
The original Gurson model was formulated and calibrated based on the mechanics of void
growth under axi-symmetric stress states. The extension does not alter the model for these states,
nor does it alter the yield condition (1). The extension modifies the predicted growth of the damage
parameter, f , for states with non-zero ( ) σ . In particular, a contribution to damage growth under
pure shear stress states is accounted for in the extension whereas the original Gurson model predicts
no change in damage for states having 0m . The extension of the Gurson model posits
1p
ij ijpkk
e
s Df f D k f
σ (8)
The first contribution is that incorporated in the original model while the second is the crux of the
extension. In a state of pure shear, (8) gives / 3Pf k f , where P is the plastic shear strain
rate and k is the shear damage coefficient, the sole new parameter in the extended model. In the
extension, f is no longer directly tied to the plastic volume change. Instead, it must be regarded
either as an effective void volume fraction or simply as a damage parameter, as it has been, for
example, when the Gurson model is applied to materials with distinctly non-spherical voids.
Further discussion and illustrations of the extension are given in [7, 14, 15]. Included is the
specification of the widely used technique that accelerates damage from cf f to ff f , at which
point the material element is eliminated [12]. The equations above fully specify the constitutive
model of the material; the remaining equations specifying for example the incremental moduli are
listed in [7] using the same notation as in this paper.1 The primary damage parameters are the initial
1 The sign of the second term on the right hand side of Eq. (13) in [7] should be minus not plus.

7
void volume fraction, 0f , and the shear damage coefficient, k ; these will be varied in the
simulations presented in the sections on results.
The uniaxial true-stress versus logarithmic strain curve for the undamaged material is taken as
1/
,
,
MM y
N
y MM y
y
E
E
(9)
with y as the initial yield stress. The material parameters used in the simulations are given in
Table I.
2.2. Finite strain formulation
A Lagrangian framework is used for the finite strain formulation with the undeformed body as
reference and coordinates in the deformed state denoted by ix , as detailed, for example, by [17,18].
Using a convected coordinate formulation of the governing equations, the components of vectors
and tensors are obtained by dot products with the appropriate base vectors. The constitutive relation
provides the incremental relation between the contravariant components of the Kirchhoff stress rate,
ij , and the covariant components of the Lagrangian strain rate, ij , as
ij ijklklL (10)
with plastic loading and elastic unloading branches for the incremental moduli, ijklL . The principle
of virtual work for the incremental problem is
V S S
ii
ijij
ii
ikkj
ijij
ij VuTSuTVuu ddd,, (11)
Here, iu and iu are the contravariant and covariant components of the displacement vector, iT is
the surface traction vector per original area and the comma denotes covariant differentiation. The
term in the square brackets in (11) is included as a means to eliminate residual equilibrium errors in
the finite element formulation.
2.3. Problem formulation
After the onset of necking ahead of an advancing crack tip, the material above and below the
neck will unload elastically enforcing plane strain conditions, i.e. enforcing essentially zero
additional straining in the direction parallel to the crack ( 33 0 ). Thus, the sequence of

8
deformation states depicted in Fig. 1 can be well approximated by considering the 2D plane strain
problem set up in Fig. 3. Two sets of boundary conditions are considered in this study as shown in
Fig. 3: (i) an unconstrained condition in Fig. 3a with zero horizontal tractions on the top
( 2/02 Lx ) and bottom ( 2/02 Lx ) edges, where only the middle node at 1 2 0x x is
constraint to prevent free body motion, and (ii) a constrained condition in Fig. 3b for which
horizontal displacements of above and below the failure process zone are constrained. These
conditions are modeled by imposing zero horizontal displacement along the centerline of the upper
and lower part of the section. This is intended to model the maximum possible constraint on out-of-
plane deflection imposed by the larger structure. For both sets of boundary conditions, the section is
loaded by applying uniform increments of the vertical displacement, 2/ , along the top and,
2/ , along bottom edges, while the resultant vertical force per unit depth, F , which is work
conjugate to is computed.
The geometry and loadings depicted in Fig. 3 are symmetric with respect to both the 1x -axis
and the 2x -axis. If the material properties strictly shared these same symmetries, localization would
first occur as a symmetric Considère neck. As the neck develops, a second localization into two
equally active symmetric shear bands occurs inside the neck region [10]. The symmetric situation
almost immediately gives way to asymmetric localization into one of the two bands promoted by
exceedingly small perturbations or imperfections. In the present study, to promote failure in a single
shear band, a very small asymmetric imperfection in the yield stress distribution has been
introduced within a narrow band of width b oriented at 45o to the centerline. With reference to
Fig. 3, the distribution in the band is chosen as
b
xxxx y
by 2
cos12
11),( 12
21 for bxxbx 221 (12)
Here, y is the initial yield stress of the material everywhere outside the band, 001.0 is the
amplitude of the imperfection, and 10/0Wb is the width of the imperfection. In the band, by is
substituted for y in (9). The imperfection is solely introduced to promote the localization into a
single shear band. Its amplitude is sufficiently small such that it does not otherwise effect the
inclination of the shear band or the computed traction-separation behavior.
The notation and a representative mesh are shown in Fig. 3 for the full section. The height and
width of the un-deformed section are 0L and 0W , respectively, with 0 0/ 3L W for all results
presented in this study. A uniform mesh of square elements of size ( ) ( )e eL L is used within the

9
region that undergoes necking, shear localization and slant fracture. The effect of element size will
be investigated and the element size will be reported as a fraction of the sheet thickness, 0W .
Isoparametric 8 node plane elements are employed, using reduced Gaussian quadrature ( 22
Gauss points) for the integration.
The boundary value problem posed above, including the initial distribution of yield stress, and
its solution possess 180o rotational symmetry about the 3x -axis such that only the region above
the 1x -axis needs to be meshed. Consistent with the rotational symmetry, the boundary conditions
along 2 0x for the upper part of the finite element mesh in Fig. 3c are: )0,()0,( 1111 xuxu and
)0,()0,( 1212 xuxu . These boundary conditions are applicable to strictly symmetric and anti-
symmetric deformations, as well as the present mixed problem.2 These conditions are imposed in
the finite element code using a standard penalty approach [20].
3. Results: Necking, shear localization and failure
3.1. Identification of traction-separation relation for cohesive zone
To set the stage for the presentation of results characterizing the cohesive zone, a representative
computed result in the form of the dimensionless load/depth, 0/ ( )yF W , as a function of the
normalized overall elongation, 0/ L , is given in Fig. 4a. As is well known, necking begins at the
maximum load. In plane strain tension the onset of necking occurs at the Considère condition,
which for the present material is when the logarithmic strain attains, LOG N . Since 0.1N in
this example, LOG , and the overall engineering strain, 0/ L , differ only slightly prior to necking,
and thus the onset of necking is at 0/ 0.1C L . Beyond the Considère point, continuing
deformation is localized to the neck which initially extends roughly one width, 0W , above and
below the horizontal centerline of the section. As the neck develops under increasing 0/ L , the
load falls gradually until the onset of shear localization noted in Fig. 4a, whereupon the load begins
to fall abruptly with relatively little further overall elongation. In this last stage, continuing
deformation is now localized to the shear band with almost no additional deformation in the neck
outside the band. The problem studied in this paper is thus characterized by two fundamental
localization phenomena, necking and shear banding, the latter contained within the former. As
2 Analogous boundary conditions were exploited by Tvergaard [19] in his study of necking and shear localization in three dimensional bars pulled in tension.

10
shearing progresses in the band, damage increases until shear failure occurs with complete
separation.
The following issue is now addressed: What part of the load-elongation behavior in Fig. 4a is
relevant to the characterization of the cohesive zone? The cohesive zone in a large scale finite
element model should represent that part of the behavior that the elements cannot capture. Plate or
shell elements ahead of a long crack can capture behavior up to the onset of necking and they can
correctly represent elastic unloading once necking begins. But, they cannot capture the sequence of
deformations in the neck beyond the onset of the necking localization. It is this part of the load-
elongation behavior in Fig. 4a which must be employed to characterize the cohesive zone. The
traction-separation curve for the cohesive zone extracted from Fig. 4a is plotted in Fig. 4b as
0/ ( )yF W (normalized traction per original area) as a function of the additional normalized
separation, 0/W , with C . The nominal Considère stress is 0/C MAXF W . Note that the
relation between 0/ ( )yF W and 0/W will be independent of the height, 0L , of the section if one
ignores the elastic unloading contraction of the sections above and below the neck after the onset of
necking. The elastic unloading contraction can be subtracted off but it is so small that its influence
is negligible.
This example, which is typical for tough ductile alloys, already makes it clear that the cohesive
work of separation, 0d I IIT (with T as the nominal traction) is primarily due to the
energy dissipated between the onset of necking and the onset of shear localization, I . The
dissipation occurring subsequent to the onset of shear localization, II , is relatively small. These
findings will be elaborated on below.
3.2. The onset of shear localization
Rice [21] established the analytical condition for the onset of shear localization as a bifurcation
condition depending on the local state of deformation and stress. The curves in Figs. 5a,c are
predictions for effective plastic strain at the onset of shear band bifurcation from the state of plane
strain tension as a function of 0f , k and N . The details of the calculations underlying these results
have been given in [7] and will not be repeated here. The band orientation is within one or two
degrees from 45o to the tensile axis. These results are compared to the finite element model in
Figs. 5b,d by mapping the circular data points in Figs. 5a,c from the shear band bifurcation analysis
onto the predicted effective plastic strain evolution in an element at the center of the neck where

11
shear localization begins. As seen in Figs. 5b,d, the element undergoes an abrupt increase in plastic
strain at the onset of shear localization. The agreement between the analytical bifurcation condition
for a shear band and the onset of the localization band in the finite element calculation is
remarkably good even though the state of deformation at the center of the neck in the finite element
model prior to shear localization is not precisely plane strain tension. Some additional stress
triaxiality develops during necking in the finite element model which accelerates the onset of shear
localization. For the cases in Figs. 5c,d, the additional triaxiality accounts for the small discrepancy
between the bifurcation prediction and the finite element results.
After the shear band forms in the center of the neck it spreads towards edges in a direction at
roughly 45o to the centerline. Once the band reaches the edges, plastic straining becomes almost
entirely localized to the band such that the overall elongation is abruptly curtailed (c.f. Fig. 4). In
the present finite element model, the thickness of the band is set by the size of the elements within
the neck. The band is essentially one element thick, as elements on either side of the band undergo
elastic unloading. The element size-dependence of the traction-separation behavior will be explored
in Section 3.4.
3.3. Two boundary conditions and initial imperfections
The two limiting boundary constraints introduced in Section 2.3 and depicted in Fig. 3 have
been considered to provide insight into conditions that will be encountered in applying a cohesive
zone model for the fracture analysis of large plate structures. The constrained case represents the
limit where the sections of the plate and the supporting structure above and below the cohesive zone
do not permit any overall out-of-plane displacement across the zone, while the unconstrained case is
the limit where there is no resistance to an overall out-of-plane displacement across the zone. In the
present model, these limiting conditions will depend on 0L , but there is very little difference in the
overall traction-displacement behavior for the two limits when 0 0/ 3L W , as seen in Fig. 6. Prior
to the onset of shear localization, the responses for the two cases are indistinguishable. Following
shear localization, more energy is dissipated in the constrained case, but the difference is very
small. This outcome is fortunate for applications of cohesive models to ductile plates because it
implies that the zone characteristics can be specified without regard for the out-of-plane constraint.
All the results which follow have been computed with the unconstrained boundary conditions.
3.4. Traction-separation and cohesive energy

12
The maximum nominal traction, 0/MAX MAXT F W , can be identified as the Considère load per
original area at the onset of necking, where the cohesive separation process begins, 0 . As can
be seen in Figs. 4 and 6, the traction falls gradually until the onset of shear localization where it
begins a precipitous fall. In most applications of cohesive traction-separation laws, the two most
important features are the maximum traction and the work/original area of the tractions,
d0 TIII . But, as discussed in [22], the exact details of T versus will generally not
be essential as long MAXT and 0 are accurately reproduced and the functional form is faithful to
the general features seen in Figs. 4 and 6. In the remainder of this paper, the results presented will
highlight the dimensionless cohesive dissipation energy, 0 0/ ( )yW , while MAXT can be computed
by elementary methods. For the power-law hardening material in (9) with no damage, the Considère
condition for plane strain tension gives
N
N
yy
MAX eNET
3
2
3
2 (13)
if elastic compressibility is ignored. Damage reduces the maximum traction but only slightly as will
be seen in the results presented below.
The role of the finite element mesh on the results of interest are brought out by Fig. 7a where
the traction-separation behavior is presented for one specific material case ( 1.0N , 01.00 f and
0k ) and for four meshes with square elements of dimensions, ( ) ( )e eL L , using the
normalization, ( )0/eL W . Prior to shear localization, there is essentially no mesh dependence because
all four meshes are fine enough to accurately predict the necking response. Similarly, assuming the
stresses and strains in the neck to be adequately resolved, the onset of shear localization at the
center of the neck is not very sensitive to meshing, because the onset condition depends on local
stresses and strains and not on their gradients. However, the subsequent growth of the shear
localization and shear failure is directly tied to element size, as discussed earlier. No length scale
has been introduced in the material model that would limit strain gradients. The shear band has
essentially one element across its width and thus has an approximate thickness, ( )eL . Figs. 7b-e
clearly indicates that the final stage of the traction-separation process depends strongly on the
element size—the larger the element, the thicker the localization band and the more energy is
dissipated. The mesh in Fig. 7b with the largest elements is too crude to even qualitatively capture
the formation of a realistic shear band.

13
A systematic study of the dependence of the cohesive work of separation on ( )0/eL W is
presented in Fig. 8. The limit as ( )0/ 0eL W in Fig. 8 is obtained by extrapolation of the computed
points as indicated. This limit is the prediction for )/( 0WyI obtained as the area under the
traction-separation curve computed between the onset of necking and the onset of shear localization
at the center of the neck. Included in Fig. 8 as square points on the ordinate are the predictions from
an estimate of I computed in uniform plane strain tension for the energy absorbed between the
Considère load and the onset of shear localization from the shear band analysis. Mainly due to the
triaxiality increase above plane strain tension, the extrapolated results for I from the finite element
calculations fall below the estimates, but the difference is quite small. As noted earlier, I is
insensitive to the finite element mesh as long as it resolves the neck. The cohesive energy can be
partitioned precisely into the contribution, I , between the onset of necking (the intercept on the
ordinate) and the onset of shear localization, and the mesh-dependent contribution, II , from the
final stage following the onset of shear localization. From Fig. 8 it can be seen that
( )0 0/ ( ) /e
II y W L W where lies between 1 and 2. This implies ( )eII y L , consistent with
the expectation that the energy/area dissipated in the final stage is on the order of y a strain of
order unity the thickness of the shear band. It is also evident that the dominant contribution to
the cohesive energy is from the onset of necking to the onset of shear localization. Moreover, this
dominant contribution scales precisely with the thickness of the plate.
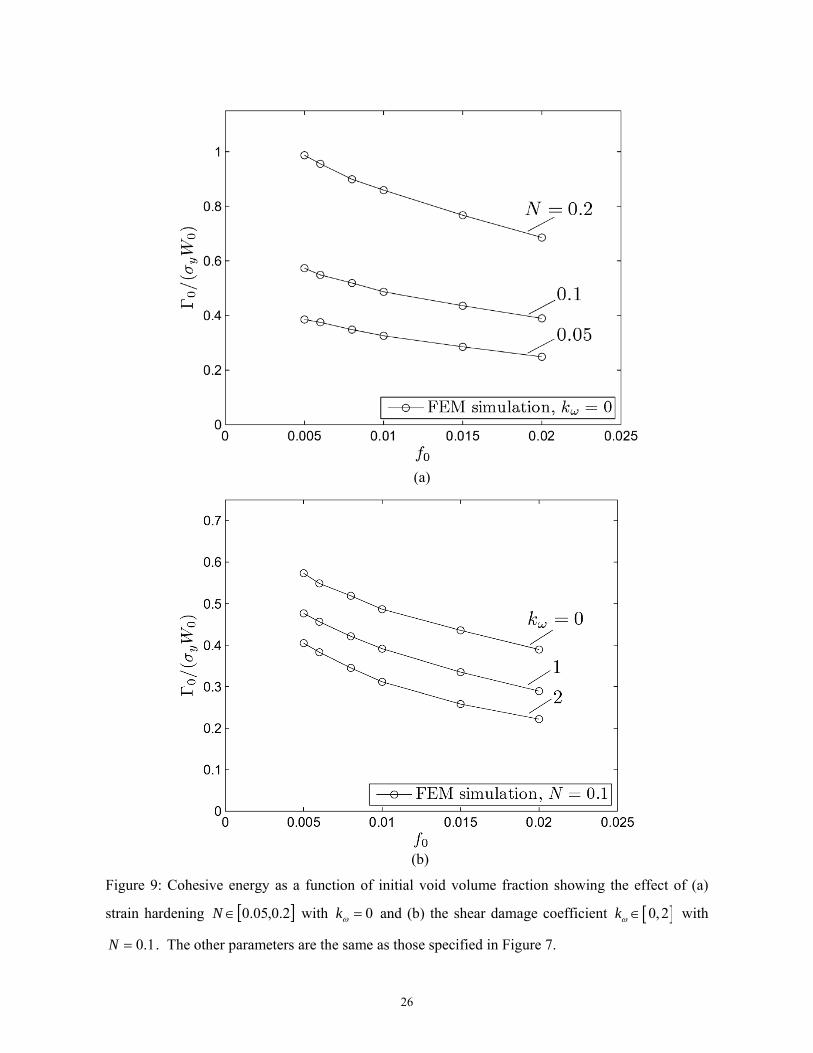
The three most important material parameters influencing the cohesive energy are N , 0f and
k . Trends showing the dependence on N and k are presented in Fig. 9 for a mesh with
96/0)( WL e . For materials with the tensile stress-strain behavior (9), the only other dimensionless
parameters affecting the traction-separation behavior are /y E , Cf and ff . The influence of
/y E is displayed in Figs. 10a,b. The dependence is directly related to the dependence of the
maximum load on /y E as reflected by (13). This dependence can be captured quite accurately if
one uses the nominal stress (13) at the Considère condition, C MAXT , in place of y in the
normalization of the traction, i.e. 0/ ( )CF A . This assertion is demonstrated in Fig. 10c where the
curves for 00 / AC , with the strain hardening 2.0,05.0N , show little dependence on /y E .
This could also be seen from the traction-separation curves as they nearly collapse to a single curve
when this alternative normalization was used, for a given strain hardening, N . A few additional

14
calculations in which the coalescence parameters Cf and ff are varied over the ranges,
0.1 0.2Cf and 0.35 0.45ff , have been carried out to assess their influence. The maximum
variation of II is approximately 20%. Because II is such a small fraction of the total work of
separation, 0 , one concludes that the primary results of interest in this study depend very weakly
on the coalescence parameters.
4. Conclusions and extensions
The energy/area, 0 , associated with a cohesive zone model of ductile plates subject to mode I
tearing has been identified as the energy dissipated during necking, shear localization and slant
fracture following the onset of necking in the zone ahead of the crack tip. The present work
provides a detailed treatment of this sequence of plane stress crack growth which fits into the
framework of plane stress growth considered more broadly in [3]. For the sequence considered
here, it is shown that the energy/area can be partitioned as 0 I II with I as the energy/area
dissipated between the onset of necking and the onset of shear localization and II as that
dissipated in shear localization and shear fracture. The first contribution, I , dominates the total
energy dissipated during crack advance and it scales exactly with the plate thickness, 0W , according
to 0WyI . For a 1-centimeter thick plate made of a ductile metal with yield stress
300y MPa, 21I MJm . By contrast, the second contribution scales as II y where is
the thickness of the shear localization band, which scales with the element size in the presented FE
analysis; for 300y MPa and μm30 , 20.01II MJm . This numerical example highlights
the fact that, because plasticity constitutes the major portion of the dissipation for both
contributions, each of them are huge compared to the atomistic work of separation, which is
typically only several 2Jm . Furthermore, this example clearly demonstrates that III .

15
The cohesive zone characterized in this paper is associated with a mode I crack that has
propagated several plate thicknesses such that the zone ahead of the crack tip is fully developed and
is advancing under nominally steady-state tearing conditions. If the crack is initially sharp when it
begins to first propagate, the relevant initial toughness will be closer to the plane strain toughness
than to the “plane stress” toughness that is the focus here. The work of separation for a tough
ductile alloy under plane strain conditions scales according to 0 Y D where D is the spacing of
the voids that dominate the fracture process. For plates thick enough such that the plane strain
toughness (or some approximation to this toughness) governs the intitiation of crack growth, the
initial fracture energy is likely to be much smaller than the plane stress fracture energy. This almost
certainly implies that a cohesive zone representation expected to capture behavior initiating from an
initial sharp crack will require a transition from an initial propagation phase with lower separation
energy to the steady-state level with higher separation energy. It also remains for further work to
determine cohesive zone parameters capable of charactering crack initiation from a stress
concentration such as a notch. Further, it remains for future work to extend the characterization of a
cohesive zone model for ductile plates for mixed mode in-plane tearing under conditions where the
crack path will be curved. For ductile plates, the cohesive zone is likely to follow the path created
by the incipient neck as it propagates ahead of the advancing crack tip. Results for the onset of sheet
necking under conditions other than plane strain tension will be needed; these are available in the
form of sheet metal forming limits. Finally, to be generally applicable in a large finite element code
for structural analysis of plates and shells, the cohesive zone representation will have to incorporate
the effects of bending moments and, possibly transverse forces, on the generalized traction-
separation behavior.
Acknowledgements
KLN is financially supported by the Danish Technical Research Council in a project entitled
“Plasticity across scales”. JWH is supported by an ONR MURI grant to Harvard University.

16
References
[1] Roychowdhury, S., Roy, Y.D., Dodds, R.H., Ductile tearing in thin aluminum panels:
experiments and analyses using large-displacement, 3-D surface cohesive elements, Eng.
Fract. Mech., 2002;69:983-1002.
[2] Chabanet, O., Steglich, D., Besson, J., Heitmann, V. Hellmann, D., Brocks, W., Predicting
crack growth resistance of aluminum sheets, Comp. Mater. Sci. 2003;26:1-12.
[3] Pardoen, T., Hachez. F., Marchioni, B., Blyth, P.H., Atkins, A.G., Mode I fracture of
sheet metal, J. Mech. Phys. Solids 2004;53:423-452.
[4] Scheider, I., Brocks, W., Cohesive elements for thin-walled structures, Comp. Mater. Sci.
2006;37:101-109.
[5] Simonsen, B.C, Törnqvist, R., Experimental and numerical modeling of ductile crack
propagation in large scale shell structures, Marine Structures, 2004;17:1-27.
[6] Gurson, A., Continuum theory of ductile rupture by void nucleation and growth – I. Yield
criteria and flow rules for porous ductile media. J. Eng. Mater. Technol. 1977;9:2-15.
[7] Nahshon, K., Hutchinson, J.W., Modification of the Gurson model for shear failure, Euro. J.
Mech. A/Solids, 2008;27:1-17.
[8] Tvergaard, V., Influence of voids on shear band instabilities under plane strain conditions,
Int. J. Frac. 1981;17:389-407.
[9] Becker, R., Needleman, A., Effect of yield surface curvature on necking and failure in
porous plastic solids, J. Applied Mech., 1986;53:491-499.
[10] Mathur, K.K., Needleman, A., Tvergaard, V., Three dimensional analysis of dynamic
ductile crack growth in a thin plate, J. Mech. Phys. Solids, 1996;44:439-464.
[11] Besson, J., Steglich, D., Brocks, W., Modelling of crack growth in round bars and plane
strain specimens, Int. J. Solids Struct. 2001;38:8259-8284.
[12] Besson, J., Steglich, D., Brocks, W., Modelling of plane strain ductile rupture, Int. J.
Plasticity 2003;19:1517-1541.
[13] Xue, L., Wierzbicki, T., Numerical Simulation of fracture mode transition in ductile plates,
Int. J. Solids Struct. 2009;46:14231435.

17
[14] Tvergaard, V., On localization in ductile materials containing spherical voids, Int. J. Frac.
1982;18:287-252.
[15] Xue, Z., Pontin, M.G., Zok, F.W., Hutchinson, J.W., Calibration procedures for a
computational model of ductile fracture, Eng. Frac. Mech., 2010;77:492-509.
[16] Tvergaard, V. and Nielsen, K.L., Relations between a micro-mechanical model and a
damage model for ductile failure in shear, J. Mech. Phys. Solids, 2010,
doi:10.1016/j.jmps.2010.06.006.
[17] Budiansky, B., Remarks on Theories of solid and structural mechanics. Harvard University,
SIAM, p. 77-83.
[18] Hutchinson, J., Finite strain analysis of elastic-plastic solids and structures. Harvard
University, AMD, 1973;6:17-29.
[19] Tvergaard, V., Necking in tensile bars with rectangular cross-section, Comp. Methods in
Appl. Mech. Eng. 1993;103:273-290.
[20] Zienkiewicz, O.C. and Taylor, R.L., The Finite Element Method – The Basis, Vol. 1, 5.
Edition, Butterworth-Heinemann, 2000.
[21] Rice, J.R., 1977. The localization of plastic deformation. In: Koiter, W.T. (Ed.), Theoretical
and Applied Mechanics, vol. 1. North-Holland Publishing, Delft, pp. 207–220.
[22] Tvergaard, V., Hutchinson, J.W., The relation between crack growth resistance and fracture
process parameters in elastic-plastic solids, J. Mech. Phys. Solids, 1992;40:1377-1397.
18
Figures
Figure 1: Sequential fracture process governing crack advance in ductile sheet metal subject to
mode I loading, (a) onset of local necking, (b) local thinning, (c) shear localization and (d) slant
failure.
Figure 2: A 10mm thick plate of A5083 aluminum tested by Simosen and Törnqvist [5]. The crack
was initiated at the edge notch located on the left edge of the plate. Flipping of the slant fracture
from one 45 degree orientation to the other is evident.

19
Figure 3: Schematic illustrating boundary conditions, notation and mesh, (a) unconstrained
condition, (b) constrained condition, and (c) representative mesh (element size 64/0)( WL e ).

20
(a)
(b)
Figure 4: (a) Normalized overall load-deflection curve for the metal sheet section considered, and
(b) traction-separation curve for the cohesive zone extracted from Fig. (a), with indicated fracture
energy associated with necking, I , and shear localization and fracture, II , respectively.

21
(a)
(b)

22
(c)
(d)
Figure 5: Effective plastic strain at shear localization based on (a, c) bifurcation analysis in plane
strain tension, and comparison with the local effective plastic strain predicted using the FE-model at
1 2, 0,0x x , for (b) 0k for ]2.0,05.0[N and ]02.0,005.0[0 f and (d) 2,0k for
1.0N and 02.0,005.00 f . ( / 0.003y E )

23
(a)
(b)
Figure 6: Effect of the out-of-plane deflection constraint across the fracture zone: (a) normalized
overall load-deflection curves for constrained and unconstrained sections and (b) associated
cohesive energy, 0 I II , for ]02.0,005.0[0 f , 1.0N , 0k and / 0.003y E .

24
(a)
(b) (c) (d) (e)
Figure 7: Mesh dependence: (a) element size effect on traction-separation curve, and associated
failure modes for element of size (b) 32/0)( WL e , (c) 48/0
)( WL e , (d) 64/0)( WL e , and (e)
96/0)( WL e ( 630y MPa, 1.0N , 0k , 01.00 f )

25
(a)
(b)
Figure 8: Cohesive energy dependency on element size during sheet necking, shear localization and
fracture, showing the effect of (a) Initial porosity 02.0,005.00 f with 1.0N , and (b) Strain
hardening 2.0,05.0N with 01.00 f . The other parameters are the same as those specified in
Figure 7.
26
(a)
(b)
Figure 9: Cohesive energy as a function of initial void volume fraction showing the effect of (a)
strain hardening 2.0,05.0N with 0k and (b) the shear damage coefficient 0,2k with
1.0N . The other parameters are the same as those specified in Figure 7.

27
(a)
(b)

28
(c)
Figure 10: (a) Normalized overall load-deflection curves for metal sheet section showing the effect
of /y E . (b) Cohesive energy normalized using the yield stress, and (c) Cohesive energy
normalized using the nominal Considère stress, C ( ]2.0,05.0[N , 0k , 01.00 f ).

29
Tables
Parameters Notation Value Youngs modulus E 210 GPa
Poisson ratio 0.3
Yield stress y 630 (210-1050) MPa
Strain hardening N 0.05-0.2
Initial porosity 0f 0.005-0.02
Yield surface constants 1q , 2q 1.5, 1
Critical void volume fraction cf 0.15
Final void volume fraction ff 0.40
Shear coefficient k 0-2
Table 1: Material properties and damage parameters.