Cognition and Hypertension in Midlife: Evidence for Gene-Environment Interplay Terrie Vasilopoulos...
48
Cognition and Hypertension in Midlife: Evidence for Gene-Environment Interplay Terrie Vasilopoulos University of Chicago Demography Workshop 01/10/13
-
Upload
melvyn-crawford -
Category
Documents
-
view
214 -
download
1
Transcript of Cognition and Hypertension in Midlife: Evidence for Gene-Environment Interplay Terrie Vasilopoulos...

Cognition and Hypertension in Midlife: Evidence for Gene-Environment Interplay
Terrie VasilopoulosUniversity of Chicago
Demography Workshop01/10/13

Cognitive performance across the lifespan
Hedden & Gabrieli (2004) Nature Reviews Neuroscience, 5, 87-96

Heritability of cognition across the lifespan
0
0.1
0.2
0.3
0.4
0.5
0.6
0.7
Childhood Adolescence Young Adulthood Middle Age Old-Old
% v
ari
an
ce e
xp
lain
ed
A C E
Haworth et al. (2010); Grant et al. (2010); McClearn et al. (1998)

Behavioral Genetics• Understand individual differences in traits• Decompose phenotypic variation into 3
components:• A additive genetic
– Genetic influences shared between relatives
• C shared environment– Non-genetic factors that make relatives similar
• E non-shared environment– Non-genetic factors that make relatives
dissimilar

Behavioral Genetics• Twins studies one of the most common
behavioral genetic designs• Monozygotic twins (MZ) Identical• Dizygotic twins (DZ) Fraternal• A additive genetic
– MZ = 100%, DZ = ~50%
• C shared environment– MZ & DZ = 100%
• E non-shared environment– MZ & DZ = 0%
• Other sibling/family structures can be used following similar assumptions

Twin Method
P = A + C + EVar(P) = a2+c2+e2
A C E EA C
P Twin 1
P Twin 2
1.0 MZ/0.5 DZ 1.0 MZ/1.0 DZ
a c e a c e
A
** Heritability (h2) = A/P **

Extensions of Twin Method
• Multivariate Relationships• Longitudinal Change• Sex Differences• Gene-Environment
Interactions/Interplay (GxE)–How do genetic influences
(heritability) differ across various environments?

Theories of Gene-Environment Interplay
• Bioecological model predicts that adverse environments suppress “genetic potential” (Brofenbrenner and Ceci, 1994)– Other early theories of gene-
environment interplay suggest genetic differences enhanced in “good enough” environments (Scarr, 1992)
• Diathesis-Stress model predicts the opposite, with genetic influences greater in high risk environments (Gottesman, 1991)

Lifestyle Health
Genes
Cognition

GxE Interactions for Cognition:
Child and Adolescent Cognition

• Rowe, Jacobson and van den Oord (1999)– Moderating effects of family
“environment” on heritability of cognitive ability• Vocabulary IQ • Parental education level
– Used data from twins, full-, half-, and unrelated siblings, and cousins from the AddHealth Study
– Found that genetic variance ↑, and shared environmental variance ↓, among adolescents with more highly educated parents
GxE Interactions for Cognition: Child and Adolescence

GxE Interactions for Cognition: Child and Adolescence
Rowe et al. (1999) Child Development

• Turkheimer et al. (2003)– Full-Scale IQ, Verbal IQ and Performance IQ– 7 year olds– Parental education, income and occupation
• Harden et al. (2006)– National Merit Scholar Qualification Test– 17 year olds– Parental education and Income
• Friend et al. (2008)– Reading Disability– 8-20 years– Parental Education
GxE Interactions for Cognition: Child and Adolescence

GxE Interactions for Cognition:
Childhood SES Adult Cognition

GxE Interactions for Cognition: Childhood SES Adult Cognition
• Kremen et al. (2005)–Middle-Aged Male twins (51-60
yrs) from Vietnam-Era Twin Study of Aging (VETSA)
–Verbal Ability –Parental Education– ↓ shared environmental variance
with ↑ parental education–Stable genetic variance –no direct genetic moderation

Kremen et al. (2005) Behavior Genetics
GxE Interactions for Cognition: Childhood SES Adult Cognition

• van der Sluis et al. (2008)– FSIQ– Shared environmental variance of IQ
moderated by parental education– Stable genetic variance – no genetic moderation – Men mean age 49 yrs (36-69 yrs)
• Grant et al. (2010) - VETSA– general cognitive ability– ↑ total variance due to parental
education – no genetic moderation
GxE Interactions for Cognition: Childhood SES Adult Cognition
GxE Interactions for Cognition:
Adult SES Adult Cognition

• van der Sluis et al. (2008)– FSIQ
– ↑ non-shared environmental variance with higher mean real estate prices of participants’ residential area
– Stable genetic variance– no genetic moderation
• Vasilopoulos et al. (unpublished)– General Cognitive Ability - VETSA– Non-shared environmental variance
moderated by individuals lifetime education– Stable genetic variance – no genetic moderation
GxE Interactions for Cognition: Adult SES Adult Cognition

Developmental Differences in GxE?
• Prior research suggests that the moderating effects of childhood family environments (e.g., family socioeconomic status) may not have lasting effects on genetic variance in adult cognition
• Lack of evidence for genetic moderation by adult SES
• Are there other adult environmental or behavioral factors that enhance or suppress genetic variance in cognition?

Physical Health and Cognition
• Many physical factors associated with cognitive function– Pulmonary function– Grip strength– Physical fitness– Bioage
• Physiological factors gene expression in brain– Caloric restriction– Exercise– Diet
Chyou et al. (1996); Alfaro-Acha et al. (2006); Anstey and Smith (1999); Macdonald et al. (2004); Salthouse et al. (1998); Johnson et al. (2009); Emery et al. (1998); Cotman & Berchtold (2002); Kitajka et al. (2002); Weindruch et al. (2002)

Hypertension and Cognition
0
0.05
0.1
0.15
0.2
0.25
0.3
0.35
0.4
0.45
GeneralIntelligence
Memory ProcessingSpeed
CognitiveFlexibility
Language
Median Effect Size
Stampfer (2006); Birns & Kalra (2008); Singh-Manoux & Marmot (2005); Knecht et al. (2009); van den Berg et al. (2009)
• Hypertension linked to poorer cognitive function

Antihypertensive medication
• Many studies adjust for antihypertensive medication use
• Evidence for direct influence on cognition– 36% reduced odds of cognitive
impairment– 8% reduction in dementia risk
Murray et al. (2002); Haag et al. (2009)

Study Objectives
• Examine the extent that hypertension modifies the influence of genetic and environmental factors on cognition at midlife
• Assess how antihypertensive medication use alters the effect of hypertension on cognition

Methods
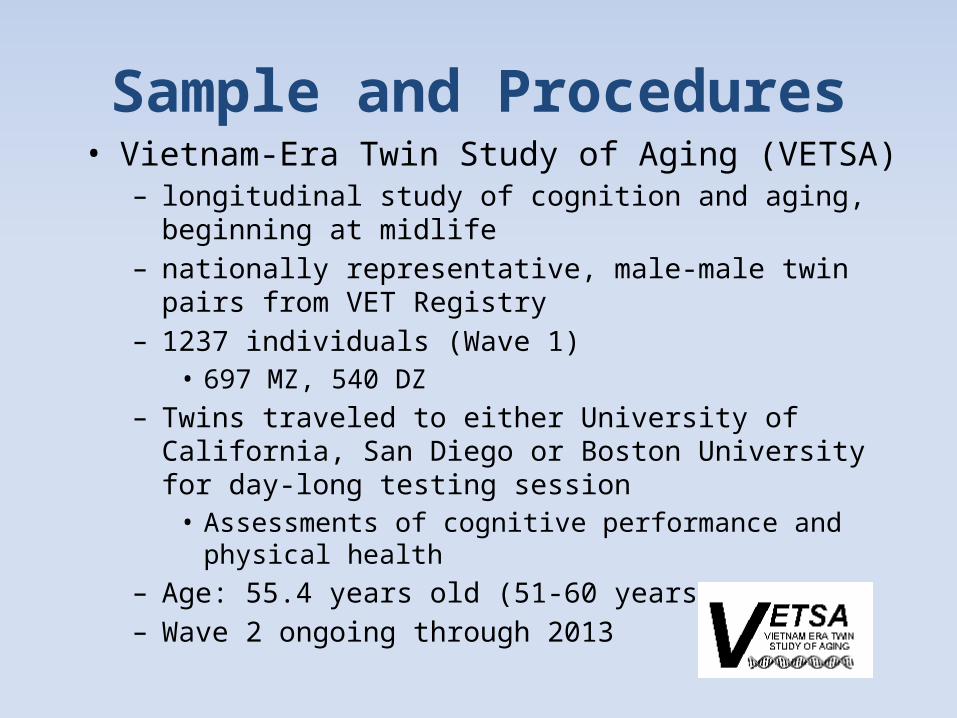
Sample and Procedures• Vietnam-Era Twin Study of Aging (VETSA)
– longitudinal study of cognition and aging, beginning at midlife
– nationally representative, male-male twin pairs from VET Registry
– 1237 individuals (Wave 1)• 697 MZ, 540 DZ
– Twins traveled to either University of California, San Diego or Boston University for day-long testing session
• Assessments of cognitive performance and physical health
– Age: 55.4 years old (51-60 years)– Wave 2 ongoing through 2013

Measures: Blood Pressure• Mean of 4 measurements taken during day-long
testing session• Three blood pressure groups:• Non-hypertensive: n = 548 (44.4%)
– systolic/diastolic < 140/90 mm hg
• Medicated Hypertensive: n = 422 (34.2%) – diagnosed hypertensive with self-reported use of
antihypertensive medication
• Unmedicated Hypertensive: n = 265 (21.4%)– systolic ≥ 140 mm hg or diastolic ≥ 90 mm hg,
untreated by antihypertensive medication

Measures: Cognition• Standardized composites of separate cognitive
tests were used to construct domains– Visual Spatial Ability (Hidden Figures, Card
Rotation)– Episodic Memory (Logical Memory, Visual
Reproduction)– Abstract Reasoning (Matrix Reasoning)– Processing Speed (Trails 2 & 3, Stroop Word)– Executive Function (Trails 4, Verbal Fluency)– Working Memory (Digit and Spatial Span Backward,
Letter-Number Sequencing)– Short Term Memory (Digit and Spatial Span
Forward)– Verbal Ability (Vocabulary)– Verbal Fluency (Category Fluency)– General Cognitive Ability Armed Forces
Qualification Test (AFQT)

Analysis: Multiple Group approach to test for GxE
• Split the sample into three groups based on blood pressure and antihypertensive medication use– Non-hypertensive (Non)– Medicated Hypertensive (Med)– Unmedicated Hypertensive (Unmed)
• Assigned each twin to a blood pressure group (Non, Med, or Unmed)– Created data groups that included twins
concordant and discordant for BP group status– Use these data groups to estimate genetic and
environmental variance for each BP group

Non-Hypertensives Medicated Hypertensives
Unmedicated Hypertensives
Non-Hypertensives Medicated Hypertensives

Model Fitting• Baseline model ACE allowed to differ
among BP groups• Submodels
– Non = Med– Non = UnMed– Med = UnMed
• Compare model fits using difference -2 Log Likelihood– Follows a chi-square (X2) distribution– Significant X2 indicates ACE cannot be
equated • ACE across BP are significantly different

Results
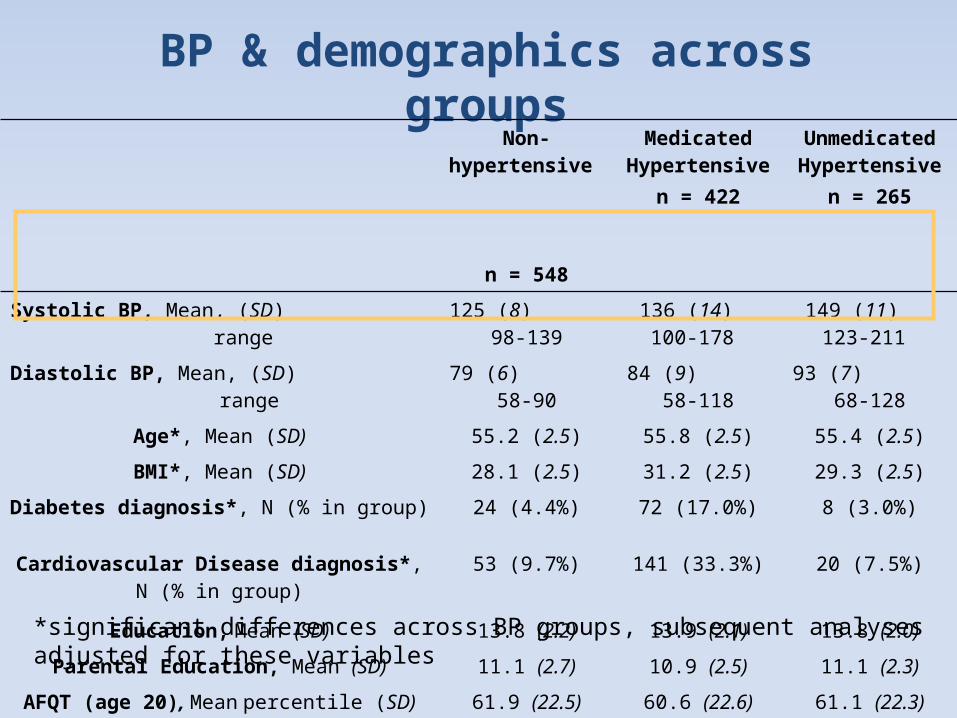
BP & demographics across groups
Non-hypertensive n
= 548
Medicated Hypertensive
n = 422
Unmedicated Hypertensive
n = 265
Systolic BP, Mean, (SD) range 125 (8) 98-139
136 (14) 100-178
149 (11) 123-211
Diastolic BP, Mean, (SD) range
79 (6) 58-90
84 (9) 58-118
93 (7) 68-128
Age*, Mean (SD) 55.2 (2.5) 55.8 (2.5) 55.4 (2.5)
BMI*, Mean (SD) 28.1 (2.5) 31.2 (2.5) 29.3 (2.5)
Diabetes diagnosis*, N (% in group) 24 (4.4%) 72 (17.0%) 8 (3.0%)
Cardiovascular Disease diagnosis*, N (% in group)
53 (9.7%) 141 (33.3%) 20 (7.5%)
Education, Mean (SD) 13.8 (2.2) 13.9 (2.1) 13.8 (2.0)
Parental Education, Mean (SD) 11.1 (2.7) 10.9 (2.5) 11.1 (2.3)
AFQT (age 20), Mean percentile (SD) 61.9 (22.5) 60.6 (22.6) 61.1 (22.3)*significant differences across BP groups, subsequent analyses adjusted for these variables

Mean differences across BP groups
• No mean level differences in cognition due to blood pressure group
Non-hypertensives
Medicated Hypertensives
Unmedicated Hypertensives
Visual Spatial Ability 0.04 (0.99) -0.04 (0.99) 0.02 (1.02)
Episodic Memory 0.02 (1.02) 0.00 (0.99) -0.04 (0.98)
Abstract Reasoning 0.00 (0.99) 0.01 (1.05) -0.01 (0.93)
Processing Speed 0.05 (0.99) -0.04 (1.04) -0.04 (0.99)
Executive Function 0.00 (1.05) -0.01 (0.95) 0.02 (0.97)
Working Memory 0.03 (1.00) -0.03 (1.00) -0.02 (0.98)
Short Term Memory 0.03 (0.99) 0.01 (0.99) -0.08 (1.01)
Verbal Ability 0.02 (1.02) -0.01 (1.02) -0.03 (0.93)
Verbal Fluency 0.07 (1.03) -0.07 (0.98) -0.03 (0.96)
General Cognitive Ability 0.03 (0.98) -0.01 (1.02) -0.03 (0.99)
*all cognitive measures were standardized prior to analysis

Univariate heritability estimates(no moderation)
A C E
Visual Spatial Ability 0.69 0.01 0.30
Episodic Memory 0.49 0.03 0.48
Abstract Reasoning 0.44 0.12 0.44
Processing Speed 0.55 0.00 0.45
Executive Function 0.41 0.00 0.59
Short Term Memory 0.58 0.00 0.42
Working Memory 0.30 0.07 0.63
Verbal Ability 0.44 0.17 0.40
Verbal Fluency 0.52 0.00 0.48
General Cognitive Ability 0.64 0.10 0.26

Non-Hypertensives = Medicated HypertensivesHeritability
Non Medχ2
df=2 p
Verbal Ability 0.65 0.59 1.18 0.56
Visual-Spatial Ability 0.73 0.76 0.23 0.89
Episodic Memory 0.62 0.59 0.50 0.78
Abstract Reasoning 0.62 0.58 2.10 0.35
Processing Speed 0.52 0.66 2.99 0.22
Working Memory 0.41 0.36 0.21 0.90
Executive Function 0.44 0.44 2.85 0.15
Short-Term Memory 0.57 0.60 0.18 0.92
Verbal Fluency 0.51 0.56 1.43 0.49
General Cognitive Ability 0.77 0.74 1.66 0.44
Multiple Group Analysis

Non-Hypertensives = Unmedicated Hypertensives
• Visual Spatial Ability– χ2 = 5.90, df = 2, p = 0.05
• Episodic Memory– χ2 = 9.32, df = 2, p = 0.01
• Support for both GxE and ExE
Multiple Group Analysis

Medicated Hypertensives = Unmedicated Hypertensives
• Visual Spatial Ability– χ2 = 7.45, df = 2, p = 0.02
• Episodic Memory– χ2 = 9.35, df = 2, p = 0.01
• Support for both GxE and ExE
Multiple Group Analysis

Non & Medicated Hypertensives = Unmedicated Hypertensives
Domainχ2
df = 2 p
Visual Spatial Ability 8.62 0.01
Episodic Memory 11.23 0.004
Abstract Reasoning 5.40 0.07
Processing Speed 2.65 0.27
Short-Term Memory 0.44 0.80
Working Memory 0.37 0.83
Verbal Ability 1.96 0.37
Executive Function 1.65 0.43
Verbal Fluency 1.89 0.33
General Cognitive Ability 0.86 0.65
Multiple Group Analysis

Heritability of cognition is lower in Unmedicated Hypertensives vs. Non & Medicated Hypertensives
Visual Spatial Ability
0
0.1
0.2
0.3
0.4
0.5
0.6
0.7
0.8
0.9
1
Non/Med UnMed
Sta
nd
ard
ized
Var
ian
ce
E
stim
ate
Episodic Memory
00.10.20.30.40.50.60.70.80.9
1
Non/Med UnMed
Sta
nd
ard
ize
d V
ari
an
ce
E
sti
ma
te
h2 = 0.75 vs. h2 = 0.55 h2 = 0.61 vs. h2 = 0.25
A A AA
E
EE
E

Summary and Conclusions

Summary of Results• No mean differences due to blood
pressure group• Heritability estimates were lower in
unmedicated hypertensives versus non-hypertensives/medicated hypertensives– Visual Spatial Ability– Episodic Memory
• Heritability estimates could be equated between non-hypertensives and medicated hypertensives

Why are results domain-specific?
• Visual spatial ability and episodic memory are some of the first processes affected by AD and aging
• Hypertension-related cognitive deficits most often reported in memory processes
0
0.05
0.1
0.15
0.2
0.25
0.3
0.35
0.4
0.45
GeneralIntelligence
Memory ProcessingSpeed
CognitiveFlexibility
Language
Median Effect Size

Why might we see differences in genetic effects prior to performance differences?
Blalock et al. (2003)
**Genetic changes may be a measurable precursor to observed cognitive changes**

Medication as a buffer against adverse effects
• Bioecological model and “good enough” environments hypothesis
• Untreated hypertension may be viewed as a poor “internal environment”
• Medication use returns internal environment to a more favorable state

Conclusions• Heritability of cognition is dynamic
• Early life experiences childhood and adolescence cognition– Not present in our sample of middle-aged men
• Physical health adult cognition– Untreated hypertension moderates genetic and
environmental influences of cognition in midlife
• Developmental differences in what types of environments influence genetic factors underlying cognition
• Future GxE studies of cognition need to take a developmentally driven approach

Acknowledgements• University of Chicago
– Kristen C. Jacobson• University of California,
San Diego– William S. Kremen– Carol E. Franz– Matthew S. Panizzon– Kathleen Kim
• Washington University School of Medicine– Phyllis K. Stein
• Saint Louis University– Hong Xian
• Boston University– Michael J. Lyons– Michael D. Grant– Rosemary Toomey
• Virginia Commonwealth University– Lindon J. Eaves
• Funding– NIH/NIA (F32
AG039954. R01 AG018386, R01 AG018384, R01 AG022381, and R01 AG022982)
Vasilopoulos et al. (2012). Untreated Hypertension Decreases Heritability of Cognition in Late Middle Age. Behavior Genetics. DOI: 10.1007/s10519-011-9479-9

Thank you!