Coexistence and Interference of WLAN (IEEE 802.11b) and ...
20
Coexistence and Interference of Coexistence and Interference of WLAN (IEEE 802.11b) WLAN (IEEE 802.11b) and and Bluetooth WPAN Bluetooth WPAN S-72333 PhD Seminar on Radio Communications Laselva Daniela Laselva Daniela [email protected] [email protected]. fi fi 04.05.2004 04.05.2004 WLAN 802.11b and Bluetooth interference 2 Contents Contents 1. Overview of WLAN / WPAN coexistence in the 2.4 GHz ISM band 2. Mutual interference of 802.11b WLAN and Bluetooth WPAN 3. Degradation of IEEE 802.11b due to Bluetooth radio interference 4. Mechanisms to reduce WLAN/WPAN interference 5. Conclusions
Transcript of Coexistence and Interference of WLAN (IEEE 802.11b) and ...

Coexistence and Interference of Coexistence and Interference of WLAN (IEEE 802.11b) WLAN (IEEE 802.11b) andand
Bluetooth WPANBluetooth WPAN
S-72333 PhD Seminar on Radio Communications
Laselva DanielaLaselva Daniela
[email protected]@cc.hut..fifi
04.05.200404.05.2004
WLAN 802.11b and Bluetooth interference 2
ContentsContents
1. Overview of WLAN / WPAN coexistence in the 2.4 GHz ISM band
2. Mutual interference of 802.11b WLAN and Bluetooth WPAN
3. Degradation of IEEE 802.11b due to Bluetooth radio interference
4. Mechanisms to reduce WLAN/WPAN interference
5. Conclusions

WLAN / WPAN coexistence in the 2.4WLAN / WPAN coexistence in the 2.4--GHz ISM bandGHz ISM band
IEEE 802.11b (DSSS) and Bluetooth (FHSS) operate at 2.4GHz ISM
� Two different wireless systems co-located in same unlicensed frequency band in the nearby generate mutual interference that impacts on the system performances.
� Coexistence: the closest the worst
• Some expected results: PER might increase significantly, WLAN throughput might drop significantly, Bluetooth voice link worst than data link because no packet retransmission?…
•Coexistence = study of potential mutual interference of systems that should not prevent from proper operations evaluated by:
• Extensive mathematical model of mutual interference between 802.11b and Bluetooth by IEEE 802.15.2 Coexistence Task Group.
• Different mathematical models of mutual interference.
• Empirical results from certain experimental setups.
Overview of radio 802.11b Overview of radio 802.11b
interfaceinterfaceIEEE 802.11b DSSS technology, DRs =1, 2, 5.5, 11 Mbps
- Spreading to combact inband interference smuts the interfering signal over the whole channel bandwidth � however it does not prevent from error if BT in the vicinity!- 79 MHz frequency band divided into 3 channels spanning channel bandwidth = 22MHz
- DR produced by varying modulation & channel coding:� 1Mbps: DBPSK modulation, every transmitted bit encoded into a 11-chip Barker symbol. Chips transmitted at 11Mchips/s.� 2Mbps: DQPSK modulation, pair of transmitted bit encoded into two 11-chip symbols, generated by Barker code. Chips transmitted at 11Mchips/s.� 5.5 (11) Mbps: CKK modulation, every 4 (8) transmitted bits are encoded into 8-chip symbol. Each symbol generated by a Walsh code. Chips transmitted at 11Mchips/s.
WLAN 802.11b and Bluetooth interference 5
- FHSS at transmission rate = 1Mbps over short distances: 79 RF channels displaced by 1MHz, fast new frequency hop (1600 hops/s), short packet, FEC.- Slots in TDD channel are allocated by the master and used for master/slave transmission alternately.
Bluetooth network piconet composes by a master device and slave devices (from 2 to 6) connected via Bluetooth in ad hoc network.The occupation of FH/TDD channel slot intervals by users done according to a pattern that depends whether Bluetooth voice link or data link is transmitted.
Overview of Bluetooth radio Overview of Bluetooth radio
interfaceinterface
Fig. FH/TDD channel in
Bluetooth: each time
slot corresponds to a
RF channel.
Packet Slot length
Single PacketAck
WLAN 802.11b and Bluetooth interference 6
Collision scenarioCollision scenario
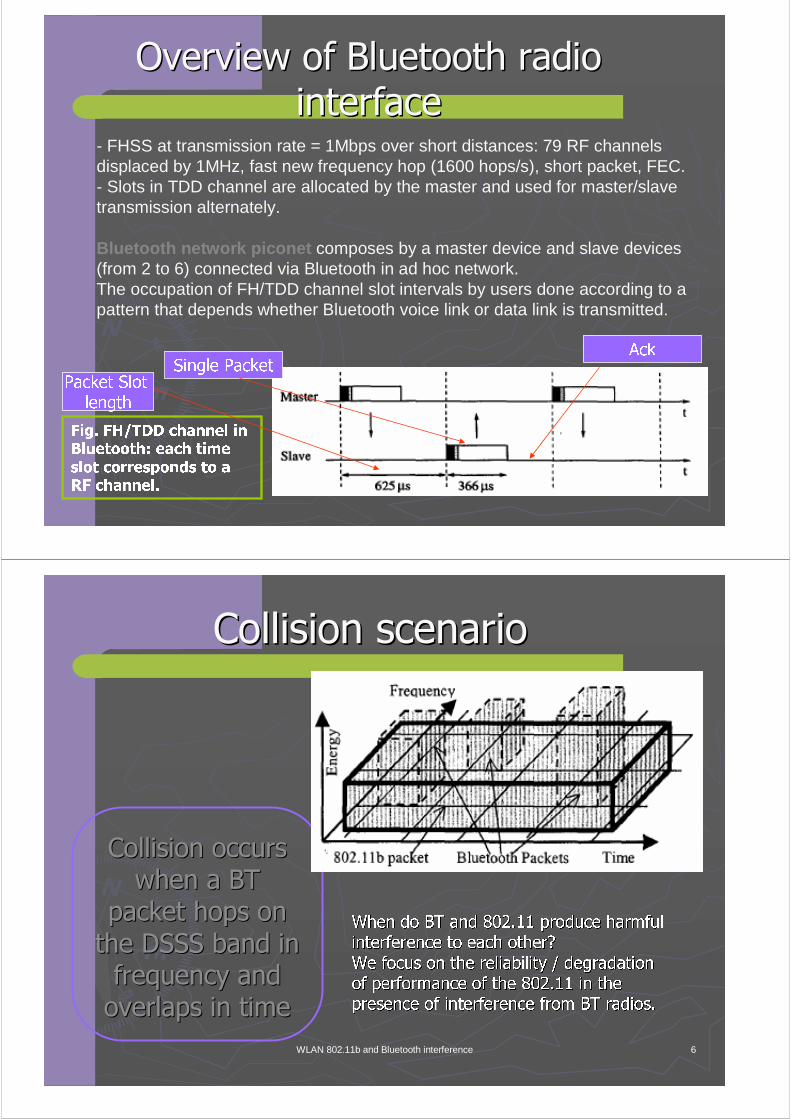
Collision occurs Collision occurs
when a BT when a BT
packet hops on packet hops on
the DSSS band in the DSSS band in
frequency and frequency and
overlaps in timeoverlaps in time
When do BT and 802.11 produce harmful When do BT and 802.11 produce harmful
interference to each other?interference to each other?
We focus on the reliability / degradation We focus on the reliability / degradation
of performance of the 802.11 in the of performance of the 802.11 in the
presence of interference from BT radios.presence of interference from BT radios.

Model AssumptionsModel AssumptionsNecessary assumptions on:Necessary assumptions on:
1.1. WLAN WLAN Network topology Network topology
2.2. User density / user positionsUser density / user positions for both systemsfor both systems
3.3. Propagation model / environment / scenariosPropagation model / environment / scenarios
4.4. Network traffic load for 802.11 and BT (Network traffic load for 802.11 and BT (piconetpiconet).).
Usually Usually the intereferncethe interefernce has been investigated and proposedhas been investigated and proposed for:for:
1.1. Infrastructure topologyInfrastructure topology
2.2. No higher density environment analyzed: only system with AP, No higher density environment analyzed: only system with AP,
WLAN STA, BT STA. WLAN STA, BT STA.
3.3. A simplified PLA simplified PL
4.4. Constant traffic for BT, typical utilization model not considereConstant traffic for BT, typical utilization model not considered.d.
Parameters to define are: Parameters to define are:
1.1. Distances between WLAN Distances between WLAN STAsSTAs, , APsAPs,,
2. density of WLAN STA, 3. Transmit power for both WLAN STA and AP: +20dBm4. BT transmit power: 0dBm5. # BT piconets co-located at each node
Zyren (qualitative) Model, [5]Zyren (qualitative) Model, [5]
►► The interference suscettivity of the 802.11 depends on desired sThe interference suscettivity of the 802.11 depends on desired signal from AP:ignal from AP: an an 11Mbps DSSS radio can provide reliable services when a narrowban11Mbps DSSS radio can provide reliable services when a narrowband d interferer as BT falls within its pass band if the SIR is greateinterferer as BT falls within its pass band if the SIR is greater than r than roughly 10dB! (roughly 10dB! (ConservativeConservative, , tested in lab!)tested in lab!)
1. WLAN STAs located 20m far from AP.1. WLAN STAs located 20m far from AP.
2. Density: 1 WLAN STA every 25 m22. Density: 1 WLAN STA every 25 m2
3. Transmit power WLAN= +20dBm3. Transmit power WLAN= +20dBm
4. BT piconet4. BT piconet: : transmit power BT= +0dBmtransmit power BT= +0dBm
1. Packet size=750B.1. Packet size=750B.
2. A fully loaded BT interferer2. A fully loaded BT interferer
►► When BT interferer > 10dB SIR thresholdWhen BT interferer > 10dB SIR threshold: : dropped packets due to overlap in time and dropped packets due to overlap in time and frequencyfrequency. . Number of potential interferes a STA is exposed depends on the rNumber of potential interferes a STA is exposed depends on the range from ange from the AP:the AP: suscettivity of WLAN to BT increases as a function of the rangesuscettivity of WLAN to BT increases as a function of the range of of distance APdistance AP--STASTA
►► There is only 25% probability that an active BT transmitter willThere is only 25% probability that an active BT transmitter will hop in a DSSS bandhop in a DSSS band. . Even less if consider packet lengthEven less if consider packet length. . But we should take into account collision also with But we should take into account collision also with ackack!!
►► Throughput drops from 7.5Mbits to 3.5MbitsThroughput drops from 7.5Mbits to 3.5Mbits
►► Based on typical BT utilization: 802.11 shows good reliability iBased on typical BT utilization: 802.11 shows good reliability in a fairly high n a fairly high dense environment.dense environment.

WLAN 802.11b and Bluetooth interference 9
Modeling mutual interference of Modeling mutual interference of IEEE802.11b & Bluetooth WPANIEEE802.11b & Bluetooth WPAN
- In the OSI model IEEE 802 develops standards for L1 (PHY) & L2 (Data link).
- Design of PHY (RF layer in Bluetooth) & MAC, Logical Link Control (Baseband and Link Manager in Bluetooth) has major impact on the performance of wireless network in presence of interference.
Mathematical model of mutual interference by IEEE 802.15.2 Coexistence Task Group.
For model details [7]:
PHY layer model for Bluetooth: Bluetooth RF layer. Model + TX GFSK modulator at 1Mbps + RX: baseband filter at DR=1Mbps + GFSK demodulator + detector
PHY layer model for 802.11 similarly…
- By using PHY models of 802.11 & Bluetooth the model calculates the
BER of the two systems working simultaneously. BER(802.11-Bluetooth interferer). Curves for each of 4 DRs.
-To calculate BER for different application scenarios, SIR needed at various RXs.
� SIR depends on transmit powers on BT and WLAN node, distances (TX-RX), path loss of RF signal.
� PL formula
� Given a geometric distribution of WLAN and WPAN nodes, the SIR is calculated at various receivers.
� PHY models calculated BER for both systems for the time intervals of
overlapping transmissions. This info is used by MAC in order to calculate some metrics (PER, throughput, NT latency) and det packet error and retransmission.
- MAC simulation: not accurately!
Results from the math modelResults from the math model

WLAN 802.11b and Bluetooth interference 11
Calculation of PER of 802.11b at 1Mbps and at 11Mbps in the presence of a BT interferer
• BT traffic: voice
• d (WLAN TX/RX) = 15m
Results:
- At 1Mbps PER ~ 65% � throughput = 35%
As the SIR increases BER drops sharply because of spreading
- At 11Mbps PER ~ 30% because the duration of the packet is shorter at higher DR: the probability of collision drops as the time duration of transmission decreases even though 11Mbps does not benefit from processing gain.
Results from the math model 3Results from the math model 3
WLAN 802.11b and Bluetooth interference 12
Observations and limitation of the modelObservations and limitation of the model
► Dropping WLAN DR not always ok because at lower DR packet longer in duration and PER might increase.
► Beyond certain distance processing gain at 1Mbps does not reduce PER.
► Assumptions, no account for situation of close proximity.
►► Coarse assumptions, no system dynamicsCoarse assumptions, no system dynamics
►► No detail or not considered WLAN PHY:No detail or not considered WLAN PHY:
�� different DRsdifferent DRs,,
�� channel coding schemeschannel coding schemes, ,
�� relative power between BT & WLAN relative power between BT & WLAN
�� Signal propagation characteristics, no inpact of timeSignal propagation characteristics, no inpact of time--space varying space varying
channelchannel
►► No detail MACNo detail MAC

Degradation for multiple 802.11bDegradation for multiple 802.11b STAs STAs
due to BTdue to BT
- Degradation depends on scenarios, devices positions, NT topologies.
- Models based on SIR requirements for 802.11 and Bluetooth receivers.
NT topologies for WLAN system within a BSS in presence of Bluetooth radio system at 2.4GHz: -Point-to-point (an AP, a WLAN station,STA): well investigated (tolerable interference levels)
-Multiple STA, an AP: more realistic! Also MAC – Access methods described.
�The model considers a SCENARIO that comprises: multiple STAs, an AP, uncoordinated BT radio interferers
�It estimates throughput of IEEE 802.11b as function of WLAN and Bluetooth parameters
WLAN 802.11b and Bluetooth interference 14
WLAN and Bluetooth parameters
The model [1] includes:
�802.11b MAC modeling�P(time coincidence)�P(frequency coincidence)�P(collision)�Numerical results

WLAN 802.11b and Bluetooth interference 15
Fig. . Theoretical maximum throughput (normalized to its raw data rate) of IEEE 802.11b systems for basic access method and RTS/CTS access method.
System ThroughputSystem Throughput
TTimeime coincidencecoincidence analysisanalysis
-BT frame duration TBT=625 µs, txm time tBT= 366 µs
-802.11b frame duration TP=1210 µs (PHY&MAC header for 1500B packet at 11Mbps)
-HP: Start txm for BT hop times as uniform r.v.
-#BT slot time overlapping in time with 802.11b is n or n-1
Overlapping n BT slots:
Pn-1= [TBT *(n-1)-TBT –tBT-FD]/ TBT
Pn =1- Pn-1
FD=802.11 frame duration (payload + headers)
� nMAX=3
Fig. Time coincidence between a BT piconet slot and a IEEE 802.11b packet. For example, if x < Tp < y, then the IEEE 802.11b packet could collide with 2 or 3 BT slots.

WLAN 802.11b and Bluetooth interference 17
Collision analysisCollision analysis
- Frequency coincidence occurs when the transmit frequencies of a BT piconet result in a packet error.
-If a nearby piconet active there is still probability that 802.11 STA receives succesfully a packet.
-Packet is destroyed if both overlap in time and frequency occurs.
-Collision with n slot overlap: Pcoll(n) = 1- (1- (Phop*LBT) )n
-LBT = piconet load factor
-Overall collision: Ptot(n) = (Pn-1 * Pcoll(n) ) - (Pn * Pcoll(n))
-Collision from m BT piconets: Pmult(m) = 1- (1- Ptot(n))m
Numerical resultsNumerical results
Distribution of AP, STAs, and BT piconets
IEEE 802.11 WLAN data rate of 2Mbps. Ph = 0.08 (a) payload size of 100 byte and (b) payload size of 1500 bytePh= Probability of hidden terminal
(a)
(b)

Numerical resultsNumerical results
IEEE 802.11 WLAN data rate of 11Mbps. Ph = 0.16 (a) payload size of 100 byte(b) payload size of 1500 byte
(b)
(a)
Throughput degradation of WLAN STAs of 25% and 66% at respectively 2Mbps and 11Mbps
WLAN 802.11b and Bluetooth interference 20
Interference in a officeInterference in a office environmentenvironment
►► TypicallyTypically analysis of interferenceanalysis of interference without respectwithout respect
with typical office environment.with typical office environment.
►► Testbed for pratical tests: Testbed for pratical tests:
�� 20dBm DSSS Lucent Orinoco 802.11b 11Mbps PC cards, 20dBm DSSS Lucent Orinoco 802.11b 11Mbps PC cards,
�� 20dBm BT Diaswear Development Module PC card (Demo Cards)20dBm BT Diaswear Development Module PC card (Demo Cards)
Fig. Ad hoc radio application

ScenariosScenarios: : open office in adopen office in ad--hoc NThoc NT
►► 6 6 scenariosscenarios investigated for interference investigated for interference ►► STASTA��802.11, 802.11,
►► BT BT �� BluetoothBluetooth. . Voice&data separated scenariosVoice&data separated scenarios
Fig. Effects of BT interferer on 802.11b (a) and of 802.11b interferer on Bluetooth (b). STA2 & BT2 far enough: no intereference. Both cards
operating on the same PC (adjacent on each other).
(a) (b)
WLAN 802.11b and Bluetooth interference 22
►► Monitoring of performanceMonitoring of performance: : quality of quality of
communication link between independent communication link between independent
stations and APsstations and APs..
►► Three MAC performance metrics evaluated:Three MAC performance metrics evaluated:
1.1. PER: % of bad packets of all received packetsPER: % of bad packets of all received packets
2.2. ThroughtputThroughtput--effective DR at receiving endeffective DR at receiving end
3.3. Ping timePing time--round trip time for a 32B poll packetround trip time for a 32B poll packet
►► 2 scenarios (over 6) yielded to conclusive results2 scenarios (over 6) yielded to conclusive results
Open office in ad hoc NT: resultsOpen office in ad hoc NT: results

Performance Metric results 1Performance Metric results 1
-Network performance reduced - At close range the effect of interferer decreases the performance because of probabilistic collision + some other effects-It appears d=3m as distance beyond which no interference is seen
Packet cell rate of 802.11 with one data BT interferer (%)
Throughput of 802.11 with one data BT interferer
Legend: continuos lines as reference, square: WLAN, other: BT
WLAN 802.11b and Bluetooth interference 24
- Effect of one interferer: both systems present good performance after 3m- Usable at smaller distances (around 1m) for low traffic situation (see ping figure)
Performance Metric results 1Performance Metric results 1
Ping time of 802.11 with one BT voice interferer

ObservationsObservations� BT data exhibits higher degradation. BT voice exhibits lower degradation because of its lower piconet utilization.� d=3m mark might be explained by the interferer’s power inadequate to cause PER(?). It shows anyway the power sensitivity of the two standards.� The variation of performances for the systems approaching the mark value could be different due to modulation technique(?)
� FROM OTHER SCENARIOS it appears that:� BT is fairly robust due to high hopping rate.� 802.11 seems to more vulnerable.
OVERALL RESULTS:� Completely unfeasibility for BT & WLAN to operate simultaneously in proximity (on the same computer): PER=99%, throughput reducedto 0, any reliability for both.� For more reliable services at least 3m distance needed.� More exhaustive scenarios needed to be further investigated.
WLAN 802.11b and Bluetooth interference 26
Interference: analytical analysisInterference: analytical analysis
- The BT interference on co-located IEEE 802.11b (at PHY and MAC layer) and the impact on the performance of 802.11b parameterized by:
�DR & packet size of 802.11b, �# BT piconets, �piconet utilization: 0 (no transmission)..100% (constant transmission), �distance between piconets and 802.11b radios.
-Model with essential features of both systems at PHY and MAC layers.-Statistical propagation model: PL, multipath fading (Rayleigh PDF), shadowing, noise (AWGN). A BT piconet in the vicinity (1-5m) of a 802.11 station: PL for both the same.-PER of 802.11 per each DR (different channel coding and modulation scheme used for each DR) in presence of BT radios.-Probability that BT packets will intersect in time and frequency.

IEEE 802.11 PHY analysisIEEE 802.11 PHY analysis
- Performance of modulation in a fading channel: -BER averaged over signal strength ranges.-PER assuming that BER independent from bit to bit (valid in indoor): PER= 1- (1-BER)m , m= #bits in the packet, (200..2400)B
Fig. PER vs. Power.
To have a low PER at high DR short distance of operation needed, otherwise retransmission rate required would be too high.
Collision analysis in smallCollision analysis in small officeoffice
Fig. Throughput of 802.11 in presence of single BT piconet(utilization=30%). Packet size so that the individual throughput optimized for the region of operation where DR is most effective.
Needed a switching algorithm between the DRs to optimize system’s total throughput.
Efficiency of each DR vs distance separation of 802.11 transmitter, receiver:-11Mbps gives the best result for a radius of 25m-5.5Mbps best results for the next 20m

Office layout with many STAsand a piconet associated with each STA uniformly distributed into the area (high density of piconets).# piconet interfering depends on the range 802.11 tx/rx distance.
Efficiency of each DR vs distance separation 802.11 (tx, rx):-11Mbps the most effective due of shortest transmission packet time (lowest PER) in radius of 0-25m-Beyond 25m the throughput is low for every DR: it suggests division of the open space into cells of 25m radius area, with AP in the center operating at 11Mbps with fragmentation size= 1300 B.
Collision analysis in open officeCollision analysis in open officeFig. Throughput of 802.11, single BT piconet,u=30%, open office env.
Open office is an extreme case where drastic throughput degradation occurs.
WLAN 802.11b and Bluetooth interference 30
Collision analysisCollision analysis
- 802.11 transmissions suffer more than BT from 802.11. Reasons:� BT fast frequency hopping, combact interference jumping to a new frequency hop.� Area of operation in 802.11 much larger: 802.11 signal strengthattenuates below the power of BT transmitter � more susceptible to interference.� BT packet smaller than 802.11: retransmission of Bt packet in case of loss for collision performed quickly.
-Probability of PER depends on the probability of collision in time and frequency and on the relative powers of the packets [3].

WLAN 802.11b and Bluetooth interference 31
Experimental results in large outdoor Experimental results in large outdoor
open spaceopen space
-[4] characterizes performance degradation of 802.11b devices through
experimental results evaluated in large outdoor open space, football stadium.
- Since the power levels and channel effects cannot be regulated, the measurements are repeated also in a lab with tuned values. Less degradation is shown in this case.
Test bed-BT devices on laptop: Digianswear BT PC cards, power output=20dBm-Lucent/Orinoco 802.11b 11Mbps PC cards with power output=15dBm-Varying SIR in controlled manner � measure PLR
Experimental setup [Experimental setup [4]4]
-Steady traffic stream setup between the BT cards.-Packet transmission (link tests) between 802.11 cards.-Client SW manager gives statistics about the lost packets at 802.11 device at each DR, signal level, etc.
Fig. Experiment setup, Antenna pattern for 802.11 (dB) and Orientation for antenna pattern measurement.- Varying d
s: signal level at 802.11 varies.
- Varying dI: interference received at 802.11 changes

WLAN 802.11b and Bluetooth interference 33
- At smaller dI: greater interference. Packet loss corresponds to decrease of SIR (2-ray ground reflection model). - The improvement in SIR at very short distances due to receiver antenna pattern nulls in the direction of the interference.
Figs. Experiment performance results
Experimental results in large outdoor open Experimental results in large outdoor open
space [space [4]4]
WLAN 802.11b and Bluetooth interference 34
Conclusions Conclusions
►► 802.11b802.11b has reasonable results even when BT interference is has reasonable results even when BT interference is 10dB than desired signal. Packet loss is not the only 10dB than desired signal. Packet loss is not the only form of form of degradationdegradation: MAC layer delays the transmission if it senses : MAC layer delays the transmission if it senses the medium busy.the medium busy.
►► BT signalBT signal degrades rapidly when interfering 802.11b signal is degrades rapidly when interfering 802.11b signal is as high as desired signal, For BT, where no carrier senses is as high as desired signal, For BT, where no carrier senses is performed, the attainable bandwidth is related directly to cell performed, the attainable bandwidth is related directly to cell packet loss.packet loss.
►► Increased transmit duration increases Increased transmit duration increases vulnerable periodvulnerable period for BT for BT collision because covers the duration of a higher # BT hops. collision because covers the duration of a higher # BT hops. The loss of any part of packet causes the loss of entire packet The loss of any part of packet causes the loss of entire packet the packet loss ratio is supposed to be higher (worst the packet loss ratio is supposed to be higher (worst performance in presence of interference) for lower DR.performance in presence of interference) for lower DR.

WLAN 802.11b and Bluetooth interference 35
Coexistence mecchanismsCoexistence mecchanisms
a) Collaborative: requires communication link between WLAN & WPAN networks in order of a cooperation on protocol level to minimize interference.E.g.,: WLAN & WPAN embedded into the same device.
b) Non collaborative: no communication link between WLAN & WPAN networks.E.g.,: WLAN embedded in laptop computer and WPAN module on PDA � independent adaptation.
WLAN 802.11b and Bluetooth interference 36
Reducing mutualReducing mutual interferenceinterference
Reccomended Practise of coexistence mechanisms by IEEE 802.15.2:
Collaborative: packet scheduling techniques to evoid packet collision
- AWMA (coordinated MAC layer for both radios)
- MEHTA (packet-by-packet basis decision of trasmission)
Non Collaborative:
- Adaptative packet selection and scheduling (APSS)
- Adaptative frequency hopping (AFH)

WLAN 802.11b and Bluetooth interference 37
AbbreviationsAbbreviations
AP Access Point
AWMA Alternating Wireless Multiple Access
BSSID Basic Service Set ID
CSMA/CD Carrier Sense Multiple Access /Collision Detection
CSMA/CA Carrier Sense Multiple Access /Collision Avoidance
CTS Clear to Send
CRC Cyclic Redundancy Check
FEC Forward Error Correction
GFSK Gaussian Frequency Shift Keying
HDLC High-level Data Link Control
ISM Industrial, Scientific and Medical
LLC Logical Link Control
MAC Medium Access Control
NT Network
OSI Open System Interconnection
OUI Organizationally Unique Identifier
PCF Point Cordination Function
PDA Personal Digital Assistent
PHY Physical
PL Path Loss
PSK Phase Shift Keying
RTS Request to Send
SIFS Short Interframe Space
STA station
WPAN Wireless Personal Area Network
AbbreviationsAbbreviations

WLAN 802.11b and Bluetooth interference 39
ReferencesReferencesI. Punnoose, R.J.; Tseng, R.S.; Stancil, D.D., “Experimental results for interference
between Bluetooth and IEEE 802.11b DSSS systems”, Vehicular Technology Conference, VTC 2001 Fall. IEEE VTS 54th, Vol.: 1 , Pgs:67 – 71, 2001.
II. Fainberg, M.; Goodman, D, “Analysis of the interference between IEEE 802.11b and Bluetooth systems”, Vehicular Technology Conference, VTC 2001 Fall. IEEE VTS 54th, Vol. 2, Pgs:967 - 971, 7-11 October 2001.
III. Chandrashekhar, M.V.S.; Choi, P.; Maver, K.; Sieber, R.; Pahlavan, K., “Evaluation of interference between IEEE 802.11b and Bluetooth in a typical office environment”, Personal, Indoor and Mobile Radio Communications, 2001 12th IEEE International Symposium on, Vol. 1 , Pages:D-71 - D-75, 30 Sept - 3 Oct2001.
IV. Jung-Hyuck Jo; Jayant, N, “Performance evaluation of multiple IEEE 802.11b wlanstations in the presence of bluetooth radio interference”, IEEE International Conference on Communications, ICC '03.,Vol. 2, Pages:1163 - 1168, 11-15 May 2003.
V. J. Zyren, “Reliability of IEEE 802.11 WLANs in presence of Bluetooth radios,” in IEEE P802.15-99/073r0, Santa Rosa, California, Sept. 1999.
VI. Bing. B., WLAN Networks, Wiley, 2002
WLAN 802.11b and Bluetooth interference 40
HomeworkHomework
1. Describe briefly the system performance degradation of IEEE 802.11b devices due to Bluetooth piconet presence in the nearby.
2. Describe briefly the important parameters to take into account for an accurate analysis of interference between the system IEEE 802.11b and Bluetooth piconets and their impact on the performance results.