Coding High Quality Digital Audio - iki.fi
38
Coding High Quality Digital Audio J. ROBERT STUART Meridian Audio Ltd, Stonehill, Stukeley Meadows, Huntingdon, PE18 6ED, United Kingdom The author has led the campaign mounted by Acoustic Renaissance for Audio of which he is Chairman. The ARA has made consistent arguments for higher standards of audio recording quality on the next major format (which should be DVD Audio). This article is an adaptation of material that the author has presented during this campaign. It summarises some of the important issues we face in deciding how to code audio for the next generation of archive and distribution. INTRODUCTION A Compact Disc (CD) carries its audio message through time and space. In that respect the current CD is a direct successor to analogue carriers like the phonograph and cassette. In every generation we capture great performances and aim to make them available to a wide audience. So, a recording system is also judged by the quality of its archive. When it comes to distributing the recording at any point in time, it is the audio properties of the channels in the distribution carrier that normally determine the delivered sound quality. Of course, CD was the first widespread carrier to use digital coding, and as we stand now on the brink of standardising new carriers related to DVD, it is worth while looking at some of the mistakes that were made in the past as well as the opportunities on offer. Audio starts as a vibration in air and we perceive it through a hearing mechanism that is not exclusively analogue in operation. Since, at any sensible scale, the audio vibrations can be considered an analogue signal, there has been considerable debate over why what starts and ends as an analogue air-pressure signal should be stored digitally. The overwhelming reason to store and transmit information in the digital domain is that it can be transmitted without loss or the introduction of interference. It can even (as we will see later) be manipulated in a way that avoids many of the distortions introduced by analogue processing methods. This somewhat obvious point is often overlooked. Analogue storage or transmission methods always introduce distortion and noise that can not be removed, and also threaten the time structure of the sounds through wow or flutter effects. Digital audio has progressed on this basis, and on the assumption that we can convert transparently from analogue to digital and back again. There are a number of experiments that have demonstrated this possibility to varying degrees, but it has also become fairly well understood that badly executed digital audio can introduce distinctive problems of its own. Different listeners bring different prejudices. For the author, digital audio was a welcome development because it avoided the particularly unpleasant damage to music caused by pitch variation and high background noise. CD was the first carrier to really bring digital audio into the home, and its development has taught us a lot.
Transcript of Coding High Quality Digital Audio - iki.fi

Coding High Quality Digital Audio
J. ROBERT STUART
Meridian Audio Ltd, Stonehill, Stukeley Meadows, Huntingdon, PE18 6ED, United Kingdom
The author has led the campaign mounted by Acoustic Renaissance for Audioof which he is Chairman. The ARA has made consistent arguments for higherstandards of audio recording quality on the next major format (which shouldbe DVD Audio). This article is an adaptation of material that the author haspresented during this campaign. It summarises some of the important issueswe face in deciding how to code audio for the next generation of archive anddistribution.
INTRODUCTIONA Compact Disc (CD) carries its audio message through time and space. In that respect the current CDis a direct successor to analogue carriers like the phonograph and cassette.
In every generation we capture great performances and aim to make them available to a wide audience.So, a recording system is also judged by the quality of its archive. When it comes to distributing therecording at any point in time, it is the audio properties of the channels in the distribution carrier thatnormally determine the delivered sound quality.
Of course, CD was the first widespread carrier to use digital coding, and as we stand now on the brinkof standardising new carriers related to DVD, it is worth while looking at some of the mistakes thatwere made in the past as well as the opportunities on offer.
Audio starts as a vibration in air and we perceive it through a hearing mechanism that is not exclusivelyanalogue in operation. Since, at any sensible scale, the audio vibrations can be considered an analoguesignal, there has been considerable debate over why what starts and ends as an analogue air-pressuresignal should be stored digitally. The overwhelming reason to store and transmit information in thedigital domain is that it can be transmitted without loss or the introduction of interference. It can even(as we will see later) be manipulated in a way that avoids many of the distortions introduced byanalogue processing methods. This somewhat obvious point is often overlooked. Analogue storage ortransmission methods always introduce distortion and noise that can not be removed, and also threatenthe time structure of the sounds through wow or flutter effects.
Digital audio has progressed on this basis, and on the assumption that we can convert transparentlyfrom analogue to digital and back again. There are a number of experiments that have demonstrated thispossibility to varying degrees, but it has also become fairly well understood that badly executed digitalaudio can introduce distinctive problems of its own.
Different listeners bring different prejudices. For the author, digital audio was a welcome developmentbecause it avoided the particularly unpleasant damage to music caused by pitch variation and highbackground noise.
CD was the first carrier to really bring digital audio into the home, and its development has taught us alot.

2
As digital audio has progressed, we have also evolved the capability to record and play back withresolution that exceeds that of Red Book CD1 and current studio practise recognises this Red Bookchannel as a ‘bottleneck’. High-quality recordings are routinely made and edited using equipment whoseperformance potential is considerably higher than CD. Figure 1 illustrates this conceptually, whilefigure 2 illustrates how resolution (in this case indicated by word-size) typically varies through a qualityaudio chain.
Along the way, some interesting ideas have been proposed to try to maximise the human-auditorypotential of CD. One idea is noise-shaping. Noise-shaping was first proposed by Michael Gerzon andPeter Craven in 1989 [11] and successfully embodied in Meridian’s 618, 518 [12, 22] and also inSony’s Super Bit Mapping [3]. This technique has been used on maybe a few thousand titles – but theseinclude some of the very finest sounding CDs available today. Other proposals were interesting, butdidn’t get off the ground – like subtractive dither and schemes to add bandwidth or channels to CDs [4,14, 19,].
The author has felt strongly for some time, that we are on the threshold of the most fantastic opportunityin audio. It comes from two directions. First, psychoacoustic theory and audio engineering may haveprogressed to the point where we know how to define a recording system that can be truly transparent asfar as the human listener is concerned. Second, we will soon see the evolution of a high-density audioformat, related to DVD, that has, if it is used wisely, the data capacity to achieve this goal.
MEASURES OF AUDIOThe author is firmly convinced that the next audio distribution format should be capable of deliveringevery sound to which a human can respond. To achieve this requires:
• sufficient linearity, i.e. low enough distortion
• sufficient dynamic range, i.e. low enough noise
• sufficient frequency range
• sufficient channels to convey 3-D sound
• sufficient temporal accuracy (wow, flutter, jitter)
In its Proposal [1], the ARA suggested that a carrier intended to convey everything humans can hearrequires:
1. Dimensionality: full spherical reproduction (including height)
2. Frequency range: from DC to 26kHz in air – and the in air qualification matters
3. Dynamic range: inaudible to 120dB spl
Before we get deeper into these questions, we need to make a small diversion.
DIGITAL AUDIO GATEWAYSEven among audio engineers, there has been considerable misunderstanding about digital audio, aboutthe sampling theory, and about how PCM works at the functional level. Some of thesemisunderstandings persist even today. Top of the list of erroneous assertions are:
i. PCM cannot resolve detail smaller than the LSB (least-significant bit).
ii. PCM cannot resolve time more accurately than the sampling period.
Let’s take (i) first. What is suggested is that because (for example) a 16 bit system defines 64K steps,that the smallest signal that can be ‘seen’ is 1/64K or about –96dB. Signals dropping off because they
1 The Red Book referred to is the Philips/Sony standard document on CD Digital Audio. The Red Book CDconveys two channels of 16-bit linear PCM sampled at 44.1kHz.

3
are smaller than the smallest step or Least Significant Bit (LSB) is a process we call truncation. Now –you can arrange for a PCM channel to truncate data below the LSB – but no engineer worth his salt hasworked like that for over ten years. One of the great discoveries in PCM was that, by adding a smallrandom noise (that we call dither) the truncation effect can disappear. Even more important was therealisation that there is a right sort of random noise to add, and that when the right dither is used [27],the resolution of the digital system becomes infinite. What results from a sensible digitisation or digitaloperation then is not signal plus a highly-correlated truncation distortion, but the signal and a benignlow level hiss. In practical terms, the resolution is limited by our ability to resolve sounds in noise. Justto reinforce this, we have no problem measuring (and hearing) signals of –110dB in a well-designed 16-bit channel.
Regarding temporal accuracy, (ii), if the signal is processed incorrectly (i.e. truncated) it is true that thetime resolution is limited to the sampling period divided by the number of digital levels2. However, whenthe correct dither is used the time resolution also becomes effectively infinite.
So, we have established the core point, that wherever audio is digitised (like in an analogue–digitalconverter) or re-digitised (as in a filter or other DSP process) there is a right way and a wrong way todo it. Neglect of the quantisation effects will lead to highly-audible distortion (as we will see later).However – and this is perhaps the most fundamental point of all – if the quantisation is performed usingthe right dither, then the only consequence of the digitisation is effectively the addition of a white,uncorrelated, benign, random noise floor. The level of the noise depends on the number of the bits in thechannel – and that is that!
LINEARITYThe previous section highlighted a point that needs reinforcing. Linear uniform PCM channels do notintroduce distortion if suitable dither is applied at every stage where the audio is processed (i.e. modifiedrather than transmitted). It is possible to digitise and then process a signal without introducing anythingthat we would commonly refer to or hear as a distortion.
This is not saying of course that all digital systems are distortion free, nor that all equipment has beencorrectly designed – had it been there would be much less discussion about ‘analogue-vs-digital’!
The important point is that because it can be done perfectly, then we should assume in designing a newcarrier that it has been – rather than make allowance for needless bad practice.
The reason for this preamble is that, as we shall see soon, truncation-type distortions are of high order(rather like crossover distortion) and so are highly audible. Whereas, the addition of a low-level ofuncorrelated random noise – which is the consequence of a good digital process – does not haveperceptual consequences of non-linearity.
Now, linearity, or lack of distortion is vital in audio systems. However these days, in a well-designedsystem, the significant non-linearities (distortions) should only arise in the transducers and analogueelectronics, rather than in the PCM channel.
Let us just take another short diversion into the question of how much distortion we can hear. It is wellestablished that he amount of distortion we can hear depends on the ‘order’ – whether it is 2nd, 3rdharmonic etc, and, because the human hearing system itself is quite non-linear, on how loud the mainsound is.
Many of the examples in this article are evaluated using a computer model of auditory detection that theauthor has developed over the years. [23, 26]
This auditory model includes a step that calculates internal ‘beats’ or distortion products in the hearingsystem. Fig. 3 hints at the potential of such a tool, and shows a contour map estimating existence
2 e.g. in CD that is represented by the reciprocal of 44100 * 64K

4
regions for detectability of pure second-harmonic distortion in mono presentation. The figure shows thatat low loudness one’s ability to hear an added octave component is controlled by the absolute hearingthreshold. Maximum acuity occurs in the medium ground corresponding to about 60dB spl. At this levelthe maximum acuity is estimated around 1–2kHz where a 0.1% second-harmonic addition just reachesthreshold. As spl is increased, the broadening of the cochlear filters and internal distortion reduceacuity.
Systems that introduce harmonic distortions also create intermodulation. Fig. 4 gives an illustration ofpredicted detectability of intermodulation distortion – in this case of a first-order difference toneresulting from non-linear processing. The bottom axis is the frequency difference between one tone fixedat 10kHz and an equal-sized tone at higher-frequency. As with the harmonic example, we see that as thecombination level is raised from 20dB spl there is a rapid rise in acuity, with a maximum sensitivityaround 60dB spl.
These examples provide a intriguing, thorough and complex guide to the age-old question: “how muchdistortion can be heard?.
PRECISION AND DYNAMIC RANGEDistortions can be introduced at analogue–digital–analogue gateways, or in analogue peripherals.However, in a uniformly sampled, uniformly quantised digital channel, the bits maintain a precise 2:1magnitude, and the potential for introducing distortion arises in:
• Non-trivial signal processing, including filtering and level changes
• Word-length truncation or rounding
The non-linear quantisation distortion that results from truncation or rounding can be avoidedcompletely by using appropriate dither at each non-trivial process.
Let us look at the distortion introduced by basic quantisation a bit closer. Fig. 5 shows measurements ofthe level-dependent distortion produced in an undithered quantiser. The original signal (a 1kHz sine-wave) is attenuated in steps to show the effect of a fade when the output of an undithered 16-bitquantiser is measured in the frequency domain. The graphs show that at high levels the quantisationerror is noise-like, whereas at low levels it is highly structured. It would be hard to imagine that thestructured distortion produced by truncation would not be audible.
On the other hand, a dithered quantisation introduces uncorrelated noise. Figure 6 shows the FFTmeasurements of a –90dBFS 1kHz signal subjected to 16-bit quantisation with and without dither. Ineach case the 1kHz signal appears at about the same level. With dithered quantisation, a smooth noisespectrum represents the benign-sounding ‘error’ in the operation. Without dither, we can see that theresulting signal is very rich in unwanted odd-harmonic components; the resulting total-harmonicdistortion is 27%.
Broadly speaking, truncated, rounded or dithered quantisations introduce ‘errors’ of similar total power.This article therefore often focuses on good practice, and considers dynamic range and precisiontogether. In a correctly engineered digital channel, the consequence of each quantisation (word-lengthreduction or filtering, for example) is the successive addition of benign noise.
Figure 7 once again uses auditory modelling to highlight important ideas. Here the base noise level isshown for 44.1kHz sampling in 16, 18 and 20-bit channels. The noise is shown, however, not in termsof spectral density (–137dBFS/√Hz with 16 bits) but in terms of human-audible significance. Theeffect of the noise rises with frequency because of the effective filters in the human ear. This transformis described in detail in [23].
The significance of the noise is plotted against an spl reference which assumes that the acoustic gain atreplay will allow a full-scale signal to reach 120dB spl (a probable worst case). The average hearingthreshold is also shown. Wherever the noise curve is above the threshold, it will be possible for the
5
channel noise to be detected. The degree and frequency range of the above-threshold spectrum indicateshow it will sound. In the 16-bit example, then, the component of noise between 700Hz and 13kHzshould be audible, whereas audibility is predicted between 2kHz and 6kHz in the 18-bit example. Thisgraph also suggests that for delivery, a 20-bit channel should have adequate dynamic range.
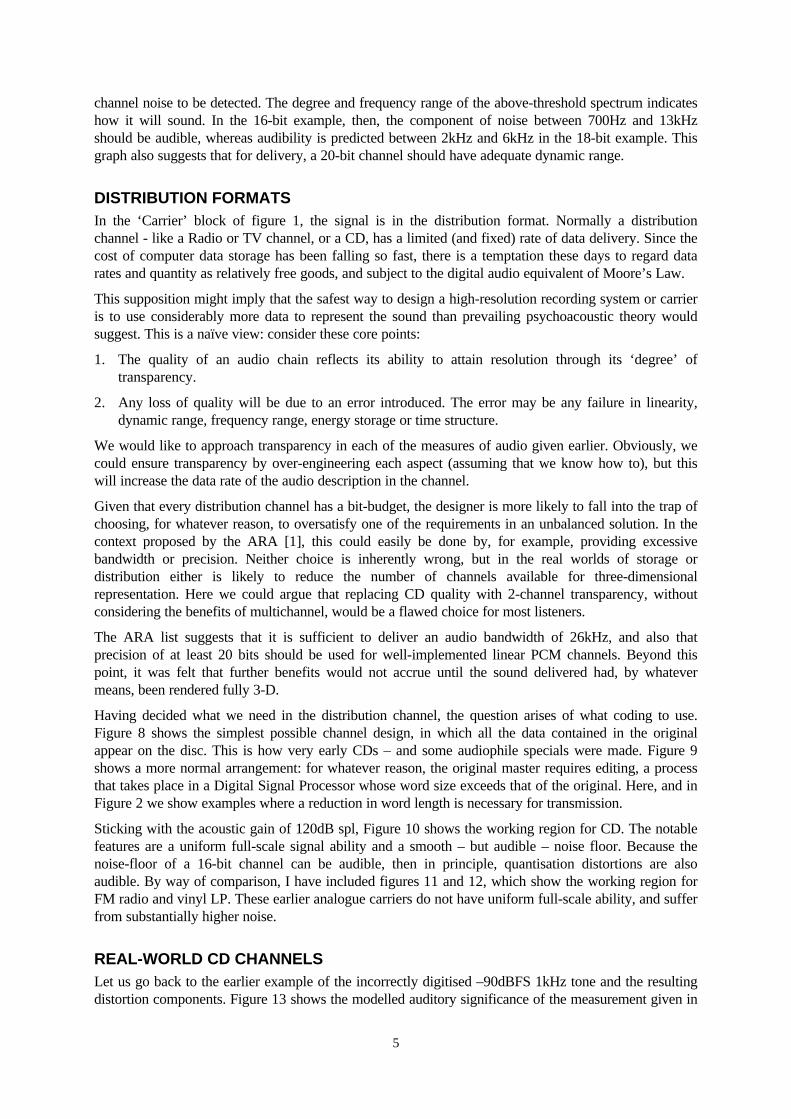
DISTRIBUTION FORMATSIn the ‘Carrier’ block of figure 1, the signal is in the distribution format. Normally a distributionchannel - like a Radio or TV channel, or a CD, has a limited (and fixed) rate of data delivery. Since thecost of computer data storage has been falling so fast, there is a temptation these days to regard datarates and quantity as relatively free goods, and subject to the digital audio equivalent of Moore’s Law.
This supposition might imply that the safest way to design a high-resolution recording system or carrieris to use considerably more data to represent the sound than prevailing psychoacoustic theory wouldsuggest. This is a naïve view: consider these core points:
1. The quality of an audio chain reflects its ability to attain resolution through its ‘degree’ oftransparency.
2. Any loss of quality will be due to an error introduced. The error may be any failure in linearity,dynamic range, frequency range, energy storage or time structure.
We would like to approach transparency in each of the measures of audio given earlier. Obviously, wecould ensure transparency by over-engineering each aspect (assuming that we know how to), but thiswill increase the data rate of the audio description in the channel.
Given that every distribution channel has a bit-budget, the designer is more likely to fall into the trap ofchoosing, for whatever reason, to oversatisfy one of the requirements in an unbalanced solution. In thecontext proposed by the ARA [1], this could easily be done by, for example, providing excessivebandwidth or precision. Neither choice is inherently wrong, but in the real worlds of storage ordistribution either is likely to reduce the number of channels available for three-dimensionalrepresentation. Here we could argue that replacing CD quality with 2-channel transparency, withoutconsidering the benefits of multichannel, would be a flawed choice for most listeners.
The ARA list suggests that it is sufficient to deliver an audio bandwidth of 26kHz, and also thatprecision of at least 20 bits should be used for well-implemented linear PCM channels. Beyond thispoint, it was felt that further benefits would not accrue until the sound delivered had, by whatevermeans, been rendered fully 3-D.
Having decided what we need in the distribution channel, the question arises of what coding to use.Figure 8 shows the simplest possible channel design, in which all the data contained in the originalappear on the disc. This is how very early CDs – and some audiophile specials were made. Figure 9shows a more normal arrangement: for whatever reason, the original master requires editing, a processthat takes place in a Digital Signal Processor whose word size exceeds that of the original. Here, and inFigure 2 we show examples where a reduction in word length is necessary for transmission.
Sticking with the acoustic gain of 120dB spl, Figure 10 shows the working region for CD. The notablefeatures are a uniform full-scale signal ability and a smooth – but audible – noise floor. Because thenoise-floor of a 16-bit channel can be audible, then in principle, quantisation distortions are alsoaudible. By way of comparison, I have included figures 11 and 12, which show the working region forFM radio and vinyl LP. These earlier analogue carriers do not have uniform full-scale ability, and sufferfrom substantially higher noise.
REAL-WORLD CD CHANNELSLet us go back to the earlier example of the incorrectly digitised –90dBFS 1kHz tone and the resultingdistortion components. Figure 13 shows the modelled auditory significance of the measurement given in

6
figure 6. Once again, (and in all subsequent figures), the acoustic gain is set so as to permit a full-scalesignal to generate 120dBspl at the listening position.
This plot is quite telling: it predicts, for example, that the harmonics generated by the unditheredquantisation will be significantly detectable right up to 15kHz. The excitation curve shows that thedistortion cannot be masked by the tone. It should also be noted that the harmonic at 5kHz is nearly30dB above threshold. This implies that there may be circumstances in which the error can be detectedwith relatively conservative acoustic gains (lower volume settings).
Single undithered truncations at the 16-bit level are regrettably all too common in practice. Not only doinadvertent truncations arise in the hardware filters of very many converters, but the editing andmastering processes often include level shifts, mixing events or DC filtering processes that have notbeen dithered correctly. There have therefore been reasonable grounds to criticise the sound of somedigital recordings – even though (as laboured earlier) this particular defect can be avoided by combininggood engineering with good practice.
Figure 14 represents the audible significance of a channel in which a correctly dithered quantisation(perhaps in a word-length reduction from 20 to 16 bits) is followed by a minor undithered process, inthis case a 0.5dB attenuation. This figure shows how just one undithered process can degrade acorrectly converted signal. Once again it is predicted that detection of a raised and granular noise flooris highly probable.
Figure 15 shows how this effect could operate in practice. The upper curve represents the audiblesignificance of the same –90dBFS tone with all the errors introduced by an original ‘correct’ 16-bitquantisation followed by four undithered signal-processing operations. Four operations may seem like alot, but this figure actually illustrates a common case in which everyday analogue-to-digital and digital-to-analogue converters are used. (As has already been mentioned, the decimation/oversampling filters inhardware converters are rarely dithered).
This curve may be taken as a baseline of current bad practice in CD recording/replay. It is put inhistorical context in figure 16, which includes the audible significance of the playback noise in a silentLP groove.
In many ways, the pity for PCM to date has been that it is so robust – which is to say that the soundsurvives this kind of abuse because it is superficially the same. If we were to introduce truncation errorslike this in other areas of digital processing chaos may well ensue; programs would refuse to run, etc.Indeed, compressed audio formats that require bit-accuracy delivery cannot tolerate the sort of abusethat poor design has brought so routinely to digital audio.
This analysis of the dynamic-range capability of the 16-bit 44.1kHz channel makes certain things veryclear:
1. Undithered quantisations can produce distortions, which are likely to be readily detectable and alsoquite unpleasant. Undithered quantisation of low-level signals will produce high and odd-orderharmonics.
2. Undithered quantisations routinely arise in the current CD replay chain, and great care is required ifa recording is to be captured, edited, mastered and replayed without any error arising.
3. The basic noise floor of the 16-bit channel suggests that it can be noiseless only when the acousticgain is less than 100dBspl (as implied by figure 7).
20-BIT PCM CHANNELSFigure 7 also predicted that basic 20-bit channel noise would be inaudible. Figure 17 investigates thesuitability of a 20-bit recording and replay chain. The channel’s basic noise is shown together with thesteady increase in the noise floor that takes place when the signal is operated on in the channel. Thecurves represent the effects of 1, 2 and 5 dithered quantisations, resulting from 1 and 4 operations

7
subsequent to the initial conversion. In fact, a modern system using 20-bit resolution throughout willprobably perform a minimum of five operations over and above the digitisation process itself, sinceanalogue-to-digital and digital-to-analogue converters will usually contain two cascaded digital anti-image or oversampling filters.
The data used in figure 17 suggest that a 20-bit channel (if engineered correctly) should be capable ofproviding a transparent and subjectively noiseless sound reproduction chain. This assertion is reinforcedby figure 18, in which the signal-processing chain postulated in figure 15 (a sequence of fivequantisations, only the first of which uses dither) is recalculated for a 20-bit channel. This is asignificant abuse, but it still appears that the distortion components should be barely audible.
This is an important conclusion because it puts an upper limit on the resolution required in adistribution channel.
24-BIT PCM CHANNELSThere is no convincing argument for using 24-bit data in a distribution format. Figure 7 clearly impliesthat the noise floor and resolution limit of a 24-bit channel will be 24dB greater than is necessary.
Why do it, then? One reason would be in order to convey more data for the subsequent DSP processesto work with. This reasoning is superficially correct. However, the author believes it to be unlikely thatA/D converters that deliver 133dB analogue SNR will ever be made, and therefore a 24-bit channelwould be kept busy conveying its own input noise! Furthermore, the majority of DSP systems andinterfaces use a 24-bit word size. It is very, very difficult at present to guarantee transparency whenperforming non-trivial DSP operations on 24-bit data in a 24-bit processing environment. Obviously wecould develop DSP processors capable of handling larger words, but why should we? Not only is thecombination of well-handled, carefully delivered 20-bit data and a 24-bit processing environment goodenough, but to deliver anything more is virtually to guarantee a higher risk of inadvertent truncation inthe average replay chain.
A more pragmatic reason not to distribute 24-bit data is that it is virtually certain that the overwhelmingmajority of DVD players will not pass 24-bit data correctly. Even if they were to use 24-bit conversion,truncation is virtually guaranteed, whereas 20-bit data in the same pathway will pass virtuallyunscathed.
IN-BAND NOISE SHAPING AND PRE-EMPHASISIt is possible to exploit the frequency-dependent human hearing threshold by shaping the quantisationand dither so that the resulting noise floor is less audible.
Figure 19 shows how the Meridian 518 (an in-band shaper) can allow a 16-bit transmission channel tohave a subjective noise floor more equivalent to a 20-bit ‘simple’ channel. If such a channel is to beuseful, the resolution of the links in the chain before and after the noise-shaped channel must beadequate. In simple terms, this means mastering and playing back using well-designed convertersoffering at least 20-bit resolution.
It was the view of the ARA committee that noise shaping can be a linear process, and that it deservesserious consideration when distribution channels are to be matched to data-rate limitations.
FREQUENCY RANGEThe graphs to date have used the standard hearing threshold described in [20]. However, individuals canexhibit somewhat different thresholds [21 and 8]. The minimum audible field has a standard deviation ofapproximately 10dB.
Individuals are to be found whose thresholds are as low as –20dBspl at 4kHz. Similarly, although thehigh-frequency response cut-off rate is always rapid, certain people can detect 24kHz.

8
Figure 20 shows how hearing thresholds can vary. This graph still suggests that a well-engineered 20-bit channel should be adequate, bearing in mind that very few rooms, no recording venues and nomicrophones genuinely approach the quietness of the 20-bit noise floor.
Figure 21 adds the frequency response of a typical digital-to-analogue converter at 44.1kHz. Thisdiagram defines the working region of a Red Book CD channel.
DO WE NEED MORE THAN 44.1KHZ?The high-frequency region of figure 21 is shown in detail in figure 22. It can be seen that an averagelistener will find little to criticise in the in-band amplitude response of the DAC. To acute listeners, a44.1kHz sample rate (even with the extremely narrow transition band shown) means a potential loss ofextreme HF (between 20kHz and 22kHz). Raising the sampling rate to 48kHz does a lot to remedy this.
However, the significance of this has to be questioned. Although there is an area of intersection betweenthe channel frequency responses and the hearing thresholds, this region is all above 100dBspl. Theauthor knows of no program material that has any significant content above 20kHz and 100dBspl!
Numerous anecdotes suggest that a wider-frequency response ‘sounds better’. It has often beensuggested that a lower cut-off rate would give a more appropriate phase response, and that the in-bandresponse ripple produced by the kind of linear-phase high-cut-off-rate filter illustrated in figure 22(DAC) and figure 23 (ADC) can prove unexpectedly easy to detect. It is also frequently asserted thatthe slower rate of fall-off in HF response found in an analogue tape recorder accounts for a preferredsound quality.
It has also been suggested that the pre-ringing produced by the very steep linear-phase filters used so farfor digital audio, can smear arrival-time detection and impact stereo imaging. This pre-ringing shows upin nearly all reviews of CD players. It can be significantly reduced by making the filter less steep (whichwe could do by raising the sample rate) or by not using a linear-phase characteristic.
The literature can contribute very little to this discussion. One well-performed set of experiments byOhashi has, however, strongly indicated that certain program material may benefit from a systemfrequency response extending beyond 50kHz [17, 18].
The real problem facing researchers is that these experiments are extremely difficult to do. Super-HFeffects cannot be investigated using existing hardware: microphones, recorders, filters, amplifiers andtweeters would all need to be redeveloped. It is difficult to alter just one parameter, and experiments arehampered by the fact that a super-HF-capable chain has yet to be developed to the same level ofperformance as the current reference.
One is forced to conclude that there is some real and much anecdotal evidence to suggest that the 20kHzbandwidth provided by a PCM channel using a sampling rate of 44.1kHz is inadequate. There is alsoconsiderable support for the observation that 48kHz digital audio sounds better than the same systemoperated at 44.1kHz. This suggests that the 44.1kHz system undershoots by at least 10%.
In the author’s opinion, the evidence fails to discriminate between the result of the filtering (genuinelistener response to audio content above 20kHz in air) and side effects of the filtering implementation. Avery recent report of certain experiments suggests that indeed the side effects are the real culprit [13].
The author has experienced listening tests which showed that the sound is degraded by the presence ofnormal (undithered) digital anti-alias and anti-image filters. He is also aware of careful listening testsindicating that any supersonic (i.e. >20kHz) content conveyed by 96kHz sampling is not detectableeither in the context of the original signal or on its own.
Other listening tests witnessed by the author have made it quite clear that the sound quality of a chain isgenerally regarded as better when it runs at 96kHz than when it runs at 48kHz, and that the differenceobserved is ‘in the bass’.
Why should this be? Two mechanisms are suggested: alias distortion and digital-filter artefacts.

9
1. Figures 22 and 23 show the frequency responses of commonly used analogue-to-digital and digital-to-analogue converters. In each case the stop-band attenuation of 80–100dB seems impressive. If weinvert this curve, however, we can see that a detectable in-band alias product may be generated bysignals in the transition region.
2. Most PCM listeners are listening to channels that do not preserve transparency in the digital filtersthemselves. Another way of putting this is that we cannot as yet reliably discriminate between thephase, ripple, bandwidth and quantisation side effects produced by the anti-alias and oversamplingfilters.
Many of the listening experiences that have raised questions about the HF response of the Red Bookchannel have involved band-limited material, speakers without significant supersonic response andlisteners with a self-declared lack of acuity at very high frequencies. It therefore seems probable that weshould concentrate even harder on the methods used to limit the bandwidth, rather than spending toomuch time considering the rapidly diminishing potential of program content above 20kHz.
This conclusion supports the development of high-resolution recording systems which capture theoriginal at a rate higher than 48kHz but do not necessarily distribute at so high a rate. Such a systemmight, for example, benefit from the anti-alias filters in a 96kHz ADC at capture, but use differentfiltering means to distribute at 48kHz, thereby reaping most of the benefits that could have beenobtained by using a chain that operated at 96kHz throughout3.
PSYCHOACOUSTIC DATA ON HIGH-FREQUENCY HEARINGThere is very little hard evidence to suggest that it is important to reproduce sounds above 25kHz.Instead there tends to be a general impression that a wider bandwidth can give rise to fewer in-bandproblems. However, there are a few points to raise before dismissing audible content above 20kHz asunimportant.
The frequency response of the outer and middle ear has a fast cut-off rate due to combined roll-off in theacoustics of the meata and in mechanical transmission. There also appears to be an auditory filter cut-off in the cochlea itself.
The cochlea operates ‘top-down’, so the first auditory filter is the highest in frequency. This filtercentres on approximately 15kHz, and extrapolation from known data suggests that it should have anoise bandwidth of approximately 3kHz. Middle-ear transmission loss seems to prevent the cochleafrom being excited efficiently above 20kHz.
Bone-conduction tests using ultrasonics have shown that supersonic excitation ends up in this first ‘bin’.Any supersonic information arriving at above 15kHz therefore ends up here, and its energy willaccumulate towards detection. It is possible that in some ears a stimulus of moderate intensity but ofwide bandwidth may modify perception or detection in this band, so that the effective noise bandwidthcould be wider than 3kHz.
The late Michael Gerzon surmised that any in-air content above 20–25kHz derived its significance fromnon-linearity in the hearing transmission, and that combinations of otherwise inaudible componentscould be detected through any resulting in-band intermodulation products.
There is a powerful caution against this. As far as the author knows, music spectra that have measuredcontent above 20kHz always exhibit that content at such a low spl that it is unlikely that the (presumed)lower spl difference distortion products would be detectable and not masked by the main content.
3 Interestingly, this is exactly how current DVD players work. 96kHz PCM material is carried at 96kHz on thedisc, but because there not yet standards for a 96kHz digital output, the players downsample to 48kHz (andusually 20 bits).

10
WHAT SHOULD THE SAMPLING RATE BE?Why should we not provide more bandwidth? The arguments are simply economic – a wider bandwidthrequires a higher data rate. For a given carrier, a higher data rate reduces playing time or the number ofchannels that can be conveyed.
To get another perspective on this question, we will take an interesting detour, but it requires two newconcepts. The upper curve in figure 24 shows the familiar human hearing threshold. Currentpsychoacoustic theory considers that this hearing threshold derives from two mechanisms. First, thebath-tub shape of the threshold is essentially due to the mechanical or acoustical response of the outer,middle and inner ear. Second, the threshold level itself is determined by ‘internal’ noise. The hearingsystem provides a continuous background noise – which is of neural or physiological origin – and whichdetermines the quietest sounds we can detect. Obviously, we do not hear this background noise becausethe brain normally adapts to ignore it!
However, if we were trying to understand human hearing as a communication channel, this noise-flooris one of the important parameters. Now, the threshold shape is not what engineers call the noisespectrum – but it is the effect of that spectrum. The difference comes from the fact that the humancochlea (inner ear) behaves as though it has a bank of internal filters. These filters are approximately1/3 octave wide above 1kHz, and the effect of these filters is to accumulate all the noise around them. Ifwe calculate the noise-spectrum that has the effect of the hearing threshold, we get the lower curve infigure 24.4
This plot shows a noise spectrum which has three fascinating properties:
• A noise exhibiting this spectral density will be either undetectable or, when its level is raised, will beequally detectable at all frequencies. This noise is uniformly-exciting at threshold.
• This noise spectrum, just below threshold, is the most intense in-band sound that we cannot hear.
• The ‘threshold noise-spectral-density (NSD)’ curve is an analogy to the internal noise of the hearingsystem.
Now, taking this last point we make a further step. Since this plot shows the effective noise floor of thehearing system, we can now attempt to specify a PCM channel that has the same properties (in order toestimate the information requirements of human hearing). The point of this being that if we can modelthe human hearing communication channel then, that channel must – by common sense – be theminimum channel we should use to convey audio transparently.
Figure 25 replots this auditory threshold on a dB vs linear frequency ‘Shannon plot’. The area boundedby the noise floor, maximum level (headroom) and maximum frequency in such a plot is a measure ofthe information or data capacity of the channel. When the noise floor and headroom are flat, we call it arectangular channel.
According to Shannon’s theory and to the Gerzon-Craven criterion for noise shaping [11], this floor canbe represented by an optimum minimum channel using noise shaping that conveys 11 bits at a samplingrate of 52kHz. This straightforward analysis, of course, overlooks the fact that if only 11 bits are usedthere will be no opportunity for any processing whatsoever, and no guard band to allow for differencesin system or room frequency response or between human listeners. In a sense the 52kHz 11-bitcombination describes the minimum PCM channel, using noise shaping, capable of replicating theinformation received by the ear. Transmission channels need to exceed that performance, so we canargue convincingly that a 58kHz sampling rate with 14 bits ought to be adequate, if in-band noiseshaping is used.
4 The detail of these steps are too complex for this article, and the interested reader is referred to [23] for moredetails

11
More interestingly, this simple analysis tells us that 52kHz is the absolute minimum desirable samplingfrequency. For comparison, figure 25 shows the channel space occupied by the CD. It also includes thenoise-spectral density of a 18.2-bit 96kHz channel without noise shaping, which is the minimum noisefloor that suggests transparency at that sampling rate.
The conclusion of this section, then, is that both psychoacoustic analysis and experience tell us that theminimum rectangular channel necessary to ensure transparency uses linear PCM with 18.2-bit samplesat 58kHz. The dynamic range must be increased according to the number of processes taking placebefore and after delivery, and the number of channels feeding into the room, so that we may converge on20 bits at 58kHz for 5 or more channels.
SAMPLING RATE ISSUESIf we were to be forced, right now, to specify a channel immune to criticism, we would have to:
• Increase the sample rate by a margin sufficient to move the phase, ripple and transition regionsfurther away from the human audibility cut-off. One could probably make a sensible argument forPCM sampled at 66.15kHz (44.1kHz times 1.5). The potential response is shown in figure 26.
• Increase the word length (to 20 bits, for example) so that the audible significance of quantisations,whether performed correctly or incorrectly, will be minimal.
Of course, with a higher sampling rate it is not strictly necessary to use a word length exceeding 16 bits.This is because the operating region of a 16-bit 88.2kHz (or higher, like 96kHz or even 192kHz)channel includes a large safely inaudible region within which noise shaping can be exploited (as figure25 clearly shows).
Given our current position, there are strong arguments for maintaining integer relationships withexisting sampling rates – which suggests that 88.2kHz or 96kHz should be adopted. This would not bean efficient way of conveying the relatively small extra bandwidth thought to be needed, but the impactof using these higher rates can be substantially reduced by using lossless compression (packing).
Although there is a small lobby that suggests even higher sample rates should be used – like 192kHz–the author disputes this; preferring to point out that when 96kHz channels have been correctly designedin terms of transmission, filtering, etc, that higher rates simply will not offer any benefit.
I realise that by expressing the requirement of transparent audio transmission – I am nailing a flag to themast and lay myself open to all kinds of attack! However, this analysis has been based on the bestunderstanding to date on this question and we should exceed this requirement only when there is nodetrimental cost to doing so.
CHANNEL CODINGSo now that we know what we want to convey, what is the most effective way of coding the audio fordistribution?
In their analysis of the coding question, the ARA concluded that uniform linear multibit PCM offeredthe following overwhelming benefits, against which other contenders should be judged:
• Uniform sampling and quantisation, which gives the option of scalability.
• Optimal dither offers effectively infinite time and amplitude resolution and is demonstrably linear,both mathematically and in practice.
• Pre-emphasis schemes based on psychoacoustics are easily incorporated.
• Stationary psychoacoustically based noise shaping is a straightforward optimisation technique.
• Transparent data compression is an option to save data.

12
It is plain that the distribution channel need not carry raw PCM; in fact the choices currently availableinclude:
1. PCM with sample rates between 32kHz and 192kHz and word sizes between 8 and 24 bits
2. PCM with pre-emphasis and de-emphasis optimisation
3. PCM using psychoacoustically optimised noise shaping to deliver higher resolution
4. PCM combining the techniques used in 2 and 3
5. PCM losslessly compressed (the ARA called this ‘packed PCM’)
6. PCM using losslessly cascadable lossy encoding
7. PCM compressed using a lossy method5
8. Bitstream coding
The ARA contended that current technology can guarantee transparency in a channel only if lossyperceptual coding (option 7 above) is not used.
Underlying this point is an extremely important observation. With the exception of bitstream coding(option 8 above), all the other systems start and end with linear PCM. Linear PCM, when correctlyused, provides an infinite-resolution (but noise-limited) representation of the output of a microphone. Inthis paradigm, we take the purist view that we want to convey as nearly as possible the ‘acousticwaveform’ of the original performance. By coding that waveform, we can attempt to replay the audio byreversing the process.
The ARA did admit some legitimate concessions to psychoacoustics: balanced limitation of bandwidthand dynamic range, and enhancing subjective resolution by using pre-emphasis or psychoacousticallyoptimised noise shaping (processes considered by the ARA committee to be effectively linear).
Looking at the other coding methods, lossless compression or packing of PCM is simply a method ofdelivering bit-accurate output data while reducing the quantity of data stored or the rate transmitted inthe channel. This is no different in concept to the well-known methods, like ZIP files, used in computersfor storing data in a smaller space – although the techniques for packing audio are quite different fromthose used for text and pictures.
Lossless compression is an important tool in the quest to optimise the resolution and deliverable soundquality of any channel. A suitable method of lossless compression has been described in [5, 6, 7, 15 and16].
The ARA strongly supported the use of lossless packing, not only because it permits very efficient useof data, but also because when data are compressed there is reduced correlation between bit patternsand audio data. This can lead to reduced levels of correlated jitter [9], which is a critical factor in high-resolution digital audio systems.
CHANNEL SAMPLE RATESWithout at this stage entering into a discussion of the ‘correct’ choice of sampling frequency, we shouldconsider the implications of figures 27, 28 and 29. It is already common practice for the recording chainto include sample-rate conversion inside ADCs and DACs.
For sample rates of 96kHz and above, designers of both lossy and lossless compression schemes haveconsidered reducing the fundamental word rate in the distribution channel, principally in order to alloweasy transmission through existing carriers or interfaces [14, 16]. A lossless processor, for example, canoffer at least 2:1 compression on most 96kHz audio material, effectively allowing the distributionsample rate to be halved as one expression of the reduced data rate.
5 Methods of this sort include psychoacoustically based variants such as DTS, MPEG and DolbyDigital.

13
In principle, this lowered rate can be treated in two ways:
• As a single compressed high-rate (96kHz) signal
• As a combination of a half-bandwidth version suitable for reproduction at the channel sample rate(e.g. 48kHz) with a high-frequency touch-up signal for highest-quality playback – either of whichmay use lossless or lossy encoding6 [15, 16]
The following sections review the various coding options listed earlier.
MULTIBIT PCMI have argued that if a well executed PCM channel is to guarantee transparency to a human listener, itwill require more than 16 bits and a sample rate higher than 48kHz. I have also pointed out that normalpractice still does not exploit the full potential of the current Red Book channel.
If we were to change the parameters purely according to audio considerations, then we might wellpropose 20 bits @ 66.15kHz. Such a channel would require a data rate of 1.4Mb/s, which is twice therate required by the current 44.1kHz 16-bit channel.
In fact, there are very strong practical reasons for maintaining 2:1 relationships with the Red Bookrelease format, with the current archive, or with video program (48kHz sampling). Realistically,therefore, the next useful sample rates for pure audio are 88.2kHz or 96kHz.
It should be clear that increasing the bandwidth as proposed will double the required data rate. Inconventional audio-engineering terms that could look like a bad deal, depending on one’s viewsconcerning both the value of the audio content above 20kHz and the desirability of setting standardsdefensively (using more data to cover up bad implementations).
So, now we shall examine the options for reducing the data requirements of channels that run rather toofast (e.g. at 96kHz).
PRE-/DE-EMPHASIS AT 96KHZThere are two linear and psychoacoustically correct coding methods for improving the performance oflinear-PCM channels, particularly if the distribution channel uses a word size smaller than that of theoriginal. These methods are:
• Noise shaping during a word-length reduction process to maintain a high effective dynamic range ina channel of fewer bits.
• The use of pre- and de-emphasis to match the channel capacity better to the energy spectrum ofmusic and to human hearing. (Noise shaping can also be combined very effectively with pre-/de-emphasis, particularly if the noise shaper is designed to exploit the pre-emphasis curve [3, 4, 12, 24,25]).
The use of pre- and de-emphasis to improve the subjective dynamic range of analogue channels is quitefamiliar to audio engineers. The method has been used with particular success in channels in which theanalogue noise level increases with frequency, as with magnetic tape, shellac or vinyl grooves and FMbroadcast. In each case, a well-documented property of music and speech is exploited: when material ofacoustic origin is microphoned at normal listening positions, the average and peak spectrum levelsdecline with frequency above a few kHz. It is therefore efficient to boost (pre-emphasise) high-frequency signals enough to make it more likely that they will occupy the channel’s capacity. De-emphasis is applied on replay or reception; it has the dual benefit of reducing both noise and distortionfrom the preceding chain.
6 This lossy method is used in the extended bandwidth schemes from DTS.

14
Although the use of pre-emphasis followed by de-emphasis began with analogue systems, the techniquesinvolved can very usefully be applied to digital channels. Meridian has shown with its 518 Processor,that when a link in the transmission chain requires a smaller word size (for example, when a 20-bitrecording is transferred to CD), very real benefit can be obtained by:
• performing pre-emphasis in the digital domain, and
• quantising with a noise shaper designed to exploit the pre-emphasis curve, and
• performing de-emphasis in the analogue domain (or in the digital domain to a larger word size digitalchannel).
So far, all standards for digital audio have permitted the use of pre- and de-emphasis. The universalcharacteristic is currently 50/15µS; it is shown in figure 30. This pre-emphasis characteristic makes anincrease in subjective dynamic range possible by boosting audio frequencies above 3kHz in thetransmission channel and attenuating them (and channel noise) on replay. It has not beenoverwhelmingly popular with the recording industry, principally because some closely-microphonedmaterial does not offer in-band high-frequency headroom and pre-emphasis brings a masteringmanagement issue because its use has to be flagged. (Once again a great potential overlooked by poorpractises.)
The ARA committee7 [2] proposed a new pre- and de-emphasis scheme8 to the DVD Forum for materialrecorded at rates higher than 88.2kHz. This method, combines a very suitable pre-emphasischaracteristic with a matched noise shaper, and is illustrated in figure 30.
Figure 31 shows the output noise spectrum after application of the proposed pre- and de-emphasis. Theattractions of this scheme include:
• Substantially improved high-audio-frequency headroom. (It is only reduced by 2dB at 15kHz,compared to 9dB in the current standard.)
• The pre-emphasis method involves a noise shaper that gives a 2.2-bit increase in overall audiodynamic range when used as a word-length-reduction device. In essence, channel capacity is movedfrom the extreme high-frequency range where it is not required, to the mid-band where it is incrediblyuseful.
• Because the noise shaper has the same shape as the pre-emphasis curve, the output (i.e. de-emphasised) noise spectrum is ‘white’.
• Analogue replay devices can match the de-emphasis very closely.
• This pre-emphasis can usefully be combined, with a matched high-advantage noise shapers such asthat shown in figure 32.
NOISE SHAPING AT 96KHZSince the use of higher sampling rates (such as 96kHz) allows the bandwidth of the channel comfortablyto exceed the high-frequency cut-off of human hearing, there are new options for noise shapers that arelow-coloration in the mid-band, but which also re-distribute the channel capacity in a more useful way.In one study [25], the author shows examples of noise shapers that can provide perceptual gains of upto 6 bits in a 96kHz channel!
The unique advantage of using noise shaping alone as a coding method of minimising data rate ormaximising the perceptual performance of a channel is that it requires neither equipment changes for
7 Robert Stuart, Peter Craven, Takeo Yamomoto, Malcolm Hawksford, Tony Griffiths, Michael Gerzon.
8 The exact details of this scheme were originally worked out by the late Michael Gerzon.

15
replay nor a decoder. It is fairly easy to design noise shapers that will provide the required dynamicrange in a 96kHz 16-bit channel.
PRE- EMPHASIS WITH NOISE SHAPING AT 96KHZThe pre- and de-emphasis scheme proposed by the ARA [2] includes an extension that combines anadditional matched psychoacoustic noise shaper with the pre-emphasis. The suggested noise-shapingcurve is shown in figure 32.
Figure 33 clarifies the way in which the suggested pre-emphasis combines with a noise shaper toprovide increased dynamic range. The headroom curves at the top show the de-emphasised responsenormalised for 16, 20 and 24-bit channels. The lower curve represents the noise spectrum of the shaperused, after correction to allow for the 2.2-bit gain achieved by the pre-emphasis scheme. Figure 33shows how a 16-bit channel at 96kHz can have an effective dynamic range of 23 bits in the critical4kHz region; note also that the channel is still offering 19-bit performance at 20kHz.
The de-emphasised noise floor is shown at the bottom of figure 33. Table 1 summarises the benefits pre-emphasis can offer.
LOSSLESS COMPRESSION OF PCMAny stream representing coded audio information is in principle compressible, for two basic reasons:
1. The full capacity of a rectangular channel is not occupied continuously by audio that conveysmeaning. This leaves room for simple techniques like noise shaping and pre- /de-emphasis to worksuccessfully.
2. Material of interest to human listeners contains some structure that can in part be predicted.
It is therefore possible to design a coding and decoding scheme that reduces the quantity of datatransmitted or stored.
Doubling the data rate from 48kHz to 96kHz to convey any less than twice the information isinefficient. One way of solving this problem elegantly is to use lossless coding in the channel. There aremany methods of implementing lossless coding; most are based on the use of prediction, which reducesthe quantity of data to be conveyed. An appropriate lossless compressor should:
• return the original data bit-for-bit intact
• be robust in dealing with errors in the channel
• be effective in reducing the data rate at high sampling rates (i.e. recognise supersonic content)
• control the peak data rate (a factor of importance in DVD replay)
The ARA proposal strongly recommends that high-quality audio channels should be losslessly coded(packed). Signal processing has advanced to such a state that the data-reduction benefits of this sort ofcoding are too good to pass by. Unlike perceptual or lossy data reduction, lossless coding does not alterthe final decoded transmitted signal in any way, but merely ‘packs’ the audio data more efficiently into alower data rate.
Existing lossless audio data compression systems are optimised for reducing average data rate, but notfor reducing the peak data rate, or for obtaining good results at high sampling rates such as 96kHz. Theprocess of packing PCM becomes more efficient as the sampling rate is increased. For example, packed96kHz audio does not double the data rate of packed 48kHz audio as you might expect; the increase ismore like 30%.
Lossless-coding can also allow the record producer can make a personal trade-off between playing time,frequency range, number of active channels and precision. The packed channel can convey this choiceimplicitly in its control data, and the system operation will be transparent to the user.

16
This arrangement has the following benefits:
• A producer mastering at 48kHz can control the incoming precision of each channel, and tradeplaying time or channels for noise floor
• A producer mastering at 96kHz can also trade bandwidth for playing time, active channels andprecision
Playing time or precision can be extended, for example, by:
a) pre-filtering information above 30kHz
b) supplying only a 2, 3 or 4-channel mix
Lossless packing offers an opportunity to make a much better product in that more precision and morechannels can be provided.
LOSSLESS CODING FOR DVDIt should be obvious that any lossless compression scheme will of its nature be more successful in somepassages than in others, so that the compressor’s output data rate will not be constant.
More recently, a lossless compression scheme has been developed, that is optimised for (but notexclusive to) DVD in that it delivers a constant data rate in the packed domain [5, 6, 7 and 15]. Thisscheme achieves lossless compression of high-resolution audio at sample rates including 96kHz. 16-bit96kHz-sampled audio signals can almost always be losslessly compressed to 8 bits, and 16-bit 48kHz-sampled signals to 12 bits, with exact reconstruction of the original on replay.
The properties of the lossless coding scheme proposed for DVD audio are as follows:
• Output data filled out to a constant data rate to meet disc constraints
• Output data rate generally lower than that of PCM input at 48kHz
• Output data rate significantly lower than that of PCM input at 96kHz
• Input word length continuously adjustable between 16 and 24 bits
• Bandwidth continuously adjustable between 22kHz and 48kHz, with efficient coding for theseoptions
• Good compression
• Seamless transition from lossless to lossy operation (if necessary)
• Extremely simple decoder
• Auxiliary data stream exactly synchronised to the audio
This scheme uses a simple hardware or software decoder that takes instructions from the bitstream. Thisallows great flexibility at the mastering stage, and the option of substituting a more sophisticatedencoder at some future stage in order to achieve better compression remains open.
Figure 34 shows the lossless encode/decode process. Bass-effects channels do not require specialhandling, as the encoder automatically makes bit-rate savings according to signal bandwidth. Theencoder core produces a data rate that varies with the audio signal, being greatest during peaks of hightreble energy. As the peak data rate is a limiting factor in DVD, the complete encoder includes a bufferthat smooths the peaks in the data rate. A corresponding buffer on the replay side allows peak data rateshigher than the DVD can handle to be delivered to the decoder core.
Table 2 shows the reductions in peak and average data rates achieved by the proposed losslesscompression scheme. These levels of compression very comfortably exceed the tentative projections putforward by Gerzon in the ARA proposal [1].

17
In DVD applications the peak data rate is the important parameter, whereas if hard-disc storage were inquestion the average rate would be the one to examine. At 44.1kHz or 48kHz the proposed scheme canalmost always reduce the peak data rate by at least 4 bits/sample in lossless mode, i.e. 16-bit audio canbe losslessly compressed so that it fits into a 12-bit channel. At 96kHz, it can reduce the peak data rateby 8 bits/sample in lossless mode, i.e. 24-bit audio can be compressed to 16 bits and 16-bit 96kHzaudio can be losslessly compressed so that it fits into an 8-bit channel.
These numbers indicate that lossless coding allows more channels to be transmitted in a given carrier.The following intriguing arrangements, for example, are possible:
1. Three channels of 44.1kHz 16-bit in a Red Book CD stream (allowing for example, Ambisonics tobe issued on CD)
2. Two channels of 88.2kHz in a Red Book CD stream
3. Four channels of losslessly compressed 24-bit 96kHz audio in a 6.144Mb/s DVD audio stream(currently only to channels fit)
4. 5.1 channels of losslessly compressed 20-bit 96kHz audio in a DVD audio stream
5. Eight channels of losslessly compressed 20-bit 48kHz audio in a DVD audio stream
LOSSY-ENCODED PCMLossy compression schemes attempt to evaluate the component of the microphone output that is‘irrelevant’ to human listeners (either because it falls outside the hearing threshold, or because it will bemasked by adjacent content) and try to convey the essence of the sound rather than the waveform. Now,perceptual coding is not a ridiculous idea – after all – that is exactly what happens in our hearingsystem. However, no-one in the ARA was prepared to accept that there is currently a lossy codingsystem that has absolutely stood any test of time in transparently delivering audio. Furthermore, ourcurrent understanding of human psychoacoustics is such that it would take a very brave (or foolish)person to suggest that we understand all we need to design a lossy compression coding scheme thatmeets the ARA requirements.
Looked at another way, it is very unlikely that we could use a data rate close to that found in theauditory cortex (c. 500kb/s) to transparently code the features we extract in normal listening. The datarate of the hypothetical noise-shaped PCM channel (52kHz @ 11-bit = 572kb/s per channel) is higherthan most lossy-compression contenders.
This is not to say at all that lossy compression is wrong, it is very useful. However, the simple pointbeing made is that if we are to convey the original music event with complete transparency, then ourcurrent understanding can offer nothing beyond passing all the captured data, bit-accurate, to the replaysystem.
The author freely admits that at some point in the future a lossy psychoacoustically-based codingscheme may prove to be audibly transparent. At the moment, however, the use of significant lossycompression in high-resolution systems simply cannot be advocated.
BITSTREAM CODINGIt has been suggested that suitable distribution formats include the single-bit, perhaps 64 timesoversampled data streams produced by modern-day converters (see figure 27) or even hybrid bitstreamssuch as 8 times oversampled 8-bit. The argument for the 1-bit scheme is that simple DACs complete thechain, so that the stages of digital filtering in the analogue–digital and digital–analogue converters canbe bypassed (see figures 27 and 28) and the bitstream signal preserves a superior archive.
The data rate of such a channel is high (around 3.1Mb/s), and even with lossless coding, bitstream.channels requires nearly three times the data required by the losslessly coded PCM equivalent.

18
Whilst it is not appropriate to go too deeply into the arguments for and against bitstream coding, thereare some very powerful negatives [10]9 – beginning with the fact that we should be aiming substantiallyhigher for the future than accepting a 1-bit 64x modulator. In fact, the best current-day converters use 4or 8-bit modulators. Furthermore, most recordings are multibit, and originate in a multibit DSPenvironment (for example, as a result of performing a mixing or editing function). So, if the capturingA/D converter uses a different modulator architecture (such as 4-bit 128x fs), or the recording ismultibit as an original, then it makes no sense to convert it to bitstream – especially as that process isinherently lossy and non-linear. The author firmly believes that it would be a very great mistake to try tostandardise the archive format, particularly to anything of such questionable audio promise as 64x fs 1-bit code.
Any attempt to introduce a low-bit distribution format would face a significant difficulty in that theindustry has no interfaces, DSP methods or machinery that would permit the change to be effectedgradually. In fact, the inherent simplicity of bitstream coding rapidly disappears when any subsequentoperations on the data are required.
Bitstream coding might be appropriate to very simple two-channel systems, but its data-rate requirementbecomes unacceptable when the needs of multichannel are taken into account. It is also difficult toguarantee perfect linearity when bitstream coders based upon delta-sigma modulation are used. This isbecause (unlike the multilevel quantiser with dither) a 2-level quantiser, even with dither, is not linear.Linearity is improved by negative feedback, but performance cannot be guaranteed for all signals.
BIT-BUDGET COMPARISONSThis article has reviewed a number of important features of the eight coding methods listed earlier.Because this we address the highest quality sound, current lossy compression schemes have been setaside as options. All the other options on the list can be engineered to provide equivalent resolution. Inthe context of real applications such as DVD, a crucial comparison is the quantity of data used by eachmethod. Channel coding that requires more data to convey the same sound quality uses up bandwidththat could have been used to convey more channels or higher-quality associated video information.
Table 3 shows a useful comparison. The base data rate is taken to be a 14-bit 58kHz channel, suggestedearlier. If the sample rates are limited to multiples of 48kHz, then a simple PCM rectangular channelusing 20 bits at 96kHz (example 5 in table 3) can meet the target performance.
When sampling is at 48kHz, the perceptually equivalent 21-bit channel (example 2 in table 3) uses 24%more data to convey less bandwidth than may be needed. Noise shaping with pre-emphasis (example 3)is close to 100% efficient, and its losslessly compressed version, at 106% efficient, is very effectiveindeed, allowing 8 nearly transparent channels to fit into a DVD audio stream.
96kHz sampling guarantees adequate bandwidth. Examples 5 and 9 show that raw 20 and 24-bitchannels use up to three times the base data rate and restrict a 6.144Mb/s stream to two or threechannels. Example 8 indicates how using the new pre-emphasis scheme alone increases efficiency, andwhen noise shaping is added (example 7) we see 60% efficiency, with four channels accommodated. ThePCM options have medium jitter susceptibility.
When lossless compression is used (example 10), efficiency rises to 70%, and 5 channels fit into theexample stream. The highest efficiency in this group (88%) is achieved by 30kHz band-limited losslesscompression (example 11 in table 3). The losslessly coded examples exhibit low jitter sensitivity.
The bitstream options (examples 15 and 16) have the lowest efficiency of all at 26%, are highlysusceptible to jitter and manage to fit only two channels into the example stream. With bitstream codingit is very difficult to offer multichannel audio or quality associated pictures.
9 Readers interested to see more of this can view a paper on bitstream coding by Professor Malcolm Hawksfordon the ARA website, at http://www.meridian-audio.com/ara.
19
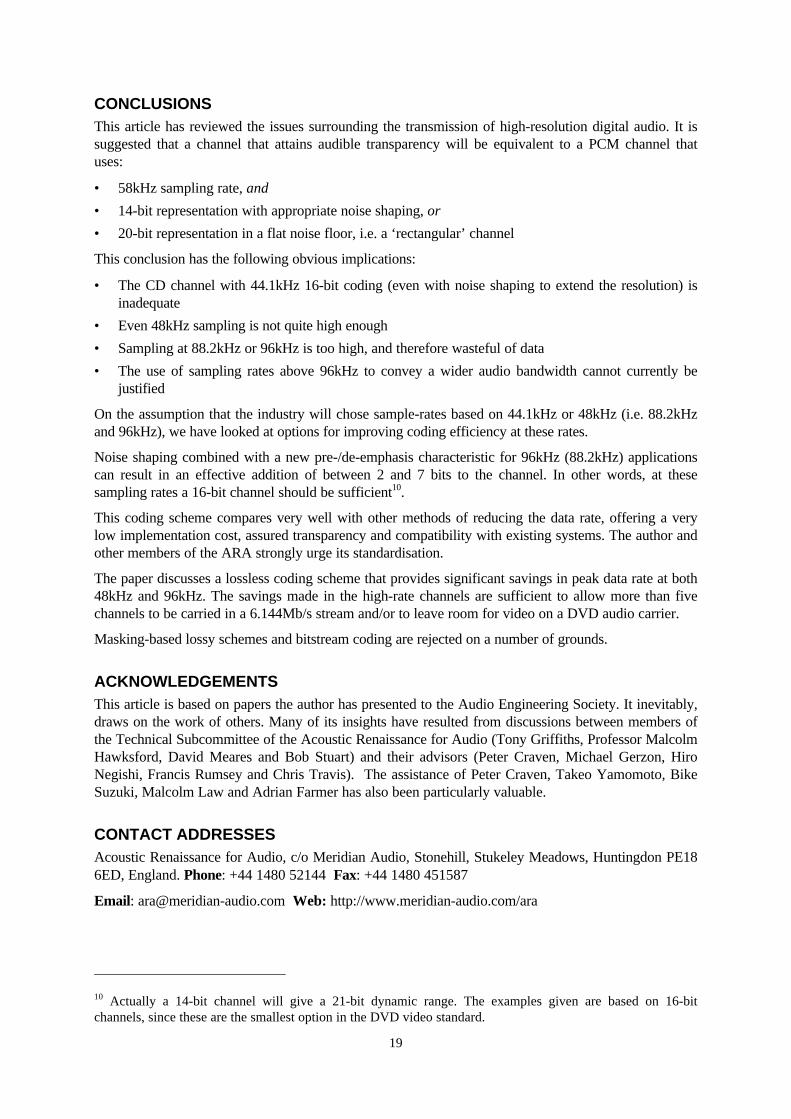
CONCLUSIONSThis article has reviewed the issues surrounding the transmission of high-resolution digital audio. It issuggested that a channel that attains audible transparency will be equivalent to a PCM channel thatuses:
• 58kHz sampling rate, and
• 14-bit representation with appropriate noise shaping, or
• 20-bit representation in a flat noise floor, i.e. a ‘rectangular’ channel
This conclusion has the following obvious implications:
• The CD channel with 44.1kHz 16-bit coding (even with noise shaping to extend the resolution) isinadequate
• Even 48kHz sampling is not quite high enough
• Sampling at 88.2kHz or 96kHz is too high, and therefore wasteful of data
• The use of sampling rates above 96kHz to convey a wider audio bandwidth cannot currently bejustified
On the assumption that the industry will chose sample-rates based on 44.1kHz or 48kHz (i.e. 88.2kHzand 96kHz), we have looked at options for improving coding efficiency at these rates.
Noise shaping combined with a new pre-/de-emphasis characteristic for 96kHz (88.2kHz) applicationscan result in an effective addition of between 2 and 7 bits to the channel. In other words, at thesesampling rates a 16-bit channel should be sufficient10.
This coding scheme compares very well with other methods of reducing the data rate, offering a verylow implementation cost, assured transparency and compatibility with existing systems. The author andother members of the ARA strongly urge its standardisation.
The paper discusses a lossless coding scheme that provides significant savings in peak data rate at both48kHz and 96kHz. The savings made in the high-rate channels are sufficient to allow more than fivechannels to be carried in a 6.144Mb/s stream and/or to leave room for video on a DVD audio carrier.
Masking-based lossy schemes and bitstream coding are rejected on a number of grounds.
ACKNOWLEDGEMENTSThis article is based on papers the author has presented to the Audio Engineering Society. It inevitably,draws on the work of others. Many of its insights have resulted from discussions between members ofthe Technical Subcommittee of the Acoustic Renaissance for Audio (Tony Griffiths, Professor MalcolmHawksford, David Meares and Bob Stuart) and their advisors (Peter Craven, Michael Gerzon, HiroNegishi, Francis Rumsey and Chris Travis). The assistance of Peter Craven, Takeo Yamomoto, BikeSuzuki, Malcolm Law and Adrian Farmer has also been particularly valuable.
CONTACT ADDRESSESAcoustic Renaissance for Audio, c/o Meridian Audio, Stonehill, Stukeley Meadows, Huntingdon PE186ED, England. Phone: +44 1480 52144 Fax: +44 1480 451587
Email: [email protected] Web: http://www.meridian-audio.com/ara
10 Actually a 14-bit channel will give a 21-bit dynamic range. The examples given are based on 16-bitchannels, since these are the smallest option in the DVD video standard.

20
FURTHER READING• Acoustic Renaissance for Audio, ‘DVD: Application of Hierarchically Encoded Surround Sound –
including Ambisonics’, private publication available for download at http://www.meridian-audio.com/ara (November 1996)
• Acoustic Renaissance for Audio, ‘High-Quality Audio Application of DVD’, Draft 0.5, privatepublication available for download at http://www.meridian-audio.com/ara (November 1996)
REFERENCES
1 Acoustic Renaissance for Audio, ‘A Proposal for High-Quality Application of High-Density CDCarriers’, private publication available for download at http://www.meridian-audio.com/ara (April1995). Reprinted in Stereophile (August 1995) and in Japanese in J. Japan Audio Soc., 35(October 1995)
2 Acoustic Renaissance for Audio, ‘DVD: Pre-emphasis for use at 96kHz or 88.2kHz’, privatepublication available for download at http://www.meridian-audio.com/ara (November 1996)
3 Akune, M., Heddle, R.M., and Akagiri, K., ‘Super Bit Mapping: Psychoacoustically OptimizedDigital Recording’, AES 93rd Convention, San Francisco, preprint 3371 (1992)
4 Craven, P.G., and Gerzon, M.A., ‘Compatible Improvement of 16-Bit Systems Using SubtractiveDither’, AES 93rd Convention, San Francisco, preprint 3356 (1992)
5 Craven, P.G., and Gerzon, M.A., ‘Lossless Coding for Audio Discs’, J. Audio Eng. Soc., 44, 706–720 (September 1996)
6 Craven, P.G., Law, M.J., and Stuart, J.R., ‘Lossless Compression using IIR prediction filters’, J.Audio Eng. Soc. (Abstracts), 44, p. 404 and preprint 4415 (March 1996)
7 Craven, P.G., and Gerzon, M.A., ‘Lossless Coding Method for Waveform Data’, InternationalPatent Application no. PCT/GB96/01164 (May 1996)
8 Dadson, R.S., and King, J.H., ‘A determination of the normal threshold of hearing and its relationto the standardisation of audiometers’, J. Laryngol. Otol., 66, 366–378 (1952)
9 Hawksford, M.O.J., and Dunn, C., ‘Is the AES/EBU/SPDIF Digital Audio Interface Flawed?’,AES 93rd Convention, San Francisco, preprint 3360 (October 1992)
10 Hawksford, M.O.J., ‘Bitstream versus PCM debate for high-density compact disc’, privatepublication available for download at http://www.meridian-audio.com/ara (April 1995)
11 Gerzon, M.A., and Craven, P.G., ‘Optimal Noise Shaping and Dither of Digital Signals’, 87thAES Convention, New York, preprint 2822 (1989)
12 Gerzon, M.A., Craven, P.G., Stuart, J.R., and Wilson, R.J., ‘Psychoacoustic Noise ShapedImprovements in CD and Other Linear Digital Media’, AES 94th Convention, Berlin, preprint3501 (March 1993)
13 Katz, B., ‘96kHz Listening Test’, thread on Internet newsgroup rec.audio.pro (July 1997)
14 Komamura, M., ‘Wideband and wide dynamic-range recording and reproduction of digital audio’,AES 96th Convention, Amsterdam, preprint 3844 (1994)
15 Meridian Audio Ltd, ‘Lossless Compression for DVD: Summary of features’, private publicationavailable for download at http://www.meridian-audio.com/dvd (July 1997)

21
16 Meridian Audio Ltd, ‘Lossless Compression for DVD: Technical proposal’, private publicationavailable for download at http://www.meridian-audio.com/dvd (July 1997)
17 Ohashi, T., Nishina, E., Kawai, N., Fuwamoto, Y., and Imai, H., ‘High Frequency Sound Abovethe Audible Range Affects Brain Electrical Activity and Sound Perception’, AES 91st Convention,New York, preprint 3207 (October 1991)
18 Ohashi, T., Nishina, E., Fuwamoto, Y., and Kawai, N., ‘On the Mechanism of Hypersonic Effect’,Proceedings Int'l Computer Music Conference, Tokyo, 432–434 (1993)
19 Oomen, A.W.J., Groenwegen, R.G., van der Waal, R.G., and Veldhuis, R.N.J. ‘A Variable-Bit-Rate Buried-Data Channel for Compact Disc’, J. Audio Eng. Soc., 43, 23–28 (January/February1995)
20 Robinson, D.W., and Dadson, R.S., in ISO131-1959
21 Robinson, D.W., and Dadson, R.S., ‘A redetermination of the equal-loudness relations for puretones’, Brit. J. Appl. Physics, vol. 7, pp. 166–181 (May 1956)
22 Stuart, J.R., and Wilson, R.J., ‘A search for efficient dither for DSP applications’, AES 92ndConvention, Vienna, preprint 3334 (1992)
23 Stuart, J.R., ‘Noise: Methods for Estimating Detectability and Threshold’, J. Audio Eng. Soc., 42,124–140 (March 1994)
24 Stuart, J.R., and Wilson, R.J., ‘Dynamic Range Enhancement Using Noise-shaped Dither Appliedto Signals with and without Pre-emphasis’, AES 96th Convention, Amsterdam, preprint 3871(1994)
25 Stuart, J.R., and Wilson, R.J., ‘Dynamic Range Enhancement using Noise-Shaped Dither at 44.1,48 and 96 kHz’, AES 100th Convention, Copenhagen (1996)
26 Stuart, J.R., ‘Auditory modelling related to the bit budget’, Proceedings of AES UK Conference‘Managing the Bit Budget’, 167–178 (1994)
27 Vanderkooy, J., and Lipshitz, S.P., ‘Digital Dither: Signal Processing with Resolution Far Belowthe Least Significant Bit’, AES 7th International Conference – Audio in Digital Times, Toronto,87–96 (1989)

ADC Archivechannel
Mix channel
Carrier
Replaychannel
DAC
Figure 1. Block diagram of a reproducing chain.
Recording(20-bit)
Edit(24-bit)
Carrier(16-bit)
Playback(20-bit)
Figure 2. Block diagram showing example word sizes in a high quality replay chain.
Sample/hold
Anin
Modulator Decimator PCMout
BSout
Figure 27. Block diagram of delta-sigma analogue-to-digital converter.
24
Figure 8. A simplistic view of a distribution channel.

23
ReQuantise20EQ 32-
64
Figure 9. A more usual distribution channel.
Interpolation(x8)
PCMin
Delta-SigmaModulator
1 bitDAC
Out
Figure 28. Block diagram of delta-sigma digital-to-analogue converter.
10Hz 100Hz 1kHz 10kHz
0
20
40
60
80
100
120
dB spl
Frequency
Audibile CD noise
Hearing Threshold
Maximum level
Figure 10. Dynamic range of CD.

24
10Hz 100Hz 1kHz 10kHz
0
20
40
60
80
100
120
Audibile FM noise
Hearing threshold
Maximum level
dB spl
Frequency
Figure 11. Dynamic range of FM.
Figure 12. Dynamic range of LP.

25
100Hz 1kHz 10kHz0
20
40
60
80
100
120
0.1%
0.3%
10%
3%
1%
3%
10%
30%
dB spl
Frequency of fundamental
Figure 3. A contour map showing the existence regions for detecting the presence of an added second-harmonic tone. The spl is of the fundamental frequency. Inside a contour, 2nd-harmonic distortion ofthe marked percentage should be audible.
100Hz 1kHz 10kHz0.01%
0.1%
1%
10%
100%
Parameter is dB spl of tone pair
30
5090
80
70
60
40
20
Diff
ere
nce
tone le
vel
Frequency Difference
Figure 4. Illustrating predicted detectability of a difference-tone resulting from non-linearprocessing. See text. The parameter is spl of the combination.

26
Modulator(6.2MHz)
Filter(96kHz)
Edit(96kHz)
Encoder(48kHz)
Decoder(96kHz)
Upsample(3.1MHz)
Modulator(3.1MHz)
Channel(48kHz)
Figure 29. Block diagram showing example of a chain with non-uniform sampling rate.
0Hz 5kHz 10kHz 15kHz 20kHz 25kHz
20dB
div
isio
ns
Figure 5. FFT analyses of an undithered 16-bit quantisation of a 1kHz tone at –20, –40, –60, –80and at –90dBFS (top to bottom). Curves offset by 25dB.

27
5kHz 10kHz 15kHz 20kHz
-140dB
-120dB
-100dB
-80dB
Dithered quantisation Truncated quantisation
Figure 6. FFT measurements of the spectrum that results when a –90dBFS 1kHz tone is quantised to a16-bit format, with and without correct (triangular probability distribution) dither.
10Hz 100Hz 1kHz 10kHz
-20
0
20
40
60
80
100
Hearing threshold
20
18
16
dB
sp
l
Figure 7. Audible significance of the noise created by a single white-spectrum TPDF-ditheredquantisation in channels using 16, 18 and 20 bits. Audibility has been plotted against the averagehuman hearing threshold assuming that a full-scale signal can attain 120dB spl at the listeningposition.

28
10Hz 100Hz 1kHz 10kHz
-20
0
20
40
60
80
100
dB s
pl-90dBFS quantisations
with TPDF dither no dither
Hearing threshold
Figure 13. Audible significance of dithered and undithered 16-bit 44.1kHz sampling of a 1kHz –90dBFS (i.e. 30dBspl) tone. (0dBFS ≡ 120dBspl.)
10Hz 100Hz 1kHz 10kHz
-20
0
20
40
60
80
100
dB s
pl
Two successive Quantisations: 1 with + 1 without dither
Hearing threshold
Figure 14. Audible significance of an undithered 16-bit 44.1kHz sampling of a 1kHz –90dBFS (i.e.30dBspl) tone on a signal already correctly quantised to 16 bits.

29
10Hz 100Hz 1kHz 10kHz
-20
0
20
40
60
80
100
dB s
pl
Successive Quantisations: 1 with + 4 without dither 1 with + 1 without dither
Hearing threshold
Figure 15. Audible significance of one (lower) and four (upper) successive undithered 16-bit 44.1kHzresamplings of a 1kHz –90dBFS (i.e. 30dBspl) tone on a signal already correctly quantised to 16 bits.
-20
0
20
40
60
80
100
dB s
pl
10Hz 100Hz 1kHz 10kHz
LP groove noise
Undithered CD channel Hearing threshold
Figure 16. Audible significance of four (lower) successive undithered 16-bit 44.1kHz resamplings of a1kHz –90dBFS (i.e. 30dBspl) tone on a signal already correctly quantised to 16 bits, contrasted withthe audible significance of noise floor measured on a silent LP groove.

30
10Hz 100Hz 1kHz 10kHz
-20
0
20
40
60
80
100
Hearing thresholddB s
pl
Frequency
LSB20 Proc.2.20 Proc.5.20
Figure 17. Audible significance of the noise created by 1, 2 and 5 successive TPDF-ditheredquantisations in a 20-bit channel.
10Hz 100Hz 1kHz 10kHz
-20
0
20
40
60
80
100
dB s
pl
Successive quantisations at 20bit 1 with and 4 without dither
Hearing threshold
Figure 18. Audible significance of one (lower) and four (upper) successive undithered 20-bit 44.1kHzresamplings of a 1kHz –90dBFS (i.e. 30dBspl) tone on a signal already correctly quantised to 20 bits.

31
10Hz 100Hz 1kHz 10kHz-20
0
20
40
60
80
100
dB s
pl
16 bit
N1,9D
N2,9
Hearing threshold
Figure 19. Audible significance of a simple 16-bit channel, with two examples from [24] of theaudible significance of noise shaping in a 16-bit channel.
10Hz 100Hz 1kHz 10kHz
-20
0
20
40
60
80
100
Hearing threshold
20
18
16
dB s
pl
Frequency
Figure 20. As figure 7, but showing how individual hearing thresholds can vary.

32
10Hz 100Hz 1kHz 10kHz
-20
0
20
40
60
80
100
120
140
DAC at 44.1 and 48kHz
Hearing thresholds
dB s
pl
Frequency
Figure 21. The useful region of CD. Frequency response at 44.1kHz is shown against the audiblesignificance of the noise floor of a 16-bit channel. Average and acute hearing thresholds are alsoplotted.
10kHz
-20
0
20
40
60
80
100
120
140
dB s
pl
Frequency
Hearing thresholds
DAC at 44.1 and 48kHz
16 bit noisefloor
Figure 22. The high-frequency range of figure 21.

33
10Hz 100Hz 1kHz 10kHz
-20
0
20
40
60
80
100
120
DAC Response
ADC Response
Hearing threshold
dB s
pl
Frequency
LSB20 Proc.2.20 Proc.5.20
C
Figure 23. Useful operating region of a well-engineered 20-bit channel. The audible significance ofnoise created by 1, 2 and 5 successive quantisations is shown.
0Hz 10kHz 20kHz 30kHz 40kHz-40
-20
0
20
40
60
80
100
120
140
Threshold NSD 11 bits @ 52kHz CD Channel 18.2 bits @ 96kHz Noise shaper
dB spl
0Hz 10kHz 20kHz 30kHz 40kHz
-40
-20
0
20
40
60
80
100
120
140
Figure 25. The ‘Shannon space’ for human hearing.

34
10Hz 100Hz 1kHz 10kHz-40
-20
0
20
40
60
80
100
120
140
Uniformly-Exciting Noise at Threshold Minimum Audible Field
dB spl
Figure 24. The derivation of uniformly exciting noise at threshold.
100Hz 1kHz 10kHz 100kHz
-40
-20
0
20
40
60
80
100
120
dB s
pl
Frequency
22bit @ 96k
20bit @ 96k
16bit noise @ 96k
Hearing thresholds
DAC at 66.15 and 96kHz
Figure 26. Useful operating regions of channels using 96kHz and 66.15kHz sampling. The figureshows that both rates allow for a near-audible HF region in which more gentle filtering could beused. The audible-significance channel-noise curves are given for 96kHz and for 16, 20 and 22-bitword lengths.

35
0 10k 20k 30k 40k 50k-18
-12
-6
0
6
12
18
24
30
36
42
48
Proposed 96kHz Pre-emphasis 50+15uS Pre-emphasis 96kHz Pre-emphasis Noise-shape
dB
Frequency Hz
Figure 30. The proposed pre-emphasis compared to 50µS / 15µS, and the noise spectrum resultingfrom the pre-emphasis noise shaper.
100 1k 10k-4
-2
0
2
4
6
8
10
12
14
16
18
18.1 Bits
Headroom Noise spectrum
Bits
Frequency Hz
Figure 31. Output noise spectrum and headroom for a channel after application of the proposed pre-and de-emphasis. The graph expresses dynamic range in bits. This example illustrates a capacity of18.1 bits at 4kHz for a 16-bit channel, i.e. a perceptual gain of 2.1 bits.

36
0 10k 20k 30k 40k 50k-36
-30
-24
-18
-12
-6
0
6
12
18
24
30
36
42
Example Noise Shaper
dB
Frequency Hz
Figure 32. An example of a 6th-order noise shaper that can be combined with the proposed pre-emphasis scheme.
0 10k 20k 30k 40k 50k-8
-4
0
4
8
12
16
20
24
28
18.8 Bits
22.9 Bits
Bits
Frequency Hz
Figure 33. Output noise spectrum and headroom for a channel after the example 6th-order noiseshaper has been combined with the proposed pre- and de-emphasis. The graph expresses the dynamicrange in bits. The example illustrates a capacity of almost 23 bits at 4kHz for a 16-bit channel, i.e. aperceptual gain of 7 bits.

37
Lossless encoder
Losslessencoder
core
24
24
24
24
24
buffer
DVD
{naudio
channels
auxiliarydata
DVD
naudio
channelsout
auxiliarydata
}Lossless decoder
Losslessdecoder
corebuffer
24
24
24
24
24
Figure 34. Lossless encoder and decoder for DVD, each consisting of the core algorithm followed (inthe encoder) or preceded (in the decoder) by a smoothing buffer.
.
Method 48kHz 96kHz
Pre-emphasis 3dB (0.5-bit) 12dB (2-bit)
Noise shaping 16dB (2.7-bit) 30dB (5-bit)
Pre-emphasis + Noiseshaping
21dB (3.5-bit) 42dB (7-bit)
Table 1. Coding benefits of pre-emphasis, noise shaping and a combination using both schemesdescribed.
Data-rate reduction: bits/sample/channel
Sampling kHz Peak Average
48 4 5 – 11
96 8 9 – 11
Table 2 Reduction in data rates when the proposed lossless compression scheme is used. The savings

38
Coding Examples for 2 channels
# fs Precision Noise- Pre- Lossless Rate Efficiency Channels Jitter
kHz Bits shape emphasis Mb/s @6.144
1 58 14 Y N N 1.62 100% 7 Medium
2 48 21 N N N 2.02 81% 6 Medium
3 48 18 Y Y N 1.73 94% 7 Medium
4 48 20 N N Y 1.54 106% 8 Low
5 96 20 N N N 3.84 42% 3 Medium
6 96 16 Y N N 3.07 53% 4 Medium
7 96 14 Y Y N 2.69 60% 4 Medium
8 96 18 N Y N 3.46 47% 3 Medium
9 96 24 N N N 4.61 35% 2 Medium
10 96 20 N N Y 2.30 70% 5 Low
11 96 20 N N Band 1.84 88% 6 Low
12 96 18 N Y Y 1.92 85% 6 Low
13 96 24 Y N Adapt 2.21 74% 5 Low
14 96 18 N Y Y 1.92 85% 6 Low
15 3072 1 N N N 6.14 26% 2 High
16 384 8 N N N 6.14 26% 2 High
Table 3. Data-rates, relative efficiencies and jitter susceptibility of a number of coding options. Thetable also shows the number of whole channels that can be fitted into a 6.144Mb/s stream.

![AUDIO CODING STANDARDS - mp3-tech.org · The advances of audio coding techniques and the ... 1992], and the Dolby AC-3 [Todd, 1994] algorithm. “Audio Coding Standards,” A chapter](https://static.fdocuments.in/doc/165x107/5aefb0d47f8b9ac2468d26b7/audio-coding-standards-mp3-tech-advances-of-audio-coding-techniques-and-the-.jpg)

![ATSC Video and Audio Coding[1]](https://static.fdocuments.in/doc/165x107/577ce7441a28abf10394b704/atsc-video-and-audio-coding1.jpg)