
Codes and Standards Final Report - CALMAC€” Statewide Codes and Standards Market Adoption and...
155
Final Report CPUC Program No. 1134-04 SCE0224.01 Statewide Codes and Standards Market Adoption and Noncompliance Rates Prepared for: Southern California Edison May 10, 2007
Transcript of Codes and Standards Final Report - CALMAC€” Statewide Codes and Standards Market Adoption and...

Final Report CPUC Program No. 1134-04
SCE0224.01
Statewide Codes and StandardsMarket Adoption andNoncompliance Rates
Prepared for:Southern California Edison
May 10, 2007
Quantec Offices
720 SW Washington, Suite 400Portland, OR 97205(503) 228-2992; (503) 228-3696 faxwww.quantecllc.com
Printed onrecycled paperPrinted onrecycled paper
3445 Grant St.Eugene, OR 97405(541) 484-2992; (541) 683-3683 fax
28 E. Main St., Suite AReedsburg, WI 53959(608) 524-4844; (608) 524-6361 fax
1722 14th St., Suite 210Boulder, CO 80302(303) 998-0102; (303) 998-1007 fax
20022 Cove CircleHuntington Beach, CA 92646(714) 287-6521
Prepared by:M. Sami Khawaja, Ph.D.
Allen Lee, Ph.D.Michelle Levy
Quantec, LLC
In association with:Lynn Benningfield
The Benningfield Group
K:\2006 Projects\2006-27 (SCE) Codes and Standards\Report\SCE_Draft_Report_021507.doc

Quantec — Statewide Codes and Standards Market Adoption and Noncompliance Rates i
Table of Contents
1. Executive Summary ...................................................................................1Initial Market Penetration and Naturally-Occurring Market Adoption ...............................1Building Standards Noncompliance ....................................................................................4Appliance Standards Noncompliance ..................................................................................6
2. Introduction and Overview......................................................................11
3. Initial Market Penetration and Naturally Occurring Market Adoption .13Introduction........................................................................................................................13Methodology......................................................................................................................13Data and Findings ..............................................................................................................26
4. Building Standards Noncompliance.......................................................47Background ........................................................................................................................47Research Methodology ......................................................................................................48Compliance “Scoring” .......................................................................................................57Results................................................................................................................................57
5. Appliance Standards Noncompliance....................................................65Introduction and Background ............................................................................................65Data Collection and Analysis Strategy ..............................................................................67Consumer Electronics: Televisions....................................................................................73Consumer Electronics: DVDs............................................................................................75Residential Pool Pumps .....................................................................................................77General Service Incandescent Lamps ................................................................................81Metal Halide Luminaires ...................................................................................................84Walk-In Refrigerators/Freezers .........................................................................................88Pre-Rinse Spray Valves .....................................................................................................90Nonresidential Duct Heaters and Unit Furnaces................................................................94Refrigerated Beverage Vending Machines ........................................................................97
6. Adjustments to Savings Estimate Spreadsheet....................................99Initial Penetration and Naturally Occurring Market Adoption ..........................................99Noncompliance Rates ......................................................................................................101
7. Lessons Learned and Recommendations for Future Research........103

Quantec — Statewide Codes and Standards Market Adoption and Noncompliance Rates ii
Initial Penetration and Naturally-Occurring Market Adoption........................................103Building Standards Noncompliance ................................................................................105Appliance Standards Noncompliance ..............................................................................108
Appendix A: Adoption Curve Expert Identification and ContactInformation..............................................................................................111Pool Pumps ......................................................................................................................111Incandescent Lamps.........................................................................................................111Metal Halides ...................................................................................................................112Pre-rinse Spray Valves .....................................................................................................112Consumer Electronics: TVs, DVDs, and Compact Audio Players ..................................113Unit Heaters/Duct Furnaces.............................................................................................113Hardwired Residential Lighting.......................................................................................113Daylighting For Commercial Buildings...........................................................................113Residential and Commercial HVAC Ducts .....................................................................114
Appendix B: Appliance Noncompliance Site-by-Site Information .........115Televisions .......................................................................................................................115DVDs ...............................................................................................................................120Residential Pool Pumps ...................................................................................................127General Service Incandescent Lamps ..............................................................................133Metal Halides ...................................................................................................................139Walk-In Refrigerators/Freezers .......................................................................................140Unit Heaters and Duct Furnaces ......................................................................................144Refrigerated Beverage Vending Machines ......................................................................149

Quantec — Statewide Codes and Standards Market Adoption and Noncompliance Rates 1
1. Executive Summary
For over thirty years, the California Energy Commission has worked to advance energyefficiency through promulgation of energy codes and standards for buildings and appliancesknown as Title 20 (appliances) and Title 24 (buildings). These standards are updated periodicallyto reflect the emergence of new energy-efficiency technologies and methods.
The California Statewide Codes and Standards Program (C&S Program, or Program) isimplemented by the state’s investor-owned utilities and seeks to improve energy efficiency byinfluencing the periodic updates to the Title 20 and Title 24 standards. A consortium ofrepresentatives from each of the investor-owned utilities, called the Stakeholder ReviewCommittee (SRC), works to propose the updates and monitor changes in energy use and markettrends as a result of the codes. The most recent round of updates to the standards went into effectin late 2005 for the building standards, and in the period 2006-2008 for the appliance standards.
Past studies have worked to estimate the energy savings attributable to the Program, but due to alack of empirical data, have typically assigned estimated, place-holder values for three keyinfluencing factors:
Initial market penetration and naturally occurring market adoption
Noncompliance rate for selected building measures
Noncompliance rate for selected appliances
These parameters are key factors in the calculation of the savings attributed to the Program andare entries in the Savings Estimate Spreadsheet that was created by the Heschong MahoneGroup, Inc.
The goal of the study, conducted by Quantec, LLC, was twofold: 1) to refine the originalestimates made of noncompliance, initial market penetration, and naturally occurring marketadoption rates by researching and analyzing the factors contributing to each parameter; and 2) totest the 2006 California Energy Efficiency Evaluation Protocols (Evaluation Protocols) as itapplies to determining net savings resulting from Program activities. This study was not intendedto be an evaluation of the Program and did not revise the gross savings estimates or any savingsinputs into the Savings Estimate Spreadsheet other than those listed above. In addition,modifying the spreadsheet was not in the research scope.
Initial Market Penetration and Naturally-Occurring MarketAdoption
In order to improve the Savings Estimate Spreadsheet’s assessment of the energy impacts of theintroduction of new Title 20 and 24 standards, this analysis was designed to research andestablish refined estimates for:

Quantec — Statewide Codes and Standards Market Adoption and Noncompliance Rates 2
1) The initial market penetration of appliances and building measures meeting the standards
2) The future market adoption trends of these items if the standards had not beenimplemented, i.e., the naturally-occurring market adoption rates
Research Methodology
Our approach for estimating both initial market penetration and naturally-occurring marketadoption was to solicit expert opinions to estimate a market adoption curve, using a typical S-shaped curve. We chose the Bass model to approximate the process.
We used a unique approach to obtain expert judgment about the market adoption curve. Aninteractive web-based tool was created that allowed experts to use sliders moved by their mouseto input their selection of leading and following behavior and maximum market penetrationparameters. They were able to view the adoption curve in real time and make adjustments untilthey were satisfied with its shape. The web tool was interactive in real time as it enabled thefollowing:
1) Allowed the experts to see the shape of the diffusion into the market over time: As theexpert moves the sliders that determine the values of the three needed parameters,(leading behavior, following behavior, and maximum market penetration), the curvestarts to take shape on the screen.
2) Provided the expert with a verbal description of the selected shape: Once the expertdecides the shape looks right, he or she clicks a selection button and a verbal descriptionof the curve is displayed. For example, the description might be that the selected curveimplies that the market penetration will never exceed 50%, current market penetration isat 20%, and the market is expected to take off in three years.
When the expert is satisfied with the shape and the verbal translation, the selection is submittedand the data are saved. All opinions are aggregated to produce the average S curve using amathematical procedure that best fits the average values at each point. A second round allowedthe participating experts to review the average curve, and provide feedback on the differencesbetween their curve and the average. Based on this feedback and follow-ups with theparticipants, we finalized the naturally occurring market adoption curve.
A subset of the building measures and appliances covered by the new Title 24 and 20 standardswas selected for analysis and these are shown in Table 1. This subset was selected primarilybased on their contribution to total expected first year savings. The expected savings, number ofexperts targeted for this study, and number of experts who participated are shown in Table 1.

Quantec — Statewide Codes and Standards Market Adoption and Noncompliance Rates 3
Table 1. Market Adoption Analysis Building Measures, Appliances, and Experts
Targeted Number of ExpertsTitle 20 and 24 Measures and Appliances First-year Savings,
GWh Equivalent Manufacturers/Distributors Contractors
Number of ExpertsParticipating
Hardwired lighting, new residential 65 - 8 3Lighting controls under skylights, new 26 - 8 3Duct improvement, residential existing 16 - 8 3Ducts, nonresidential existing 19 - 8Consumer electronics-TVs 68 6 - 5Consumer electronics-DVDs 12 6 - 4Consumer electronics-audio players 53 6 - 4Residential pool pumps, 2-speed, Tier II 130 6 6 7Pulse start metal halides 49 6 - 7General service incandescent 79 6 - 4Commercial dishwasher spray valves 76 3 - 4Unit heaters/duct furnaces 19 6 - 5
Results
Table 2 summarizes the results of these analyses. For each high efficiency measure andappliance, the table shows the year from which the adoption curve analysis starts, the 2006estimated market penetration, and the estimated naturally-occurring market adoption rates fortwo representative years, 2015 and 2030. It is important to note that the estimates of marketbehavior presented in Table 2 stemmed from the informed opinions of a relatively small sampleof industry experts. These data are qualitative in nature, and represent the best point estimatesavailable at this time. Since a key objective of this study was to test the Evaluation Protocols,these results serve the dual purpose of providing improved Savings Estimate Spreadsheetestimates, as well as demonstrating the effectiveness of the chosen approach and offering keylessons for future research (as outlined below).

Quantec — Statewide Codes and Standards Market Adoption and Noncompliance Rates 4
Table 2. Initial Market Penetration and Naturally Occurring Adoption Results
Naturally Occurring MarketAdoption, %Title 20 and 24 Measures and
Appliances
MarketIntroduction
Year
Initial MarketPenetration
2006, % 2015 2030Hardwired lighting, new residential 2000 8 35 56Lighting controls under skylights, new 2000 7 38 51Duct improvement, residential existing 1990 10 17 19Ducts, nonresidential existing 1990 2 7 19Consumer electronics-TVs 2000 41 76 83Consumer electronics-DVDs 2000 24 58 61Consumer electronics-audio players 2000 26 46 50Res pool pumps, 2-speed, Tier II 1995 6 23 33Pulse start metal halides 1992 26 46 57General service incandescents1 1970 47 50 52Commercial dishwasher spray valves 1985 25 41 51Unit heaters/duct furnaces 1965 50 58 65
Building Standards Noncompliance
As with initial market penetration and naturally occurring market adoption, the development ofthe Savings Estimate Spreadsheet used placeholder values for building standards noncompliancerates; this value was 30% for all measures.
Research Methodology
Data were collected via a combined approach of reviewing building department records andconducting site visits at a sample of buildings to estimate the noncompliance rates. The buildingmeasures investigated are shown in Table 3.
Building departments were selected to represent a mix of projects and climate zones across thestate (nine building departments in Arcata, Ceres, Elk Grove, Sonoma County, Paso Robles,Anaheim, Fullerton, Riverside County, and San Diego).
In total, 418 records were examined, representing 437 measures. Of those, a total of 395measures had permits that were available for complete review.
Sample sizes were drawn with the goal of yielding statistically defensible results for each of theidentified measures with 90% confidence ±10%. Actual precision levels ranged from ± 1% to±10%.
Beyond the noncompliance values themselves, this study also provided valuable insight into thevarying building department processes and procedures in place across the state.
Quantec — Statewide Codes and Standards Market Adoption and Noncompliance Rates 5
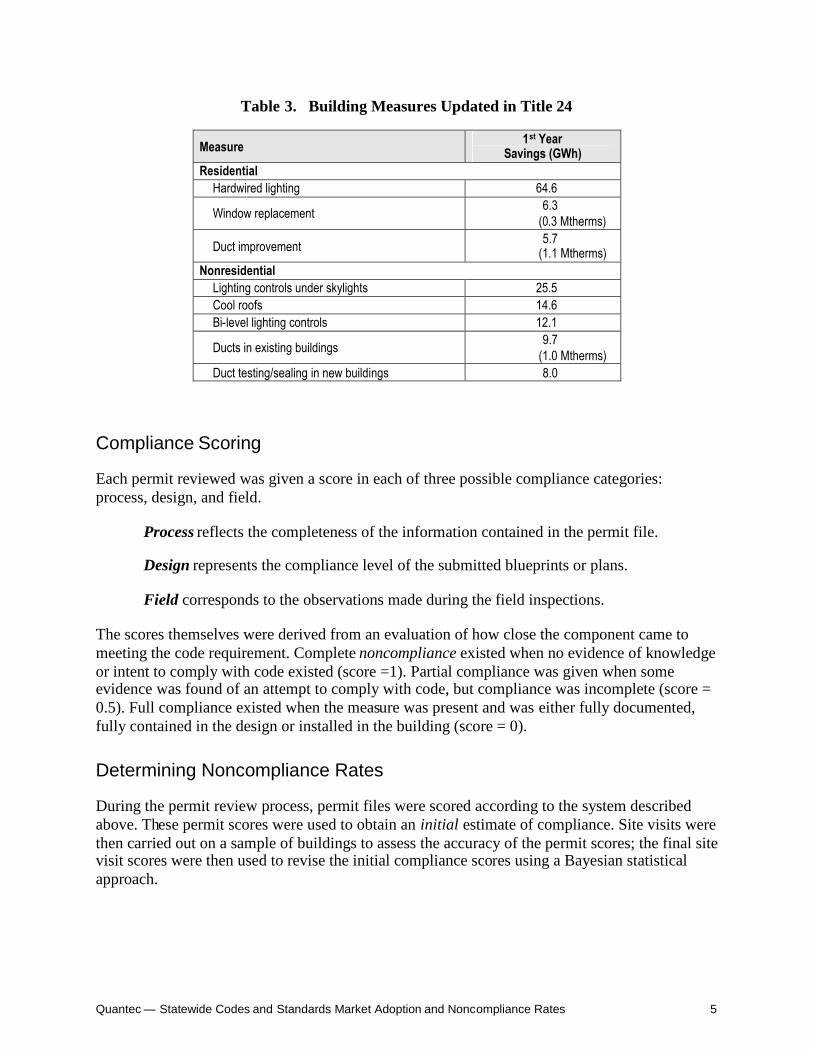
Table 3. Building Measures Updated in Title 24
Measure 1st YearSavings (GWh)
ResidentialHardwired lighting 64.6
Window replacement 6.3(0.3 Mtherms)
Duct improvement 5.7(1.1 Mtherms)
NonresidentialLighting controls under skylights 25.5Cool roofs 14.6Bi-level lighting controls 12.1
Ducts in existing buildings 9.7(1.0 Mtherms)
Duct testing/sealing in new buildings 8.0
Compliance Scoring
Each permit reviewed was given a score in each of three possible compliance categories:process, design, and field.
Process reflects the completeness of the information contained in the permit file.
Design represents the compliance level of the submitted blueprints or plans.
Field corresponds to the observations made during the field inspections.
The scores themselves were derived from an evaluation of how close the component came tomeeting the code requirement. Complete noncompliance existed when no evidence of knowledgeor intent to comply with code existed (score =1). Partial compliance was given when someevidence was found of an attempt to comply with code, but compliance was incomplete (score =0.5). Full compliance existed when the measure was present and was either fully documented,fully contained in the design or installed in the building (score = 0).
Determining Noncompliance Rates
During the permit review process, permit files were scored according to the system describedabove. These permit scores were used to obtain an initial estimate of compliance. Site visits werethen carried out on a sample of buildings to assess the accuracy of the permit scores; the final sitevisit scores were then used to revise the initial compliance scores using a Bayesian statisticalapproach.

Quantec — Statewide Codes and Standards Market Adoption and Noncompliance Rates 6
Results
Through this study, we found that noncompliance values varied widely by measure, rangingfrom 21% for hardwired lighting to 100% for nonresidential ducts (both new and retrofit). Thenoncompliance estimates for each measure studied are displayed in Table 4.
Table 4. Summary of Building Measure Noncompliance Estimates
Building Measure EstimatedNoncompliance rate
Precision ofEstimate
ResidentialHardwired lighting 28% 3%Window replacement 68% 7%Duct improvement 73% 1%NonresidentialLighting controls under skylights 44% 10%Cool roofs 50% 3%Bi-level lighting controls n/a n/aDucts in existing buildings 100% 2%Duct testing/sealing in new buildings 100% 1%
We note that, since this study began shortly after the implementation of the updated 2005building codes, utility-sponsored training and education (T&E) programs aimed at improvingcompliance rates had not been completed yet. These T&E efforts are carried out through IOUEnergy Centers, the Savings by Design program, and statewide and local partnership programs.We expect that compliance with the 2005 standards will improve as these training effortscontinue.
Appliance Standards Noncompliance
We assessed the noncompliance rates for nine appliance standards that went into effect inJanuary 2006. The affected appliances were selected based on the magnitude of their estimatedenergy savings.
Appliance manufacturers are required to submit an application to the California EnergyCommission (CEC) to have their product certified as meeting Title 20. For appliancesmanufactured after the effective date of these standards, only those certified can be sold legallyin California. The CEC maintains a database listing the certified appliances of each type. Theappliances included in our study and a description of the Title 20 energy-efficiency requirementsare provided in Table 5. The table also indicates whether or not the appliance type was in theCEC compliance database when we conducted our study.

Quantec — Statewide Codes and Standards Market Adoption and Noncompliance Rates 7
Table 5. Appliance Standards Included in Noncompliance Analysis
Appliance Category In CECDatabase Standard
Televisions Yes Max. standby power usage =3W
DVD Players Yes Max. standby power usage =3WResidential Pool Pumps, Tier 1 No Motor may not be split phase or capacitor start-induction run type motor
General Service Incandescent,Tier 1 No
Max. wattage set for lumen output; applies to most incandescent andhalogen lamps between 25 and 150 watts. Rough service, decorative, 3-way, and colored lamps are excluded.Frost/clear: Max. W=(0.05*lumens)+21Soft white: Max. W=(0.05*lumens)+22.5
Metal Halide Luminaires No Allows only pulse-start ballasts for vertical lamps with base upapplications. Probe-start ballasts disallowed.
Walk-in Refrigerators/ Freezers No
Usually custom made. Requires automatic closers on doors <4’ wideand <7’ high; R-28 insulation in refrigerators, R-36 in freezers;electronically commutated, permanent split capacitor type, or polyphasemotors on condenser fans <1 HP; electronically commutated orpermanent split capacitor type motors on evaporator fans <1 HP.
Pre-rinse Spray Valves No Flow rate ≤1.6 gpm @ 60 psi; cleans 60 plates at average of ≤30seconds per plate.
Unit Heaters and DuctFurnaces Yes
Natural gas-fired unit heaters and duct furnaces shall have either powerventing or an automatic flue damper
Type Fuel Min.Efficiency @Max. Capacity
Max. WattsduringStandby
Duct furnaces Nat gas 80 10Duct furnaces LPG 80 147Unit heaters Nat gas 80 10Unit heaters LPG 80 147Unit heaters Oil 81 N/A
Refrigerated Canned/BottledBeverage Vending Machines Yes Max daily kWh=0.55*(8.66+(0.009*C)); C=rated capacity, # of 12 oz.
cans
Methodology
Our primary approach to estimate noncompliance rates was to identify a sample of retailersand/or wholesalers for each appliance and conduct site visits to collect primary data onbrands/models sold and their sales volumes. Our basic approach was to determine whether eachbrand/model complied with Title 20 and, using the sales volumes, calculate the overallnoncompliance rate.
In addition to collecting information from wholesalers/retailers, we contacted distributors andmanufacturers of each appliance and obtained relevant information from websites and requestedand reviewed catalogs. A stratified cluster sampling approach was used to select retailers andwholesalers for site visits.
The site visits were conducted between July 26 and September 11, 2006, by Quantec fieldtechnicians. They began in Southern California and moved north.

Quantec — Statewide Codes and Standards Market Adoption and Noncompliance Rates 8
The site-visit data were analyzed to determine which models at each outlet did or did not complywith the relevant California standard. We also intended to determine which models weremanufactured prior to the effective date of the standards, but this was not possible since wefound that manufacture dates were not provided for the products. The primary source ofcompliance information was the CEC databases of certified products. The noncompliance ratefor each appliance was then estimated based on the rate for each outlet, approximate sales, andappropriate weights for the strata.
This general approach had to be tailored to each appliance. In the early stages of data collection,it was found that CEC certification databases existed for only four of the appliances studied.Instead of categorizing all these units as “not in compliance,” a decision was reached to assesscompliance of the products sold using supplemental information.
Results
Our estimates of noncompliance rates for each appliance are presented in Table 6.Noncompliance varied from virtually zero (all units complied) to 63%. The averagenoncompliance rate across all these appliances was 32%.
Table 6. Summary of Noncompliance Estimates for 2006
Appliance Category Estimatednoncompliance rate
Certainty levelof estimate
Televisions 41% MediumDVD Players 57% MediumResidential Pool Pumps, Tier 1 15% MediumGeneral Service Incandescents, Tier 1 27% MediumMetal Halide Luminaires 37% LowWalk-in Refrigerators/ Freezers 0% MediumPre-rinse Spray Valves 4.2% HighUnit Heaters and Duct Furnaces 44% LowRefrigerated Canned/Bottled BeverageVending Machines 63% Low
Lessons and Recommendations
Initial Penetration and Naturally-Occurring Market Adoption
The methodology used in this study to research naturally-occurring market adoption rates was apioneering effort, and yielded a number of key lessons on how this process could be improved infuture applications.
Experts should be identified during the standards development process and they shouldbe informed that their input will be required to estimate market trends.
The amount of the incentive should be increased to an adequate level, as we found that$100 was inadequate to incentivize responses.

Quantec — Statewide Codes and Standards Market Adoption and Noncompliance Rates 9
Empirical data on the baseline market should be developed, and then used to provide ananchor point for the experts who will participate in the market estimation exercise.
The process should be expanded to fully implement the Delphi approach by conductingone or two additional rounds to allow the respondents a chance to revise their estimatesand exchange information on the range of estimates.
Building Standards Noncompliance
In order to pinpoint and correct flaws in the compliance chain so that energy savings predictedfrom the codes can be fully realized, we propose future research in the following areas:
Conduct building surveys to determine the frequency of permitted vs. nonpermittedconstruction projects by measure and by jurisdiction to learn more about the penetrationlevels of the codes and standards.
Identify existing building department processes and ensure that compliance and otherimplementation forms fit into these processes.
Survey building industry professionals to identify barriers that may exist in implementingand complying with energy efficiency building codes. This information would bevaluable in the design of training and educational efforts, as well as in the design offuture code updates.
Conduct studies on building performance. These studies characterize the market in amore complete way than do measure-specific studies, and allow more accuratepredictions into the benefits of codes and standards, and the impact of enforcement.
Appliance Standards Noncompliance
The following lessons learned and recommendations were developed as a result of our research:
When noncompliance is researched shortly after a standard goes into effect, specialissues may arise that need to be addressed in the research approach and scope.Specifically, if databases are not available for identifying complying products then theapproach and scope should be designed to implement other research that may benecessary to determine compliance.
There are likely to be limitations in the accuracy of databases used to identify vendorsfor data collection site visits so it is important to verify during pre-site visit calls thatvendors are correctly classified and carry the proper product. In addition, it is importantto have the flexibility in the field to identify other vendors that can provide information.
Special steps should be taken to enlist the cooperation of retailers and wholesalersincluding presenting a letter from the state or utility explaining the study and contactingcorporate management to have them notify the local vendor that they have approved thesite visit.

Quantec — Statewide Codes and Standards Market Adoption and Noncompliance Rates 11
2. Introduction and Overview
For over thirty years, the California Energy Commission has worked to advance energyefficiency through promulgation of energy codes and standards for buildings and appliances.Known as Title 20 (appliances) and Title 24 (buildings), these standards are updated periodicallyto reflect the emergence of new energy-efficiency technologies and methods.
The California Statewide Codes and Standards Program (C&S Program, or Program) isimplemented by the state’s investor-owned utilities and seeks to improve energy efficiency byinfluencing the periodic updates to the Title 20 and Title 24 standards. A consortium ofrepresentatives from each of the investor-owned utilities, called the Stakeholder ReviewCommittee (SRC), works to propose the code updates and monitor changes in energy use andmarket trends as a result of the codes. The most recent round of updates to the standards wentinto effect in late 2005 for the building standards, and in the period 2006-2008 for the appliancestandards.
Past studies have worked to estimate the energy savings attributable to the Program – a complextask that is sensitive to many parameters. Most recently, a key study entitled “Codes andStandards Program Savings Estimate For 2005 Building Standards and 2006/2007 ApplianceStandards” was conducted by Heschong Mahone Group Inc. (HMG).1 This effort estimated theenergy, demand, and gas savings attributable to the C&S Program, with calculations and resultsavailable in an Excel spreadsheet entitled Savings Estimate Spreadsheet. Due to a lack ofempirical data, three key influencing factors were given place-holder values in the spreadsheet:
Initial market penetration and naturally occurring market adoption
Noncompliance rate for selected building measures
Noncompliance rate for selected appliances2
The goal of the study conducted by Quantec, LLC was twofold: 1) to refine the originalestimates made of noncompliance, initial market penetration, and naturally occurring marketadoption rates by researching and analyzing the factors contributing to each parameter; and 2) totest the 2006 California Energy Efficiency Evaluation Protocols3 as it applies to determining netsavings resulting from Program activities. This study was not intended to be an evaluation of theProgram and did not revise the gross savings estimates or any savings inputs into the Savings
1 November 1, 2005.2 The Savings Estimate Spreadsheet assigned a 30% across-the-board noncompliance estimate for both appliances
and building measures. For naturally -occurring market adoption, the HMG analysis estimated time (in years)remaining until full market adoption for that product, and then used a linear market adoption curve from the dateC&S activities began to the date of full adoption.
3 See California Energy Efficiency Evaluation Protocols: Technical, Methodological and Reporting Requirementsfor Evaluation Professionals. Prepared for the California Public Utilities Commission by the Tec Market WorksTeam, April 2006.

Quantec — Statewide Codes and Standards Market Adoption and Noncompliance Rates 12
Estimate Spreadsheet other than those listed above. In addition, modifying the spreadsheet wasnot in the research scope.
The following chapters describe the methods employed to refine these estimates, and present thefindings of our research. The final chapter summarizes the data from our study that should beincorporated into the HMG Savings Estimate Spreadsheet. In addition, the report presentsobservations on lessons learned and provides recommendations for future research.

Quantec — Statewide Codes and Standards Market Adoption and Noncompliance Rates 13
3. Initial Market Penetration and Naturally OccurringMarket Adoption
Introduction
To estimate the impact of the introduction of the new Title 20 and 24 standards, the analysisneeds to estimate:
1) The initial market penetration of appliances and building measures meeting the standards
2) The future market adoption trends of these items if the standards had not beenimplemented.
The initial market penetration represents the state of the market at the time the standards go intoeffect, in other words, what share of annual installations or purchases are already meeting therequirements of the standards. The naturally occurring market adoption rates project what theannual sales or installations of items that meet the standards would have been without thestandards.
These market characteristics need to be assessed to estimate the incremental effect of newstandards. The upper limit of the impact is the total annual sales or installations of measurescovered by the standards, times their unit energy savings. The final estimates are used inestimating final impacts through the use of the Heschong Mahone Group (HMG) SavingsEstimate Spreadsheet .4 Quantifying the market penetration prior to the effective date of newstandards permits adjusting the energy savings attributed to the standards by the savings thatwere already occurring. Quantifying the naturally occurring adoption rates allows extending thisadjustment into the future.
Prior to this analysis, initial market penetration was estimated based on the market dataavailable; in some cases, these data were quite limited. Naturally occurring market adoption wasestimated as a linear increase in penetration over a specific number of years for each efficientmeasure or appliance
Methodology
Our approach for estimating both initial market penetration and naturally occurring marketadoption was to solicit expert opinions to estimate a market diffusion curve.
4 The latest version of this spreadsheet is Total CS Savings HMG – v3 DM.xls

Quantec — Statewide Codes and Standards Market Adoption and Noncompliance Rates 14
Bass Curve
The Bass curve was adopted for analyzing naturally occurring adoption (both initial and future)rates.5 The standard Bass curve can be represented by the following equation:
tqp
tqp
epqetF )(
)(
)/(11)(
where
F(t) = the cumulative fraction of adopters,
p = coefficient of innovation,
q = coefficient of imitation, and
t = elapsed time
p captures the effect of consumers who are not influenced by the behavior of others and qcaptures the effect of consumers who are influenced by prior adopters.6
The HMG Spreadsheet incorporates the assumption that, in the absence of the Program, anequivalent standard would have been adopted for each appliance/measure at some point in thefuture. Consequently, the estimates of naturally occurring market adoption are significant onlyuntil an equivalent standard is assumed to be adopted in the future.
For the purposes of this analysis, the most critical part of the curve to estimate accurately was thepart representing the initial years immediately following the introduction of themeasure/appliance, since the S-shaped nature of the Bass curve is able to provide more realisticestimates of naturally occurring market adoption rates during those first years, as productsgradually increase their market shares. The differences between the linear and S-shaped adoptioncurves are illustrated in Figure 1, which compares a Bass curve that produces 99% marketpenetration in 18 years to a linear curve that was assumed in the initial Savings EstimateSpreadsheet.
5 For a good reference describing and comparing various methodologies for predicting market penetration rates,including the standard Bass curve, see S.T. Gilshannon and D.R. Brown.“Review of Methods for Forecasting theMarket Penetration of New Technologies.” Pacific Northwest Laboratory PNNL-11428 (December 1996).
6 The Bass curve is usually applied to characterize the trend in adoption of a new technology within a fixed group ofadopters over time. We use this approach in a slightly different way here to estimate the trend in the sales of aspecific product variation each year, where the annual sales of the product remain constant, but the proportion ofhigh-efficiency units increases.

Quantec — Statewide Codes and Standards Market Adoption and Noncompliance Rates 15
Figure 1. Comparison of Typical Bass and Linear Curves for18-year Market Adoption
In the earliest years, the penetration rates based on the Bass curve are slightly less than the linearcurve, and they exceed the linear rates in later years. In this example the naturally occurringadoption adjustment would be less with the Bass curve for about eight years, and morethereafter.
Mathematically, three of the following five parameters are needed to estimate the Bass curve:
1) Time (tmax) when maximum adoption rate will occur
2) Maximum adoption rate
3) Cumulative adoption at the maximum rate
4) Coefficient of innovation (p)
5) Coefficient of imitation (q)
It was essential to determine a start date for the market adoption curve for each appliance ormeasure. The objective was to identify a date when the efficient appliance or measure started tohave a presence in the market that represented the beginning of its market growth. Some itemshave been available for many years, but have experienced little or no market growth. Otherswere present for some time and their market shares were already growing before the standardswent into effect. Still others had little or no notable market presence at the time the standardswent into effect. We selected a start date using an iterative process starting with a literaturereview for each item and relying heavily upon the information presented in the relevant CASE
0%
20%
40%
60%
80%
100%
0 5 10 15 20
Years
Ma
rket
Sa
les
Pen
etra
tio
n

Quantec — Statewide Codes and Standards Market Adoption and Noncompliance Rates 16
report.7 In all cases, we solicited the input from experts participating in the process to confirm ormodify our proposed start dates.
Selection of Measures/Appliances and Experts
A subset of the building measures and appliances covered by the new Title 24 and 20 standardswas selected for analysis. This subset was selected primarily by their contribution to totalexpected first year savings and to most efficiently use the resources available for this study.
Specifically, the study only included measures and appliance that were expected to contribute atleast 2.3% of total savings for both gas and electricity. This resulted in a list of 12measures/appliances (accounting for 47% of total electricity savings and 63% of natural gassavings) These are listed in Table 7.8
Table 7 also shows the number of industry experts we targeted from whom to collect input on thenaturally occurring market adoption rates. For each appliance/measure, it was important to solicitinputs from experts knowledgeable about the market for that efficient technology. Based on theinformation contained in the CASE reports, we selected the type and number of industry expertsto target for providing input on each building measure and appliance.
In addition to these industry representatives, it was thought that the inclusion of CaliforniaEnergy Commission (CEC) staff, utility representatives, and consultants would be beneficial tothe analysis. Consequently, we solicited input from representatives of each of these groups.
7 The CASE reports were studies conducted on behalf of the utilities to develop information in support of the Codesand Standards Program.
8 Residential pool pump requirement included is the Tier II, two-speed standard, which does not go into effect until2008. The SRC believed that it was more important and useful to include this than the Tier I requirement, whichprohibits certain motor types, because the Tier II standard produced the highest estimated energy savings of all thestandards.

Quantec — Statewide Codes and Standards Market Adoption and Noncompliance Rates 17
Table 7. Market Adoption Analysis Building Measures, Appliances, and Experts9
Targeted Number of ExpertsTitle 20 and 24 Measuresand Appliances
First-year Savings,GWh Equivalent Manufacturers/
Distributors Contractors
Hardwired lighting, newresidential 65 - 8
Lighting controls underskylights, new 26 - 8
Duct improvement,residential existing 16 - 8
Ducts, nonresidentialexisting 19 - 8
Consumer electronics-TVs 68 6 -Consumer electronics-DVDs 12 6 -Consumer electronics-audio
players 53 6 -
Residential pool pumps, 2-speed, Tier II 130 6 6
Pulse start metal halides 49 6 -General serviceincandescents 79 6 -
Commercial dishwasherspray valves 76 3 -
Unit heaters/duct furnaces 19 6 -
Data Collection
Traditional methods of estimating the parameters to generate the Bass curve are to use valuesderived from curves for similar existing products, rely on market research, or apply expertjudgment about how the product will perform. In conjunction with the SRC, we selected aninnovative approach that relied on inputs from industry experts using a visual tool developedspecifically for this purpose.
It was decided that a visual approach would maximize the efficacy of data collection regardingthese parameters, as it would provide direct feedback, educate the participant on the concept, andbe more intuitive and appealing to use. To implement this approach, we developed an interactivewebsite as an effective and efficient way to obtain expert opinions on the inputs. The websitewas designed to introduce the process we were using and the overall approach by presenting anexplanation of the inputs and parameters of the market-specific adoption curve, as well as adiscussion of the influences that the experts should take into account in their assessments.
9 We used a value of 9,648 Btu/kWh to make the conversion based on typical California heat rates (Klein, J. April17, 1998. The Use of Heat Rates in Production Cost Modeling and Market Modeling. California EnergyCommission) and estimated line losses of 7.2% (http://climatetechnology.gov/library/2003/tech-options/tech-options-1-3-2.pdf).

Quantec — Statewide Codes and Standards Market Adoption and Noncompliance Rates 18
Macromedia Flash software was used to develop an interactive display that the respondents wereable to adjust to reflect the innovative and imitative parameters used in the Bass model equation.For purposes of this exercise, we modified the terminology and referred to these parameters as“leading” and “following” behavior, respectively. Based on our pretests we determined that theseterms were more understandable for participants. It was not necessary for the respondent tounderstand the details of the model in order to select appropriate values. Adjustable sliders wereprovided for the participants to vary until the curve best depicted their expectations about howmarket adoption would have occurred in the absence of the standards. Sample screen shots arepresented in the Round 1 Data Collection section.
PretestsTwo pretests of the methodology were conducted. The first was implemented with Quantec staffto verify that the website link functioned, the language and instructions were clear, the curvedrawing operated properly, and the electronic feedback worked. Based on this pretest, the toolwas refined slightly.
The second pretest was conducted with members of the SRC. Each member was sent an emailand electronic link to use to view the website and provide their inputs. Feedback from the SRCmembers was used to make a second set of modifications in preparation for Round 1 datacollection from the expert group.
Identifying and Recruiting Experts
The solicitation of market segment experts was originally conducted by phone. Phone numberswere acquired using a variety of different means including the references provided by marketaffiliated associations, call lists purchased in coordination with site-visit efforts, and “snowball”methods where one contact provides the names of other respondents. The expert solicitationprocess began by providing the experts with contextual information. This included a descriptionof the project, trends in the market for the appliance/measure (historical market penetration andcurrent data as available), and a description of the Bass curve concept.
We offered each of the experts a $100 gift certificate for their participation in two rounds of datacollection. The processes we used to identify and recruit industry experts for each of theappliances and building standard measures are described below, along with some conclusionsand recommendations for future reference. In addition to the industry experts, we also solicitedinput from policy and program experts at the CEC and consultants who were knowledgeableabout specific products and markets.
Appliance Standards Experts
The solicitation of these experts was conducted primarily by telephone calls. The strategydeveloped to find appliance experts typically included reaching a knowledgeable and amenablerepresentative of a professional association. In some cases these associations were helpful and inother cases no representative from the related association would agree to assist our research.Calls were made to contacts suggested by consultants familiar with the market, as well as CECpolicy experts. Manufacturers were often called directly from contact information contained in
Quantec — Statewide Codes and Standards Market Adoption and Noncompliance Rates 19
their websites. Typically, we found that submitting comments on the corporate website resultedin no helpful responses and, hence, no progress toward contacting experts.
In most cases, calls that we made without our being able to reference someone who referred us tothe person we were calling went unanswered. As an example, when we did reach the office of anexecutive of a large corporation, his assistant felt he might be interested, but added that he almostnever responded to “cold calls.”
Appendix A provides information on the process we conducted to identify and recruit appliancestandard experts for the different products.
Building Standards Experts
In general, the building standards represented a different challenge from the appliance group.Instead of contacting a handful of larger corporations with their associated distributors, hundredsif not thousands of contractors had expertise with these standards. Lists of businesses used forthe building standards noncompliance study were the initial sources for calls.
Details on how we contacted the building standards experts are provided in Appendix A.
Observations and Recommendations on Expert Recruitment
Overall, we made hundreds of calls to identify and recruit experts and we were unable to reachour targeted number of participants for some appliances and measures. It was most difficult toidentify and recruit experts in the building measures area, largely because of problems gettinggood sources of contact information. In addition, it was challenging to find contractors whospecialized in the specific building measures covered by the standards. In addition to thehundreds of recruitment calls we made, we often called and emailed each person who agreed toparticipate multiple times to ensure that they would follow through. In the end, several still didnot complete the process.
The reasons behind the difficulty finding experts who would agree to participate in the programvaried by market. We found that professionals in larger companies, such as those in theconsumer electronics and incandescent lighting markets, have layers of bureaucracy to protectthemselves from unsolicited contacts. Even when those layers were penetrated, many peopleexpressed that they were too busy to participate and seemed suspicious of any calls not referredby a friendly colleague. While the financial incentive we offered encouraged some people toparticipate, it was not the main inducement for many to participate. In fact, three of the 27industry experts said they could not accept the $100 gift certificates due to company policies. Allthree came from employees of large companies.
It was often difficult to reach potential participants employed by smaller companies, such asbuilding contractors and distributors, because they had a receptionist who served as a protectivegatekeeper. Phone messages were frequently left for bosses who were in meetings and neverreturned the calls. When someone was reached they were often so busy they simply were notinterested in anything not directly helping their business.

Quantec — Statewide Codes and Standards Market Adoption and Noncompliance Rates 20
Perhaps the single most important change we could have made to improve participation in anymarket would have been to have had our data acquisition web tool available when contacts werefirst reached. We chose to make an initial round of screening and recruitment calls while the toolwas being tested, so when some interested participants were reached initially, the tool was notyet “live.” After asking initial questions to ascertain the knowledge of the potential expert, thisindividual could have been emailed the internet link while still on the phone and asked to beginuse of the market adoption web tool immediately. This would have served two purposes. First,the expert could have seen immediately that the tool was the product of a serious effort ofprofessional organization to gain information, and we believe this would have alleviated some ofthe suspicions about the process. Second, and perhaps more important, this real-time approachcould serve as a method to prevent procrastination. In many cases, we were able to engage aninterested participant in an enlightening conversation over the phone, but this expert in the endnever participated in the study. Unlike the common phone survey, this survey was done on theparticipants’ own time and hence, given the busy lives and customer-centric focus of mostcompanies, these experts never found time to complete their adoption curve over the web.
In the future, to increase participation we would recommend both a larger financial incentive forsmall business owners, and a greater effort toward building relationships in the industry withindividuals who can then recommend the researcher to knowledgeable colleagues. For largercompanies it is imperative to provide access to the web tool at the time of initial contact.
Round 1 Data CollectionA sample of the final Round 1 input display is shown in Figure 2. Experts were contacted andrecruited by telephone. This process is described in more detail later. An introduction screen (notshown) presents an overview of the process and tells the participant how to navigate through thetool.
The sample input screen displayed in Figure 2 shows a market adoption curve drawn based onone expert’s inputs. For each appliance and measure studied, this introductory screen provides asummary of the requirements of the new Title 20 or 24 standard. The sliders that the respondentsadjust are shown on the right. Participants move the sliders by placing their mouse cursor on itand then moving it to the left or right; the curve immediately changes shape in response to themovements. The “Max Market Share” slider allows the user to set a maximum level he or shebelieves the market share for the efficient appliance or measure will reach. This allows for caseswhere the expert believes that the product would have never reached a 100% market sharewithout the standard being in effect. The “Leading Behavior” slider adjusts the p value in thecurve equation and the “Following Behavior” slider adjusts the q value. Note that the timescalestarts at 1995, which happens to be the date for this measure when it was determined to starthaving a market presence. For some products or measures the start date was prior to 1995 and forothers it was later. The curve exhibits a typical S-shaped trend over time and reaches a maximumof 79% of the annual market installations (or sales) in 2035. Based on the choices made by therespondent, the adoption curve reflects a relatively small value for leading behavior (p, orinnovation) and a moderate value for following behavior (q, or imitation).

Quantec — Statewide Codes and Standards Market Adoption and Noncompliance Rates 21
Figure 2. Initial Round Sample Input Screen
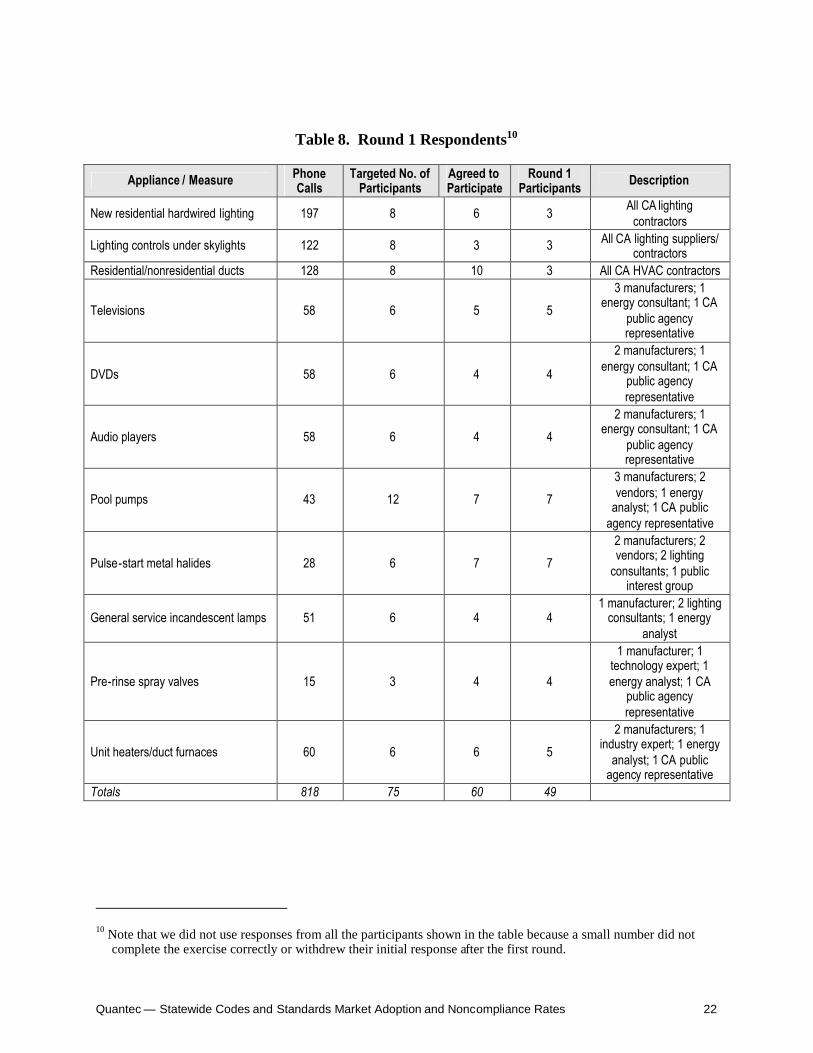
Table 8 shows the number of experts we contacted, the number who agreed to provide feedbackduring Round 1, the number who actually participated, and a description of the categories ofparticipants. These numbers can be compared to the quantities we targeted initially. In somecases, we had to conduct more than 30 calls to recruit one person who agreed to participate. Inthe best case, we called about four people to get one who agreed. Even after we had some expertsagree to participate, attrition occurred in a few situations. In one case, 70% of the people whohad agreed to participate, failed to provide input during Round 1.
Quantec — Statewide Codes and Standards Market Adoption and Noncompliance Rates 22
Table 8. Round 1 Respondents10
Appliance / Measure PhoneCalls
Targeted No. ofParticipants
Agreed toParticipate
Round 1Participants Description
New residential hardwired lighting 197 8 6 3 All CA lightingcontractors
Lighting controls under skylights 122 8 3 3 All CA lighting suppliers/contractors
Residential/nonresidential ducts 128 8 10 3 All CA HVAC contractors
Televisions 58 6 5 5
3 manufacturers; 1energy consultant; 1 CA
public agencyrepresentative
DVDs 58 6 4 4
2 manufacturers; 1energy consultant; 1 CA
public agencyrepresentative
Audio players 58 6 4 4
2 manufacturers; 1energy consultant; 1 CA
public agencyrepresentative
Pool pumps 43 12 7 7
3 manufacturers; 2vendors; 1 energy
analyst; 1 CA publicagency representative
Pulse-start metal halides 28 6 7 7
2 manufacturers; 2vendors; 2 lighting
consultants; 1 publicinterest group
General service incandescent lamps 51 6 4 41 manufacturer; 2 lighting
consultants; 1 energyanalyst
Pre-rinse spray valves 15 3 4 4
1 manufacturer; 1technology expert; 1energy analyst; 1 CA
public agencyrepresentative
Unit heaters/duct furnaces 60 6 6 5
2 manufacturers; 1industry expert; 1 energy
analyst; 1 CA publicagency representative
Totals 818 75 60 49
10 Note that we did not use responses from all the participants shown in the table because a small number did notcomplete the exercise correctly or withdrew their initial response after the first round.

Quantec — Statewide Codes and Standards Market Adoption and Noncompliance Rates 23
Although it was quite labor intensive to recruit participants and obtain their inputs, and althoughthe number of participants failed to meet our target in several cases, we believe this methodshows promise as a way to obtain information from experts on naturally occurring marketadoption and other market estimates. Feedback from participants and the SRC members wasgenerally quite positive. One of the limitations to our approach was that it was the first time thismethodology had been applied and, to meet our schedule, pretesting was still occurring as werecruited participants. We believe several more experts would have agreed to participate if wehad been able to direct them to the website at the time they were recruited, and to provide themwith assistance as needed. In addition, it was not possible to fully implement the Delphiapproach, using several rounds and providing comments and feedback to help informparticipants of the rationale for the inputs of all participants. We believe that implementing thisapproach more fully would have provided higher quality information and generated more interestin participating in the process. Chapter 7 presents our overall observations and recommendationsfor improving the methodology. In the future, the choice of whether or not to use this tool shouldprimarily be determined by the timeline.
Round 2 Data Collection
After receiving all Round 1 inputs, we generated an average market adoption curve. The marketadoption rates provided by our experts were averaged for each year over the period analyzed. ASAS statistical analysis routine (PROC NLIN) was used to estimate the p, q, and maximummarket share values that generated a Bass curve that best fit the average data.
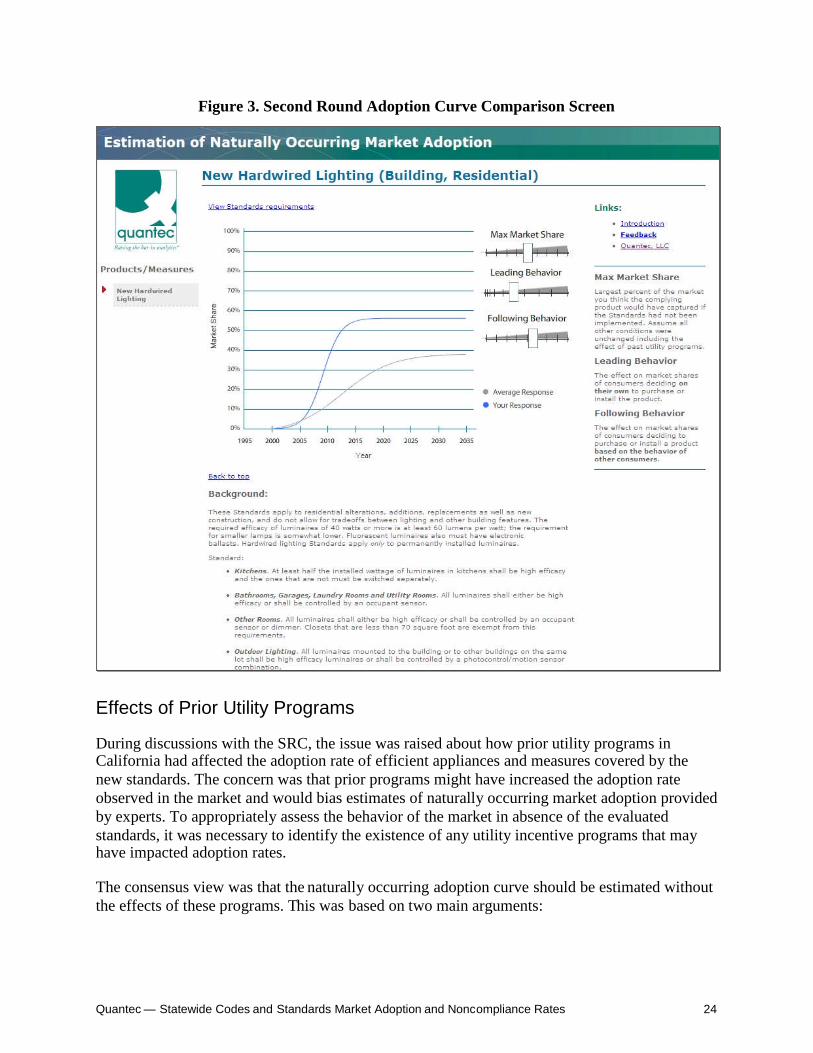
Once these average curves were generated for each appliance/measure, we sent another email toeach participant with a link to a revised website. A sample of the screen that participants viewedin this round is shown in Figure 3. This screen shows the average curve (lower curve) for eachproduct the expert assessed and the curve that he or she input (upper curve). In this case theexpert’s curve indicated he expected hardwired residential lighting meeting the requirements ofthe new Title 24 would grow to about 55% of the new housing market by about 2017. Theaverage, however, showed much slower growth and a peak penetration of only 38%. Therespondents were asked to provide feedback indicating whether they believed the average curveor their original curve was a better predictor of the market adoption rates, and to also provide anexplanation of why they made the choice they did.
Quantec — Statewide Codes and Standards Market Adoption and Noncompliance Rates 24
Figure 3. Second Round Adoption Curve Comparison Screen
Effects of Prior Utility Programs
During discussions with the SRC, the issue was raised about how prior utility programs inCalifornia had affected the adoption rate of efficient appliances and measures covered by thenew standards. The concern was that prior programs might have increased the adoption rateobserved in the market and would bias estimates of naturally occurring market adoption providedby experts. To appropriately assess the behavior of the market in absence of the evaluatedstandards, it was necessary to identify the existence of any utility incentive programs that mayhave impacted adoption rates.
The consensus view was that the naturally occurring adoption curve should be estimated withoutthe effects of these programs. This was based on two main arguments:

Quantec — Statewide Codes and Standards Market Adoption and Noncompliance Rates 25
1) Although there was no good way to predict what market penetration would revert towhen the programs stopped, most observers felt that the market would go back to thenaturally occurring penetration of the high-efficiency appliances/measures, given thatthe programs were typically acquisition programs.
2) If the market were assumed to stay at the penetration level at the time the programsended, then this full amount would be subtracted from the effects of the Codes andStandards Program, and neither this Program nor the previous utility programs wouldreceive credit for these savings.
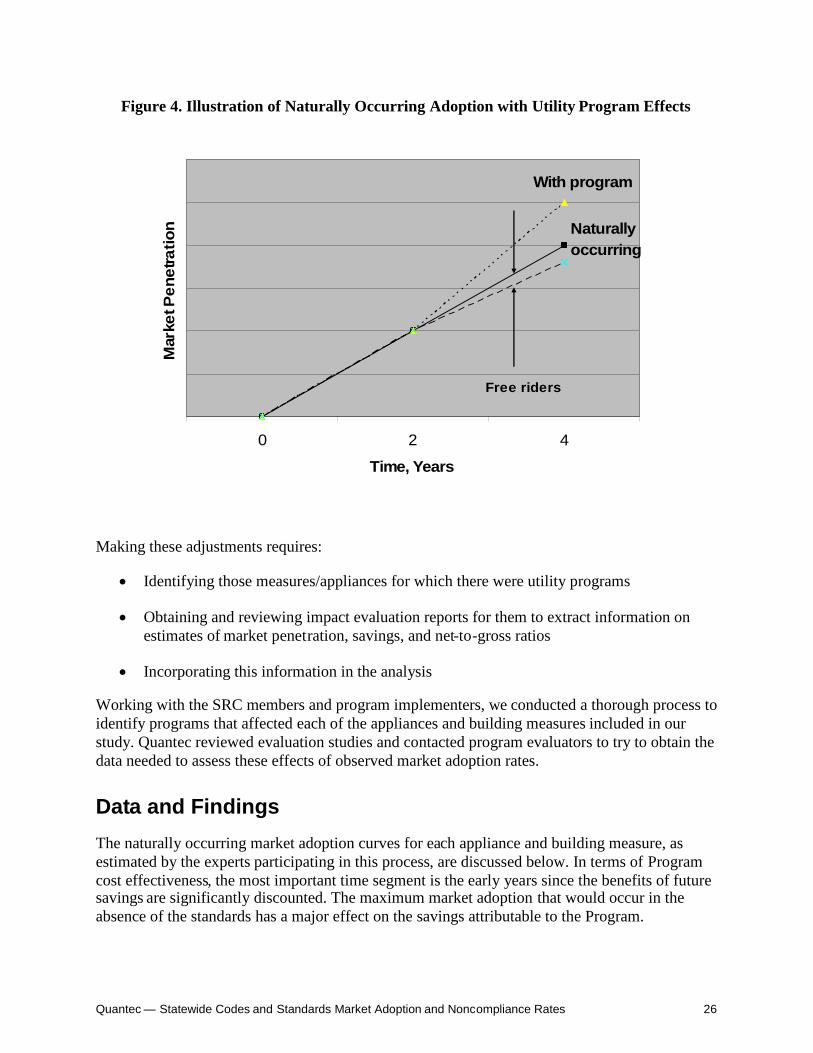
Our approach for tackling this is illustrated in Figure 4. Just for illustration purposes, theestimate of naturally occurring adoption without any utility programs is shown as a linearfunction of time. The upper dashed line in the figure shows the effect of a utility program startingin year 2. Over the next two years, the program increases market penetration above the level thatwould have occurred without any programs; finally, when asked to estimate market adoptionrates, experts would estimate the upper curve, thus including the full effects of the existingprogram.
The gap between the bottom and upper curves shows the gross effects of the program estimatedby an impact evaluation. Because typically some of the program participants would be freeriders, subtracting out the full penetration and gross savings due to program participants wouldoverstate the adjustment to arrive at the real naturally occurring market adoption. The differencebetween the naturally occurring curve and the bottom dashed line shows the portion of themarket that would have adopted the efficient measure or appliance without the program, butparticipated in the program as free riders. Consequently, to get back to the naturally occurringcurve, the program free riders have to be removed from the gross program effects.
Quantec — Statewide Codes and Standards Market Adoption and Noncompliance Rates 26
Figure 4. Illustration of Naturally Occurring Adoption with Utility Program Effects
Making these adjustments requires:
Identifying those measures/appliances for which there were utility programs
Obtaining and reviewing impact evaluation reports for them to extract information onestimates of market penetration, savings, and net-to-gross ratios
Incorporating this information in the analysis
Working with the SRC members and program implementers, we conducted a thorough process toidentify programs that affected each of the appliances and building measures included in ourstudy. Quantec reviewed evaluation studies and contacted program evaluators to try to obtain thedata needed to assess these effects of observed market adoption rates.
Data and Findings
The naturally occurring market adoption curves for each appliance and building measure, asestimated by the experts participating in this process, are discussed below. In terms of Programcost effectiveness, the most important time segment is the early years since the benefits of futuresavings are significantly discounted. The maximum market adoption that would occur in theabsence of the standards has a major effect on the savings attributable to the Program.
0 2 4
Time, Years
Mar
ketP
en
etr
ati
on
.
Naturallyoccurring
With program
Free riders

Quantec — Statewide Codes and Standards Market Adoption and Noncompliance Rates 27
For each efficiency measure and efficient appliance analyzed, we show for comparison theoriginal curve that was used to estimate naturally occurring market adoption. These curves arebased on adoption growing linearly over a number of years, which vary by appliance andmeasure. In most cases, the original curve starts at zero market penetration. However, in a fewcases the original analysis is based on an initial market adoption greater than zero. In the SavingsEstimate Spreadsheet, this initial adoption rate is embedded in the gross savings estimates. Forexample, if the initial market penetration of an efficient appliance was estimated to be 50%, thegross savings used in the Savings Estimate Spreadsheet is 50% of the savings possible for thetotal annual sales of the appliance. If the naturally occurring market adoption for this efficientappliance was assumed to reach 100% in 10 years, then the original curve would start at 50% andincrease linearly to reach 100% in 10 years.
Hardwired Lighting, New Residential
We solicited input from four industry experts for market adoption estimates for new residentialhardwired lighting meeting requirements of the new standards. Inputs from only two of therespondents were valid, however, because one did not complete the exercise and onemisunderstood the request. The start date estimated for this technology was 2000. Figure 5 showsthe adoption curves estimated by the two experts and the average curve fit to the data. (As aconvention in all the market adoption rate graphs, the average curve is shown as a dashed linewhile all other curves are solid lines.)
The average adoption rate estimated in 2006 was 8%. The two experts agreed quite closely aboutthe maximum level of market adoption that would be achieved without the standards, and theaverage estimate was 57%. The two experts differed, however, in their predictions of howquickly market penetration would grow. These differences were driven by differences in the“following” behavior expected in the market. The second curve from the top in Figure 5 showsthat one expert felt the market would quickly adopt the measure once early adopters beganimplementing it, while the other believed this would happen more slowly.
Starting at 8% of the market in 2006, the average curve showed a fairly linear growth in theadoption rate, peaking at about 56% in 2029. The preliminary place holder estimate in theSavings Estimate Spreadsheet was based on linear growth starting in 2006 and reaching 100% ofthe market in 18 years (2023). This original estimate is the top curve in the figure and theoriginal estimates of the penetration rates exceeded the average value we estimated over theentire period. We received no feedback from these two experts on the average adoption curve forthis measure.

Quantec — Statewide Codes and Standards Market Adoption and Noncompliance Rates 28
Figure 5. Complying Hardwired Lighting Market Adoption Estimates
Lighting Controls under Skylights, New Nonresidential
Four industry experts provided market adoption estimates for lighting controls under skylights.The start date estimated for this technology was 2000. Estimates of the market penetration in2006 ranged from 3% to 10%, with an average value of 7%. Two experts predicted that withoutthe standards the penetration rate would have eventually reached 80%. On the other hand, onepredicted about 35%, and another predicted that only 10% of the market would have eventuallyadopted lighting controls specified by the standards. The individual responses and average
0
10
20
30
40
50
60
70
80
90
100
2006
2008
2010
2012
2014
2016
2018
2020
2022
2024
2026
2028
2030
2032
2034
2036
Year
An
nua
lMar
ket
Ad
opt
ion
,%.
Average
Original

Quantec — Statewide Codes and Standards Market Adoption and Noncompliance Rates 29
response are shown in
0
10
20
30
40
50
60
70
80
90
100
2006
2008
2010
2012
2014
2016
2018
2020
2022
2024
2026
2028
2030
2032
2034
2036
Year
Ann
ual
Mar
ket
Ad
op
tion
,%.
Average
Original
.
The average curve and all but the lowest curve were quite similar until about 2014. As notedearlier, the initial years are the most influential in determining the energy savings attributed tothe Program. For comparison, the original value used in the Savings Estimate Spreadsheetassumed that lighting controls would penetrate 100% of the market within 12 years, starting in2006.11 This is shown in the top curve and this curve lies above the average curve from ouranalysis over the entire period.
The only follow-up received from the experts was from the person who provided the lowestestimate of the adoption curve. Given that no other experts provided additional comments, weassume that the average curve was acceptable to them. The person who provided the lowestestimate assessed four appliances or measures, and in all cases his estimate was the lowest. Heindicated that, in general, his experience led him to conclude that the market was quite slow toadopt efficient technologies without standards, and this influenced his judgment.
11 Note that from the information available it appears that the gross savings attributed to this measure in the SavingsEstimate Spreadsheet assumes that the naturally occurring penetration of this measure would be 0% in the firstyear without the new standards.

Quantec — Statewide Codes and Standards Market Adoption and Noncompliance Rates 30
Figure 6. Complying Lighting Controls Market Adoption Estimates
0
10
20
30
40
50
60
70
80
90
100
2006
2008
2010
2012
2014
2016
2018
2020
2022
2024
2026
2028
2030
2032
2034
2036
Year
An
nua
lMar
ket
Ad
opt
ion
,%.
Average
Original
Duct Improvement, Residential Existing
Three industry experts provided market adoption estimates for residential duct improvementsequivalent to the new standards, using an estimated start date of 1990. The focus of theirestimates was on the duct sealing aspect of the standard. Estimates of the market penetration in2006 ranged from 2% to 15%, with an average value of 10%. Estimates of the ultimate marketpenetration without the standards ranged from 15% to 22%, with an average value of 19% in

Quantec — Statewide Codes and Standards Market Adoption and Noncompliance Rates 31
about 20 years. The individual responses and average response are shown in
0
10
20
30
40
50
60
70
80
90
100
2006
2008
2010
2012
2014
2016
2018
2020
2022
2024
2026
2028
2030
2032
2034
2036
Year
Ann
ual
Mar
ket
Ad
op
tion
,%.
Average
Original
.
The experts had different views about near-term market growth, but agreement was good onwhat the final market adoption would have been without the standard. The average curve showsthe expected market adoption growing gradually from about 10% currently to 19% over 20years. The original estimate in the Savings Estimate Spreadsheet is shown in the top curvedepicting growth starting in 2006 and reaching 100% in 18 years.12 From 2008 on, the originalestimate exceeded the average penetration curve produced by our analysis.
Only one participant provided feedback on the average curve. He indicated that he felt theaverage estimate was better than his original assessment, though there was little differencebetween the two.
12 It was not possible to determine from the information available on the original savings estimates for this standardwhat original, naturally occurring penetration of this measure was assumed so for illustrative purposes we assumethat original penetration would have been 0% in the absence of the new standard.

Quantec — Statewide Codes and Standards Market Adoption and Noncompliance Rates 32
Figure 7. Complying Residential Duct Improvement Market Adoption Estimates
0
10
20
30
40
50
60
70
80
90
100
2006
2008
2010
2012
2014
2016
2018
2020
2022
2024
2026
2028
2030
2032
2034
2036
Year
An
nua
lMar
ket
Ad
opt
ion
,%.
Average
Original
Duct Improvements, Nonresidential Existing
Two industry experts provided market adoption estimates for nonresidential duct improvementsequivalent to the new standards. As with the residential ducts, the focus of the estimates was onthe duct sealing part of the requirements. The start date estimated for this measure was 1990.Estimates of the market penetration in 2006 ranged from 1% to 3%, with an average value of2%. Estimates of the ultimate market penetration without the standards ranged from 10% to 34%,with an average value of 23% in about 20 years. The individual responses and average responseare shown in Figure 8.
The experts had similar views about near-term market growth, but diverged after about 10 years.The average curve shows the expected market adoption growing gradually from about 2%currently to a little over 20% in about 30 years. The original estimate in the Savings EstimateSpreadsheet was that naturally occurring adoption would start in 2006 and grow to 100% in 18years; the original estimate is above our estimate over the entire period.13
Only one participant provided feedback on the average curve. He indicated that he thought thelight commercial market would have had a lower adoption rate than the average curve withoutthe standards, based on his experience that light commercial buildings are more often not
13 It was not possible to determine from the information available on the original savings estimates for this standardwhat original, naturally occurring penetration of this measure was assumed so for illustrative purposes we assumethat original penetration would have been 0% in the absence of the new standard.

Quantec — Statewide Codes and Standards Market Adoption and Noncompliance Rates 33
owner-occupied, and that there have not been any significant utility programs over the years thathave targeted duct sealing in light commercial buildings.
Figure 8. Complying Nonresidential Duct ImprovementMarket Adoption Estimates
Consumer Electronics-Televisions
Three industry representatives and two policy/program experts provided market adoptionestimates for televisions meeting the requirements of the new standards. The start date estimatedfor this measure was 2000. After being shown the average response provided by the expertgroup, one of the policy experts indicated she would defer to the estimates of the group, so herresponse was removed. The remaining policy expert’s curve is shown with triangles in Figure 9.After removing the one response, estimates of the market penetration in 2006 ranged from 3% to57%, with an average value of 41%. Estimates of the ultimate market penetration without thestandards ranged from 48% to 100%, with an average value of 83% in about 20 years. The figureshows the individual responses and average response.
Three of the four respondents provided very similar growth curves, starting at more than 50%market penetration in 2006. The lowest curve was the estimate from an industry representativewho indicated in his comments that his company’s products had already been meeting the Title20 requirements, but he felt other companies’ products had not. Since the other curvesrepresented the knowledge of other companies, he may have underestimated the existing marketpenetration. The average curve shows the expected market adoption growing gradually fromabout 40% currently to over 80% in about 20 years. The original estimate in the Savings
0
10
20
30
40
50
60
70
80
90
10020
06
2008
2010
2012
2014
2016
2018
2020
2022
2024
2026
2028
2030
2032
2034
2036
Year
An
nual
Mar
ketA
dop
tio
n,%
.
Average
Original

Quantec — Statewide Codes and Standards Market Adoption and Noncompliance Rates 34
Estimate Spreadsheet was that naturally occurring adoption would start in 2006 and grow to100% in six years. The original estimated market adoption exceeds our average curve from 2009on.
Two industry experts provided comments in addition to the comment mentioned above. Bothexperts mentioned that Energy Star had played a major role in increasing adoption of televisions(and other consumer products) with reduced standby consumption.
Figure 9. Complying Television Market Adoption Estimates
Consumer Electronics-DVDs
Two industry representatives and two policy/program experts provided market adoptionestimates for DVDs meeting the requirements of the new standards. The start date estimated forthis measure was 2000. After being shown the average response provided by the expert group,one of the policy experts indicated she would defer to the estimates of the group, so her responsewas removed. After removing this response, estimates of the market penetration in 2006 stillcovered a large range, from 1% to 40%, with an average value of 24%. The curve for theremaining policy/program expert (triangles) is the highest curve in Figure 10. Estimates of theultimate market penetration without the standards ranged from 22% to 90%, with an averagevalue of 61% in about 12 years. The figure shows the individual responses and average response.
Figure 10. Complying DVD Market Adoption Estimates
0
10
20
30
40
50
60
70
80
90
100
2006
2008
2010
2012
2014
2016
2018
2020
2022
2024
2026
2028
2030
2032
2034
2036
Year
An
nua
lMar
ket
Ad
opt
ion
,%.
Average
Original

Quantec — Statewide Codes and Standards Market Adoption and Noncompliance Rates 35
Two of the three experts provided very similar curves, starting at about one-third marketpenetration in 2006. The lowest curve was the estimate from the same industry representativewho provided the lowest estimate for televisions; he provided the same comments for DVDs ashe did for TVs. The average curve shows the expected market adoption growing gradually froma little over 20% in 2006 to about 60% in 12 years. As shown by the top curve in the figure, theoriginal estimate in the Savings Estimate Spreadsheet was that adoption would start at thebeginning of 2006 and grow to 100% in six years. The average curve estimated in our study liesbelow the original curve from 2007 on.
Two industry experts provided similar comments about the DVD market as they did for thetelevision market.
Consumer Electronics-Audio Players
Two industry representatives and two policy/program experts provided market adoptionestimates for audio player improvements equivalent to the new standards. The start dateestimated for this measure was 2000. Estimates of the market penetration in 2006 rangedsubstantially, from less than 1% to 54%, with an average value of 26%. Estimates of the ultimatemarket penetration without the standards ranged from 22% to 80%, with an average value of50% in about 15 years. The individual responses and average response are shown in Figure 11.
Figure 11. Complying Consumer Audio PlayerMarket Adoption Estimates
0
10
20
30
40
50
60
70
80
90
100
2006
2008
2010
2012
2014
2016
2018
2020
2022
2024
2026
2028
2030
2032
2034
2036
Year
Ann
ual
Mar
ket
Ado
pti
on,%
.
Average
Original

Quantec — Statewide Codes and Standards Market Adoption and Noncompliance Rates 36
Although the experts’ assessments differed quite substantially regarding both the initial marketpenetration and growth in adoption, there was no consistent reason to prefer any responses overothers. The industry experts’ curves are shown with square symbols and the policy/programexperts’ curves are shown with triangles in Figure 11. There are no consistent differencesbetween the responses of members in these two groups. When respondents were asked to providefeedback on the average curve shown in the figure, we received only one comment. Thiscomment was from a policy/program expert (see the curve second from the bottom in the figure)who stressed the difficulties that had been encountered in getting manufacturers to certify theirproducts to the new California standards. Although this argument is important, we note that themarket curve estimated by this respondent agreed fairly closely with the average curve afterabout six years, even though the initial market adoption rates were quite different.
Based on this information, we chose to use the average as the basis for our estimate of theadoption curve. The average curve shows the expected market adoption growing gradually fromabout 24% in 2006 to a little over 50% in 12 years. The original estimate in the Savings EstimateSpreadsheet is shown in the top curve and it shows naturally occurring adoption in 2006 at about6% and growing to 100% in six years starting in 2007.14 Starting in 2008, this curve lies aboveour average curve over the remaining period.
14 This is based on the results reported in the final project report by Energy Solutions et al., June 9, 2005.
0
10
20
30
40
50
60
70
80
90
100
2006
2008
2010
2012
2014
2016
2018
2020
2022
2024
2026
2028
2030
2032
2034
2036
Year
An
nua
lMar
ket
Ad
op
tion
,%.
Average
Original
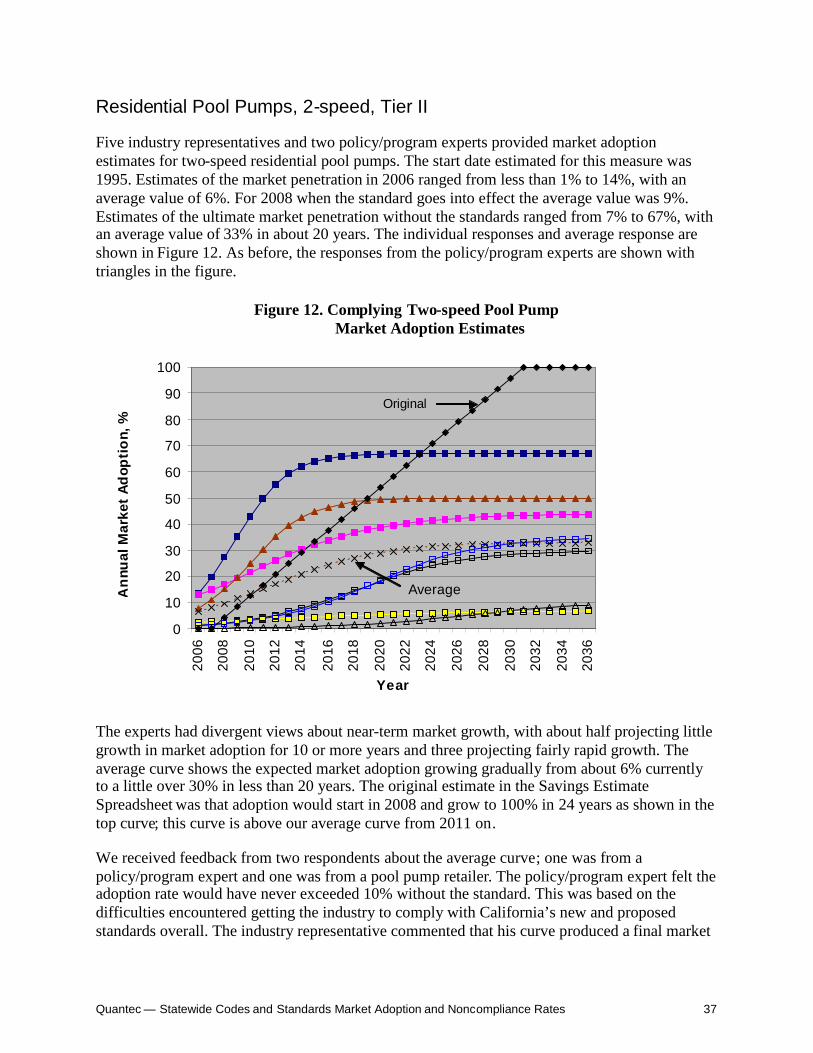
Quantec — Statewide Codes and Standards Market Adoption and Noncompliance Rates 37
Residential Pool Pumps, 2-speed, Tier II
Five industry representatives and two policy/program experts provided market adoptionestimates for two-speed residential pool pumps. The start date estimated for this measure was1995. Estimates of the market penetration in 2006 ranged from less than 1% to 14%, with anaverage value of 6%. For 2008 when the standard goes into effect the average value was 9%.Estimates of the ultimate market penetration without the standards ranged from 7% to 67%, withan average value of 33% in about 20 years. The individual responses and average response areshown in Figure 12. As before, the responses from the policy/program experts are shown withtriangles in the figure.
Figure 12. Complying Two-speed Pool PumpMarket Adoption Estimates
The experts had divergent views about near-term market growth, with about half projecting littlegrowth in market adoption for 10 or more years and three projecting fairly rapid growth. Theaverage curve shows the expected market adoption growing gradually from about 6% currentlyto a little over 30% in less than 20 years. The original estimate in the Savings EstimateSpreadsheet was that adoption would start in 2008 and grow to 100% in 24 years as shown in thetop curve; this curve is above our average curve from 2011 on.
We received feedback from two respondents about the average curve; one was from apolicy/program expert and one was from a pool pump retailer. The policy/program expert felt theadoption rate would have never exceeded 10% without the standard. This was based on thedifficulties encountered getting the industry to comply with California’s new and proposedstandards overall. The industry representative commented that his curve produced a final market
0
10
20
30
40
50
60
70
80
90
100
2006
2008
2010
2012
2014
2016
2018
2020
2022
2024
2026
2028
2030
2032
2034
2036
Year
An
nual
Mar
ket
Ad
opti
on,
%.
Average
Original
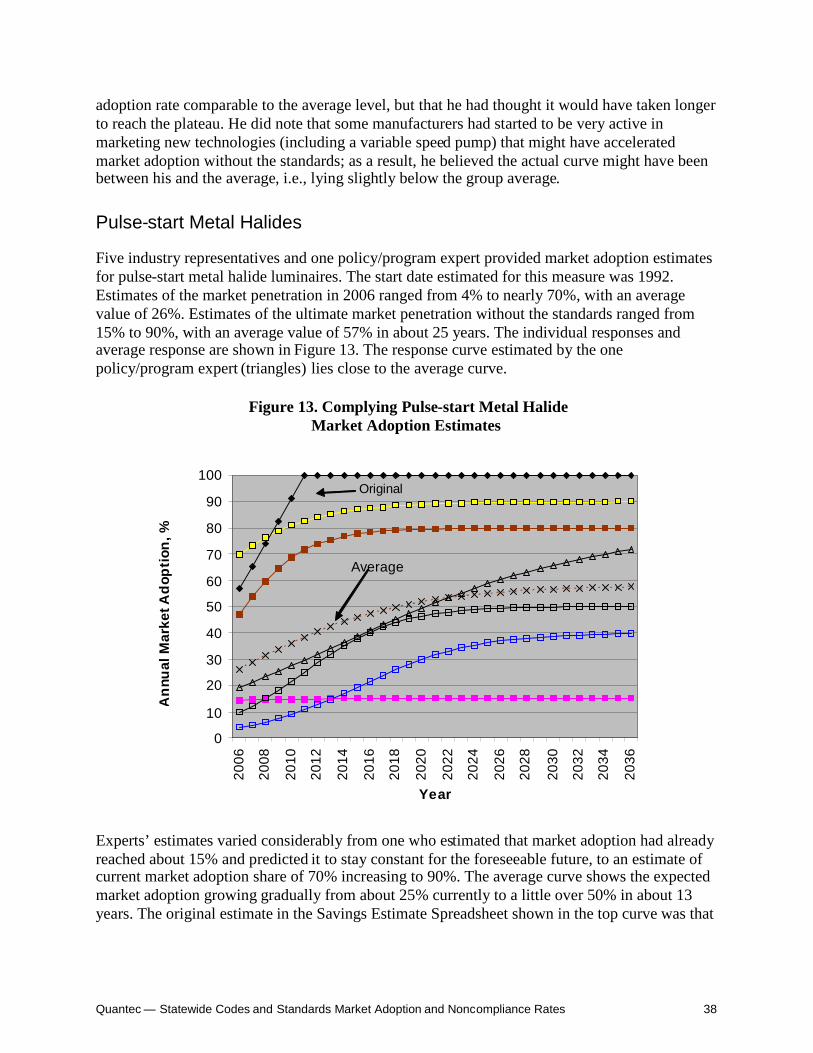
Quantec — Statewide Codes and Standards Market Adoption and Noncompliance Rates 38
adoption rate comparable to the average level, but that he had thought it would have taken longerto reach the plateau. He did note that some manufacturers had started to be very active inmarketing new technologies (including a variable speed pump) that might have acceleratedmarket adoption without the standards; as a result, he believed the actual curve might have beenbetween his and the average, i.e., lying slightly below the group average.
Pulse-start Metal Halides
Five industry representatives and one policy/program expert provided market adoption estimatesfor pulse-start metal halide luminaires. The start date estimated for this measure was 1992.Estimates of the market penetration in 2006 ranged from 4% to nearly 70%, with an averagevalue of 26%. Estimates of the ultimate market penetration without the standards ranged from15% to 90%, with an average value of 57% in about 25 years. The individual responses andaverage response are shown in Figure 13. The response curve estimated by the onepolicy/program expert (triangles) lies close to the average curve.
Figure 13. Complying Pulse-start Metal HalideMarket Adoption Estimates
Experts’ estimates varied considerably from one who estimated that market adoption had alreadyreached about 15% and predicted it to stay constant for the foreseeable future, to an estimate ofcurrent market adoption share of 70% increasing to 90%. The average curve shows the expectedmarket adoption growing gradually from about 25% currently to a little over 50% in about 13years. The original estimate in the Savings Estimate Spreadsheet shown in the top curve was that
0
10
20
30
40
50
60
70
80
90
100
2006
2008
2010
2012
2014
2016
2018
2020
2022
2024
2026
2028
2030
2032
2034
2036
Year
An
nual
Mar
ketA
dop
tion
,%.
Average
Original

Quantec — Statewide Codes and Standards Market Adoption and Noncompliance Rates 39
initial naturally occurring adoption was 48% and starting in 2006 it would grow to 100% in sixyears; this curve lies above our average curve over the entire time period.15
We received feedback from several respondents on the average curve. The industry expert whoestimated the highest adoption curve made several arguments for why he thought it applied. Hestated that pulse-start units could be installed in smaller quantities than probe-start units, thusoffsetting the higher equipment cost and reducing labor costs. He noted that the industry hadshifted its R&D to pulse-starts so this technology would continue to improve, while probe-starttechnology was static. He stated emphatically, “There is no downside to pulse-start metalhalides!” The individual who estimated the lowest curve provided comments on several productsindicating that he believed the industry’s projections were too optimistic in general, but he didnot provide evidence supporting that view. The expert who estimated that market adoption wouldhave reached only 40% ultimately, said that based on his market knowledge, the penetrationprior to 2006 was nowhere near the 25% shown for the average response.
Overall, there were considerable differences among the views of these experts. Without anextensive effort to reconcile these differences, the average curve appeared to be a reasonableestimate that was a significant improvement over the original estimate.
General Service Incandescents
Two industry representatives and one policy/program expert provided market adoption estimatesfor general service incandescents. The start date estimated for this measure was 1970. Thetechnology allowing these lamps to meet the standards has been available for a long time and, asone industry representative pointed out, the higher efficiency is generally achieved for a tradeoffin bulb life. There were major differences across the estimates, with the estimated marketpenetration in 2006 ranging from 3% to 100% and having an average value of 46%. Estimates ofthe ultimate market penetration without the standards ranged from 20% to 100%, with anaverage value of 53% in about 21 years. The individual responses and average response areshown in Figure 14. The response curve estimated by the one policy/program expert (triangles)lies close to the average curve.
Figure 14. Complying General Service IncandescentsMarket Adoption Estimates
15 This is based on the results reported in the final project report from Energy Solutions et al., June 9, 2005.

Quantec — Statewide Codes and Standards Market Adoption and Noncompliance Rates 40
As the figure shows, experts’ estimates varied widely. The average curve shows the expectedmarket adoption growing gradually from about 45% in 2006 to 50% in about eight years. Thegrowth based on the original estimate in the Savings Estimate Spreadsheet starts in 2006 andincreases to 100% in 18 years. Our average adoption curve shows a higher adoption rate than theoriginal estimate until about 2015.
Because of its extreme values, we contacted the expert who provided estimates for the top curvein the figure to get an explanation for his views. He indicated that the incandescents that were themost popular met the efficiency requirement of the new standard and only those rated as long-life did not. He argued that the analysis done to develop the standard established an efficiencylevel that was intended to allow one-third of existing lamps to comply, but the analysis wasbased on lamp models alone and did not take sales into account. We were able to confirm thatthis was the case. However, as the chapter in this report discussing appliance noncomplianceshows, we found compliance with the new standard was only 74%, taking into account lampinventory data. Consequently, we were not convinced that the current market adoption wouldhave been 100% without the standard.
Given the results of this analysis and the findings from the noncompliance study, we believe thatthe average curve shown in Figure 14 is a reasonable estimate of market behavior without thestandard.
Commercial Dishwasher Pre-rinse Spray Valves
Two industry representatives and two policy/program experts provided market adoptionestimates for pre-rinse spray valves. The start date estimated for this measure was 1985. There
0
10
20
30
40
50
60
70
80
90
100
2006
2008
2010
2012
2014
2016
2018
2020
2022
2024
2026
2028
2030
2032
2034
2036
Year
An
nu
alM
arke
tA
dop
tion
,%.
Average
Original

Quantec — Statewide Codes and Standards Market Adoption and Noncompliance Rates 41
were fairly consistent estimates of the market adoption that would have occurred in 2006 (exceptfor one respondent), but significant differences were observed across the predicted trends. Twoof the experts predicted two different flat market adoption rates from 2006 on (10% and 45%),while the other respondents projected that market adoption would have trended upward overtime. The estimated market penetration in 2006 ranged from 10% to 45%, with an average valueof 25%. Estimates of the ultimate market penetration without the standards ranged from 10% to80%, with an average value of 52% in about 26 years. The individual responses and averageresponse are shown in Figure 15. The response curve estimated by the policy/program expert areshown with triangles, and one of these curves lies quite close to the average curve.
There were no consistent differences between the predictions of the policy/program experts andthe industry experts. The average curve shows the expected market adoption growing graduallyfrom about 25% currently to a little over 50% by about 2030. The original estimate in theSavings Estimate Spreadsheet, as shown by the top curve, was that adoption would start in 2006and grow to 100% in nine years. From 2008 on this curve lies above our average estimatedcurve.
Figure 15. Complying Pre-rinse Spray ValvesMarket Adoption Estimates
Several respondents provided comments on their estimates. One policy expert noted that theindustry had been slow to provide compliance data, and for this reason projections of naturaladoption should be conservative. This expert’s prediction of ultimate market adoption, however,was close to the average level that we estimated. One industry representative noted:
0
10
20
30
40
50
60
70
80
90
100
2006
2008
2010
2012
2014
2016
2018
2020
2022
2024
2026
2028
2030
2032
2034
2036
Year
An
nual
Mar
ketA
dop
tio
n,%
.
Average
Original

Quantec — Statewide Codes and Standards Market Adoption and Noncompliance Rates 42
“The shape of the average adoption curve starts out tracking the shape of my own curvequite well. However, I predicted the max. market share at 70% while the group averagepredicted 50%. Given the positive economic return on low-flow spray valves and thesupporting utility rebate and educational programs, I have to believe that the penetrationwould have exceeded 50%. However, on another round, I might adjust downward to say,60% max. market share. But it is still conceivable, that in 25 years, the market wouldhave educated itself and been significantly transformed (e.g., 70%) without legislation.”
The other industry representative who estimated market adoption at no higher than 10% providedno comments on his prediction. The remaining policy expert commented:
“I will stick with my estimate [of 80% naturally occurring adoption in the long run],largely because voluntary programs, especially in the water utility industry have or willhave seized on this opportunity over the next years making significant inroads in terms ofsaturation impacts. The current incremental cost is largely a function of demand andsupply and as market share increases, I expect it to go down...it's just a chunk of metalshaped a little bit better. So manufacturing barriers are limited … water in my estimationis going to get very expensive in the out years creating a stronger market for the betterproducts. On the other hand, I don't have good familiarity with the portion of the marketthat likes spray valves for filling large pots in addition to cleaning. If this is fairlycommon, then my estimate is overly aggressive at assuming 80% eventual penetration. Atthis point, I'd be inclined to split the difference to some extent but I think the average is alittle pessimistic.”
When we conducted our compliance/noncompliance analysis presented in Chapter 5, we foundthat nearly all spray valves being sold were meeting the standard. Consequently, we believe theaverage curve does not overstate what would have occurred in the market without the standard,and is a realistic projection.
Unit Heaters/Duct Furnaces
Estimating the naturally occurring adoption of unit heaters/duct furnaces meeting therequirements of the new standard was particularly challenging. Three industry representativesand two policy/program experts provided market adoption estimates. The technology wasestimated to have become commercially available starting in 1965. The estimates provided werebi-modal—either very low or very high. The estimates of initial market penetration in 2006varied widely, ranging from 4% to 98%, with an average value of 50%. For both the low andhigh estimates, the adoption curves from 2006 on were quite flat. Estimates of the ultimatemarket penetration without the standards ranged from 15% to 100%, with an average value of69% by 2036. The individual responses and average response are shown in Figure 16; responsesof the policy/program experts are designated by triangles.

Quantec — Statewide Codes and Standards Market Adoption and Noncompliance Rates 43
Figure 16. Complying Unit Heater/Duct FurnaceMarket Adoption Estimates
The average curve shows the expected market adoption growing gradually from about 50% in2006 to 69% by 2036, but continuing to grow beyond then. The original estimate curve showsadoption starting in 2006 and growing to 100% in nine years; it lies above our estimated averagecurve from 2010 on.
Comments from the experts, as well as our noncompliance analysis (presented in Chapter 5),provided conflicting evidence for different adoption rates. The two equipment manufacturersgenerated the highest adoption curves shown in Figure 16. One of those experts noted, “Themarket [for unit heaters/duct furnaces] began in approximately 1939, and was exclusivelyGravity Vent (100%) until the 1960's or so and since that time Power Vent has grown to thedominant market share (67% by the end of 2005).” On the other hand, one of the policy expertscommented:
“[Under previous standards] 12 manufacturers with 3,751 natural gas models werecertified. Even after being advised of the new requirements, [compliance information hasbeen provided by only] three manufacturers on a total of 107 models. [This] appears to beone of the least-compliant of all [appliances] ... There are likely many manufacturers stillmissing. And, unless all manufacturers are willing to show compliance for all models, …the likelihood of those manufacturers meeting a specific standard level voluntarily (e.g.,where the standard had not been enacted) is small.”
0
10
20
30
40
50
60
70
80
90
100
2006
2008
2010
2012
2014
2016
2018
2020
2022
2024
2026
2028
2030
2032
2034
2036
Year
Ann
ual
Mar
ket
Ado
pti
on,%
.
Average
Original

Quantec — Statewide Codes and Standards Market Adoption and Noncompliance Rates 44
When we assessed compliance based on data from the field (see Chapter 5), we found somevendors with high compliance rates (60% or greater), and some with very low compliance rates.Our overall estimate was 56%, but we noted that the estimate was conservative and uncertainbecause compliance was determined strictly based on whether a unit was in the CEC database,and sales data were rarely available.
Taking these factors into account, we believe that the average market adoption curve is areasonable estimate of what would have happened without the standard. However, furtherinterviews with industry representatives and an assessment of compliance would be useful toclarify how common complying units were before and since the standard went into effect.
Prior Utility Programs
As discussed earlier, we developed a method for adjusting our estimates of naturally occurringmarket adoption to take into account the effect of utility programs. Three steps were required:
Identifying measures/appliances for which there were utility programs
Obtaining and reviewing impact evaluation reports from which to extract information onmarket penetration, savings, and net-to-gross ratios
Incorporating this information in the analysis
Working with the SRC members and program implementers, we conducted a thorough process toidentify programs that affected each of the appliances and building measures included in ourstudy. We contacted key consultants who had conducted overall work on the standards (primarilyEnergy Solutions and HMG) and utility staff familiar with various utility programs. Theconsultants were able to provide initial information about prior programs. Quantec then reviewedevaluation studies and contacted program evaluators to try to obtain the data needed to assess theeffects on estimated market adoption rates.
Only a few appliances were identified by Energy Solutions as having been included in priorCalifornia utility energy-efficiency programs. One of these was a recent PG&E program forpulse-start metal halides that specified use of a pulse-start ballast in retrofits. Prior to that, theycould have been implemented through the Express Efficiency Program. We obtained anevaluation of the Express Efficiency Program and talked to the study’s author. The evaluation,did not quantify free-ridership, savings, or installation rates at the measure level. No otherinformation about metal halide programs was available.
A recent PG&E program for pool pumps was identified. To qualify for rebates, pool pumpmotors had to meet certain efficiency or multiple speed capabilities. The program was veryrecent, however, and we were unable to locate any evaluation data for the program.
The 2004 and 2005 Express Efficiency Programs provided rebates for pre-rinse spray valves thatmet the basic requirements of the new standards. We were unable to obtain any evaluations orother analyses to provide the data needed to assess the effects of these programs. No programs ordata were identified for the other appliances included in our study.

Quantec — Statewide Codes and Standards Market Adoption and Noncompliance Rates 45
On the building measure side, HMG identified potential programs, but could not provide detailedinformation. We were referred to utility contacts to try to obtain the necessary information. Wemade multiple attempts to contact staff who were knowledgeable about specific buildingmeasure programs, but we were unable to obtain the additional information needed to analyzethe programs.
In addition to incentive programs, the utilities undertook training and education efforts toincrease awareness of the standards. These activities very likely influenced both the perceptionsabout market adoption rates and compliance with the standards. Disentangling the effects ofthese efforts was beyond the scope of our study, but the role of these programs will becomeincreasingly important to ensure that each efficient appliance and building standard achieves itsintended effect. Our analyses, particularly the estimates of noncompliance, should help identifythe best targets for future training and education activities.
After collecting the information and studies that were available, Quantec found insufficientinformation to make adjustments to our estimates for either the appliances or building measuresfor which naturally occurring market adoption rates were estimated. We believe that the lack ofinformation did not introduce a significant error in our estimates, however. This is because theincentive programs that were conducted were unlikely to have introduced major shifts in themarket that would have influenced the experts’ estimates of current and future adoption rateswithout the standards. Given this, it would be most appropriate to credit the utility programs withthe savings demonstrated through program evaluations and studies, and not make any adjustmentin the savings estimated for the Codes and Standards Program to account for prior programs.


Quantec — Statewide Codes and Standards Market Adoption and Noncompliance Rates 47
4. Building Standards Noncompliance
Background
For the purposes of the original Savings Estimate Spreadsheet, the noncompliance rate forbuilding standards was assumed to be 30% for all measures. Quantec and the BenningfieldGroup devised a research approach based on the collection of building field data to revise thecompliance estimate for each measure. The data were collected via a combined approach ofreviewing building department records and conducting site visits at a sample of buildings toverify the reported compliance rates.
Table 9 shows the building efficiency requirements of the 200516 Title 24 Standards that wereassessed in the cited HMG 2005 report. Measures are listed in the order of estimated first-yearelectricity savings, first for residential and then for nonresidential buildings.
Table 9. Building Measures Updated in Title 24
Measure 1st YearSavings (GWh)
ResidentialHardwired lighting 64.6
Window replacement 6.3(0.3 Mtherms)
Duct improvement 5.7(1.1 Mtherms)
Multifamily water heating 1.5 MthermsNonresidential
Lighting controls under skylights 25.5Cool roofs 14.6Bi-level lighting controls 12.1
Ducts in existing buildings 9.7(1.0 Mtherms)
Duct testing/sealing in new buildings 8.0Cooling towers 3.0Relocatable classrooms 2.9
Given the limited time and resources available for this study, we proposed to focus on the largestenergy savers and this approach was incorporated into our final work plan. As a result,multifamily water heating (1.5 Mtherms), nonresidential cooling towers (3 GWh), andrelocatable classrooms (2.9 GWh) were not included in this study. The remaining measuresaccount for nearly 90% of total first year savings. 17
16 The 2005 Title 24 Standards took effect on October 1, 2005.17 As described earlier, total savings were calculated as GWh (Mtherms converted to GWh equivalent).
Quantec — Statewide Codes and Standards Market Adoption and Noncompliance Rates 48
Research Methodology
Initially, our work plan was designed to include the following components of data collection:
1) Visits to ten building departments, representing a mix of climate zones acrossCalifornia
2) Reviews of 400 building records, including permits and plans/drawings whenavailable
3) On-site inspections of a sample of 100 building projects drawn from the 400 reviewedrecords
This initial plan was modified slightly when it was discovered that some building departmentsencompass multiple climate zones; for purposes of efficiency, nine building departmentsultimately were visited.
This methodology was employed with the objective of providing statistically defensible resultsfor each of the identified measures with 90% confidence ±10%. This level of precision wasachieved, with absolute precision levels ranging from ± 0.9% to ±10%. Relative precision levelsranged from ± 1.2% to ±24%. Beyond the noncompliance values themselves, this study also wasable to provide valuable insight into the varying building department processes and procedures inplace across the state. These findings shed some light on the types of process holes that exist, andtheir likely impacts on overall building energy code compliance. These process findings, as wellas general lessons learned through this research, are discussed later in this chapter.
Building Department SelectionBuilding departments were selected to maximize opportunities for viewing permits and plansfrom a mix of building projects and climate zones across the state. To maintain consistency withthe California Energy Commission’s 2005 Building Energy Efficiency Standards ComplianceManual, California’s 16 climate zones were grouped into five climate zone clusters for thisstudy. Our goal was to pull records from those areas with ample building activity to provide asample of building projects across the five climate zone clusters that were likely to contain ourtargeted measures. Our method for doing this began with viewing a climate zone map ofCalifornia, and identifying the larger metropolitan areas in each climate zone cluster. Once a listof potential departments was assembled, we contacted building officials at each department toexplain the study and request access to the records. In some cases, access was readily grantedand the building department representatives were helpful. In others, additional effort was neededto secure cooperation. In the end, we were able to obtain data from nine building departmentswith adequate representation of the state.
Figure 17 shows the distribution of the building departments across the state.

Quantec — Statewide Codes and Standards Market Adoption and Noncompliance Rates 49
Figure 17. Building Department Locations
Table 10 displays the nine building departments visited, each department’s associated climatezone cluster, and the number of permits that were reviewed at each.

Quantec — Statewide Codes and Standards Market Adoption and Noncompliance Rates 50
Table 10. Building Department Permit Review Breakdown
BuildingDepartment County
ClimateZone
Cluster
PermitsReviewed
Percent ofTotal
ResidentialPermitaVolume(CountyLevel)
Percent ofTotal
Permits
Nonresidential Building
Valuation inDollars(CountyLevel)
Percentof Total
Valuation
Arcata Humboldt 1, 16 27 7% 326 1% 68,030 0.4%Anaheim 36 9%Fullerton
Orange 6-939 10%
6,758 13% 3,688,049 21%
Riverside Riverside 2, 10-13 50 13% 21,761 42% 5,551,340 32%
Ceres Stanislaus 2, 10-13 51 13% 2,039 4% 752,999 4%
Elk Grove Sacramento 2, 10-13 38 10% 5,239 10% 1,492,198 9
San Diego San Diego 6-9 62 16% 8,944 17% 3,368,185 19%Paso
RoblesSan LuisObispo 3-5 39 10% 1,344 3% 410,523 2.4%
Concord ContraCosta 10-13 8 2% 3,385 7% 1,435,469 8%
Sonoma Sonoma1, 2,
10-13and 16
45 11% 1,594 3% 574,456 3.3%
Totals 395 51,530 17,341,249aResidential building permit volume and nonresidential building valuation figures represent the first nine months of 2006.
Data Collection
Building Department Permit Review
At each building department, we reviewed recent permit records and permit lists; typically, thepermits studied were filed between November 1, 2005 through June 2006.18 Permits that werelikely to contain one of the study’s target measures were selected, and, if available, specificrecords and plans for those projects were pulled for further review. For each record the followingdata were collected: permit number, address, owner’s name, owner’s phone number (whenavailable), type of permit, details of work to be performed, target measure applicability, andvarious notes on documents in the file, including energy calculation results and comments onconstruction status to help determine if the project was suitable for a field visit.
18 Few permits filed after June 2006 were reviewed to allow time for projects to be completed, and because the studyaimed to give focused attention on compliance rates soon following code changes.
Quantec — Statewide Codes and Standards Market Adoption and Noncompliance Rates 51
Background
Although we expected to find a certain level of procedural inconsistencies between buildingdepartments, we were surprised to learn just how unique each building department’s policieswere. To provide background to the findings in this study, and to help inform future studies, herewe describe some examples of the nuances of the data collection effort.
All building departments keep records of permits by address, date and permit number; however,the methods by which they categorize, store, and support projects differ in every jurisdiction. Inparticular, we found that the level of project detail available for viewing was inconsistentthroughout the state. For example, one city may file a permit for a particular project simply as aresidential permit with no further detail. In order to learn more about this project, the file must bepulled and the building plans retrieved to obtain even basic details, such as type of residentialconstruction (new subdivision, new single family residence, addition to existing residence,remodel of existing residence, or repair to existing residence). At some departments these broadsub-classifications did exist in the master record or permit list, and most provided at least “new”vs. “existing” distinctions. However, even within those classifications, there wereinconsistencies. For example, some departments might catalog a studio addition or “granny flat”as an addition/remodel because there is an existing permit record for that address, while otherswould call it a new single family residence.
Another interesting permitting nuance lies in the area of subdivision construction. In California,most building departments allow what they classify as “master plans,” where production buildersmay submit one complete set of plans for each type of residence they plan to construct within asubdivision. In these cases, if developers can prove, typically via the performance method, thateach home type complies with minimum building codes, the master plan is deemed to complywith the code. Prior to actual construction, then, builders need only come into the buildingdepartment with a plot plan/grading plan to obtain a permit for an individual address. Eachbuilding department has a different system for matching these mastered plan approvals toindividual permits by address. For nonresidential permits, similar matching inconsistencies exist.
Finally, to ensure good customer service, most, if not all, building departments in Californiaoffer walk-in service and issue what are known as “counter permits” for many types ofconstruction. To obtain a counter permit, applicants typically are able to simply complete a formand pay a fee, with little or no design or component documentation required. This is a keyexample of a building department policy that made data collection for this project moreproblematic than anticipated. One example of how counter permits complicated the reviewprocess is in the case of re-roofing. Many times, we pulled permits for these building projecttypes and found that the permit did not describe the type, size or slope of the roof. Similarly, acounter permit can be issued for a replacement HVAC system or replacement windows. Thisissue is exacerbated by the fact that the technicians issuing counter permits typically do not havesufficient training or expertise to review energy compliance documentation or specifications. Inshort, the myriad processes and procedures we encountered, together with the wide range ofproject detail present in the building permits, created a challenging environment in which tomake compliance determinations for the targeted measures in this study. More importantly, theseinconsistencies will likely complicate future efforts to improve compliance and document energy

Quantec — Statewide Codes and Standards Market Adoption and Noncompliance Rates 52
savings resulting from codes and standards, unless compliance chain issues are further identifiedand addressed.
Record Retrieval and Plan Review
For most building departments, we were able to scan a list of permits either provided by staff orretrieved from the departments’ databases. After an initial review, those permits likely to containone of the study’s targeted measures were selected for more detailed evaluation, which includedan examination of plans. In some jurisdictions, this was done through physical access to the planroom; in others, it involved having the permit staff retrieve plans for us.
It is important to note that although it often appeared that a building project “should contain” oneof the study’s measures, it was not always possible to make a compliance determination from theavailable records. This was due to a few different factors, including the type of measure(mandatory, prescriptive, or credit) and the presence or absence of plans containing finer projectdetails. Here we discuss how different variables influenced the process of makingnoncompliance appraisals for each measure.
Type of Measure
In the standards, there are three types of requirements: mandatory, prescriptive and credit.
Mandatory measures are required each time the measure is included in a building design. Forexample, all appliance standards are considered mandatory measures. There are no exceptionsand no tradeoffs. Documentation usually consists of confirming via a check mark on a form thatthe measure exists in the design. Residential hardwired lighting is another mandatory measure,although documentation of compliance with this measure is somewhat more involved, typicallyrequiring completion of one or more special forms.
Prescriptive measures are slightly different. They are prescribed as part of the base-case designfor a particular climate zone. Insulation requirements, for example, are prescriptively set fordifferent climate zones. However, if and when a prescriptive requirement begins to restrict thebuilding’s design, that requirement can be “traded off” for another measure that savesapproximately the same amount of energy. These substitutions, and the subsequent determinationof project compliance with the energy code, are typically done via the performance compliancemethod. The performance method requires that a certified computer program be used to modelthe building’s overall energy use. The results of the computer model are then used to prove thatthe building meets the allowed energy use for a building of that type and configuration.
This trading off of measures to meet the energy requirements via overall building performancecame into play during our analysis. For example, a prescriptive requirement like lighting controlsunder skylights in large warehouses is often traded off with other measures, and therefore maynot have been present in the file or shown in the blueprints. However, the building as a wholemay well have remained in conformance with the code, if the designer chose to add anotherfeature (e.g., a more efficient HVAC unit) in order to make up for the energy lost due to theabsence of skylights with lighting controls.
Quantec — Statewide Codes and Standards Market Adoption and Noncompliance Rates 53
Credits, lastly, are present in the code as a means to encourage adoption of newer technologies.For example, the installation of dimming ballasts and dimming controls on fluorescent lampsprovides a control credit in the form of a Power Adjustment Factor. This factor provides acompliance credit for using that technology, and allows a designer the option of utilizing a higherlighting power than is ordinarily allowed in the code.
Availability of DataThe prevalence of permits applicable to our project varied significantly by measure. In manycases, a feature is required only under certain conditions, reducing the number of potentialrecords available to review. For example, cool roofs are only required for commercial re-roofprojects where low-slope conditions exist, and even then there are some exceptions to therequirement that make the presence of that measure relatively uncommon.
This study also found that substantially fewer permits exist in the nonresidential sector. Whilethe volume of nonresidential building projects is substantial from a valuation perspective, from apermitting perspective they are relatively underrepresented. Nonresidential buildings are larger,take longer to plan and construct, and are often built in phases with separate permits taken onlyfor specific building components (e.g., unconditioned shell, demolition of previous building,grading, electrical, etc.). The availability of data is further restricted by the fact that contractorsand owners sometimes neglect to take out the required permits. This phenomenon was reportedto varying degrees at each building department, and appears to happen less frequently in smallerjurisdictions where the building department has a closer link to the community. The frequencyof this occurrence anywhere, however, is anecdotal, because those who bypass the permit systemcannot be tracked unless their illegal activity is reported to the department by a third party.
Building Department Policies
Building departments, governed by administrations that must answer to councils and boards ofsupervisors, often set polices that do not adequately recognize or accommodate some aspects ofthe building energy-efficiency codes. For example, the most current building energy efficiencycodes went into effect on October 1, 2005. “Grandfathering” under an older code is permissiblein cases where a permit was filed prior to October 1, even if project completion does not occuruntil well beyond this date. In some jurisdictions, however, residential permits issued afterOctober 1 were grandfathered in. We found that some level of inappropriate grandfathering ofold requirements into the new time frame was adopted policy in five of the nine buildingdepartments visited. As a consequence, hundreds of homes statewide are complying withoutdated code requirements. In addition, the interpretation, application, and enforcement ofcodes was found to be inconsistent between building departments. For example, somejurisdictions have opted not to require permits (though they should) for commercial reroofs or forreplacement of residential windows, rendering it impossible to study compliance for thosemeasures in those departments.
Plan Review and Site Visit Protocols by Measure
The protocol used for the record review, plan review, and site visit is described in this section.Table 11 shows the types of forms reviewed at the building departments.

Quantec — Statewide Codes and Standards Market Adoption and Noncompliance Rates 54
Table 11. Forms Applicable to Record Review and Field Inspection
Residential Forms Nonresidential FormsMF 1-R FC-1 and/or FC-2CF 4-R LTG 1-CCF 6-R Mech 1-CWS 5-R Applicable acceptance testing documentsCF 1-R Mech 1-A and back-up documents
Applicable specification sheets or notes LTG 1-A and back-up documentsApplicable specification sheets or notes
Hardwired Lighting
This measure is the most universally applicable of all the measures researched, as it is applicableto all residential new construction and alterations. It is a mandatory measure, so it cannot betraded off for another feature with equal or greater energy savings potential. Permits reviewedfor this measure included all residential construction, including single and multifamily projectsand subdivisions.
Research protocol. In the permit file, we looked for a MF-1 form and a WS5-R form. Theseforms document the designer/owner’s intent to install the required lighting and to document thatincandescent lights installed in the kitchen do not exceed the allotted maximum wattage. Whenreviewing plans, we looked for a lighting or electrical drawing that indicated location and typesof fixture and controls. In the field, we observed and recorded the types of fixtures and controlsthat were installed.
Window Replacement
This is a prescriptive measure that applies to the replacement of windows in the residentialsector. While the measure is universally applicable, except in rare cases where the requirement istraded off for another, only a small number of permits were located at the building departments.This is due to two factors: (1) window replacements represent a small subset of the residentialmarket (alteration only), and (2) window replacement permits are not required by all buildingdepartments. Some departments require permits for all replacements, while others only requirepermits when there is a change in window size. Still others don’t require them at all. Windowsoften are replaced in conjunction with another type of alteration, and the permit details may notalways reveal whether windows were included in the scope of the alteration work.
Research protocol. In the permit file, we looked for a certificate of compliance and/or windowspecifications. These forms document the designer/owner’s intent to install windows thatconform to the U-factor and SHGC requirements specified in the code. Window replacementpermits are often issued as counter permits, which limited the prevalence of documentation (e.g.,drawings indicating location, size or type of windows to be replaced) that would have informedthis study. In the field, we looked for window labels indicating type and U-factor. In the absenceof a window label, we recorded the window and frame type.

Quantec — Statewide Codes and Standards Market Adoption and Noncompliance Rates 55
Duct Sealing for Residential HVAC ReplacementThis is a prescriptive measure that applies only to the replacement of a major component of theHVAC unit in certain climate zones (2 and 9-16). The requirement includes performing a ducttest that verifies a maximum leakage rate of 15% (or 10% leakage to the outside), or a 60%leakage improvement over the existing system, verified through a smoke test. In certain areasand under certain conditions, homeowners can choose to install a higher efficiency HVAC unitinstead of having the duct test performed.
Research protocol. In the permit file, we looked for a certificate of compliance, duct test results,or the presence of a testing form awaiting completion. These forms document thecontractor/owner’s notification of the results of the leakage test or the requirement to have a test.Since these are typically counter permits, no sketch or specification is usually provided. In thefield, the measure was inspected for test results or the existence of compliance forms that wouldindicate a test had been performed. If neither was present, we noted the installation quality of theduct system. For this and all of the measures where duct sealing was required, records werechecked against the HERS registry which would reveal all sites where data on duct test resultswere uploaded, as required by the code.
Skylights
Skylights are prescriptive measures that apply to a small number of very large buildings thathave a warehouse or retail occupancy designation. For skylights (and future lighting controls toobtain the energy savings from daylighting) to be required, the building must be 25,000 squarefeet or larger, must have relatively high ceilings, and must have greater than 0.5 watts-per-squarefoot of lighting installed (or intended to be installed). Skylights are required to provide light to atleast 50% of the floor area. Since it is a prescriptive requirement, it can be traded off via theperformance method.
Research protocol. In the permit file, we looked for compliance forms that indicated the skylightwas required and that it was either present or traded off against another feature. In design plans,we looked for the presence of skylights in qualifying buildings. We then attempted to verify that,if skylights were present, the area and size of the skylights might yield the amount of daylight tothe space as required by code (50% of floor area). This is done by calculating the daylit areabased on the size and spacing of the skylights. In the field, we verified the presence of skylightsand, if lighting was installed, the presence of qualifying lighting controls.
Cool RoofsA cool roof is a prescriptive measure that applies to certain low-sloped roof replacements. There-roofed area must be >50% of the total roof area (or a minimum of 1,000 square feet). If thatcondition exists, then most roofs must meet the prescriptive requirements of a cool roof, unlessthe feature is traded off via the performance method or all of the exceptions listed in Section 149(b) 1 B exist. During field visits, we learned that many roofs and roof repairs are completedwithout obtaining a permit. One jurisdiction in our study currently does not require permits forthis type of construction activity. Another jurisdiction reported that the volume of permit activityfor commercial reroofs dropped after the code change; it is suspected that increasingly restrictiverequirements sometimes drive contractors away from the process completely.

Quantec — Statewide Codes and Standards Market Adoption and Noncompliance Rates 56
Research protocol. In the permit file, we recorded the presence or absence of compliance formsthat indicated that the applicant was aware that a roof was required to meet the requirements of acool roof and that the product should be certified by the Cool Roof Rating Council (CRRC)19.Likely due to the fact that these are counter permits, we found no cases where any plans,sketches or specifications were found in the file. Occasionally the permit description indicatedthat a cool roof replacement was intended for that address. During the field visits, we noted theroof color and looked for a CRRC certificate or label.
Bi-level Lighting ControlsBi-level lighting controls exist in the building energy efficiency codes as an optional controlcredit that may be taken to allow for increased lighting power. The lighting control credits arecalculated in terms of “Power Adjustment Factors,” which are multipliers that allow the actuallighting power used in compliance calculations to be reduced, giving a lower adjusted lightingpower. This makes it easier to meet the allowed lighting power requirement.
Research protocol. In the permit file, we looked for permits pertaining to new small officespaces or tenant improvements where the lighting control credit may be used. Our studyreviewed twelve permits where a bi-level lighting control would have been applicable, but didnot locate any building projects that opted to take the credit.
Duct Sealing for Commercial HVAC Replacement
This is a prescriptive measure similar to that for residential systems. However, this measure wasfound to be required less frequently in nonresidential applications because duct systems are oftenlocated in conditioned spaces, or they serve an area greater than 5,000 square feet. The existenceof either one of these features exempts a building from the requirement. In addition, buildingowners may choose to install a higher efficiency HVAC unit in some cases, in order to exemptthem from the duct sealing requirement.
Research protocol. In the permit file, we noted the presence of compliance forms, a complete orincomplete duct test report, or other information indicating that the applicant intended to seal andtest the duct system. Once again, this measure requires only a counter permit, so plans andsketches are typically absent. In the field, we looked for a duct test report. If one was not present,we noted the quality of installation of the duct system. As previously noted, all projectscontaining measures where duct sealing was required were checked against the HERS registry.
Duct Sealing for New Commercial HVACThis is a prescriptive measure that applies to HVAC systems serving relatively small zones(5,000 square feet or less) that have greater than 25% of the ducts located in unconditionedspace. When a project meets the applicability criteria, very often these systems are installed aspart of small tenant improvement permits and the requirement is traded off against the lighting
19 The Cool Roof Rating Council (CRRC) is an independent organization that has established a system for providingradiative property data on roof surfaces.

Quantec — Statewide Codes and Standards Market Adoption and Noncompliance Rates 57
requirement via the performance method. If a “mechanical only” permit is pulled, typically theduct system is required to be sealed and tested.
Research protocol. At the building department, we noted the presence of compliance forms, acomplete or incomplete duct test report, and other information indicating that the applicantintended to seal and test the duct system. Since these are counter permits, no plans or sketchesare typically present for review. In the field, we looked for a duct test report. If one was notpresent, the reviewer noted the quality of installation of the duct system. For all of the measureswhere duct sealing was required, records were checked against the HERS registry.
Compliance “Scoring”
Each permit reviewed was given a score in each of three possible compliance categories:process, design, and field.
Process reflects the completeness of the information contained in the permit file.
Design represents the compliance level of the submitted blueprints or plans.
Field corresponds to the observations made during the field inspections.
The scores themselves were derived from an evaluation of how close the component came tomeeting the code requirement. Complete noncompliance existed when no evidence of knowledgeor intent to comply with code existed (score =1). Partial compliance was given when someevidence was found of an attempt to comply with code, but compliance was incomplete (score =0.5). Full compliance existed when the measure was present and either fully documented, fullycontained in the design or installed in the building (score = 0). The one exception to this scoringscheme applied to window replacements, where a partial noncompliance score of 0.3 was givenin certain cases. See Results section for more details.
As an example, a permit record may receive a process score of 0 for hardwired lighting if there isa completed MF1-R and a completed WS5-R form in the file. That same record may receive onlya 0.5 design score if the blueprints show recessed cans in the kitchen, but do not specify those ashigh efficacy fixtures. Finally, that same record may receive a field score of 1 if the fixtures arein fact found to be incandescent, and there are no occupancy sensors in the bathroom areas.
Results
A total of 418 records were selected at nine building departments representing 437 measures. Ofthose, a total of 395 measures had permits that were available for complete review. Thisdiscrepancy in number of permits reviewed is due to missing information or the fact that recordsand plans were unavailable on the day of the visit. For example, some records indicated that ameasure was present when it was not, and further investigation ultimately showed that themeasure was not required after all. Other times it was not possible to prove that a measure wasrequired based on the information provided. In still other cases, the file was located but not theplans that would have contained the information necessary to verify compliance. These are all
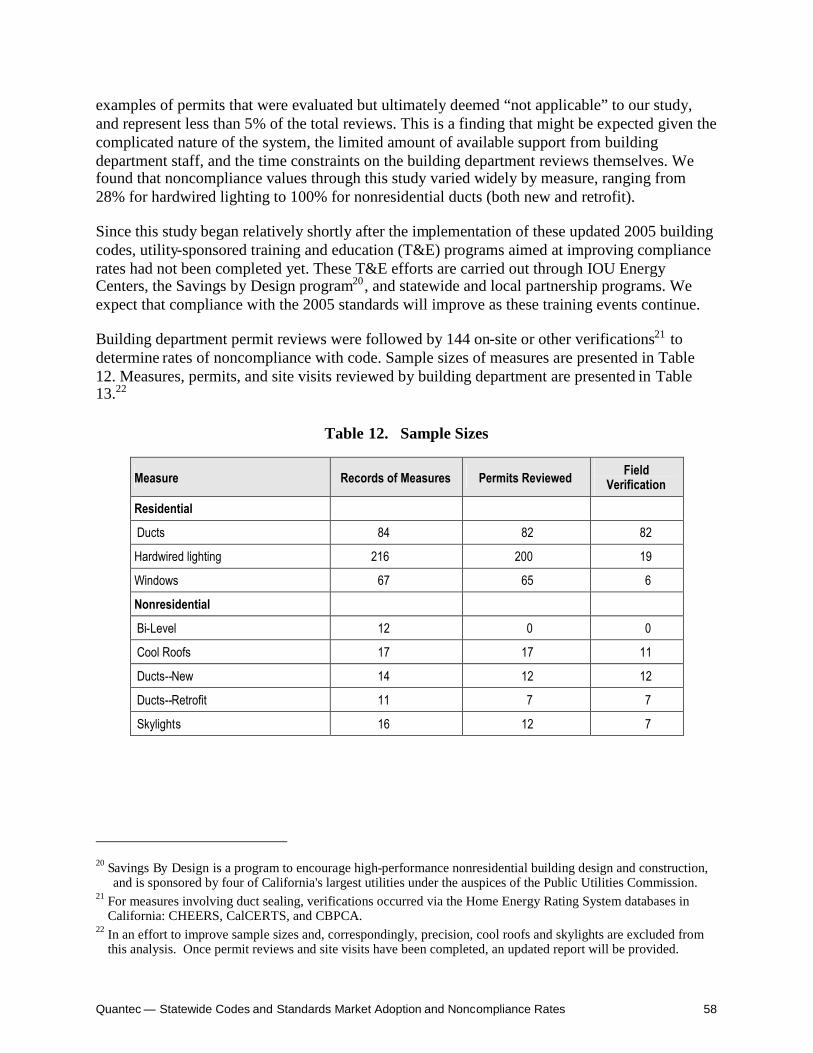
Quantec — Statewide Codes and Standards Market Adoption and Noncompliance Rates 58
examples of permits that were evaluated but ultimately deemed “not applicable” to our study,and represent less than 5% of the total reviews. This is a finding that might be expected given thecomplicated nature of the system, the limited amount of available support from buildingdepartment staff, and the time constraints on the building department reviews themselves. Wefound that noncompliance values through this study varied widely by measure, ranging from28% for hardwired lighting to 100% for nonresidential ducts (both new and retrofit).
Since this study began relatively shortly after the implementation of these updated 2005 buildingcodes, utility-sponsored training and education (T&E) programs aimed at improving compliancerates had not been completed yet. These T&E efforts are carried out through IOU EnergyCenters, the Savings by Design program20 , and statewide and local partnership programs. Weexpect that compliance with the 2005 standards will improve as these training events continue.
Building department permit reviews were followed by 144 on-site or other verifications21 todetermine rates of noncompliance with code. Sample sizes of measures are presented in Table12. Measures, permits, and site visits reviewed by building department are presented in Table13.22
Table 12. Sample Sizes
Measure Records of Measures Permits Reviewed FieldVerification
Residential
Ducts 84 82 82
Hardwired lighting 216 200 19
Windows 67 65 6
Nonresidential
Bi-Level 12 0 0
Cool Roofs 17 17 11
Ducts--New 14 12 12
Ducts--Retrofit 11 7 7
Skylights 16 12 7
20 Savings By Design is a program to encourage high-performance nonresidential building design and construction,and is sponsored by four of California's largest utilities under the auspices of the Public Utilities Commission.
21 For measures involving duct sealing, verifications occurred via the Home Energy Rating System databases inCalifornia: CHEERS, CalCERTS, and CBPCA.
22 In an effort to improve sample sizes and, correspondingly, precision, cool roofs and skylights are excluded fromthis analysis. Once permit reviews and site visits have been completed, an updated report will be provided.

Quantec — Statewide Codes and Standards Market Adoption and Noncompliance Rates 59
Table 13. Measures, Permits, Site Visits
Building Department TotalMeasures Sites
TotalPermits
Reviewed
FieldVerification
Anaheim 45 45 36 20
Arcata 29 28 27 3
Ceres 51 48 51 12
Concord 8 8 8 8
Elk Grove 42 37 38 26
Fullerton 40 39 39 16
Paso Robles 47 45 39 4
Riverside 51 51 50 19
San Diego 71 70 62 13
Sonoma 53 47 45 23
Table 14 summarizes the noncompliance estimates for all measures studied.
Table 14. Summary of Building Measure Noncompliance Estimates
Building Measure Estimated Noncompliance rate Absolute Precision ofEstimate
RelativePrecision of Estimate
ResidentialHardwired lighting 28% 3% 11%Window replacement 68% 7% 10%Duct improvement 73% 0.9% 1.2%NonresidentialLighting controls under skylights 44% 10% 24%Cool roofs 50% 3% 6%Bi-level lighting controls n/a n/a n/aDucts in existing buildings 100% 2% 2%Duct testing/sealing in new buildings 100% 1% 1%
Determining Noncompliance Rates
During the permit review process, permit files were scored to indicate whether or not themeasures were compliant with code. If, for example, the files revealed a measure wasnoncompliant, a score of 1 was assigned, reflecting 100% noncompliance. If the measure wasshown to be compliant, a score of 0 was given. In some instances, paperwork was not complete,

Quantec — Statewide Codes and Standards Market Adoption and Noncompliance Rates 60
but showed some indication of compliance and received a score of 0.5. These scores were usedto obtain an initial estimate of compliance.23
In order to assess the accuracy of permit scores, site visits were carried out on a sample ofbuildings for each measure. Scoring was done using the same methodology described for therecord reviews: a building project noncompliant with code received a score of 1 and compliantprojects were given a score of 0. As with the review of permits, some measures could not befully assessed on site, but appeared to be compliant and, therefore, received a score of 0.5. Forexample, a cool roof that appeared to have some cool roof properties (e.g. light in color) but wasunable to be verified would receive a partial compliance score of 0.5.
There were two exceptions to this method. The first was with respect to residential windowreplacements. In most cases, windows lacked U-factor or NFRC24 labels and could not beverified. However, if during inspection a window tested as low-e and was framed with vinyl, itwas considered better than half compliant and was given a noncompliance score of 0.3.25 Thesecond exception was with regard to hardwired lighting. Though the scoring scheme remainedthe same, weights were applied to the scores in order to account for differences in constructiontype and scale. This additional step was applied after it was found that there was a largediscrepancy in compliance between production housing and single family housing or additions. Itwas found that production homes were significantly more likely to be compliant with the code.In order to properly recognize this and to account for the relative impact of each constructiontype on the residential market as a whole, a weighting factor of 10 was applied to productionhousing, new single-family homes a weight of 2, and remodels a score of 1. This in partrecognizes the large scale repetitive impact of one compliant design being built many times overin a particular subdivision.
In all cases, the final site visit scores were then used to update the initial compliance scores usinga Bayesian statistical analysis as described below.
Finally, all noncompliance scores were weighted according to building department usingbuilding valuation figures for 2005 and 2006.26 Using the total residential and commercialvaluations for the nine building departments we visited for this study, weights were constructedas a proportion of total valuations. For example, the weight applied to residential noncompliancescores in Sonoma County is equal to the residential valuation in Sonoma divided by the totalvaluation of all nine building departments.
23 For more details on the scoring protocol used, see Compliance“Scoring” section.24 The National Fenestration Rating Council provides energy performance ratings for window products.25 The 2005 Ducker Worldwide windows market study, The Distribution of Residential and Nonresidential Windows
and Doors in the 2003 U.S. Market, applied a multiplier of 0.95 to low-e window sales to estimate Energy Starwindow sales. However, Energy Star requirements vary by climate zone, and Energy Star criteria and code criteriado not always exactly agree in California. Therefore, we used a more conservative estimate of 0.7 (0.3noncompliance) for the purposes of this study.
26 California construction valuation figures for 2006 were for the first 9 months of the year. Data were obtained fromthe Construction Industry Research Board (CIRB).

Quantec — Statewide Codes and Standards Market Adoption and Noncompliance Rates 61
Bayes’ TheoremRevising probabilities when new information is obtained is the foundation of Bayes’ Theorem.Often we begin an analysis with an initial or prior probability estimate for a specific event (inthis case the probability that a building measure is noncompliant). Then as additional informationis obtained, we update the prior probability values by calculating revised probabilities, referredto as posterior probabilities. Bayes’ Theorem provides the means of computing theseprobabilities.
For this study, we obtained a sample of building permits from which we estimated the priorprobabilities of noncompliance. We then obtained another sample comprised of site visits anddatabase verifications for selected buildings from the initial review. The probabilities ofnoncompliance estimated from the site visits were then used to revise the priors to estimate theposteriors.
The initial estimated proportion of noncompliance and its corresponding standard error arecomputed as follows:
1
11
1
n
xp
n
ii
and
1
1121
)1(n
pps
where xi is the score (0 to 1; with 1 indicating 100% noncompliance) of a measure for aparticular permit and n1 is the number of permits reviewed for the measure in question.
This is the prior estimate, since it is the result of information collected at the outset of the studyand is subject to updating by a subsequent sample. The prior estimate represents what is believedto be true about noncompliance until more detailed information can be collected to either supportor refute those estimates. Once the site visit scores are incorporated, we then have posteriorestimates, calculated as follows:
)1()1(
11
11
1
22
22
1
1
2
22
ppn
ppn
pn
pn
p
and
)21(2)1()1()1(
11122
22112
ppnppnpppp

Quantec — Statewide Codes and Standards Market Adoption and Noncompliance Rates 62
where p2 is the estimated rate of noncompliance estimated from the site visits (calculation is thesame as for the prior estimate), and n2 is the number of site visits for a given measure.
The following sections explain, by measure, the noncompliance rates found in this study.
Residential Hardwired Lighting
As shown in Table 15 below, we reviewed 200 residential permits for compliance with thehardwired lighting code. Of these, 46% were found to be noncompliant. Nearly ten percent of thereviewed permits were then selected for site visits. The inspected buildings were found to have a21% noncompliance rate. Incorporating that information into the original 46% noncomplianceestimate yields a posterior noncompliance estimate of 28%. At 90% confidence, this estimate hasprecision level of ±3%.
Table 15. Residential Hardwired Lighting
Permits Site Visits
Reviewed Noncompliance Rate CompletedVisits Noncompliance Rate
PosteriorNoncompliance
RatePrecision
200 46% 19 21% 28% ±3%
Residential Windows
Sixty-five permits were obtained for review for the residential windows measure, with 82% ofthese determined to be noncompliant (Table 16). However, from the sample of 65, six sites werevisited for compliance verification, and of those, only 31% were found to be noncompliant. Thisdiscrepancy illustrates the gap between documenting compliance with the code and complyingwith the requirements in the building itself. In this case, because window replacement permitsare given as “counter permits,” there is a poor process in place for requesting and reviewing therequired paperwork that proves compliance. Conversely, window manufacturers, suppliers andcontractors are commonly aware of the code requirement, which leads to a relatively high rate ofcompliance during the purchase and installation of windows. The posterior estimatednoncompliance rate is 68%. The 90% confidence interval is 61% to 75% noncompliance (± 7%).
Table 16. Residential Windows
Permits Site Visits
Reviewed Noncompliance Rate CompletedVisits Noncompliance Rate
PosteriorNoncompliance
RatePrecision
65 82% 6 31% 68% ±7%
Commercial Cool RoofsSeventeen permits for cool roofs were examined for this study, of which eleven were reviewedby site visits. The initial noncompliance rate for cool roofs, as assessed through permit reviews is
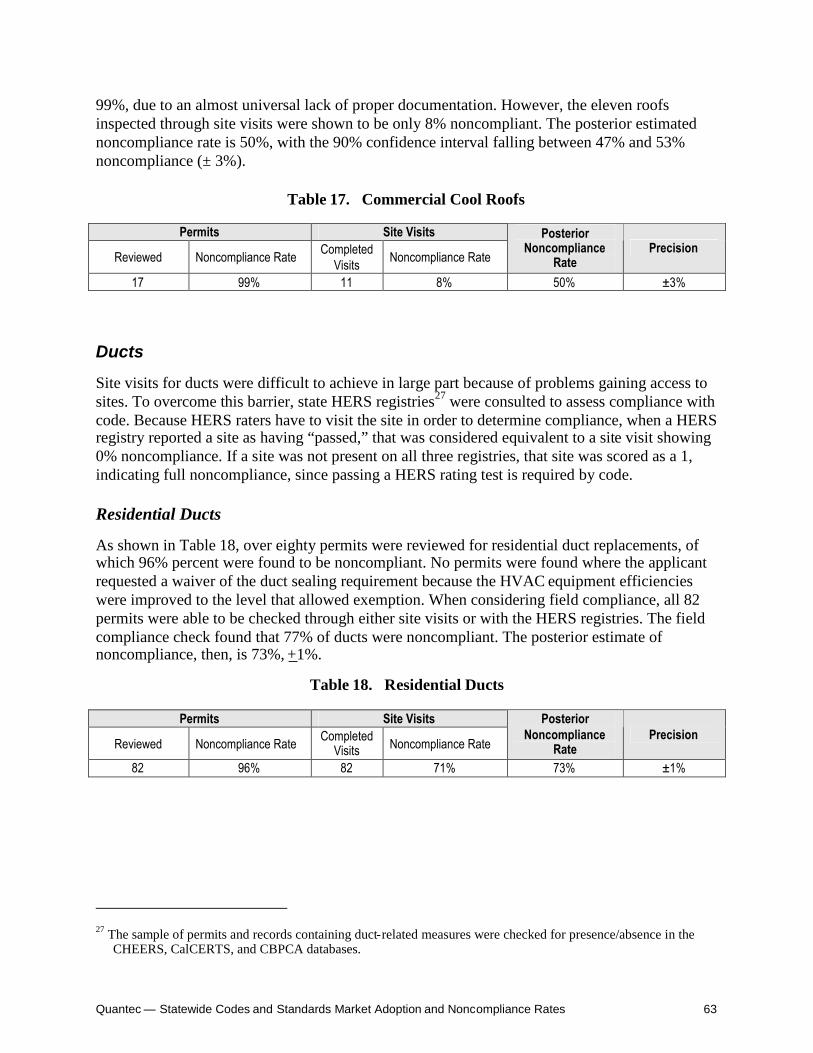
Quantec — Statewide Codes and Standards Market Adoption and Noncompliance Rates 63
99%, due to an almost universal lack of proper documentation. However, the eleven roofsinspected through site visits were shown to be only 8% noncompliant. The posterior estimatednoncompliance rate is 50%, with the 90% confidence interval falling between 47% and 53%noncompliance (± 3%).
Table 17. Commercial Cool Roofs
Permits Site Visits
Reviewed Noncompliance Rate CompletedVisits Noncompliance Rate
PosteriorNoncompliance
RatePrecision
17 99% 11 8% 50% ±3%
Ducts
Site visits for ducts were difficult to achieve in large part because of problems gaining access tosites. To overcome this barrier, state HERS registries27 were consulted to assess compliance withcode. Because HERS raters have to visit the site in order to determine compliance, when a HERSregistry reported a site as having “passed,” that was considered equivalent to a site visit showing0% noncompliance. If a site was not present on all three registries, that site was scored as a 1,indicating full noncompliance, since passing a HERS rating test is required by code.
Residential Ducts
As shown in Table 18, over eighty permits were reviewed for residential duct replacements, ofwhich 96% percent were found to be noncompliant. No permits were found where the applicantrequested a waiver of the duct sealing requirement because the HVAC equipment efficiencieswere improved to the level that allowed exemption. When considering field compliance, all 82permits were able to be checked through either site visits or with the HERS registries. The fieldcompliance check found that 77% of ducts were noncompliant. The posterior estimate ofnoncompliance, then, is 73%, +1%.
Table 18. Residential Ducts
Permits Site Visits
Reviewed Noncompliance Rate CompletedVisits Noncompliance Rate
PosteriorNoncompliance
RatePrecision
82 96% 82 71% 73% ±1%
27 The sample of permits and records containing duct-related measures were checked for presence/absence in theCHEERS, CalCERTS, and CBPCA databases.
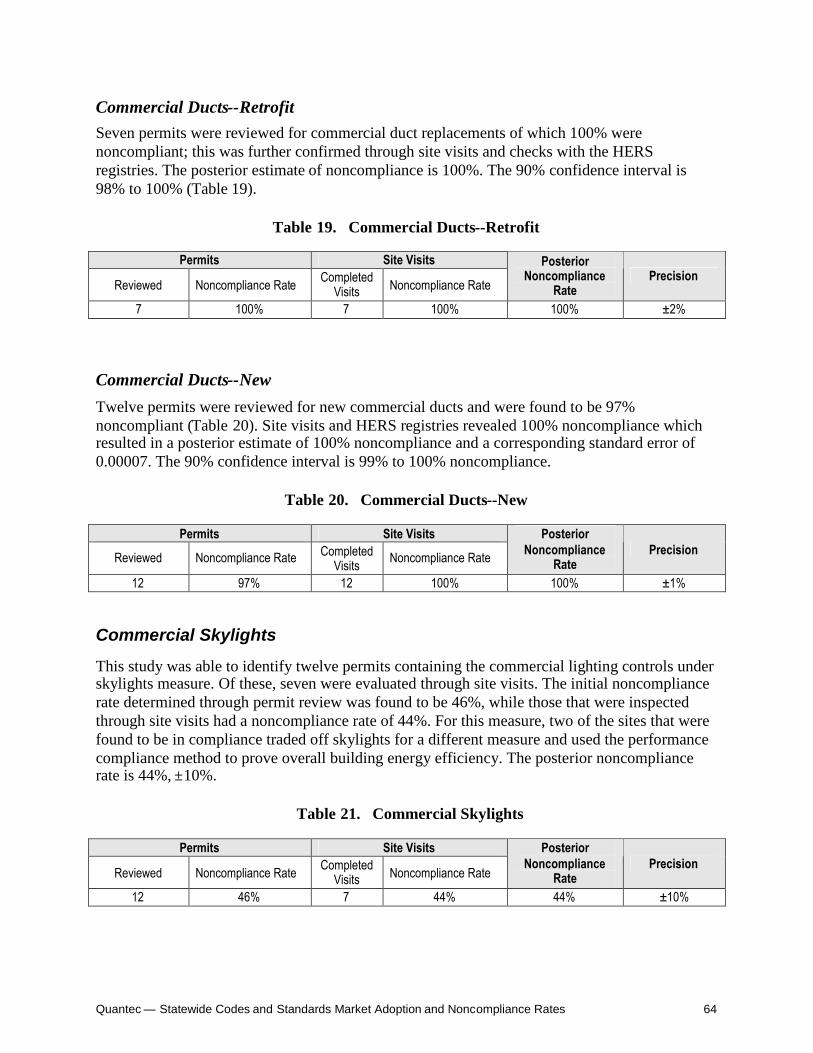
Quantec — Statewide Codes and Standards Market Adoption and Noncompliance Rates 64
Commercial Ducts--RetrofitSeven permits were reviewed for commercial duct replacements of which 100% werenoncompliant; this was further confirmed through site visits and checks with the HERSregistries. The posterior estimate of noncompliance is 100%. The 90% confidence interval is98% to 100% (Table 19).
Table 19. Commercial Ducts--Retrofit
Permits Site Visits
Reviewed Noncompliance Rate CompletedVisits Noncompliance Rate
PosteriorNoncompliance
RatePrecision
7 100% 7 100% 100% ±2%
Commercial Ducts--New
Twelve permits were reviewed for new commercial ducts and were found to be 97%noncompliant (Table 20). Site visits and HERS registries revealed 100% noncompliance whichresulted in a posterior estimate of 100% noncompliance and a corresponding standard error of0.00007. The 90% confidence interval is 99% to 100% noncompliance.
Table 20. Commercial Ducts--New
Permits Site Visits
Reviewed Noncompliance Rate CompletedVisits Noncompliance Rate
PosteriorNoncompliance
RatePrecision
12 97% 12 100% 100% ±1%
Commercial Skylights
This study was able to identify twelve permits containing the commercial lighting controls underskylights measure. Of these, seven were evaluated through site visits. The initial noncompliancerate determined through permit review was found to be 46%, while those that were inspectedthrough site visits had a noncompliance rate of 44%. For this measure, two of the sites that werefound to be in compliance traded off skylights for a different measure and used the performancecompliance method to prove overall building energy efficiency. The posterior noncompliancerate is 44%, ±10%.
Table 21. Commercial Skylights
Permits Site Visits
Reviewed Noncompliance Rate CompletedVisits Noncompliance Rate
PosteriorNoncompliance
RatePrecision
12 46% 7 44% 44% ±10%

Quantec — Statewide Codes and Standards Market Adoption and Noncompliance Rates 65
5. Appliance Standards Noncompliance
Introduction and Background
The state of California’s new appliance efficiency standards (Title 20) went into effect in January2006. Nine of the affected appliances were selected for inclusion in this study based on themagnitude of their estimated energy savings:
Unit heaters and duct furnaces
General service incandescents, Tier I
Metal halide luminaires
DVD players
Televisions
Residential pool pumps, Tier I
Refrigerated canned/bottled beverage vending machines
Walk-in refrigerators/freezers
Pre-rinse spray valves
Appliance manufacturers are required to submit an application to the California EnergyCommission (CEC) with specified information in order to have their product certified as meetingTitle 20. For appliances manufactured after the effective date of these standards (January 1, 2006for all these products), only those that are certified can be sold legally in California. The CEC isrequired to maintain a current database that lists all the certified appliances of each type. Thesedatabases can be accessed at the CEC website.28 A summary of the energy-efficiencyrequirements for each of the appliances listed above is provided in Table 22. This table alsoindicates whether or not a CEC database existed for each appliances when we conducted ourstudy.29
The purpose of this research was to develop a more accurate estimate of the compliance/noncompliance rates for each of the appliances based on empirical data. The existingmethodology (Savings Estimate Spreadsheet) for calculating the impacts of these standards (andthe new Title 24 building standards) starts with a preliminary place holder of 30% for all
28 This information is located at http://energy.ca.gov/appliances/appliance/index.html.29 The most recent updates we used in our study were from September 2006.

Quantec — Statewide Codes and Standards Market Adoption and Noncompliance Rates 66
products in the first and all future years. In reality, noncompliance rates are likely to vary byproduct and they are likely to change over time.
The objectives of this research were to collect and use the best available data to developcompliance/noncompliance rate estimates for each appliance. These estimates provide a snapshotof the rates when the study was conducted. In parallel, another objective was to lay thegroundwork for future studies of the noncompliance rates by identifying research approaches andobstacles that needed to be overcome to maximize the quality of the data and estimates.
Table 22. Description of Standards
Appliance Category In CECDatabase Standard
Televisions Yes Max. standby power usage =3W
DVD Players Yes Max. standby power usage =3WResidential Pool Pumps,Tier 1 No Motor may not be split phase or capacitor start-induction run type
motor
General ServiceIncandescents, Tier 1 No
Max. wattage set for lumen output; applies to most incandescentand halogen lamps between 25 and 150 watts. Rough service,decorative, 3-way, and colored lamps are excluded.Frost/clear: Max. W=(0.05*lumens)+21Soft white: Max. W=(0.05*lumens)+22.5
Metal Halide Luminaires No Allows only pulse-start ballasts for vertical lamps with base upapplications. Probe-start ballasts disallowed.
Walk-in Refrigerators/Freezers No
Usually custom made. Requires automatic closers on doors <4’wide and <7’ high; R-28 insulation in refrigerators, R-36 infreezers; electronically commutated, permanent split capacitortype, or polyphase motors on condenser fans <1 HP;electronically commutated or permanent split capacitor typemotors on evaporator fans <1 HP.
Pre-rinse Spray Valves No Flow rate ≤1.6 gpm @ 60 psi; cleans 60 plates at average of ≤30seconds per plate.
Unit Heaters and DuctFurnaces Yes
Natural gas-fired unit heaters and duct furnaces shall have eitherpower venting or an automatic flue damper
Type Fuel Min.Efficiency @Max. Capacity
Max. WattsduringStandby
Duct furnaces Nat gas 80 10Duct furnaces LPG 80 147Unit heaters Nat gas 80 10Unit heaters LPG 80 147Unit heaters Oil 81 N/A
RefrigeratedCanned/Bottled BeverageVending Machines
Yes Max daily kWh=0.55*(8.66+(0.009*C)); C=rated capacity, # of 12oz. cans

Quantec — Statewide Codes and Standards Market Adoption and Noncompliance Rates 67
Data Collection and Analysis Strategy
Overview of Approach
Our primary approach to estimate noncompliance rates was to identify a sample of retailersand/or wholesalers for each appliance and conduct site visits to collect primary data onbrands/models sold and their sales volumes. We planned to determine whether each brand/modelcomplied with Title 20 and, using the sales volumes, calculate the overall noncompliance rate.Estimates were not derived by utility service area for three main reasons. Consumer products areoften sold by chains that have outlets throughout the state and their sales patterns would not beexpected to vary significantly by location. Many of the vendors we contacted sell products tocustomers across the state, so their sales were not affected by location. Finally, our sample wasdesigned to ensure representative data were collected from across the state; the number of siteswithin individual utility service areas was not sufficient to estimate differences among the areas,if any exist.
A database of California industries was purchased to provide a listing of manufacturers,distributors, wholesalers, and retailers for each appliance.30 Since compliance behavior is likelyto vary by company size, particularly for retailers and wholesalers, we stratified our list to ensurethat when we selected a sample for data collection both large and small companies would berepresented. We used number of employees as the measure of company size and the sites wereranked by number of employees and the cumulative number of employees was calculated. Wecreated two initial strata: those below and those above the 50th percentile in total employment.The resulting groups were reviewed and modified to ensure that adequate numbers of sites werein each group to permit us to collect data from at least two in each stratum in each of threegeneral regions: southern, central, and northern California.
Table 23. Maximum Number of Employees forSites in First Stratum
Appliance Category Maximum No. ofEmployees in First Stratum
Televisions <50DVD Players <50Residential Pool Pumps, Tier 1 <20General Service Incandescents, Tier 1 <50Metal Halide Luminaires <50Walk-in Refrigerators/ Freezers <20Pre-rinse Spray Valves <20Unit Heaters and Duct Furnaces <20Refrigerated Canned/Bottled BeverageVending Machines <10
30 This list was obtained from Alliance Direct Marketing Solutions, LLC.

Quantec — Statewide Codes and Standards Market Adoption and Noncompliance Rates 68
In addition to collecting information from wholesalers/retailers, we planned to contactdistributors and manufacturers of each appliance and obtain relevant information from websitesand request and review catalogs. The mix of information obtained from the different supply-chain members was finalized after we conducted initial research and held discussions with theSRC.
We designed a stratified cluster sampling approach to select retailers and wholesalers for sitevisits. The planned number of outlets to sample was:
120 = 3 (regions) * 2 (strata) * 2 (average # stores in each stratum) * 9 (appliances)+ 24 (adjustment for pool pumps and incandescents being sold at both retail andwholesale outlets)– 12 (adjustment for sales of TVs and DVD players at same retailers)
In addition, we planned to collect website and catalog information from samples of the variousmembers of the supply chains. For each appliance, we proposed selecting a sample of at leastthree manufacturers for information collection and possibly interviews to learn more about theirsupply chain. We targeted including three distributors of seven appliances in our data collectionsample and one wholesaler in addition to those included in our site-visit sample to include in ourwebsite/catalog sample.
Data Collection
During the site visits, we planned to record information for each appliance including suppliername and address, brand, model, date of manufacture, number of units in stock, and approximatesales volume for the appliance type. Given that suppliers can legally continue to sell productsmanufactured prior to January 2006, we intended to document the number of products that weremanufactured before this date.
The site visits were conducted between July 26 and September 11, 2006, by Quantec fieldtechnicians. They began in southern California and moved north. Cities visited included SanDiego, Anaheim, Riverside, Bakersfield, Burbank, Santa Barbara and Oakland. In some cases,phone calls to retailers/wholesalers were substituted for the planned site visits (see discussion innext section). Table 24 presents summary information on the retailer/wholesaler data collection.
From our review of websites and catalogs we recorded characteristics of the appliances and anyreferences to the availability of the appliance for sale in California. A database was created forrecording all this information.
Once we started data collection, this approach had to be modified some to adjust to gaps andlimitations in data availability. This is discussed in the next section.
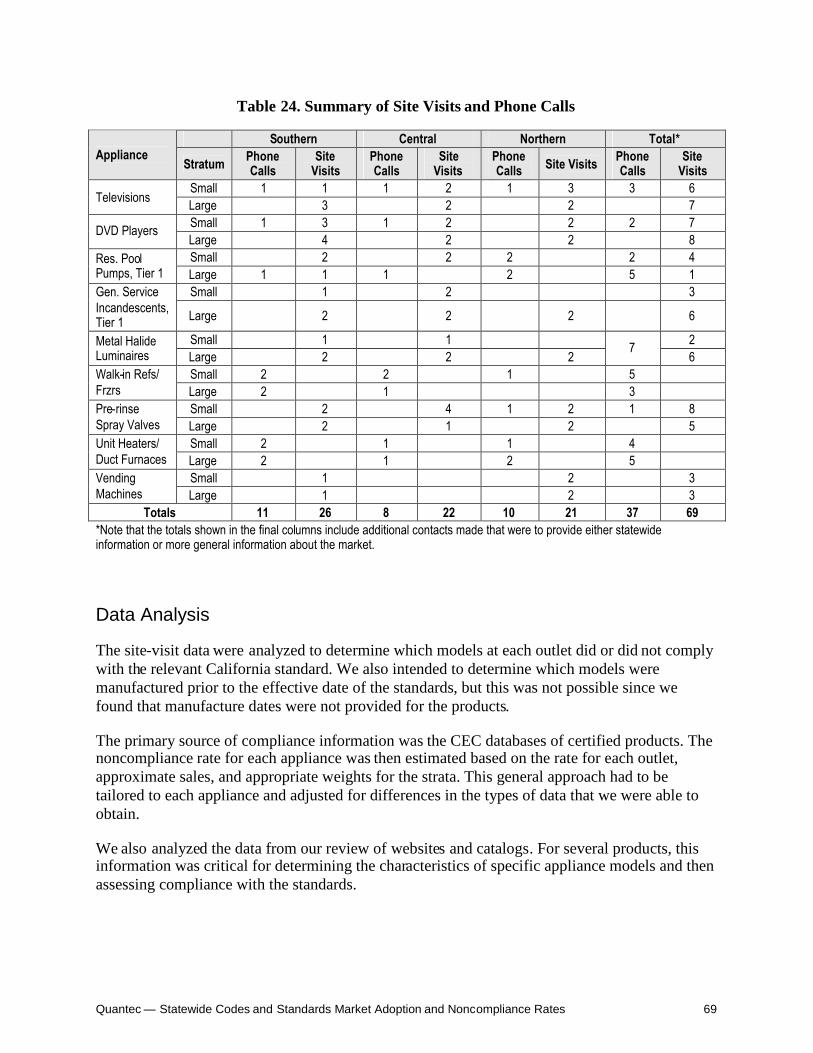
Quantec — Statewide Codes and Standards Market Adoption and Noncompliance Rates 69
Table 24. Summary of Site Visits and Phone Calls
Southern Central Northern Total*Appliance
Stratum PhoneCalls
SiteVisits
PhoneCalls
SiteVisits
PhoneCalls Site Visits Phone
CallsSite
VisitsSmall 1 1 1 2 1 3 3 6
Televisions Large 3 2 2 7Small 1 3 1 2 2 2 7DVD PlayersLarge 4 2 2 8Small 2 2 2 2 4Res. Pool
Pumps, Tier 1 Large 1 1 1 2 5 1Small 1 2 3Gen. Service
Incandescents,Tier 1 Large 2 2 2 6
Small 1 1 2Metal HalideLuminaires Large 2 2 2
76
Small 2 2 1 5Walk-in Refs/Frzrs Large 2 1 3
Small 2 4 1 2 1 8Pre-rinseSpray Valves Large 2 1 2 5
Small 2 1 1 4Unit Heaters/Duct Furnaces Large 2 1 2 5
Small 1 2 3VendingMachines Large 1 2 3
Totals 11 26 8 22 10 21 37 69*Note that the totals shown in the final columns include additional contacts made that were to provide either statewideinformation or more general information about the market.
Data Analysis
The site-visit data were analyzed to determine which models at each outlet did or did not complywith the relevant California standard. We also intended to determine which models weremanufactured prior to the effective date of the standards, but this was not possible since wefound that manufacture dates were not provided for the products.
The primary source of compliance information was the CEC databases of certified products. Thenoncompliance rate for each appliance was then estimated based on the rate for each outlet,approximate sales, and appropriate weights for the strata. This general approach had to betailored to each appliance and adjusted for differences in the types of data that we were able toobtain.
We also analyzed the data from our review of websites and catalogs. For several products, thisinformation was critical for determining the characteristics of specific appliance models and thenassessing compliance with the standards.

Quantec — Statewide Codes and Standards Market Adoption and Noncompliance Rates 70
Data Gaps and Analysis Issues
In the early stages of data collection, it became apparent that several types of gaps andcomplexities would affect the analysis of the data collected for each appliance. For one, as Table22 shows, CEC certification databases existed for only four of the appliances when this studywas conducted. Because Title 20 requires appliance manufacturers to file certificationinformation with the CEC to identify which specific units meet the standards and, therefore, canbe sold legally in California, a strict interpretation of the requirements would suggest that onlyappliances listed in the databases met the standards.31
Quantec discussed this issue with the SRC and the group agreed that this interpretation was toorigid for the purposes of this study since the study was aiming to estimate effects on energysavings, not absolute compliance with all requirements of the standards. This decision bothcomplicated the analysis (since determining compliance was not a simple matter of searching forproducts in the CEC databases) and introduced sources of uncertainty (such as gaps in other datathat had to be obtained to ascertain compliance). To compensate for the added research effortrequired to deal with products for which there were no databases, agreement was reached onusing phone calls to collect data in place of some of the site visits as long as the quality of theinformation was not diminished.
A related issue was that the CEC databases were updated during the course of our research asmanufacturers submitted more information. We started our study with the databases available inmid-July, but updated our analysis using the databases available in mid-September, 2006.
Another issue was that appliances sold that were manufactured prior to 2006 did not have tocomply with the standards, thus allowing retailers and wholesalers to sell their preexistinginventory of products. We found that it was not possible to determine the date of manufacture forindividual items. During our outlet site visits, we examined products and packaging and wereunable to locate manufactured date. Consequently, it was not possible to identify those itemsmanufactured only in 2006 and calculate their noncompliance rates. In consultation with theSRC, the decision was made to document noncompliance of all products being sold during 2006,regardless of their date of manufacture. Because energy impacts of products sold in 2006 aredetermined by their characteristics regardless of when they were manufactured, this was anappropriate approach for calculating overall first-year impacts of the standards. Being unable toisolate appliances manufactured in 2006 did increase the scope of the data analysis beyond whatwas anticipated initially, however.
The biggest hurdles and uncertainties encountered in data collection and analysis were related tosales volume data. Our goal was to obtain actual sales data by model from each source. Althoughsome of the sites we visited were able and willing to provide these data, many were either unableto provide them or refused. Some of the outlets said the information was proprietary. Others saidthe information had to be obtained from corporate offices and we had limited success obtainingthese data when we contacted corporate offices. In some cases, the number of brands/models
31 One argument for why manufacturers had not submitted certification information on all appliances was that theindustry had challenged the standards in the courts and this issue was not decided until mid-2006.

Quantec — Statewide Codes and Standards Market Adoption and Noncompliance Rates 71
sold was so large that the company representatives were unwilling to spend the time compilingthe information. Our approach for resolving this issue varied by outlet and product. For someappliances, we counted the quantity of individual products on the shelves or in the storeinventory and used this information to inform our estimate of noncompliance rates. In othercases, we had to conduct follow-up phone calls to request information such as the top sellingmodels and their proportion of total sales. In all cases, we attempted to obtain the approximatenumber of the appliances each retailer/wholesaler sold in a year as a way to weight theirnoncompliance data.
Noncompliance Assessment
We used two general techniques to determine compliance and, hence, noncompliance. In onecase, a CEC database of compliant units was available. In the second case, no compliancedatabase was yet available. These approaches are described below.
Differences in the types of data available from the contacts for each appliance required flexibilityand innovation in how we analyzed each. Appendix B presents our data and findings for eachretailer/wholesaler and supplemental information we collected to provide the most completepicture possible of the types of information we relied on and the uncertainties inherent in theanalyses.
Methodology—CEC database exists. As noted earlier, products for which a CEC database existsincluded televisions, DVD players, refrigerated canned/bottled beverage vending machines, andunit heaters and duct furnaces. Model numbers that were acquired during the site visits orpreliminary phone calls were compared with the model numbers contained in the CECdatabase.32
Using Excel functions, we identified units with model numbers that matched a number in thedatabase exactly and deemed the units to comply. We then used our “close” match subroutine toidentify units with numbers very similar to ones in the database. We manually examined thissecond list further for typographical errors and permitted variance in “compliant” model numbers(e.g., ABC12F and ABC12G). This secondary analysis resulted in the ability to match additionalmodel numbers to the database, which reduced the number of products in question. This processrequired the analysts to apply discerning judgment to make determinations about whether theappliance should be counted as compliant.
For all appliances for which a CEC database exists, it is possible that some units that are not inthe database do, in fact, comply with the performance requirements of the standard. Our analysisrelied directly on the database when one was available; therefore, noncompliance estimates forthese products are likely to be somewhat conservative because other, possibly complying unitswere not included.
32 Due to the extent of small variations in model numbers, we created a unique subroutine in Excel to identify“close” matches in addition to exact matches.

Quantec — Statewide Codes and Standards Market Adoption and Noncompliance Rates 72
Methodology—no database exists. As noted above, the SRC agreed that we should developcompliance/noncompliance rate estimates for those five products for which no CEC databasewas available—residential pool pumps, general service incandescents, metal halide luminaires,walk-in refrigerators/ freezers, and pre-rinse spray valves. To do so required a data collectionprocess similar to the one used for the other appliances, but expanded as needed to obtain datarequired to determine compliance (e.g., lumens and watts for incandescent lamps). In addition,we then had to perform the calculations or analysis for each appliance that was required to assesscompliance. For incandescent lamps, for example, it was necessary to calculate the allowablewatts for the lumen output and compare that with the level allowed by the standards.
Reporting Results
The data and analysis issues identified above were discussed with the SRC once they becameapparent. There was general agreement that the steps being conducted were appropriate given thescope of this study. The group also felt that the lessons learned from this study would be usefulfor future noncompliance rate studies that were being designed.
As a result of these discussions, our analysis was structured to provide the following informationin addition to the best estimates possible of compliance/noncompliance rates:
1. Discussion and assessment of uncertainties: For each appliance we discuss the types offactors that affected the uncertainties in the data and resulting noncompliance rateestimates. We provide a qualitative assessment of the accuracy of the estimates.
2. Lessons learned: To support future studies of noncompliance with Title 20, wedocument the types of problems encountered collecting and analyzing the required dataand how we tackled these problems.
Summary of Noncompliance Findings
Our estimates of noncompliance rates for each appliance are presented in Table 25. The detailsof how the rates were determined for each product are presented in Appendix B. The table alsoshows our assessment of the certainty that can be attached to each estimate. This assessment isqualitative, based on the types of data available, number of observations, and other factors.

Quantec — Statewide Codes and Standards Market Adoption and Noncompliance Rates 73
Table 25. Summary of Appliance Noncompliance Estimates for 2006
Appliance Category Estimatednoncompliance rate
Certainty level ofestimate
Televisions 41% MediumDVD Players 57% MediumResidential Pool Pumps, Tier 1 15% MediumGeneral Service Incandescents, Tier 1 27% MediumMetal Halide Luminaires 37% LowWalk-in Refrigerators/ Freezers 0% MediumPre-rinse Spray Valves 4.2% HighUnit Heaters and Duct Furnaces 44% LowRefrigerated Canned/Bottled BeverageVending Machines 63% Low
Consumer Electronics: TelevisionsElectronic products that consume standby energy are included in the consumer electronicmeasures.
The standby energy use associated with residential televisions in California is estimatedat 7.3W. The standard provides that the maximum allowable standby power level fortelevisions would be 3W.
Data Collection and Methodology
Because this standard governs consumer products that are readily available for purchase at retailestablishments, site visits were conducted in an effort to collect product and inventoryinformation directly from the consumer’s sources of these appliances. When possible, visits werescheduled with companies that market both televisions and DVDs for the purpose of efficiency.While on site, model numbers and inventory counts were recorded when available. However, inmany instances only a display model was available for observation on the sales floor, whileinventory was kept in a back stock room. Security and safety issues prevented some of theretailers from allowing inventory counts of these non-public stocking areas. Additionally, whenknowledgeable sales representatives were available for questioning, an attempt was made toobtain sales data for the appliances; however, it was found that this information was notgenerally available to the sales clerks. To supplement the information collected from retailoutlets, we conducted multiple calls to corporate offices and faxed information requests. Itshould be noted for future efforts that the corporate offices were largely non-responsive.
It should also be noted that while discontinued or clearance items were recorded as such whenpossible, this is not information that is generally presented to the public. Therefore, thecompliance rates that are presented herein may include products that are not available for order,but are still available for purchase by the consumer.
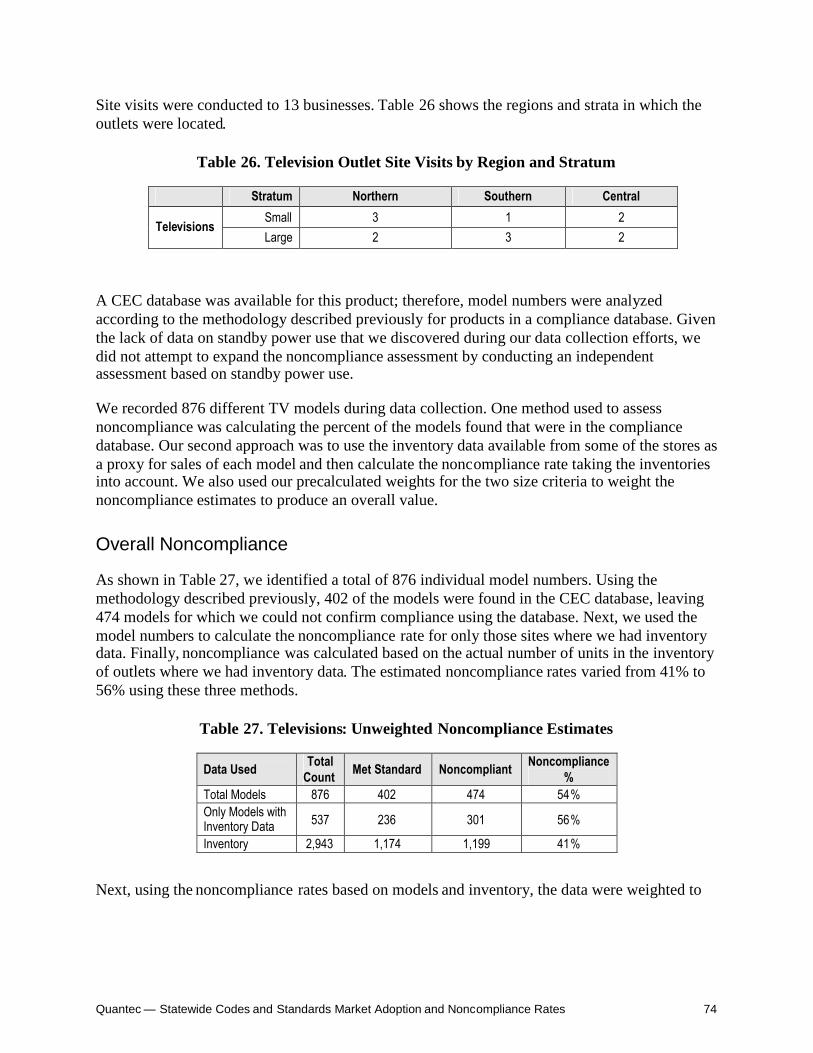
Quantec — Statewide Codes and Standards Market Adoption and Noncompliance Rates 74
Site visits were conducted to 13 businesses. Table 26 shows the regions and strata in which theoutlets were located.
Table 26. Television Outlet Site Visits by Region and Stratum
Stratum Northern Southern Central
Small 3 1 2Televisions
Large 2 3 2
A CEC database was available for this product; therefore, model numbers were analyzedaccording to the methodology described previously for products in a compliance database. Giventhe lack of data on standby power use that we discovered during our data collection efforts, wedid not attempt to expand the noncompliance assessment by conducting an independentassessment based on standby power use.
We recorded 876 different TV models during data collection. One method used to assessnoncompliance was calculating the percent of the models found that were in the compliancedatabase. Our second approach was to use the inventory data available from some of the stores asa proxy for sales of each model and then calculate the noncompliance rate taking the inventoriesinto account. We also used our precalculated weights for the two size criteria to weight thenoncompliance estimates to produce an overall value.
Overall Noncompliance
As shown in Table 27, we identified a total of 876 individual model numbers. Using themethodology described previously, 402 of the models were found in the CEC database, leaving474 models for which we could not confirm compliance using the database. Next, we used themodel numbers to calculate the noncompliance rate for only those sites where we had inventorydata. Finally, noncompliance was calculated based on the actual number of units in the inventoryof outlets where we had inventory data. The estimated noncompliance rates varied from 41% to56% using these three methods.
Table 27. Televisions: Unweighted Noncompliance Estimates
Data Used TotalCount Met Standard Noncompliant Noncompliance
%Total Models 876 402 474 54%Only Models withInventory Data 537 236 301 56%
Inventory 2,943 1,174 1,199 41%
Next, using the noncompliance rates based on models and inventory, the data were weighted to

Quantec — Statewide Codes and Standards Market Adoption and Noncompliance Rates 75
reflect the two size strata established during the initial site selection process. The results based onthe inventory data are presented in Table 28.33
Table 28. Televisions: Inventory Based Weighted Noncompliance Estimate
Strata Weights OriginalNoncompliance
WeightedNoncompliance
Final ProductNoncompliance
Small 0.30 40% 12%TotalModels Large 0.70 42% 29%
41%
Since inventory counts were available at several of the sites, we were able to use them in thenoncompliance rate calculation. Ideally, we would have used sales data in the analysis, but it wasnot possible to obtain sufficient sales data to produce accurate estimates. From our study of someof the other products for which we had both inventory data and sales data available, theinventory data appeared to be a reasonable proxy for sales.
Our final estimate of overall noncompliance for televisions is 41%.
This is likely to be an overestimate of noncompliance because we did not attempt to assesscompliance for models that were not included in the CEC compliance database; we assumed thatall unlisted models were noncompliant. The noncompliance rate is probably increased also by thefact that stores continue to sell models manufactured before January 2006, which are notrequired to meet the new standards. Over time, noncompliance should decrease as these modelsare sold.
Given the data available, we assign a medium level of certainty to our final noncomplianceestimate. Certainty was increased because the data were drawn from a large sample of stores thatwere distributed throughout California. When inventory data were available, we conductedcomplete counts so these estimates should be quite accurate. The main sources of uncertaintywere possible differences between inventory counts and actual sales; incomplete matches ofmodel numbers with the compliance database; and no compliance assessment of models notfound in the database. The steps we took to match the recorded model numbers with those listedin the database where described earlier. The method was automated using Excel, but it was notperfect. The likely effect of these uncertainties was to bias our noncompliance estimatedownward.
Consumer Electronics: DVDs
The standard establishes the same requirement for DVDs as televisions.
The standby energy use associated with residential DVDs in California is estimated at 4.2W. The standard provides that the maximum allowable standby power level for DVDswould be 3W.
33 Using the model count data alone, the estimated noncompliance rate was 54% for both strata.
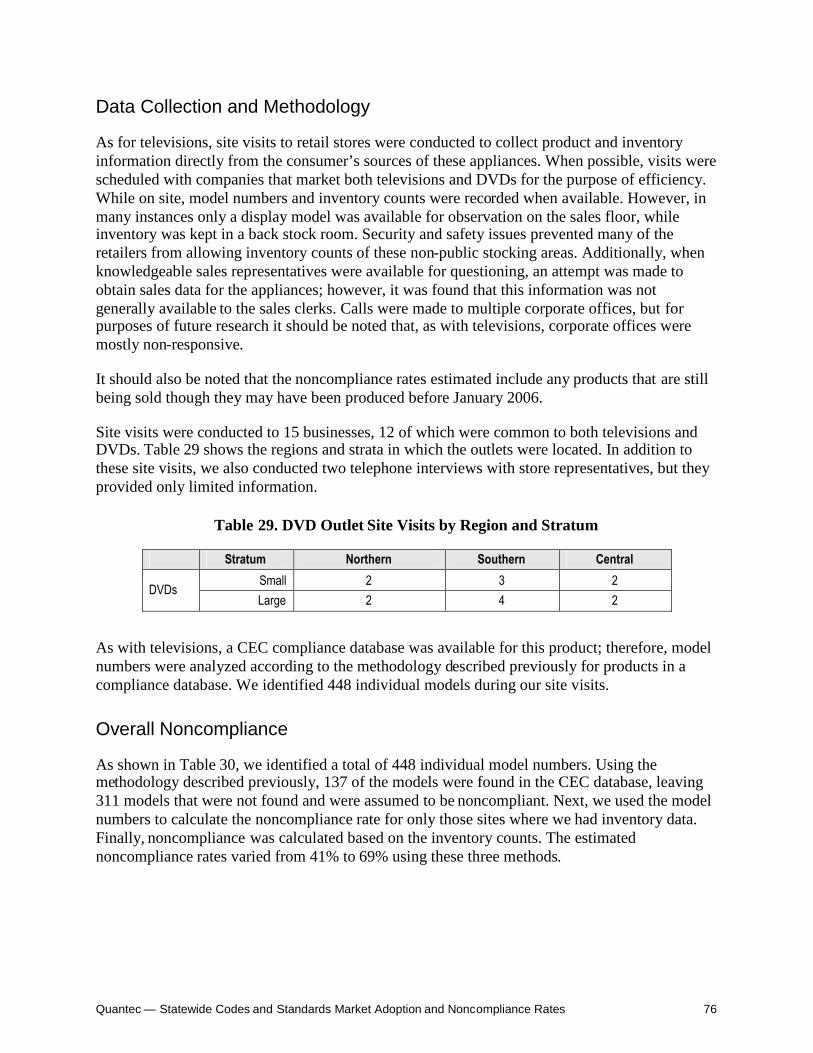
Quantec — Statewide Codes and Standards Market Adoption and Noncompliance Rates 76
Data Collection and Methodology
As for televisions, site visits to retail stores were conducted to collect product and inventoryinformation directly from the consumer’s sources of these appliances. When possible, visits werescheduled with companies that market both televisions and DVDs for the purpose of efficiency.While on site, model numbers and inventory counts were recorded when available. However, inmany instances only a display model was available for observation on the sales floor, whileinventory was kept in a back stock room. Security and safety issues prevented many of theretailers from allowing inventory counts of these non-public stocking areas. Additionally, whenknowledgeable sales representatives were available for questioning, an attempt was made toobtain sales data for the appliances; however, it was found that this information was notgenerally available to the sales clerks. Calls were made to multiple corporate offices, but forpurposes of future research it should be noted that, as with televisions, corporate offices weremostly non-responsive.
It should also be noted that the noncompliance rates estimated include any products that are stillbeing sold though they may have been produced before January 2006.
Site visits were conducted to 15 businesses, 12 of which were common to both televisions andDVDs. Table 29 shows the regions and strata in which the outlets were located. In addition tothese site visits, we also conducted two telephone interviews with store representatives, but theyprovided only limited information.
Table 29. DVD Outlet Site Visits by Region and Stratum
Stratum Northern Southern Central
Small 2 3 2DVDs
Large 2 4 2
As with televisions, a CEC compliance database was available for this product; therefore, modelnumbers were analyzed according to the methodology described previously for products in acompliance database. We identified 448 individual models during our site visits.
Overall Noncompliance
As shown in Table 30, we identified a total of 448 individual model numbers. Using themethodology described previously, 137 of the models were found in the CEC database, leaving311 models that were not found and were assumed to be noncompliant. Next, we used the modelnumbers to calculate the noncompliance rate for only those sites where we had inventory data.Finally, noncompliance was calculated based on the inventory counts. The estimatednoncompliance rates varied from 41% to 69% using these three methods.

Quantec — Statewide Codes and Standards Market Adoption and Noncompliance Rates 77
Table 30. DVDs: Unweighted Noncompliance Estimates
Data Used TotalCount Met Standard Noncompliant Noncompliance
%Total Models 448 137 311 69%Only Models withInventory Data 199 136 63 68%
Inventory 2,943 1,174 1,199 41%
The results based on DVD inventories are shown in Table 31.34 Noncompliance was more thantwice as high for large stores as it was for small stores.
Table 31. DVDs: Inventory Based Weighted Noncompliance Estimates
Strata Weights OriginalNoncompliance
WeightedNoncompliance
Final ProductNoncompliance
Small 0.301 30% 9%TotalModels Large 0.699 68% 48%
57%
Since inventory counts were available at several of the sites, we were able to use them in thenoncompliance rate calculation. Ideally, we would have used sales data in the analysis, but it wasnot possible to obtain sufficient sales data to produce accurate estimates. As noted in thediscussion of televisions, the inventory data appeared to be a reasonable proxy for sales.
Our final estimate of overall noncompliance for DVDs is 57%.
This is likely to be a conservative estimate for the same reasons discussed earlier for televisions.These include assuming that all unlisted models were noncompliant and the fact that storescontinue to sell models manufactured before January 2006.
Given the data available, we assign a medium level of certainty to our final noncomplianceestimate. Certainty was increased because the data were drawn from a large sample of storesdistributed throughout California. When inventory data were available, we conducted completecounts so these estimates should be quite accurate. The main sources of uncertainty werepossible differences between inventory counts and actual sales; incomplete matches of modelnumbers with the compliance database; and no compliance assessment of models not found inthe database.
Residential Pool Pumps
The new Title 20 standards prohibit all residential pool pump from using split-phase or capacitorstart-induction run type motors. All pool pump motors manufactured in 2006 must meet this Tier1 requirement. This standard eliminates use of the least energy-efficient motors. In Tier 2, the
34 Noncompliance based just on model counts was 69%.
Quantec — Statewide Codes and Standards Market Adoption and Noncompliance Rates 78
standard will require every motor of 1-horsepower or more to have multi-speed capabilities withpump controls. Tier 2 is effective on 2008 and will not be discussed in this section since thepurpose is to verify compliance with the 2006 standard.
Data Collection and Methodology
Capacitor start–induction run motors, generally known as capacitor start motors, are consideredthe industry standard, and are less expensive than more energy-efficient types of motors.Capacitor run motors, on the other hand, have the distinction of being energy efficient or, asreferred to by some motor manufacturers, as “conservationist” motors. According to the CASEreport prepared for this standard, manufacturers offer high efficiency pump-motor combinationsfor most of their product lines, typically using capacitor start-capacitor run motors.
There was no compliance database available for pool pumps, so we had to develop an approachto assess noncompliance. In a prior study it was found that specific pump efficiency data are notgenerally published by manufacturers and are not readily available from other sources.35 Afterperforming research for this project, we also found that specific pump efficiency data are notgenerally published, thereby making it difficult to verify if specific pumps meet the newstandards. Because of this, in some cases we had to make assumptions to assess noncompliance;these assumptions are discussed in detail below.
Sites visits to various pool pump retailers/dealers were made throughout California. Theseprovided a snapshot of the inventory available, including model number, speed-type, and horsepower rating. During our site visits we recorded 133 pump model numbers. This information isuseful. However, it does not verify the motor type since pumps are sold as a unit; motors are onlyone part of the pump assembly and sourced from original equipment manufacturers (OEMs).
We developed a two-fold approach to assess noncompliance in the absence of a compliancedatabase. First, we had to identify the part number for the motor used in each pump by reviewingthe product manual. We found that the majority of all the pump manufacturers had motors madeby only one manufacturer. Second, we had to cross-reference the pump motor part number withthe motor manufacturer stock number.
One problem with this method is that not all pump motor part numbers were in the motormanufacturer’s database. Also, characteristics of the motors are generally not disclosed withoutcross-referencing to secondary data such as Motor-Master and this source is not completely up todate or complete. The motor manufacturers, however, typically do provide notation for theirenergy-efficient models by classing them as “conservationist” motors, capacitor run, and thesemeet the standards. However, in cases where the notation is not present it is possible that themotor still may or may not meet the standards. Overall, then we had to apply four generalassumptions to assess noncompliance:
35 Codes and Standards Enhancement Initiative For PY2004: Title 20 Standards Development Analysis of StandardsOptions For Residential Pool Pumps, Motors, and Controls.

Quantec — Statewide Codes and Standards Market Adoption and Noncompliance Rates 79
1) To remain conservative, all motors found without specific energy-efficiency notationby the motor manufacturers are considered capacitor start motors and, therefore, notcompliant with the standard.
2) Where pump motor part numbers contain numbers very similar to the available motormanufacturers’ list, the motor type is assumed to be the same.
3) For some pumps, certain similarities in the model numbers occurred that appeared tobe related to energy efficiency. For example, “EE” was in the motor part number forsome units labeled “conservationist” and we assumed that this meant “energyefficient” and extended this assumption to other motors that were not found in amanufacturer’s motor list.
4) All dual-speed (or variable speed) motors meet the standard.
The validity of several of these assumptions were confirmed during phone interviews after ourassessment began. To obtain this type of information, we contacted a range of market actorsknowledgeable about pool pumps.
Our initial data were collected through a combination of site visits (5) and phone calls (6) to 11pool pump business locations, distributed as shown in Table 32. One additional phone call wasmade to obtain information of relative to statewide data.
Table 32. Residential Pool Pumps, Number of Outlets Contacted by Region and Stratum
Stratum Northern Southern Central
Small 2 2 2Large 2 2 1
The small businesses were distributed uniformly across the three regions. The larger companiesvisited have multiple locations throughout California. These companies distribute and installtheir products across the state. The large stratum businesses represent only two differentcompanies, although we visited six different locations for them.
During our site visits, we recorded all of their display or inventory pool pump model numbers.As stated before, 133 different model number were recorded. However, since there was overlapin the models carried among the different sites, we actually recorded a total of 214 pool pumpmodels.
After we recorded the pump model number at each site, we found the corresponding motor IDnumber in manuals we obtained from the manufacturers. As noted above, we then cross-referenced that ID number to the motor manufacture stock information to verify motor type andassess noncompliance with the standard. Table 33 summarizes the information collected on poolpump models; the distribution of motor types; how many required application of one or more ofthe assumptions described above to determine noncompliance; and the assumptions that wereapplied.

Quantec — Statewide Codes and Standards Market Adoption and Noncompliance Rates 80
Table 33. Site Visit Summery of Pool Pump Models and Assumptions Made
Motor Type Number of PoolPump Models
Number DeterminedUsing Assumptions
AssumptionsApplied
Capacitor Start 43 28 1, 2Capacitor Run / Other 127 77 2, 3
Dual Speed 25 25 4Not Found 19 0 -Total 214 130 -1=No energy-efficiency notation found2=Motor number similar to number of known motor3=Part of motor number indicated compliance in known motor4=Dual (or variable) speed motor
Of the total recorded, 19 pool pump models were not found in any reference base and we wereunable to apply any of our assumptions other than to be conservative and assume these modelsdo not comply. We note that it is likely that a significant share of the pumps found during ourvisits were stock left over from 2005 and were not required to comply with the new standard.
A lack of consistent and complete information provided by the businesses during the site visitsmade it necessary to make follow-up calls to fill some gaps, clarify some of the information, andobtain sales data. Out of the 11 surveyed locations there are eight different companiesrepresented. We visited all 11 sites and contacted the eight companies by phone.
Overall Noncompliance
We calculated overall weighted noncompliance using two approaches; one used the site visitmodel data and the other incorporated the sales information obtained through the follow-upphone survey. It is important to note that two to three months elapsed between the time the sitevisits and phone surveys were conducted, so the compliance picture would be expected to changeand improve based on the phone survey information.
The model-based noncompliance rates from the site visits were weighted to reflect the two stratathat were established during our site selection process. This resulted in an overall noncompliancerate of 25%, as presented in Table 34.
Table 34. Pool Pumps: Site Survey Model Number Noncompliance
Strata Weights OriginalNoncompliance
WeightedNoncompliance
Final ProductNoncompliance
Small 0.547 34% 19%Large 0.453 14% 6%
25%
The noncompliance rates for those companies from which we were able to obtain additionalinformation during the follow-up phone survey were also weighted to reflect the two strata. Thisresulted in an overall noncompliance rate of 15%, as presented in Table 35.
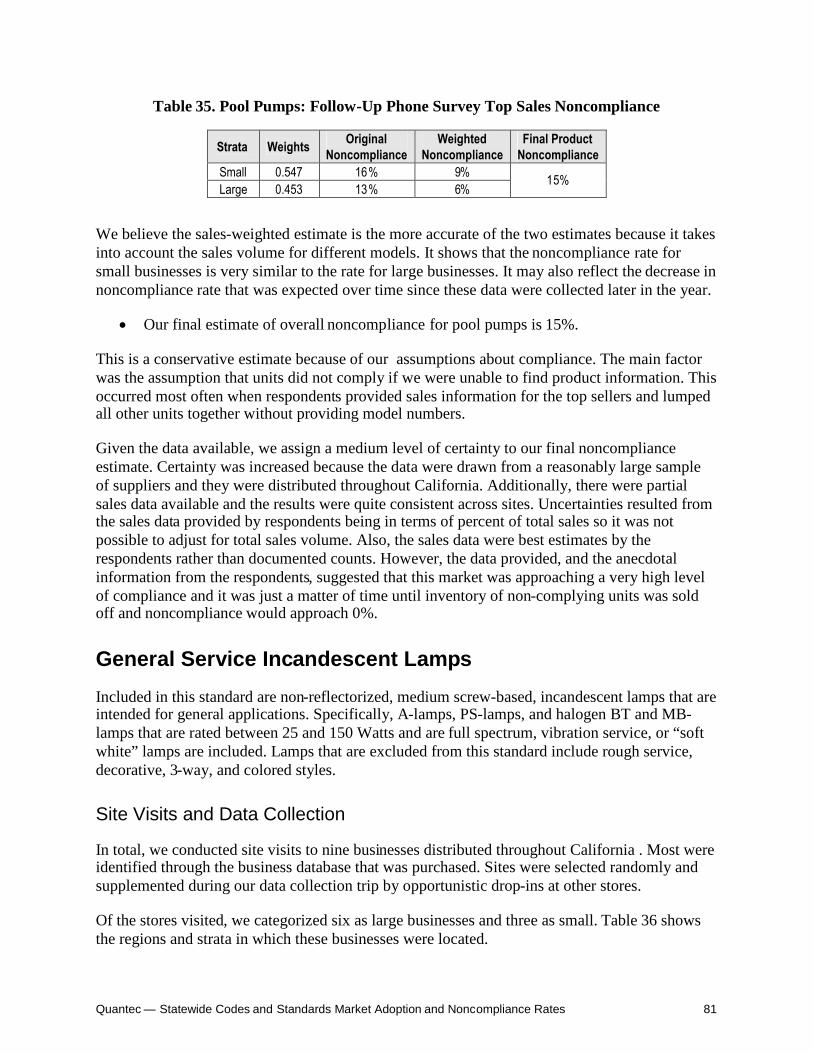
Quantec — Statewide Codes and Standards Market Adoption and Noncompliance Rates 81
Table 35. Pool Pumps: Follow-Up Phone Survey Top Sales Noncompliance
Strata Weights OriginalNoncompliance
WeightedNoncompliance
Final ProductNoncompliance
Small 0.547 16% 9%Large 0.453 13% 6%
15%
We believe the sales-weighted estimate is the more accurate of the two estimates because it takesinto account the sales volume for different models. It shows that the noncompliance rate forsmall businesses is very similar to the rate for large businesses. It may also reflect the decrease innoncompliance rate that was expected over time since these data were collected later in the year.
Our final estimate of overall noncompliance for pool pumps is 15%.
This is a conservative estimate because of our assumptions about compliance. The main factorwas the assumption that units did not comply if we were unable to find product information. Thisoccurred most often when respondents provided sales information for the top sellers and lumpedall other units together without providing model numbers.
Given the data available, we assign a medium level of certainty to our final noncomplianceestimate. Certainty was increased because the data were drawn from a reasonably large sampleof suppliers and they were distributed throughout California. Additionally, there were partialsales data available and the results were quite consistent across sites. Uncertainties resulted fromthe sales data provided by respondents being in terms of percent of total sales so it was notpossible to adjust for total sales volume. Also, the sales data were best estimates by therespondents rather than documented counts. However, the data provided, and the anecdotalinformation from the respondents, suggested that this market was approaching a very high levelof compliance and it was just a matter of time until inventory of non-complying units was soldoff and noncompliance would approach 0%.
General Service Incandescent Lamps
Included in this standard are non-reflectorized, medium screw-based, incandescent lamps that areintended for general applications. Specifically, A-lamps, PS-lamps, and halogen BT and MB-lamps that are rated between 25 and 150 Watts and are full spectrum, vibration service, or “softwhite” lamps are included. Lamps that are excluded from this standard include rough service,decorative, 3-way, and colored styles.
Site Visits and Data Collection
In total, we conducted site visits to nine businesses distributed throughout California . Most wereidentified through the business database that was purchased. Sites were selected randomly andsupplemented during our data collection trip by opportunistic drop-ins at other stores.
Of the stores visited, we categorized six as large businesses and three as small. Table 36 showsthe regions and strata in which these businesses were located.

Quantec — Statewide Codes and Standards Market Adoption and Noncompliance Rates 82
Table 36. General Service Incandescent Lamps: Number of BusinessesContacted by Region and Stratum
Stratum Northern Southern CentralSmall 0 1 2
Large 2 2 2
When we conducted our site visits, no manufacturers had submitted their complianceinformation so no CEC database was available for this product. The standard is written in termsof allowable wattage for a given lumen output. To check noncompliance, we recorded the twocharacteristics during our site visits that we needed, labeled lumen and rated wattage, for thepurpose of applying the formulas established by the standard:
1. Frost or Clear: Max. Watts=(0.05*lumens)+212. Soft White: Max. Watts=(0.05*lumens)+22.5
In addition, product model numbers, inventory counts, and some sales data were recorded duringthe site visits. Unfortunately, lamp type such as “soft white,” “rough-service,” “frost,” or “clear”was not recorded consistently while on site. This information is needed to ascertain whether thestandard applies and, if so, which specific formula must be met. We were able to use internetresearch using product model numbers to fill in much of this missing information.
Due to the gaps and inconsistencies in the information provided by the businesses during the sitevisits, follow-up calls were made to each of the sites in an effort to supplement the originalinformation. The staff we were able to reach often did not have the information we were seeking.This may be due, in part, to the fact that most of the businesses selected for site visits were large,retail chains with corporate offices that had the required data, but may not have even beenlocated in California.
Noncompliance Analysis Methodology
A multi-step process was developed for the purpose of determining compliance based on lumenand wattage ratings. First, the recorded lumen value for each lamp was input into the calculationspecified for Frost or Clear type lamps, which was the stricter of the two formulas set forth in thestandard. If the recorded wattage was found to be less than the maximum allowed, as determinedby the formula, then the lamp was considered compliant whether it was Frost/Clear or SoftWhite.36
If the recorded wattage was found to be greater than the wattage allowed, then the recordedlumen value was input into the formula for Soft White type lamps. If the recorded wattage was
36 It is important to note that since we did not have complete information on lamp type, it was possible that somelamps that passed this test were of a type not required to meet the standard. By potentially including some of theselamps in our calculation, the compliance rate could be overstated. On the other hand, if some of these lamps werenot required to meet the standard, but did anyway, then these products were more efficient than required by thestandard.

Quantec — Statewide Codes and Standards Market Adoption and Noncompliance Rates 83
less than the maximum allowed for this style of lamp then it was treated as possibly compliantsince we did not know from the data collected at this point whether the lamp was, in fact, SoftWhite. For those that met the Soft White criterion only, additional research was necessary inorder to determine whether or not the lamp in question was of the Soft White style. For those thatwere found to be noncompliant with the Soft White formula, further research was necessary toascertain whether the lamp was actually excluded from the standard. To address both theseissues, internet research was conducted using the model numbers that were collected on-site. Inmany instances, this research provided enough information to determine compliance ornoncompliance, or to exclude the lamp from the analysis.
Overall Noncompliance
We estimated overall noncompliance in two ways. First, we used the model counts alone.Second, we used the inventory or sales data to estimate the noncompliance rate and calculatedthe rate both with and without weights for the two size strata we defined.
As shown in Table 37, we identified a total of 280 individual model numbers. Using theprocedure described earlier, 138 of the lamps were found to be compliant, leaving 142 lamps thatmight be compliant under the soft white standard, or that did not meet the criteria set forth in thestandard. Of these, it was not possible to determine compliance for 37 and 23 were not coveredby the standard. Next, we used the model numbers to calculate the noncompliance rate for onlythose sites where we had inventory data. Finally, noncompliance was calculated based on the rawinventory counts. The estimated noncompliance rates varied from 26% to 37% using these threemethods.
Table 37. General Service Incandescent Lamps: Unweighted Noncompliance Estimates
Data Used TotalCount Met Standard Noncompliant Excluded Unidentified Adjusted
CountNoncompliance
%Total Models 280 138 82 23 37 220 37%Only Models withInventory Data 179 88 32 22 37 120 27%
Inventory 11,295 5,793 1,999 1,192 2,311 7,792 26%*Inventory counts were not performed at two sites.
Next, using the noncompliance rates for those seven sites for which inventory counts wereavailable, the data were weighted to reflect the two size strata established during the initial siteselection process.37 These results are presented in Table 38.
Our final estimate of overall noncompliance for general service incandescent lamps is27%.
37 We did not use the sales data that were available because reliable data were available for only one store.

Quantec — Statewide Codes and Standards Market Adoption and Noncompliance Rates 84
Table 38. General Service Incandescent LampsWeighted Noncompliance Estimates
Strata Weights OriginalNoncompliance
WeightedNoncompliance
Final ProductNoncompliance
Small 0.31 31% 10%Large 0.69 24% 17% 27%
We assign a medium level of certainty to this estimate. Noncompliance rates calculated forindividual stores using the different methods we applied ranged from 14% to 80%, but most wereclustered between 20% and 40%. The sample we selected was randomly chosen and representedall areas of the state. A reasonable number of stores was included in both the large and smallstrata. Compliance was easy to determine from the watt and lumen ratings, but there were somedifficulties determining which standard, if any, applied since we did not always have the lamptype information available. Although sales data were not typically available, inventory appearedto be a good proxy for sales volume since there was considerable turnover in the store stocks andit would be reasonable to stock lamps based on expected sales volume.
Metal Halide Luminaires
A metal halide luminaire is comprised of two components – the lamp (or bulb) and the ballast.Metal halide lamps are a type of high-intensity discharge (HID) lamp that generally offer longerlamp life and energy efficiency38. Metal halide lamps require a ballast to operate. The 2006California standard requires that vertically mounted metal halide luminaires rated at 150 to 500watts contain pulse-start lamps and ballasts, and not a probe-start ballast.
Data Collection and Noncompliance Assessment Approach
Noncompliance assessment proved to be the most challenging for these products. There was noexisting compliance database of certified metal halide luminaires available to determinecompliance so we had to directly seek information about individual products.
The assessment of noncompliance was complicated by the fact that the market for metal halidesincludes new construction, major renovation, and retrofit applications. In retrofits, the choice isto replace an existing lamp or replace the entire luminaire; given cost considerations, purchasersare likely to replace existing probe-start lamps (or ballasts) rather than purchase a whole newluminaire. Since the standard applies to the whole luminaire, penetration in the retrofit marketwill probably be relatively low. Given the size of the retrofit market for lamps, probe-start lampsand ballasts will likely continue to be sold for some time. This complicates assessment ofcompliance with the new standard since vendors will carry probe-start equipment until demanddrops off. Consequently, though we found it was possible to obtain information on the
38 Reference material regarding metal halide lamps was found from the National Lighting Product InformationProgram at the Lighting Research Center: www.lrc.rpi.edu/programs/nlpip/lightingAnswers/mwmhl/abstract.asp
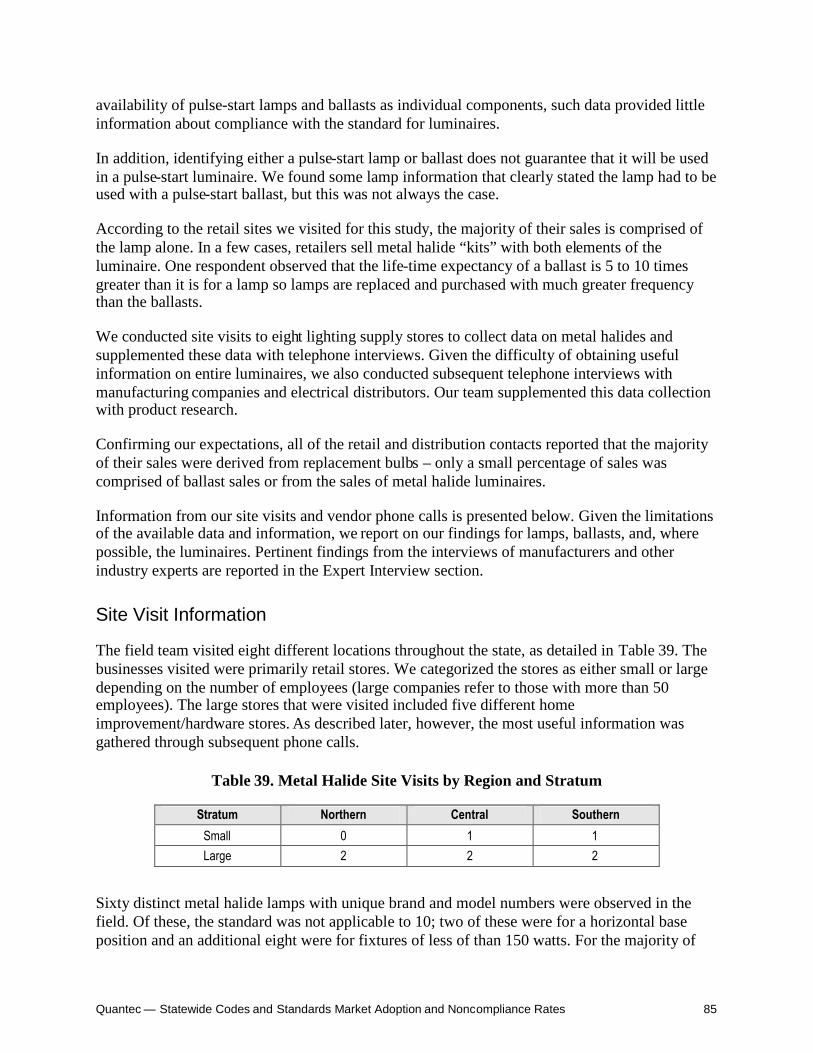
Quantec — Statewide Codes and Standards Market Adoption and Noncompliance Rates 85
availability of pulse-start lamps and ballasts as individual components, such data provided littleinformation about compliance with the standard for luminaires.
In addition, identifying either a pulse-start lamp or ballast does not guarantee that it will be usedin a pulse-start luminaire. We found some lamp information that clearly stated the lamp had to beused with a pulse-start ballast, but this was not always the case.
According to the retail sites we visited for this study, the majority of their sales is comprised ofthe lamp alone. In a few cases, retailers sell metal halide “kits” with both elements of theluminaire. One respondent observed that the life-time expectancy of a ballast is 5 to 10 timesgreater than it is for a lamp so lamps are replaced and purchased with much greater frequencythan the ballasts.
We conducted site visits to eight lighting supply stores to collect data on metal halides andsupplemented these data with telephone interviews. Given the difficulty of obtaining usefulinformation on entire luminaires, we also conducted subsequent telephone interviews withmanufacturing companies and electrical distributors. Our team supplemented this data collectionwith product research.
Confirming our expectations, all of the retail and distribution contacts reported that the majorityof their sales were derived from replacement bulbs – only a small percentage of sales wascomprised of ballast sales or from the sales of metal halide luminaires.
Information from our site visits and vendor phone calls is presented below. Given the limitationsof the available data and information, we report on our findings for lamps, ballasts, and, wherepossible, the luminaires. Pertinent findings from the interviews of manufacturers and otherindustry experts are reported in the Expert Interview section.
Site Visit Information
The field team visited eight different locations throughout the state, as detailed in Table 39. Thebusinesses visited were primarily retail stores. We categorized the stores as either small or largedepending on the number of employees (large companies refer to those with more than 50employees). The large stores that were visited included five different homeimprovement/hardware stores. As described later, however, the most useful information wasgathered through subsequent phone calls.
Table 39. Metal Halide Site Visits by Region and Stratum
Stratum Northern Central Southern
Small 0 1 1Large 2 2 2
Sixty distinct metal halide lamps with unique brand and model numbers were observed in thefield. Of these, the standard was not applicable to 10; two of these were for a horizontal baseposition and an additional eight were for fixtures of less of than 150 watts. For the majority of

Quantec — Statewide Codes and Standards Market Adoption and Noncompliance Rates 86
the lamps observed, however, it was not possible to determine if they would be installed in acompliant ballast or not – no conclusion could therefore be made about their final compliance.As noted earlier, however, some lamps are designed specifically for pulse-start applications, suchas Philips MS175 BU PS, or Philips lamps with model numbers beginning in MHC or MHS39.However in most cases, the model number alone cannot provide this information. Nor does themodel number necessarily indicate the orientation of the lamp upon application.
Expert Interviews
In addition to the retail site visits, the project team also interviewed a number of lightingmanufacturers, manufacturer representatives, electrical distributors and other lighting industryspecialists. These included one lighting manufacturer, one ballast manufacturer, twomanufacturer representatives, two electrical distributors, and a specialist from the LightingResearch Center at Rensselaer Polytechnic Institute.
The answers received from electrical distributors and lighting specialists varied. In general, themanufacturers were less familiar with sales specific to the state of California, whereas thedistributors were more focused on a given territory.
When asked about sales in California, one electrical distributor reported that his company sellsapproximately 500 metal halide luminaires annually. He stated that approximately 20% of theseinclude a pulse-start ballast, but he did not specify the share among vertical mount units.
Another lighting distributor reported that 60% to 70% of the metal halide luminaires that he sellsin the state of California are pulse-start luminaires. He further reported that for verticalorientation applications the pulse-start share was in the range of 80% to 100%.
A manufacturer’s representative who sells predominately in the state of California reported that“most if not all” of the metal halide fixtures that they sell are pulse-start. “In the last two years,this is becoming the standard.” He further stated that even the lower end (i.e., less expensivemodels) are now pulse-start. Metal halide fixtures with pulse-start ballasts continue to be moreexpensive, but that the price difference has become smaller in recent years. For a $530 fixture,for example, the cost of including a pulse-start ballast is $19 (approximately a 3.5% increase incost).
According to another lighting manufacturer, metal halide luminaires that his company currentlysells across the country are predominately probe-start. He reported that the most commonly soldmetal halide fixture in North America is a 400 watt probe-start. Somewhat in contrast to what theother manufacturer representative said, he stated that while the pulse-start technology is about 15years old, the price differential between pulse-start and probe-start ballasts continues to be adeterrent to their sales. This same expert estimated that the price difference between pulse-startand a probe-start luminaires ranges from 20% to 50%, depending upon the size and features of agiven luminaire.
39 Interview with Philips Lighting representative October 12, 2006.
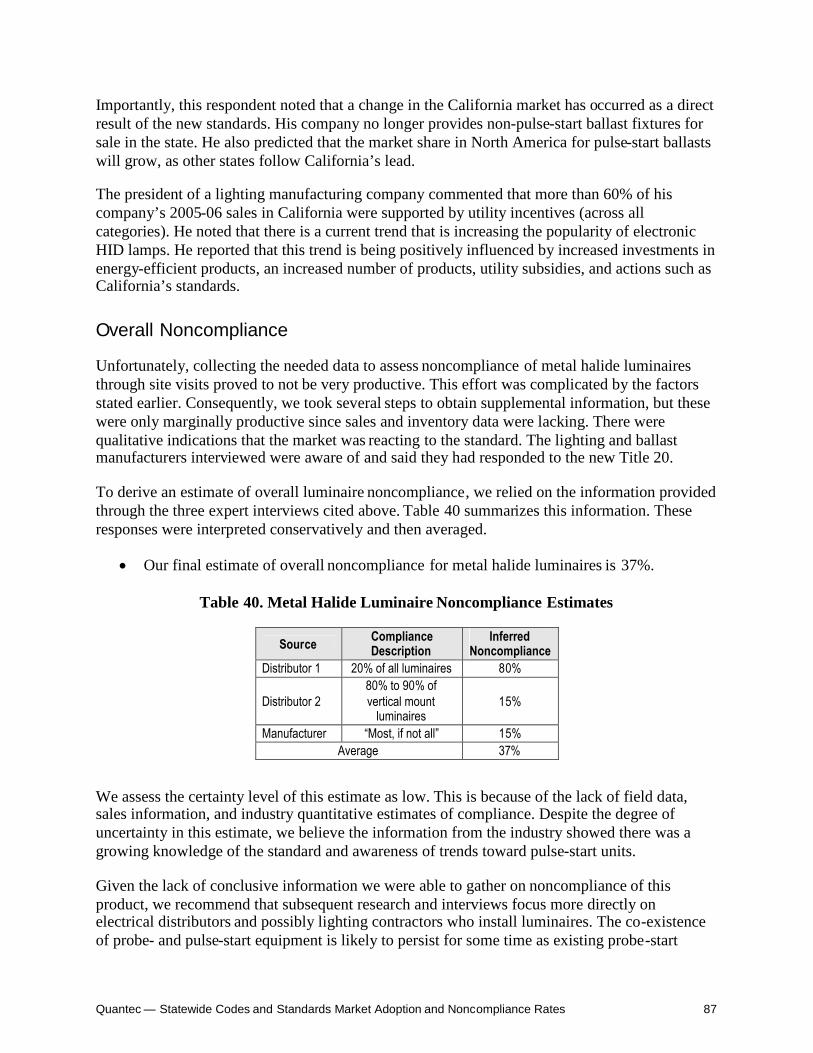
Quantec — Statewide Codes and Standards Market Adoption and Noncompliance Rates 87
Importantly, this respondent noted that a change in the California market has occurred as a directresult of the new standards. His company no longer provides non-pulse-start ballast fixtures forsale in the state. He also predicted that the market share in North America for pulse-start ballastswill grow, as other states follow California’s lead.
The president of a lighting manufacturing company commented that more than 60% of hiscompany’s 2005-06 sales in California were supported by utility incentives (across allcategories). He noted that there is a current trend that is increasing the popularity of electronicHID lamps. He reported that this trend is being positively influenced by increased investments inenergy-efficient products, an increased number of products, utility subsidies, and actions such asCalifornia’s standards.
Overall Noncompliance
Unfortunately, collecting the needed data to assess noncompliance of metal halide luminairesthrough site visits proved to not be very productive. This effort was complicated by the factorsstated earlier. Consequently, we took several steps to obtain supplemental information, but thesewere only marginally productive since sales and inventory data were lacking. There werequalitative indications that the market was reacting to the standard. The lighting and ballastmanufacturers interviewed were aware of and said they had responded to the new Title 20.
To derive an estimate of overall luminaire noncompliance, we relied on the information providedthrough the three expert interviews cited above. Table 40 summarizes this information. Theseresponses were interpreted conservatively and then averaged.
Our final estimate of overall noncompliance for metal halide luminaires is 37%.
Table 40. Metal Halide Luminaire Noncompliance Estimates
Source ComplianceDescription
InferredNoncompliance
Distributor 1 20% of all luminaires 80%
Distributor 280% to 90% ofvertical mount
luminaires15%
Manufacturer “Most, if not all” 15%Average 37%
We assess the certainty level of this estimate as low. This is because of the lack of field data,sales information, and industry quantitative estimates of compliance. Despite the degree ofuncertainty in this estimate, we believe the information from the industry showed there was agrowing knowledge of the standard and awareness of trends toward pulse-start units.
Given the lack of conclusive information we were able to gather on noncompliance of thisproduct, we recommend that subsequent research and interviews focus more directly onelectrical distributors and possibly lighting contractors who install luminaires. The co-existenceof probe- and pulse-start equipment is likely to persist for some time as existing probe-start

Quantec — Statewide Codes and Standards Market Adoption and Noncompliance Rates 88
lamps and ballasts are replaced when they fail; this will continue to make it difficult to assesscompliance of the luminaires covered by the new standard. Once the industry has submittedcertification information and a compliance database has been assembled, however, this taskshould become more straightforward.
Walk-In Refrigerators/Freezers
The appliance standard for walk-in refrigerators and walk-in freezers (WIRF) does not requirelabeling and, since they are usually custom built, the standard is not performance-based as it isfor several other appliances. Instead, there are prescriptive requirements for individualcomponents of walk-in refrigerators and walk-in freezers. The 2006 Title 20 standard for WIRFare summarized in Table 41.
Table 41. Title 20 Standards for Walk-in Refrigerators and Walk-in Freezers
Motor Type Required Components
All Automatic door closers that firmly close for all doors, except doors that arelarger than 4 feet wide or 7 feet tall.
All Refrigerator envelope insulation > R-28All Freezer envelope insulation > R-36
Condenser Fan Motors < 1HP
One of the following:Electrically commutated motorsPermanent split capacitor-type motorsPolyphase motors > ½ HPMotors of equivalent efficiency as determined by the Executive Director
Single-phase Evaporator FanMotors < 1 HP and < 460Volts
One of the following:Electronically commutated motorsPermanent split capacitor-type motors
Data Collection and Methodology
There was no compliance database available for WIRF and, given the custom nature ofindividual units, it is unlikely one could be compiled. Our methodology for collecting andanalyzing noncompliance data was two-fold. First, we made an initial contact with businessesthat offer walk-ins throughout the state, either by phone or site visit. Second, a follow-up callwas performed to obtain sales data and compliance information.
Collecting data from California businesses that offer WIRF proved to be difficult since they donot carry inventory and almost all walk-ins are custom order so there are no model numbers toverify. In the few cases where non-custom designs (standard sized units) were sold, the productswere not in stock and were still considered a special order. Even in the case of these standardizedunits, it was very difficult to confirm that all the components comply to the standard.
Seven locations were contacted by phone initially and eight were contacted in the follow-upcalls, as shown in Table 42. The eighth location was chosen after the initial calls since wewanted to diversify the feedback across the state.

Quantec — Statewide Codes and Standards Market Adoption and Noncompliance Rates 89
Table 42. Walk-in Refrigerators/Freezers, Outlets Contacted by Region and Stratum
Stratum Northern Southern CentralSmall 11 22 2
Large 0 2 11 This eighth company was contacted during the follow-up calls and was not a part of the initial site survey. It wasadded to ensure that we had a business located in the northern region.2 One location in this region was head-quartered out of the state, but distributes to southern California. Phonesurveys, initial and follow-up, were to the headquarters.
A lack of consistent information provided by the businesses during the initial contact made itnecessary to make follow-up calls. This was done to verify and supplement the originalinformation requested as well as gather additional information. Again, however, contacts wereunable to provide very complete information. In the end, noncompliance was assessed based onfeedback from contacted businesses that were either retailers, distributors, or manufacturers.Sales data were recorded whenever possible for each business.
Overall Noncompliance
A summary of the sales and noncompliance information is presented in Table 43. For those sitesthat were directly involved in sales or distribution of WIRF in California and had someexperience selling units in 2006, the respondents all indicated that compliance was 100% and,therefore, noncompliance was 0%.
Table 43. WIRF Summary of Sales and Noncompliance by Site
Site Strata Region Estimated AnnualSales
NoncomplianceBased on Respondent
Feedback1 Small Southern - 0%
2 Small Southern 24 N/A
3 Small Central 20 0%4 Small Central - N/A
5 Small Northern 50 0%
6 Large Southern 1 N/A
7 Large Southern 85 0%8 Large Central 2 0%
Since nearly all orders are custom and the vendors and distributors do not have an inventory,there are no older, non-complying units in the pipeline for sale in 2006. It is the responsibility ofthe distributor or vendor to order units and the manufacturer to comply with the new standard.As one respondent noted, if a manufacturer was not able to comply with the 2006 standard intime, they would not provide price quotes.
Our final estimate of overall noncompliance for walk-in refrigerators and freezers is 0%.

Quantec — Statewide Codes and Standards Market Adoption and Noncompliance Rates 90
We assign a medium certainty level to this noncompliance estimate. Although most respondentsdemonstrated a good understanding of the requirements of the standard and consistently said thatcompliance was 100%, we were unable to obtain any independent evidence of the compliancelevel. Such evidence would probably have to come from observing actual units delivered tocustomers this year or examining specifications and order sheets. None of this information wasavailable to us for this study.
Pre-Rinse Spray Valves
The pre-rinse spray valve is a handheld device that uses a spray of water to remove food wastefrom dishes prior to cleaning in a commercial dishwasher. Pre-rinse spray valves consist of aspray nozzle, a squeeze lever that controls the water flow, and a dish guard bumper. The newCalifornia standard requires all pre-rinse spray valves that are manufactured after January 1,2006, to have a maximum flow rate of 1.6 gallons per minute (gpm) at 60 psi and a cleanabilityaverage of 30 seconds or less per plate. Models may include a spray handle clip, allowing theuser to lock the lever in the full spray position for continual use.
No CEC database listing complying models was available when we conducted our research.However, according to one source the following models are considered to meet all the newstandards:40
40 http://www.fishnick.com/saveenergy/sprayvalves/
Encore KN50-Y002-12
Fisher Ultra-Spray 2949
Krowne Metal Water Saver 21-129
Niagara N2180
Strahman Kwik-Clean II
T&S B-0107
T&S B-0107-C
T&S Equip 5SV
T&S JetSpray B-0108
T&S JetSpray B-0108-C
Data Collection Methods
The project team conducted site visits to outlets in all three areas of California. During the sitevisits, they attempted to collect model numbers, brand names, inventory, manufacture dates, andany sales volume information available to them. This research was conducted in restaurantsupply retail stores in person. Site visit information was also supplemented by subsequenttelephone interviews.
During the site visits, we discovered that some units were integrated into an entire fixture(usually for residential applications), so we did not record information for these units since therewas nothing available specific to the spray valves. In most cases, the team recorded model
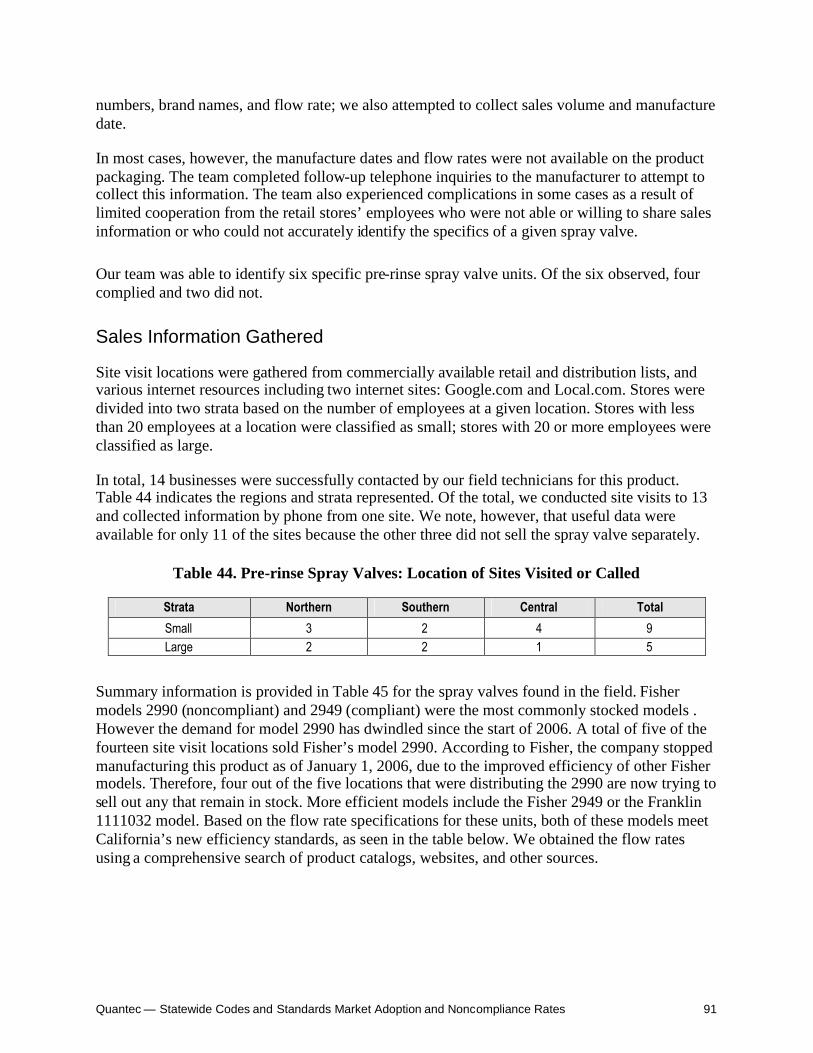
Quantec — Statewide Codes and Standards Market Adoption and Noncompliance Rates 91
numbers, brand names, and flow rate; we also attempted to collect sales volume and manufacturedate.
In most cases, however, the manufacture dates and flow rates were not available on the productpackaging. The team completed follow-up telephone inquiries to the manufacturer to attempt tocollect this information. The team also experienced complications in some cases as a result oflimited cooperation from the retail stores’ employees who were not able or willing to share salesinformation or who could not accurately identify the specifics of a given spray valve.
Our team was able to identify six specific pre-rinse spray valve units. Of the six observed, fourcomplied and two did not.
Sales Information Gathered
Site visit locations were gathered from commercially available retail and distribution lists, andvarious internet resources including two internet sites: Google.com and Local.com. Stores weredivided into two strata based on the number of employees at a given location. Stores with lessthan 20 employees at a location were classified as small; stores with 20 or more employees wereclassified as large.
In total, 14 businesses were successfully contacted by our field technicians for this product.Table 44 indicates the regions and strata represented. Of the total, we conducted site visits to 13and collected information by phone from one site. We note, however, that useful data wereavailable for only 11 of the sites because the other three did not sell the spray valve separately.
Table 44. Pre-rinse Spray Valves: Location of Sites Visited or Called
Strata Northern Southern Central Total
Small 3 2 4 9Large 2 2 1 5
Summary information is provided in Table 45 for the spray valves found in the field. Fishermodels 2990 (noncompliant) and 2949 (compliant) were the most commonly stocked models .However the demand for model 2990 has dwindled since the start of 2006. A total of five of thefourteen site visit locations sold Fisher’s model 2990. According to Fisher, the company stoppedmanufacturing this product as of January 1, 2006, due to the improved efficiency of other Fishermodels. Therefore, four out of the five locations that were distributing the 2990 are now trying tosell out any that remain in stock. More efficient models include the Fisher 2949 or the Franklin1111032 model. Based on the flow rate specifications for these units, both of these models meetCalifornia’s new efficiency standards, as seen in the table below. We obtained the flow ratesusing a comprehensive search of product catalogs, websites, and other sources.

Quantec — Statewide Codes and Standards Market Adoption and Noncompliance Rates 92
Table 45. Compliance of Pre-rinse Spray Valve Models at Contacted Sites
# of Stores thatStock Model Manufacturer Model Number Flow Rate
(gpm/psi) Compliance Status
1 Blanco 157084ST 2.2 gpm at 60 psi Noncompliant5 Fisher 2990 2.65 gpm at 80 psi Noncompliant
8 Fisher 2949 1.15 gpm at 60 psi Compliant
1 Fisher 2210WB 1.6 gpm at 60 psi Compliant
1 Franklin 1111032 1.42 gpm at 60 psi Compliant1 T&S B-0107 1.6 gpm at 60 psi Compliant
*Number of stores that stock models field may add up to more than total sites because some of these models were carried bymultiple stores.
Noncompliance Rate
Table 46 summarizes compliance, sales, and inventory data gathered from the sites we includedin our sample. To estimate the noncompliance rate, we used all information in the table for thosestores where both inventory and estimated unit sales data were available. Noncompliance rateswere calculated separately for outlets in the small and large strata. Within each stratum, wemultiplied the number of units sold per month times the percent of the inventory units that didnot comply. These values were totaled and divided by the number of units sold to calculate theaverage noncompliance within a stratum.
For the small stores, our estimated noncompliance rate was 11%. For large stores, it was 1%. Thehigher rate for the small stores was probably due in part to the lower turnover rate in inventorythat would clear out older, non-complying units. Consequently, our noncompliance rate estimatefor small stores may be an overestimate. The overall noncompliance rate was then calculated byweighting the rate for the small and large strata based on the data we had for the number ofemployees at sites within each strata.

Quantec — Statewide Codes and Standards Market Adoption and Noncompliance Rates 93
Table 46. Noncompliance of Models Available at Sampled Stores*
Site StrataClassification
Compliant Model(s)Observed
Compliant ModelInventory
Noncompliant Model(s)Observed
NoncompliantModel Inventory
% of StockComprised ofNoncompliant
Models
ApproximateUnits Sold per
Month
1 Small - - Blanco: 157084ST 1 100% -
2 Small - - Fisher: 2990 1 100% 2
3 Small Fisher: 2210WB 15 - - 0% 20
4 Small Fisher: 2949;Franklin: 1111032
Special Order, none instock Fisher: 2990 Special order, none in
stock 37% -
5 Small Fisher: 2949 22 Fisher: 2990 24 50% 5
6 Small Fisher: 2949 3 - - 0% 4
7 Small Fisher: 2949 12 - - 0% 12
8 Large Fisher: 2949; T&S: B-0107 22; 17 - - 0% 40
9 Large Fisher: 2949 10 - - 0% 35
10 Large Fisher: 2949 Special order, none instock Fisher: 2990 Special order, none in
stock 50% -
11 Large Fisher: 2949 5 Fisher: 2990 1 50% 3
*As noted in text, we were unable to determine noncompliance levels at three stores included in our sample because they sold only units that had spray valves built into the fixtureand no information was available for the spray valves separately.

Quantec — Statewide Codes and Standards Market Adoption and Noncompliance Rates 94
Our final estimate of overall noncompliance for pre-rinse spray valves was 4.2%.
We believe this estimate has a high level of certainty. This is our assessment for several reasons.For one, the sample we selected was randomly chosen and represented all areas of the state.Though the number of stores included was not large, they were well distributed geographicallyand in terms of size. There is little uncertainty about noncompliance since it is determinedprimarily by the flow rate, which we were able to document for each model. Finally, ourdiscussions with industry representatives indicated that they were knowledgeable about the newrequirements and most were in the process of clearing their inventory of units that did notcomply.
Nonresidential Duct Heaters and Unit Furnaces
The new Title 20 standards for these units require power venting or automatic flue dampersalong with specific efficiency levels as shown in Table 22. The unit heater is a space heater withsizes ranging from 25,000 Btu to 6,000,000 Btu per hour. Typically, these units are installed inceiling mounted locations used primarily to heat industrial and commercial buildings. PreviousTitle 20 standards have effectively required that all natural gas fired models have an intermittentignition device. Duct furnaces are similar but the fan or blower is provided separately. Ductfurnaces are available in sizes ranging from 56,000 to 1,200,000 Btu per hour.
Data Collection and Methodology
Upon reviewing the purchased company database, it was determined that most of the companieslisted in the furnace category were vendors of residential equipment. Consequently, we decidedthat phone calls would be placed with equipment manufacturers for the purpose of collectingcontact information for distributors of duct heaters and unit furnaces. Since this occurred whilethe site visits were in progress and an agreement had been reached regarding the collection ofdata via phone calls, a decision was made to contact these distributors by phone. Due to themanufacturers referral, the distributors were generally helpful over the phone in providing thenecessary information.
In total, nine businesses were successfully contacted by phone for this product. Table 47 showsthe regions and strata in which the outlets were located.
Table 47. Unit Heaters and Duct Furnaces: Number of OutletsContacted by Region and Stratum
Stratum Northern Southern CentralSmall 1 2 1
Large 2 2 1
A CEC database was available for this product; therefore, model numbers were analyzedaccording to the methodology described previously for products in a compliance database. Wecounted a total of 631 models sold by the nine businesses contacted with the initial calls.

Quantec — Statewide Codes and Standards Market Adoption and Noncompliance Rates 95
Due to the lack of consistent information provided by the businesses during the initial contact,secondary calls were made to each of the sites to supplement the original information. Generally,contacts were unable to identify top sellers among the list of identified models. For this product,model numbers frequently represent Btu output and it was observed by multiple contacts thatcustomers purchase specific models based on the amount of heat that is required for the situation.Consequently, some contacts were able to identify common sizes, though not specific models,that they believed were more likely to sell than others.
Noncompliance Results
For the benefit of future studies, we note that deriving an overall compliance/noncompliance rateestimate for this product was very challenging for several reasons. For one, sales and inventorydata were very hard to obtain and, in the end, useful quantitative data were available for only asmall number of sites. This made it difficult to properly weight the responses from individualsites. Second, most businesses we contacted said they carried a single brand so there was littlediversity in the units carried by each site. Third, only a few manufacturers had listed theirproducts with the CEC as certified, but because units were not listed did not necessarily meanthey did not comply with the requirements of the standard. Fourth, there were significant changesin some cases between what we observed during site visits and what we were told during follow-up phone calls. This may have been due to businesses responding to the standard or changingtheir product lines for other reasons, or respondents’ lacking the information required to providethe needed data.
Table 48 summarizes the data and noncompliance estimates for each of the nine sites included inour study. The table indicates whether sales or inventory data were available at each business.For those where no sales or inventory data were available, the noncompliance estimate is baseddirectly on the percent of the model numbers that did not comply. Where sales or inventory datawere available, we used that information to estimate noncompliance if it was sufficient. Thenoncompliance rates appeared to be bimodal—either the rate was close to 100% or it was in the20% to 40% range.
To develop an overall noncompliance estimate, we elected to use the most reliable data available.The sites for which no sales or inventory data were available were excluded since it was notpossible to know how much they might affect the average noncompliance rate. We included themost conservative estimate for those sites where we had at least some information on sales,including top-selling models. The sites excluded from our estimate were 1 and 2 shown in Table48. We took the average of the values remaining for each stratum, and then weighted the averagenoncompliance rates for small and large businesses using the weights calculated initially. Theresults are shown in Table 49.
Our final estimate of overall noncompliance for duct furnaces and unit heaters is 44%.
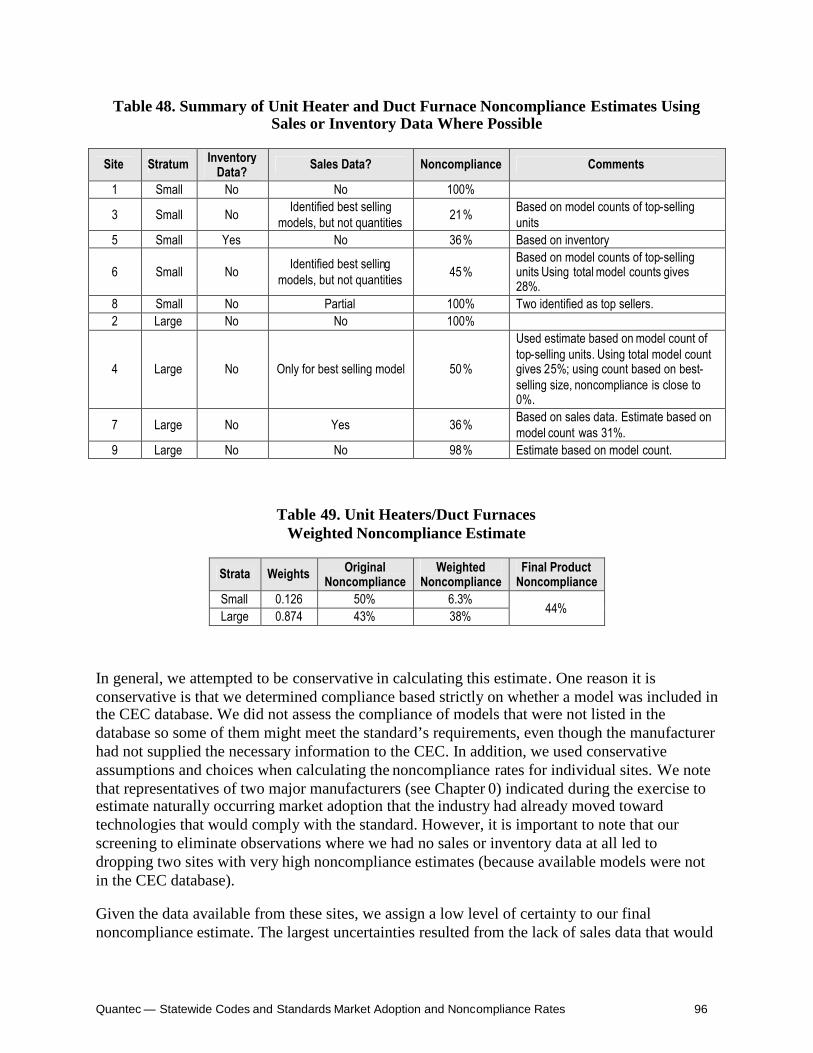
Quantec — Statewide Codes and Standards Market Adoption and Noncompliance Rates 96
Table 48. Summary of Unit Heater and Duct Furnace Noncompliance Estimates UsingSales or Inventory Data Where Possible
Site Stratum InventoryData? Sales Data? Noncompliance Comments
1 Small No No 100%
3 Small No Identified best sellingmodels, but not quantities 21% Based on model counts of top-selling
units5 Small Yes No 36% Based on inventory
6 Small No Identified best sellingmodels, but not quantities 45%
Based on model counts of top-sellingunits Using total model counts gives28%.
8 Small No Partial 100% Two identified as top sellers.2 Large No No 100%
4 Large No Only for best selling model 50%
Used estimate based on model count oftop-selling units. Using total model countgives 25%; using count based on best-selling size, noncompliance is close to0%.
7 Large No Yes 36% Based on sales data. Estimate based onmodel count was 31%.
9 Large No No 98% Estimate based on model count.
Table 49. Unit Heaters/Duct FurnacesWeighted Noncompliance Estimate
Strata Weights OriginalNoncompliance
WeightedNoncompliance
Final ProductNoncompliance
Small 0.126 50% 6.3%Large 0.874 43% 38% 44%
In general, we attempted to be conservative in calculating this estimate. One reason it isconservative is that we determined compliance based strictly on whether a model was included inthe CEC database. We did not assess the compliance of models that were not listed in thedatabase so some of them might meet the standard’s requirements, even though the manufacturerhad not supplied the necessary information to the CEC. In addition, we used conservativeassumptions and choices when calculating the noncompliance rates for individual sites. We notethat representatives of two major manufacturers (see Chapter 0) indicated during the exercise toestimate naturally occurring market adoption that the industry had already moved towardtechnologies that would comply with the standard. However, it is important to note that ourscreening to eliminate observations where we had no sales or inventory data at all led todropping two sites with very high noncompliance estimates (because available models were notin the CEC database).
Given the data available from these sites, we assign a low level of certainty to our finalnoncompliance estimate. The largest uncertainties resulted from the lack of sales data that would
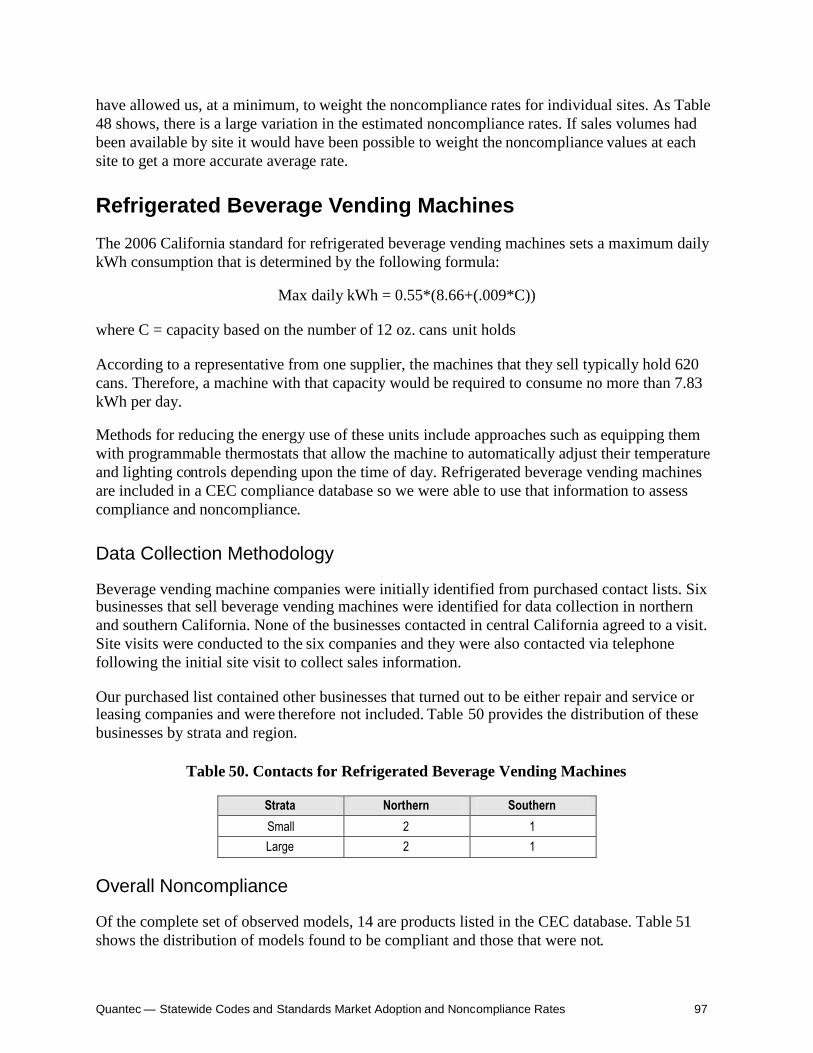
Quantec — Statewide Codes and Standards Market Adoption and Noncompliance Rates 97
have allowed us, at a minimum, to weight the noncompliance rates for individual sites. As Table48 shows, there is a large variation in the estimated noncompliance rates. If sales volumes hadbeen available by site it would have been possible to weight the noncompliance values at eachsite to get a more accurate average rate.
Refrigerated Beverage Vending Machines
The 2006 California standard for refrigerated beverage vending machines sets a maximum dailykWh consumption that is determined by the following formula:
Max daily kWh = 0.55*(8.66+(.009*C))
where C = capacity based on the number of 12 oz. cans unit holds
According to a representative from one supplier, the machines that they sell typically hold 620cans. Therefore, a machine with that capacity would be required to consume no more than 7.83kWh per day.
Methods for reducing the energy use of these units include approaches such as equipping themwith programmable thermostats that allow the machine to automatically adjust their temperatureand lighting controls depending upon the time of day. Refrigerated beverage vending machinesare included in a CEC compliance database so we were able to use that information to assesscompliance and noncompliance.
Data Collection Methodology
Beverage vending machine companies were initially identified from purchased contact lists. Sixbusinesses that sell beverage vending machines were identified for data collection in northernand southern California. None of the businesses contacted in central California agreed to a visit.Site visits were conducted to the six companies and they were also contacted via telephonefollowing the initial site visit to collect sales information.
Our purchased list contained other businesses that turned out to be either repair and service orleasing companies and were therefore not included. Table 50 provides the distribution of thesebusinesses by strata and region.
Table 50. Contacts for Refrigerated Beverage Vending Machines
Strata Northern Southern
Small 2 1Large 2 1
Overall Noncompliance
Of the complete set of observed models, 14 are products listed in the CEC database. Table 51shows the distribution of models found to be compliant and those that were not.

Quantec — Statewide Codes and Standards Market Adoption and Noncompliance Rates 98
Table 51. Refrigerated Beverage Vending Machines: Models Found in Database
Total ModelsIdentified In Database Not In Database % Noncompliant
based on Database33 14 19 58%
We determined the overall noncompliance rate by calculating the weighted average for the twosize strata using the model counts. For the each size stratum, we calculated the noncompliancerate by totaling up the number of non-complying and total units across all the members of thatgroup. Using the findings from this sample set of six locations, the final noncompliance rate forrefrigerated beverage vending machines was determined as shown in Table 52. The finalnoncompliance rate is determined by taking the sum of the weighted noncompliance rates foreach stratum.
Table 52. Weighted Noncompliance – Refrigerated Vending Machines
Strata Weights OriginalNoncompliance
WeightedNoncompliance
Final ProductNoncompliance
Small 0.123 33% 4%Large 0.877 67% 59%
63%
We were unable to make adjustments for inventory or sales since only one site provided anyuseful information. It is worth noting that the noncompliance rate for the one site where stockdata were obtained decreased significantly when this information was incorporated in theanalysis. However, given that one of the small and large businesses had no complying models atall suggested that having stock data would not have decreased the overall noncomplianceestimate very much.
Our final estimate of overall noncompliance for refrigerated vending machines is 63%.
This estimate is probably conservative since it was likely that not all complying models had beensubmitted to the CEC for inclusion in the compliance database. Supporting evidence for this wasthat one contact indicated the models they sold met Energy Star requirements, which would havemade them compliant with the California standard. Nevertheless, the units were not yet listed inthe compliance database and a preliminary review of the Energy Star compliance list did notshow some of the models.
Given the relatively small sample size, and the lack of comprehensive sales and stockinformation provided by the contacted beverage vending machine companies, the final productnoncompliance rate is stated with a low level of certainty.
This report was designed to review noncompliance levels among companies that sell refrigeratedvending machines. Many of the refrigerated vending machines in service in California are leasedrather than purchased. While beyond the scope of this study, it may be a valuable exercise toreview noncompliance rates among leased machine vendors as well.

Quantec — Statewide Codes and Standards Market Adoption and Noncompliance Rates 99
6. Adjustments to Savings Estimate Spreadsheet
Our analyses provide revised estimates of three key inputs to the spreadsheet for each Title 20efficient appliance and Title 24 building measure studied. First, we estimated the initial marketpenetration for each appliance and measure using the approach described in Chapter 0. Second,the naturally occurring market adoption rate over time for each appliance and measure wasestimated using the same methodology. Third, Quantec estimated the initial non-compliance ratefor a selected set of appliances and building measures covered by the new standards. Theapproach and detailed findings for building measures and appliances are presented in Chapters 1and 5, respectively. The results of these analyses are summarized below.
In each research area, we learned valuable lessons about the methodology that should be usefulin future studies. This chapter ends with a summary of the lessons learned and ourrecommendations for future research.
Initial Penetration and Naturally Occurring Market Adoption
We revised the standard Bass curve equation presented earlier to the following form:
Maxepq
etF tqp
tqp
))/(1()1()( )(
)(
where
F(t) = the market penetration in year t (%),
p = coefficient of leading behavior (innovation),
q = coefficient of following behavior (imitation),
Max = maximum penetration rate (%)
t = elapsed time from initial market presence.
Table 53 summarizes the results of these analyses. For each high efficiency measure andappliance, the table shows the year from which the adoption curve analysis starts. These dateswere derived for each measure and appliance as described earlier and represent the point in timewhen the item was beginning to have a commercially available presence in the market. Next, theestimated values of the variables shown in the equation above are presented. The 2006 estimatedmarket penetration based on the adoption curve is then shown. Finally, the estimated naturallyoccurring market adoption rates are shown for two representative years, 2015 and 2030.

Quantec — Statewide Codes and Standards Market Adoption and Noncompliance Rates 100
Out of all the items analyzed, only one—general service incandescents—presented modelingdifficulties. Consequently, the values shown for this product in the table should be used only toestimate naturally occurring market adoption from 2006 on.41
Table 53. Initial Market Penetration and Naturally Occurring Adoption Results
Adoption CurveCoefficients
Naturally Occurring MarketAdoption, %Title 20 and 24
Measures andAppliances
MarketIntroduction
Year p q Max,%
Initial MarketPenetration
2006, % 2015 2030
Hardwired lighting,new residential 2000 0.0122 0.2131 57 8 35 56
Lighting controlsunder skylights,new
2000 0.00863 0.3026 51 7 38 51
Duct improvement,residential existing 1990 0.01050 0.1819 19 10 17 19
Ducts,nonresidentialexisting
1990 0.00129 0.1571 23 2 7 19
Consumerelectronics-TVs 2000 0.07250 0.1698 83 41 76 83
Consumerelectronics-DVDs 2000 0.03150 0.3283 61 24 58 61
Consumerelectronics-audioplayers
2000 0.08170 0.1566 50 26 46 50
Residential poolpumps, 2-speed,Tier II
1995 0.00451 0.2346 33 6 23 33
Pulse start metalhalides 1992 0.01720 0.1403 58 26 46 57
General serviceincandescents1 1970 0.055 0.01 53 47 50 52
Commercialdishwasher sprayvalves
1985 0.00735 0.1303 53 25 41 51
Unit heaters/ductfurnaces 1965 0.00990 0.0632 69 50 58 65
1 See discussion in text about the use of these values.
To update the Savings Estimate Spreadsheet, both the initial penetration rates and annualnaturally occurring market adoption rates can be obtained from this analysis. We note that the
41 As noted previously, the estimates of naturally occurring market adoption provided by respondents for thisproduct differed greatly. When we attempted to use our methodology to develop a curve to fit the averageresponse over the time period it did not converge because of the behavior of the average curve in the period closeto introduction in 1970. As a result, we developed a curve that fit the average of the responses closely from 2006on so this curve should not be used to try to estimate naturally occurring adoption for earlier periods.

Quantec — Statewide Codes and Standards Market Adoption and Noncompliance Rates 101
current Savings Estimate Spreadsheet has embedded in the initial gross energy savings values theeffect of initial market penetration that was estimated during the development of the newstandards. Therefore, the initial penetration rates presented in Table 53 will have to be applied tomodify the gross savings estimate appropriately. Given this, we recommend that the SavingSpreadsheet be modified in two ways. The gross savings in the Spreadsheet should be changed tothe value reflecting no initial market penetration. Second, the estimated initial market penetrationshould be added to the Spreadsheet as factor to adjust the gross savings. With these changes, theSpreadsheet can be updated easily and transparently as new data become available about marketpenetration and changes in the gross savings potential.
Noncompliance Rates
A summary of our estimated noncompliance rates is presented in Table 54. The estimated ratesare shown for each appliance and building measure we analyzed. In addition, the table presentsan assessment of the certainty level that applies to each estimate.
Table 54. Noncompliance Rates
Appliance or Building Measure Estimatednoncompliance rate
Certainty levelof estimate*
AppliancesTelevisions 41% MediumDVD Players 57% MediumResidential Pool Pumps, Tier 1 15% MediumGeneral Service Incandescents, Tier 1 27% MediumMetal Halide Luminaires 37% LowWalk-in Refrigerators/ Freezers 0% MediumPre-rinse Spray Valves 4.2% HighUnit Heaters and Duct Furnaces 44% LowRefrigerated Canned/Bottled BeverageVending Machines 63% Low
Residential Building MeasuresDucts 73% + 0.9%Hardwired lighting 28% + 3%Windows 68% + 7%Non-residential Building MeasuresBi-Level n/a n/aCool Roofs 50% + 3%Ducts--New 100% + 1%Ducts--Retrofit 100% + 2%Skylights 44% + 10%
*Certainty levels for appliances are qualitative, case-specific judgments; these estimates were
based on types of data available, number of observations, and other factors. Building measurecertainty levels refer to absolute precision measurements based on the sample size for eachmeasure.

Quantec — Statewide Codes and Standards Market Adoption and Noncompliance Rates 102
The values presented in Table 54 can be used directly in the Savings Estimate Spreadsheet. It isimportant to note, however, that these values are empirically derived and apply only to the firstyear after the standards have gone into effect. The spreadsheet incorporates estimates ofnoncompliance over the entire forecasting period. The current estimate is a constant of 30% foreach appliance and building measure over the period. At this point it is necessary to determinewhat revisions should be made to the existing Spreadsheet to modify the 30% estimate in futureyears to take into account the findings from our study.
These new estimates of noncompliance are very useful in two respects. First, they provide thebest data available on initial compliance in the market, thus allowing much better estimates ofthe initial energy savings resulting from the Program . Second, they identify areas in whichefforts should be dedicated to improve compliance. The utilities and the CPUC can use thisinformation to examine alternative strategies for reducing noncompliance and can analyze theresults by applying the revised Savings Estimate Spreadsheet.

Quantec — Statewide Codes and Standards Market Adoption and Noncompliance Rates 103
7. Lessons Learned and Recommendations forFuture Research
Initial Penetration and Naturally-Occurring Market Adoption
The method we used to estimate initial penetration and naturally-occurring market adoption rateswas devised specifically for use in this project, and was applied for the first time here. Thecornerstone of our approach was an interactive Web-based tool that industry experts were able tomodify in order to draw market adoption curves. As the use of this approach was a pioneeringeffort, several lessons were learned through the process.
The Value of Pretesting
We employed two pretest rounds to fine-tune the Web tool and research process, which wereshown to be critical to the successful implementation of the methodology with the experts.During pretests, we received feedback on the instructional text, screen design, and overallfunctionality of the tool; these comments were incorporated into subsequent revisions of the tool.The value of pretesting is unquestionable. No such effort should ever be undertaken without asmuch pretesting as time allows.
Market Start Dates
A key finding in this study area was the importance of estimating realistic market adoption startdates for each measure and appliance. This is critical in creating an accurate adoption curve. Wemodified our initial respondent recruitment process to include a short survey containingquestions about when the efficient appliance or building measure was first substantially presentin the market. This could be considered the point in time when the item was consideredcommercially available. We recommend that future studies also pay close attention toestablishing meaningful dates as the starting point of the market adoption curve, and to use asimilar approach of soliciting this information from the same experts that will provide marketadoption curve inputs.
Participant Recruitment
Overall, we contacted approximately ten potential experts for each one who ultimately providedtheir adoption curve estimates. In a resource-intensive effort, we employed several techniques toidentify potential respondents, including contacting participants in the standards developmentprocess, purchasing business contact lists, conducting Web searches, and making numerousphone calls. When we were able to reach a knowledgeable and willing respondent, we used asnowball approach where contacts were asked to recommend others to recruit. Participants alsowere provided a financial incentive to participate as an inducement to complete the process.
Quantec — Statewide Codes and Standards Market Adoption and Noncompliance Rates 104
A related issue is that the final number of respondents was relatively small for somemeasures/appliances, and it was unclear whether some of the experts were knowledgeableenough about the specific markets to provide informed estimates. We did make a concertedeffort to ensure that all respondents understood the markets and technologies for which theyprovided inputs, but the significant differences in some of the estimates suggest that there mayhave been notable differences in relative knowledge levels.
Timing of Participant Recruitment
To expedite the data collection process, we began contacting experts to recruit them while theWeb-based tool was being pretested. This was useful because it allowed us to conduct severalactivities concurrently, and shorten the schedule for this phase of the project. However, we foundthat some experts, when initially contacted, expressed an interest and willingness to participatethat led them to want to go to the Web site and begin the process right then. However, becausethe tool was not finalized when recruitment started, several of these interested and willingexperts never did complete the exercise because other things intervened in the meantime. In thefuture, therefore, we recommend that recruitment wait until the data collection instrument is live,so that potential respondents can be directed to the Web site and assisted with the tool if needed.
Data Quality
In reviewing the curves submitted by the experts, there were occasions where it was clear thatthe participants either did not completely understand the process, or there was a technicalproblem in capturing their inputs. Because all the inputs were reviewed in batches, occasionally aquality problem was not identified until a few days after the respondent submitted his or herinputs. Although we followed up with the participant in each of these cases, and most were ableto revise their estimates, there were a few cases where the respondent never submitted reviseddata, and was ultimately dropped from the analysis. For future studies, we recommend, assuggested above, that at the time of recruitment, respondents be directed to the Web site andwalked through the data entry process with the recruiter. When this is not possible, werecommend that quality reviews be conducted as soon as possible following participantsubmittals.
In an effort to arrive at refined estimates, we asked respondents to provide feedback on theirinput relative to the group average adoption curve. However, the scope of this study did notallow us to fully implement a Delphi process in which respondents would be able to revise theirinputs, and exchange information about their assessments. We strongly recommend that futureefforts fully utilize Delphi, incorporating at least two additional rounds beyond the initial datagathering effort.
Recommendations for Future Research
Given our experiences trying to recruit participants, and the uncertainties around some of theresponses we received, we believe there are a number of ways that this process could beimproved in the future.

Quantec — Statewide Codes and Standards Market Adoption and Noncompliance Rates 105
First, experts should be identified during the standards development process and theyshould be informed that their input will be required to estimate market trends.
Second, the amount of the incentive should be increased to provide more motivation forthe professionals solicited to invest the time required to participate.
Third, empirical data on the baseline market should be developed, and then used toprovide an anchor point for the experts who will participate in the market estimationexercise.
Fourth, the process should be expanded to fully implement the Delphi model byconducting one or two additional rounds to allow the respondents a chance to revise theirestimates and exchange information on the range of estimates.
Finally, our study proposed employing a method for adjusting the initial penetration and marketadoption rates to reflect the effects of utility programs. However, we were unable to findsufficient information on the utility programs to support any adjustment to our estimates. As thenumber of California program evaluations increases and as the new evaluation protocols areimplemented, this should become less of a problem as more of the required data becomeavailable on a consistent basis.
Building Standards Noncompliance
Research Process
Each building department is unique, and has its own processes and procedures in place, whichresults in inconsistencies not only with permitting requirements across the state, but also with thelevel of access that is granted to the files themselves for the file review. At some buildingdepartments, access was denied or significantly restricted. Future research should allow ampletime for building department screening and scheduling, permit volume and valuation research, aswell as time to navigate a learning curve at each department, as procedures and requirementsvary widely between jurisdictions.
Our research revealed that a review of permits, while a good indicator of process compliancewith code requirements, was not a consistent indicator of actual installation of compliantmeasures. For example, the commercial lighting controls under skylights were found to bepresent and compliant in the permit files the majority of the time, and field inspections confirmedthis estimate (46% and 44% noncompliance, respectively). Conversely, commercial cool roofswere found to be almost universally noncompliant through permit review (99%), while fieldinspections showed a noncompliance rate of only 8%. These examples illustrate that, while onewould assume that improved paper compliance equals improved field compliance, that is notalways the case. Compliance is highly dependent on the measure, the building department andthe local design community. Nonetheless, the more information that is available on all aspects ofcompliance, the better we will understand how to improve compliance on a measure-by-measurebasis .

Quantec — Statewide Codes and Standards Market Adoption and Noncompliance Rates 106
Compliance Chain
The compliance chain is complex and each link represents potential for compromised energysavings if not executed properly. When code change proposals are initially researched anddeveloped, proper thought must be given to the implementation strategy in light of existingdelivery mechanisms (building department permit processes). During and following codeadoption, documentation forms must be developed that clearly communicate code requirements,and must tie in directly to the design drawings themselves. During transition, the utilities play animportant role in setting the groundwork for successful compliance through their incentiveprograms and ongoing education and training activities. Implementation largely rests on thebuilding departments; in order to be successful the energy code implementation method mustconform to their overall process. Third party rating, verification and commissioning agents alsohave an important role. Finally, the building industry itself must recognize and embrace codechanges in their design and construction practices.
Assigning Noncompliance Rates
Because records of a building department don't always provide a complete and clear path todetermining compliance, we used all possible clues from the permit record, building drawings,and existing field conditions to ascertain whether a building project complied with the intent andletter of the code.Each of these steps speaks to the effectiveness of the Codes and StandardsProgram and the resultant energy savings. The three scores were given to represent thecumulative effect of these stages on code compliance, while also helping to pinpoint areas wherethe process may be broken.
On one level, assigning noncompliance to each of three phases, process, plan review and field,was a very objective exercise. If the proper documentation was absent from all three phases, thenit was determined that energy savings were not achieved. However, we recognize that thismethodology has the potential to artificially inflate the level of noncompliance for two reasons:
1) There is a difference between meeting the letter of the code and complying with theintent of the code.
2) It is not always possible to verify product performance in the field absent a certificate orlabel, although it is possible in some cases for visual clues to provide an indication ofcompliance, though this is particularly measure dependent.
Another noteworthy finding is that a substantial number of building designers utilize theperformance method to document energy compliance, particularly in residential newconstruction, complex residential additions and large nonresidential buildings. While the basecase for the performance method is built on the prescriptive measures, the final design merelyhas to prove that the energy use is the same or less than a similar building built with theprescriptive measures in place. This comprehensive model provides a measure of overallbuilding compliance (as opposed to individual measure compliance) that would be useful toinclude in further studies.

Quantec — Statewide Codes and Standards Market Adoption and Noncompliance Rates 107
In short, although it could be argued that, absent proper code compliance documentation theCodes and Standards Program has not fully reached its objectives, ultimately, energy savingsgoals are achieved through the correct installation of the measure itself, not from thedocumentation path. In future studies, we recommend performance modeling to determine levelsof whole-building compliance to help provide some insight into the actual energy impacts ofpermit and process noncompliance, as well as partial compliance.
Future Research
We recommend additional future research to pinpoint and correct flaws in the compliance chainso that energy savings predicted from the codes can be fully realized. Research should becentered around these areas:
Market Behavior. Surveys should be conducted to determine the frequency of permitted vs.nonpermitted construction projects by measure and by jurisdiction to learn more about thepenetration levels of the codes and standards. More should be learned about permit volumesrelative to number of building projects, and the rationales behind allowing exceptions to some ofthe codes. Finally, permit data should be collected and reviewed on an ongoing basis.
Building Department Processes and Compliance. Commonalities among the buildingdepartments’ electronic and paper processes should be identified, understood, and referenced inthe development of new codes and standards. Compliance and other implementation formsshould fit into existing building department processes, rather than requiring the processes toconform to changes in the code.
End-User Surveys. Building industry professionals, from both the design and build perspectives,hold important insights into the key barriers to implementation of new codes. These barriers mayexist on the process and paperwork side of a building project, on a customer satisfaction level, oron a practical installation level. For example, this study found that skylights in >25,000 ft2 retailspace were absent in some cases due to the final end use of that building shell being uncertain(subdivision of the space was likely but undefined, and the installation of drop ceilings waslikely). A survey of the end-users of energy efficiency codes, including more field and phonesurveys, could serve to illuminate the reasons why compliance with some measure codes are solow. Research of this nature could also help define whether a measure correctly installed in thefield can be traced back to the codes and standards efforts. This information would be valuable inthe design of training and educational efforts, as well as in the design of future code updates.
Comprehensive Building-Specific Studies. Studies on building performance characterize themarket in a more complete way than do measure-specific studies. These types of studies requiredevelopment and modification of computer models and are time intensive. However, once acertain number of models are created that reflect specific construction types, these models can beused to more accurately predict the benefits arising from the codes and standards and the impactof proper enforcement.
Quantec — Statewide Codes and Standards Market Adoption and Noncompliance Rates 108
Appliance Standards Noncompliance
Overall, the approach used in this study provided a good snapshot of first-year noncompliancefor the appliances studied. We applied an approach of the following steps:
1) Identifying the best point in the supply chain to obtain the necessary data
2) Developing a sample of supply-chain actors stratified by size and distributed throughoutCalifornia
3) Conducting site visits to document products being sold (supplemented, as needed, byother data sources)
4) Assessing compliance and noncompliance rates for individual sites
5) Aggregating noncompliance estimates to develop a statewide noncompliance rate foreach efficient appliance
Compliance Information Gap
Ideally, the compliance databases maintained by the CEC should have been used to identifyappliance models that were compliant with the new standards. However, at the time of this study,those databases did not exist for every product, as some manufacturers had not submitted theirlists of complying products (due in part to legal challenges made in response to the standards).The methodological complications caused by the missing compliance databases may not recur inthe future. However, if this problem persists, the procedures we used to address the issue couldbe of value to future studies.
As a result of the compliance information gap, we applied alternative approaches to determinecompliance rates for the appliances carried by vendors. In most of these cases we recorded theproduct models in the stores in our sample and then reviewed product documents and catalogs todetermine compliance. This significantly increased the effort required, and it was not alwayspossible to find the performance or specification information needed to assess compliance, sosome uncertainties were introduced in the results.
Another complication was that it was not possible to determine when the products sold had beenmanufactured. The standards apply to products manufactured starting in 2007, and Title 20requires the manufacture date to be displayed on complying products. However, we were notable to find manufacture dates on most of the products we viewed in stores, and it would havebeen excessively time consuming to try to determine the date through product codes or serialnumbers. Lacking this information increased the uncertainty in our noncompliance estimates,and we took that into account in our certainty assessments. For the future, this should be less ofan issue as manufacturers provide compliance information and ensure that products carry themanufacture date.

Quantec — Statewide Codes and Standards Market Adoption and Noncompliance Rates 109
Sample Site Selection
To select our vendor samples for data collection, we purchased a list of California businesses asour main information source. In some cases, however, we found during our visits that the storeswere misclassified or did not carry the proper products. Once this problem was encountered westarted verifying by telephone that each business actually carried the correct appliances. Werecommend for future studies that pre-visit telephone contacts be made, not only to set up sitevisits, but also to verify that the proper products are carried by the vendors.
In the course of making the phone calls, we determined that some stores were willing and able toprovide their product information over the phone, so site visits were not necessary. However, thisapproach was possible only with stores that carried just a few different models. In future studies,this phone verification approach, where feasible, may function as a viable alternative to sitevisits, with the quality of the data obtained over the phone verified with site visits on a samplingbasis.
Retailer/Wholesaler Cooperation
The responses and cooperation of retailers and wholesalers varied. In general, smaller storeswere cooperative, but due to small staff sizes they often could not provide the time required toassist our field staff collect the necessary data. We found that some big box stores were verycooperative and willing to let us review their floor inventory and databases. The letter weobtained from the CPUC describing the study and requesting the stores’ cooperation was oftenhelpful, so we recommend that future efforts use a similar approach. Some large retailers wereunwilling to cooperate, however, without approval obtained from their corporate offices and,even though we attempted to obtain this approval, it was not possible in all cases. Werecommend in similar future studies that researchers contact store representatives a few monthsprior to data collection, determine whether corporate approval would be required or helpful, andthen obtain the necessary contact information.
In general, it was necessary to be flexible in planning and scheduling data collection. Before ourfield team made site visits, they identified all the sites to be included. However, on someoccasions the targeted store did not cooperate when our team arrived. On other occasions (asmentioned earlier), the store did not carry the correct products or was not appropriate for otherreasons. Consequently, we used an adaptive approach where our team conducted Web searchesfor other vendors when they were in a location where it was not possible to meet our desiredquota of site visits. We recommend that this option be included in similar future studies.
Use a Flexible Data Collection Approach
There were a few unique situations we encountered that required special approaches. For themetal halide luminaires, we found that there was a lot of information available on metal halidelamps, and that a range of stores sold them. However, there was considerably less informationavailable on-line for luminaires, and few of the vendors we contacted sold entire luminaires. Inthis case, distributors, contractors, and manufacturers turned out to be the best sources ofinformation on this product. Adequate attention should be paid to the unique characteristics of

Quantec — Statewide Codes and Standards Market Adoption and Noncompliance Rates 110
the markets for specific products, and the data collection strategy should be designed with thesecharacteristics in mind.

Quantec — Statewide Codes and Standards Market Adoption and Noncompliance Rates 111
Appendix A: Adoption Curve Expert Identificationand Contact Information
This appendix summarizes information about the process we used to identify, contact, and recruitexperts to participate in the naturally-occurring market adoption estimation exercise. Thisinformation should be useful for future studies.
Pool Pumps
We began by calling two industry associations: the Association of Pool & Spa Professionals(APSP) and the National Swimming Pool Foundation (NSPF). Within two phone calls wereached a representative from one of the two associations. He forwarded an email to theassociation members that we prepared describing the nature of the research and the incentives wewere offering. Four members replied expressing interest. These replies were forwarded to us,supplying us with contact information. Even though they expressed interest in an email to theirassociation, only three of the four company representatives participated. In some cases only oneor two phone calls were required to get the information we needed, while others required severalphone calls to reach the right person, and explain the requirements of the research over thephone. The company that did not participate returned one phone call and left a message, but thendid not respond to a subsequent call. As marketers or sales managers, these manufacturerrepresentatives were knowledgeable about the pool pump market. Asking some of these expertsfor distributors they work with resulted in a few phone numbers of contacts, but, unfortunately,no one who ended up participating in the survey.
We found other contacts through persistent calling of numbers found on company websites.Finding major distributors who were interested in participating proved to be difficult. Afterseveral phone calls we reached one distributor who agreed to participate.. However, he neverresponded to the emails or reminder calls. One third of the pool pumps installed pass through onespecific chain of stores. However, several calls to this chain resulted in long waits; we left twomessages with two different individuals who never responded.
We were able to reach two remaining contacts as a result of calling numerous other pool supplystores and reaching the president/manager of the store. In the end, we made about 40 phone callsand sent many emails, resulting in the participation of five experts.
Incandescent Lamps
Incandescent lamp manufacturing is dominated by three large corporations, GE, Osram Sylvania,and Philips, each of which dwarfs the largest pool pump manufacturers. Consequently, followingthe strategy outlined above proved to be less effective. Initial calls to the National ElectricalManufacturers Association (NEMA) regional offices were not returned. The national office wasinitially unresponsive; later in the process we uncovered that the contact person to whom wedirected had retired. Later in the process we reached the new official who proved to be helpful.
Quantec — Statewide Codes and Standards Market Adoption and Noncompliance Rates 112
The American Lighting Association (ALA) representative was also helpful, offering assistanceand additional referrals to recommended contacts. However, when we reached the referralcontacts, many of them felt they were not qualified, and declined to a participate.
By contacting other consulting firms and people who had worked on the standards, we receivedreferrals to knowledgeable consultants who had not worked on the standards, as well as otherengineers within the large manufacturers. Eventually we made contact with the correct parties inthe manufacturing association, and we were able to conduct productive discussions. Since thereare only three major lighting manufacturers, it was difficult to find more than three independentparticipants among the companies. Through extensive research on incandescent lamps, we alsoidentified academics who offered advice, and contacts among metal halide manufacturers that weused to research that product.
We were provided contact information for only three distributors, and we attempted to contactthem all, but none returned our calls. Overall, at least 40 calls were made to manufacturers,consultants, and distributors, resulting in five contacts who said they would participate.
Metal Halides
We initially had significant difficulties trying to identify and reach industry experts. Searches onthe internet resulted in contact phone numbers, but led us only to answering machines, and wereceived no return phone calls as a result of the messages we left. However, by following achain of people (including the leads obtained through the research on incandescent lamps) weeventually reached some well-connected consultants who were happy to refer su to acomprehensive list of influential contacts in business and government. These referrals returnedcalls at a high rate and, in general, were very helpful. Unlike with the larger corporations in theincandescent and consumer electronics industries, in this case executives were more willing totalk about their businesses, and to share their opinions of the future of the market.
After the slow start, 28 calls resulted in six expert contacts who agreed to participate in ourresearch.
Pre-rinse Spray Valves
With only three major spray valve manufacturers, Fisher, Chicago Faucets, T&S Brass andBronze Works, and each of moderate size, we had to make only a few calls to find an interested,knowledgeable participant at each of the three companies. Unfortunately, one manufacturer whoagreed to participate never responded again to repeated phone calls, and a second declined toparticipate.
It was difficult to identify and reach distributors. We contacted two distributors, and one initiallyagreed to participate, but then reversed his decision, citing a busy schedule as the reason. Weidentified one additional expert who was employed by a testing facility, and he agreed toparticipate. In the end, two experts agreed to participate out of the thirteen that we called.
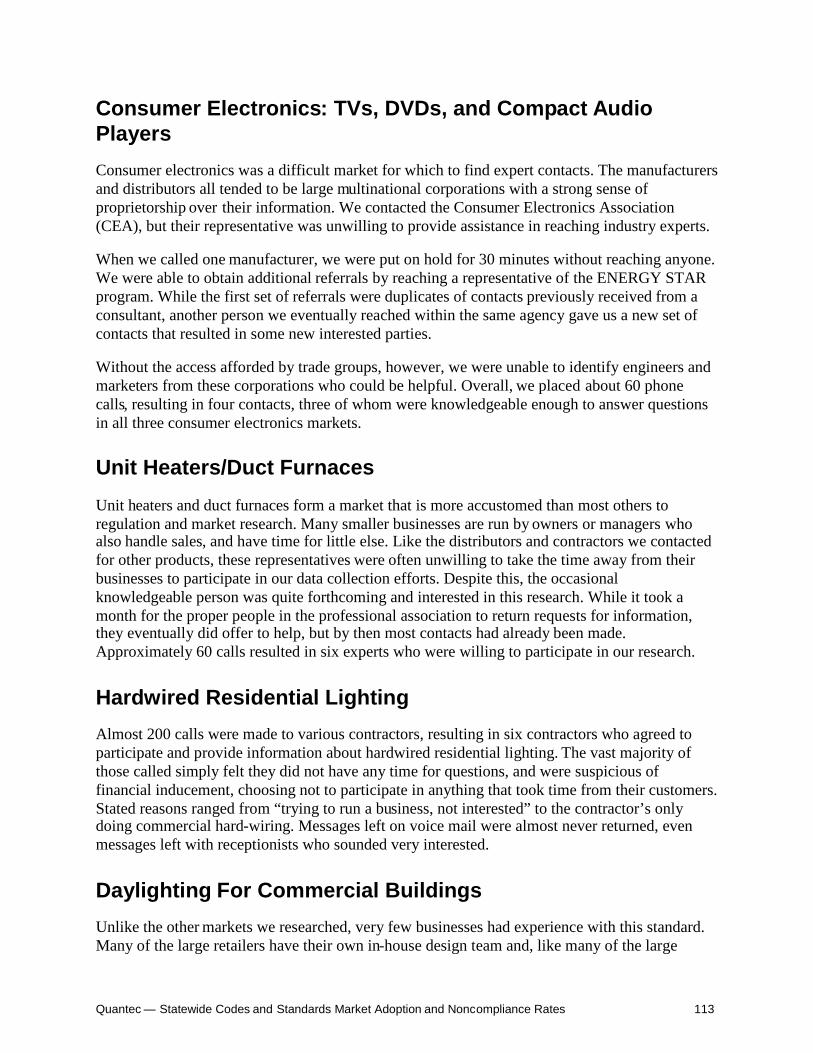
Quantec — Statewide Codes and Standards Market Adoption and Noncompliance Rates 113
Consumer Electronics: TVs, DVDs, and Compact AudioPlayers
Consumer electronics was a difficult market for which to find expert contacts. The manufacturersand distributors all tended to be large multinational corporations with a strong sense ofproprietorship over their information. We contacted the Consumer Electronics Association(CEA), but their representative was unwilling to provide assistance in reaching industry experts.
When we called one manufacturer, we were put on hold for 30 minutes without reaching anyone.We were able to obtain additional referrals by reaching a representative of the ENERGY STARprogram. While the first set of referrals were duplicates of contacts previously received from aconsultant, another person we eventually reached within the same agency gave us a new set ofcontacts that resulted in some new interested parties.
Without the access afforded by trade groups, however, we were unable to identify engineers andmarketers from these corporations who could be helpful. Overall, we placed about 60 phonecalls, resulting in four contacts, three of whom were knowledgeable enough to answer questionsin all three consumer electronics markets.
Unit Heaters/Duct Furnaces
Unit heaters and duct furnaces form a market that is more accustomed than most others toregulation and market research. Many smaller businesses are run by owners or managers whoalso handle sales, and have time for little else. Like the distributors and contractors we contactedfor other products, these representatives were often unwilling to take the time away from theirbusinesses to participate in our data collection efforts. Despite this, the occasionalknowledgeable person was quite forthcoming and interested in this research. While it took amonth for the proper people in the professional association to return requests for information,they eventually did offer to help, but by then most contacts had already been made.Approximately 60 calls resulted in six experts who were willing to participate in our research.
Hardwired Residential Lighting
Almost 200 calls were made to various contractors, resulting in six contractors who agreed toparticipate and provide information about hardwired residential lighting. The vast majority ofthose called simply felt they did not have any time for questions, and were suspicious offinancial inducement, choosing not to participate in anything that took time from their customers.Stated reasons ranged from “trying to run a business, not interested” to the contractor’s onlydoing commercial hard-wiring. Messages left on voice mail were almost never returned, evenmessages left with receptionists who sounded very interested.
Daylighting For Commercial Buildings
Unlike the other markets we researched, very few businesses had experience with this standard.Many of the large retailers have their own in-house design team and, like many of the large
Quantec — Statewide Codes and Standards Market Adoption and Noncompliance Rates 114
corporations previously described, are difficult to reach. Approximately 80 calls were made tovarious energy management contractors resulting in only one expert in the industry who agreedto participate.
By contacting architectural organizations and contacts made from the lighting market research,we eventually made over 120 calls to find four contacts.
Residential and Commercial HVAC Ducts
Judging from their responses to phone calls asking about their background and suitability forparticipating in research, HVAC contractors are consistently very busy. We had problems similarto those described earlier about the hardwired lighting market. We made more than 100 calls thatresulted in ten experts who agreed to participate. Unfortunately, of the ten who initially agreed,only three participated when the survey requests were presented to them.

Quantec — Statewide Codes and Standards Market Adoption and Noncompliance Rates 115
Appendix B: Appliance Noncompliance Site-by-Site Information
This appendix presents the information collected from each site for the appliances included in thenoncompliance analysis.
Televisions
Site-by-site information is presented below for sources providing data on televisions.
Site 1
This business operates in Northern California, and was designated as a member of the largestratum under the previously defined classification system. Our site visit identified 83 uniquemodel numbers for multiple brands available from this outlet. Of these model numbers, 22 werefound in the database. (See Table 55)
Table 55. Televisions: Products in CEC Database - Site 1
Unique ModelsIdentified
Models Foundin Database
Models Not Foundin Database
% inDatabase
83 22 61 27%
Due to security concerns, the retailer did not permit an inventory count of these products. Salesdata were also unavailable.
Site 2
This company operates in Southern California, and was designated as a large business. Our sitevisit identified 153 unique model numbers for multiple brands available from this company. Ofthese model numbers, 57 were found in the database. (See Table 56)
Table 56. Televisions: Products in CEC Database - Site 2
Unique ModelsIdentified
Models Foundin Database
Models Not Foundin Database
%Compliant
153 57 96 37%
While on site, an inventory was recorded for each of the model numbers. As a result, compliancebased on inventory was estimated as presented in Table 57. Sales data were not available at thislocation.

Quantec — Statewide Codes and Standards Market Adoption and Noncompliance Rates 116
Table 57. Televisions: Inventory Compliance - Site 2
Total Inventory Compliant Not Compliant %Compliant
432 207 225 48%
Site 3
This company operates in Central California, and was categorized as large. Our site visitidentified 175 unique model numbers for multiple brands available from this company. Of thesemodel numbers, 64 were found in the database. (See Table 58)
Table 58. Televisions: Products in CEC Database - Site 3
Unique ModelsIdentified
Models Foundin Database
Models Not Foundin Database
%Compliant
175 64 111 37%
Due to security concerns, the retailer did not permit an inventory count of these products. Salesdata were also unavailable.
Site 4
This company operates in Central California, and was designated as a member of the largestratum. Our site visit identified 115 unique model numbers for multiple brands available at thislocation. Of these model numbers, 76 were found in the database. (See Table 59)
Table 59. Televisions: Products in CEC Database - Site 4Unique Models
IdentifiedModels Foundin Database
Models Not Foundin Database
%Compliant
115 76 39 66%
Due to security concerns, the retailer did not permit an inventory count of these products. Salesdata were also unavailable.
Site 5
This company operates in Northern California, and was a large business. Our site visit identified102 unique model numbers for multiple brands available from this company. Of these modelnumbers, 57 were found in the database. (See Table 60.)
Table 60. Televisions: Products in CEC Database - Site 5
Unique ModelsIdentified
Models Foundin Database
Models Not Foundin Database
%Compliant
102 57 45 56%
The retailer did not permit an inventory count of these products. Sales data were alsounavailable.

Quantec — Statewide Codes and Standards Market Adoption and Noncompliance Rates 117
Site 6
This company operates in Southern California, and was designated as a large business. Our sitevisit identified 134 unique model numbers for multiple brands available from this company. Ofthese model numbers, 81 were found in the database. (See Table 61)
Table 61. Televisions: Products in CEC Database - Site 6
Unique ModelsIdentified
Models Foundin Database
Models Not Foundin Database
%Compliant
134 81 53 60%
While on site, an inventory was recorded for each of the model numbers. As a result, we wereable to estimate compliance based on inventory as presented in Table 62. Sales data were notavailable at this location.
Table 62. Televisions: Inventory Compliance - Site 6
Total Inventory Compliant Not Compliant %Compliant
473 320 153 68%
Site 7
This company operates in Southern California and it was defined as a large business. Our sitevisit identified 40 unique model numbers for multiple brands available from this company. Ofthese model numbers, 11 were found in the database. (See Table 63.)
Table 63. Televisions: Products in CEC Database - Site 7
Unique ModelsIdentified
Models Foundin Database
Models Not Foundin Database
%Compliant
40 11 29 28%
Due to security concerns, the retailer did not permit an inventory count of these products. Salesdata were also unavailable.
Site 8
This company operates in Central California, and was designated as a member of the smallstratum under our classification system. Our site visit identified three unique model numbers formultiple brands available from this company. Of these model numbers, all were found in thedatabase. (See Table 64)
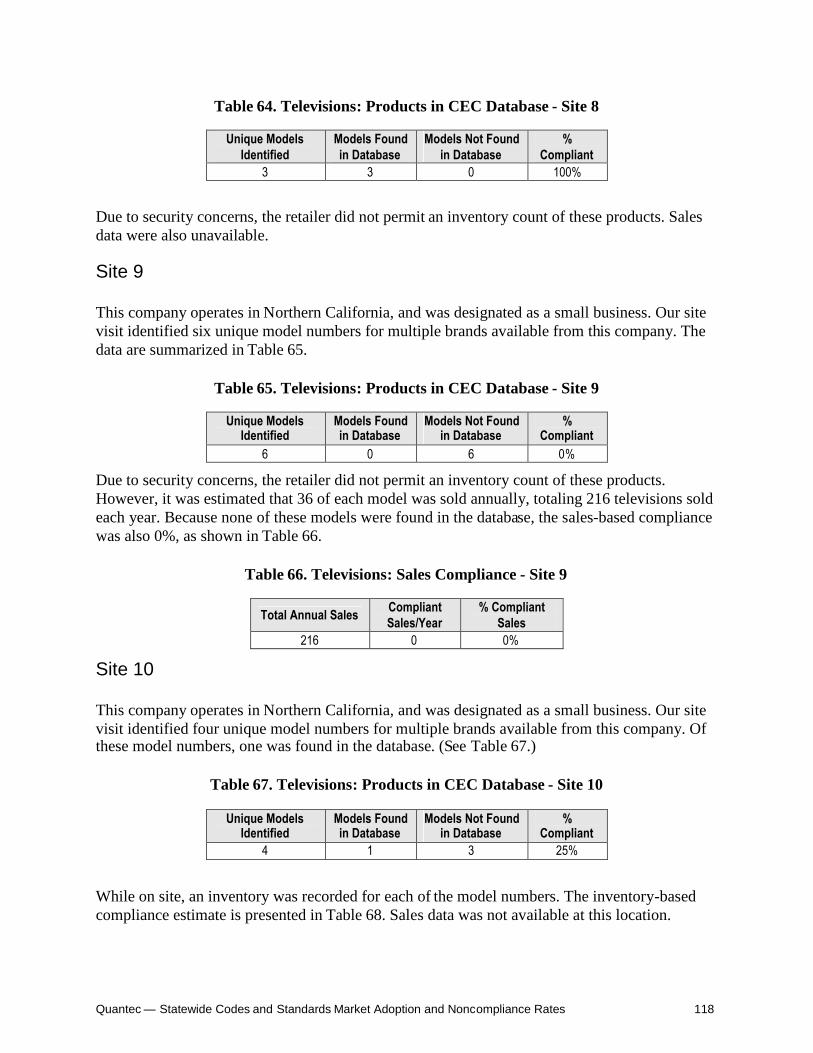
Quantec — Statewide Codes and Standards Market Adoption and Noncompliance Rates 118
Table 64. Televisions: Products in CEC Database - Site 8
Unique ModelsIdentified
Models Foundin Database
Models Not Foundin Database
%Compliant
3 3 0 100%
Due to security concerns, the retailer did not permit an inventory count of these products. Salesdata were also unavailable.
Site 9
This company operates in Northern California, and was designated as a small business. Our sitevisit identified six unique model numbers for multiple brands available from this company. Thedata are summarized in Table 65.
Table 65. Televisions: Products in CEC Database - Site 9
Unique ModelsIdentified
Models Foundin Database
Models Not Foundin Database
%Compliant
6 0 6 0%
Due to security concerns, the retailer did not permit an inventory count of these products.However, it was estimated that 36 of each model was sold annually, totaling 216 televisions soldeach year. Because none of these models were found in the database, the sales-based compliancewas also 0%, as shown in Table 66.
Table 66. Televisions: Sales Compliance - Site 9
Total Annual Sales CompliantSales/Year
% CompliantSales
216 0 0%
Site 10
This company operates in Northern California, and was designated as a small business. Our sitevisit identified four unique model numbers for multiple brands available from this company. Ofthese model numbers, one was found in the database. (See Table 67.)
Table 67. Televisions: Products in CEC Database - Site 10
Unique ModelsIdentified
Models Foundin Database
Models Not Foundin Database
%Compliant
4 1 3 25%
While on site, an inventory was recorded for each of the model numbers. The inventory-basedcompliance estimate is presented in Table 68. Sales data was not available at this location.

Quantec — Statewide Codes and Standards Market Adoption and Noncompliance Rates 119
Table 68. Televisions: Inventory Compliance - Site 10
Total Inventory Compliant Not Compliant %Compliant
12 3 9 25%
Site 11This business operates in Central California, and was designated as a member of the smallstratum under the previously defined classification system. Our site visit identified three uniquemodel numbers for multiple brands available from this company. Of these model numbers, onewas found in the database. (See Table 69)
Table 69. Televisions: Products in CEC Database - Site 11
Unique ModelsIdentified
Models Foundin Database
Models Not Foundin Database
%Compliant
3 1 2 33%
Due to security concerns, the retailer did not permit an inventory count of these products.However, it was estimated that 120 of each model was sold annually, totaling 360 televisionssold each year. Because only one of these models was found in the database, it was possible toestimate the sales-based compliance as shown in Table 70.
Table 70. Televisions: Sales Compliance - Site 11
Total Annual Sales CompliantSales/Year
% CompliantSales
360 120 33%
Site 12This company operates in Southern California, and was designated as a member of the smallstratum under our classification system. The site visit identified 48 unique model numbers formultiple brands available from this company. Of these model numbers, 27 were found in thedatabase. (See Table 71)
Table 71. Televisions: Products in CEC Database - Site 12
Unique ModelsIdentified
Models Foundin Database
Models Not Foundin Database
%Compliant
48 27 21 56%
While on site, the inventory was recorded for each of the model numbers. As a result,compliance based on inventory can be estimated at 60%, as presented in Table 72.

Quantec — Statewide Codes and Standards Market Adoption and Noncompliance Rates 120
Table 72. Televisions: Inventory Compliance - Site 12
Total Inventory Compliant Not Compliant %Compliant
2,026 1,214 812 60%
It should be noted that of the 48 unique models that were identified, two models with a total of46 units, were reported as having been discontinued. Removing these discontinued items fromthe analysis results in a compliance rate of 59% based on model numbers, and 61% based oninventory.
Sales data were not available at this location.
Site 13This company operates in Northern California, and was designated as a small business. Our sitevisit identified 10 unique model numbers for multiple brands available from this company. Ofthese model numbers, two were found in the database. (See Table 73)
Table 73. Televisions: Products in CEC Database - Site 13
Unique ModelsIdentified
Models Foundin Database
Models Not Foundin Database
%Compliant
10 2 8 20%
Due to security concerns, the retailer did not permit an inventory count of these products. Salesdata were also unavailable.
DVDs
Site-by-site results are presented below for DVDs.
Site 1This company operates in Northern California, and was designated as a member of the largestratum under the previously defined classification system. Our site visit identified 22 uniquemodel numbers for multiple brands available from this company. Of these model numbers, eightwere found in the database. (See Table 74)
Table 74. DVDs: Products in CEC Database - Site 1
Unique ModelsIdentified
Models Foundin Database
Models Not Foundin Database
%Compliant
22 8 14 36%
Due to security concerns, the retailer did not permit an inventory count of these products. Salesdata were also unavailable.

Quantec — Statewide Codes and Standards Market Adoption and Noncompliance Rates 121
Site 2This company operates in Southern California, and was a large business. Our site visit identified59 unique model numbers for multiple brands available from this company. Of these modelnumbers, 16 were found in the database. (See Table 75)
Table 75. DVDs: Products in CEC Database - Site 2
Unique ModelsIdentified
Models Foundin Database
Models Not Foundin Database
%Compliant
59 16 43 27%
Due to security concerns, the retailer did not permit an inventory count of these products. Salesdata were also unavailable.
Site 3This company operates in Central California, and was designated a large business. Our site visitidentified 57 unique model numbers this business carried. Of these model numbers, 15 werefound in the database. (See Table 76)
Table 76. DVDs: Products in CEC Database - Site 3
Unique ModelsIdentified
Models Foundin Database
Models Not Foundin Database
%Compliant
57 15 42 26%
While on site, an inventory was recorded for each of the model numbers. As a result, weestimated compliance based on the inventory count as presented in Table 77. Sales data were notavailable at this location.
Table 77. DVDs: Inventory Compliance - Site 3
Total Inventory Compliant Not Compliant %Compliant
44 18 26 41%
Site 4This company operates in Southern California, and was designated as a large business. Our sitevisit identified 95 unique model numbers for multiple brands available from this company. Ofthese model numbers, 20 were found in the database. (See Table 78)
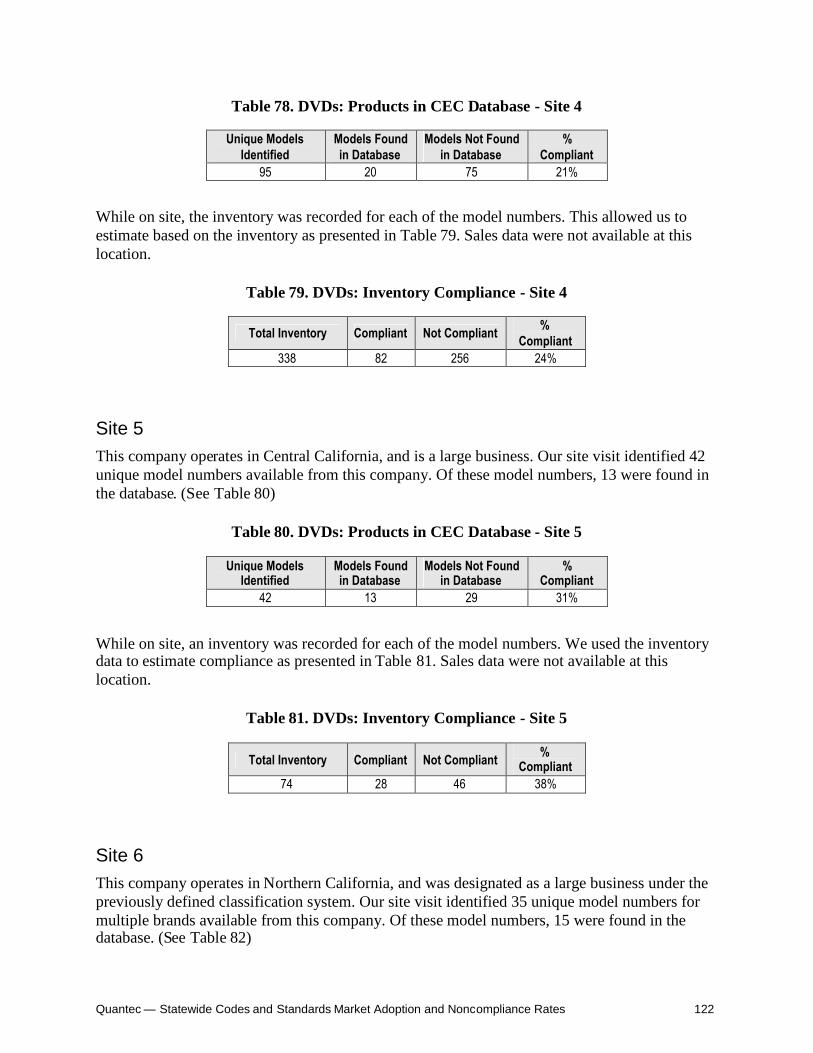
Quantec — Statewide Codes and Standards Market Adoption and Noncompliance Rates 122
Table 78. DVDs: Products in CEC Database - Site 4
Unique ModelsIdentified
Models Foundin Database
Models Not Foundin Database
%Compliant
95 20 75 21%
While on site, the inventory was recorded for each of the model numbers. This allowed us toestimate based on the inventory as presented in Table 79. Sales data were not available at thislocation.
Table 79. DVDs: Inventory Compliance - Site 4
Total Inventory Compliant Not Compliant %Compliant
338 82 256 24%
Site 5This company operates in Central California, and is a large business. Our site visit identified 42unique model numbers available from this company. Of these model numbers, 13 were found inthe database. (See Table 80)
Table 80. DVDs: Products in CEC Database - Site 5
Unique ModelsIdentified
Models Foundin Database
Models Not Foundin Database
%Compliant
42 13 29 31%
While on site, an inventory was recorded for each of the model numbers. We used the inventorydata to estimate compliance as presented in Table 81. Sales data were not available at thislocation.
Table 81. DVDs: Inventory Compliance - Site 5
Total Inventory Compliant Not Compliant %Compliant
74 28 46 38%
Site 6This company operates in Northern California, and was designated as a large business under thepreviously defined classification system. Our site visit identified 35 unique model numbers formultiple brands available from this company. Of these model numbers, 15 were found in thedatabase. (See Table 82)

Quantec — Statewide Codes and Standards Market Adoption and Noncompliance Rates 123
Table 82. DVDs: Products in CEC Database - Site 6
Unique ModelsIdentified
Models Foundin Database
Models Not Foundin Database
%Compliant
35 15 20 43%
Due to security concerns, the retailer did not permit an inventory count of these products. Salesdata were also unavailable.
Site 7This company operates in Southern California, and was designated as a large business. Our sitevisit identified 31 unique model numbers for multiple brands available from this company. Ofthese model numbers, 15 were found in the database. (See Table 83)
Table 83. DVDs: Products in CEC Database - Site 7
Unique ModelsIdentified
Models Foundin Database
Models Not Foundin Database
%Compliant
31 15 16 48%
While on site, the inventory was recorded for each of the model numbers. We used the inventorydata to estimate compliance as shown in Table 84. Sales data were not available at this location.
Table 84. DVDs: Inventory Compliance - Site 7
Total Inventory Compliant Not Compliant %Compliant
98 52 46 53%
Site 8This company operates in Southern California, and was a large business. Our site visit identified38 unique model numbers available from this company. Of these model numbers, 11 were foundin the database. (See Table 85)
Table 85. DVDs: Products in CEC Database - Site 8
Unique ModelsIdentified
Models Foundin Database
Models Not Foundin Database
%Compliant
38 11 27 29%
Due to security concerns, the retailer did not permit an inventory count of these products. Salesdata were also unavailable.

Quantec — Statewide Codes and Standards Market Adoption and Noncompliance Rates 124
Site 9This company operates in Central California, and was a small business. Our site visit identifiedfive unique model numbers for multiple brands available from this company. Of these modelnumbers, two were found in the database. (See Table 86)
Table 86. DVDs: Products in CEC Database - Site 9
Unique ModelsIdentified
Models Foundin Database
Models Not Foundin Database
%Compliant
5 2 3 40%
Due to security concerns, the retailer did not permit an inventory count of these products. Salesdata were also unavailable.
Site 10This company operates in Northern California, and was designated as a small business under thepreviously defined classification system. Our site visit identified eight unique model numbers formultiple brands available from this company. Of these model numbers, two 2 were found in thedatabase. (See Table 87)
Table 87. DVDs: Products in CEC Database - Site 10
Unique ModelsIdentified
Models Foundin Database
Models Not Foundin Database
%Compliant
8 2 6 25%
Due to security concerns, the retailer did not permit an inventory count of these products.However, it was estimated that 12 of each model were sold annually, totaling 96 DVDs sold eachyear. We used these sales estimates, and the fact that only two models were found in thedatabase, to estimate sales-based compliance as shown in Table 88.
Table 88. DVDs: Sales Compliance - Site 10
Total Annual Sales CompliantSales/Year
% CompliantSales
96 24 25%
It should be noted that of the 8 unique models that were identified, 2 models were reported ashaving been discontinued. As with the other models, each of these were estimated to sell at therate of 12 per year. Removing these discontinued items from the analysis results in a compliancerate of 33% based on model numbers, and 33% based on sales.
Site 11This company operates in Northern California, and was designated as a member of the smallstratum under the previously defined classification system. Our site visit identified 11 unique

Quantec — Statewide Codes and Standards Market Adoption and Noncompliance Rates 125
model numbers for multiple brands available from this company. Of these model numbers, 3were found in the database. (See Table 89)
Table 89. DVDs: Products in CEC Database - Site 11
Unique ModelsIdentified
Models Foundin Database
Models Not Foundin Database
%Compliant
11 3 8 27%
While on site, we recorded an inventory for each of the model numbers. As a result, compliancebased on inventory can be estimated at 27%, as presented in Table 90. Sales data were notavailable at this location.
Table 90. DVDs: Inventory Compliance - Site 11
Total Inventory Compliant Not Compliant %Compliant
33 9 24 27%
Site 12This company operates in Central California, and was categorized as small. Our site visitidentified eight unique model numbers for multiple brands available from this company. Of thesemodel numbers, three were found in the database. (See Table 91)
Table 91. DVDs: Products in CEC Database - Site 12
Unique ModelsIdentified
Models Foundin Database
Models Not Foundin Database
%Compliant
8 3 5 38%
Complete sales data were not provided by this retailer. Instead, the contact was able to attribute90% of the company’s DVD sales to the eight unique model numbers that were recorded, andprovided the percentage of annual sales attributable to those specific models as shown in Table92. Using this information, 39% of the company’s annual sales are compliant, 51% are not, and10% are models for which we had no information. Table 93 presents the same data, but adjustedby excluding the 10% of sales for which no model information or compliance data wereavailable.
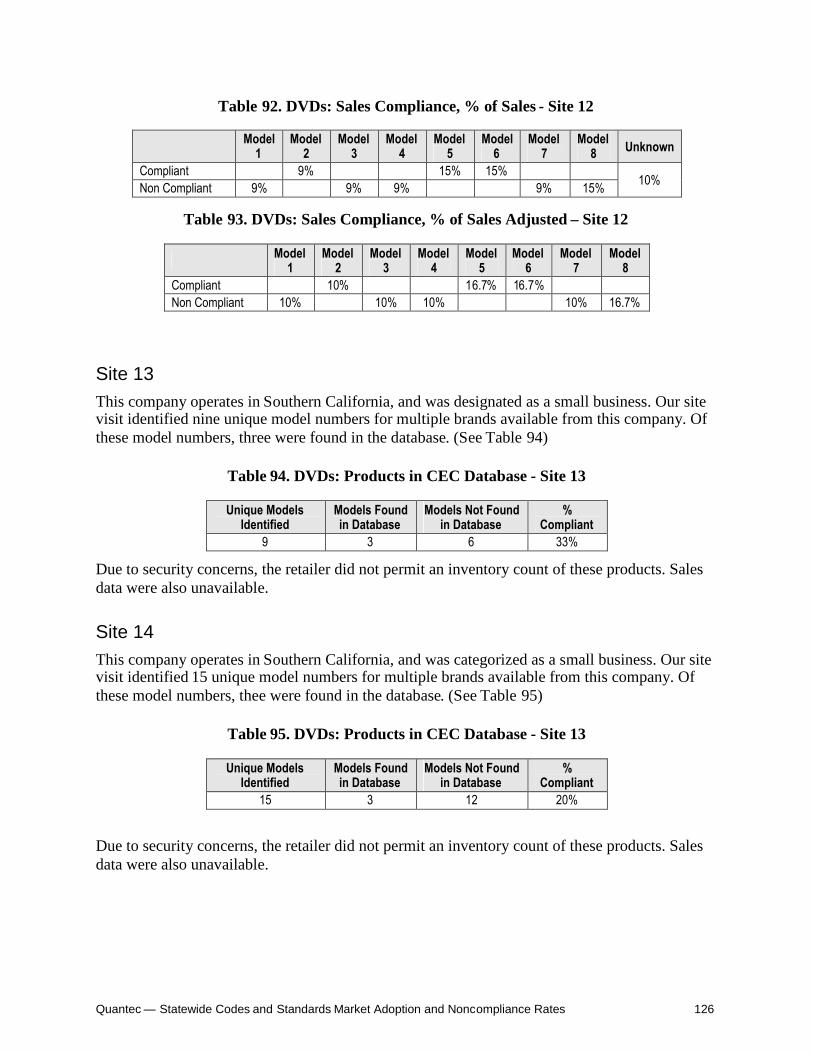
Quantec — Statewide Codes and Standards Market Adoption and Noncompliance Rates 126
Table 92. DVDs: Sales Compliance, % of Sales - Site 12
Model1
Model2
Model3
Model4
Model5
Model6
Model7
Model8 Unknown
Compliant 9% 15% 15%Non Compliant 9% 9% 9% 9% 15% 10%
Table 93. DVDs: Sales Compliance, % of Sales Adjusted – Site 12
Model1
Model2
Model3
Model4
Model5
Model6
Model7
Model8
Compliant 10% 16.7% 16.7%Non Compliant 10% 10% 10% 10% 16.7%
Site 13This company operates in Southern California, and was designated as a small business. Our sitevisit identified nine unique model numbers for multiple brands available from this company. Ofthese model numbers, three were found in the database. (See Table 94)
Table 94. DVDs: Products in CEC Database - Site 13
Unique ModelsIdentified
Models Foundin Database
Models Not Foundin Database
%Compliant
9 3 6 33%
Due to security concerns, the retailer did not permit an inventory count of these products. Salesdata were also unavailable.
Site 14This company operates in Southern California, and was categorized as a small business. Our sitevisit identified 15 unique model numbers for multiple brands available from this company. Ofthese model numbers, thee were found in the database. (See Table 95)
Table 95. DVDs: Products in CEC Database - Site 13
Unique ModelsIdentified
Models Foundin Database
Models Not Foundin Database
%Compliant
15 3 12 20%
Due to security concerns, the retailer did not permit an inventory count of these products. Salesdata were also unavailable.

Quantec — Statewide Codes and Standards Market Adoption and Noncompliance Rates 127
Site 15This company operates in Southern California, and was designated as a member of the smallstratum. Our site visit identified 13 unique model numbers for multiple brands available fromthis company. Of these model numbers, eight were found in the database. (See Table 96)
Table 96. DVDs: Products in CEC Database - Site 11
Unique ModelsIdentified
Models Foundin Database
Models Not Foundin Database
%Compliant
13 8 5 62%
While on site, an inventory count was recorded for each of the model numbers. As a result,compliance based on inventory was estimated as presented in Table 97.
Table 97. DVDs: Inventory Compliance - Site 15
Total Inventory Compliant Not Compliant %Compliant
547 398 149 73%
It should be noted that of the 13 unique models that were identified, one was reported as havingbeen discontinued. Twelve of these units were in stock. Removing these discontinued items fromthe analysis results in a compliance rate of 67% based on model numbers, and 74% based oninventory. Sales data were not available at this location.
Residential Pool Pumps
The results of our site visits and follow-up calls are presented by site below.
Site 1
This company operates in Southern California, and was designated as a small business under ourpreviously defined classification system. Data collected during the site visit included 35 modelnumbers on the shelf. Table 98 shows product compliance based on the model numbers that wererecorded on site; note that the percent compliant value includes the Not Found (unidentifiedmotor types) units and treats them as noncompliant. We use this approach in the remainingassessments for pool pumps.

Quantec — Statewide Codes and Standards Market Adoption and Noncompliance Rates 128
Table 98. Pool Pumps: Model Number Compliance – Site 1
TotalModels
Capacitor-Run(Compliant)
Dual-Speed(Compliant)
Capacitor-Start(Not Compliant)
Not Found(Not Compliant)
%Compliant
35 10 8 15 2 51%
While neither sales data nor a full inventory count were provided during the site visit, a follow-up call was performed to gather sales information of the top sellers. Table 99 provides thecompliance rate based on sales information for the top sellers. In this table and all similar tablesfor this product, we make the conservative assumption that none of the units that are not topsellers comply. The resulting estimate is considerably higher than the value based on a count ofthe models available and shows the importance for this product of weighting by sales.
Table 99. Pool Pumps: Top Sales Compliance – Site 1
Top SellerCompli-
ant(Y/N)?
% ofTotalSales
Estimated AnnualSales of the Top
Sellers
Compliance Basedon Complying Top
SellersWhisper Flow ¾ HP (WFE3) Y 80%
Whisper Flow 1HP (WFE4) Y 15%31 95%
Everything Else (Not Top Sellers) N 5%
During the follow-up call, the contact stated that their company always recommends energy-efficient pool-pump models. They encourage customers to downsize from their old pumps andargue that pump capacity (flow rate) and energy-efficient design are better now than for olderpumps.
Site 2
This company operates in Southern California, and was designated as a small business under oursystem. Data collected during site visits included 24 model numbers on the shelf at this location.Table 100 shows product compliance based on the model numbers that were recorded on site.
Table 100. Pool Pumps: Model Number Compliance – Site 2
TotalModels
Capacitor-Run(Compliant)
Dual-Speed(Compliant)
Capacitor-Start(Not Compliant)
Not Found(Not Compliant)
%Compliant
24 20 0 3 1 83%
While sales data were not provided during the site visit and a full inventory count was notavailable, a follow-up call was performed to gather sales information for the top sellers. Afterrepeated phone calls, however, this respondent would not agree to provide sales information. Theonly information relayed was manufacturers of units sold: Pentair Whisper Flow and HaywardTriStar. This information was verified during the site visit.
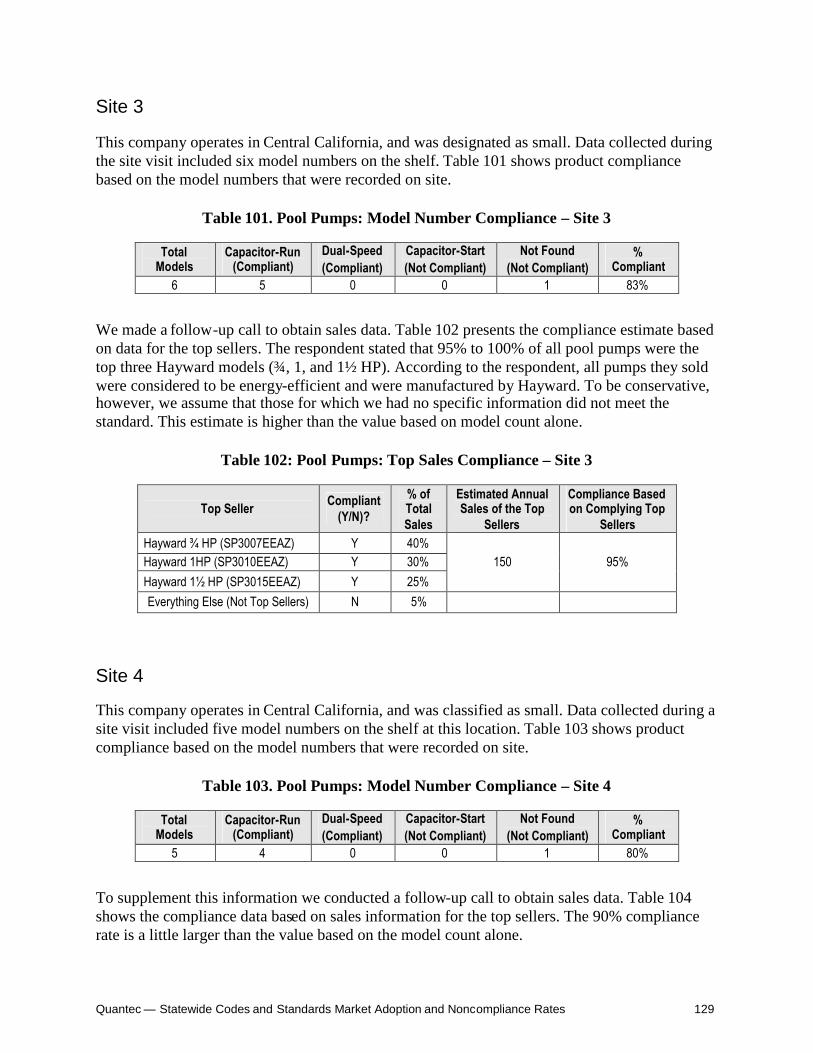
Quantec — Statewide Codes and Standards Market Adoption and Noncompliance Rates 129
Site 3
This company operates in Central California, and was designated as small. Data collected duringthe site visit included six model numbers on the shelf. Table 101 shows product compliancebased on the model numbers that were recorded on site.
Table 101. Pool Pumps: Model Number Compliance – Site 3
TotalModels
Capacitor-Run(Compliant)
Dual-Speed(Compliant)
Capacitor-Start(Not Compliant)
Not Found(Not Compliant)
%Compliant
6 5 0 0 1 83%
We made a follow-up call to obtain sales data. Table 102 presents the compliance estimate basedon data for the top sellers. The respondent stated that 95% to 100% of all pool pumps were thetop three Hayward models (¾, 1, and 1½ HP). According to the respondent, all pumps they soldwere considered to be energy-efficient and were manufactured by Hayward. To be conservative,however, we assume that those for which we had no specific information did not meet thestandard. This estimate is higher than the value based on model count alone.
Table 102: Pool Pumps: Top Sales Compliance – Site 3
Top Seller Compliant(Y/N)?
% ofTotalSales
Estimated AnnualSales of the Top
Sellers
Compliance Basedon Complying Top
SellersHayward ¾ HP (SP3007EEAZ) Y 40%Hayward 1HP (SP3010EEAZ) Y 30%Hayward 1½ HP (SP3015EEAZ) Y 25%
150 95%
Everything Else (Not Top Sellers) N 5%
Site 4
This company operates in Central California, and was classified as small. Data collected during asite visit included five model numbers on the shelf at this location. Table 103 shows productcompliance based on the model numbers that were recorded on site.
Table 103. Pool Pumps: Model Number Compliance – Site 4
TotalModels
Capacitor-Run(Compliant)
Dual-Speed(Compliant)
Capacitor-Start(Not Compliant)
Not Found(Not Compliant)
%Compliant
5 4 0 0 1 80%
To supplement this information we conducted a follow-up call to obtain sales data. Table 104shows the compliance data based on sales information for the top sellers. The 90% compliancerate is a little larger than the value based on the model count alone.
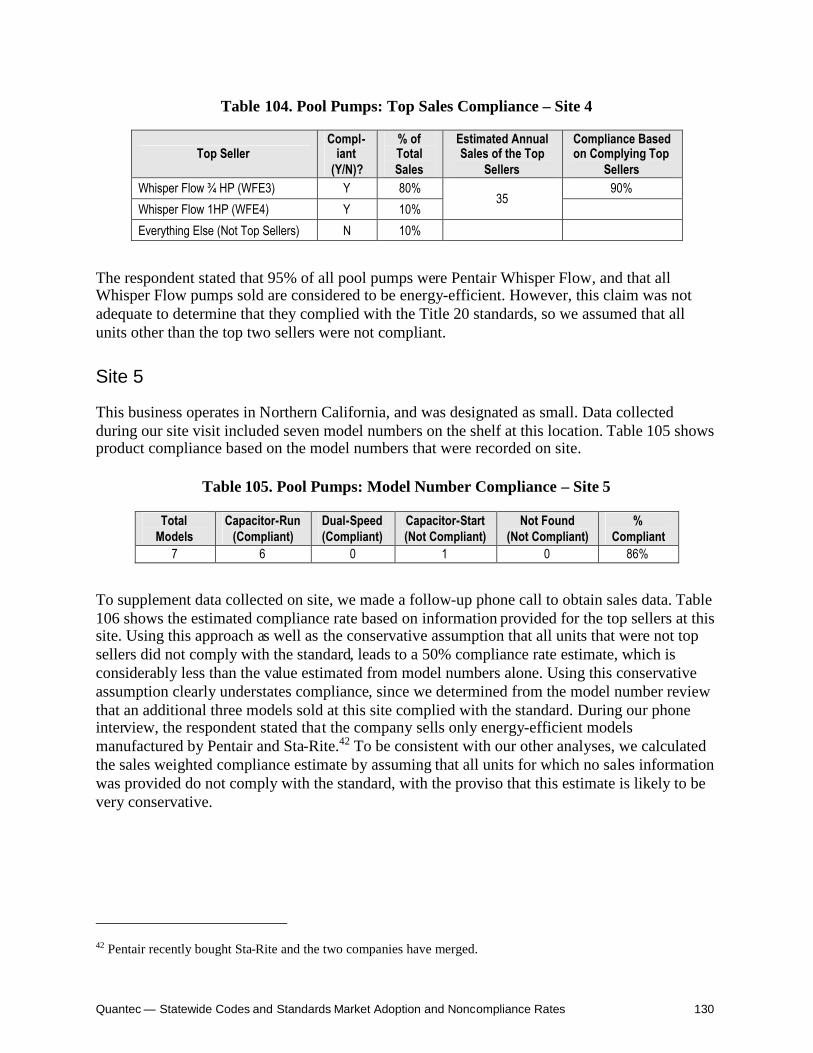
Quantec — Statewide Codes and Standards Market Adoption and Noncompliance Rates 130
Table 104. Pool Pumps: Top Sales Compliance – Site 4
Top SellerCompl-
iant(Y/N)?
% ofTotalSales
Estimated AnnualSales of the Top
Sellers
Compliance Basedon Complying Top
SellersWhisper Flow ¾ HP (WFE3) Y 80% 90%
Whisper Flow 1HP (WFE4) Y 10%35
Everything Else (Not Top Sellers) N 10%
The respondent stated that 95% of all pool pumps were Pentair Whisper Flow, and that allWhisper Flow pumps sold are considered to be energy-efficient. However, this claim was notadequate to determine that they complied with the Title 20 standards, so we assumed that allunits other than the top two sellers were not compliant.
Site 5
This business operates in Northern California, and was designated as small. Data collectedduring our site visit included seven model numbers on the shelf at this location. Table 105 showsproduct compliance based on the model numbers that were recorded on site.
Table 105. Pool Pumps: Model Number Compliance – Site 5
TotalModels
Capacitor-Run(Compliant)
Dual-Speed(Compliant)
Capacitor-Start(Not Compliant)
Not Found(Not Compliant)
%Compliant
7 6 0 1 0 86%
To supplement data collected on site, we made a follow-up phone call to obtain sales data. Table106 shows the estimated compliance rate based on information provided for the top sellers at thissite. Using this approach as well as the conservative assumption that all units that were not topsellers did not comply with the standard, leads to a 50% compliance rate estimate, which isconsiderably less than the value estimated from model numbers alone. Using this conservativeassumption clearly understates compliance, since we determined from the model number reviewthat an additional three models sold at this site complied with the standard. During our phoneinterview, the respondent stated that the company sells only energy-efficient modelsmanufactured by Pentair and Sta-Rite.42 To be consistent with our other analyses, we calculatedthe sales weighted compliance estimate by assuming that all units for which no sales informationwas provided do not comply with the standard, with the proviso that this estimate is likely to bevery conservative.
42 Pentair recently bought Sta-Rite and the two companies have merged.

Quantec — Statewide Codes and Standards Market Adoption and Noncompliance Rates 131
Table 106. Pool Pumps: Top Sales Compliance – Site 5
Top SellerCompl-
iant(Y/N)?
% ofTotalSales
Estimated AnnualSales of the Top
Sellers
Compliance Basedon Complying Top
SellersWhisper Flow ¾ HP (WFE3) Y 20%
MaxPro ¾ HP (Sta-Rite) Y 15%
Whisper Flow ½ HP (WFE2) Y 15%
45 50%
Everything Else (Not Top Sellers) N 50%
Site 6
This company operates in Northern California, and was designated as small under ourclassification system. Data collected during site visits included 74 model numbers on the shelf.Table 107 shows product compliance based on the model numbers that were recorded on site.
Table 107. Pool Pumps: Model Number Compliance – Site 6
TotalModels
Capacitor-Run(Compliant)
Dual-Speed(Compliant)
Capacitor-Start(Not Compliant)
Not Found(Not Compliant)
%Compliant
74 35 12 19 8 64%
Since sales data were not gathered during the site visit, a follow-up call was performed to obtainsales information for the top sellers. Table 106 shows the compliance rate estimate based onthese data.
Table 108. Pool Pumps: Top Sales Compliance – Site 5
Top SellerCompl-
iant(Y/N)?
% ofTotalSales
Estimated AnnualSales of the Top
Sellers
Compliance Basedon Complying Top
SellersWhisper Flow ¾ HP (WFE3) Y 90% - 90%
Everything Else (Not Top Sellers) N 10%
The respondent did not know the annual units sold of any model, but he did state that PentairWhisper Flow pumps account for 95% of their pool pumps sold. They are phasing out older Sta-Rite pumps for the newer Pentair Whisper Flow pumps (as noted earlier these two companieshave merged). According to the respondent, motors from older pump models are being replacedwith more energy-efficient motors. He stated that roughly 40% of the models will be replacedwith more energy-efficient motors. This is consistent with our site visit data, which showed that36% of the pool pump models found at this site did not comply with the new standards.
Sites 7 and 8
This company operates throughout California and was designated as a large business. Twolocations were visited in our site survey; one in southern and one in northern California. Data
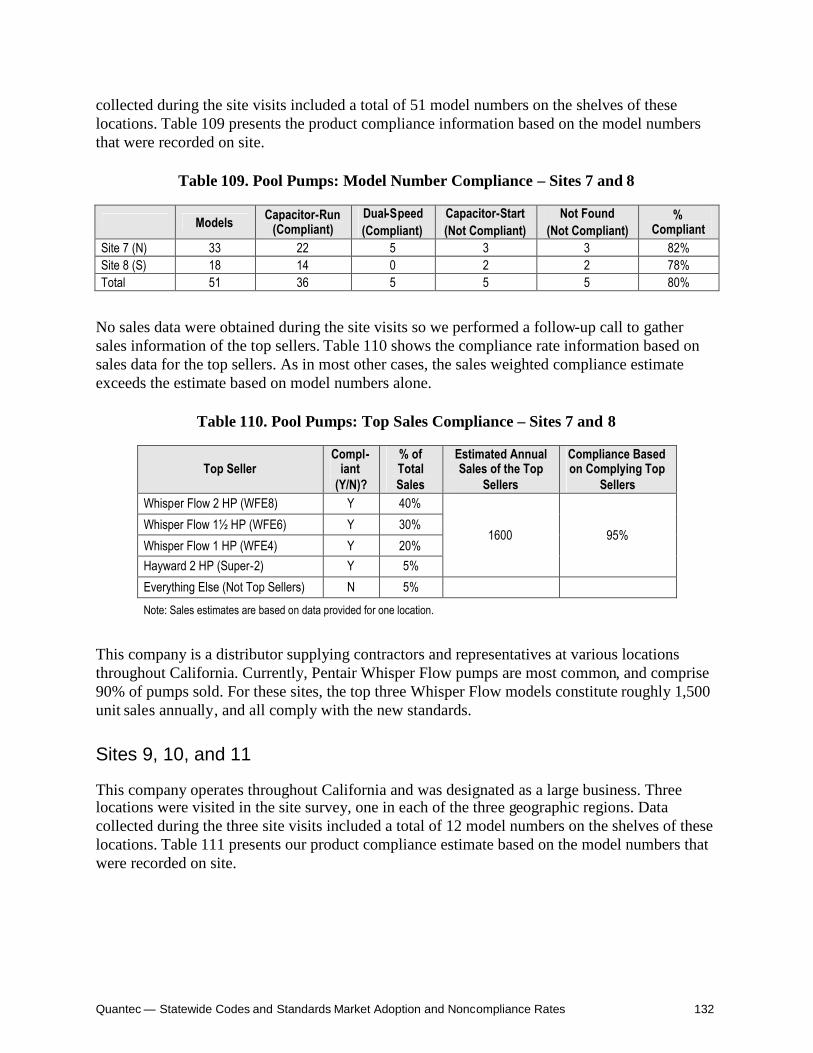
Quantec — Statewide Codes and Standards Market Adoption and Noncompliance Rates 132
collected during the site visits included a total of 51 model numbers on the shelves of theselocations. Table 109 presents the product compliance information based on the model numbersthat were recorded on site.
Table 109. Pool Pumps: Model Number Compliance – Sites 7 and 8
Models Capacitor-Run(Compliant)
Dual-Speed(Compliant)
Capacitor-Start(Not Compliant)
Not Found(Not Compliant)
%Compliant
Site 7 (N) 33 22 5 3 3 82%Site 8 (S) 18 14 0 2 2 78%Total 51 36 5 5 5 80%
No sales data were obtained during the site visits so we performed a follow-up call to gathersales information of the top sellers. Table 110 shows the compliance rate information based onsales data for the top sellers. As in most other cases, the sales weighted compliance estimateexceeds the estimate based on model numbers alone.
Table 110. Pool Pumps: Top Sales Compliance – Sites 7 and 8
Top SellerCompl-
iant(Y/N)?
% ofTotalSales
Estimated AnnualSales of the Top
Sellers
Compliance Basedon Complying Top
SellersWhisper Flow 2 HP (WFE8) Y 40%
Whisper Flow 1½ HP (WFE6) Y 30%
Whisper Flow 1 HP (WFE4) Y 20%Hayward 2 HP (Super-2) Y 5%
1600 95%
Everything Else (Not Top Sellers) N 5%
Note: Sales estimates are based on data provided for one location.
This company is a distributor supplying contractors and representatives at various locationsthroughout California. Currently, Pentair Whisper Flow pumps are most common, and comprise90% of pumps sold. For these sites, the top three Whisper Flow models constitute roughly 1,500unit sales annually, and all comply with the new standards.
Sites 9, 10, and 11
This company operates throughout California and was designated as a large business. Threelocations were visited in the site survey, one in each of the three geographic regions. Datacollected during the three site visits included a total of 12 model numbers on the shelves of theselocations. Table 111 presents our product compliance estimate based on the model numbers thatwere recorded on site.

Quantec — Statewide Codes and Standards Market Adoption and Noncompliance Rates 133
Table 111. Pool Pumps: Model Number Compliance – Sites 9, 10, 11
Models Capacitor-Run(Compliant)
Dual-Speed(Compliant)
Capacitor-Start(Not Compliant)
Not Found(Not Compliant)
%Compliant
Site 9 (N) 4 4 0 0 0 100%Site 10 (C) 4 4 0 0 0 100%Site 11 (S) 4 3 0 0 1 75%
Total 12 11 0 0 1 92%
We supplemented our site visit data by conducting a phone interview to obtain sales informationfor the top sellers. The respondent was able to provide sales shares for only one of the sites, andcould provide no total sales volumes. We used this information to estimate compliance shown inTable 112. The respondent stated that units in the Hayward RS series were the best sellers and allHayward RS pumps have energy-efficient motors. However, we were unable to find informationon the smallest (1/2 horsepower) model and, to be conservative, assumed that it did not comply.
Table 112. Pool Pumps: Top Sales Compliance – Sites 9, 10, 11
Top SellerCompl-
iant(Y/N)
% ofTotalSales
Estimated AnnualSales of the Top
Sellers
Compliance Basedon Complying Top
SellersHayward ¾ HP (RS 750) Y 45%
Hayward 1 HP (RS 1000) Y 23%
Hayward 2 HP (RS 2000) Y 11%
Hayward ½ HP (RS 500) N 11%
75 79%
Everything Else (Not Top Sellers) N 10%
Note: The sales information was only available at one location.
This particular company plans to switch motor manufacturers for their pool pumps. According tothe respondent, the current motor is considered to be energy efficient, but another company’smotors provide even better efficiency overall.
General Service Incandescent Lamps
General service incandescent lamp data collection and results are presented for each site below.
Site 1
This retail company is located within central California, and was designated as a small businessunder our previously defined classification system. Data collected during site visits included nineunique model numbers available from this location. Of these model numbers, it was found thatseven were compliant under the Frost/Clear or Soft White standard, one was not required to meetthe standard, and none were unidentified. Table 113 shows product compliance based on themodel numbers that were recorded on site; note that the percent compliance value does notinclude the excluded or unidentified products.

Quantec — Statewide Codes and Standards Market Adoption and Noncompliance Rates 134
Table 113. General Service Incandescent: Model Number Compliance – Site 1
Total UniqueModels Compliant Not Compliant Excluded Unidentified %
Compliant9 7 1 1 0 88%
An inventory count was not performed at this location. When we made follow-up calls in aneffort to supplement the data we originally collected, the contact was unwilling to provide aninventory count. However, this contact was able to estimate the company’s annual lamp sales atapproximately 10,000 lamps/year, and identified three particular wattages, 60, 75, and 40 asbeing the most popular. There were some inconsistencies between information provided byphone and from our site visit that cast some doubt upon the accuracy of the data that wereprovided by phone.
Site 2
This retail company is located within central California, and was designated as a small business.Data collected during site visits included 92 unique model numbers in stock at this location. Ofthese model numbers, it was found that 43 were compliant under the Frost/Clear or Soft Whitestandard, none were excluded from the standard, and none were unidentified. Table 114 showsproduct compliance based on the model numbers that were recorded on site; as before, thecompliance percent does not include the excluded or unidentified products.
Table 114. General Service Incandescent: Model Number Compliance – Site 2
Total UniqueModels Compliant Not Compliant Excluded Unidentified %
Compliant92 43 49 0 0 47%
An inventory count was not performed at this location. When follow-up calls were made tosupplement the site data, the contact was unwilling to provide an inventory count. However, thiscontact was able to estimate the company’s annual lamp sales at approximately 66,000lamps/year based on monthly estimates, and identified the 60 Watt lamps as the most popular.From the list of models that had been provided, 19 were found to be 60 Watts. Of these onlythree were compliant; therefore, of the top selling lamps, a very conservative estimate ofcompliance would be 16%.
Site 3
This retail company is located within central California, and was designated as large under ourclassification system. Data collected during site visits included 22 unique model numbers instock. Of these model numbers, it was found that nine were compliant under the Frost/Clear orSoft White standard, none were excluded from the standard, and seven were unidentified. Table115 shows product compliance based on the model numbers that were recorded on site. Thecompliance value does not include the excluded or unidentified products.

Quantec — Statewide Codes and Standards Market Adoption and Noncompliance Rates 135
Table 115. General Service Incandescent: Model Number Compliance – Site 3
Total UniqueModels Compliant Not Compliant Excluded Unidentified %
Compliant22 9 6 0 7 60%
While sales data were not provided during the initial site visit, a full inventory count wasperformed as shown in Table 116. Note that the compliance rate does not include excluded orunidentified products.
Table 116. General Service Incandescent: Inventory Compliance – Site 3
Total Inventory Compliant Not Compliant Excluded Unidentified %Compliant
1,308 568 367 0 373 61%
When a follow up call was made to obtain sales information, the original contact was unavailableand the call was transferred to multiple people who were unable to provide the appropriateinformation.
Site 4
This retail company is located in northern California, and was designated as a large businessunder our classification system. Data collected during site visits included 29 unique modelnumbers in stock at this location. Of these model numbers, we found that 17 were compliantunder the Frost/Clear or Soft White standard, none were excluded from the standard, and eightwere unidentified. Table 117 shows product compliance based on the model numbers that wererecorded on site.
Table 117. General Service Incandescent: Model Number Compliance – Site 4
Total UniqueModels Compliant Not Compliant Excluded Unidentified %
Compliant29 17 4 0 8 81%
Though sales data were not provided during the site visit, a full inventory count was performedas shown in Table 118. The compliance rate was calculated based on the inventory data.
Table 118. General Service Incandescent: Inventory Compliance – Site 4
Total Inventory Compliant Not Compliant Excluded Unidentified %Compliant
1,357 842 213 0 302 80%
When a follow up call was made to try to obtain sales information, the original contact was

Quantec — Statewide Codes and Standards Market Adoption and Noncompliance Rates 136
unable to estimate monthly or annual sales or even identify a top selling lamp. When the contactwas asked for a referral to the sales department or to someone who would have knowledge of thecompany’s sales, the contact stated that no one at the store could provide such information.
Site 5
This retail company is located Southern California, and was designated as a large business. Datacollected during site visits included 20 unique model numbers in stock. Of these model numbers,it was found that 10 were compliant under the Frost/Clear or Soft White standard, eight wereexcluded from the standard, and one was unidentified. Table 119 shows product compliance of91% based on the model numbers that were recorded on site.
Table 119. General Service Incandescent: Model Number Compliance – Site 5
Total UniqueModels Compliant Not Compliant Excluded Unidentified %
Compliant20 10 1 8 1 91%
Sales data were not provided during the site visit, but we conducted a full inventory countproviding the data shown in was performed as shown in Table 120. Using these values, thecompliance rate was estimated at 96%.
Table 120. General Service Incandescent: Inventory Compliance – Site 5
Total Inventory Compliant Not Compliant Excluded Unidentified %Compliant
1,146 520 22 537 67 96%
A follow-up call was not made to this location to try to obtain sales data since calls made to otherbranches of the same company had not resulted in any additional data. Attempts were made toreach knowledgeable staff within the corporate office of this company, but the automated phonesystem did not permit our call to be transferred to the appropriate department or person.
Site 6
This retail company is located in Southern California, and was designated as a large business.Data collected during site visits included 30 unique model numbers in stock at this location. Ofthese model numbers, it was found that 10 were compliant under the Frost/Clear or Soft Whitestandard, 12 were excluded from the standard, and five were unidentified. Table 121 showsproduct compliance based on the model numbers that were recorded on site.

Quantec — Statewide Codes and Standards Market Adoption and Noncompliance Rates 137
Table 121. General Service Incandescent: Model Number Compliance – Site 6
Total UniqueModels Compliant Not Compliant Excluded Unidentified %
Compliant30 10 3 12 5 77%
Sales data were not provided during the site visit, but a full inventory count was performed asshown in Table 122, giving a slightly higher compliance rate. We were unable to obtain any salesinformation through a follow-up call.
Table 122. General Service Incandescent: Inventory Compliance – Site 6
Total Inventory Compliant Not Compliant Excluded Unidentified %Compliant
2,076 687 127 590 672 84%
Site 7
This retail company is located in Southern California, and was designated as small. Datacollected during site visits included five unique model numbers in stock at this location. Of thesemodel numbers, it was found that one was compliant under the Frost/Clear or Soft Whitestandard, none were excluded from the standard, and none were unidentified. Table 123 showsthe product compliance based on the model numbers that were recorded on site.
Table 123. General Service Incandescent: Model Number Compliance – Site 7
Total UniqueModels Compliant Not Compliant Excluded Unidentified %
Compliant5 1 4 0 0 20%
Sales data were not provided during the site visit, but a full inventory count was performed asshown in Table 124. Using the inventory information, the estimated compliance rate wasconsiderably higher than the model number data alone suggested.
Table 124. General Service Incandescent: Inventory Compliance – Site 7
Total Inventory Compliant Not Compliant Excluded Unidentified %Compliant
1,879 1,300 579 0 0 69%
When a follow up call was made to obtain sales information, the original contact was able toestimate sales at approximately 1,000 lamps/month or 12,000 lamps/year. Additionally, thecontact stated that the 60 Watt lamp, which was also the only lamp found to be in compliance,was the top selling product, which was consistent with the inventory data.
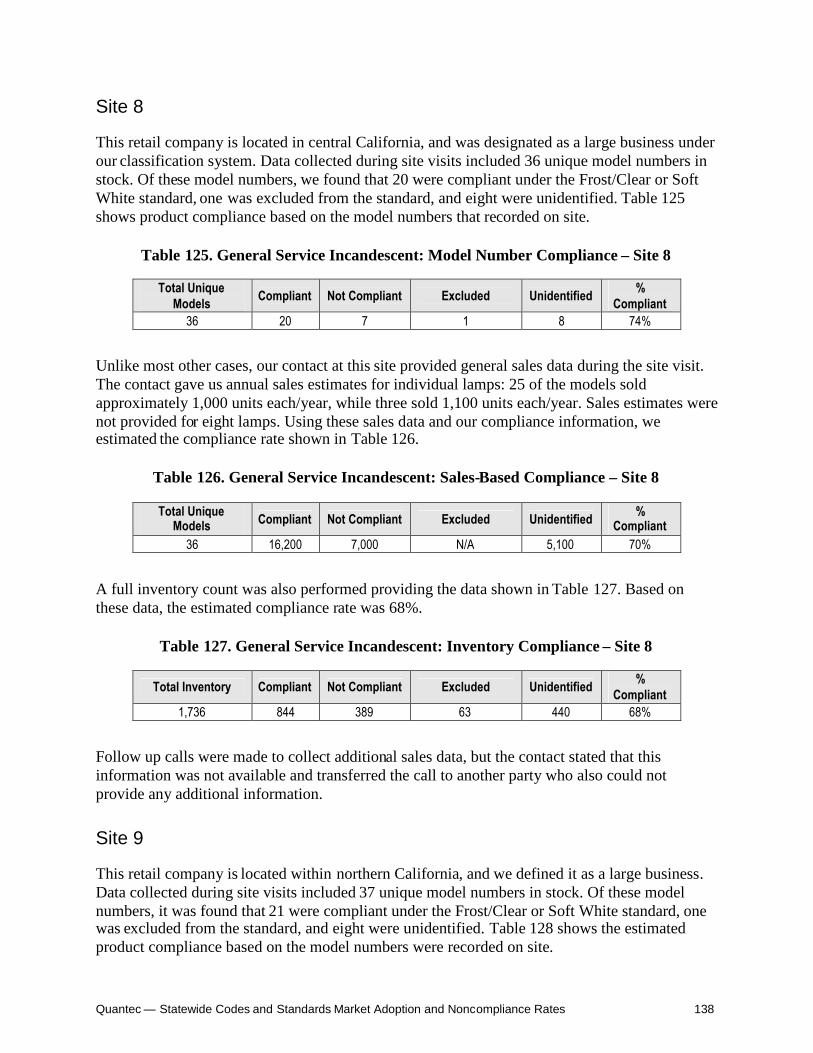
Quantec — Statewide Codes and Standards Market Adoption and Noncompliance Rates 138
Site 8
This retail company is located in central California, and was designated as a large business underour classification system. Data collected during site visits included 36 unique model numbers instock. Of these model numbers, we found that 20 were compliant under the Frost/Clear or SoftWhite standard, one was excluded from the standard, and eight were unidentified. Table 125shows product compliance based on the model numbers that recorded on site.
Table 125. General Service Incandescent: Model Number Compliance – Site 8
Total UniqueModels Compliant Not Compliant Excluded Unidentified %
Compliant36 20 7 1 8 74%
Unlike most other cases, our contact at this site provided general sales data during the site visit.The contact gave us annual sales estimates for individual lamps: 25 of the models soldapproximately 1,000 units each/year, while three sold 1,100 units each/year. Sales estimates werenot provided for eight lamps. Using these sales data and our compliance information, weestimated the compliance rate shown in Table 126.
Table 126. General Service Incandescent: Sales-Based Compliance – Site 8
Total UniqueModels Compliant Not Compliant Excluded Unidentified %
Compliant36 16,200 7,000 N/A 5,100 70%
A full inventory count was also performed providing the data shown in Table 127. Based onthese data, the estimated compliance rate was 68%.
Table 127. General Service Incandescent: Inventory Compliance – Site 8
Total Inventory Compliant Not Compliant Excluded Unidentified %Compliant
1,736 844 389 63 440 68%
Follow up calls were made to collect additional sales data, but the contact stated that thisinformation was not available and transferred the call to another party who also could notprovide any additional information.
Site 9
This retail company is located within northern California, and we defined it as a large business.Data collected during site visits included 37 unique model numbers in stock. Of these modelnumbers, it was found that 21 were compliant under the Frost/Clear or Soft White standard, onewas excluded from the standard, and eight were unidentified. Table 128 shows the estimatedproduct compliance based on the model numbers were recorded on site.
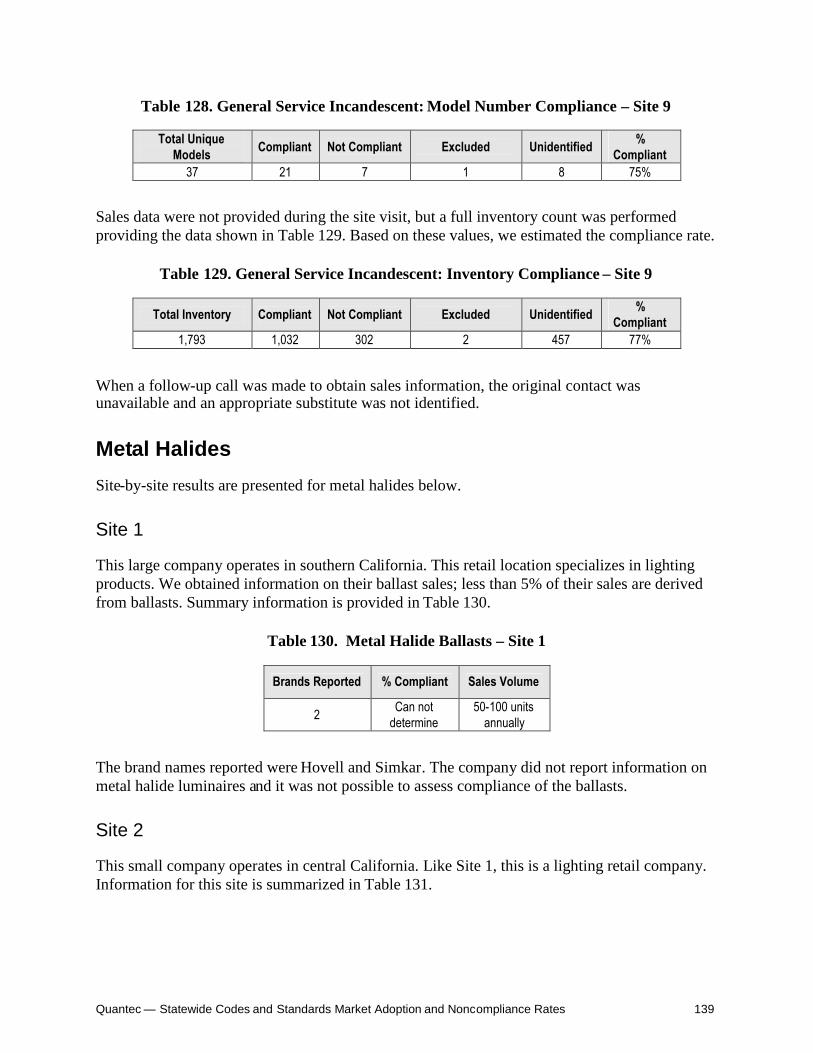
Quantec — Statewide Codes and Standards Market Adoption and Noncompliance Rates 139
Table 128. General Service Incandescent: Model Number Compliance – Site 9
Total UniqueModels Compliant Not Compliant Excluded Unidentified %
Compliant37 21 7 1 8 75%
Sales data were not provided during the site visit, but a full inventory count was performedproviding the data shown in Table 129. Based on these values, we estimated the compliance rate.
Table 129. General Service Incandescent: Inventory Compliance – Site 9
Total Inventory Compliant Not Compliant Excluded Unidentified %Compliant
1,793 1,032 302 2 457 77%
When a follow-up call was made to obtain sales information, the original contact wasunavailable and an appropriate substitute was not identified.
Metal Halides
Site-by-site results are presented for metal halides below.
Site 1
This large company operates in southern California. This retail location specializes in lightingproducts. We obtained information on their ballast sales; less than 5% of their sales are derivedfrom ballasts. Summary information is provided in Table 130.
Table 130. Metal Halide Ballasts – Site 1
Brands Reported % Compliant Sales Volume
2 Can notdetermine
50-100 unitsannually
The brand names reported were Hovell and Simkar. The company did not report information onmetal halide luminaires and it was not possible to assess compliance of the ballasts.
Site 2
This small company operates in central California. Like Site 1, this is a lighting retail company.Information for this site is summarized in Table 131.
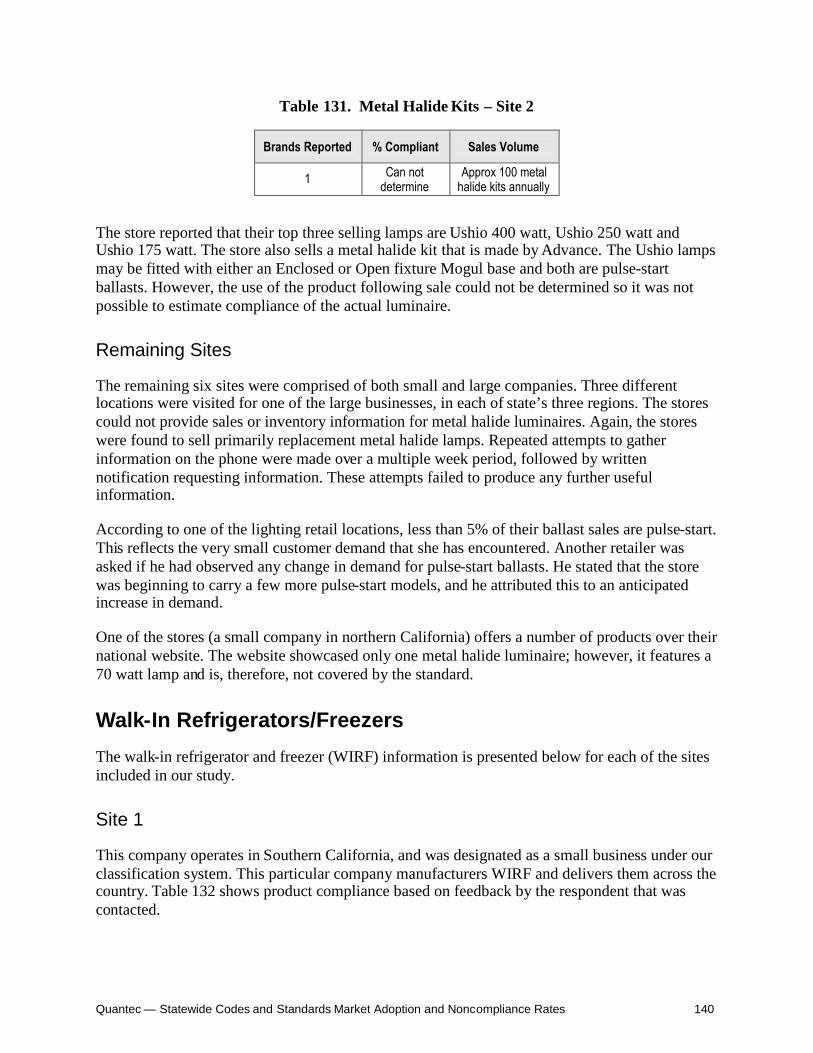
Quantec — Statewide Codes and Standards Market Adoption and Noncompliance Rates 140
Table 131. Metal Halide Kits – Site 2
Brands Reported % Compliant Sales Volume
1 Can notdetermine
Approx 100 metalhalide kits annually
The store reported that their top three selling lamps are Ushio 400 watt, Ushio 250 watt andUshio 175 watt. The store also sells a metal halide kit that is made by Advance. The Ushio lampsmay be fitted with either an Enclosed or Open fixture Mogul base and both are pulse-startballasts. However, the use of the product following sale could not be determined so it was notpossible to estimate compliance of the actual luminaire.
Remaining Sites
The remaining six sites were comprised of both small and large companies. Three differentlocations were visited for one of the large businesses, in each of state’s three regions. The storescould not provide sales or inventory information for metal halide luminaires. Again, the storeswere found to sell primarily replacement metal halide lamps. Repeated attempts to gatherinformation on the phone were made over a multiple week period, followed by writtennotification requesting information. These attempts failed to produce any further usefulinformation.
According to one of the lighting retail locations, less than 5% of their ballast sales are pulse-start.This reflects the very small customer demand that she has encountered. Another retailer wasasked if he had observed any change in demand for pulse-start ballasts. He stated that the storewas beginning to carry a few more pulse-start models, and he attributed this to an anticipatedincrease in demand.
One of the stores (a small company in northern California) offers a number of products over theirnational website. The website showcased only one metal halide luminaire; however, it features a70 watt lamp and is, therefore, not covered by the standard.
Walk-In Refrigerators/Freezers
The walk-in refrigerator and freezer (WIRF) information is presented below for each of the sitesincluded in our study.
Site 1
This company operates in Southern California, and was designated as a small business under ourclassification system. This particular company manufacturers WIRF and delivers them across thecountry. Table 132 shows product compliance based on feedback by the respondent that wascontacted.

Quantec — Statewide Codes and Standards Market Adoption and Noncompliance Rates 141
Table 132. WIRF Sales and Compliance Based on Feedback – Site 1
Stratum Region Estimated AnnualSales1
Compliance Basedon Feedback
Small Southern - 100%1Annual sales could be not confirmed when the follow-up call occurred. At the initial contact the respondent
stated that 250 to 300 units were sold a year to California customers. During the second call, however, thesame respondent could not provide an estimate. Consequently, we do not report sales.
The manufacturer stated that all their WIRF are compliant with the new standards and are allcustom orders. According to the respondent, the envelope insulation values, auto-doors, andmotors all meet the 2006 standard. They sell to dealers, distributors, and customers throughoutthe country and all products sold in California meet the standard. However, it is worth noting thatthe respondent stated that units sold outside of California may or may not meet the Title 20standards.
Site 2
This company is headquartered in Wisconsin but distributes directly to southern California, andwas designated as small under our classification system. This particular company is amanufacturer of the insulation for WIRF. They deliver products across the country. Table 133shows product compliance based on feedback from the respondent contacted.
Table 133. WIRF Sales and Compliance Based on Feedback – Site 2
Stratum Region Estimated AnnualSales
Compliance Basedon Feedback
Small Southern 24 -
Unfortunately, the respondent was unable to answer if the products sent to California complywith Title 20 standards. Feedback was limited since insulation for WIRF was their primaryproduct.
Site 3
This company operates in Central California, and was classified as small. This particularcompany is a wholesaler of WIRF and delivers them across the state. Table 134 shows productcompliance information based on feedback from the respondent.
Table 134. WIRF Sales and Compliance Based on Feedback – Site 3
Sales by RegionStratum RegionNorth Central South
Estimated AnnualSales
Compliance Basedon Feedback
Small Central 1/3 1/3 1/3 20 100%
In some cases this site purchases bulk walk-in components and custom builds the units. Based onthe feedback, all custom units meet the new Title 20 standards. According to the respondent,
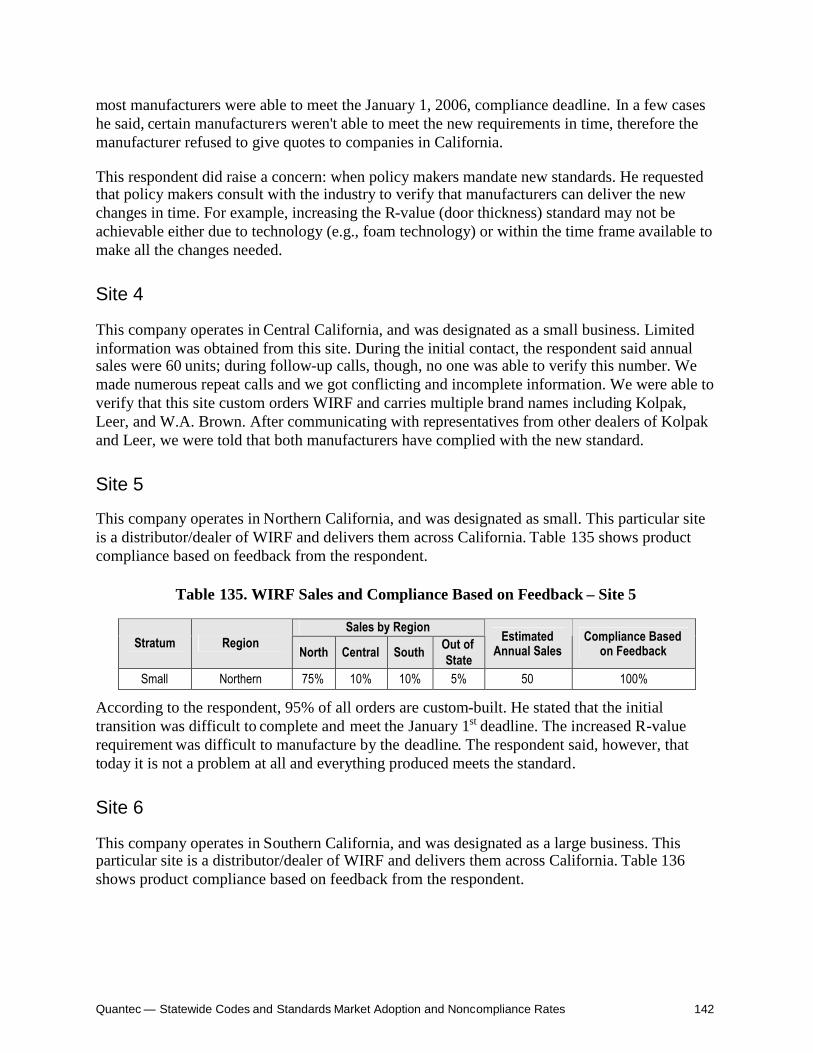
Quantec — Statewide Codes and Standards Market Adoption and Noncompliance Rates 142
most manufacturers were able to meet the January 1, 2006, compliance deadline. In a few caseshe said, certain manufacturers weren't able to meet the new requirements in time, therefore themanufacturer refused to give quotes to companies in California.
This respondent did raise a concern: when policy makers mandate new standards. He requestedthat policy makers consult with the industry to verify that manufacturers can deliver the newchanges in time. For example, increasing the R-value (door thickness) standard may not beachievable either due to technology (e.g., foam technology) or within the time frame available tomake all the changes needed.
Site 4
This company operates in Central California, and was designated as a small business. Limitedinformation was obtained from this site. During the initial contact, the respondent said annualsales were 60 units; during follow-up calls, though, no one was able to verify this number. Wemade numerous repeat calls and we got conflicting and incomplete information. We were able toverify that this site custom orders WIRF and carries multiple brand names including Kolpak,Leer, and W.A. Brown. After communicating with representatives from other dealers of Kolpakand Leer, we were told that both manufacturers have complied with the new standard.
Site 5
This company operates in Northern California, and was designated as small. This particular siteis a distributor/dealer of WIRF and delivers them across California. Table 135 shows productcompliance based on feedback from the respondent.
Table 135. WIRF Sales and Compliance Based on Feedback – Site 5
Sales by RegionStratum Region
North Central South Out ofState
EstimatedAnnual Sales
Compliance Basedon Feedback
Small Northern 75% 10% 10% 5% 50 100%
According to the respondent, 95% of all orders are custom-built. He stated that the initialtransition was difficult to complete and meet the January 1st deadline. The increased R-valuerequirement was difficult to manufacture by the deadline. The respondent said, however, thattoday it is not a problem at all and everything produced meets the standard.
Site 6
This company operates in Southern California, and was designated as a large business. Thisparticular site is a distributor/dealer of WIRF and delivers them across California. Table 136shows product compliance based on feedback from the respondent.

Quantec — Statewide Codes and Standards Market Adoption and Noncompliance Rates 143
Table 136. WIRF Sales and Compliance Based on Feedback – Site 6
Stratum Region Estimated AnnualSales
Compliance Basedon Feedback
Large Southern 1 N/A
This representative could not provide definite information about compliance since their salesvolume was so small. The small volume for WIRF at this location is due to fact that the primarybusiness of this site is not walk-ins. When they do sell WIRF, the biggest sellers are semi-customorders in two sizes: 5’x7’ or 8’x6’. When the product is shipped it is in pieces and professionalinstallers put it together, creating a custom fit. According to the respondent, several months ago avendor representative visited the company and told them that all new models are more energyefficient. We had no information, however, about the characteristics of these models that wouldallow us to assess compliance.
Site 7
This company operates in Southern California, and was designated as large. This particular site isa distributor/dealer of WIRF. Table 137 shows product compliance based on respondentfeedback.
Table 137. WIRF Sales and Compliance Based on Feedback – Site 7
Sales by RegionStratum Region
North Central South Out ofState
EstimatedAnnual Sales
Compliance Basedon Feedback
Large (2) Southern 0% 0% 90% 10% 85 to 100 units 100%
The respondent at this site verified that all their WIRF meet the new Title 20 standard. This sitedistributes only Kolpak walk-in units. According to the respondent, the baseline design modelcomes standard meeting all requirements of the 2006 California standards and is sold as suchacross the country.
Site 8
This company operates in Central California, and was designated as a large business. Thisparticular site is a wholesalers of WIRF and other products. Table 138 shows productcompliance based on respondent feedback.
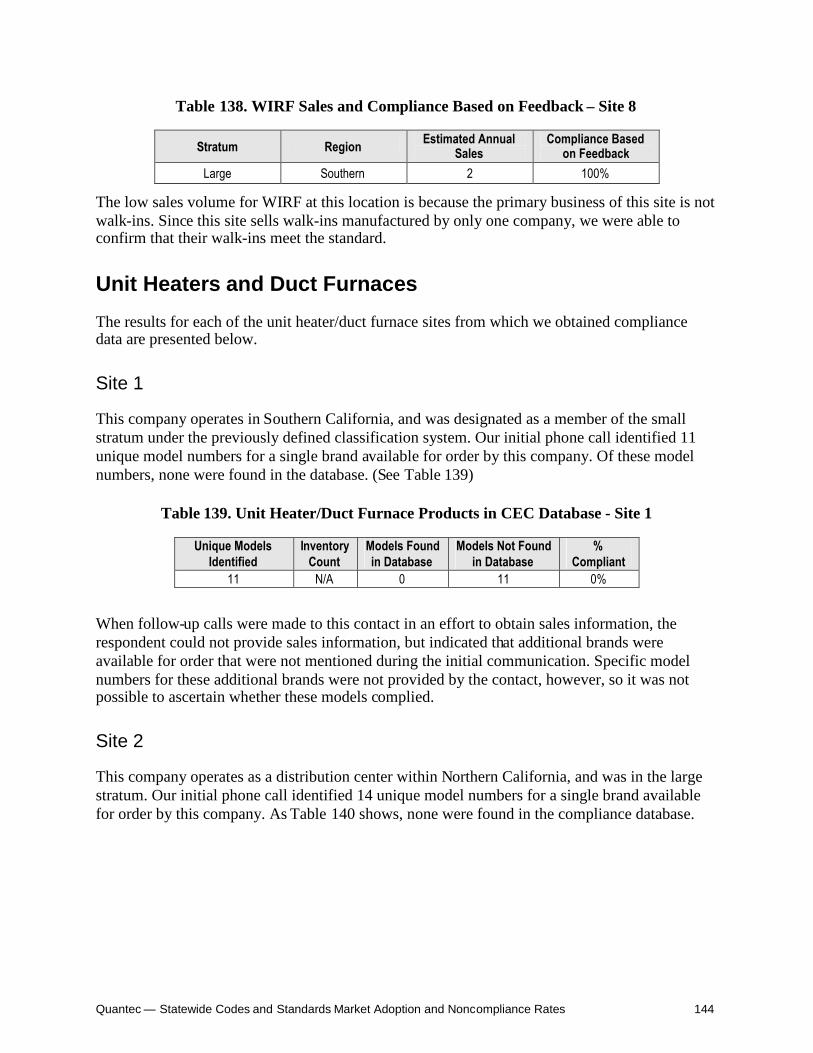
Quantec — Statewide Codes and Standards Market Adoption and Noncompliance Rates 144
Table 138. WIRF Sales and Compliance Based on Feedback – Site 8
Stratum Region Estimated AnnualSales
Compliance Basedon Feedback
Large Southern 2 100%
The low sales volume for WIRF at this location is because the primary business of this site is notwalk-ins. Since this site sells walk-ins manufactured by only one company, we were able toconfirm that their walk-ins meet the standard.
Unit Heaters and Duct Furnaces
The results for each of the unit heater/duct furnace sites from which we obtained compliancedata are presented below.
Site 1
This company operates in Southern California, and was designated as a member of the smallstratum under the previously defined classification system. Our initial phone call identified 11unique model numbers for a single brand available for order by this company. Of these modelnumbers, none were found in the database. (See Table 139)
Table 139. Unit Heater/Duct Furnace Products in CEC Database - Site 1
Unique ModelsIdentified
InventoryCount
Models Foundin Database
Models Not Foundin Database
%Compliant
11 N/A 0 11 0%
When follow-up calls were made to this contact in an effort to obtain sales information, therespondent could not provide sales information, but indicated that additional brands wereavailable for order that were not mentioned during the initial communication. Specific modelnumbers for these additional brands were not provided by the contact, however, so it was notpossible to ascertain whether these models complied.
Site 2
This company operates as a distribution center within Northern California, and was in the largestratum. Our initial phone call identified 14 unique model numbers for a single brand availablefor order by this company. As Table 140 shows, none were found in the compliance database.

Quantec — Statewide Codes and Standards Market Adoption and Noncompliance Rates 145
Table 140. Unit Heater/Duct Furnace Products in CEC Database - Site 2
Unique ModelsIdentified
InventoryCount
Models Foundin Database
Models Not Foundin Database
%Compliant
14 N/A 0 14 0%
We conducted a follow-up call to obtain sales data, but the respondent was unable to provide anysuch data or additional model numbers. The contact went further to say that annual salesinformation was not available because multiple sales people operated at the same location, noneof whom were aware how many others were selling.
Site 3
This company operates as a distribution center within Northern California, and was designated assmall under our classification system. Initial phone calls identified 191 unique model numbersfor a single brand available for order by this company. During the initial call to this contact, onemodel number was identified as a “top seller” at 1,000 units per year. This model number wasnot found in the compliance database.
When we conducted a follow-up call to get additional information this contact identified 14specific models and noted that unit heaters were their most popular selling item, withapproximately 600 of each sold each year. It appeared that the sales pattern had changedconsiderably from the first call. Interestingly, the previously identified best seller was notincluded in the resulting list of 14 unit heaters. Of these 14, 11 were found in the database, asshown in Table 141.
Table 141. Unit Heater/Duct Furnace Product Sales in CEC Database - Site 3 Follow-upInformation
Top ModelsIdentified
TopModels
Found inDatabase
ModelsNot
Found inDatabase
% inDatabase
Sales ofEach/Year
CompliantSales/Year
14 11 3 79% 600 6,600
Site 4
This company operates in Central California, and was designated as large under ourclassification system. Initial phone calls identified 52 unique model numbers of one brandavailable for order by this company. Of these model numbers, 39 were found in the database (seeTable 142).

Quantec — Statewide Codes and Standards Market Adoption and Noncompliance Rates 146
Table 142. Unit Heater/Duct Furnace Products in CEC Database - Site 4 InitialInformation
Unique ModelsIdentified
InventoryCount
Models Foundin Database
Models Not Foundin Database
%Compliant
52 N/A 39 13 75%
During the initial call to this contact, one model number series was identified as a “top seller” at350 units each per year. Of the 10 model numbers in this series, 50% were found in the databaseas shown in Table 143.
Table 143. Unit Heater/Duct Furnace Product Sales in CEC Database - Site 4
Top ModelsIdentified
Top ModelsFound inDatabase
Models NotFound inDatabase
% inDatabase
Sales ofEach/Year
CompliantSales/Year
10 5 5 50% 350 1,750
However, during the follow-up call this contact was unable to identify a top selling model andstated only that models rated at 100,000 Btu were the most popular. Additionally, it wasdiscovered that an additional brand was also sold by this company, but model numbers were notprovided by the contact. When we determined the four model numbers rated at 100,000 Btu allfour were found in the database, implying a compliance rate of close to 100%.
Site 5
This company operates as a distribution center within Southern California, and was designated tobe in the small stratum. Initial phone calls identified 68 unique model numbers from one brandavailable for order by this company. Of these model numbers, 45 were found in the compliancedatabase. In addition, an inventory list was provided by this company. The summary data areshown in Table 144.
Table 144. Unit Heater/Duct Furnace Products in CEC Database - Site 5
Unique ModelsIdentified
Models Foundin Database
Models Not inDatabase
% Models inDatabase
InventoryCount
% Compliant basedon Inventory
68 45 23 66% 361 64%
This contact was not able to provide any sales data, and would not identify any “top sellers”whether by model number, output rating, or any distinguishing feature.
Site 6
This company operates as a distribution center within Southern California, and was designated asa small business under our classification system. Initial phone calls identified 36 unique model

Quantec — Statewide Codes and Standards Market Adoption and Noncompliance Rates 147
numbers from one brand available for order by this company. Of these model numbers, we found26 in the database as seen in Table 145.
Table 145. Unit Heater/Duct Furnace Products in CEC Database - Site 6
Unique ModelsIdentified
InventoryCount
Models Foundin Database
Models Not Foundin Database
%Compliant
36 N/A 26 10 72%
Sales data were not collected during the initial call to this contact. When a follow-up call wasmade to the company it was discovered that the original contact had retired and that the territoryhad been reassigned to the same person used as a contact for Site 3. This contact was not able toprovide any sales data. He thought, however, that general sales patterns would be the same, withthe same series of model numbers being most popular as had been identified for Site 3, only withfewer units sold than the 600/year reported for the northern location. Twenty-two model numbersmatched this criterion, 12 of which were found in the database as displayed in Table 146.
Table 146. Unit Heater/Duct Furnace Product Sales in CEC Database - Site 6
TopModels
Identified
Top ModelsFound inDatabase
Models NotFound inDatabase
% CompliantSales
Sales ofEach/Year
CompliantSales/Year
22 12 10 55% <600 <7,200
Site 7
This company operates as a distribution center within Southern California, and was designated asa large business under our system. Initial phone calls identified 106 unique model numbers forone brand available for order by this company. Of these model numbers, 73 were found in thedatabase (see Table 147).
Table 147. Unit Heater/Duct Furnace Products in CEC Database - Site 7
Unique ModelsIdentified
InventoryCount
Models Foundin Database
Models Not Foundin Database
%Compliant
106 N/A 73 33 69%
During the initial call to this contact, sales data were provided for each of the model numberseries carried, with sales reported at either 200 or 350 per month. This additional informationmade it possible to calculate a compliance rate of 64% based on sales, which is comparable tothe rate that was calculated based on the unique models available for order. These results arepresented in Table 148.

Quantec — Statewide Codes and Standards Market Adoption and Noncompliance Rates 148
Table 148. Unit Heater/Duct Furnace Product Sales in CEC Database - Site 7
Total SalesVolume/Month
CompliantSales/Month
% CompliantSales
CompliantSales/Month x
12 months2,900 1,865 64% 22,380
Site 8
This company operates as a distribution center within Central California, and we designated it asa small business. Initial phone calls identified 18 unique model numbers for one brand availablefor order by this company. Of these model numbers, none were found in the database. Sales datawere not provided during the initial call. When a follow up call was made to obtain thisinformation, the same contact reported that the original brand identified was no longer carried bythis company. Instead, he said they now carried a different brand and, based on the six modelnumbers provided, none of these were found in the compliance database. This information issummarized in Table 149.
Table 149. Unit Heater/Duct Furnace Products in CEC Database - Site 8
Unique ModelsIdentified
InventoryCount
Models Foundin Database
Models Not Foundin Database
%Compliant
6 N/A 0 6 0%
In total, it was reported that approximately 600 units were sold each year, with two modelsidentified as top sellers. However, as mentioned previously none of the models were found in thecompliance database.
Site 9
This company operates as a distribution center within Northern California, and was designated asa large business under our system. Initial phone calls identified 135 unique model numbers ofone brand available for order by this company. Of these model numbers, three were found in thedatabase as shown in Table 150.
Table 150. Unit Heater/Duct Furnace Products in CEC Database - Site 9
Unique ModelsIdentified
InventoryCount
Models Foundin Database
Models Not Foundin Database
%Compliant
135 N/A 3 132 2%
Sales data were not collected during the initial call to this contact. Multiple follow-up calls weremade, but the contact was unavailable or did not return the calls. A corporate office wascontacted as well, but again no calls were returned.

Quantec — Statewide Codes and Standards Market Adoption and Noncompliance Rates 149
Refrigerated Beverage Vending Machines
Site-by-site results are presented below for vending machines.
Site 1
One of the sites visited was a small store located in Northern California. The store reported twodifferent brands of vending machines, and nine different model numbers. The majority of themodels were listed in the CEC database. Table 151 presents these data.
Table 151. Vending Machines: Products in CEC Database - Site 1
Unique ModelsIdentified
Models Foundin Database
Models Not Foundin Database
%Compliant
9 8 1 89%
It should be noted that a number of the model numbers provided were similar to the base modelnumbers of machines found in the CEC database, but lacked an alphabetical suffix. In thesecases, the model numbers were assumed to be the same. For example, DN600E was assumed tobe the same as DN600EDD; 621 was assumed to be the same as 621C. This assumption wasverified as a generally reliable approach by staff at the store in subsequent telephoneconversations.
Site 2
A large business in Southern California also reported 9 different models. The complianceinformation for this site is presented in Table 152.
Table 152. Vending Machines: Products in CEC Database – Site 2
Unique ModelsIdentified
Models Foundin Database
Models Not Foundin Database
%Compliant
9 4 5 44%
Site 2 was the only location to provide current stock information for their machines. The storehad 47 machines in stock at the time of the July 2006 site visit. The results are shown in Table153.

Quantec — Statewide Codes and Standards Market Adoption and Noncompliance Rates 150
Table 153. Vending Machines: Compliance Based on Inventory – Site 2
IndividualMachines in Stock
Units in CECDatabase % Compliant
47 30 64%
The store primarily carried two to five machines per model number, with one exception. For oneof the models in the CEC database, the store had 20 machines, which increased the estimate ofthe compliance rate significantly. Integrating the stock information then, had a positive impacton the compliance rate for this particular site
Site 3
A small business in Northern California reported only two different products for sale. Of these,one was listed in the CEC database (i.e., its model number was the same as the CEC databaseless an alphabetical suffix – more specifically, 501E was assumed to be equivalent to501ER).Table 154 presents this information.
Table 154. Vending Machines: Products in CEC Database - Site 3
Unique ModelsIdentified
Models Foundin Database
Models Not Foundin Database
%Compliant
2 1 1 50%
Site 4
At this large business site, three different beverage vending models were found. One of thesewas in the CEC database. The results for this business located in Northern California are shownin Table 155.
Table 155. Vending Machines: Products in CEC Database - Site 4
Unique ModelsIdentified
Models Foundin Database
Models Not Foundin Database
%Compliant
3 1 2 33%
Site 5
Another of the vending machine companies visited was a small business in Southern California.As shown in Table 156, none of the five models that they provided were found in the CECdatabase. They were also of a brand name that is not currently included in the CEC database. Noadditional data were provided about the machines in order to determine if they might meet thestandard.

Quantec — Statewide Codes and Standards Market Adoption and Noncompliance Rates 151
Table 156. Vending Machines: Products in CEC Database - Site 5
Unique ModelsIdentified
Models Foundin Database
Models Not Foundin Database
%Compliant
5 0 5 0%
Site 6
Three different models were found at this location, which was classified as a large companylocated in Northern California. None of the models were included in the CEC database as shownin Table 157. These models were manufactured by the same company as those found at Site 5.
Table 157. Vending Machines: Products in CEC Database - Site 6
Unique ModelsIdentified
Models Foundin Database
Models Not Foundin Database
%Compliant
3 0 3 0%


![Codes & Standards[1]](https://static.fdocuments.in/doc/165x107/577cd56b1a28ab9e789abbf6/codes-standards1.jpg)

