Coca cola 2
45
-
Upload
works-in-gcuf -
Category
Education
-
view
269 -
download
0
Transcript of Coca cola 2


HISTORY
Coca-Cola® originated as a soda fountain beverage in 1886 selling for five cents a glass. Early growth was impressive, but it was only when a strong bottling system developed that Coca-Cola became the world-famous brand it is today.
1894 – A modest start for a Bold Idea
1899 The first bottling agreemen
1900-1909 … Rapid growth
1920s and 30s … International expansion
1940s … Post-war growth
1950s … Packaging innovations
1970s and 80s … Consolidation to serve customers
1990s … New and growing markets

STANDING IN THE BUSINESS ENVIRONMENT
Ranking: We own 4 of the world's top 5 nonalcoholic sparkling beverage brands
Associates: 90,500 worldwide Operational Reach: 200 countries Consumer Servings (per day): 1.5 billion Beverage Variety: more than 2,800 products
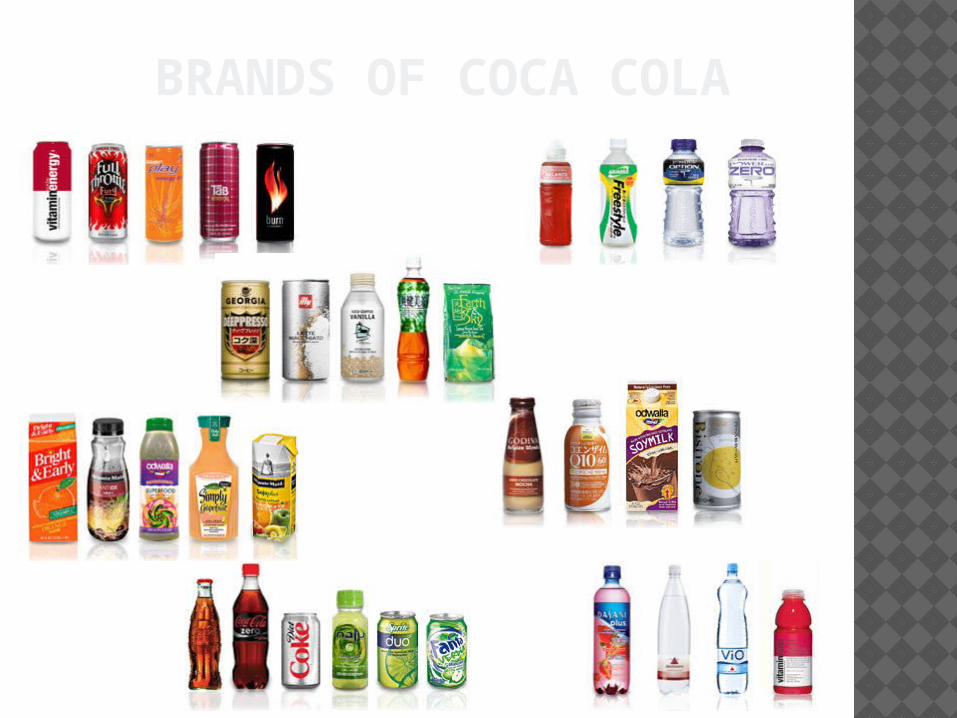
BRANDS OF COCA COLA
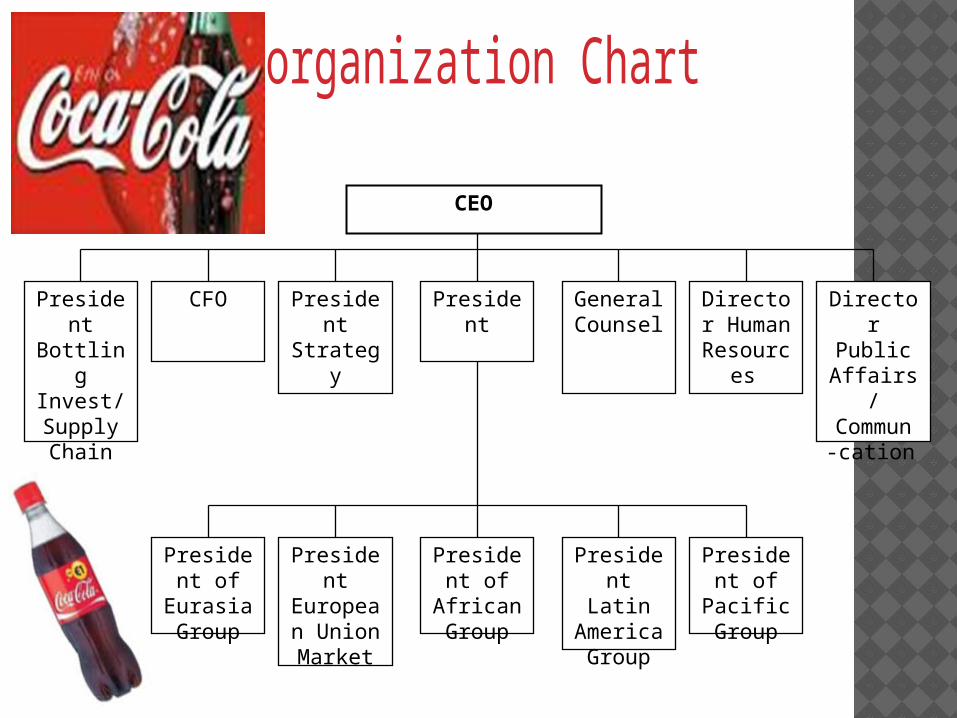
CEO
President Bottling Invest/ Supply Chain
CFO President Strategy
President General Counsel
Director Human
Resources
Director Public Affairs/
Commun -cation
President of
African Group
President European Union Market
President of
Eurasia Group
President Latin
America Group
President of Pacific
Group

MISSION
Cock mission declares our purpose as a company. It serves as the standard against which we weigh our actions and decisions.
To refresh the world in body, mind and spirit. To inspire moments of optimism through our
brands and our actions. To create value and make a difference
everywhere we engage
VISION
Our vision guides every aspect of our business by describing what we need to accomplish in order to continue achieving sustainable growth.

THE WAY OF SUCCESS
1- I believe in order to ensure the success of the product must test the market and this is through publicity of the product in all countries of the world .
2- Interest in product name . 3- Attention to the packaging .

SLOGANS
• 1963 “Things Go Better With Coke.”
• 1970 “It’s the Real Thing”
• 1975 “Look Up America”
• 1979 “Have a Coke and a Smile”
• 1982 “Coke Is It!”
• 1987 “You Can’t Beat the Real Thing”
• 1993 “Always Coca-Cola” 2013 open happiness

MARKET ANALYSIS

COCA COLAFinancial statementsSwot AnalysisIncome Statement Balance Sheet Liquidity RatiosProfitability Ratios Strength Ratios


COCA COLA SERVICES
Being a word favourite brand they understand customers & what thay want and continusly innovate them with new product and packaging and coke strive to deliver the best, most efficient service to their customer
Coca-Cola has customized its Facebook page to enable and empower users to post videos and win contest

PRODUCT & SERVICE DESCRIPTION The product/service section is one
of the most important parts of your business plan.
It's your chance to clearly explain you products/services, identify their features and benefits,
and discuss what needs or problems they address in the market.

CUSTOMER BENEFIT
values the health & well-being of our employees
provides a variety of market-competitive benefits programs to address employees' benefits needs. Our total benefits package is highly regarded
designed to meet employees' basic and life-changing benefits needs,and promote healthy lifestyles.

MARKET ANALYSIS
Important to consider:
Demographics: the global market Elasticity: the relative effect of changes in
price to demand Market trend: the decline of sales in
carbonated drinks(2009)
The rise of functional soft drinks juices & vitamin water(2003)
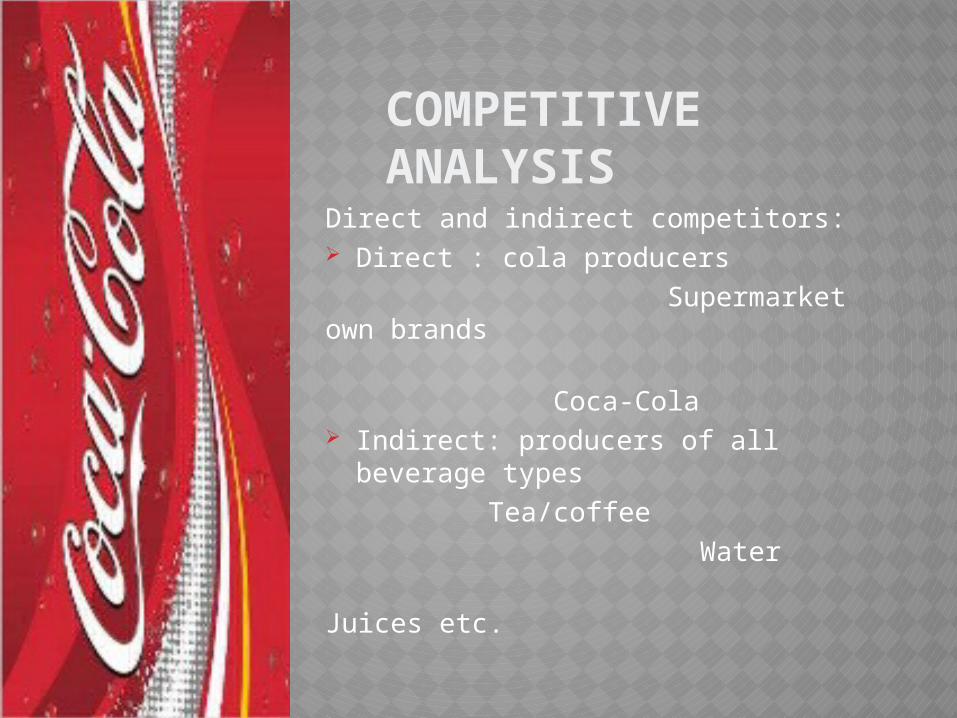
COMPETITIVE ANALYSIS
Direct and indirect competitors: Direct : cola producers
Supermarket own brands
Coca-Cola Indirect: producers of all beverage
types
Tea/coffee
Water
Juices etc.

TARGET MARKET
Coca-Cola takes every customers target and potential who is thirsty
All age groups are being targeted but the most potential is the age group from 18-25 that covers around 40% of total age

MARKET SIZE
Associates: 90,500 worldwide
Operational Reach: 200 countries
Consumer Servings (per day): 1.5 billion

ACTIVITY FOR CLASS

MARKETING TARGET AND STRATEGY1. Marketing strategy
2. Pricing strategy
3. Adverting strategy
4. Distribution strategy
5. Sale strategy
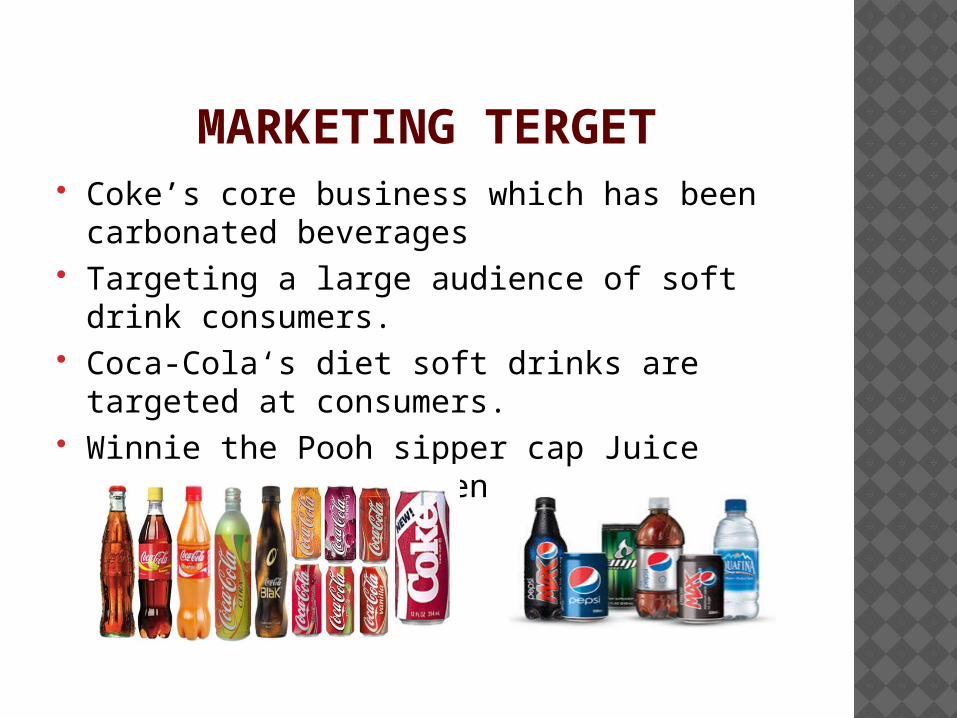
MARKETING TERGET Coke’s core business which has been carbonated
beverages Targeting a large audience of soft drink consumers. Coca-Cola‘s diet soft drinks are targeted at consumers. Winnie the Pooh sipper cap Juice Drink target children

MARKETING STRATEGY
The Coca-Cola Company uses marketing strategies to
differentiate its product from its competitors to gain a
competitive advantage.
To become the market leader in the functional drinks
segment with increased market shares.

PRICING STRATEGY
The Coca-Cola Company's products are sold in retail
stores, convenient stores, petrol stations etc.
The pricing strategies are set by those the company
sells.
Retail outlet uses pricing methods and pricing
strategies when selling Coca-Cola products.
Meet-the-competition pricing The Coca-Cola products
pricing are set around the same level as its competitors.
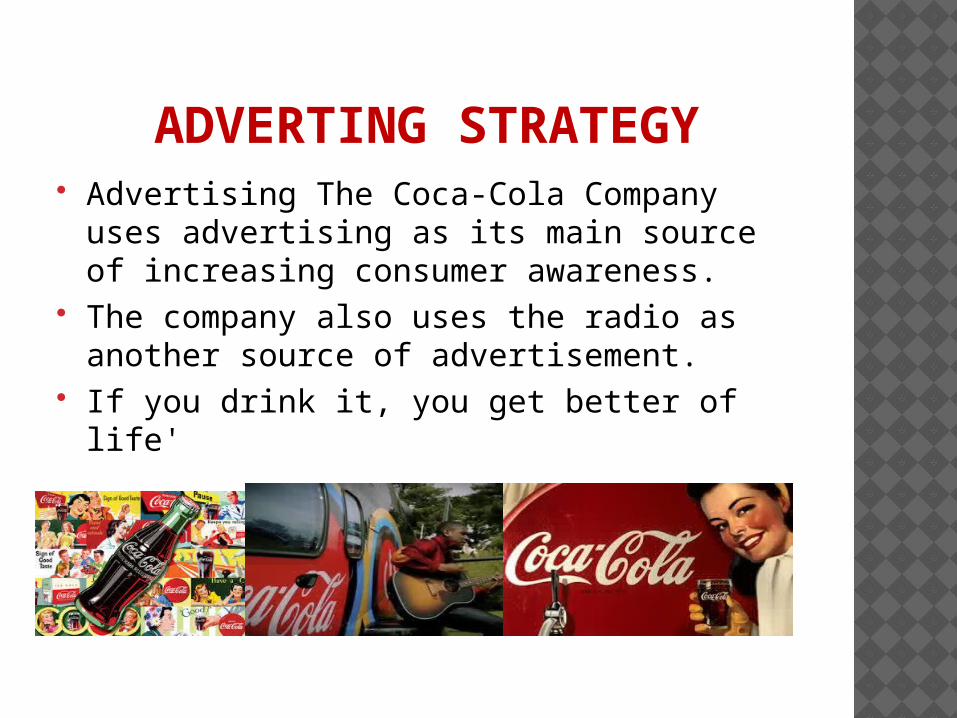
ADVERTING STRATEGY Advertising The Coca-Cola Company uses advertising
as its main source of increasing consumer awareness. The company also uses the radio as another source of
advertisement. If you drink it, you get better of life'
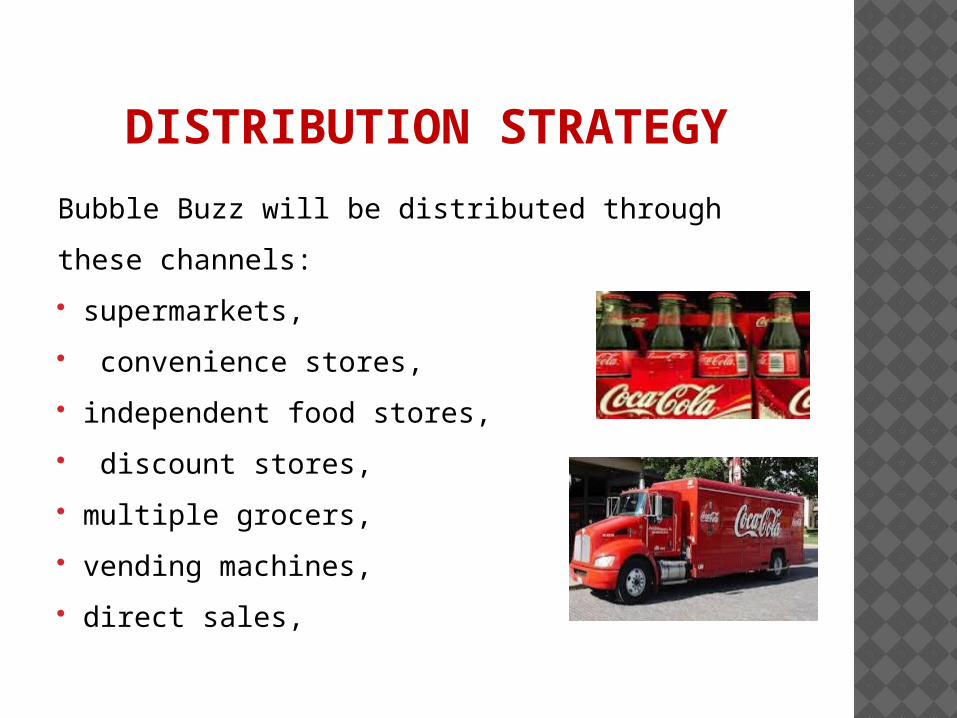
DISTRIBUTION STRATEGY
Bubble Buzz will be distributed through these channels:
supermarkets,
convenience stores,
independent food stores,
discount stores,
multiple grocers,
vending machines,
direct sales,
SALE STATEGY
To stimulate the demand by popularizing products.
To face competition effectively.
To keep the memory of products in mind of customer.
To supplement the personal selling & adverting.
To establish the large market segment.

PRODUCTION PLAN AND PROCESS
Idea Development Product Screening Final Design Design and Testing

IDEA DEVELOPMENT
Companies get employees to come up with creative
and innovative ideas.
By shifting from risk-adverse culture to a risk-taking
culture.
Coke’s Head of Marketing, Strategy, and Innovation,
Mary Minnick idea development strategy.

Product Screening
fit with existing facilities and labor skills,
size of potential market,
expected market share,
share of potential market
expected profit,
break-even point
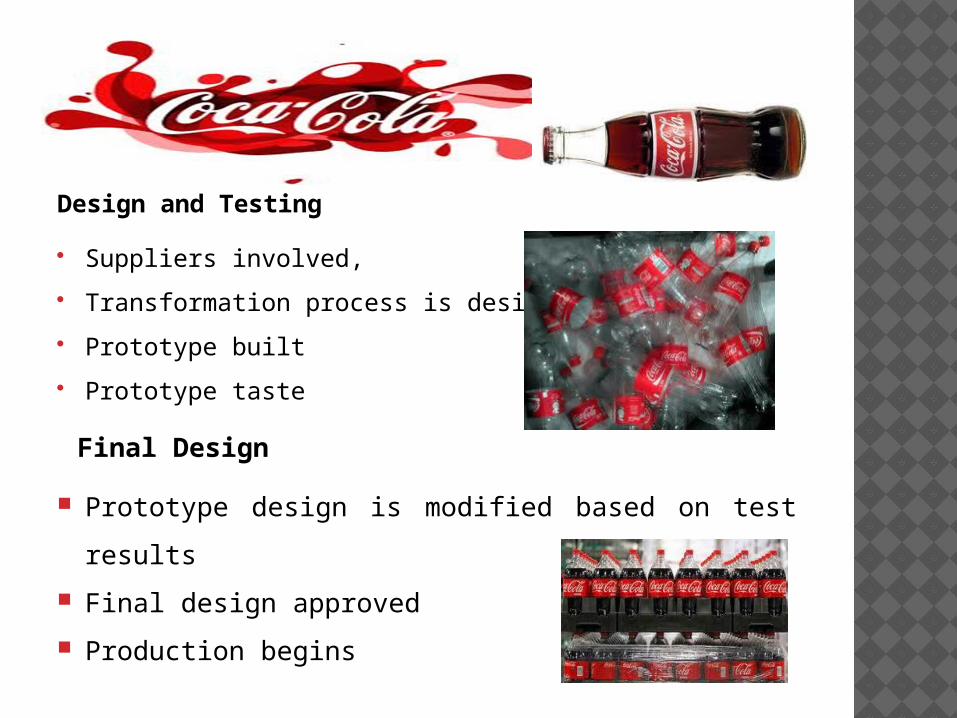
Design and Testing
Suppliers involved,
Transformation process is designed,
Prototype built
Prototype taste
Final Design
Prototype design is modified based on test results
Final design approved
Production begins
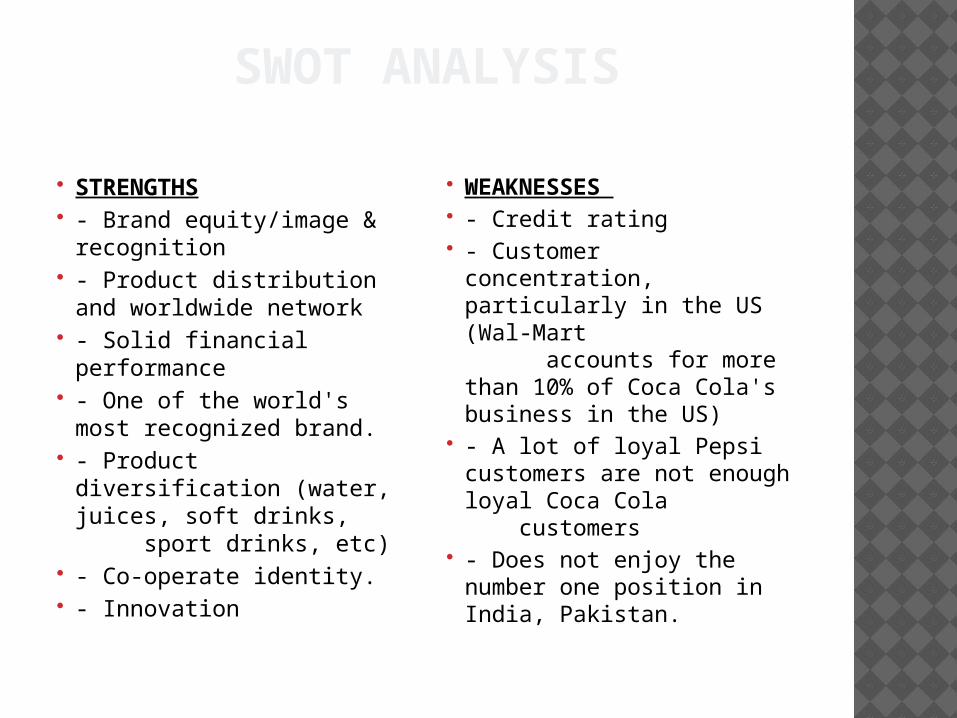
SWOT ANALYSIS
STRENGTHS - Brand equity/image &
recognition - Product distribution and
worldwide network - Solid financial performance - One of the world's most
recognized brand. - Product diversification
(water, juices, soft drinks, sport drinks, etc)
- Co-operate identity. - Innovation
WEAKNESSES - Credit rating - Customer concentration,
particularly in the US (Wal-Mart accounts for more than 10% of Coca Cola's business in the US)
- A lot of loyal Pepsi customers are not enough loyal Coca Cola customers
- Does not enjoy the number one position in India, Pakistan.

SWOT ANALYSISOPPORTUNITIES
-Possible growing demand.
-Expansion – Reaching all segments.
-Globalization -Catering to Health
Consciousness of People -Bottled water growth
-Acquisitions of smaller players.
THREATS - Health Drinks – Fruit
Juice Companies - Key competitors
(Pepsi, etc) - Commodity prices
growth - Image perception in
certain parts of the world.

INCOME STATEMENT The Coca-Cola Company has a multi-step Income
Statement because it includes the Gross Profit amount that is stated after net revenues and Cost of Goods Sold.
FiscalYear(amountsstated in millions of dollars)
2007
2008
Difference
Operating Income
$7,252
$8446
$1,194
Gross Profit
$18,451
$20,570
$2,119
Net Income
$5,981
$5,807
(-$174)
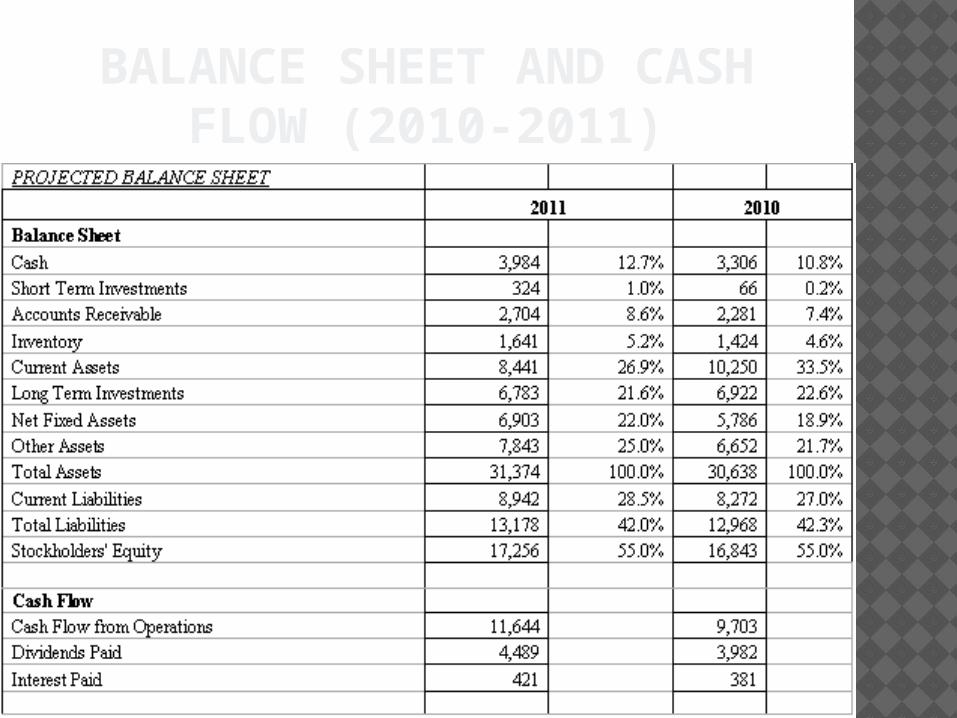
BALANCE SHEET AND CASH FLOW (2010-2011)
The data shows overall growth with one large exception, the net income increased in 2011. Current liabilities also increased .there is also rise in short term investments. inventory level also increased. the Balance Sheet and Statement of cash flow shows that the coke has enjoying profit

INCOME STATEMENT
All accounts, total liabilities and total stockholders’ equity led to a decrease of total assets in 2011.•Total Liabilities was the account that had the most change.

FINANCIAL ANALYSIS PROFITABILITY RATIOS
Average Days Sales Uncollected: 2007: 37.3 days 2008: 36.5 days
Inventory Turnover: 2007: 5.4 times 2008: 5.2 times
Average Days Inventory on hand: 2007: 67.7 days 2008: 70.7 days

FINANCIAL ANALYSIS AND LIQUIDITY RATIOS
Working Capital (in millions): 2007: -$1,120 2008: -$812
Current Ratio: 2007: 0.9153 2008: 0.9375
Receivable Turnover: 2007: 9.8 times 2008: 10.0 times
Average Days Sales Uncollected: 2007: 37.3 days 2008: 36.5 days
Inventory Turnover: 2007: 5.4 times 2008: 5.2 times
Average Days Inventory on hand: 2007: 67.7 days 2008: 70.7 days

FINANCIAL ANALYSIS PROFITABILITY RATIOS
Gross Profit Margin: 2007: 63.9% 2008: 64.4%
Asset Turnover: 2007: 0.79 2008: 0.76
Return on Assets •2007: 16.3% •2008: 13.6%\
Return on Equity: •2007: 34.46% •2008: 34.83%From
2007

FINANCIAL ANALYSIS MARKET STRENGTH RATIOS
price Earnings Ratio: 2007: 14.37 times the earnings reported. 2008: 22.73 times the earnings reported.
Dividend Yield: 2007: 2.2% 2008: 3.3%
An increase in the dividend yield shows that coca-cola shares gained more value per share as compared to 2007.

QUESTIONS?
Questions???????????????
?????????