Practicas recomendadas para la reparación de maquinas electricas rotativas
Upload
ecologistas-en-accionCategory
view
172download
3
Policy Analysis
CO2 Embodied in International Tradewith Implications for Global ClimatePolicyG L E N P . P E T E R S * A N DE D G A R G . H E R T W I C H
Industrial Ecology Programme, Norwegian University ofScience and Technology (NTNU),NO-7491 Trondheim, Norway
Received August 14, 2007. Revised manuscript receivedDecember 17, 2007. Accepted December 18, 2007.
The flow of pollution through international trade flows hasthe ability to undermine environmental policies, particularly forglobal pollutants. In this article we determine the CO2 emissionsembodied in international trade among 87 countries for the year2001. We find that globally there are over 5.3 Gt of CO2embodied in trade and that Annex B countries are net importersof CO2 emissions. Depending on country characteristics—suchas size variables and geographic location—there areconsiderable variations in the embodied emissions. We arguethat emissions embodied in trade may have a significantimpact on participation in and effectiveness of global climatepolicies such as the Kyoto Protocol. We discuss several policyoptions to reduce the impact of trade in global climatepolicy. If countries take binding commitments as a part of acoalition, instead of as individual countries, then the impacts oftrade can be substantially reduced. Adjusting emissioninventories for trade gives a more consistent description of acountry’s environmental pressures and circumvents many traderelated issues. It also gives opportunities to exploit trade asa means of mitigating emissions. Not least, a better understandingof the role that trade plays in a country’s economic andenvironmental development will help design more effectiveand participatory climate policy post-Kyoto.
1. IntroductionInternational trade causes a geographic separation of con-sumers and the pollution emitted in the production ofconsumable items. This gives a mechanism for consumersto shift environmental pollution associated with theirconsumption to distant lands. For local pollutants this maybe viewed as a rational option for consumers, but for globalpollutants—such as greenhouse gases (GHG)—consumerswill bear the costs regardless of where production occurs.Consequently one would expect the optimal policy for globalpollutants to consider the implications of international trade.Interestingly, the only reference to international trade in theKyoto Protocol is that “Parties. . .shall strive to implementpolicies and measures. . .in such a way as to minimize adverseeffects. . .on international trade”. Many of the debatedproblems of the Kyoto Protocol are manifested in interna-tional trade—costs, competitiveness, carbon leakage, andso on—and perhaps ironically, restructuring international
trade may help mitigation and accelerate sustainabledevelopment.
Historically, international trade has played a significantrole in economic development by giving a mechanism toefficiently allocate resources, typically labor and capital (1).However, without fully and uniformly costing externalities,production may occur in regions with poor environmentalperformance or weak environmental legislation. This sepa-ration of consumption and production has instigated manystudies on the pollution embodied in international trade—primarily air pollutants (2, 3), but also water (4), land (5),materials (6), and even forest products (7). These studieshave highlighted the magnitude and policy importance ofpollution embodied in trade for individual countries or smallgroups of countries. Despite this, there is a clear need formore comprehensive global studies to provide input forclimate policy analysis.
Given the political rhetoric associated with trade andcompetitiveness issues in climate policy (8–10), there hasbeen little research on how trade may impact climate policy.If a country has a large share of its exports in pollution-intensive production, then there may be large—real orperceived (11)—economic cost associated with participatingin a global climate regime (12). If the climate regime hasinadequate participation, then there is a risk that productionwill increasingly shift to nonparticipating countries. Eitherindustries may close down and move to nonparticipatingcountries, or more problematic, expanded production mayoccur in nonparticipating countries (13) as is clearly dem-onstrated by the rapid growth of production in China (14, 15).Further, with increasingly global production, most low-costmitigation options may be located outside the country ofconsumption. As an example, since Norway has almost 100%hydropower, it would make economic sense for Norway tofocus emission reductions on coal power electricity genera-tion in its important trading partners (16). The Kyoto Protocolattempts to address this through the Clean DevelopmentMechanism (CDM), but evidence suggests that the CDM hasnot been effective at meeting its goals (17).
There have been many proposals for climate policy in thepost-Kyoto period (18, 19) with many considering issues suchas equity, flexibility, economic costs, and environmentaleffectiveness. Very few proposals have assessed whetherinternational trade may be underlying some of the concernswith the Kyoto Protocol. International trade has beendiscussed as a way to enforce climate policy (20) and thereis increasing interest in using trade-based mechanisms suchas border-tax adjustments (21–23). National emission in-ventories can also be adjusted for trade (24, 25) which hasthe potential to avoid issues such as carbon leakage, but hasreceived little attention in climate policy debates (12). Giventhe importance of trade in most aspects of modern econo-mies, it is certainly beneficial to investigate the role tradehas in climate policy.
The main focus of this article is a quantitative comparisonof how the emissions embodied in international trade shapea country’s environmental profile and discuss the implica-tions for global climate policy. We perform detailed analyseson the emissions embodied in exports and imports, thecarbon leakage between Annex B and non-Annex B countries,and compare different methods for constructing GHGinventories. Finally, we discuss the implications of anthro-pogenic carbon flows for global climate policy.
* Corresponding author phone:+47 7359 8938; e-mail: [email protected]; http://www.indecol.ntnu.no/.
10.1021/es072023k CCC: $40.75 2008 American Chemical Society VOL. 42, NO. 5, 2008 / ENVIRONMENTAL SCIENCE & TECHNOLOGY 9 1401
Published on Web 01/30/2008
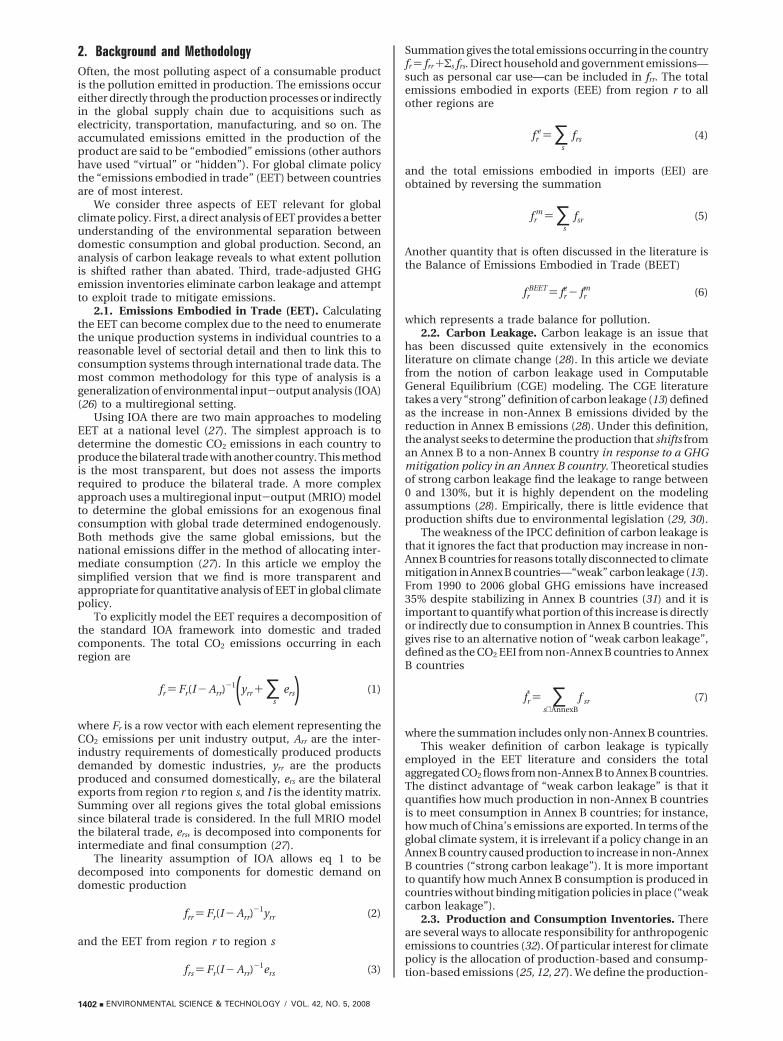
2. Background and MethodologyOften, the most polluting aspect of a consumable productis the pollution emitted in production. The emissions occureither directly through the production processes or indirectlyin the global supply chain due to acquisitions such aselectricity, transportation, manufacturing, and so on. Theaccumulated emissions emitted in the production of theproduct are said to be “embodied” emissions (other authorshave used “virtual” or “hidden”). For global climate policythe “emissions embodied in trade” (EET) between countriesare of most interest.
We consider three aspects of EET relevant for globalclimate policy. First, a direct analysis of EET provides a betterunderstanding of the environmental separation betweendomestic consumption and global production. Second, ananalysis of carbon leakage reveals to what extent pollutionis shifted rather than abated. Third, trade-adjusted GHGemission inventories eliminate carbon leakage and attemptto exploit trade to mitigate emissions.
2.1. Emissions Embodied in Trade (EET). Calculatingthe EET can become complex due to the need to enumeratethe unique production systems in individual countries to areasonable level of sectorial detail and then to link this toconsumption systems through international trade data. Themost common methodology for this type of analysis is ageneralization of environmental input-output analysis (IOA)(26) to a multiregional setting.
Using IOA there are two main approaches to modelingEET at a national level (27). The simplest approach is todetermine the domestic CO2 emissions in each country toproduce the bilateral trade with another country. This methodis the most transparent, but does not assess the importsrequired to produce the bilateral trade. A more complexapproach uses a multiregional input-output (MRIO) modelto determine the global emissions for an exogenous finalconsumption with global trade determined endogenously.Both methods give the same global emissions, but thenational emissions differ in the method of allocating inter-mediate consumption (27). In this article we employ thesimplified version that we find is more transparent andappropriate for quantitative analysis of EET in global climatepolicy.
To explicitly model the EET requires a decomposition ofthe standard IOA framework into domestic and tradedcomponents. The total CO2 emissions occurring in eachregion are
fr ) Fr(I-Arr)-1(yrr +∑
s
ers) (1)
where Fr is a row vector with each element representing theCO2 emissions per unit industry output, Arr are the inter-industry requirements of domestically produced productsdemanded by domestic industries, yrr are the productsproduced and consumed domestically, ers are the bilateralexports from region r to region s, and I is the identity matrix.Summing over all regions gives the total global emissionssince bilateral trade is considered. In the full MRIO modelthe bilateral trade, ers, is decomposed into components forintermediate and final consumption (27).
The linearity assumption of IOA allows eq 1 to bedecomposed into components for domestic demand ondomestic production
frr ) Fr(I-Arr)-1yrr (2)
and the EET from region r to region s
frs ) Fr(I-Arr)-1ers (3)
Summation gives the total emissions occurring in the countryfr ) frr +Σs frs. Direct household and government emissions—such as personal car use—can be included in frr. The totalemissions embodied in exports (EEE) from region r to allother regions are
fre )∑
s
frs (4)
and the total emissions embodied in imports (EEI) areobtained by reversing the summation
frm )∑
s
fsr (5)
Another quantity that is often discussed in the literature isthe Balance of Emissions Embodied in Trade (BEET)
frBEET ) fr
e - frm (6)
which represents a trade balance for pollution.2.2. Carbon Leakage. Carbon leakage is an issue that
has been discussed quite extensively in the economicsliterature on climate change (28). In this article we deviatefrom the notion of carbon leakage used in ComputableGeneral Equilibrium (CGE) modeling. The CGE literaturetakes a very “strong” definition of carbon leakage (13) definedas the increase in non-Annex B emissions divided by thereduction in Annex B emissions (28). Under this definition,the analyst seeks to determine the production that shifts froman Annex B to a non-Annex B country in response to a GHGmitigation policy in an Annex B country. Theoretical studiesof strong carbon leakage find the leakage to range between0 and 130%, but it is highly dependent on the modelingassumptions (28). Empirically, there is little evidence thatproduction shifts due to environmental legislation (29, 30).
The weakness of the IPCC definition of carbon leakage isthat it ignores the fact that production may increase in non-Annex B countries for reasons totally disconnected to climatemitigation in Annex B countries—“weak” carbon leakage (13).From 1990 to 2006 global GHG emissions have increased35% despite stabilizing in Annex B countries (31) and it isimportant to quantify what portion of this increase is directlyor indirectly due to consumption in Annex B countries. Thisgives rise to an alternative notion of “weak carbon leakage”,defined as the CO2 EEI from non-Annex B countries to AnnexB countries
fr* ) ∑
s∉ AnnexB
f sr (7)
where the summation includes only non-Annex B countries.This weaker definition of carbon leakage is typically
employed in the EET literature and considers the totalaggregated CO2 flows from non-Annex B to Annex B countries.The distinct advantage of “weak carbon leakage” is that itquantifies how much production in non-Annex B countriesis to meet consumption in Annex B countries; for instance,how much of China’s emissions are exported. In terms of theglobal climate system, it is irrelevant if a policy change in anAnnex B country caused production to increase in non-AnnexB countries (“strong carbon leakage”). It is more importantto quantify how much Annex B consumption is produced incountries without binding mitigation policies in place (“weakcarbon leakage”).
2.3. Production and Consumption Inventories. Thereare several ways to allocate responsibility for anthropogenicemissions to countries (32). Of particular interest for climatepolicy is the allocation of production-based and consump-tion-based emissions (25, 12, 27). We define the production-
1402 9 ENVIRONMENTAL SCIENCE & TECHNOLOGY / VOL. 42, NO. 5, 2008

based emission inventory as the total domestic emissionsoccurring from economic production within a country
frprod ) fr (8)
The production-based inventory is related to, but differentfrom the IPCC definition. In the IPCC definition, emissioninventories are allocated according to “national (includingadministered) territories and offshore areas over which thecountry has jurisdiction” (33), while our production-basedinventories are based on the economic activities of residentialinstitutions as defined in the System of National Accounts(SNA) (34) and used in the NAMEA (35, 36). Generally theunderlying source data are the same, but the production-based inventories include international economic activities—primarily, international transportation and tourism—asdefined in the Gross Domestic Product (GDP) (12). Further,the NAMEA are allocated to economic sectors, while the IPCCdata are allocated to technologies.
We define the consumption-based emission inventory asthe total global emissions occurring from economic con-sumption within a country
frcons ) fr
prod - fre + fr
m ) fr - frBEET (9)
and can thus be considered a trade-adjusted version of theproduction-based inventory. The consumption-based in-ventory takes the production-based inventory, but deductsthe EEE and adds the EEI. According to our definitions ofEEE and EEI, the consumption-based inventory is based ontotal consumption—intermediate and final—using bilateraltrade data. If using the full MRIO model a slightly differentdefinition would be used which considers the global emis-sions from final consumption in each region (27).
3. DataThe data requirements for a multiregional IOA are consider-able, but most developed countries and many developingcountries collect the necessary data. However, convertingthe country data to a consistent global data set is aconsiderable task. The Global Trade Analysis Project (GTAP)has constructed the necessary data for the purposes of CGEmodeling and this data set can be applied for multiregionalIOA. The GTAP provides data for 87 countries and 57 industrysectors covering IOA, trade, protection, energy, and CO2
emissions (37). Version 6 represents the world economy in2001. We only consider CO2 emissions which covers over70% of global GHG emissions (38).
While the GTAP database has impressive coverage, careneeds to be taken with its consistency and accuracy.Generally, original data are supplied by the members of theGTAP in return for free subscription. The data are often fromreputable sources such as national statistical offices. Un-fortunately, due to the voluntary nature of data submissions,the data are not always the most recently available. Further,once the original data has been received “[GTAP] make[s]further significant adjustments to ensure that the I-O tablematches the external macroeconomic, trade, protection, andenergy data” (37). These adjustments (or calibrations) aremade for internal consistency in computable general equi-librium modeling and are of unknown magnitude. The keydata challenges and adjustments we perform on the GTAPdata in preparation for our analysis are described in theSupporting Information.
4. Results4.1. Emissions Embodied in Trade. Table 1 shows the EEEand EEI for key Annex B and developing countries. TheSupporting Information contains the full data set in bothabsolute and percentage quantities. For each region we show
the production-based emissions, f prodr, the consumption-
based emissions, f consr, the percentage EEE, fe
r/fprodr, the
percentage EEI, f mr/fprod
r, the percentage BEET, f BEETr/f prod
r,the percentage carbon leakage normalized with respect tothe total production-based emissions, f *r/fprod
r, and thepercentage carbon leakage with respect to the EEI, f*r/fm
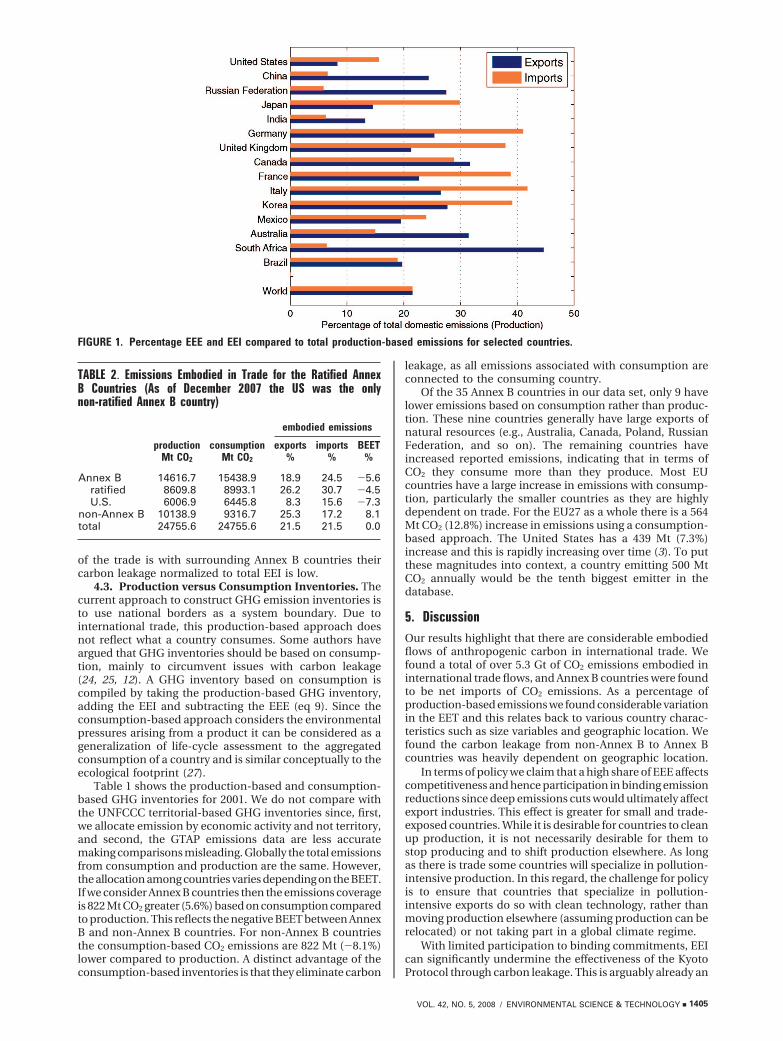
r.We have cross checked our numbers with another study (39)and found that our values generally lie between their lowerand upper bounds (see Supporting Information). Figure 1gives a graphic representation of the EEE and EEI for the 15countries in the data set with the highest domestic emissions.
Table 1 shows that 5.3 Gt (21.5%) of global CO2 emissionsare embodied in international trade. This number increasesto 5.7 Gt (23.0%) if all international transportation is allocatedto EEE (see Supporting Information). The Annex B countriesexport 2.8 Gt (18.9%) of their domestic CO2 emissions andthe non-Annex B countries export 2.6 Gt (25.3%). Forindividual countries the EEE can vary considerably. Overhalf of the countries have more than 25% CO2 EEE with manycountries around 50% EEE. The range of values is between7.4% and 59.7%. This increases to 7.8% and 71.5% if allinternational transportation is included (see SupportingInformation).
Due to symmetry, the global EEI is the same as the globalEEE. The Annex B countries import 3.6 Gt (24.5%) of theirdomestic CO2 emissions, while the non-Annex B countriesimport 1.7 Gt (17.2%). Consequently, Annex B countries arenet importers of CO2 emissions and non-Annex B countriesare net exporters. For individual countries the CO2 EEI rangesfrom 5.9% (Russian Federation) to 219.3% (Hong Kong). Theirare 9 of 87 countries which have an EEI of more than 100%(that is, the CO2 EEI are greater than their domesticemissions). These are generally small, trade-exposed coun-tries. When interpreting the EEI it is important to note thatwe normalize the EEI (numerator) with the domestic emis-sions (denominator). This implies that if a country has acleaner electricity mix then its trading partners, then it islikely that it will have a higher value of EEI compared to acountry with a dirtier electricity mix.
Table 1 also shows the “Balance of Emissions Embodiedin Trade” (BEET). Annex B countries are net importers ofCO2 emissions, while non-Annex B countries are net export-ers. Some authors have placed emphasis on the BEET in theliterature (25), but we feel that care is needed in itsinterpretation. The tendency is to argue that it is better toexport more pollution than you import (positive BEET). Froma global climate change perspective we argue that it is moredesirable to have production occur where it is environmen-tally preferable and then trade the products internationally.Based on this, some countries may have a large positive ornegative BEET depending on their environmental compara-tive advantage (12).
Given the possible importance of EET in shaping acountries environmental profile we performed regressionsbetween EET and various country characteristics (see Sup-portingInformation).Wefoundthatgenerallylargecountries—GDP, population, area—have smaller EET. This could beinterpreted as large countries being more self-sufficient (11).In terms of the Kyoto Protocol, this suggests that the policyimplications of trade will differ depending on the size of thecountry. Small, trade exposed countries (e.g., Belgium, EEE45.5%, EEI 89.4%) may face greater economic impacts ifclimate policy affects trade, compared to a bigger country(e.g., United States, EEE 8.3%, EEI 15.6%) that has a relativelylarge and independent domestic economy. This suggests thatif countries act in coalitions to increase their effective sizethen they may negate some of the negative consequences oftrade.
Currently the United States has not ratified the KyotoProtocol (Croatia ratified May 2007 and Australia ratified
VOL. 42, NO. 5, 2008 / ENVIRONMENTAL SCIENCE & TECHNOLOGY 9 1403

December 2007). Since the United States represents aroundone-third of Annex B emissions (38) the Annex B EET variessubstantially. Table 2 shows that the ratified countries aresignificantly more trade exposed then the United States, Table1. The United States (8) and, previously Australia (9), bothcited competitiveness concerns as their rationale for notratifying the Kyoto Protocol. Based on EET arguments, ourresults suggest that the United States and Australia haveconsiderably less competitiveness concerns compared tomany other Annex B countries.
4.2. Carbon Leakage. If an international climate regimehas limited participation, such as in the Kyoto Protocol, theproblem of carbon leakage arises. Increased carbon leakagecan be caused by two factors. First, industries close down ina participating country and migrate to a nonparticipatingcountry with lax environmental regulations (strong PollutionHaven Hypothesis, PHH). Evidence for the strong PHH ispoor (29, 30). Second, increased consumption in a partici-pating country is met by increased production in a non-participating country (weak PHH) (13). Given dynamiceconomic development the weak PHH would be sufficient
to cause substantial concerns for the effectiveness of a climateregime with limited participation.
Table 1 shows the carbon leakage from Annex B countriesfor CO2 in 2001, and Figure 2 gives a graphical representationfor key countries. We use two measures of carbon leakage.The first gives the carbon leakage compared to total domesticemissions which indicates the magnitude of the leakage. Thesecond measure (shown in brackets below), normalizescarbon leakage relative to EEI which indicates the share ofEEI coming from non-Annex B countries and is a maximumof 100%. We estimate the carbon leakage from the KyotoProtocol for CO2 as 10.8% (44.3%). The leakage variesconsiderably among countries. It is as high as 29.4% (32.9%)for Belgium and decreases to 2.7% (46.6%) for the RussianFederation. The general trend is for countries with high EEIto have high carbon leakage, although geographic locationis important. For instance, Japan and the United States arelocated far away from other Annex B countries and sonormalized to their EEI they have high carbon leakage (68.5%and 61.7%, respectively). On the other hand, countries withinthe EU have high absolute carbon leakage, but since most
TABLE 1. Emissions Embodied in Trade for Selected Countries (Complete List in Supporting Information)a
embodied emissions carbon leakage
productionMt CO2
consumptionMt CO2 exports % imports % BEET % total % share %
United States 6006.9 6445.8 8.3 15.6 -7.3 9.6 61.7Russian Federation 1502.8 1178.0 27.5 5.9 21.6 2.7 46.6Japan 1291.0 1488.8 14.5 29.8 -15.3 20.4 68.5Germany 892.2 1032.1 25.3 41.0 -15.7 13.7 33.4United Kingdom 618.6 721.3 21.3 37.9 -16.6 14.5 38.2Canada 547.7 532.2 31.7 28.8 2.8 7.7 26.7France 509.9 591.9 22.7 38.8 -16.1 12.8 33.0Italy 475.1 547.6 26.5 41.8 -15.3 16.4 39.2Belarus/Ukraine 363.3 314.8 28.5 15.1 13.3 3.1 20.3Australia 351.6 293.7 31.4 14.9 16.5 8.6 57.6Poland 309.8 280.6 21.9 12.5 9.4 3.0 24.1Spain 305.7 336.7 26.4 36.6 -10.1 14.5 39.8Netherlands 204.5 243.4 39.1 58.1 -19.0 21.1 36.3Belgium 126.4 181.9 45.5 89.4 -43.9 29.4 32.9Czech Republic 117.4 99.8 40.2 25.3 14.9 4.5 17.7Greece 101.4 107.3 29.6 35.5 -5.8 14.8 41.8Finland 94.9 86.3 44.6 35.5 9.1 6.3 17.7Denmark 74.8 85.0 34.1 47.8 -13.7 13.0 27.2Portugal 70.0 79.7 25.5 39.4 -13.9 10.7 27.2Sweden 59.7 83.4 34.1 73.7 -39.7 18.1 24.5Rest of Annex B 593.1 708.7 34.0 53.5 -19.5 12.7 23.7Annex B 14616.7 15438.9 18.9 24.5 -5.6 10.8 44.3
China 3289.2 2703.7 24.4 6.6 17.8 3.2 48.2Rest of Middle East 1199.9 1042.2 28.2 15.1 13.1 8.7 57.8India 1024.8 953.9 13.1 6.2 6.9 4.3 69.7Korea 397.7 443.1 27.6 39.1 -11.4 23.1 59.2Mexico 389.9 407.5 19.4 23.9 -4.5 5.9 24.8Rest of Former Soviet 350.6 303.8 28.5 15.1 13.3 3.1 20.3South Africa 323.7 200.2 44.6 6.4 38.2 3.4 52.1Brazil 321.0 318.5 19.7 18.9 0.8 9.2 48.7Indonesia 305.4 247.3 31.4 12.4 19.0 7.9 64.3Taiwan 247.9 240.2 40.0 36.9 3.1 20.2 54.8Turkey 196.3 188.0 27.5 23.3 4.2 8.6 36.9Thailand 178.7 154.3 41.8 28.1 13.7 16.6 59.2Venezuela 155.8 124.0 29.3 8.9 20.4 4.7 53.2Argentina 120.4 118.4 18.4 16.7 1.7 9.8 58.5Malaysia 116.8 93.3 59.7 39.5 20.1 23.5 59.6Rest of non-Annex B 1520.9 1778.4 22.3 39.3 -16.9 26.0 66.3Non-Annex B 10138.9 9316.7 25.3 17.2 8.1 9.7 56.3
Total 24755.6 24755.6 21.5 21.5 0.0 10.4 48.2a The first columns show the production-based and consumption-based emission inventories. The EEE, EEI, and BEET
are expressed as a percentage of the production-based emissions. The carbon leakage is expressed as a percentage of theproduction-based emissions (first column) and EEI (second column). Production-based totals differ from UNFCCC valuessince we allocate emissions according to economic activity and not territory (see text).
1404 9 ENVIRONMENTAL SCIENCE & TECHNOLOGY / VOL. 42, NO. 5, 2008
of the trade is with surrounding Annex B countries theircarbon leakage normalized to total EEI is low.
4.3. Production versus Consumption Inventories. Thecurrent approach to construct GHG emission inventories isto use national borders as a system boundary. Due tointernational trade, this production-based approach doesnot reflect what a country consumes. Some authors haveargued that GHG inventories should be based on consump-tion, mainly to circumvent issues with carbon leakage(24, 25, 12). A GHG inventory based on consumption iscompiled by taking the production-based GHG inventory,adding the EEI and subtracting the EEE (eq 9). Since theconsumption-based approach considers the environmentalpressures arising from a product it can be considered as ageneralization of life-cycle assessment to the aggregatedconsumption of a country and is similar conceptually to theecological footprint (27).
Table 1 shows the production-based and consumption-based GHG inventories for 2001. We do not compare withthe UNFCCC territorial-based GHG inventories since, first,we allocate emission by economic activity and not territory,and second, the GTAP emissions data are less accuratemaking comparisons misleading. Globally the total emissionsfrom consumption and production are the same. However,the allocation among countries varies depending on the BEET.If we consider Annex B countries then the emissions coverageis 822 Mt CO2 greater (5.6%) based on consumption comparedto production. This reflects the negative BEET between AnnexB and non-Annex B countries. For non-Annex B countriesthe consumption-based CO2 emissions are 822 Mt (-8.1%)lower compared to production. A distinct advantage of theconsumption-based inventories is that they eliminate carbon
leakage, as all emissions associated with consumption areconnected to the consuming country.
Of the 35 Annex B countries in our data set, only 9 havelower emissions based on consumption rather than produc-tion. These nine countries generally have large exports ofnatural resources (e.g., Australia, Canada, Poland, RussianFederation, and so on). The remaining countries haveincreased reported emissions, indicating that in terms ofCO2 they consume more than they produce. Most EUcountries have a large increase in emissions with consump-tion, particularly the smaller countries as they are highlydependent on trade. For the EU27 as a whole there is a 564Mt CO2 (12.8%) increase in emissions using a consumption-based approach. The United States has a 439 Mt (7.3%)increase and this is rapidly increasing over time (3). To putthese magnitudes into context, a country emitting 500 MtCO2 annually would be the tenth biggest emitter in thedatabase.
5. DiscussionOur results highlight that there are considerable embodiedflows of anthropogenic carbon in international trade. Wefound a total of over 5.3 Gt of CO2 emissions embodied ininternational trade flows, and Annex B countries were foundto be net imports of CO2 emissions. As a percentage ofproduction-based emissions we found considerable variationin the EET and this relates back to various country charac-teristics such as size variables and geographic location. Wefound the carbon leakage from non-Annex B to Annex Bcountries was heavily dependent on geographic location.
In terms of policy we claim that a high share of EEE affectscompetitiveness and hence participation in binding emissionreductions since deep emissions cuts would ultimately affectexport industries. This effect is greater for small and trade-exposed countries. While it is desirable for countries to cleanup production, it is not necessarily desirable for them tostop producing and to shift production elsewhere. As longas there is trade some countries will specialize in pollution-intensive production. In this regard, the challenge for policyis to ensure that countries that specialize in pollution-intensive exports do so with clean technology, rather thanmoving production elsewhere (assuming production can berelocated) or not taking part in a global climate regime.
With limited participation to binding commitments, EEIcan significantly undermine the effectiveness of the KyotoProtocol through carbon leakage. This is arguably already an
FIGURE 1. Percentage EEE and EEI compared to total production-based emissions for selected countries.
TABLE 2. Emissions Embodied in Trade for the Ratified AnnexB Countries (As of December 2007 the US was the onlynon-ratified Annex B country)
embodied emissions
productionMt CO2
consumptionMt CO2
exports%
imports%
BEET%
Annex B 14616.7 15438.9 18.9 24.5 -5.6ratified 8609.8 8993.1 26.2 30.7 -4.5U.S. 6006.9 6445.8 8.3 15.6 -7.3
non-Annex B 10138.9 9316.7 25.3 17.2 8.1total 24755.6 24755.6 21.5 21.5 0.0
VOL. 42, NO. 5, 2008 / ENVIRONMENTAL SCIENCE & TECHNOLOGY 9 1405

issue in the Kyoto Protocol where the ratified Annex Bcountries only account for one-third of global GHG emissions(38). Further, from 1990 to 2006 global CO2 emissions haveincreased by 35% (31), even though Annex B countries arestill on target for a 5% reduction in 1990 GHG emissions by2008–2012 (40). This highlights a major challenge in the Kyotoframework. To achieve global coverage and avoid carbonleakage high participation is needed, but this runs the riskof reducing effectiveness to encourage participation (41).We claim these issues are inseparable from internationaltrade.
Within the context of the Kyoto Policy one way to reducethe impact of trade on individual countries may be toencourage coalition formation (42). The EET is generally lowerfor a coalition compared to individual members of thecoalition and this may reduce competitiveness concerns andencourage participation. As an example, within the EuropeanCommunities (EC)—EU15 in the Kyoto Protocol—a signifi-cant share of the EET are between EC members and so theEET of individual countries are larger and more variablecompared to the EC as a whole, Figure 3. The coalition limitstrade impacts to products and services that leave the EC. Itis also possible that groupings of countries with similarenvironmental objectives could form coalitions with binding
commitments; see Supporting Information for examples withthe Asia-Pacific Partnership on Clean Development andClimate (AP6), Association of South East Asian Nations(ASEAN), and the South American Community of Nations(CSN). A further advantage of regional approaches is thatmany geo-political and economic organizations are alreadywell-established and many of these bodies have alreadyimplemented environmental initiatives. Negotiations amongregions with established dialogue and policies may face fewerpolitical obstacles and may be a more effective method ofdesigning an optimal global framework (42).
Another approach to reduce the impact of trade on climatepolicy is to adjust emission inventories for trade. Currently,emission inventories are production-based and this causesa separation between a country’s consumption and the globalproduction system. Arguably, it is this separation that causesthe competitiveness concerns in the Kyoto Protocol. Withconsumption-based emission inventories consistency isreturned between a country’s consumption (which occursdomestically) and the production system required for theconsumption (which occurs globally). Consumption-basedinventories eliminate carbon leakage and encourage mitiga-tion to occur where the costs are lowest (16, 12). In the veryleast, trade-adjusted emission inventories may offer a moresystematic approach for allocating differentiated commit-ments (43, 44) if the Kyoto Protocol structure is retainedpost-2012.
Another interesting feature of consumption-based in-ventories in the context of the Kyoto Protocol is theconnection with Border Tax Adjustments (BTA). BTA havebeen suggested as a way of addressing competitivenessconcerns and encouraging participation (20–23). BTA arerelated to consumption-based inventories in two ways. First,since the consumption-based inventory includes a share ofemissions from trading partners it indirectly places a cost ofcarbon in those trading partners. Second, the methodologyused to construct consumption-based inventories is also aconsistent method to determine the value of border taxes foraggregated sectors.
As negotiations for a post-Kyoto climate protocol intensify,it is important to not only strive for participation fromdeveloping countries, but also to improve the structure ofthe Kyoto Protocol. Arguably, the Kyoto Protocol has manygood features which should remain, but small improvementsmay greatly increase its effectiveness (44). One potential holein the Kyoto Protocol is that global emissions can seeminglyincrease unabated despite emissions reductions in Annex Bcountries (40). While the Kyoto Protocol may be hailed as asuccess in international political negotiations, it is yet to beseen whether it will be successful in meeting its environ-mental goals. In this article, we have argued that internationaltrade underlies many of the debated issues in the KyotoProtocol—economic costs, competitiveness, participation,carbon leakage—and trade issues should play a muchstronger role in post-Kyoto negotiations.
AcknowledgmentsThis research was funded by the Research Council of Norwaythrough contract 139853 and by the rector of NTNU. Wethank the reviewers for helpful contributions.
Supporting Information AvailableSupplementary Methods, Data, Comparisons, Results, andDiscussion; the complete list of all 87 countries analyzedshown in both absolute and percentage terms; three ad-ditional figures on coalition formation. This information isavailable free of charge via the Internet at http://pubs.acs.org.
Literature Cited(1) Feenstra, R. C. Advanced International Trade: Theory and
Evidence; Princeton University Press: Princeton, NJ, 2003.
FIGURE 2. EEI of selected countries showing the EEI fromAnnex B countries and non-Annex B countries (carbonleakage). Relative to total EEI, EU countries have a larger shareof EEI originating in Annex B countries since EU countries aresurrounded by other Annex B countries. The carbon leakage fornon-Annex B countries is defined the same as for Annex Bcountries.
FIGURE 3. EEE and EEI of selected EC members showing theEET originating inside the coalition (left bar) and outside thecoalition (right bar). Generally, the EET are reduced if countriesact in a coalition since only the EET originating outside thecoalition is considered.
1406 9 ENVIRONMENTAL SCIENCE & TECHNOLOGY / VOL. 42, NO. 5, 2008

(2) Wiedmann, T.; Lenzen, M.; Turner, K.; Barrett, J. Examining theglobal environmental impact of regional consumption activities- Part 2: Review of input-output models for the assessment ofenvironmental impacts embodied in trade. Ecol. Econ. 2007,61, 15–26.
(3) Weber, C.; Matthews, H. S. Embodied Environmental Emissionsin U.S. International Trade, 1997–2004. Environ. Sci. Technol.2007, 41 (14), 4875–4881.
(4) Hoekstra, A. Y.; Hung, P. Q. Globalisation of water resources:International virtual water flows in relation to crop trade. GlobalEnviron. Change 2005, 15 (1), 45–56.
(5) Hubacek, K.; Giljum, S. Applying physical input-output analysisto estimate land appropriation (ecological footprints) of in-ternational trade activities. Ecol. Econ. 2003, 44 (1), 137–151.
(6) Müller, D. B.; Wang, T.; Duval, B.; Graedel, T. E. Exploring theengine of anthropogenic iron cycles. Proc. Natl. Acad. Sci. 2006,103 (44), 16111–16116.
(7) Mayer, A. L.; Kauppi, P. E.; Angelstam, P. K.; Zhang, Y.; Tikka,P. M. Importing timber, exporting ecological impact. Science2005, 308, 359–360.
(8) Bush, G. W. Letter from the President to Senators Hagel, Helms,Craig, and Roberts; The White House: Washington, DC, 13 March2001.
(9) Hansard No. 18. Wednesday, 6 December 2006, Commonwealthof Australia, 2006.
(10) Grubb, M.; Neuhoff, K. Allocation and competitiveness in theEU emissions trading scheme: policy overview. Climate Policy2006, 6, 7–30.
(11) Krugman, P. Competitiveness: A dangerous obsession. ForeignAffairs 1994, 73 (2), 28–44.
(12) Peters, G. P.; Hertwich, E. G. Post-Kyoto greenhouse gasinventories: Production versus consumption. Climatic Change2008, 86 (1–2), 51–66.
(13) Rothman, D. S. Environmental Kuznets Curves—real progressor passing the buck? A case for consumption-based approaches.Ecol. Econ. 1998, 25, 177–194.
(14) Streets, D. G.; Yu, C.; Bergin, M. H.; Wang, X.; Carmichael, G. R.Modeling study of air pollution due to the manufacture of exportgoods in China’s Pearl River Delta. Environ. Sci. Technol. 2006,40 (7), 2099–2107.
(15) Peters, G. P.; Weber, C. L.; Guan, D.; Hubacek, K. China’s growingCO2 emissions - a race between increasing consumption andefficiency gains. Environ. Sci. Technol. 2007, 41 (17), 5939–5944.
(16) Peters, G. P.; Hertwich, E. G. Structural analysis of internationaltrade: Environmental impacts of Norway. Econ. Syst. Res. 2006,18 (2), 155–181.
(17) Wara, M. Is the global carbon market working? Nature 2007,445, 595–596.
(18) Aldy, J. E.; Barrett, S.; Stavins, R. N. Thirteen plus one: Acomparison of global climate policy architectures. Climate Policy2003, 3, 373–397.
(19) Bodansky, D.; Chou, S.; Jorge-Tresolini, C. International ClimateEfforts Beyond 2012: A Survey of Approaches; Pew Center onGlobal Climate Change: Arlington, VA, 2004.
(20) Aldy, J. E.; Orszag, P. R.; Stiglitz, J. E. Climate change: An agendafor global collective action. Prepared for the conference on “TheTiming of Climate Change Policies”; Pew Center on GlobalClimate Change: Arlington, VA, 2001.
(21) Ismer, R.; Neuhoff, K. Border tax adjustments: A feasible way toaddress nonparticipation in emission trading; Working Papersin Economics CWPE 0409; Department of Applied Economics,University of Cambridge: Cambridge, UK, 2004.
(22) de Cendra, J. Can emissions trading schemes be coupled withborder tax adjustments? An analysis vis-á-vis WTO law. Rev.Eur. Commun. Int. Environ. Law 2006, 15 (2), 131–145.
(23) Pauwelyn, J. U.S. federal climate policy and competitivenessconcerns: The limits and options of international trade law; NI
WP 07-02; Nicholas Institute for Environmental Policy Solutions,Duke University: Durham, NC, 2007.
(24) Kondo, Y.; Moriguchi, Y.; Shimizu, H. CO2 emissions in Japan:Influences of imports and exports. Appl. Energy 1998, 59 (2–3),163–174.
(25) Munksgaard, J.; Pedersen, K. A. CO2 accounts for openeconomies: Producer or consumer responsibility. Energy Policy2001, 29, 327–334.
(26) Leontief, W. Environmental repercussions and the economicstructure: An input-output approach. Rev. Econ. Statistics 1970,52 (3), 262–271.
(27) Peters, G. P. From Production-Based to Consumption-BasedNational Emission Inventories . Ecol. Econ. (published online:doi:10.1016/j.ecolecon.2007.10.014).
(28) IPCC. Climate Change 2007: Mitigation; Contribution of WorkingGroup III to the Fourth Assessment Report of the Intergov-ernmental Panel on Climate Change; Metz, B., Davidson, O. R.,Bosch, P. R., Dave, R., Meyer, L. A., Eds.; Cambridge UniversityPress: Cambridge, UK/New York, 2007.
(29) Cole, M. A.; Elliott, R. J. R.; Shimamoto, K. Why the grass is notalways greener: the competing effects of environmental regula-tions and factor intensities on US specialization. Ecol. Econ.2005, 54, 95–109.
(30) Spatareanu, M. Searching for pollution havens: The impact ofenvironmental regulations on foreign direct investment. J.Environ. Devel. 2007, 16 (2), 161–182.
(31) MNP. China now no. 1 in CO2 emissions; USA in second position;Climate Change Dosier, Netherlands Environmental AssessmentAgency, 2007.
(32) Eder, P.; Narodoslawsky, M. What environmental pressures area region’s industries responsible for? A method of analysis withdescriptive indices and input-output models. J. Environ. Devel.1999, 29, 359–374.
(33) IPCC. Revised 1996 IPCC Guidelines for National GreenhouseGas Inventories (3 volumes); Intergovernmental Panel on ClimateChange, 1996.
(34) United Nations. System of National Accounts 1993; UnitedNations, 1993.
(35) de Haan, M.; Keuning, S. J. Taking the environment into account:The NAMEA approach. Rev. Income Wealth 1996, 42 (2), 131–148.
(36) Gravgård Pedersen, O.; de Haan, M. The system of environmentaland economic accounts-2003 and the economic relevance ofphysical flow accounting. J. Ind. Ecol. 2006, 10 (1–2), 19–42.
(37) Dimaranan, B. V., Ed. Global Trade, Assistance, and Production:The GTAP 6 Data Base; Center for Global Trade Analysis, PurdueUniversity: West Lafayette, IN, 2006.
(38) CAIT. Climate Analysis Indicators Tool (CAIT) Version 4; WorldResources Institute: Washington, DC, 2007.
(39) Ahmad, N.; Wyckoff, A. Carbon dioxide emissions embodied ininternational trade of goods; DSTI/DOC(2003)15; Organisationfor Economic Co-operation and Development (OECD): Paris,2003.
(40) UNFCCC. Key GHG Data: Greenhouse Gas (GHG) Emissions Datafor 1990–2003; United Nations, 2005.
(41) Barrett, S.; Stavins, R. Increasing participation and compliancein international climate change agreements. Int. Environ.Agreements: Politics, Law Econ. 2003, 3, 349–376.
(42) Victor, D. G.; House, J. C.; Joy, S. A Madisonian approach toclimate policy. Science 2005, 309, 1820–1821.
(43) Babiker, M. H.; Eckaus, R. S. Rethinking the Kyoto emissionstargets. Climatic Change 2002, 54, 399–414.
(44) Grubb, M. Kyoto and the future of international climate changeresponses: From here to where. Int. Rev. Environ. Strategies2004, 5 (1), 15–38.
ES072023K
VOL. 42, NO. 5, 2008 / ENVIRONMENTAL SCIENCE & TECHNOLOGY 9 1407