CO Baseline Database for the Indian Power Sector … Baseline Database...CO 2 Baseline Database for...
35
CO 2 Baseline Database for the Indian Power Sector User Guide Version 10.0 December 2014 Government of India Ministry of Power Central Electricity Authority Sewa Bhawan, R.K.Puram, New Delhi-66
Transcript of CO Baseline Database for the Indian Power Sector … Baseline Database...CO 2 Baseline Database for...
CO2 Baseline Database
for the Indian Power Sector
User Guide
Version 10.0
December 2014
Government of India
Ministry of Power
Central Electricity Authority Sewa Bhawan, R.K.Puram,
New Delhi-66
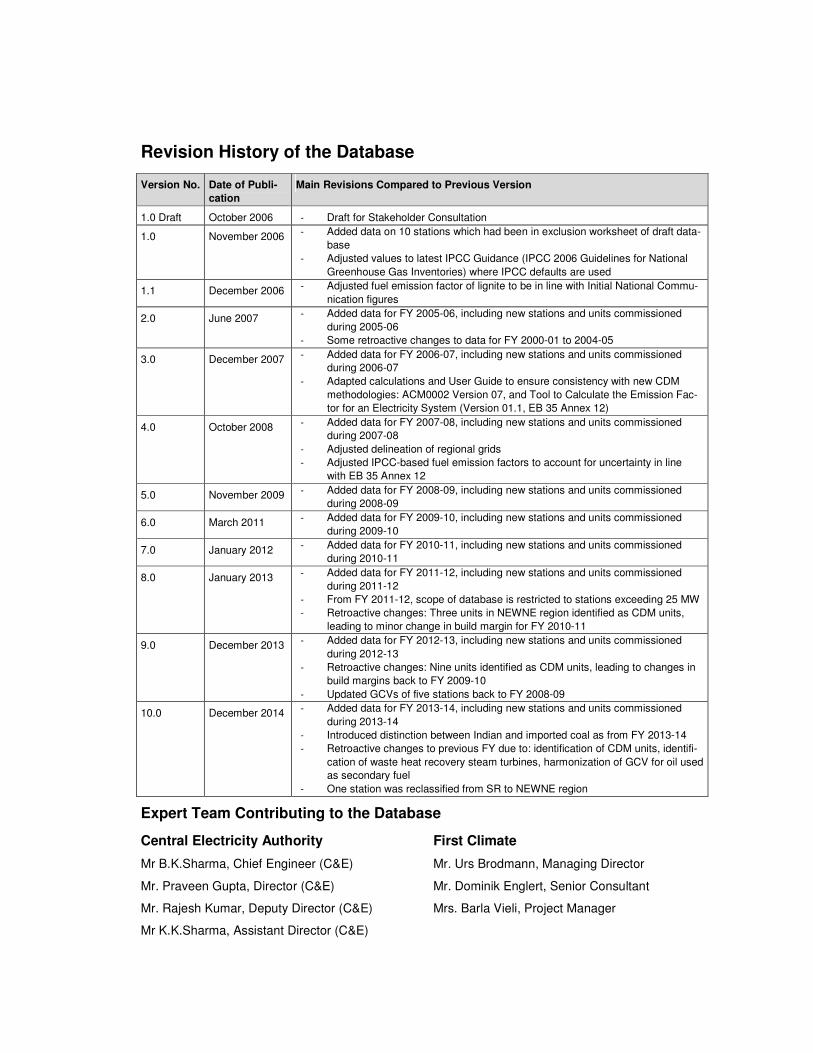
Revision History of the Database
Version No. Date of Publi-
cation
Main Revisions Compared to Previous Version
1.0 Draft October 2006 - Draft for Stakeholder Consultation
1.0 November 2006 - Added data on 10 stations which had been in exclusion worksheet of draft data-
base
- Adjusted values to latest IPCC Guidance (IPCC 2006 Guidelines for National
Greenhouse Gas Inventories) where IPCC defaults are used
1.1 December 2006 - Adjusted fuel emission factor of lignite to be in line with Initial National Commu-
nication figures
2.0 June 2007 - Added data for FY 2005-06, including new stations and units commissioned
during 2005-06
- Some retroactive changes to data for FY 2000-01 to 2004-05
3.0 December 2007 - Added data for FY 2006-07, including new stations and units commissioned
during 2006-07
- Adapted calculations and User Guide to ensure consistency with new CDM
methodologies: ACM0002 Version 07, and Tool to Calculate the Emission Fac-
tor for an Electricity System (Version 01.1, EB 35 Annex 12)
4.0 October 2008 - Added data for FY 2007-08, including new stations and units commissioned
during 2007-08
- Adjusted delineation of regional grids
- Adjusted IPCC-based fuel emission factors to account for uncertainty in line
with EB 35 Annex 12
5.0 November 2009 - Added data for FY 2008-09, including new stations and units commissioned
during 2008-09
6.0 March 2011 - Added data for FY 2009-10, including new stations and units commissioned
during 2009-10
7.0 January 2012 - Added data for FY 2010-11, including new stations and units commissioned
during 2010-11
8.0 January 2013 - Added data for FY 2011-12, including new stations and units commissioned
during 2011-12
- From FY 2011-12, scope of database is restricted to stations exceeding 25 MW
- Retroactive changes: Three units in NEWNE region identified as CDM units,
leading to minor change in build margin for FY 2010-11
9.0 December 2013
- Added data for FY 2012-13, including new stations and units commissioned
during 2012-13
- Retroactive changes: Nine units identified as CDM units, leading to changes in
build margins back to FY 2009-10
- Updated GCVs of five stations back to FY 2008-09
10.0 December 2014 - Added data for FY 2013-14, including new stations and units commissioned
during 2013-14
- Introduced distinction between Indian and imported coal as from FY 2013-14
- Retroactive changes to previous FY due to: identification of CDM units, identifi-
cation of waste heat recovery steam turbines, harmonization of GCV for oil used
as secondary fuel
- One station was reclassified from SR to NEWNE region
Expert Team Contributing to the Database
Central Electricity Authority First Climate
Mr B.K.Sharma, Chief Engineer (C&E) Mr. Urs Brodmann, Managing Director
Mr. Praveen Gupta, Director (C&E) Mr. Dominik Englert, Senior Consultant
Mr. Rajesh Kumar, Deputy Director (C&E) Mrs. Barla Vieli, Project Manager
Mr K.K.Sharma, Assistant Director (C&E)
III
Contents
Summary .............................................................................................................................. 1
1 Background and Objective .......................................................................................... 2
2 How to Use the Database............................................................................................. 5
3 Scope of Database ....................................................................................................... 7
4 Data and Calculation Approach................................................................................... 8
4.1 Base Data............................................................................................................. 8
4.2 Annual Data.......................................................................................................... 9
4.3 Calculation of CO2 Emissions ............................................................................. 11
4.4 Adjustment for Inter-Grid and Cross-Border Electricity Transfers........................ 13
4.5 Conservativeness............................................................................................... 13
5 Results ........................................................................................................................ 14
5.1 Results for Fiscal Year 2013-14.......................................................................... 14
5.2 Developments over Time.................................................................................... 15
5.3 Changes compared to Previous Database Versions........................................... 19
6 User Examples............................................................................................................ 21
7 Updating Procedure ................................................................................................... 24
8 Further Information .................................................................................................... 24
Appendix A – Systems in India’s Grids............................................................................ 25
Appendix B – Assumptions for CO2 Emission Calculations........................................... 28
Appendix C – Grid Emission Factors ............................................................................... 29
Appendix D – Summary of Methodology ACM0002 / Version 15.0.0 .............................. 31
Appendix E – Abbreviations ............................................................................................. 32
1
Summary
Since the emergence of the Kyoto Protocol and its Clean Development Mechanism (CDM),
energy projects lowering the carbon intensity of the electricity grid can generate additional
revenues from carbon credits. Methodologies approved by the CDM Executive Board have to
be applied to determine the resulting emission reductions, using the “baseline” CO2 emission
factor of the relevant geographical area.
In order to facilitate adoption of authentic baseline emissions data and also to ensure uni-
formity in the calculations of CO2 emission reductions by CDM project developers, Central
Electricity Authority (CEA) has compiled a database containing the necessary data on CO2
emissions for all grid-connected power stations in India.
The Indian electricity system is divided into two grids, the Integrated Northern, Eastern,
Western, and North-Eastern regional grids (NEWNE) and the Southern Grid. Each grid cov-
ers several states. As the grids are interconnected, there is inter-state and inter-regional ex-
change. A small power exchange also takes place with the neighbouring countries Bhutan
and Nepal. For each of the two grids, the main emission factors are calculated in accordance
with the relevant CDM methodologies. CEA will continue updating the database at the end of
each fiscal year.
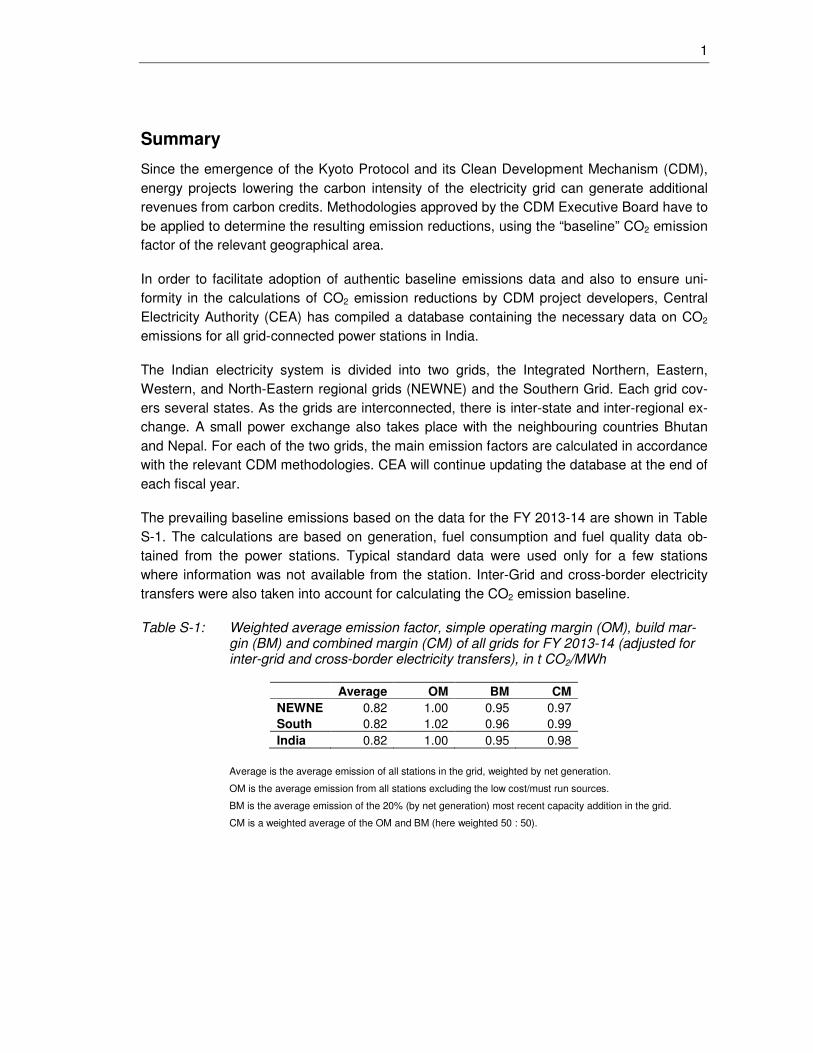
The prevailing baseline emissions based on the data for the FY 2013-14 are shown in Table
S-1. The calculations are based on generation, fuel consumption and fuel quality data ob-
tained from the power stations. Typical standard data were used only for a few stations
where information was not available from the station. Inter-Grid and cross-border electricity
transfers were also taken into account for calculating the CO2 emission baseline.
Table S-1: Weighted average emission factor, simple operating margin (OM), build mar-gin (BM) and combined margin (CM) of all grids for FY 2013-14 (adjusted for inter-grid and cross-border electricity transfers), in t CO2/MWh
Average OM BM CM
NEWNE 0.82 1.00 0.95 0.97
South 0.82 1.02 0.96 0.99
India 0.82 1.00 0.95 0.98
Average is the average emission of all stations in the grid, weighted by net generation.
OM is the average emission from all stations excluding the low cost/must run sources.
BM is the average emission of the 20% (by net generation) most recent capacity addition in the grid.
CM is a weighted average of the OM and BM (here weighted 50 : 50).
2
1 Background and Objective
Purpose of the CO2 Database
The Clean Development Mechanism (CDM) under the Kyoto Protocol to United Nations
Framework Convention on Climate Change (UNFCCC) provides an opportunity for the Indian
power sector to earn revenue through the reduction of greenhouse gas emissions (GHG),
particularly carbon dioxide (CO2). India has tremendous potential for CDM projects. Power
generation based on higher efficiency technologies such as supercritical technology, inte-
grated gasification combined cycle, and renovation and modernisation of old thermal power
plants, co-generation along with renewable energy sources are some of potential candidates
for CDM in the power sector. Energy efficiency and conservation projects also present them-
selves as eligible CDM projects, as these would also result in energy savings and displace
associated CO2 emissions which otherwise would be produced by grid-connected power sta-
tions.
The CDM has by now become an established mechanism for crediting climate friendly pro-
jects. Projects involving displacement or saving of grid electricity must calculate their emis-
sion reductions based on a grid emission factor which needs to be determined in accordance
with the rules set by the CDM Executive Board. Central Electricity Authority (CEA) accord-
ingly took up to compile a database for all grid-connected power stations in India. The pur-
pose of the database is to establish authentic and consistent quantification of the CO2 emis-
sion baseline which can be readily used by CDM project developers in the Indian power sec-
tor. This would enhance the acceptability of Indian projects and would also expedite the
clearance/approval process. The baseline emissions for the grids are given in Section 5 (Re-
sults) of this User Guide. The complete updated CO2 Database (Microsoft Excel File) and
this User Guide along with all previous versions is available on the website of Central Elec-
tricity Authority: www.cea.nic.in.
The purpose of this User Guide is to provide a ready reference to the underlying calculations
and assumptions used in the CO2 database and to summarise the key results.
Official Status of the Database
The database is an official publication of the Government of India for the purpose of CDM
baselines. It is based on the most recent data available with the Central Electricity Authority.
3
Consistency of the Database with CDM Methodologies
Under the CDM, emission reductions must be quantified using an approved methodology.
Key examples of such methodologies include AMS-I.D and ACM0002 for grid-connected
power generation from renewable sources in small and large- scale projects, respectively.
The latest versions of all approved CDM methodologies are available at the official CDM
website, http://cdm.unfccc.int.
In addition, the CDM Executive Board has adopted a methodological tool to facilitate the cal-
culation of baseline emission factors for electricity grids.1 This tool, which is referred to as the
Grid Tool in this user guide, has become the main reference for CDM methodologies involv-
ing baseline emission factors for power grids, such as ACM0002.
This version of the database is designed to be consistent with version 4.0 of the Tool
to calculate the emission factor for an electricity system published by the CDM
Executive Board.
Installed Capacity
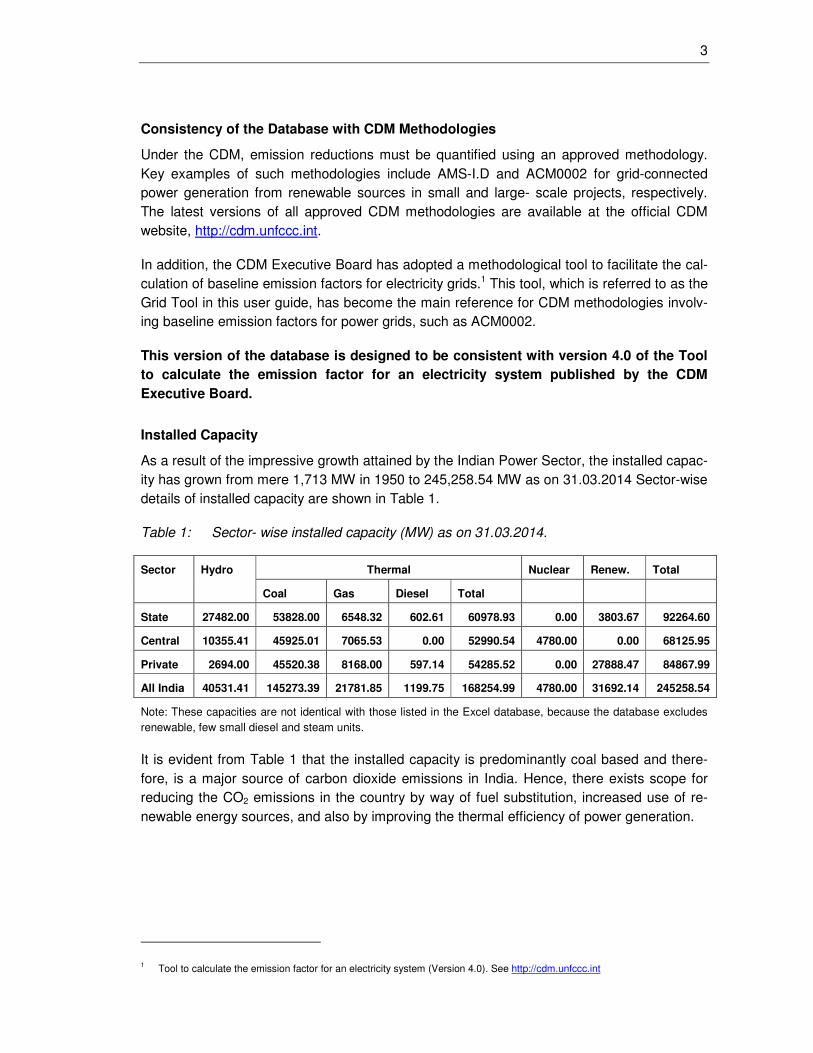
As a result of the impressive growth attained by the Indian Power Sector, the installed capac-
ity has grown from mere 1,713 MW in 1950 to 245,258.54 MW as on 31.03.2014 Sector-wise
details of installed capacity are shown in Table 1.
Table 1: Sector- wise installed capacity (MW) as on 31.03.2014.
Thermal Nuclear Renew. Total Sector Hydro
Coal Gas Diesel Total
State 27482.00 53828.00 6548.32 602.61 60978.93 0.00 3803.67 92264.60
Central 10355.41 45925.01 7065.53 0.00 52990.54 4780.00 0.00 68125.95
Private 2694.00 45520.38 8168.00 597.14 54285.52 0.00 27888.47 84867.99
All India 40531.41 145273.39 21781.85 1199.75 168254.99 4780.00 31692.14 245258.54
Note: These capacities are not identical with those listed in the Excel database, because the database excludes
renewable, few small diesel and steam units.
It is evident from Table 1 that the installed capacity is predominantly coal based and there-
fore, is a major source of carbon dioxide emissions in India. Hence, there exists scope for
reducing the CO2 emissions in the country by way of fuel substitution, increased use of re-
newable energy sources, and also by improving the thermal efficiency of power generation.
1 Tool to calculate the emission factor for an electricity system (Version 4.0). See http://cdm.unfccc.int
4
Indian Grids
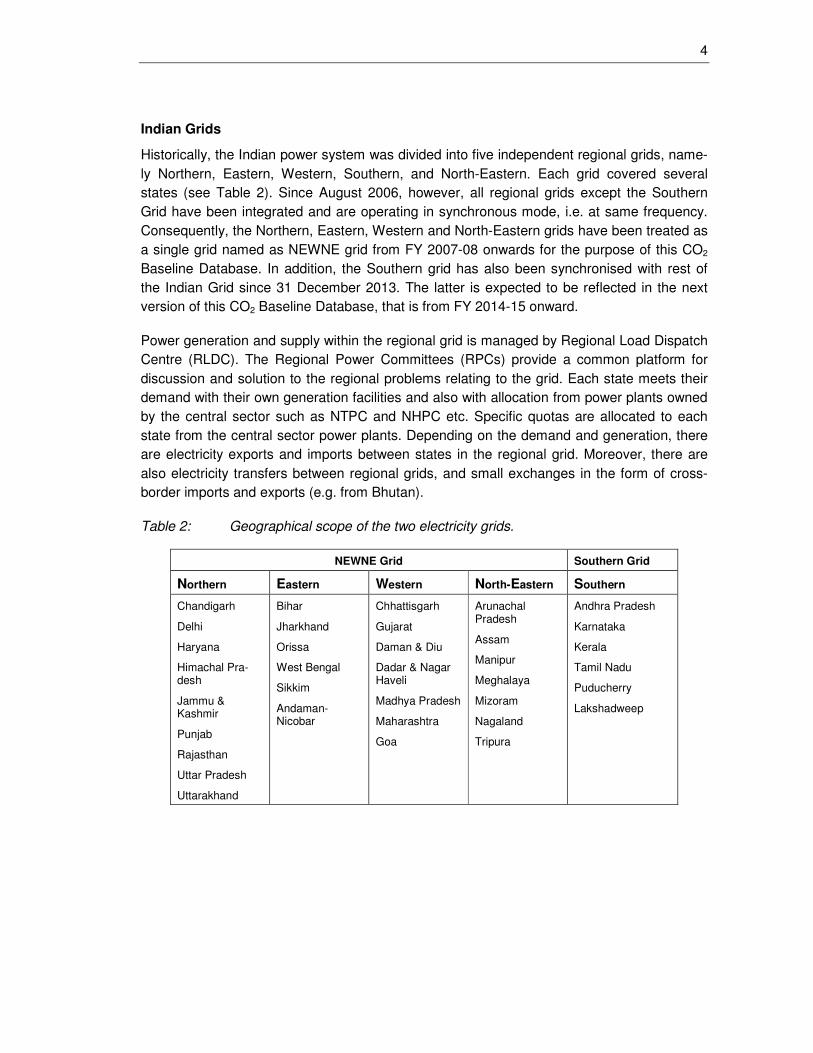
Historically, the Indian power system was divided into five independent regional grids, name-
ly Northern, Eastern, Western, Southern, and North-Eastern. Each grid covered several
states (see Table 2). Since August 2006, however, all regional grids except the Southern
Grid have been integrated and are operating in synchronous mode, i.e. at same frequency.
Consequently, the Northern, Eastern, Western and North-Eastern grids have been treated as
a single grid named as NEWNE grid from FY 2007-08 onwards for the purpose of this CO2
Baseline Database. In addition, the Southern grid has also been synchronised with rest of
the Indian Grid since 31 December 2013. The latter is expected to be reflected in the next
version of this CO2 Baseline Database, that is from FY 2014-15 onward.
Power generation and supply within the regional grid is managed by Regional Load Dispatch
Centre (RLDC). The Regional Power Committees (RPCs) provide a common platform for
discussion and solution to the regional problems relating to the grid. Each state meets their
demand with their own generation facilities and also with allocation from power plants owned
by the central sector such as NTPC and NHPC etc. Specific quotas are allocated to each
state from the central sector power plants. Depending on the demand and generation, there
are electricity exports and imports between states in the regional grid. Moreover, there are
also electricity transfers between regional grids, and small exchanges in the form of cross-
border imports and exports (e.g. from Bhutan).
Table 2: Geographical scope of the two electricity grids.
NEWNE Grid Southern Grid
Northern Eastern Western North-Eastern Southern
Chandigarh
Delhi
Haryana
Himachal Pra-desh
Jammu & Kashmir
Punjab
Rajasthan
Uttar Pradesh
Uttarakhand
Bihar
Jharkhand
Orissa
West Bengal
Sikkim
Andaman-Nicobar
Chhattisgarh
Gujarat
Daman & Diu
Dadar & Nagar Haveli
Madhya Pradesh
Maharashtra
Goa
Arunachal Pradesh
Assam
Manipur
Meghalaya
Mizoram
Nagaland
Tripura
Andhra Pradesh
Karnataka
Kerala
Tamil Nadu
Puducherry
Lakshadweep
5
2 How to Use the Database
Structure of the Database
Emission reductions from CDM projects in the power sector are calculated based on the net
electricity generated by the project, and the difference between the emission factors (in t
CO2/MWh) of the baseline and the project activity. The baseline emission factor reflects the
carbon intensity of the displaced grid electricity. This baseline emission factor can be derived
from the data provided in the CO2 Database.
Specifically, the database contains the following elements:
• Worksheet “Data” provides the net generation and the absolute and specific CO2 emis-
sions of each grid-connected power station (see Section 4 for exceptions). It also indi-
cates which stations and units were included in the operating margin and build margin,
respectively.
• Worksheet “Results” provides the most commonly used aggregate emission factors.
These are calculated from the station data in accordance with the most recent Grid
Tool.2 The emission factors are explained in more detail in the next section.
• Worksheet “Abbreviations” explains the abbreviations used in the “Data” worksheet.
• Worksheet “Assumptions” shows the assumptions that were used for the calculation of
the CO2 emissions at station and unit level, to the extent required.
• Worksheet “Transfers” shows the inter-Grid and cross-border power transfers.
Different Types of Emission Factors
The CDM methodologies which have been approved to date by the CDM Executive Board
distinguish a range of different emission factors. In the Indian context, the following four are
most relevant, and were therefore calculated for each regional grid based on the underlying
station data:
Weighted average:
The weighted average emission factor describes the average CO2 emitted per unit of electric-
ity generated in the grid. It is calculated by dividing the absolute CO2 emissions of all power
stations in the region by the region’s total net generation. Net generation from so-called low-
cost/must-run sources (hydro and nuclear) is included in the denominator.
2 Tool to calculate the emission factor for an electricity system (Version 4.0). See http://cdm.unfccc.int

6
Simple operating margin (OM):
The operating margin describes the average CO2 intensity of the existing stations in the grid
which are most likely to reduce their output if a CDM project supplies electricity to the grid (or
reduces consumption of grid electricity). “Simple” denotes one out of four possible variants
listed in the Grid Tool for calculating the operating margin.3 Furthermore, option A has been
selected as the required disaggregated data is available in India.
The simple operating margin is the weighted average emissions rate of all generation
sources in the region except so-called low-cost or must-run sources. In India, hydro and nu-
clear stations qualify as low-cost/must-run sources and are excluded. The operating margin,
therefore, can be calculated by dividing the region’s total CO2 emissions by the net genera-
tion of all thermal stations. In other words, it represents the weighted average emissions rate
of all thermal stations in the regional grid.
Values for operating margins given in this User Guide and the Database are always based
on the “ex post” option as set out in the Grid Tool.4
Build margin (BM):
The build margin reflects the average CO2 intensity of newly built power stations that will be
(partially) replaced by a CDM project. In accordance with the Grid Tool, the build margin is
calculated in this database as the average emissions intensity of the 20% most recent capac-
ity additions in the grid based on net generation. Depending on the region, the build margin
covers units commissioned in the last five to ten years.
Combined margin (CM):
The combined margin is a weighted average of the simple operating margin and the build
margin. By default, both margins have equal weights (50%). However, CDM project develop-
ers may choose to argue for different weights. In particular, for intermittent and non-
dispatchable generation types such as wind and solar photovoltaic, the Grid Tool allows to
weigh the operating margin and build margin at 75% and 25%, respectively. However, the
combined margins shown in the database are calculated based on equal weights.
In line with the Grid Tool, if a station is registered as a CDM activity, it is excluded from the
build margin but not from the operating margin.5
3 The two variants “Simple adjusted operating margin” and “Dispatch data analysis operating margin” cannot currently be
applied in India due to lack of necessary data.
4 See Tool to calculate the emission factor for an electricity system (Version 4.0).
5 See Tool to calculate the emission factor for an electricity system (Version 4.0), pp. 10 and 20f
7
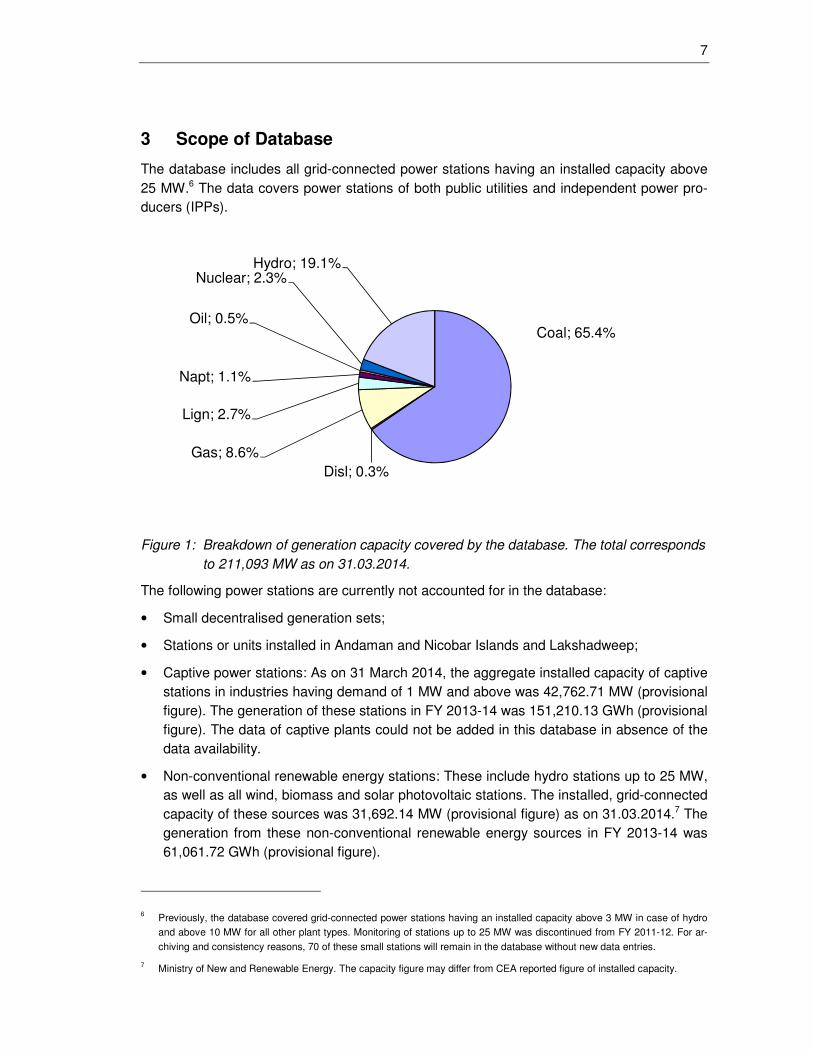
3 Scope of Database
The database includes all grid-connected power stations having an installed capacity above
25 MW.6 The data covers power stations of both public utilities and independent power pro-
ducers (IPPs).
Coal; 65.4%
Disl; 0.3%
Gas; 8.6%
Lign; 2.7%
Napt; 1.1%
Oil; 0.5%
Nuclear; 2.3%Hydro; 19.1%
Figure 1: Breakdown of generation capacity covered by the database. The total corresponds
to 211,093 MW as on 31.03.2014.
The following power stations are currently not accounted for in the database:
• Small decentralised generation sets;
• Stations or units installed in Andaman and Nicobar Islands and Lakshadweep;
• Captive power stations: As on 31 March 2014, the aggregate installed capacity of captive
stations in industries having demand of 1 MW and above was 42,762.71 MW (provisional
figure). The generation of these stations in FY 2013-14 was 151,210.13 GWh (provisional
figure). The data of captive plants could not be added in this database in absence of the
data availability.
• Non-conventional renewable energy stations: These include hydro stations up to 25 MW,
as well as all wind, biomass and solar photovoltaic stations. The installed, grid-connected
capacity of these sources was 31,692.14 MW (provisional figure) as on 31.03.2014.7 The
generation from these non-conventional renewable energy sources in FY 2013-14 was
61,061.72 GWh (provisional figure).
6 Previously, the database covered grid-connected power stations having an installed capacity above 3 MW in case of hydro
and above 10 MW for all other plant types. Monitoring of stations up to 25 MW was discontinued from FY 2011-12. For ar-
chiving and consistency reasons, 70 of these small stations will remain in the database without new data entries.
7 Ministry of New and Renewable Energy. The capacity figure may differ from CEA reported figure of installed capacity.
8
4 Data and Calculation Approach
This section gives an overview on the base data, annual data as well as the approaches
used to calculate station-level and unit-level CO2 emissions.
4.1 Base Data
The following base data parameters were collected for all the stations listed in the CO2 data-
base:
• SNo:
The Station Numbers start at 1 in each regional grid. The numbering has been introduced
for unambiguous referral to each station and to allow for the insertion of additional sta-
tions in a region without having to change the numbers of other regions. All units of a sta-
tion have the same station number. Numbers may change in future database versions.
• Station Name
Name of the power station
• Unit Number:
The units of a station are numbered serially starting with 1. Stations are attributed with
unit number 0 for the purpose of calculations.
• Commissioning Date:
The commissioning date is provided for each unit. Commissioning dates are important for
the determination of the build margin.
• Capacity:
Capacity data is based on declared rated capacities in MW for each unit as of 31st March
2014.
• Grid:
Grid to which the station is connected to. The table below gives the codes for the different
grids used in the database:
Table 3: Code for grids used in the database
Name of the Grid Code
NEWNE Grid (covering former Northern, Eastern, Western and North-Eastern regions) NEWNE
Southern Grid SR
• State:
State where the power station is located.
• Sector:
This denotes whether the station is operated by the central sector, the state authorities,
or the private sector.
• System:
A list of the systems including abbreviations and full names is provided in Appendix A.
9
• Type:
Indicates the type of the station, viz. thermal, nuclear, hydro.
• Fuel:
Fuel 1 and Fuel 2 indicates the main fuels used for power generation at each station. For
example, in coal based stations, Coal is indicated as Fuel 1 and Oil as Fuel 2.
4.2 Annual Data
The annual data columns in the database provide the following: net generation in GWh of the
station, absolute carbon dioxide emissions in metric tonnes, and specific carbon dioxide
emissions in t CO2/MWh, for the five fiscal years 2009-10 to 2013-14. In addition, there are
columns to indicate whether the station is included in the operating margin in the respective
year, and an additional column indicating which units are included in the build margin. If a
unit is part of a registered CDM activity, it is excluded from the build margin, and the CDM
registration number is indicated in the respective column.
CEA has compiled the CO2 Database based upon generation, fuel consumption and fuel
gross calorific value (GCV) data furnished by each power station. In cases where the station
could not provide reliable data for all the relevant parameters, assumptions were made as
described below. Further details on the assumptions made are provided in Appendix B.
a) Assumptions at Station Level
At the station level, the following assumptions were made where the relevant data could not
be provided by a station:
Net generation:
For hydro stations, only gross generation was available, but not net generation data. There-
fore, the CEA standard value for auxiliary power consumption in hydro units (0.5%) was ap-
plied to derive the net generation from the gross generation data reported by the stations.
Likewise, CEA standard values for auxiliary power consumption had to be applied for some
thermal stations.
Gross Calorific Value (GCV):
Default values were used for some thermal stations where station-specific GCVs were not
available.
If the station consists just of one unit, the assumptions at unit level were applied to the sta-
tion level.
b) Assumptions at Unit Level
At unit level, the following assumptions were made for those units falling into the build margin
(i.e. the most recently built units comprising 20% of net generation):
Gross generation:
For some stations, gross generation data were not available at unit level. Therefore the plant

10
load factor of the respective station was used to derive the gross generation of the units. For
units commissioned after the start of the relevant fiscal year, the gross generation was fur-
ther adjusted pro rata the number of days since commissioning.
Net generation:
Net generation data is increasingly being reported at unit level by thermal stations. Two dis-
tinct approaches were applied to estimate net generation where unit level data was not avail-
able.
1. The auxiliary consumption (in % of gross generation) of the unit was assumed to be equal
to that of the respective stations in the following cases:
i. All units of a station fall into the build margin; or
ii. All units of a station have the same installed capacity; or
iii. The units in the station have different capacities but do not differ with respect to the
applicable standard auxiliary consumption; or
iv. If the default auxiliary power consumption for that type of generation unit is higher
than the observed auxiliary power consumption of the station concerned, and the rel-
evant unit is among the largest in that station.
2. In a few other cases, standard values for auxiliary consumption adopted by CEA were
applied.
Fuel consumption and GCV:
In case, Fuel consumption and GCV are not reported at unit level by thermal stations, the
specific CO2 emissions of the units coming in the build margin could usually be assumed to
be equal to the values of the respective station. See Section 4.3 for details.
11
4.3 Calculation of CO2 Emissions
Calculation Approach – Station Level
CO2 emissions of thermal stations were calculated using the formula below:
∑=
×××=
2
1
,,2 )(i
iiyiyiy OxidEFGCVFuelConstationAbsCO ( 1 )
Where:
AbsCO2,y Absolute CO2 emission of the station in the given fiscal year ‘y’
FuelConi,y Amount of fuel of type i consumed in the fiscal year ‘y’
GCVi,y Gross calorific value of the fuel i in the fiscal year ‘y’
EFi CO2 emission factor of the fuel i based on GCV
Oxidi Oxidation factor of the fuel i
The emission and oxidation factors used in the CO2 Database are provided in Appendix B.
The emission factors for Indian coal and lignite were based on the values provided in India’s
Initial National Communication under the UNFCCC (Ministry of Environment & Forests,
2004). The emission factor for coal is supported by the results of an analysis of approx. 120
coal samples collected from different Indian coal fields. Since the values in the National
Communication are based on the NCV (Net Calorific Value), they were converted to GCV
basis using a formula also furnished in the National Communication. For all other fuels as
well as for imported coal, default emission factors were derived from the IPCC 2006 Guide-
lines.8 In line with the Grid Tool, the low end values of the 95% confidence intervals indicated
by IPCC were used.9 The IPCC default factors were converted to GCV basis using IEA de-
fault conversion factors.
The oxidation factor for Indian coal and lignite was derived from an analysis performed with
data on the unburnt carbon content in the ash from various Indian coal-fired power stations.
The value of 98% is consistent with the default value provided in the IPCC 1996 Guide-
lines.10 For all other fuels as well as imported coal, default values provided in the more recent
IPCC 2006 Guidelines were used.
Specific CO2 emissions of stations (SpecCO2(station)y) were computed by dividing the abso-
lute emissions (AbsCO2(station)y) estimated above by the station’s net generation (Net-
Gen(station)y).
8 2006 IPCC Guidelines for National Greenhouse Gas Inventories, Volume 2: Energy, Table 1.4
9 In accordance with the Tool to calculate the emission factor for an electricity system, Version 4.0
10 IPCC 1996 Revised Guidelines for National Greenhouse Gas Inventories, Volume 3 (Reference Manual), p.1.13
12
y
y
ystationNetGen
stationAbsCOstationSpecCO
)(
)()(
2
2 = ( 2 )
In FY 2013-14, fuel consumption was not available for three stations with very low gross
generation (< 100 GWh). In these few cases, conservative standard values have been ap-
plied for the specific emissions of the respective station.
Calculation Approach – Unit Level
Unit-level CO2 emissions were only calculated for units falling in the build margin.
Wherever reliable fuel consumption data was available at unit level, it was used for determin-
ing the emissions of units falling in the build margin, in the same way as for the station emis-
sions. This applies for an increasing number of thermal units, especially new and large coal-
fired stations.
In the remaining cases where unit-level fuel consumption was not available, the absolute
CO2 emissions of thermal units (AbsCO2(unit)y) were derived by multiplying the specific
emissions (SpecCO2(unit)y) with the net generation of each unit (NetGen(unit)y), where net
generation was obtained as described in Section 4.2:
yyy unitNetGenunitSpecCOunitAbsCO )()()(22
×= ( 3 )
Two distinct approaches were applied for determining the specific emissions of these units:
1. A unit was assumed to have the same specific emissions as the corresponding station in
the following three cases:
i. If all units of a station fall into the build margin;
ii. If all units of a station have the same installed capacity;
iii. If the default specific emissions for the respective unit is higher than the correspond-
ing station’s specific emissions, and the concerned unit is capacity-wise among the
largest of the station.
The large majority of units for which fuel consumption was not reported fall in one of the
above-mentioned three categories.
2. In the remaining cases, the specific emissions of the units were derived from conservative
standard heat rate values (see Appendix B). In FY 2013-14, this was required for 17 units.
13
4.4 Adjustment for Inter-Grid and Cross-Border Electricity Transfers
The weighted average emission factors and operating margins of each grid were adjusted for
inter-grid and cross-border electricity imports and exports, in line with the Grid Tool:
• The relevant amounts of electricity imported and exported are listed in the database
worksheet “Transfers”;
• The CO2 emissions associated with these imports were quantified based on the simple
operating margin of the exporting grid.11
4.5 Conservativeness
The need to ensure conservativeness of calculations in situations of uncertainty is a funda-
mental principle in the CDM. Assumptions are conservative if they tend to reduce the number
of emission reductions being credited to a CDM project activity. The following approaches
and assumptions contribute to the conservativeness of the database:
• The quality of station-level data was ensured through extensive plausibility testing and
interaction with the station operators.
• In cases of data gaps at station level, standard data from CEA were used. For example,
standard auxiliary power consumption was assumed for a number of diesel- and some
coal-fired stations. Comparison with monitored values shows that these standard values
are rather conservative, i.e. they lead to a somewhat lower heat rate and hence lower
emissions than observed in many stations.
• The fuel emission factors and oxidation factors used are generally consistent with IPCC
defaults and relevant EB guidance. For Indian coal, the emission factor provided in In-
dia’s Initial National Communication was used (95.8 t CO2/TJ on NCV basis). The oxida-
tion factor of 0.98 used for Indian coal appears to be conservative in light of recent effi-
ciency improvements in coal-fired generation. All other fuel emission factors represent
the lower limits of the respective 95% confidence intervals indicated by IPCC, as re-
quired by the CDM Executive Board.12
• The scope of the database remains conservative because of the exclusion of captive
power stations, which are generally thermal stations. As detailed in Section 3, genera-
tion from these captive stations remains far greater than the generation from non-
conventional renewable energy stations, which are also excluded. The overall effect of
these restrictions in scope is that the weighted average emission factor will tend to be
slightly understated.
11 This corresponds to Options a)+b) listed in the Grid Tool, (Version 4.0), p. 8
12 See Tool to calculate the emission factor for an electricity system (Version 4.0), p.29

14
5 Results
Worksheet “Results” in the database provides the net generation and CO2 emissions data
and the resulting emission factors for the two grids in the fiscal years 2009-10 to 2013-14.
The emission factors are also reproduced in Appendix C. The values are rounded off at two
decimals. See database file for additional decimals.
5.1 Results for Fiscal Year 2013-14
Table 4 indicates the development of total emissions by grid over the last five years covered
by the database.
Table 4: Total emissions of the power sector by region for the FY 2009-10 to 2013-14, in million tonnes CO2
2009-10 2010-11 2011-12 2012-13 2013-14
NEWNE 453.3 469.7 497.8 547.2 572.1
South 126.8 128.7 140.0 149.3 155.3
India 580.1 598.4 637.8 696.5 727.4
Table 5 shows the emission factors for FY 2013-14 excluding inter-grid and cross-border
power transfers, whereas Table 6 shows the emission factors for the same year including
these power transfers.
Table 5: Weighted average emission factor, simple operating margin (OM), build mar-gin (BM) and combined margin (CM) of grids for FY 2013-14 (not adjusted for inter-grid and cross-country electricity transfers), in t CO2/MWh
Average OM BM CM
NEWNE 0.82 1.00 0.95 0.98
South 0.81 1.02 0.96 0.99
India 0.82 1.01 0.95 0.98
Table 6: Weighted average emission factor, simple operating margin (OM), build mar-gin (BM) and combined margin (CM) of grids for FY 2013-14 (adjusted for in-ter-grid and cross-country electricity transfers), in t CO2/MWh
Average OM BM CM
NEWNE 0.82 1.00 0.95 0.97
South 0.82 1.02 0.96 0.99
India 0.82 1.00 0.95 0.98
The observed variations in the emission factors between the different grids originate from the
differing availability and use of coal, gas and hydro resources. Stations fired with other fossil
fuels such as diesel as well as nuclear stations play a less significant role.
15
A comparison of Table 5 and Table 6 shows that electricity transfers between grids did not
have a significant influence on the emission factors in 2013-14.
Table 7 shows the weighted average specific emissions for fossil fuel-fired power stations in
the two grids. Inter-grid variations arise chiefly from differences in station age and build (in-
stalled capacity and conversion technology).
Table 7: Weighted average specific emissions for fossil fuel-fired stations in FY 2013-14, in t CO2/MWh.
Coal Diesel Gas* Lign Oil
NEWNE 1.03 - 0.49 1.31 0.70
South 1.02 0.62 0.49 1.41 0.60
India 1.03 0.62 0.49 1.38 0.63
* Only gas-fired stations that do not use any other fuel. Stations that use naptha, diesel or oil as a sec-
ond fuel are excluded from the weighted average.
Note: Stations for which assumptions had to be made are included in this analysis (see Section 4
for details).
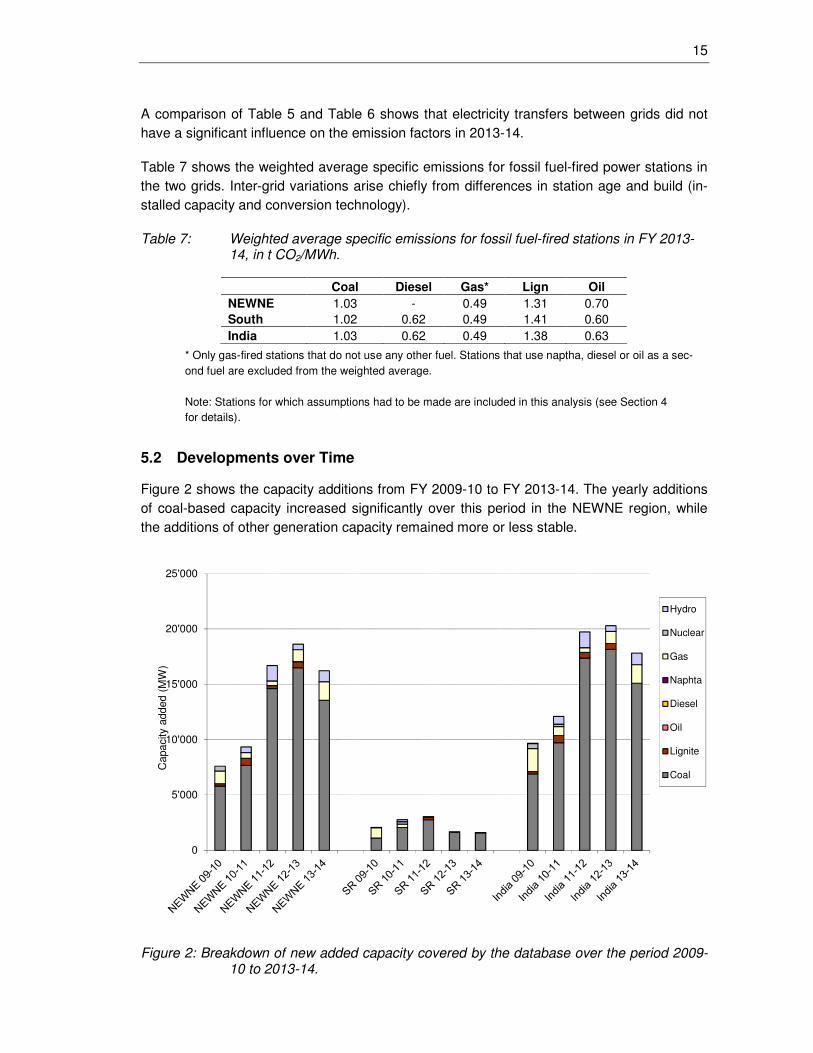
5.2 Developments over Time
Figure 2 shows the capacity additions from FY 2009-10 to FY 2013-14. The yearly additions
of coal-based capacity increased significantly over this period in the NEWNE region, while
the additions of other generation capacity remained more or less stable.
0
5'000
10'000
15'000
20'000
25'000
Capa
city
add
ed (
MW
)
Hydro
Nuclear
Gas
Naphta
Diesel
Oil
Lignite
Coal
Figure 2: Breakdown of new added capacity covered by the database over the period 2009-10 to 2013-14.
16
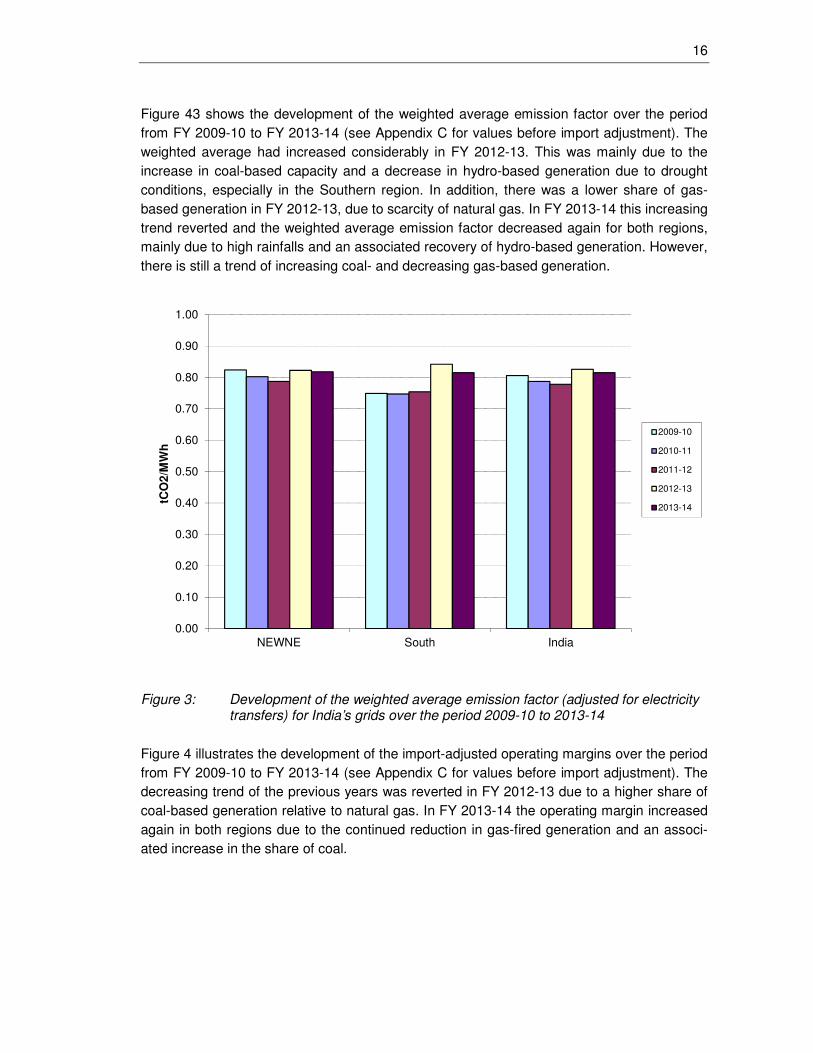
Figure 43 shows the development of the weighted average emission factor over the period
from FY 2009-10 to FY 2013-14 (see Appendix C for values before import adjustment). The
weighted average had increased considerably in FY 2012-13. This was mainly due to the
increase in coal-based capacity and a decrease in hydro-based generation due to drought
conditions, especially in the Southern region. In addition, there was a lower share of gas-
based generation in FY 2012-13, due to scarcity of natural gas. In FY 2013-14 this increasing
trend reverted and the weighted average emission factor decreased again for both regions,
mainly due to high rainfalls and an associated recovery of hydro-based generation. However,
there is still a trend of increasing coal- and decreasing gas-based generation.
0.00
0.10
0.20
0.30
0.40
0.50
0.60
0.70
0.80
0.90
1.00
NEWNE South India
tCO
2/M
Wh
2009-10
2010-11
2011-12
2012-13
2013-14
Figure 3: Development of the weighted average emission factor (adjusted for electricity transfers) for India’s grids over the period 2009-10 to 2013-14
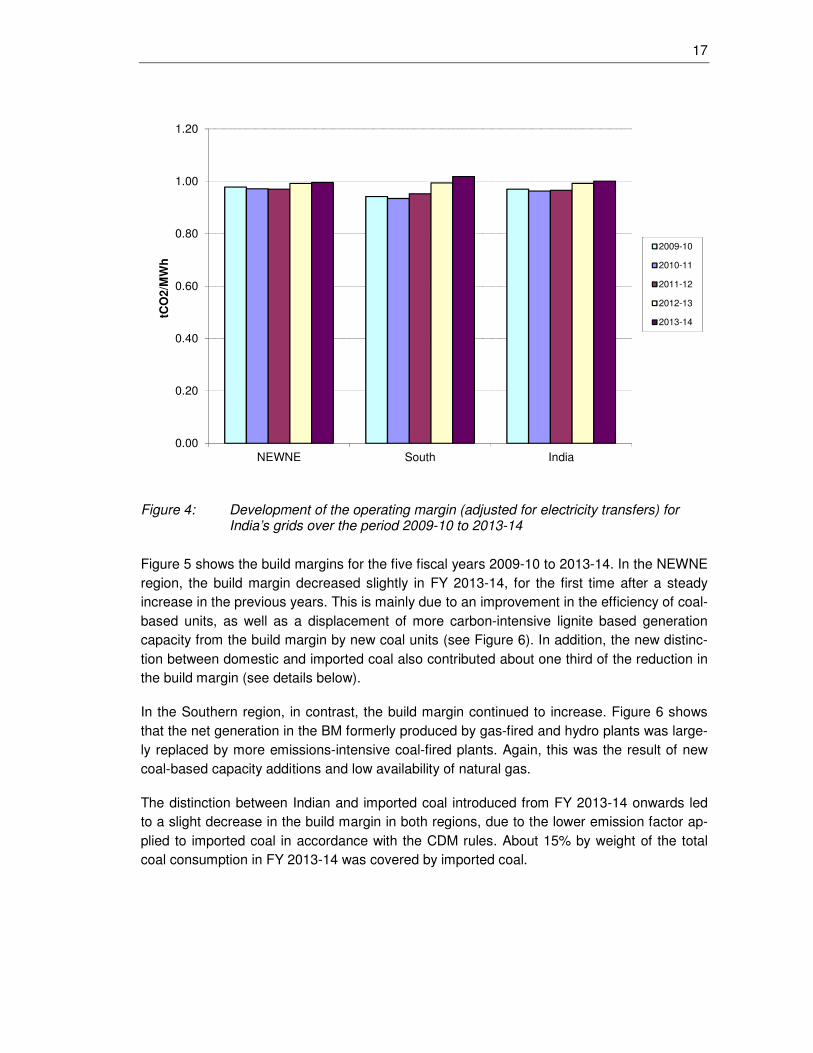
Figure 4 illustrates the development of the import-adjusted operating margins over the period
from FY 2009-10 to FY 2013-14 (see Appendix C for values before import adjustment). The
decreasing trend of the previous years was reverted in FY 2012-13 due to a higher share of
coal-based generation relative to natural gas. In FY 2013-14 the operating margin increased
again in both regions due to the continued reduction in gas-fired generation and an associ-
ated increase in the share of coal.
17
0.00
0.20
0.40
0.60
0.80
1.00
1.20
NEWNE South India
tCO
2/M
Wh
2009-10
2010-11
2011-12
2012-13
2013-14
Figure 4: Development of the operating margin (adjusted for electricity transfers) for India’s grids over the period 2009-10 to 2013-14
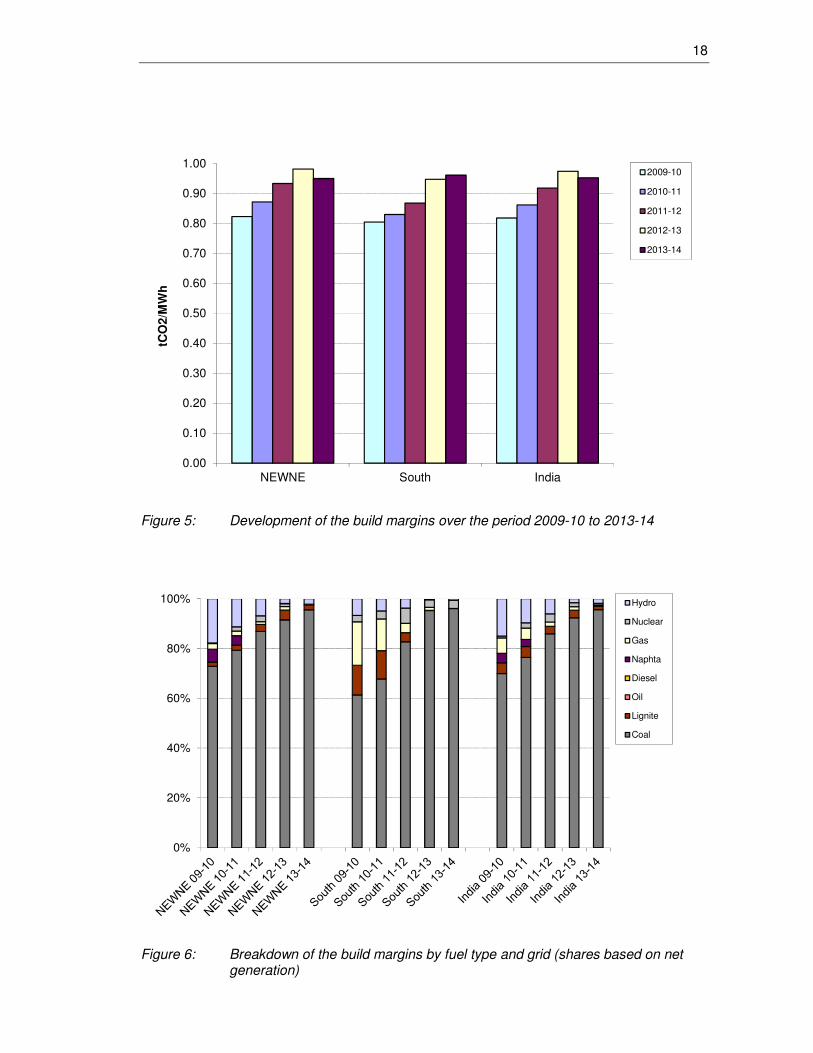
Figure 5 shows the build margins for the five fiscal years 2009-10 to 2013-14. In the NEWNE
region, the build margin decreased slightly in FY 2013-14, for the first time after a steady
increase in the previous years. This is mainly due to an improvement in the efficiency of coal-
based units, as well as a displacement of more carbon-intensive lignite based generation
capacity from the build margin by new coal units (see Figure 6). In addition, the new distinc-
tion between domestic and imported coal also contributed about one third of the reduction in
the build margin (see details below).
In the Southern region, in contrast, the build margin continued to increase. Figure 6 shows
that the net generation in the BM formerly produced by gas-fired and hydro plants was large-
ly replaced by more emissions-intensive coal-fired plants. Again, this was the result of new
coal-based capacity additions and low availability of natural gas.
The distinction between Indian and imported coal introduced from FY 2013-14 onwards led
to a slight decrease in the build margin in both regions, due to the lower emission factor ap-
plied to imported coal in accordance with the CDM rules. About 15% by weight of the total
coal consumption in FY 2013-14 was covered by imported coal.
18
0.00
0.10
0.20
0.30
0.40
0.50
0.60
0.70
0.80
0.90
1.00
NEWNE South India
tCO
2/M
Wh
2009-10
2010-11
2011-12
2012-13
2013-14
Figure 5: Development of the build margins over the period 2009-10 to 2013-14
0%
20%
40%
60%
80%
100% Hydro
Nuclear
Gas
Naphta
Diesel
Oil
Lignite
Coal
Figure 6: Breakdown of the build margins by fuel type and grid (shares based on net generation)
19
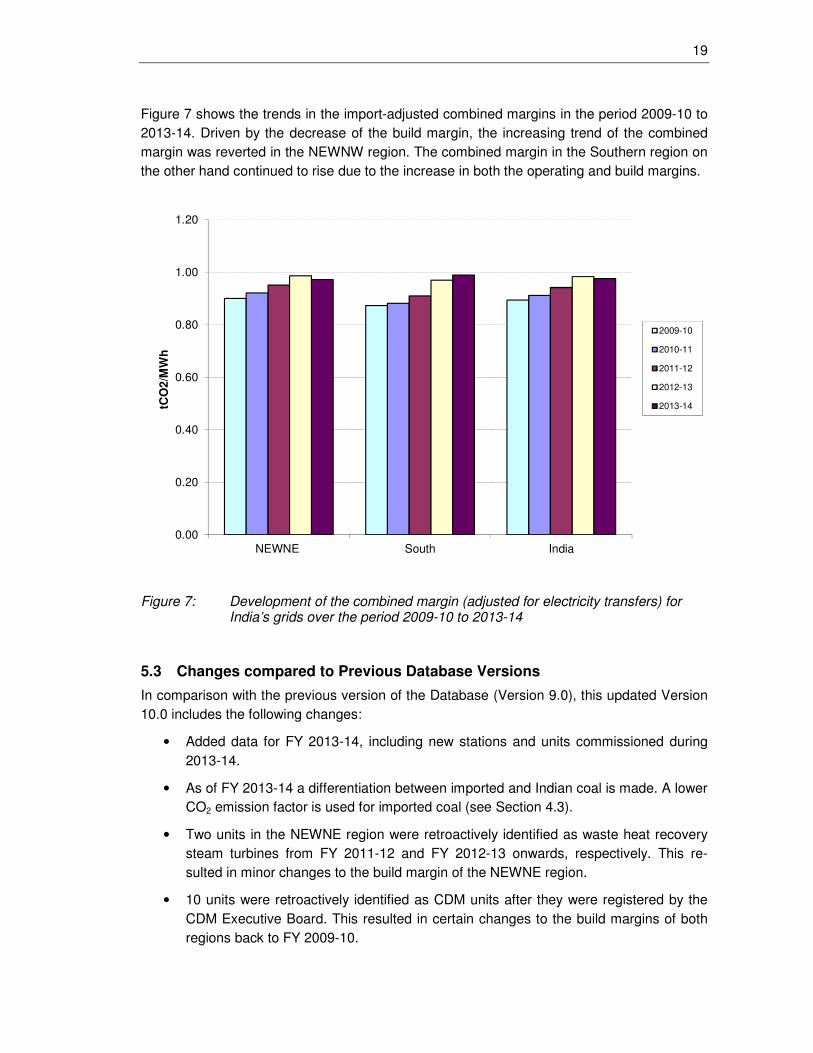
Figure 7 shows the trends in the import-adjusted combined margins in the period 2009-10 to
2013-14. Driven by the decrease of the build margin, the increasing trend of the combined
margin was reverted in the NEWNW region. The combined margin in the Southern region on
the other hand continued to rise due to the increase in both the operating and build margins.
0.00
0.20
0.40
0.60
0.80
1.00
1.20
NEWNE South India
tCO
2/M
Wh
2009-10
2010-11
2011-12
2012-13
2013-14
Figure 7: Development of the combined margin (adjusted for electricity transfers) for India’s grids over the period 2009-10 to 2013-14
5.3 Changes compared to Previous Database Versions
In comparison with the previous version of the Database (Version 9.0), this updated Version
10.0 includes the following changes:
• Added data for FY 2013-14, including new stations and units commissioned during
2013-14.
• As of FY 2013-14 a differentiation between imported and Indian coal is made. A lower
CO2 emission factor is used for imported coal (see Section 4.3).
• Two units in the NEWNE region were retroactively identified as waste heat recovery
steam turbines from FY 2011-12 and FY 2012-13 onwards, respectively. This re-
sulted in minor changes to the build margin of the NEWNE region.
• 10 units were retroactively identified as CDM units after they were registered by the
CDM Executive Board. This resulted in certain changes to the build margins of both
regions back to FY 2009-10.
20
• One station was reclassified from the Southern to the NEWNE region. This resulted in
small changes to the emission factors of both regions back to FY 2010-11.
• Where the GCV of oil used as secondary fuel was <9,600 or >10,600 it has retroac-
tively been replaced with its standard value of 10,100 (applies to FY 2012-13 and
2013-14).
• Two units have been added retroactively to the SR region.
The revised emission factors are provided in Appendix C and in the Database file.
21
6 User Examples
This section provides two illustrative examples of how the CO2 Database can be applied. The
examples are based on hypothetical renewable energy projects that differ in size and supply
different grids.
Project A is a grid-connected 5 MW small hydropower station located in the State of Assam
which belongs to the NEWNE Region. The station will be commissioned in 2015. Annual net
generation is projected at approx. 17’500 MWh.
• The project qualifies as a small-scale CDM activity since its capacity is below the 15 MW
threshold. Hence it will use the latest version of CDM methodology AMS-I.D for grid-
connected power generation from renewable energy sources.
• Methodology AMS-I.D gives two options for determining the baseline emission factor:
Either the weighted average emissions, or the combined margin of the grid. In this exam-
ple, it is assumed that the promoters choose the weighted average option. In addition, it
is assumed that the promoters choose to adjust the weighted average emission factor for
electricity imports, despite the fact that this is not mandatory under AMS-I.D.
• In the PDD, the expected emission reductions achieved by the hydro station are pro-
jected based on the expected annual generation, and the import-adjusted weighted aver-
age emission factor for the NEWNE Grid in the most recent year for which data is avail-
able (2013-14). The corresponding value is 0.82 t CO2/MWh. Hence the absolute emis-
sion reductions are projected at 0.82 * 17’500 = 14,350 t CO2/yr. The emission reductions
are equal to the baseline emissions, since the project does not result in greenhouse gas
emissions of its own.
• In accordance with AMS-I.D, the promoters will determine the actual baseline emission
factor ex post. The actual emission reductions will then be calculated in each year of the
crediting period based on the observed net generation and the weighted average emis-
sion factor for the respective year.13 The latter would be published annually by CEA.
Project B is a 100 MW grid-connected wind farm located in the State of Tamil Nadu (South-
ern Grid). The project will be commissioned in 2015. Average net supplies to the grid are
projected at 312,500 MWh per year.
• The project exceeds the 15 MW threshold and thus qualifies as a large-scale CDM activ-
ity. Hence it is eligible to use the latest version of methodology ACM0002 for grid-
connected power generation from renewable energy sources.
• Under ACM0002, the combined margin approach is mandatory. In addition, inter-grid
power transfers (imports and exports) must be taken into account.
13 The emission factor of the previous year may be used instead. See Tool to calculate the emission factor for an electricity
system (Version 4.0), p.10
22
• In contrast to the first example, the promoters decide to fix the baseline emission factor
ex ante. That is, the baseline emission factor is determined based on the most recent da-
ta available, and remains fixed for the duration of the crediting period. The actual emis-
sion reductions will be calculated in each year based on the observed net generation and
the pre-defined baseline emission factor.
• For this ex ante-option, the Grid Tool referred to in the methodology ACM0002 requires
that the operating margin is calculated as the generation-weighted average of the three
most recent years (here 2011-12 to 2013-14).14 The operating margin to be applied thus
works out to 0.988 t CO2/MWh.
• Since wind is an intermittent energy source, the promoter is allowed to assign a weight of
75% to the operating margin, and 25% to the build margin. The resulting combined mar-
gin is 0.981 t CO2/MWh (75% x 0.988 + 25% x 0.96 for the FY 2013-14). This value is
used for projecting the emission reductions in the PDD as well as for calculating the ac-
tual emission reductions.
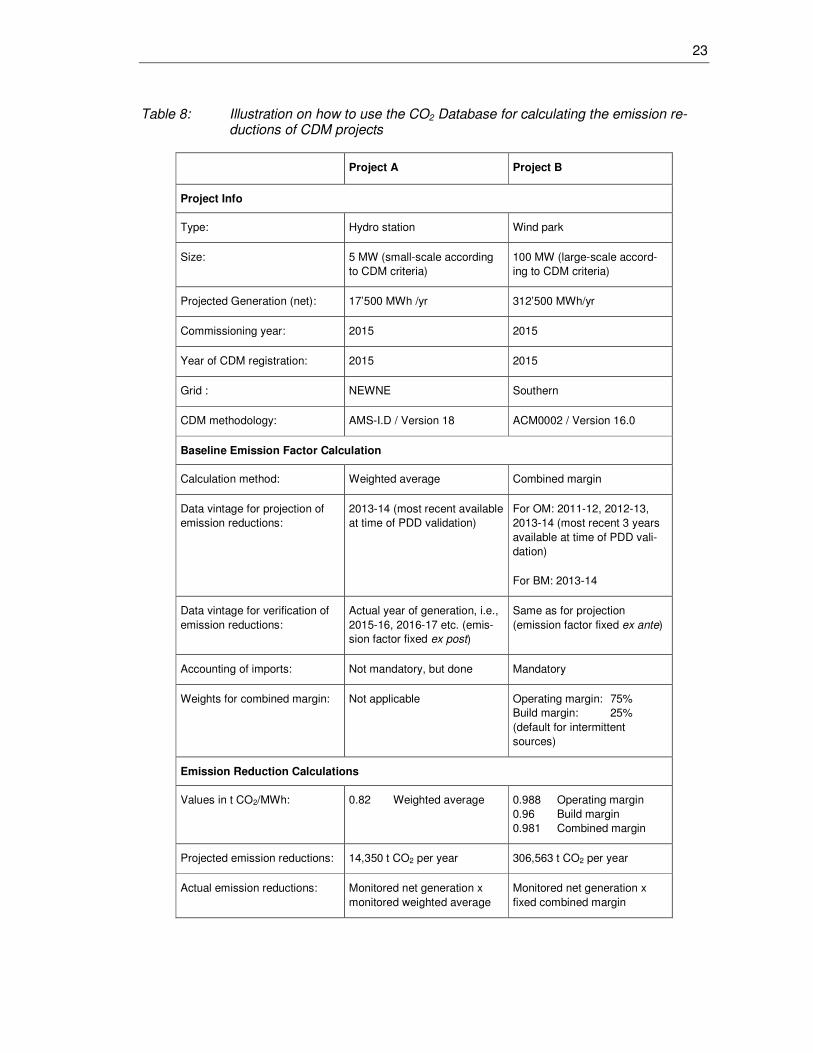
The two CDM project activities are summarised in Table 8 below.
14 See Tool to calculate the emission factor for an electricity system (Version 4.0), p.10
23
Table 8: Illustration on how to use the CO2 Database for calculating the emission re-ductions of CDM projects
Project A Project B
Project Info
Type: Hydro station Wind park
Size: 5 MW (small-scale according
to CDM criteria)
100 MW (large-scale accord-
ing to CDM criteria)
Projected Generation (net): 17’500 MWh /yr 312’500 MWh/yr
Commissioning year: 2015 2015
Year of CDM registration: 2015 2015
Grid : NEWNE Southern
CDM methodology: AMS-I.D / Version 18 ACM0002 / Version 16.0
Baseline Emission Factor Calculation
Calculation method: Weighted average Combined margin
Data vintage for projection of
emission reductions:
2013-14 (most recent available
at time of PDD validation)
For OM: 2011-12, 2012-13,
2013-14 (most recent 3 years
available at time of PDD vali-
dation)
For BM: 2013-14
Data vintage for verification of
emission reductions:
Actual year of generation, i.e.,
2015-16, 2016-17 etc. (emis-
sion factor fixed ex post)
Same as for projection
(emission factor fixed ex ante)
Accounting of imports: Not mandatory, but done Mandatory
Weights for combined margin: Not applicable Operating margin: 75%
Build margin: 25%
(default for intermittent
sources)
Emission Reduction Calculations
Values in t CO2/MWh:
0.82 Weighted average 0.988 Operating margin
0.96 Build margin
0.981 Combined margin
Projected emission reductions: 14,350 t CO2 per year 306,563 t CO2 per year
Actual emission reductions: Monitored net generation x
monitored weighted average
Monitored net generation x
fixed combined margin
24
7 Updating Procedure
The CO2 Database will be updated annually by CEA and made available on its website:
www.cea.nic.in. Previous versions will be archived by CEA and the main changes relative to
previous database versions will be documented.
8 Further Information
For any further information, contact by email:
Chief Engineer (C&E)
Central Electricity Authority
Sewa Bhawan
R. K. Puram, New Delhi-110066
Email: [email protected]
25
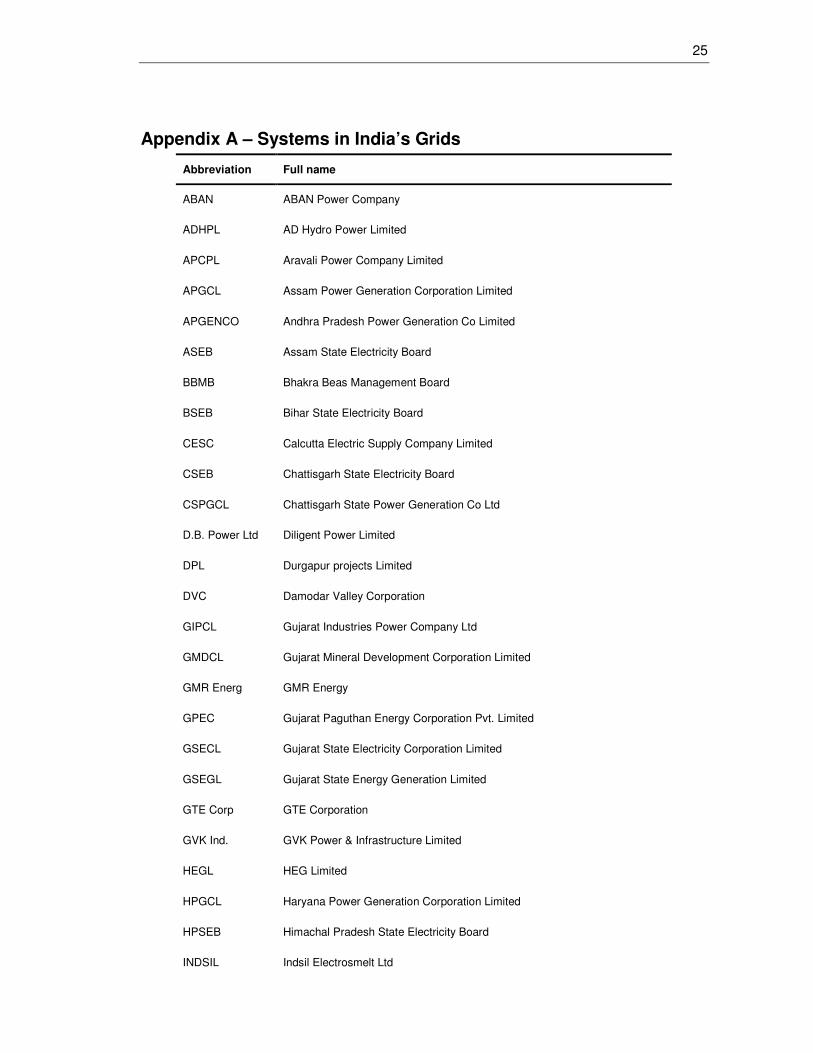
Appendix A – Systems in India’s Grids
Abbreviation Full name
ABAN ABAN Power Company
ADHPL AD Hydro Power Limited
APCPL Aravali Power Company Limited
APGCL Assam Power Generation Corporation Limited
APGENCO Andhra Pradesh Power Generation Co Limited
ASEB Assam State Electricity Board
BBMB Bhakra Beas Management Board
BSEB Bihar State Electricity Board
CESC Calcutta Electric Supply Company Limited
CSEB Chattisgarh State Electricity Board
CSPGCL Chattisgarh State Power Generation Co Ltd
D.B. Power Ltd Diligent Power Limited
DPL Durgapur projects Limited
DVC Damodar Valley Corporation
GIPCL Gujarat Industries Power Company Ltd
GMDCL Gujarat Mineral Development Corporation Limited
GMR Energ GMR Energy
GPEC Gujarat Paguthan Energy Corporation Pvt. Limited
GSECL Gujarat State Electricity Corporation Limited
GSEGL Gujarat State Energy Generation Limited
GTE Corp GTE Corporation
GVK Ind. GVK Power & Infrastructure Limited
HEGL HEG Limited
HPGCL Haryana Power Generation Corporation Limited
HPSEB Himachal Pradesh State Electricity Board
INDSIL Indsil Electrosmelt Ltd
26
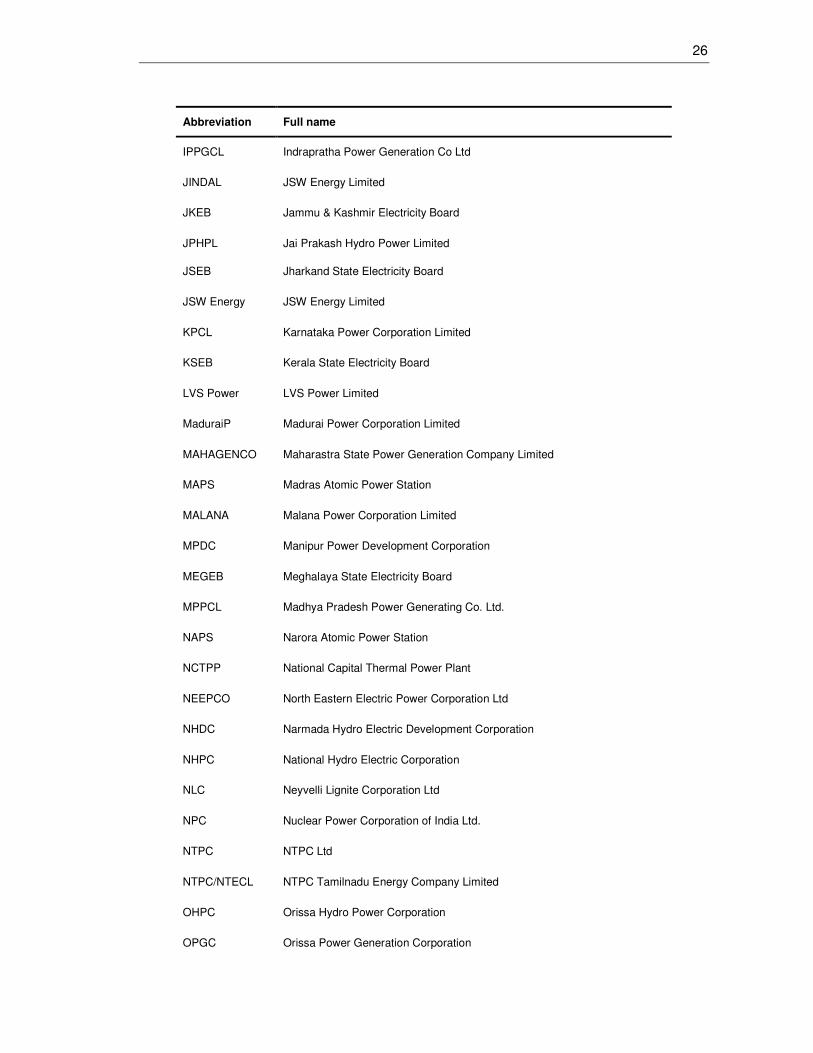
Abbreviation Full name
IPPGCL Indrapratha Power Generation Co Ltd
JINDAL JSW Energy Limited
JKEB Jammu & Kashmir Electricity Board
JPHPL Jai Prakash Hydro Power Limited
JSEB Jharkand State Electricity Board
JSW Energy JSW Energy Limited
KPCL Karnataka Power Corporation Limited
KSEB Kerala State Electricity Board
LVS Power LVS Power Limited
MaduraiP Madurai Power Corporation Limited
MAHAGENCO Maharastra State Power Generation Company Limited
MAPS Madras Atomic Power Station
MALANA Malana Power Corporation Limited
MPDC Manipur Power Development Corporation
MEGEB Meghalaya State Electricity Board
MPPCL Madhya Pradesh Power Generating Co. Ltd.
NAPS Narora Atomic Power Station
NCTPP National Capital Thermal Power Plant
NEEPCO North Eastern Electric Power Corporation Ltd
NHDC Narmada Hydro Electric Development Corporation
NHPC National Hydro Electric Corporation
NLC Neyvelli Lignite Corporation Ltd
NPC Nuclear Power Corporation of India Ltd.
NTPC NTPC Ltd
NTPC/NTECL NTPC Tamilnadu Energy Company Limited
OHPC Orissa Hydro Power Corporation
OPGC Orissa Power Generation Corporation
27
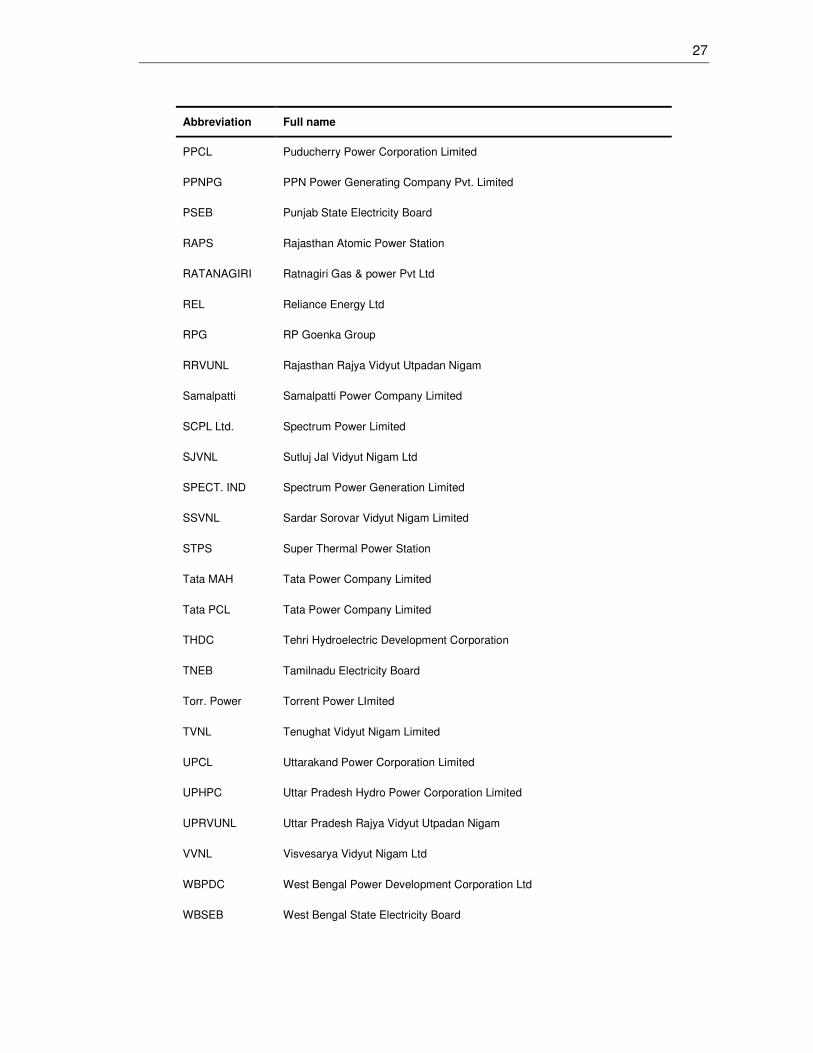
Abbreviation Full name
PPCL Puducherry Power Corporation Limited
PPNPG PPN Power Generating Company Pvt. Limited
PSEB Punjab State Electricity Board
RAPS Rajasthan Atomic Power Station
RATANAGIRI Ratnagiri Gas & power Pvt Ltd
REL Reliance Energy Ltd
RPG RP Goenka Group
RRVUNL Rajasthan Rajya Vidyut Utpadan Nigam
Samalpatti Samalpatti Power Company Limited
SCPL Ltd. Spectrum Power Limited
SJVNL Sutluj Jal Vidyut Nigam Ltd
SPECT. IND Spectrum Power Generation Limited
SSVNL Sardar Sorovar Vidyut Nigam Limited
STPS Super Thermal Power Station
Tata MAH Tata Power Company Limited
Tata PCL Tata Power Company Limited
THDC Tehri Hydroelectric Development Corporation
TNEB Tamilnadu Electricity Board
Torr. Power Torrent Power LImited
TVNL Tenughat Vidyut Nigam Limited
UPCL Uttarakand Power Corporation Limited
UPHPC Uttar Pradesh Hydro Power Corporation Limited
UPRVUNL Uttar Pradesh Rajya Vidyut Utpadan Nigam
VVNL Visvesarya Vidyut Nigam Ltd
WBPDC West Bengal Power Development Corporation Ltd
WBSEB West Bengal State Electricity Board
28
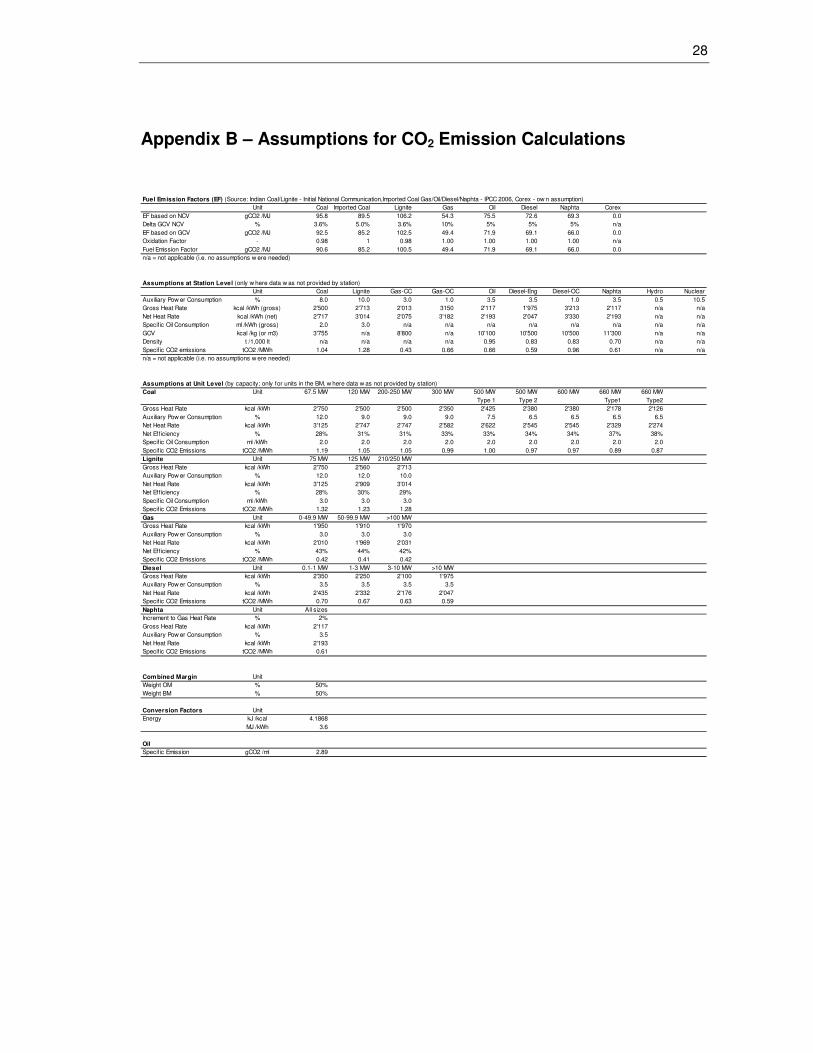
Appendix B – Assumptions for CO2 Emission Calculations
Fuel Emission Factors (EF) (Source: Indian Coal/Lignite - Initial National Communication,Imported Coal Gas/Oil/Diesel/Naphta - IPCC 2006, Corex - ow n assumption)
Unit Coal Imported Coal Lignite Gas Oil Diesel Naphta Corex
EF based on NCV gCO2 /MJ 95.8 89.5 106.2 54.3 75.5 72.6 69.3 0.0
Delta GCV NCV % 3.6% 5.0% 3.6% 10% 5% 5% 5% n/a
EF based on GCV gCO2 /MJ 92.5 85.2 102.5 49.4 71.9 69.1 66.0 0.0
Oxidation Factor - 0.98 1 0.98 1.00 1.00 1.00 1.00 n/a
Fuel Emission Factor gCO2 /MJ 90.6 85.2 100.5 49.4 71.9 69.1 66.0 0.0
n/a = not applicable (i.e. no assumptions w ere needed)
Assumptions at Station Level (only w here data w as not provided by station)
Unit Coal Lignite Gas-CC Gas-OC Oil Diesel-Eng Diesel-OC Naphta Hydro Nuclear
Auxiliary Pow er Consumption % 8.0 10.0 3.0 1.0 3.5 3.5 1.0 3.5 0.5 10.5
Gross Heat Rate kcal /kWh (gross) 2'500 2'713 2'013 3150 2'117 1'975 3'213 2'117 n/a n/a
Net Heat Rate kcal /kWh (net) 2'717 3'014 2'075 3'182 2'193 2'047 3'330 2'193 n/a n/a
Specif ic Oil Consumption ml /kWh (gross) 2.0 3.0 n/a n/a n/a n/a n/a n/a n/a n/a
GCV kcal /kg (or m3) 3'755 n/a 8'800 n/a 10'100 10'500 10'500 11'300 n/a n/a
Density t /1,000 lt n/a n/a n/a n/a 0.95 0.83 0.83 0.70 n/a n/a
Specif ic CO2 emissions tCO2 /MWh 1.04 1.28 0.43 0.66 0.66 0.59 0.96 0.61 n/a n/a
n/a = not applicable (i.e. no assumptions w ere needed)
Assumptions at Unit Level (by capacity; only for units in the BM, w here data w as not provided by station)
Coal Unit 67.5 MW 120 MW 200-250 MW 300 MW 500 MW 500 MW 600 MW 660 MW 660 MW
Type 1 Type 2 Type1 Type2
Gross Heat Rate kcal /kWh 2'750 2'500 2'500 2'350 2'425 2'380 2'380 2'178 2'126
Auxiliary Pow er Consumption % 12.0 9.0 9.0 9.0 7.5 6.5 6.5 6.5 6.5
Net Heat Rate kcal /kWh 3'125 2'747 2'747 2'582 2'622 2'545 2'545 2'329 2'274
Net Eff iciency % 28% 31% 31% 33% 33% 34% 34% 37% 38%
Specif ic Oil Consumption ml /kWh 2.0 2.0 2.0 2.0 2.0 2.0 2.0 2.0 2.0
Specif ic CO2 Emissions tCO2 /MWh 1.19 1.05 1.05 0.99 1.00 0.97 0.97 0.89 0.87
Lignite Unit 75 MW 125 MW 210/250 MW
Gross Heat Rate kcal /kWh 2'750 2'560 2'713
Auxiliary Pow er Consumption % 12.0 12.0 10.0
Net Heat Rate kcal /kWh 3'125 2'909 3'014
Net Eff iciency % 28% 30% 29%
Specif ic Oil Consumption ml /kWh 3.0 3.0 3.0
Specif ic CO2 Emissions tCO2 /MWh 1.32 1.23 1.28
Gas Unit 0-49.9 MW 50-99.9 MW >100 MW
Gross Heat Rate kcal /kWh 1'950 1'910 1'970
Auxiliary Pow er Consumption % 3.0 3.0 3.0
Net Heat Rate kcal /kWh 2'010 1'969 2'031
Net Eff iciency % 43% 44% 42%
Specif ic CO2 Emissions tCO2 /MWh 0.42 0.41 0.42
Diesel Unit 0.1-1 MW 1-3 MW 3-10 MW >10 MW
Gross Heat Rate kcal /kWh 2'350 2'250 2'100 1'975
Auxiliary Pow er Consumption % 3.5 3.5 3.5 3.5
Net Heat Rate kcal /kWh 2'435 2'332 2'176 2'047
Specif ic CO2 Emissions tCO2 /MWh 0.70 0.67 0.63 0.59
Naphta Unit All sizes
Increment to Gas Heat Rate % 2%
Gross Heat Rate kcal /kWh 2'117
Auxiliary Pow er Consumption % 3.5
Net Heat Rate kcal /kWh 2'193
Specif ic CO2 Emissions tCO2 /MWh 0.61
Combined Margin Unit
Weight OM % 50%
Weight BM % 50%
Conversion Factors Unit
Energy kJ /kcal 4.1868
MJ /kWh 3.6
Oil
Specif ic Emission gCO2 /ml 2.89
29
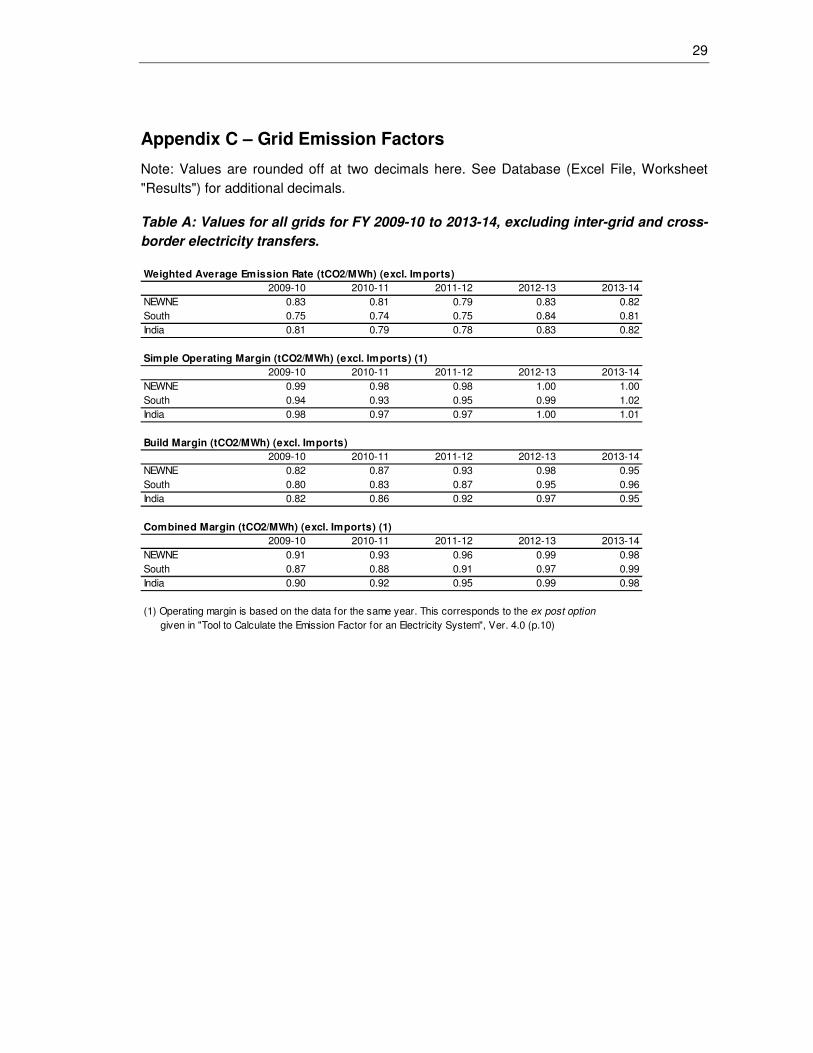
Appendix C – Grid Emission Factors
Note: Values are rounded off at two decimals here. See Database (Excel File, Worksheet
"Results") for additional decimals.
Table A: Values for all grids for FY 2009-10 to 2013-14, excluding inter-grid and cross-
border electricity transfers.
Weighted Average Emission Rate (tCO2/MWh) (excl. Imports)
2009-10 2010-11 2011-12 2012-13 2013-14
NEWNE 0.83 0.81 0.79 0.83 0.82
South 0.75 0.74 0.75 0.84 0.81
India 0.81 0.79 0.78 0.83 0.82
Simple Operating Margin (tCO2/MWh) (excl. Imports) (1)
2009-10 2010-11 2011-12 2012-13 2013-14
NEWNE 0.99 0.98 0.98 1.00 1.00
South 0.94 0.93 0.95 0.99 1.02
India 0.98 0.97 0.97 1.00 1.01
Build Margin (tCO2/MWh) (excl. Imports)
2009-10 2010-11 2011-12 2012-13 2013-14
NEWNE 0.82 0.87 0.93 0.98 0.95
South 0.80 0.83 0.87 0.95 0.96
India 0.82 0.86 0.92 0.97 0.95
Combined Margin (tCO2/MWh) (excl. Imports) (1)
2009-10 2010-11 2011-12 2012-13 2013-14
NEWNE 0.91 0.93 0.96 0.99 0.98
South 0.87 0.88 0.91 0.97 0.99
India 0.90 0.92 0.95 0.99 0.98
(1) Operating margin is based on the data for the same year. This corresponds to the ex post option
given in "Tool to Calculate the Emission Factor for an Electricity System", Ver. 4.0 (p.10)
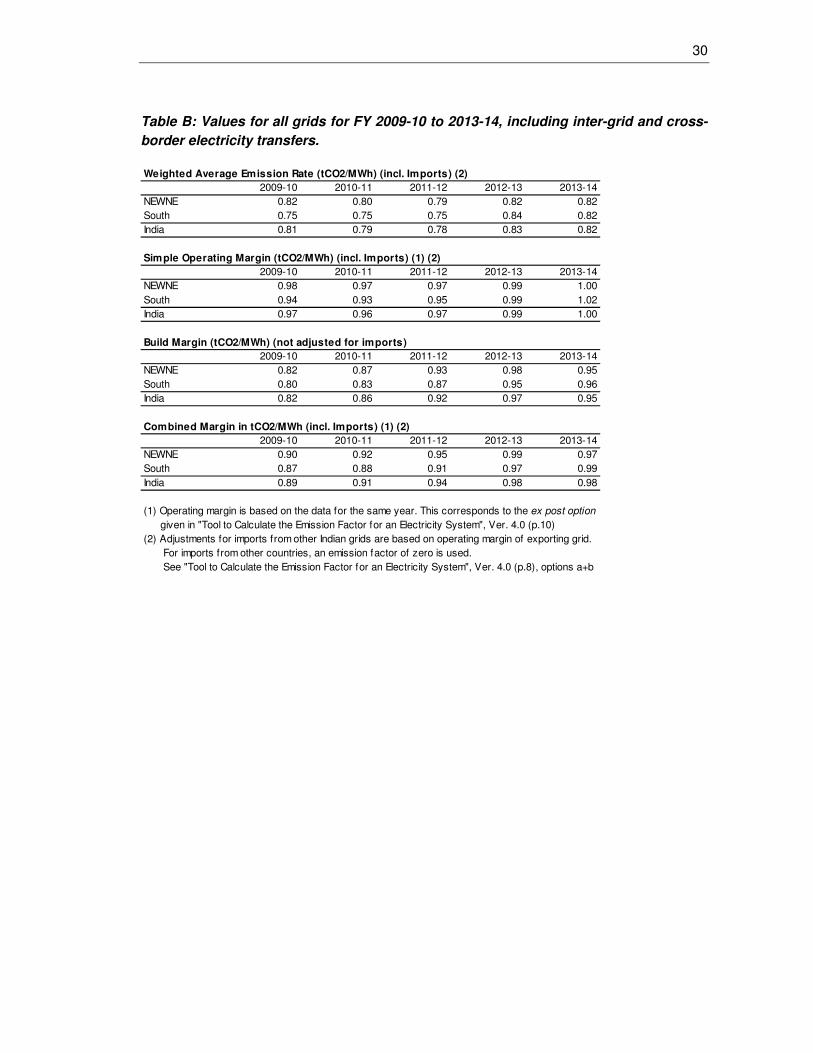
30
Table B: Values for all grids for FY 2009-10 to 2013-14, including inter-grid and cross-
border electricity transfers.
Weighted Average Emission Rate (tCO2/MWh) (incl. Imports) (2)
2009-10 2010-11 2011-12 2012-13 2013-14
NEWNE 0.82 0.80 0.79 0.82 0.82
South 0.75 0.75 0.75 0.84 0.82
India 0.81 0.79 0.78 0.83 0.82
Simple Operating Margin (tCO2/MWh) (incl. Imports) (1) (2)
2009-10 2010-11 2011-12 2012-13 2013-14
NEWNE 0.98 0.97 0.97 0.99 1.00
South 0.94 0.93 0.95 0.99 1.02
India 0.97 0.96 0.97 0.99 1.00
Build Margin (tCO2/MWh) (not adjusted for imports)
2009-10 2010-11 2011-12 2012-13 2013-14
NEWNE 0.82 0.87 0.93 0.98 0.95
South 0.80 0.83 0.87 0.95 0.96
India 0.82 0.86 0.92 0.97 0.95
Combined Margin in tCO2/MWh (incl. Imports) (1) (2)
2009-10 2010-11 2011-12 2012-13 2013-14
NEWNE 0.90 0.92 0.95 0.99 0.97
South 0.87 0.88 0.91 0.97 0.99
India 0.89 0.91 0.94 0.98 0.98
(1) Operating margin is based on the data for the same year. This corresponds to the ex post option
given in "Tool to Calculate the Emission Factor for an Electricity System", Ver. 4.0 (p.10)
(2) Adjustments for imports from other Indian grids are based on operating margin of exporting grid.
For imports from other countries, an emission factor of zero is used.
See "Tool to Calculate the Emission Factor for an Electricity System", Ver. 4.0 (p.8), options a+b
31
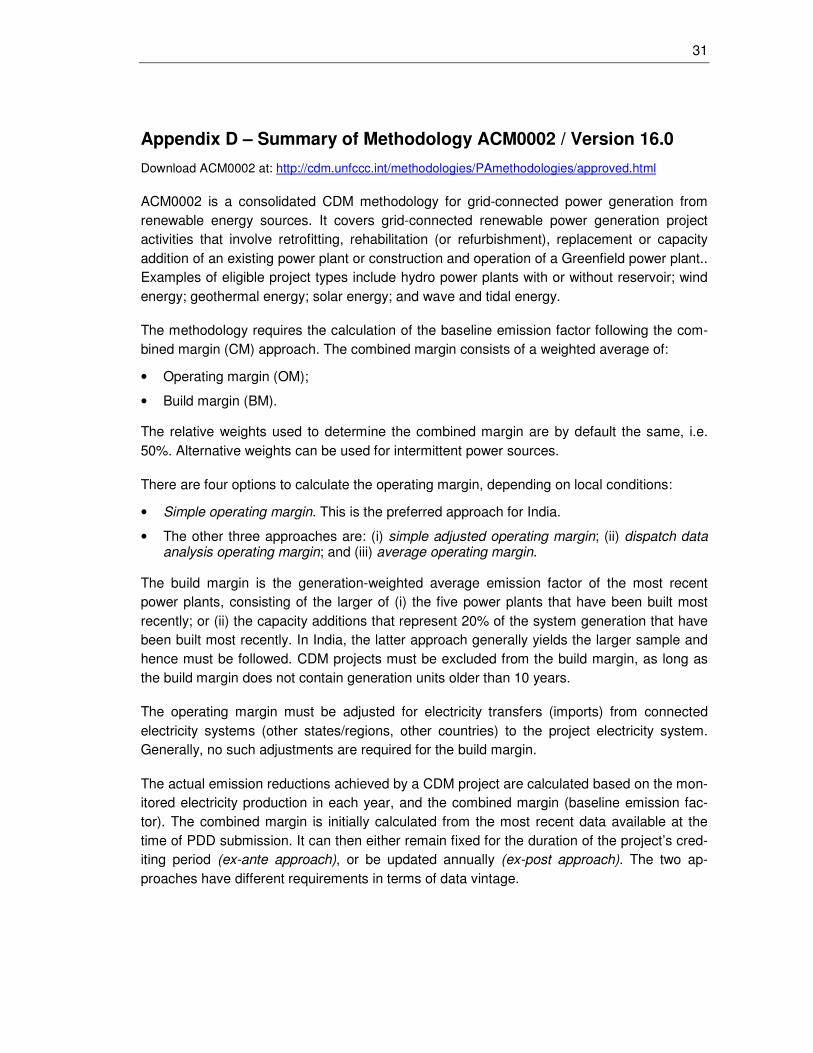
Appendix D – Summary of Methodology ACM0002 / Version 16.0
Download ACM0002 at: http://cdm.unfccc.int/methodologies/PAmethodologies/approved.html
ACM0002 is a consolidated CDM methodology for grid-connected power generation from
renewable energy sources. It covers grid-connected renewable power generation project
activities that involve retrofitting, rehabilitation (or refurbishment), replacement or capacity
addition of an existing power plant or construction and operation of a Greenfield power plant..
Examples of eligible project types include hydro power plants with or without reservoir; wind
energy; geothermal energy; solar energy; and wave and tidal energy.
The methodology requires the calculation of the baseline emission factor following the com-
bined margin (CM) approach. The combined margin consists of a weighted average of:
• Operating margin (OM);
• Build margin (BM).
The relative weights used to determine the combined margin are by default the same, i.e.
50%. Alternative weights can be used for intermittent power sources.
There are four options to calculate the operating margin, depending on local conditions:
• Simple operating margin. This is the preferred approach for India.
• The other three approaches are: (i) simple adjusted operating margin; (ii) dispatch data analysis operating margin; and (iii) average operating margin.
The build margin is the generation-weighted average emission factor of the most recent
power plants, consisting of the larger of (i) the five power plants that have been built most
recently; or (ii) the capacity additions that represent 20% of the system generation that have
been built most recently. In India, the latter approach generally yields the larger sample and
hence must be followed. CDM projects must be excluded from the build margin, as long as
the build margin does not contain generation units older than 10 years.
The operating margin must be adjusted for electricity transfers (imports) from connected
electricity systems (other states/regions, other countries) to the project electricity system.
Generally, no such adjustments are required for the build margin.
The actual emission reductions achieved by a CDM project are calculated based on the mon-
itored electricity production in each year, and the combined margin (baseline emission fac-
tor). The combined margin is initially calculated from the most recent data available at the
time of PDD submission. It can then either remain fixed for the duration of the project’s cred-
iting period (ex-ante approach), or be updated annually (ex-post approach). The two ap-
proaches have different requirements in terms of data vintage.
32
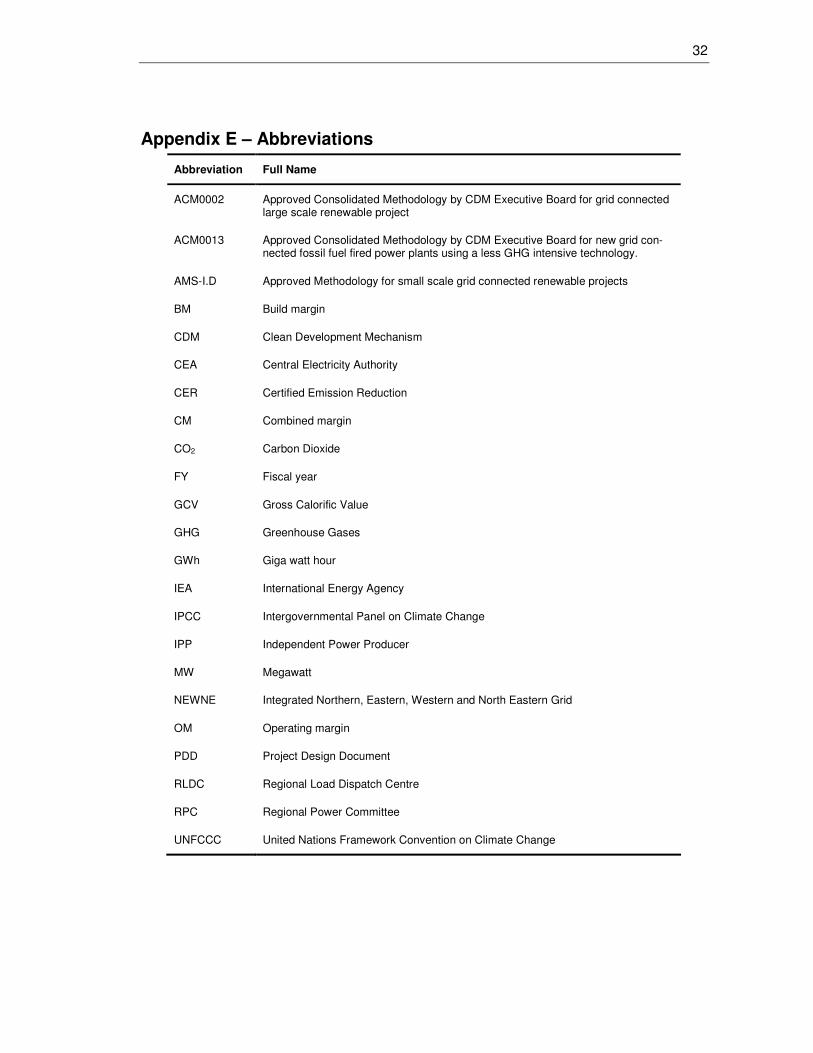
Appendix E – Abbreviations
Abbreviation Full Name
ACM0002 Approved Consolidated Methodology by CDM Executive Board for grid connected large scale renewable project
ACM0013 Approved Consolidated Methodology by CDM Executive Board for new grid con-nected fossil fuel fired power plants using a less GHG intensive technology.
AMS-I.D Approved Methodology for small scale grid connected renewable projects
BM Build margin
CDM Clean Development Mechanism
CEA Central Electricity Authority
CER Certified Emission Reduction
CM Combined margin
CO2 Carbon Dioxide
FY Fiscal year
GCV Gross Calorific Value
GHG Greenhouse Gases
GWh Giga watt hour
IEA International Energy Agency
IPCC Intergovernmental Panel on Climate Change
IPP Independent Power Producer
MW Megawatt
NEWNE Integrated Northern, Eastern, Western and North Eastern Grid
OM Operating margin
PDD Project Design Document
RLDC Regional Load Dispatch Centre
RPC Regional Power Committee
UNFCCC United Nations Framework Convention on Climate Change