CO Baseline Database for the Indian Power Sector -...
34
CO 2 Baseline Database for the Indian Power Sector User Guide Version 1.0 November 2006 Ministry of Power Central Electricity Authority Sewa Bhawan, R.K.Puram, New Delhi-66
Transcript of CO Baseline Database for the Indian Power Sector -...
CO2 Baseline Database for the Indian Power Sector
User Guide
Version 1.0
November 2006
Ministry of Power Central Electricity Authority
Sewa Bhawan, R.K.Puram, New Delhi-66

Revision History of this Document and the Database
Version No. Date of Publication Main Revisions Compared to Previous Version
1.0 Draft for Stakeholder Consultation
4th October 2006 ‘--
1.0 November 2006 - Added data on 10 stations which had been in exclusion worksheet of draft database
- Adjusted values to latest IPCC Guidance (IPCC 2006 Guidelines for National Greenhouse Gas Inventories) where IPCC defaults are used

Foreword
The Clean Development Mechanism (CDM) gives an opportunity to developing countries in achieving their sustainable development objective. Besides providing an additional opportunity to introduce new and efficient technologies and earn revenue in the form of selling Carbon Credits to developed countries.
India has high potential for CDM projects, particularly in the Power Sector. The Baseline Carbon Dioxide Emissions from Power Sector have been worked out by CEA based on detailed authenticated information obtained from all the operating Power Stations in the country. The Baseline would benefit all prospective CDM project developers to estimate the amount of Certified Emission Reduction (CERs) from any CDM project activity.
The team of CEA Officers headed by Shri K.P. Singh, Chief Engineer (Conservation and Efficiency Division) has done a commendable job under the able guidance of Shri V.S. Verma, Member (Planning), CEA. The work has taken the final shape as a result of series of interaction with the Power Station Authorities, the Officers of GTZ namely, Dr A. Kaupp, Smt. Pamposh Bhat, Head GTZ CDM India and review of the whole data by Mr Urs Brodmann and Dr Axel Michaelowa, CDM-India consultants, who also provided feedback and guidance to the team of engineers working on the job.
I am confident that this Baseline Carbon Dioxide Emissions Database will fulfil the expectations of all the stakeholders who are involved in the development of CDM projects in India. The baseline information is dynamic in nature and data will have to be updated every year based on the new generating capacity added in the country.
New Delhi (Rakesh Nath)
Nov 2006 Chairperson

Preface
Developing countries like India do not fall in the Annex I category of the Kyoto Protocol but India has a strong commitment to reduce its emissions of greenhouse gases. Ministry of Power has accorded high priority to the CDM projects in the power sector.
The number of Indian CDM projects registered with the CDM Executive Board is a good indication to India’s commitment towards protection of the Global Environment. Till date, 124 Indian projects have been registered with the Executive Board. Host country approval to about 421 projects has also been accorded by the National CDM Authority established under the Ministry of Environment and Forest.
CEA undertook the study relating to the baseline data for the Power sector in the country with a view to obtain uniformity of approach in the country towards a common objective. Detailed information was collected from all power generating stations. This user guide has been prepared to enable project developers to use these baseline emission data effectively for CDM benefits.
CEA along with GTZ-CDM India had organised a workshop to discuss and deliberate on the Draft CDM baseline data wherein all stakeholders including SEBs, generating companies, consultant, professional technical institutions such as IITs, USAID, UNDP, CDM Consultant and Electricity Regulatory Commissions participated. The clarifications sought were furnished. The draft baseline data was sent to all concerned and put on CEA website for about 4 weeks. The comments/suggestions received have been taken into consideration and the final baseline date is now being published.
The cooperation of all utilities/organizations who furnished the information is gratefully acknowledged. I hope all the utilities/organizations would extend whole-hearted support in annual updating of the database in future.
I appreciate the efforts put in by all the officers of Central Electricity Authority and GTZ- CDM-India in bringing up the data on baseline carbon dioxide emissions on time. This is a unique effort made by India for the first time in the world. The data is proposed to be updated on annual basis.
I am confident, that baseline carbon dioxide emissions, developed by CEA would provide direction to help industry to come up with new CDM project concepts to further consolidate and reinforce our effort to save the global environment.
New Delhi (V.S. Verma)
Nov 2006 Member (Planning)


Acknowledgement
I take the opportunity to thank Ministry of Power, Government of India, for reposing confidence in CEA and entrusting us with the responsibility of establishing the Baseline carbon dioxide emissions from the Indian power sector.
I take this opportunity to thank Shri R.V. Shahi, Secretary (Power) and Shri Ajay Shankar, Additional Secretary and Shri U.N. Panjiar, Additional Secretary, Ministry of Power who provided whole hearted support and faith.
I am grateful to Shri Rakesh Nath, Chairperson, CEA and Shri V.S. Verma, Member(Planning), CEA for enlightening us with their valuable views and guidance all along in developing the baseline carbon dioxide emissions.
I sincerely thank Dr A. Kaupp, Manager, IGEN, the CDM-India consultants Mr Urs Brodmann and Mr Rodrigo Weiss of Factor Consulting and Dr Axel Michaelowa of Perspectives Climate Change, and Ms Pamposh Bhat, Head, GTZ-CDM India for providing their expert views in establishing the baseline emissions.
I appreciate and thank all the power sector utilities/organizations who furnished the data/information timely to enable us to bring out these baseline carbon dioxide emissions.
I acknowledge with deep appreciation, the hard work and efforts put in by officers of Conservation and Efficiency Division, CEA in compilation of data and evolving the Baseline carbon dioxide emissions from the power sector. I also thank officers of Thermal, G&OD and Hydro wings of CEA for their contribution in completing this study.
New Delhi (K. P. Singh)
Nov 2006 Chief Engineer (C&E)

Contents
Summary ......................................................................................................................... S-1 1 Background and Objective ...........................................................................................1 2 How to Use the Database ............................................................................................4 3 Scope of Database.......................................................................................................6 4 Data and Calculation Approach....................................................................................7
4.1 Base Data ..........................................................................................................7 4.2 Annual Data .......................................................................................................8 4.3 Calculation of CO2 Emissions ............................................................................9 4.4 Adjustment for Inter-Regional and Cross-Border Electricity Transfers ............11 4.5 Conservativeness.............................................................................................11
5 Results .......................................................................................................................12 6 User Examples ...........................................................................................................15 7 Updating Procedure ...................................................................................................18 8 Further Information.....................................................................................................18 Appendix A – Systems in India’s Regional Grids...............................................................19 Appendix B – Assumptions for CO2 Emission Calculations...............................................22 Appendix C – Grid Emission Factors.................................................................................23 Appendix D – Summary of Methodology ACM0002 / Version 06 ......................................25 Appendix E – Abbreviations...............................................................................................26

S-1
Summary
Since the emergence of the Kyoto Protocol and its Clean Development Mechanism (CDM), energy projects lowering the carbon intensity of the electricity grid can generate additional revenues from carbon credits. Methodologies approved by the CDM Executive Board have to be applied to determine the resulting emission reductions, using the “baseline” CO2 emission factor of the relevant geographical area.
In order to facilitate adoption of authentic baseline emissions data and also to ensure uniformity in the calculations of CO2 emission reductions by CDM project developers, Central Electricity Authority (CEA), in cooperation with GTZ CDM-India, has compiled a database containing the necessary data on CO2 emissions for all grid-connected power stations in India. The database currently covers the five fiscal years 2000-01 to 2004-05. CEA intends to update the database at the end of each financial year.
The Indian electricity system is divided into five regional grids, viz. Northern, Eastern, Western, Southern, and North-Eastern. Each grid covers several states. As the regional grids are interconnected, there is inter-state and inter-regional exchange. A small power exchange also takes place with neighbouring countries like Bhutan and Nepal. For each of the five regions, the main emission factors are calculated in accordance with the relevant CDM methodologies.
The prevailing baseline based on the data for the Fiscal Year 2004-05 is shown in Table S-1.
The calculations are based on generation, fuel consumption and fuel quality data obtained from the power stations. Typical standard data were used wherever precise information was not available. Inter-regional and cross-border electricity transfers were also taken into account for calculating the CO2 emission baseline.
Table S-1: Weighted average emission factor, simple operating margin (OM), build margin (BM) and combined margin (CM) of all Indian regional grids for FY 2004-05 (inter-regional and cross-border electricity transfers included), in tCO2/MWh
Average OM BM CMNorth 0.72 0.98 0.53 0.75East 1.05 1.17 0.90 1.04South 0.78 1.00 0.71 0.85West 0.92 1.01 0.77 0.89North-East 0.46 0.81 0.10 0.45India 0.84 1.02 0.70 0.86 Average is the average emissions of all stations in the grid
OM is the average emission from all the stations excluding the low cost/must run sources.
BM is the average emission of the 20% (by net generation) most recent capacity addition in the grid.
CM is a weighted average of the OM and BM.
1
1 Background and Objective
Purpose of the CO2 Database The Clean Development Mechanism (CDM) under the Kyoto Protocol to United Nations Framework Convention on Climate Change (UNFCCC) provides an opportunity for the Indian power sector to earn revenue through the reduction of greenhouse gas emissions (GHG), particularly carbon dioxide (CO2). India has tremendous potential for CDM projects. Power generation based on higher efficiency technologies such as supercritical technology, integrated gasification combined cycle, and renovation and modernisation of old thermal power plants, co-generation along with renewable energy sources are some of potential candidates for CDM in the power sector. Energy efficiency and conservation projects also present themselves as eligible CDM projects, as these would also result in energy savings and displace associated CO2 emissions which otherwise would be produced by grid-connected power stations.
CDM appears to be a promising mechanism but many implementation issues are yet to be addressed like fixing of baseline etc. A need was, therefore, felt to work out an acceptable and realistic baseline of CO2 emissions for the various regions of the country to enable facilitating the prospective project developers to pose their projects for approval by the CDM Executive Board. Central Electricity Authority (CEA), accordingly took up in cooperation with GTZ CDM-India, to compile a database for all grid-connected power stations in India. The purpose of the database is to establish authentic and consistent quantification of the CO2 emission baseline which can be readily used by CDM project developers in the Indian power sector. This would enhance the acceptability of Indian projects and would also expedite the clearance/approval process. India is the first country in the world to have ventured to take up the complex task of developing such an official baseline for the power sector as a whole.
Project developers wishing to benefit from the CDM must use an approved methodology to quantify their emission reductions. Examples of such methodologies include AMS-I.D and ACM002 for grid-connected power generation from renewable sources in small and large- scale projects, respectively. The latest versions of all approved CDM methodologies are available at the official CDM website, http://cdm.unfccc.int.
The baseline emissions for all the five regional grids are given in Section-5 (Results) of this user guide. The complete CO2 Database (Microsoft Excel File) and this User Guide are available on the Central Electricity Authority website: www.cea.nic.in
The purpose of this User Guide is to provide a ready reference to the underlying calculations and assumptions used in the CO2 database and summarise the key results.

2
Official Status of the Database The database is an official publication of the Government of India for the purpose of CDM baselines. It is based on the most recent data available to the Central Electricity Authority.
Indian Power Sector As a result of the impressive growth attainted by the Indian Power Sector, the installed capacity has grown from mere 1,713 MW in 1950 to 124,287 MW as on 31.03.2006, consisting of 82,411 MW Thermal, 32,326 MW Hydro, 3,360 MW Nuclear. Regionwise details of installed capacity is shown in Table 1
Table 1: Region wise installed capacity (MW) as on 31.3.2006. Note: These capacities are not identical with those listed in the Excel database, because the database currently covers only the years up to 31.3.2005
Region Thermal Hydro Nuclear Renew. Total
Coal Gas Diesel Total
Northern 17592.50 3213.19 14.99 20820.68 11061.88 1180.00 694.59 33757.15
Western 20941.50 5080.72 17.48 26039.70 6681.33 1300.00 1098.83 35119.86
Southern 15992.50 3434.50 939.32 20366.32 10967.71 880.00 4233.49 36447.52
Eastern 13662.38 190.00 17.20 13869.58 2496.53 0.00 111.67 16477.78
North Eastern 330.00 771.50 142.74 1244.24 1113.07 0.00 46.86 2404.17
Island 0 0.00 70.02 70.02 5.25 0.00 5.42 80.69
All India 68518.88 12689.91 1201.75 82410.54 32325.77 3360.00 6190.86 124287.17
It is evident from Table 1 that the installed capacity is predominantly coal based and therefore, is a major source of carbon dioxide emissions from India. Hence, there exists scope for reducing the CO2 emissions from the country by way of fuel substitution, increased use of renewable energy sources, and also by improving the thermal efficiency of power generation.
The Indian power system is divided into five independent regional grids, namely Northern, Eastern, Western, Southern, and North-Eastern. Each grid covers several states (see Table 2). Power generation and supply within the regional grid is managed by Regional Load Dispatch Centre (RLDC). The Regional Power Committees (RPCs) provide a common platform for discussion and solution to the regional problems relating to the grid.

3
Each state in a regional grid meets their demand with their own generation facilities and also with allocation from power plants owned by the central sector such as NTPC and NHPC etc. Specific quotas are allocated to each state from the central sector power plants. Depending on the demand and generation, there are electricity exports and imports between states in the regional grid. There are also electricity transfers between regional grids, and small exchanges in the form of cross-border imports and exports (e.g. from Bhutan). Recently, the Indian regional grids have started to work in synchronous mode, i.e. at same frequency.
Table 2: Geographical scope of the five regional electricity grids
Northern Western Southern Eastern North-Eastern
Chandigarh
Delhi
Haryana
Himachal Pradesh
Jammu & Kashmir
Punjab
Rajasthan
Uttar Pradesh
Uttaranchal
Chhattisgarh
Gujarat
Daman & Diu
Dadar & Nagar Haveli
Madhya Pradesh
Maharashtra
Goa
Andhra Pradesh
Karnataka
Kerala
Tamil Nadu
Pondicherry
Lakshadweep
Bihar
Jharkhand
Orissa
West Bengal
Sikkim
Andaman-Nicobar
Arunachal Pradesh
Assam
Manipur
Meghalaya
Mizoram
Nagaland
Tripura
For the purpose of calculating the emission reductions achieved by any CDM project, the CDM Executive Board requires that the “project electricity system is defined by the spatial extent of the power plants that can be dispatched without significant transmission constraints”.1 This implies that the grid emission factors are most appropriately calculated at the level of the five regional grids.
1 Approved consolidated baseline methodology ACM0002 / Version 06

4
2 How to Use the Database
Structure of the Database Emission reductions from CDM projects in the power sector are calculated based on the net electricity generated by the project, and the difference between the emission factors (in t CO2/MWh) of the baseline and the project activity. The baseline emission factor reflects the carbon intensity of the displaced amount of grid electricity. This baseline emission factor can be derived from the data provided in the CO2 Database.
Specifically, the database contains the following elements:
• Worksheet “Data” provides the net generation and the absolute and specific CO2 emissions of each grid-connected power station (see Section 3 for exceptions). It also indicates which stations and units have been included in the operating margin and build margin, respectively.
• Worksheet “Results” provides the most commonly used aggregate emission factors. These are calculated from the station data in accordance with the approved consolidated methodology ACM002 (Version 06). The emission factors are explained in more detail in the next section.
• Worksheet “Abbreviations” explains the abbreviations used in the “Data” worksheet.
• Worksheet “Assumptions” shows the assumptions that were used for the calculation of the CO2 emissions at station and unit level, to the extent required.
• Worksheet “Electricity Transfers” shows the interregional and cross-border power transfers.
Different Types of Emission Factors The CDM methodologies which have been approved to date by the CDM Executive Board distinguish a range of different emission factors. In the Indian context, the following four are most relevant, and were therefore calculated for each regional grid based on the underlying station data:
Weighted average: The weighted average emission factor describes the average CO2 emitted per unit of electricity generated in the grid. It is calculated by dividing the absolute CO2 emissions of all power stations in the region by the region’s total net generation. Net generation from so-called low-cost/must-run sources (hydro and nuclear) is included in the denominator.
Simple operating margin (OM): The operating margin describes the average CO2 intensity of existing stations in the grid which are most likely to reduce their output if a CDM project supplies electricity to the grid (or

5
reduces consumption of grid electricity). “Simple” denotes one out of four possible variants listed in ACM0002 for calculating the operating margin.2 The simple operating margin is obtained by dividing the region’s total CO2 emissions by the net generation of the stations serving the region excluding low-cost/must-run sources. In other words, the total emissions are divided by the total net generation of all thermal power stations. Hydro and nuclear qualify as low-cost/must-run sources, and their net generation is therefore excluded from the denominator.
Build margin (BM): The build margin reflects the average CO2 intensity of newly built power stations that will be (partially) replaced by a CDM project. In accordance with ACM0002, the build margin is calculated in this database as the average emissions intensity of the 20% most recent capacity additions in the grid based on net generation. Depending on the region, the build margin covers units commissioned in the last five to ten years.
Combined margin (CM): The combined margin is a weighted average of the simple operating margin and the build margin. By default, both margins have equal weights (50%). However, CDM project developers may chose to argue for different weights. In particular, for intermittent and non-dispatchable generation types such as wind and solar photovoltaic, ACM0002 allows to weigh the operating margin and build margin at 75% and 25%, respectively (see ACM0002, Version 06). However, the combined margins shown in the database are calculated based on equal weights.
2 The two variants “Simple adjusted operating margin” and “Dispatch data analysis operating margin” cannot currently be
applied in India due to lack of necessary data.

6
3 Scope of Database
The CO2 Database includes all grid-connected power stations having an installed capacity above 5 MW in case of hydro and above 10 MW for other plant types. Data covers both power stations of public utilities and independent power producers (IPPs).
Coal55.3%
Nuclear2.4%
Hydro26.9%
Gas9.6%
Naphta0.4%
Lignite2.9%
Diesel0.9%
Oil1.1%
Figure 1: Breakdown of generation capacity covered by the Database. The total corresponds to 112,389 MW as on 31.03.2005.
The following power stations are currently not accounted for in the CO2 Database:
• Stations or units installed in Andaman and Nicobar Islands and Lakshadweep.
• Captive power plants: As on 31 March 2005, the installed capacity and electricity generation from captive plants were 19,103 MW and 71,415 GWh, respectively, which is approx. 10% of total generation in India.
• Non-conventional renewable energy stations: These include power generation from wind, biomass, solar photovoltaic, and hydro below 5 MW capacity. The installed, grid-connected capacity of these sources was approx. 6,000 MW as on 31 12 2005.3
• Small decentralised generation sets.
In the future, stations registered as CDM activities may have to be excluded for the duration of their crediting period, to avoid an unjustified “negative feedback” to subsequent CDM project activities.
3 Annual Report 2005-2006, Ministry of Non-Conventional Energy Sources
7
4 Data and Calculation Approach
This section gives an overview on the base data, annual data as well as the approaches used to calculate station-level and unit-level CO2 emissions.
4.1 Base Data
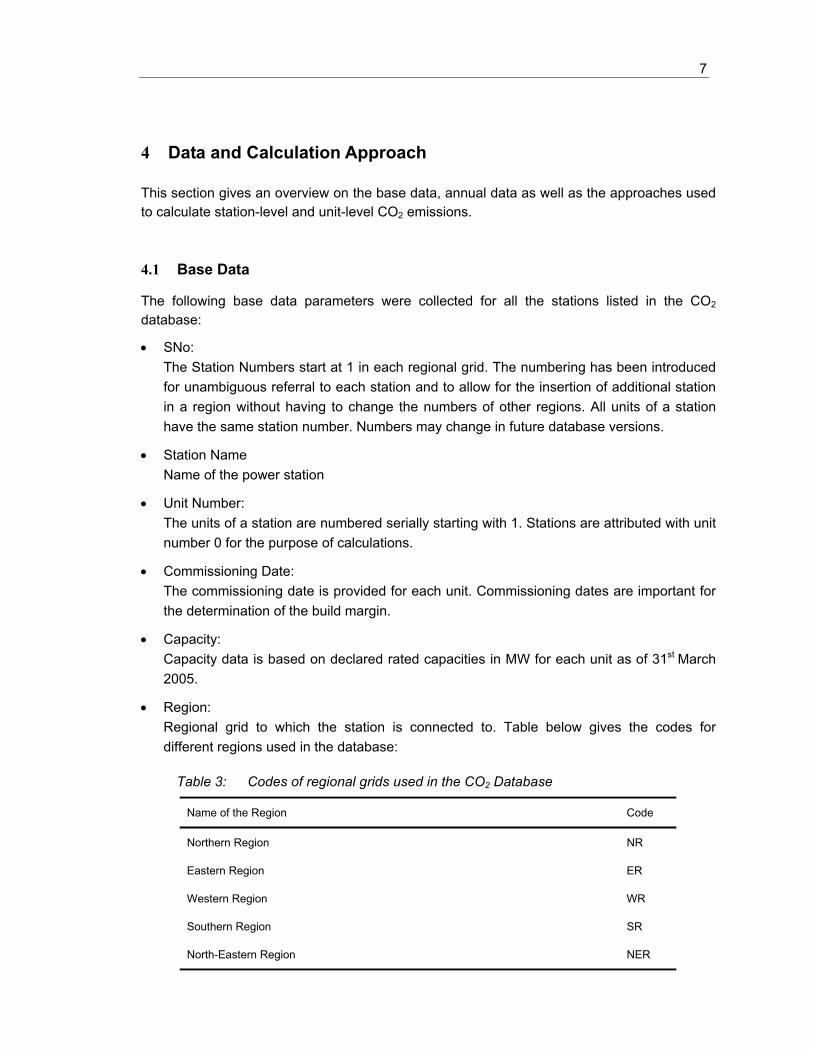
The following base data parameters were collected for all the stations listed in the CO2 database:
• SNo: The Station Numbers start at 1 in each regional grid. The numbering has been introduced for unambiguous referral to each station and to allow for the insertion of additional station in a region without having to change the numbers of other regions. All units of a station have the same station number. Numbers may change in future database versions.
• Station Name Name of the power station
• Unit Number: The units of a station are numbered serially starting with 1. Stations are attributed with unit number 0 for the purpose of calculations.
• Commissioning Date: The commissioning date is provided for each unit. Commissioning dates are important for the determination of the build margin.
• Capacity: Capacity data is based on declared rated capacities in MW for each unit as of 31st March 2005.
• Region: Regional grid to which the station is connected to. Table below gives the codes for different regions used in the database:
Table 3: Codes of regional grids used in the CO2 Database
Name of the Region Code
Northern Region NR
Eastern Region ER
Western Region WR
Southern Region SR
North-Eastern Region NER

8
• State: State where the power station is located.
• Sector: This denotes whether the stations is operated by the central sector, the state authorities, or the private sector.
• System: A list of the systems including abbreviations and full names is provided in Appendix A.
• Type: Indicates the type of the station, viz. thermal, nuclear, hydro.
• Fuel: Fuel 1 and Fuel 2 indicates the main fuels used for power generation at each station. For example, in coal based stations, Coal is indicated as Fuel 1 and Oil as Fuel 2.
4.2 Annual Data
The annual data columns in the database provide the following: net generation in GWh of the station, absolute carbon dioxide emissions in metric tonnes, and specific carbon dioxide emissions in tCO2/MWh, for the Fiscal Years 2000-01 to 2004-2005. In addition, there are columns to indicate whether the station is included in the operating margin in the respective year, and an additional column indicating which units are included in the build margin.
Assumptions CEA has compiled the CO2 Database for the Fiscal Years (FY)4 2000-01 to 2004-05 based upon generation, fuel consumption and fuel gross calorific value (GCV) data furnished by each power station. In cases where the station could not provide reliable data for all the relevant parameters, assumptions were made as described below.
At station level, the key assumptions include the following:
Net generation: For hydro stations, only gross generation was available, but not net generation data. CEA standard values for auxiliary power consumption for hydro units (0.5%) was applied to derive the net generation from the gross generation data reported by the stations.
Gross Calorific Value (GCV): Default values were used for some thermal stations where station-specific GCVs were not available.
4 FY: 1 April – 31 March

9
At unit level, the following assumptions were made for those units falling in the build margin (i.e. the most recently built units comprising 20% of net generation):
Gross generation: For hydro stations, gross generation data were not available at unit level. Instead, the plant load factor of the respective station was used to derive the gross generation of the units.
Net generation: Net generation data is generally not measured at unit level. Two distinct approaches were applied to estimate net generation. (i) In cases where all units of a station fall into the build margin or where all units of a station have the same installed capacity, the auxiliary consumption (in % of gross generation) of the units was assumed to be equal to that of the respective station. (ii) In all other cases, standard values for auxiliary consumption adopted by CEA were applied.
Fuel consumption and GCV: Fuel consumption and GCV were not available at unit level. Thus, the specific CO2 emissions of the relevant units were directly determined based on heat rates. See Section 4.3 for details.
Details on the assumptions are available in Appendix B.
4.3 Calculation of CO2 Emissions
Calculation Approach – Station Level CO2 emissions of thermal stations were calculated using the formula below:
∑=
×××=2
1,,2 )(
iiiyiyiy OxidEFGCVFuelConstationAbsCO ( 1 )
Where:
AbsCO2,y Absolute CO2 emission of the station in the given fiscal year ‘y’
FuelConi,y Amount of fuel of type i consumed in the fiscal year ‘y’
GCVi,y Gross calorific value of the fuel I in the fiscal year ‘y’
EFi CO2 emission factor of the fuel i based on GCV
Oxidi Oxidation factor of the fuel i

10
The emission- and oxidation factors used in the CO2 database are provided in Appendix B.
The emission factors for coal and lignite are based on the values provided in India’s Initial National Communication under the UNFCCC (Ministry of Environment & Forests, 2004). The emission factor for coal is supported by the results of an analysis of approx. 120 coal samples collected from different Indian coal fields. Since the values in the National Communication are based on the NCV (Net Calorific Value), they were converted to GCV basis using a formula also furnished in the National Communication. For other fuels, default emission factors from IPCC 2006 Guidelines5 (also based on the respective fuel’s NCV) were taken and converted to GCV basis using IEA default conversion factors.
The oxidation factor for coal and lignite were derived from an analysis performed with data on the unburnt carbon content in the ash from various Indian coal-fired power stations. The value of 98% is consistent with the default value provided in the IPCC 1996 Guidelines.6 For all other fuels, default values provided in the more recent IPCC 2006 Guidelines were used.
Specific CO2 emissions of stations (SpecCO2,y) were computed by dividing the absolute emissions estimated above by the station’s net generation (NetGeny).
y
yy stationNetGen
stationAbsCOstationSpecCO
)()(
)( 22 = ( 2 )
Calculation Approach – Unit Level Unit-level CO2 emissions were only calculated for units in the build margin.
Two distinct approaches were applied to estimate the specific emissions of the units.
a) In cases where all units of a station fall into the build margin or where all units of a station have the same installed capacity, the specific emissions of the unit were assumed to be equal to those of the respective station. This approach was possible for over 80% of the thermal units falling into the build margin.
b) Specific emissions of the remaining units in the build margin were derived from conservative standard heat rate values, defined as the design heat rate plus 5%.
The absolute CO2 emissions of thermal units were derived by multiplying the specific emissions with the net generation of each unit:
yyy unitNetGenunitSpecCOunitAbsCO )()()( 22 ×= ( 3 )
5 2006 IPCC Guidelines for National Greenhouse Gas Inventories, Volume 2: Energy, Table 2.2 6 IPCC 1996 Revised Guidelines for National Greenhouse Gas Inventories, Volume 3 (Reference Manual), p.1.13
11
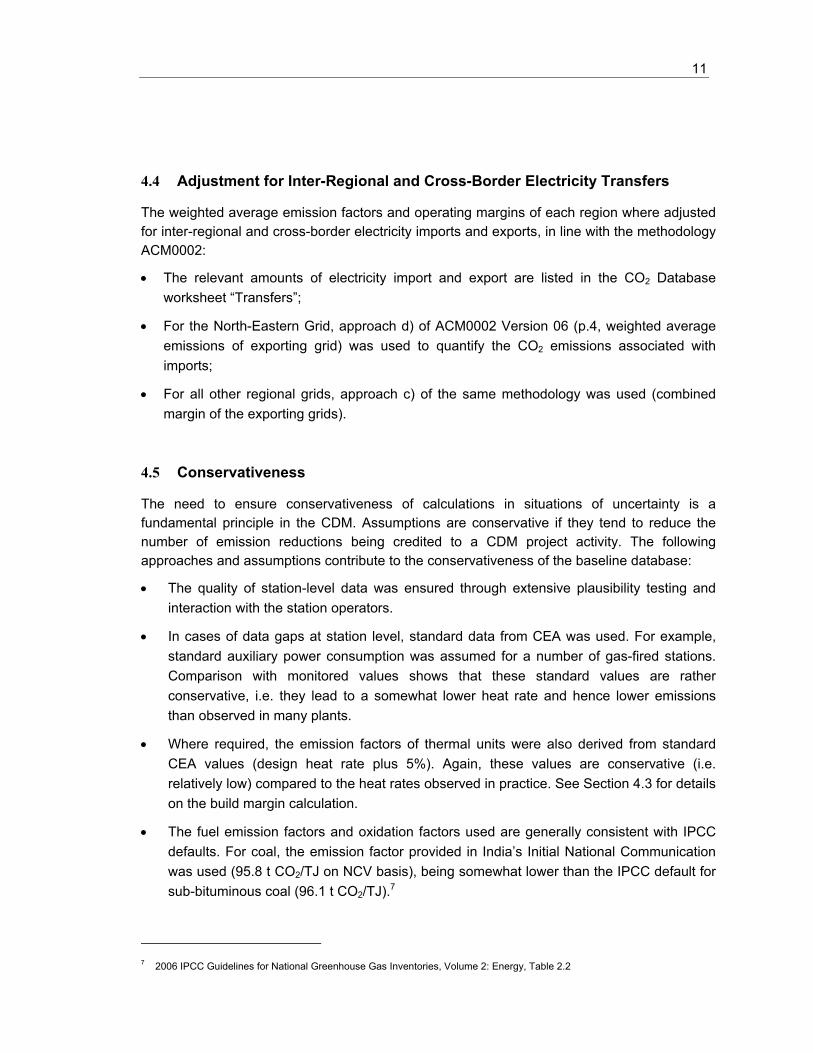
4.4 Adjustment for Inter-Regional and Cross-Border Electricity Transfers
The weighted average emission factors and operating margins of each region where adjusted for inter-regional and cross-border electricity imports and exports, in line with the methodology ACM0002:
• The relevant amounts of electricity import and export are listed in the CO2 Database worksheet “Transfers”;
• For the North-Eastern Grid, approach d) of ACM0002 Version 06 (p.4, weighted average emissions of exporting grid) was used to quantify the CO2 emissions associated with imports;
• For all other regional grids, approach c) of the same methodology was used (combined margin of the exporting grids).
4.5 Conservativeness
The need to ensure conservativeness of calculations in situations of uncertainty is a fundamental principle in the CDM. Assumptions are conservative if they tend to reduce the number of emission reductions being credited to a CDM project activity. The following approaches and assumptions contribute to the conservativeness of the baseline database:
• The quality of station-level data was ensured through extensive plausibility testing and interaction with the station operators.
• In cases of data gaps at station level, standard data from CEA was used. For example, standard auxiliary power consumption was assumed for a number of gas-fired stations. Comparison with monitored values shows that these standard values are rather conservative, i.e. they lead to a somewhat lower heat rate and hence lower emissions than observed in many plants.
• Where required, the emission factors of thermal units were also derived from standard CEA values (design heat rate plus 5%). Again, these values are conservative (i.e. relatively low) compared to the heat rates observed in practice. See Section 4.3 for details on the build margin calculation.
• The fuel emission factors and oxidation factors used are generally consistent with IPCC defaults. For coal, the emission factor provided in India’s Initial National Communication was used (95.8 t CO2/TJ on NCV basis), being somewhat lower than the IPCC default for sub-bituminous coal (96.1 t CO2/TJ).7
7 2006 IPCC Guidelines for National Greenhouse Gas Inventories, Volume 2: Energy, Table 2.2

12
5 Results
Worksheet “Results” in the CO2 Database gives the various emission factors calculated for all the five regional grids for FY 2000-01 to FY 2004-05. The same data are also reproduced in Appendix C.
Table 4 shows the emission factors for FY 2004-05 excluding inter-regional and cross-border power transfers, whereas Table 5 shows the emission factors for the same year including these power transfers.
Table 4: Weighted average emission factor, simple operating margin (OM), build margin (BM) and combined margin (CM) of all Indian regional grids for FY 2004-05 (not adjusted for inter-regional and cross-country electricity transfers), in tCO2/MWh
Average OM BM CMNorth 0.71 0.97 0.53 0.75East 1.08 1.20 0.90 1.05South 0.78 1.00 0.71 0.85West 0.92 1.01 0.77 0.89North-East 0.30 0.66 0.10 0.38India 0.84 1.03 0.70 0.86
Table 5: Weighted average emission factor, simple operating margin (OM), build margin (BM) and combined margin (CM) of all Indian regional grids for FY 2004-05 (adjusted for inter-regional and cross-country electricity transfers), in tCO2/MWh
Average OM BM CMNorth 0.72 0.98 0.53 0.75East 1.05 1.17 0.90 1.04South 0.78 1.00 0.71 0.85West 0.92 1.01 0.77 0.89North-East 0.46 0.81 0.10 0.45India 0.84 1.02 0.70 0.86

13
The observed variations in the emission factors between the different regional grids originate from the differing availability and use of coal, gas and hydro resources. Plants fired with other fossil fuels such as diesel as well as nuclear stations play a less significant role.
A comparison of Table 4 and Table 5 shows that, with exception of the north-eastern grid, electricity transfers from other regions do not have a significant influence on the emission factors.
Figure 2 and Figure 3 illustrate the development of the operating and combined margins over the period from FY 2000-01 to FY 2004-05. For all but the north-eastern region, the factors remained relatively constant. The north-eastern region’s emission factor experienced a significant rise of approx. 20% owing to large electricity imports from the coal-dominated eastern grid.
It is important to note that for practical reasons, the build margins for all the five regional grids were only calculated for FY 2004-05. In contrast, separate operating margins were determined for each fiscal year. The combined margins were then determined based on the operating margin for each year and the build margin for 2004-05. The resulting error is expected to be small, because the variations in the build margin will tend to cancel out over years, and because the retrospective build margins are only relevant for a relatively small number of early CDM projects. In the future, the build margins will be updated annually along with the operating margins for each region.
0.00
0.20
0.40
0.60
0.80
1.00
1.20
1.40
2000-01 2001-02 2002-03 2003-04 2004-05
Fiscal Year
tCO
2/M
Wh
NorthEastSouthWestNorth-EastIndia
Figure 2: Development of the operating margin (adjusted for electricity transfers) for India’s regional grids over the period 2000-01 to 2004-05.

14
0.00
0.20
0.40
0.60
0.80
1.00
1.20
2000-01 2001-02 2002-03 2003-04 2004-05
Fiscal Year
tCO
2/M
Wh
NorthEastSouthWestNorth-EastIndia
Figure 3: Development of the combined margin (adjusted for electricity transfers) for India’s regional grids over the period 2000-01 to 2004-05.
Figure 4 below shows a breakdown of the electricity generated by units in the build margin by plant and fuel type. With exception of the north-eastern grid, coal has remained the most important source of energy over the last decade – and will continue to so in the future.
0%
20%
40%
60%
80%
100%
North East South West North-East
India
HydroNuclearOilNaphtaLigniteGasDieselCoal
Figure 4: Breakdown of the build margin (FY 2004-05) by plant and fuel type for all regional grids (shares based on net generation)
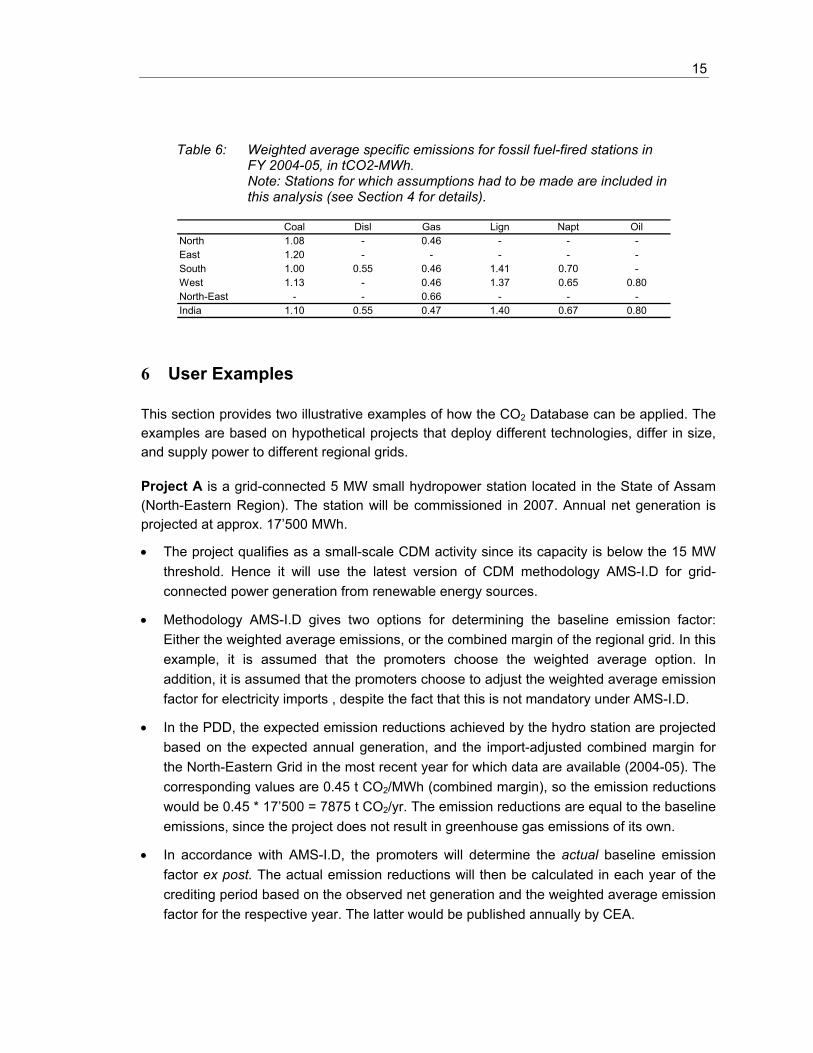
Table 6 shows the weighted average specific emissions for fossil fuel-fired power plants in the five regional grids. Inter-regional variations arise chiefly from differences in plant age and build (installed capacity and conversion technology). The substantially higher emission factor of gas stations in the north-eastern region (0.66 tCO2/MWh) compared to other regions (0.45-0.46 tCO2/MWh) can be explained with the dominance of open-cycle gas stations in the north-eastern grid. However, due to the relatively low absolute generation level in this region, the influence on the country average value is small.
15
Table 6: Weighted average specific emissions for fossil fuel-fired stations in FY 2004-05, in tCO2-MWh. Note: Stations for which assumptions had to be made are included in this analysis (see Section 4 for details).
Coal Disl Gas Lign Napt OilNorth 1.08 - 0.46 - - -East 1.20 - - - - -South 1.00 0.55 0.46 1.41 0.70 -West 1.13 - 0.46 1.37 0.65 0.80North-East - - 0.66 - - -India 1.10 0.55 0.47 1.40 0.67 0.80
6 User Examples
This section provides two illustrative examples of how the CO2 Database can be applied. The examples are based on hypothetical projects that deploy different technologies, differ in size, and supply power to different regional grids.
Project A is a grid-connected 5 MW small hydropower station located in the State of Assam (North-Eastern Region). The station will be commissioned in 2007. Annual net generation is projected at approx. 17’500 MWh.
• The project qualifies as a small-scale CDM activity since its capacity is below the 15 MW threshold. Hence it will use the latest version of CDM methodology AMS-I.D for grid-connected power generation from renewable energy sources.
• Methodology AMS-I.D gives two options for determining the baseline emission factor: Either the weighted average emissions, or the combined margin of the regional grid. In this example, it is assumed that the promoters choose the weighted average option. In addition, it is assumed that the promoters choose to adjust the weighted average emission factor for electricity imports , despite the fact that this is not mandatory under AMS-I.D.
• In the PDD, the expected emission reductions achieved by the hydro station are projected based on the expected annual generation, and the import-adjusted combined margin for the North-Eastern Grid in the most recent year for which data are available (2004-05). The corresponding values are 0.45 t CO2/MWh (combined margin), so the emission reductions would be 0.45 * 17’500 = 7875 t CO2/yr. The emission reductions are equal to the baseline emissions, since the project does not result in greenhouse gas emissions of its own.
• In accordance with AMS-I.D, the promoters will determine the actual baseline emission factor ex post. The actual emission reductions will then be calculated in each year of the crediting period based on the observed net generation and the weighted average emission factor for the respective year. The latter would be published annually by CEA.

16
Project B is a 100 MW grid-connected wind farm located in the State of Tamil Nadu (Southern Region). The project was commissioned in 2005. Average net supplies to the grid are projected at 312,500 MWh per year.
• The project exceeds the 15 MW threshold and thus qualifies as a large-scale CDM activity. Hence it is eligible to use the latest version of methodology ACM0002 for grid-connected power generation from renewable energy sources.
• Under ACM0002, the combined margin approach is mandatory. In addition, inter-regional power transfers (imports and exports) must be taken into account.
• Since wind is an intermittent energy source, the promoter is allowed to assign a weight of 75% to the operating margin, and 25% to the build margin. The resulting combined margin is 0.93 t CO2/MWh (75% x 1.00 + 25% x 0.71) for the fiscal year 2004-05. This value is used for projecting the emission reductions in the PDD.
• Like in the first example, the promoters choose to calculate the actual baseline emission factors ex post. That is, the actual emission reductions will be calculated in each year of the crediting period based on the observed net generation and the combined margin for the respective year. The latter would be calculated from the operating margin and build margin published annually by CEA.
The two CDM project activities are summarised in Table 7 below.

17
Table 7: Illustration on how to use the CO2 Database for calculating the emission reductions of CDM projects
Project A Project B
Project Info
Type: Hydro station Wind park
Size: 5 MW (small-scale according to CDM criteria)
100 MW (large-scale according to CDM criteria)
Projected Generation (net): 17’500 MWh /yr 312’500 MWh /yr
Commissioning year: 2007 2005
Year of CDM registration: 2006 2006
Region: North East South
CDM methodology: AMS-I.D / Version 09 ACM0002 / Version 06
Baseline Emission Factor Calculation
Calculation method: Weighted average Combined margin
Data vintage for projection of emission reductions:
2004-05 (most recent available at time of PDD validation)
2004-05 (most recent available at time of PDD validation)
Data vintage for verification of emission reductions:
Actual year of generation i.e. 2005-06, 2006-07 etc. (emission factor fixed ex post)
Actual year of generation i.e. 2005-06, 2006-07 etc. (emission factor fixed ex post)
Accounting of imports: Not mandatory, but done Mandatory
Weights for combined margin: operating margin: 50% build margin: 50% (general default of ACM0002)
operating margin: 75% build margin: 25% (default f. intermittent sources)
Emission Reduction Calculations
Values in tCO2/MWh:
0.45 Weighted average 1.00 Operating margin 0.71 Build margin 0.93 Combined margin
Projected emission reductions 7’875 t CO2 per year 290’625 t CO2 per year
Actual emission reductions: Monitored net generation x monitored weighted average
Monitored net generation x monitored combined margin

18
7 Updating Procedure
In CDM, emission reductions achieved by projects are often quantified on a yearly basis based on observed performance of the project and the electricity grid. To enable this approach, the CO2 Database will be updated annually by CEA on its website: www.cea.nic.in . Previous versions will be archived by CEA and the main changes relative to previous database versions will be documented.
8 Further Information
For any further information, contact by email:
Chief Engineer(C&E) Ms. Pamposh Bhat Central Electricity Authority Head, CDM India Room No 230, Sewa Bhawan A-33, Gulmohar Park R. K. Puram, New Delhi-110066 New Delhi-110049 Email: [email protected] Email: [email protected]

19
Appendix A – Systems in India’s Regional Grids
In alphabetical order
Abbreviation Full name
APGCL Assam Power Generation Corporation Limited
APGENCO Andhra Pradesh Power Generation Co Limited
ASEB Assam State Electricity Board
BBMB Bhakra Beas Management Board
BSES Reliance Energy Limited
CESC Calcutta Electric Supply Company
CSEB Chattisgarh State Electricity Board
DPL Durgapur projects Limited
DVC Damodar Valley Corporation
GEB Gujrat Electricity Board
GIPCL Gujarat Industries Power Company Limited
GMR Energy GMR Energy Limited
GPEC Gujarat Paguthan Energy Corporation Pvt. Limited
GSECL Gujarat State Electricity Corporation Limited
GVK Ind. GVK Power & Infrastructure Limited
HPGC Haryana Power Generation Corporation
HPSEB Himachal Pradesh State Electricity Board
IPGPCL Indraprastha Power Generation Company Limited
JINDAL JSW Energy Limited
JKEB Jammu & Kashmir Electricity Board
JSEB Jharkand State Electricity Board

20
Continuation
Abbreviation Full name
KPCL Karnataka Power Corporation Limited
KSEB Kerala State Electricity Board
MAHAGENCO Maharastra State Power Generation Company Limited
MAPS Madras Atomic Power Station
MALANA Malana Power Corporation Ltd
MEGEB Meghalaya State Electricity Board
MPGPCL Madhya Pradesh Power Generating Co. Ltd.
MPDC Manipur Power Development Corporation
MSEB Maharastra State Electricity Board
NTPC NTPC Ltd
NAPS Narora Atomic Power Station
NEEPCO North Eastern Electric Power Corporation Ltd
NHDC Narmada Hydro Electric Development Corporation
NHPC National Hydro Electric Corporation
NLC Neyvelli Lignite Corporation Ltd
NPC Nuclear Power Corporation
OHPC Orissa Hydro Power Corporation
OPGC Orissa Power Generation Corporation
PPCL Pondichery Power Corporation Limited
PPNPG PPN Power Generating Company Pvt. Limited
PSEB Punjab State Electricity Board

21
Continuation
Abbreviation Full name
RAPS Rajasthan Atomic Power Station
REL Reliance Energy Ltd
RRVUNL Rajasthan Rajya Vidyut Utpadan Nigam
SJVNL Sutluj Jal Vidyut Nigam Ltd
SPECT. IND Spectrum Power Generation Limited
Tata PCL Tata Power Company Limited
THDC Tehri Hydroelectric Development Corporation
TNEB Tamilnadu Electricity Board
TORR POWER Torrent Power AEC Limited
TVNL Tenughat Vidyut Nigam Limited
UPRVUNL Uttar Pradesh Rajya Vidyut Utpadan Nigam Limited
USEB Uttarnchal State Electricity Board
VVNL Visvesarya Vidyut Nigam Ltd
WBPDC West Bengal Power Development Corporation Ltd
WBSEB West Bengal State Electricity Board

22
Appendix B – Assumptions for CO2 Emission Calculations
BASE PARAMETERS AND ASSUMPTIONS
Fuel Emission Factors (EF) (Source: Coal/Lignite - Initial National Communication, Gas/Oil/Diesel/Naphta - IPCC 2006, Corex - own assumption)Unit Coal Lignite Gas Oil Diesel Naphta Corex
EF based on NCV gCO2 /MJ 95.8 102.4 56.1 77.4 74.1 73.3 0.0Delta GCV NCV % 3.6% 3.6% 10% 5% 5% 5% n/aEF based on GCV gCO2 /MJ 92.5 98.8 51.0 73.7 70.6 69.8 0.0Oxidation Factor - 0.98 0.98 1.00 1.00 1.00 1.00 n/aFuel Emission Factor gCO2 /MJ 90.6 96.9 51.0 73.7 70.6 69.8 0.0n/a = not applicable (i.e. no assumptions were needed)
Assumptions at Station Level (only where data was not provided by station)Unit Coal Lignite Gas Oil Diesel Naphta Hydro Nuclear
Auxiliary Power Consumption % 8.0 10.0 3.0 3.5 3.5 3.5 0.5 10.5Gross Heat Rate kcal /kWh (gross) 2'500 2'713 2'013 2'117 1'975 2'117 n/a n/aNet Heat Rate kcal /kWh (net) 2'717 3'014 2'075 2'193 2'047 2'193 n/a n/aSpecific Oil Consumption ml /kWh (gross) 2.0 3.0 n/a n/a n/a n/a n/a n/aGCV kcal /kg (or m3) 3'755 n/a n/a 10'100 10'500 11'300 n/a n/aDensity t /1,000 lt n/a n/a n/a 0.95 0.83 n/a n/a n/aSpecific CO2 emissions tCO2 /MWh 1.04 1.23 0.44 0.68 0.60 0.64 n/a n/an/a = not applicable (i.e. no assumptions were needed)
Assumptions at Unit Level (by capacity; only for units in the BM, where data was not provided by station)Coal Unit 67.5 MW 120 MW 200-250 MW 500 MWGross Heat Rate kcal /kWh 2'750 2'500 2'500 2'425Auxiliary Power Consumption % 12.0 9.0 9.0 7.5Net Heat Rate kcal /kWh 3'125 2'747 2'747 2'622Specific Oil Consumption ml /kWh 2.0 2.0 2.0 2.0Specific CO2 Emissions tCO2 /MWh 1.19 1.05 1.05 1.00Lignite Unit 75 MW 125 MW 210/250 MWGross Heat Rate kcal /kWh 2'750 2'560 2'713Auxiliary Power Consumption % 12.0 12.0 10.0Net Heat Rate kcal /kWh 3'125 2'909 3'014Specific Oil Consumption ml /kWh 3.0 3.0 3.0Specific CO2 Emissions tCO2 /MWh 1.28 1.19 1.23Gas Unit 0-49.9 MW 50-99.9 MW >100 MWGross Heat Rate kcal /kWh 1'950 1'910 1'970Auxiliary Power Consumption % 3.0 3.0 3.0Net Heat Rate kcal /kWh 2'010 1'969 2'031Specific CO2 Emissions tCO2 /MWh 0.43 0.42 0.43Diesel Unit 0.1-1 MW 1-3 MW 3-10 MW >10 MWGross Heat Rate kcal /kWh 2'350 2'250 2'100 1'975Auxiliary Power Consumption % 3.5 3.5 3.5 3.5Net Heat Rate kcal /kWh 2'435 2'332 2'176 2'047Specific CO2 Emissions tCO2 /MWh 0.72 0.69 0.64 0.60Naphta Unit All sizesIncrement to Gas Heat Rate % 2%Gross Heat Rate kcal /kWh 2'117Auxiliary Power Consumption % 3.5Net Heat Rate kcal /kWh 2'193Specific CO2 Emissions tCO2 /MWh 0.64
Combined Margin UnitWeight OM % 50%Weight BM % 50%
Conversion Factors UnitEnergy kJ /kcal 4.1868
MJ /kWh 3.6
OilSpecific Emission gCO2 /ml 2.96

23
Appendix C – Grid Emission Factors
Table A: Values for all regional grids for FY 2000-01 until FY 2004-05, excluding inter-regional and cross-border electricity transfers.
Weighted Average Emission Rate (tCO2/MWh) (excl. Imports)2000-01 2001-02 2002-03 2003-04 2004-05
North 0.72 0.73 0.74 0.71 0.71East 1.09 1.06 1.11 1.10 1.08South 0.73 0.74 0.81 0.84 0.78West 0.90 0.92 0.90 0.90 0.92North-East 0.39 0.38 0.37 0.36 0.30India 0.82 0.83 0.85 0.85 0.84
Simple Operating Margin (tCO2/MWh) (excl. Imports)2000-01 2001-02 2002-03 2003-04 2004-05
North 0.98 0.98 1.00 0.99 0.97East 1.22 1.22 1.20 1.23 1.20South 1.01 1.00 0.99 1.00 1.00West 0.98 1.01 0.98 0.99 1.01North-East 0.67 0.66 0.68 0.62 0.66India 1.01 1.02 1.02 1.02 1.03
Build Margin (tCO2/MWh) (excl. Imports)2000-01 2001-02 2002-03 2003-04 2004-05
North 0.53East 0.90South 0.71West 0.77North-East 0.10India 0.70
Combined Margin (tCO2/MWh) (excl. Imports)2000-01 2001-02 2002-03 2003-04 2004-05
North 0.76 0.76 0.77 0.76 0.75East 1.06 1.06 1.05 1.07 1.05South 0.86 0.85 0.85 0.86 0.85West 0.88 0.89 0.88 0.88 0.89North-East 0.39 0.38 0.39 0.36 0.38India 0.85 0.86 0.86 0.86 0.86
24
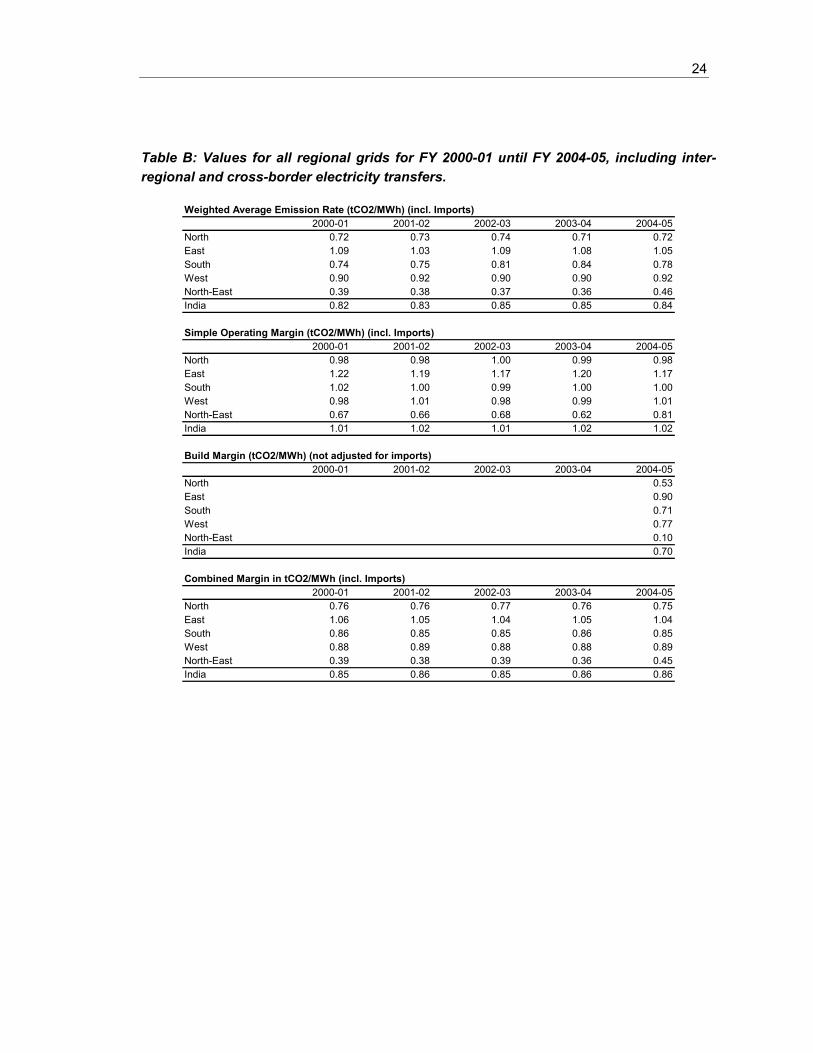
Table B: Values for all regional grids for FY 2000-01 until FY 2004-05, including inter-regional and cross-border electricity transfers.
Weighted Average Emission Rate (tCO2/MWh) (incl. Imports)2000-01 2001-02 2002-03 2003-04 2004-05
North 0.72 0.73 0.74 0.71 0.72East 1.09 1.03 1.09 1.08 1.05South 0.74 0.75 0.81 0.84 0.78West 0.90 0.92 0.90 0.90 0.92North-East 0.39 0.38 0.37 0.36 0.46India 0.82 0.83 0.85 0.85 0.84
Simple Operating Margin (tCO2/MWh) (incl. Imports)2000-01 2001-02 2002-03 2003-04 2004-05
North 0.98 0.98 1.00 0.99 0.98East 1.22 1.19 1.17 1.20 1.17South 1.02 1.00 0.99 1.00 1.00West 0.98 1.01 0.98 0.99 1.01North-East 0.67 0.66 0.68 0.62 0.81India 1.01 1.02 1.01 1.02 1.02
Build Margin (tCO2/MWh) (not adjusted for imports)2000-01 2001-02 2002-03 2003-04 2004-05
North 0.53East 0.90South 0.71West 0.77North-East 0.10India 0.70
Combined Margin in tCO2/MWh (incl. Imports)2000-01 2001-02 2002-03 2003-04 2004-05
North 0.76 0.76 0.77 0.76 0.75East 1.06 1.05 1.04 1.05 1.04South 0.86 0.85 0.85 0.86 0.85West 0.88 0.89 0.88 0.88 0.89North-East 0.39 0.38 0.39 0.36 0.45India 0.85 0.86 0.85 0.86 0.86

25
Appendix D – Summary of Methodology ACM0002 / Version 06
Download ACM0002 at: http://cdm.unfccc.int/methodologies/PAmethodologies/approved.html
ACM0002 is a consolidated CDM methodology for grid-connected power generation from renewable energy sources, including:
• Run-of-river hydro power plants, and hydro power projects with existing reservoirs where the volume of the reservoir is not increased;
• Wind sources;
• Geothermal sources;
• Solar sources;
• Wave and tidal sources.
The methodology requires the calculation of the baseline emission factor following the combined margin (CM) approach. The combined margin consist of a weighted average of:
• Operating margin (OM);
• Build margin (BM).
The relative weights used to determine the combined margin are by default the same, i.e. 50%. Alternative weights can be used for intermittent power sources.
There are four options to calculate the operating margin, depending on local conditions:
• Simple operating margin. This is the preferred approach for India, except potentially in regions with a very high share of hydro power (North-Eastern Region).
• The other three approaches are: (i) simple adjusted operating margin; (ii) dispatch data analysis; and (iii) average operating margin.
The build margin is the generation-weighted average emission factor of the most recent power plants, consisting of the larger of (i) the five power plants that have been built most recently; or (ii) the capacity additions that represent 20% of the system generation that have been built most recently. In India, the latter approach generally yields the larger sample and hence must be followed.
The operating margin must be adjusted for electricity transfers (imports) from connected electricity systems (other states/regions, other countries) to the project electricity system. Generally, no such adjustments are required for the build margin.
The actual emission reductions achieved by a CDM project are calculated based on the monitored electricity production in each year, and the combined margin (baseline emission factor). The combined margin is initially calculated from the most recent data available at the time of PDD submission. It can then either remain fixed for the duration of the project’s crediting period (ex-ante approach), or be updated annually (ex-post approach). The two approaches have different requirements in terms of data vintage.
26
Appendix E – Abbreviations
In alphabetical order
Abbreviation Full Name
ACM0002 Approved Consolidated Methodology by CDM executive Board for grid connected large scale renewable project
AMS-I.D Approved Methodology for small scale grid connected renewable projects
BM Build Margin
CDM Clean Development Mechanism
CEA Central Electricity Authority
CER Certified Emission Reduction
CM Combined Margin
CO2 Carbon Dioxide
FY Financial Year
GCV Gross Calorific Value
GHG Greenhouse Gases
GWH Gigawatt Hour
IEA International Energy Agency
IPCC Intergovernmental Panel on Climate Change
IPP Independent Power Producer
MW Megawatt
OM Operating Margin
PDD Project Design Document
RLDC Regional Load Dispatch Centre
RPC Regional Power Committee
UNFCCC United Nations Framework Convention on Climate Change
![Energy XT PRO BaseLine Application [A00003xx-A00013xx]mosinv.ru/Documentation/XT-PRO/8MA10073 EXT Pro Baseline... · Energy XT PRO BaseLine Application [A00003xx-A00013xx] BaseLine](https://static.fdocuments.in/doc/165x107/5ca5dcdf88c99388188d3802/energy-xt-pro-baseline-application-a00003xx-a00013xx-ext-pro-baseline-energy.jpg)