CMOST: an open-source framework for the microsimulation of ...
16
TECHNICAL ADVANCE Open Access CMOST: an open-source framework for the microsimulation of colorectal cancer screening strategies Meher K. Prakash 1 , Brian Lang 2,3 , Henriette Heinrich 1 , Piero V. Valli 1 , Peter Bauerfeind 1 , Amnon Sonnenberg 4 , Niko Beerenwinkel 2,3 and Benjamin Misselwitz 1* Abstract Background: Colorectal cancer (CRC) is a leading cause of cancer-related mortality. CRC incidence and mortality can be reduced by several screening strategies, including colonoscopy, but randomized CRC prevention trials face significant obstacles such as the need for large study populations with long follow-up. Therefore, CRC screening strategies will likely be designed and optimized based on computer simulations. Several computational microsimulation tools have been reported for estimating efficiency and cost-effectiveness of CRC prevention. However, none of these tools is publicly available. There is a need for an open source framework to answer practical questions including testing of new screening interventions and adapting findings to local conditions. Methods: We developed and implemented a new microsimulation model, Colon Modeling Open Source Tool (CMOST), for modeling the natural history of CRC, simulating the effects of CRC screening interventions, and calculating the resulting costs. CMOST facilitates automated parameter calibration against epidemiological adenoma prevalence and CRC incidence data. Results: Predictions of CMOST were highly similar compared to a large endoscopic CRC prevention study as well as predictions of existing microsimulation models. We applied CMOST to calculate the optimal timing of a screening colonoscopy. CRC incidence and mortality are reduced most efficiently by a colonoscopy between the ages of 56 and 59; while discounted life years gained (LYG) is maximal at 49–50 years. With a dwell time of 13 years, the most cost-effective screening is at 59 years, at $17,211 discounted USD per LYG. While cost-efficiency varied according to dwell time it did not influence the optimal time point of screening interventions within the tested range. Conclusions: Predictions of CMOST are highly similar compared to a randomized CRC prevention trial as well as those of other microsimulation tools. This open source tool will enable health-economics analyses in for various countries, health-care scenarios and CRC prevention strategies. CMOST is freely available under the GNU General Public License at https://gitlab.com/misselwb/CMOST Keywords: Colorectal cancer, Screening colonoscopies, Screening intervals, Cost-effectiveness, Microsimulation * Correspondence: [email protected] 1 Division of Gastroenterology, University Hospital Zurich (USZ), Rämistrasse 100, 8091 Zurich, Switzerland Full list of author information is available at the end of the article © The Author(s). 2017 Open Access This article is distributed under the terms of the Creative Commons Attribution 4.0 International License (http://creativecommons.org/licenses/by/4.0/), which permits unrestricted use, distribution, and reproduction in any medium, provided you give appropriate credit to the original author(s) and the source, provide a link to the Creative Commons license, and indicate if changes were made. The Creative Commons Public Domain Dedication waiver (http://creativecommons.org/publicdomain/zero/1.0/) applies to the data made available in this article, unless otherwise stated. Prakash et al. BMC Medical Informatics and Decision Making (2017) 17:80 DOI 10.1186/s12911-017-0458-9
Transcript of CMOST: an open-source framework for the microsimulation of ...

Prakash et al. BMC Medical Informatics and Decision Making (2017) 17:80 DOI 10.1186/s12911-017-0458-9
TECHNICAL ADVANCE Open Access
CMOST: an open-source framework for themicrosimulation of colorectal cancerscreening strategies
Meher K. Prakash1, Brian Lang2,3, Henriette Heinrich1, Piero V. Valli1, Peter Bauerfeind1, Amnon Sonnenberg4,Niko Beerenwinkel2,3 and Benjamin Misselwitz1*Abstract
Background: Colorectal cancer (CRC) is a leading cause of cancer-related mortality. CRC incidence and mortality can bereduced by several screening strategies, including colonoscopy, but randomized CRC prevention trials face significantobstacles such as the need for large study populations with long follow-up. Therefore, CRC screening strategies will likelybe designed and optimized based on computer simulations. Several computational microsimulation tools have beenreported for estimating efficiency and cost-effectiveness of CRC prevention. However, none of these tools is publiclyavailable. There is a need for an open source framework to answer practical questions including testing of new screeninginterventions and adapting findings to local conditions.
Methods: We developed and implemented a new microsimulation model, Colon Modeling Open Source Tool (CMOST),for modeling the natural history of CRC, simulating the effects of CRC screening interventions, and calculating theresulting costs. CMOST facilitates automated parameter calibration against epidemiological adenoma prevalence and CRCincidence data.
Results: Predictions of CMOST were highly similar compared to a large endoscopic CRC prevention study as well aspredictions of existing microsimulation models. We applied CMOST to calculate the optimal timing of a screeningcolonoscopy. CRC incidence and mortality are reduced most efficiently by a colonoscopy between the ages of 56 and 59;while discounted life years gained (LYG) is maximal at 49–50 years. With a dwell time of 13 years, the most cost-effectivescreening is at 59 years, at $17,211 discounted USD per LYG. While cost-efficiency varied according to dwell time it didnot influence the optimal time point of screening interventions within the tested range.
Conclusions: Predictions of CMOST are highly similar compared to a randomized CRC prevention trial as well as thoseof other microsimulation tools. This open source tool will enable health-economics analyses in for various countries,health-care scenarios and CRC prevention strategies. CMOST is freely available under the GNU General Public License athttps://gitlab.com/misselwb/CMOST
Keywords: Colorectal cancer, Screening colonoscopies, Screening intervals, Cost-effectiveness, Microsimulation
* Correspondence: [email protected] of Gastroenterology, University Hospital Zurich (USZ), Rämistrasse100, 8091 Zurich, SwitzerlandFull list of author information is available at the end of the article
© The Author(s). 2017 Open Access This article is distributed under the terms of the Creative Commons Attribution 4.0International License (http://creativecommons.org/licenses/by/4.0/), which permits unrestricted use, distribution, andreproduction in any medium, provided you give appropriate credit to the original author(s) and the source, provide a link tothe Creative Commons license, and indicate if changes were made. The Creative Commons Public Domain Dedication waiver(http://creativecommons.org/publicdomain/zero/1.0/) applies to the data made available in this article, unless otherwise stated.
Prakash et al. BMC Medical Informatics and Decision Making (2017) 17:80 Page 2 of 16
BackgroundColorectal cancer (CRC) is the second most commondeadly cancer in the United States [1] and many otherWestern countries. It represents an important public healthburden in industrialized countries and increasingly also indeveloping countries [2]. Since treatment options for ad-vanced cancer are limited, current public health strategiesfocus on CRC screening for prevention of mortality.CRC is remarkable for the long-term presence of ad-
enomatous carcinoma precursors [3, 4]. Early adenomasare, by definition, adenomas with a tubular histology anda size of less than 10 mm. Advanced adenomas are ei-ther larger than 10 mm in size or display an advancedvillous or serrated histology. Adenomas are more fre-quent in males and their frequency increases with age.While adenomas are infrequently observed before theage of 30 years, within the screening population of 50–80 year olds, prevalence rates of at least one early aden-oma and at least one advanced adenoma are 30% and6%, respectively [5]. The presence of adenomas is an im-portant risk factor for subsequent CRC [6].The natural history of CRC, i.e., the sequence of events
leading to CRC in each individual patient, has not beensufficiently clarified. For instance, the adenoma dwelltime, i.e., the average time from initiation of an adenomauntil initiation of CRC, remains unknown [7, 8]. Further-more, several lines of evidence indicate that right sidedCRC (close to cecum) and left sided CRC (close to rec-tum) differ regarding their biological behavior: a signifi-cant fraction of right-sided CRC derives from serratedadenomas with possible faster progression rates andlower detectability during endoscopy [9, 10].Endoscopy is an attractive method for CRC screening be-
cause adenomas can be removed by polypectomy duringthis intervention, thus effectively preventing CRC [6]. Add-itional benefits of CRC screening include identification ofhigh-risk individuals for surveillance via the presence of ad-enomas. Furthermore, screening detects CRC at earlierstages with better survival as compared to symptomaticcancer [11]. The effectiveness of rectosigmoidoscopy, whichonly visualizes the left-sided colon, in reducing CRC inci-dence and mortality was demonstrated in several large ran-domized controlled studies [12–16]. Colonoscopy, whichvisualizes the whole colon, may be similarly effective as rec-tosigmoidoscopy [17–20], but rigorous randomized con-trolled trials have been initiated only recently [21]. As such,the true magnitude of CRC risk reduction by colonoscopyis still unknown. Despite these limitations, colonoscopyscreening programs have been implemented in several in-dustrialized countries. It is generally recommended that in-dividuals between ages 50–75 years undergo screeningevery 10 years, an interval which has not been determinedin any systematic way [22]. Alternative CRC screeningmethods that have also been shown to reduce CRC
mortality include detection of fecal occult blood in the stoolas a cancer biomarker [23].The optimal application of CRC screening remains a
central task in gastroenterology. However, most of theopen questions, such as optimal timing of multiplescreening colonoscopies, will likely never be answeredby high-quality clinical studies. Randomized trials ofCRC screening would need a long follow-up of at least10 years, its costs are unlikely to be covered by commer-cial sponsors, and patient compliance might be low dueto the (largely unwarranted) perception of colonoscopybeing unpleasant or dangerous. Due to these limitations,alternative strategies for studying CRC prevention usingcomputer simulations have been developed.In microsimulations, a large, simulated, population of
many individual patients is followed throughout individuallifetimes for colonic lesions. Microsimulations account forthe individual risk for colorectal cancer, the age-dependentgradual appearance of adenomas, the development of aden-omas into cancer, and the detection and treatment of CRC.Assumptions about occurrence and growth rates of aden-omas are calibrated to reflect the natural history of CRC.Further, the effect of screening interventions and polypect-omy can be incorporated into the model. Simulation exper-iments are appealing, because a calibrated and validatedmodel allows for the assessment of a wide range of medicalscreening interventions, such as multiple screening colon-oscopies, in a time-efficient and cost-effective manner.Three microsimulation models, namely Microsimula-
tion Screening Analysis (MISCAN), Colorectal CancerSimulated Population model for Incidence and Naturalhistory (CRC-SPIN), and Simulation Model of ColorectalCancer (SimCRC) have been described (http://cisnet.-cancer.gov/colorectal/ [24]). These models have beenvery useful to evaluate various screening interventionsfor CRC with a high degree of confidence [25–29], andthey share several features. All models assume that car-cinomas develop exclusively from adenomas. Adenomasprogress to advanced adenomas or cancer following spe-cific rules and parameters are fit to match the epidemio-logically observed prevalence of adenomas, advancedadenomas, and cancer. However, individual model pre-dictions differ and depend on model assumptions andon the choice of parameters [8].Adenoma dwell time, defined as the time from the ap-
pearance of clinically detectable adenoma to the appear-ance of carcinoma, presents the window of opportunityfor effective screening. However, the value of this criticalparameter remains unknown. It cannot be determinedempirically since adenomas cannot be left in situ. Thepublished microsimulation models assume differentvalues: MISCAN assumes a short adenoma dwell time of6 years, resulting in rapid adenoma progression and ag-gressive behavior. By contrast, SimCRC and CRC-SPIN
Prakash et al. BMC Medical Informatics and Decision Making (2017) 17:80 Page 3 of 16
use a dwell time of 23 and 18 years, respectively, leadingto slow adenoma progression and more benign behavior[30]. Differences of MISCAN, SimCRC, and CRC-SPINare not restricted to adenoma dwell time, and it remainsunknown which model features are responsible for differ-ences in predictions. Further, even though general featuresof all microsimulation models are described, the modelsare not publicly available and hence predictions of thesemodels cannot be independently reproduced or advanced.There is a growing awareness towards CRC screening
and its costs and a constant need to determine the cost-effectiveness of various screening strategies. Further-more, many new countries with different CRC epidemi-ology and health-care costs will be implementing CRCscreening programs. Thus, there is an immediate re-quirement for an open source tool that is transparent,easily accessible, and adaptable for addressing highlyrelevant clinical and health economy questions.Here, we present Colon Modeling Open Source
Tool (CMOST), a new, open-source CRC microsi-mulation model. We calibrated our model againstclinical data including a large rectosigmoidoscopyscreening trial and compared it to existing microsi-mulation tools. We developed three parameteriza-tions of our model differing in adenoma dwell time.Our results show that adenoma dwell time influencessome but not all predictions of our CRC microsimu-lation model. The model offers the flexibility to de-sign new screening protocols and costs as well as to
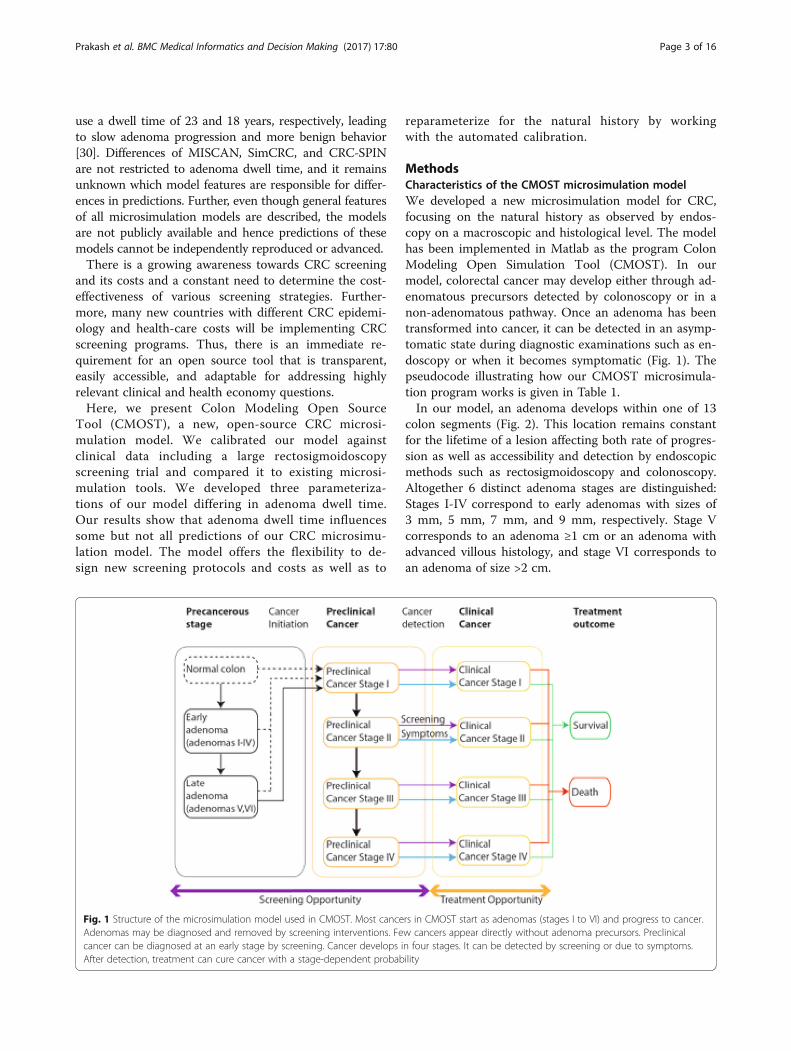
Fig. 1 Structure of the microsimulation model used in CMOST. Most canceAdenomas may be diagnosed and removed by screening interventions. Fecancer can be diagnosed at an early stage by screening. Cancer develops iAfter detection, treatment can cure cancer with a stage-dependent probab
reparameterize for the natural history by workingwith the automated calibration.
MethodsCharacteristics of the CMOST microsimulation modelWe developed a new microsimulation model for CRC,focusing on the natural history as observed by endos-copy on a macroscopic and histological level. The modelhas been implemented in Matlab as the program ColonModeling Open Simulation Tool (CMOST). In ourmodel, colorectal cancer may develop either through ad-enomatous precursors detected by colonoscopy or in anon-adenomatous pathway. Once an adenoma has beentransformed into cancer, it can be detected in an asymp-tomatic state during diagnostic examinations such as en-doscopy or when it becomes symptomatic (Fig. 1). Thepseudocode illustrating how our CMOST microsimula-tion program works is given in Table 1.In our model, an adenoma develops within one of 13
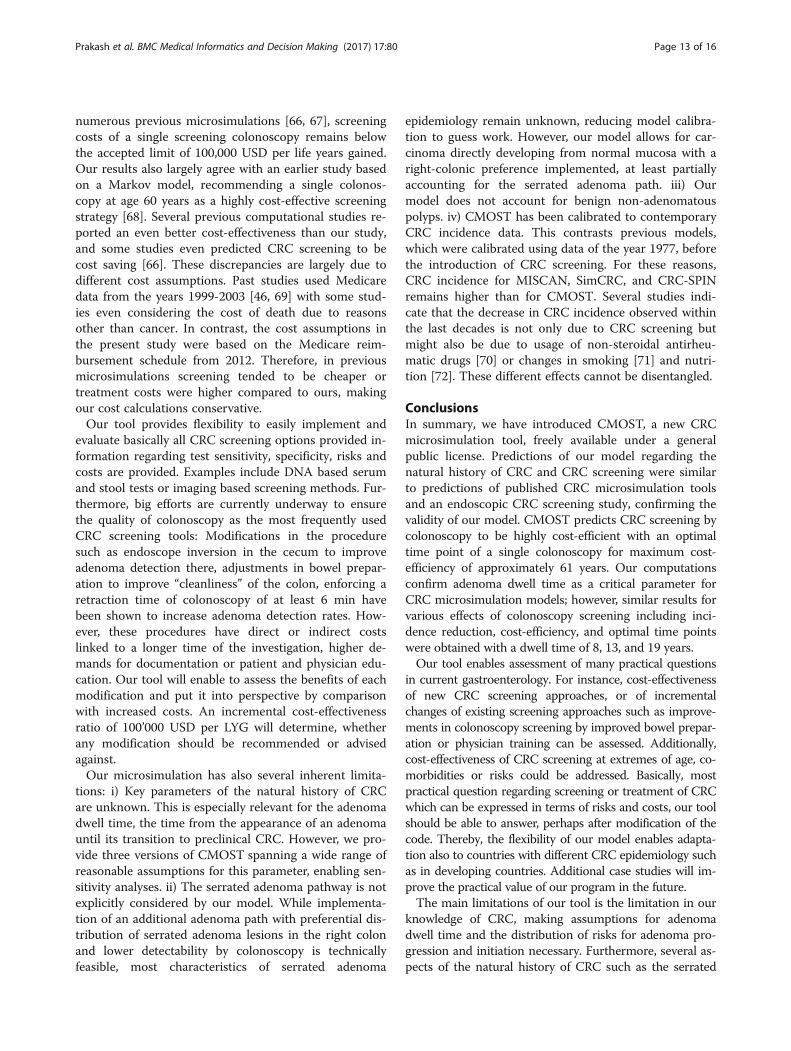
colon segments (Fig. 2). This location remains constantfor the lifetime of a lesion affecting both rate of progres-sion as well as accessibility and detection by endoscopicmethods such as rectosigmoidoscopy and colonoscopy.Altogether 6 distinct adenoma stages are distinguished:Stages I-IV correspond to early adenomas with sizes of3 mm, 5 mm, 7 mm, and 9 mm, respectively. Stage Vcorresponds to an adenoma ≥1 cm or an adenoma withadvanced villous histology, and stage VI corresponds toan adenoma of size >2 cm.
rs in CMOST start as adenomas (stages I to VI) and progress to cancer.w cancers appear directly without adenoma precursors. Preclinicaln four stages. It can be detected by screening or due to symptoms.ility

Table 1 Pseudocode for the CMOST program flowimplemented in MATLAB
MAIN MODULE OF CMOST: individually tracks every individual in apopulation
Input:
- Model parameters determining natural history of CRC
- Settings for CRC screening and surveillance
Output:
- Death year, cause of death and years lost to CRC for each individual
- CRC incidence, prevalence, stages, mode of detection and outcomefor each CRC and each individual
- Adenoma prevalence and adenoma stages for the whole population
- Usage of screening and surveillance interventions
- All CRC related costs
for Year = 1 to 100 and if Alive = ‘YES’
for IndividualNumber = 1 to NumberOfIndividuals
call function AdenomaNaturalHistory(Record)
%— updates the natural history of adenomas and development tocancer
if (Screening.Mode=’ON’ and Screening.Preference=’COLONOSCOPY’and Screening.Year=Year) or
(Cancer.Symptomatic=’YES’) or (FollowUp.Year = Year)
%— if colonoscopy is a preferred screening option, or if cancer issymptomatic or for followup
call function Colonoscopy
if Treatment=’ON’ and (Year-Cancer.DetectionYear) > 5 years
Treatment=’OFF’
elseif Treatment=’ON’ and (Year-Cancer.DetectionYear) < 5 years
call function AddCost(Treatment=’ON’)
if rand > DeathFromCancer.Chance
Alive.Cancer=’NO’
DeathFromCancer.Year = Year % — used for treatment costs in thelast year before death from cancer
elseif rand > DeathFromNaturalCauses.Chance
Alive=’NO’
end IndividualNumber
end Year
function AdenomaNaturalHistory(Record)
% — new adenoma(s) appear (influenced by age, gender, colonlocation, individual risk)
Record.(AdenomaStage=I) = Record.(AdenomaStage=I) +ChanceOfNewAdenoma
% — adenoma progression (influenced by age, gender, colonlocation, individual risk)
Record.(AdenomaStage=II to VI) = Record.(AdenomaStage=II to VI) +AdenomaStageProgression
Record.CancerStage(1) = Record.CancerStage(I) +AdenomatousCancer(FromAdenomaStage=VI)
+ FastCancer(FromAdenomaStage=I to V) +DirectCancer(FromNoAdenoma)
Table 1 Pseudocode for the CMOST program flowimplemented in MATLAB (Continued)
Record.CancerStage(2 to 4) = Record.CancerStage(2 to 4) +CancerStageProgression
Cancer.Symptomatic = ChanceOfSymptoms(Record.CancerStage)
end function AdenomaNaturalHistory
function Colonoscopy(Record)
Adenoma.Detected =ChanceOfAdenomaDetection(Record.AdenomaStage,Record.AdenomaLocation)
Cancer.Detected = ChanceOfCancerDetection(Record.CancerStage,Record.CancerLocation)
if Cancer.Detected = ’YES’
Cancer.DetectionYear = Year
Record.Cancer = 0%— assume curative treatment has beenperformed
Treatment = ’ON’
elseif Adenoma.Detected = ’Yes’
Polypectomy = ’YES’
Record.Adenoma = 0%— remove the adenomas by polypectomy
Adenoma.Detected = 0
FollowUp.Year = RecommendedYear % — recommend followupaccording to guidelines
if rand > ChanceOfComplication
Complications = ’YES’
If rand > ChanceOfDeathFromComplications
Alive = ’NO’
call function AddCosts(Colonoscopy, Polypectomy, Complications)
end function Colonoscopy
function AddCosts
Cost = Cost + if(Colonoscopy = ’YES’) x InputCost.Colonoscopy +
and in the last year of death from cancerif(Polypectomy = ’YES’) xInputCost.Polypectomy +
and in the last year of death from cancerif(Complications = ’YES’) xInputCost.Complications +
and in the last year of death from cancerif(Treatment = ’ON’) xInputCost.TreatmentCost(Year – Cancer.DetectionYear)
and in the last year of death from cancer%— the treatment cost isdivided into 3 stages: initial, continuing and last year costs for the firstquarter, upto 5 years and in the last year of death from cancer
end function AddCosts
Prakash et al. BMC Medical Informatics and Decision Making (2017) 17:80 Page 4 of 16
CMOST tracks the history of a general populationfrom birth until death or a maximum age of 100 years.Adenoma initiation, progression to advanced adenomaand cancer, cancer progression, screening, and surveil-lance are all modeled in time increments of 3 months.
Choice of parametersThe relevant parameters used for the description of thenatural history of CRC are summarized in Table 2, andtheir values are provided in the supplementary

Fig. 2 Location of adenomas and cancer within the colon. The large intestine has been divided into 13 relevant segments. The CMOST modelassumes location dependence for the progression and detectability of adenomas and cancers. Colonoscopy reaches the cecum in 95% of cases.Rectosigmoidoscopy is easier to perform but limited in scope and meant to reach the left flexure in the majority of cases
Prakash et al. BMC Medical Informatics and Decision Making (2017) 17:80 Page 5 of 16
information. Some of these parameters depend on ageand hence are defined by a function, for instance theage-dependent adenoma initiation risk of an individualis assumed to be a sigmoidal function. The sigmoidfunction was chosen since the benchmark parameter (i.e.age-dependent adenoma prevalence) also follows a sig-moidal function and can thus be conveniently repro-duced. The model parameters age dependent early/advanced adenoma progression are described by Gauss-ian functions, since these functions provide maximalflexibility allowing for a monotonously increasing or de-creasing curve or a curve with a maximum.Other model parameters are assumed to be stochas-
tic and hence are defined by an assumed probabilitydistribution. In this case the value for the individualor the adenoma is drawn randomly from the respect-ive distribution in each simulation run. The param-eter will then remain constant throughout the lifetimeof the individual or adenoma. Examples include therisk for new adenomas specific for an individual or aprogression risk specific for a given adenoma (seebelow). Other parameters, e.g., the relative risk ofmales versus females, are scaling factors for the re-spective condition.Please note that our parameters cannot be directly com-
pared to parameters from existing microsimulationmodels since different strategies for the description of thenatural history of CRC were used [31]: For MISCAN, the
duration of an adenoma in a given state (not adenomaprogression rates) are used to describe the natural historyof CRC and duration of adenomas are drawn from an ex-ponential distribution. For CRC-Spin, adenoma growthfollows a Janoschek growth model and CRC growth an ex-ponential model. Finally, in SimCRC describing adenomainitiation and progression follow logistic regressioncurves, resembling our description of the natural historyof CRC closest. It should be noted that due to the limitedunderstanding of the natural history of CRC, the bestmathematical descriptions of adenoma and CRC initiationand progression cannot be determined.
Simulating the natural history of CRCAt birth, an individual adenoma risk is assigned toeach individual, which defines high or low CRC riskfor this individual. At each time increment we decideabout initiation of an adenoma, at random, consider-ing both the individual adenoma risk and the agedependent adenoma risk. Upon adenoma initiation, anadenoma specific progression risk will be assigned toeach adenoma. A high risk defines a quickly progres-sing aggressive adenoma, whereas a low risk defines abenign adenoma.At each time increment, each adenoma might undergo
one of the following changes: i) Adenoma progression:the risk for progression is determined by the product ofan age-dependent adenoma progression risk, the

Table 2 Description of the different parameters used in CMOST model. The procedure for calculating the parameters is described inthe supplementary information
Model parameter Properties Functional form(whereapplicable)
Age-dependent adenoma initiation risk Defined by a sigmoidal function. a01 þ exp − a1y−a2ð Þð Þ
Age-dependent early adenoma progression risk Defined by a Gaussian function. b0 exp(−(b1y −b2)
2)
Age-dependent advanced adenoma progression risk Defined by a Gaussian function. c0 exp(−(c1y −c2)
2)
Individual adenoma risk Cumulative density function describing the relationship betweenpopulation proportions and individual risk for appearance of newadenomas. Defined by automatically calibrated anchor points.
Early and advanced adenoma specific progression risk Cumulative density function describing the relationship betweenearly or advanced adenoma proportions and adenoma specificprogression risk. Defined by manually calibrated anchor points.
Correction factors male/female for i) adenoma initiation ii)early adenoma progression iii) advanced adenomaprogression
Constant
Correction factor rectum/colon for i) early adenomaprogression ii) advanced adenoma progression
Constant
Adenoma stage-specific progression risk Constant. One value for each adenoma stage 1-6, enables finetuning of the distribution of adenoma stages 1-6
Adenoma stage-specific regression risk Constant. One value for each adenoma stage (1-6 highest for 1,lowest for 6); not calibrated
Adenoma stage-specific cancer risk Constant. One value for each adenoma stage (1 to 5), calibratedto match prevalence of cancer in adenomas
Location specific direct cancer risk Constant. One value for each colon segment 1-13 (calibrated tomatch CRC incidence reduction in rectosigmoidoscopy CRCprevention study)
Prakash et al. BMC Medical Informatics and Decision Making (2017) 17:80 Page 6 of 16
progression risk of the given adenoma, the progressionrisk of the adenoma stage, and correction factors for fe-male gender or rectal location if applicable. ii) Fast pro-gression of adenoma to cancer: the risk of this eventdepends on the age-dependent advanced adenoma pro-gression rate, the stage of the adenoma, gender, and lo-cation. iii) Adenoma regression: with very lowprobability, regression of an adenoma (or disappearanceof a stage-I adenoma) is possible [32–36]; the risk of thisevent is defined by the adenoma stage.Initiation of CRC can happen via three different pathways
(Fig. 1): i) Progression of a stage 6 adenoma: this pathwayaccounts for approximately two thirds of all carcinoma inour microsimulation. ii) Fast progression of a smaller aden-oma (stage 1-4) as described above. iii) Direct cancer with-out adenomatous precursors; such a pathway wasintroduced to match data from randomized endoscopicCRC prevention trials [12, 15, 37, 38] regarding preventionof right-sided adenomas after rectosigmoidoscopy screen-ing. This direct cancer pathway represents cancers withprecursors difficult or impossible to detect by colonoscopy.These cancers occur preferentially within the right colonand the direct cancer pathway reflects the reduced efficacy
of CRC prevention by colonoscopy regarding right-sidedCRC [39, 40].At initiation of a cancer a sojourn time, i.e., the
time from the initiation of the cancer to it becomingsymptomatic, is assigned to the cancer. The sojourntime is drawn from a normal distribution of valueswith a mean of 3 years [8, 41] and a standard devi-ation of 0.5 years. The stage at which symptoms willappear is chosen to reflect the stage distribution ofsymptomatic cancers. The time spent in each stage isalso predefined for each cancer to reflect the stagedistribution of cancers detected during colonoscopyscreening [42].After sojourn time a carcinoma will become symp-
tomatic, triggering a diagnostic colonoscopy. Upondetection of a cancer, survival time will be defined,following published survival rates for the respectiveCRC stage [43]. Death from CRC is restricted to5 years after CRC diagnosis.In our microsimulation death results from colon can-
cer, medical interventions, or from other age-dependentcauses of mortality according to the 2008 US Life TableData [44]. An individual patient who dies of CRC is

Prakash et al. BMC Medical Informatics and Decision Making (2017) 17:80 Page 7 of 16
followed in the simulation until he would have died fromother causes.
Simulation of CRC screeningCMOST supports simulation of CRC screening and de-tection by colonoscopy. For each colonoscopy, theamount of colon visualized is drawn from a specifieddistribution, with 95% of all colonoscopies reaching thececum on average. For each adenoma, our microsimula-tion will determine whether the respective lesion will bedetected during a given intervention [45]. The probabil-ity of detection depends on adenoma stage and whetherthe lesion resided within the visualized colon. CMOSTalso accounts for slightly reduced adenoma detection atthe hepatic and splenic flexure. CMOST considers thefollowing complications of colonoscopy: i) major bleed-ing (4 per 10,000), ii) minor bleeding (11 per 10,000), iii)mucosal burn (3 per 10,000) and iv) perforation (7 per10,000) [46]. The probabilities of these complications arederived from published data and increase 2-fold afterpolypectomy [47].Rectosigmoidoscopy is implemented similar to colon-
oscopy but with the limitation that the colon is visual-ized only from rectum to the left-flexure (on average 6of the 13 segments of the colon). Due to poor bowelpreparation and additional technical limitations, theprobability to detect an adenoma is assumed to be lowerthan for colonoscopy (12.5% lower probability of detec-tion for advanced adenomas and 25% for early adenomascompared to colonoscopy). The risk of complicationsduring rectosigmoidoscopy is much lower than for col-onoscopy [48] and no lesions will be removed. Any le-sion detected at this intervention will trigger acolonoscopy.CMOST also supports additional screening interven-
tions including fecal occult blood test (FOBT) or im-mune -FOBT. The parameters of all screeningintervention as well as adherence to screening andfollow-up colonoscopy can be freely adjusted. CMOSTallows for the definition of a screening plan with a start-ing date, a finishing date, an adherence rate and ascreening interval.
Cost calculationsOur model includes costs for screening colonoscopy, po-tential polypectomy, and procedural complications. Inour cost calculations, treatment costs during 5 yearsafter cancer diagnosis are considered. Treatment is di-vided into three phases: The initial care phase lasting3 months includes cancer detection, surgery and radi-ation as well as chemotherapy in selected situations de-pending on the stage and location of the carcinoma. Incase of death from CRC, the phase of terminal care lastsup to 12 months and includes additional palliative
surgery in 50% and palliative chemotherapy in all pa-tients. The period of continued treatment with moni-toring and consultation visits spans from the end ofthe initial phase to the beginning of the last year orthe end of treatment. Screening and treatment costs(Additional file 1: Table S1) are based on the Diagno-sis Related Group (DRG) codes for the outpatient set-ting and Current Procedural Terminology (CPT)codes for the inpatient setting, using the correspond-ing Medicare reimbursement schedule (http://www.cms.gov). Average national US payments for theyear 2012 are used in the present calculations. Costsand life years gained are computed via comparison tothose that accrue in the non-screening scenario. Both,costs and LYG are discounted by a 3% annual dis-count rate. A list of costs used for our study is pro-vided in Additional file 2: Tables S7 and Additionalfile 3: Table S8.
Automated parameter calibrationCMOST supports automated calibration of model pa-rameters to meet epidemiological benchmarks regard-ing the natural history of colorectal cancer. Tocalibrate our model to the US American population,we used published age- and sex-specific adenomaprevalence rates as benchmarks [18, 49–51]. Carcin-oma incidence and mortality, as well as separatecolon and rectum cancer incidence rates, are modeledaccording to data from the Surveillance Epidemiologyand End Results (SEER) database for 2005–2009 [52].The stage distributions of symptomatic and asymp-tomatic cancers also follow published analyses [11,53]. Altogether we used 105 benchmarking datapoints covering various quantities predicted by themodel for parameter estimation. A full list of allbenchmarks is provided in Additional file 1: Table S1.Our strategy for automated parameter calibration isexplained in detail in Section V of the Supplement.Briefly: we divide the natural history of CRC into foursteps (I: early adenoma, II: advanced adenoma, III:cancer, IV: direct cancer) and perform calibration ofthe group of parameters relevant for each of thesesteps sequentially. Our implementation of the naturalhistory of CRC has been designed in a way that foreach calibration step a lower step will influence thereadouts of all higher steps but not vice versa. For in-stance, adjusting parameters in step 1 to increase theincidence of early adenomas by 10% will also changethe incidence of advanced adenomas by 10%. Viceversa, modifying parameters of step 2 to increase ad-enoma progression to increase advanced adenoma in-cidence by 10% will affect early adenoma prevalenceto a lesser degree: Faster early adenoma progressionwill decrease early adenoma prevalence since some

Prakash et al. BMC Medical Informatics and Decision Making (2017) 17:80 Page 8 of 16
early adenomas will be advanced adenomas now.However, the decrease will only be approximately 1%since prevalence of early adenomas is 10 times higherthan for advanced adenomas. For these reasons, allfour steps can be considered independent calibrationsteps and are performed sequentially and sequentialcalibrations yields in satisfactory results.However, practical tests showed that even better
fitting could be achieved by a final calibration stepwhich simultaneously readjust parameters for step 2and 3 simultaneously. Furthermore, our programprovides the option to automatically perform param-eter calibration of steps 1-3 sequentially, followed bya fine-tuning of parameters in steps 2 and 3 as asingle procedure (for instance on a cluster com-puter). Details of these procedures are explained inthe Manual.For each calibration, we used a heuristic greedy algo-
rithm followed by Nelder-Mead optimization [54] tominimize the squared error between the benchmarkvalues and the corresponding model predictions for par-ameter estimation. Automated parameter calibration isrequired only when the benchmarks of the natural his-tory are changed or when different possibilities for theadenoma dwell time within the same natural history areto be explored.
Implementation of CMOSTDetails of all features of CMOST can be found in theaccompanying manual. The software is available undera GNU general public license and can be downloadedat https://gitlab.com/cmostmodel/CMOST. CMOSThas been implemented in Matlab®. Time criticalcalculations were implemented using the Coder mod-ule of Matlab, resulting in a 20x improvement inperformance.All functionality of CMOST is available via several in-
tuitive graphical user interfaces. All relevant parameters,including values for all variables describing the naturalhistory, specifications for CRC screening, and a screen-ing plan, can be saved and loaded as a settings file.CMOST can be run on a desktop computer and we pro-vide basic support in the form of scripts for running iton LINUX compute clusters.CMOST produces the following output files after
each calculation: i) a Matlab data file with the rawcomputation results, which can be used for furthercalculations in Matlab; ii) several PDF files containingplots of all relevant variables that describe the preva-lence and distribution of adenomas, advanced aden-omas, and CRC, relative to the benchmarks used; iii)an Excel file with a summary of the CMOST simula-tion run.
The accurate determination of the optimal age forreduction in incidence, mortality, or cost per lifeyear gained required calculations on population sizesof up to 10 million. The calculations are repeatedfor each condition, e.g., the year of recommendedscreening colonoscopy. Each of these cases is, inprinciple, a single processor job. However, in orderto effectively handle the memory available on eachprocessor, the calculation on the population of 10million was subdivided into calculations with100,000 individuals on a high-performance LINUXcomputer cluster.
ResultsA new microsimulation model for the natural history ofCRCWe developed CMOST, a microsimulation model tosimulate CRC progression and the effect of CRC screen-ing (Fig. 1). In our model carcinoma develops via earlyand advanced adenoma precursors. Altogether, 6 aden-oma stages and 4 carcinoma stages are considered in themodel. Most of the transition towards pre-clinical canceroccurs via the adenomatous pathway, advancing throughthe 6 successive stages of adenoma progression. Withlower probability, pre-clinical cancer can also start fromany of the adenoma stages or even from seemingly nor-mal colon mucosa.Our model accounts for the gender- and age-
dependent risks of adenoma development [5, 18, 50,55] as well as the presence of multiple adenomas.Each adenoma will be assigned one of 13 locationswithin the colon, reflecting the distribution of aden-oma lesions within the colon [24]. In our model, rec-tum adenomas progress faster compared to colonadenomas to achieve the expected proportion of rec-tum cancers of all CRC [56]. Each individual withinthe simulated patient population is assigned an indi-vidual adenoma risk. The distribution of these riskswithin the whole population is calibrated to matchthe frequency of multiple adenomas [49] and alsomatches the frequency of synchronous colorectal can-cers of 3.5% of all CRC [57].Adenoma dwell time indicates the time between ap-
pearance of an adenoma and transition to colorectalcancer. Since adenoma dwell time can only be estimatedempirically with a broad margin of error, we consideredthree parameterizations of CMOST with dwell times of8, 13, and 19 years, referred to as CMOST8, CMOST13,and CMOST19, respectively.
Automated calibration of our modelTo calibrate our model for the North American or asimilar Western population, published age- and sex-specific adenoma prevalence rates were used [18, 50,

Prakash et al. BMC Medical Informatics and Decision Making (2017) 17:80 Page 9 of 16
55]. Carcinoma incidence and mortality, as well as separ-ate colon and rectum cancer incidence rates, are mod-eled according to the data from the SurveillanceEpidemiology and End Results (SEER) data base for 2005–2009 [52]. Altogether, 105 benchmarks were selected(Additional file 1: Table S1) and an automated calibrationstrategy was employed (see Additional file 4). A compari-son with the benchmarks is performed at every iterationof the automated parameter calibration. The calibration isterminated when the comparisons are satisfactory, such asshown in Fig. 3. CMOST allows the flexibility of includinga new set of CRC natural history benchmarks from a newpopulation, and the four-steps of the automated param-eter calibration can be repeated.CMOST assumes a fraction of all cancers to appear
without adenomatous precursors (referred to as directcancer henceforward). Benchmarking for direct cancerwas performed in an indirect way using data from a ran-domized rectosigmoidoscopy study with 170,432 individ-uals between 55 and 64 years of age [58]. After a one-time only rectosigmoidoscopy (visualizing the left-sidedcolon), individuals with positive findings are followedby a full colonoscopy, thus enabling CRC preventionon the left and the right side of the colon. OverallCRC incidence reduction was used as a benchmark toparameterize the rate of direct cancers (further detailsin Additional file 4).
Simulation of CRC screeningIn our microsimulation, colonoscopy will either be per-formed according to a pre-defined screening schedule,for adenoma or cancer surveillance, or for the diagnosisof symptomatic cancer. Our implementation of colonos-copy accounts for varying probabilities of successfulvisualization of the hepatic and splenic flexures and im-perfect detection of early and advanced adenomas and
A B
Fig. 3 Results of CMOST regarding adenoma and cancer epidemiology for theAdvanced adenoma prevalence c: Cancer incidence. Literature-derived benchmblack squares and a blue dashed line; results of CMOST13 calculations are showas red-squares otherwise
colorectal cancer [45, 59]. Complications of colonoscopyincluding major bleeding, which requires hospitalization;minor bleeding, which does not require hospitalization;perforation, which requires surgical treatment; and mu-cosal burn, are all accounted for [60]. We also simulatedsurveillance colonoscopies after the detection of a lesion–according to current guidelines [61]. Other screeninginterventions, including rectosigmoidoscopy and fecaloccult blood tests with various test parameters, havealso been implemented. Our program can be used toassess effects of every CRC screening method includingDNA stool tests, DNA blood tests or imaging basedtests provided that information about test sensitivity,specificity, risks and the costs are available.
Comparison of CMOST to randomized CRC screeningtrialsTo validate CMOST, we compared the predictions ofour model to the independent results of a large random-ized controlled trial of endoscopy for CRC prevention[37] (Table 3) that were not used for model calibration.In this study, the effect of one or two rectosigmoidosco-pies in a combined study group of 77,445 individualsaged 55-74 years was tested over an 11.9-year follow-upperiod. While the study is similar to the one used forbenchmarking the direct cancers [12], the study group isslightly larger, start and end times differ, and two endos-copies are used in a significant fraction of patients. Re-sults of CMOST13 simulations compare well with theintention-to-treat analysis of the randomized study andits confidence intervals: CMOST13 predicts a similaroverall incidence reduction (19.9% predicted vs. 21% ob-served), left-sided CRC incidence reduction (24% pre-dicted vs. 29% observed) and overall mortality reduction(26% predicted vs. 26% observed) [37]. Similar resultswere obtained using CMOST8 and CMOST19 (Table 3).
C
whole population (males and females). a: Early adenoma prevalence b:arks (see Additional file 4) used for our microsimulation are indicated byn as a black line and green-squares when within 20% of benchmarks, and

Table 3 Effects of rectosigmoidoscopy screening for CRC prevention combined with 11.9-year follow-up (intention to treat analysisaccording to the randomized controlled study by Schoen et al. [37])
Schoen et al. [37] with 95% CI CMOST8 CMOST13 CMOST19
Incidence reduction All CRC 21% (28-15) 20% 20% 20%
Right-sided CRC 14% (3-24%). 15% 7% 5%
Left-sided CRC 29% (20-36). 21% 24% 26%
Mortality reduction 26% (13-37) 23% 26% 23%
Prakash et al. BMC Medical Informatics and Decision Making (2017) 17:80 Page 10 of 16
We also simulated other smaller CRC prevention studies(Additional file 5: Table S9), and the simulation resultswere also in agreement with the observed data [15, 38].We conclude that CMOST reflects the natural history ofCRC well and reliably predicts the outcome of random-ized rectosigmoidoscopy screening trials.
Comparison of CMOST with existing CRC simulationmodelsPredictions of CMOST were compared to those of othermicrosimulation models describing the natural history ofCRC, namely MISCAN, CRC-SPIN, and SimCRC,following two previously published comparative studies[7, 62]. In a first comparison, a hypothetical perfectscreening intervention, removing all lesions within thecolon of each individual (early adenomas, advanced ad-enomas, and cancers) at the age of 65 was modeled (re-ferred to as maximum clinical incidence reduction in theoriginal publication [7]). All CRC detected after the ageof 65 would thus be newly developed lesions. CMOST8,CMOST13, and CMOST19 differ slightly regarding fu-ture CRC incidence (Fig. 4). Predictions of CMOST8strongly resemble predictions of MISCAN whileCMOST13 and CMOST19 predict a lower CRC incidence20 years after the hypothetical intervention (Fig. 4). Add-itional detailed comparisons between all microsimulation
Fig. 4 Maximum clinical incidence reduction: The incidence of cancerfollowing a hypothetical perfect intervention which removes alladenomas and undiagnosed cancers at age 65 is used to compare thepredictions of microsimulation models. MISCAN, CRC-SPIN, and SimCRCdata are from reference [7]
models are provided in Additional file 6 Tables S2, Add-itional file 7: Table S3, Additional file 8: Table S4, Add-itional file 9: Table S5 and Additional file 10: Table S6.We also tested predictions of CMOST with regard to
the effects of colonoscopy on colon cancer incidenceand mortality (Table 4) and found that CMOST wasclosest to the MISCAN model. Since for all versions ofCMOST, i.e., CMOST8, CMOST13, and CMOST19 thedirect cancer rate was calibrated to achieve an identicalincidence reduction as a randomized rectosigmoido-scopy study, predictions of all CMOST versions werevery similar. Thereby, the fraction of direct cancer islowest for CMOST8, intermediate for CMOST13, andhighest for CMOST19. Effects of a longer dwell time(19 years for CMOST19, 13 years for CMOST13, leadingto longer lasting effects of adenoma removal than forCMOST8) will be offset by a higher fraction of directcancers which cannot be prevented by CRC screening.Without this calibration step (with identical direct can-cer rates) incidence reduction for CMOST19 would behighest, intermediate for CMOST13, and lowest forCMOST8 (data not shown).On a different note, CMOST was calibrated to reflect
contemporary CRC incidence, whereas MISCAN, CRC-SPIN, and SimCRC reflect the higher CRC incidence of1977 (before the onset of CRC screening). This differ-ence explains some of the discrepancies within Table 4(compare “CRC cases prevented” or “colonoscopies perlife year gained” for CMOST and the establishedmodels). We also simulated the effect of FOBT screeningregarding CRC incidence and mortality reduction. Theresults obtained by CMOST are similar to those fromSimCRC and MISCAN according to published data [63](Additional file 9: Table S5, Additional file 10 Table S6).Taken together, predictions by CMOST regarding thenatural history of CRC development and CRC screeningare comparable to published microsimulation tools. Allversions of CMOST resulted in similar predictions forvarious read outs, and predictions of CMOST stronglyresemble those of MISCAN.
Defining the optimal time point for colonoscopyscreeningWe tested the optimal application of colonoscopy in ascenario allowing for a single screening colonoscopy

Table 4 Comparison of CMOST with other microsimulation tools. Screening colonoscopies were performed at 10-year intervals be-tween ages 50 and 75 years. Results of the microsimulation tools MISCAN, CRC-SPIN, and SimCRC were taken from reference [7].Numbers indicate percentage reduction or the number of additional colonoscopies or CRC cases as indicated per 1000 individuals.For CMOST, the numbers of the baseline scenario assuming a dwell time of 13 years (CMOST13) are given; numbers in parenthesisindicate results obtained by using CMOST8 and CMOST19
MISCAN CRC-SPIN SimCRC CMOST13 (CMOST8, CMOST19)
Incidence reduction 52% 91% 82% 53% (55, 48)
Mortality reduction 65% 92% 84% 61% (65, 55)
Life years gained 207 260 327 142 (155, 121)
Screening colonoscopies 2288 2580 2574 2373 (2304, 2289)
Surveillance colonoscopies 1715 1341 1609 1311 (1222, 1251)
Total colonoscopies 4002 3921 4184 3600 (3538, 3558)
CRC cases prevented 30 56 54 27 (28, 23)
CRC mortality cases prevented 19 25 30 12 (13, 10)
Colonoscopies per case prevented 135 70 77 132 (124, 155)
Colonoscopies per LYG 19 15 13 25 (22, 29)
Prakash et al. BMC Medical Informatics and Decision Making (2017) 17:80 Page 11 of 16
during the lifetime of a patient. We compared incidenceand mortality of CRC to a scenario without screening(Fig. 5a, b). For all versions of CMOST, incidence reduc-tion from colonoscopy increases with age at first colon-oscopy up to an optimum at approximately 58 years.Both the extent of the benefit conferred by colonoscopy(incidence reductions in CMOST8, CMOST13,CMOST19 are 36%, 36%, and 35%, respectively) and theoptimal time point for colonoscopy were comparable for
Fig. 5 Results of the effect of a single screening colonoscopy is performedDiscounted life years gained d: Discounted costs per discounted life year g
all simulation models tested (59, 58, and 56 years;Fig. 5a). Similarly, the mortality reductions predicted byCMOST8, CMOST13, and CMOST19 are 43%, 40%,and 39%, respectively, all at the optimal ages of 61, 60,and 50 years (Fig. 5b).We also calculated life years gained (LYG) and cost-
efficiency of colonoscopy. Following current practice inhealth economics, LYG and costs were compared to thestandard scenario without screening. Differences were
at a specific age: a: Incidence reduction b: Mortality reduction c:ained

Prakash et al. BMC Medical Informatics and Decision Making (2017) 17:80 Page 12 of 16
discounted by 3% per year (Fig. 5c). Since prevention ofa carcinoma in a young patient will save more life yearscompared to an older individual, the optimum for LYGis at a lower age than for incidence and mortality reduc-tion. For CMOST8, CMOST13, and CMOST19, 17, 16and 14 discounted years per 1000 persons, respectively,were obtained. An optimum was reached at similar timepoints, (age 50, 49, and 49 years, respectively). Withoutdiscounting, the number of LYG would be considerablyhigher (102, 94, and 85 years per 1000 individuals) atsomewhat later time points (53, 54 and 53 years,respectively).Cost efficiency was estimated by dividing discounted
costs in USD by discounted LYG. By common conven-tions in health economics, any intervention with costsless than 100,000 USD per LYG is considered cost-effective. In our calculations, the optimal values of cost-efficiency for a single screening colonoscopy were$14,209, $17,211, and $21,698 USD/LYG, and thus cost-effective for all three versions of CMOST. As for inci-dence and mortality reduction, the optimum cost-effectiveness is attained at a similar age in all versions ofCMOST tested, i.e., for CMOST8, CMOST13, andCMOST19, at 61, 59, and 56 years, respectively (Fig. 5d).
DiscussionWe have introduced CMOST, a new microsimulationmodel for the natural history of CRC. CMOST reflectsall basic characteristics of the natural history of CRC,shows comparable characteristics to published models ofCRC microsimulation, and can reproduce the results ofa large randomized endoscopic screening intervention.Our tool offers several benefits to the user. First, our
model is publicly available under a GNU General PublicLicense. This will enable independent reproduction ofpredictions and advancement of the model and its im-plementation. Furthermore, publication of all details ofour microsimulation will enable scrutiny and a detaileddiscussion regarding all relevant aspects of CRC simula-tions. We hope that future extensions of CMOST willhelp increasing the validity of simulation results and fur-ther improve the in silico design of CRC screening strat-egies. Additional advancements of our model and itsimplementation include calibration against results of arecently published endoscopic screening trial, which hadnot been possible at the time of the development of pre-vious models. The transparency of benchmarking andautomated calibration of CMOST parameters will facili-tate further improvements to the model. Repeated con-vergence to the same set of parameters for differentinitial parameter guesses suggests a well-definedoptimum in parameter space of CMOST.We believe that many aspects of the CMOST imple-
mentation will benefit future users of the tool. CMOST
can be run using a graphical user interface, which allowsadjustment of all relevant parameters. Time critical rou-tines are accelerated using the coder option of Matlab,with a 20x improvement in performance. A simulationof 100,000 individuals implemented in Matlab R2015and executed on a 2.5 GHz processor, uses 1 GB RAMand typically finishes in less than 1 min. In addition,CMOST supports usage of a high-performance computecluster for either the simulation of large populations ordetailed explorations. There is no agreement as to whatlevel of detail is necessary for a CRC microsimulation tobe both accurate and practical. We attempted to imple-ment CMOST as a detailed microsimulation. For in-stance, 13 different locations of a lesion within the colonare supported and many details of CRC pathogenesisand screening can be adjusted according to theselocations.Since the true value (or probability distribution) of ad-
enoma dwell times is unknown, we calibrated versionsof CMOST with median dwell times of 8, 13, and19 years (CMOST8, CMOST13, CMOST19). Predictionsof CMOST8, CMOST13, and CMOST19 were similarand showed resemblance to MISCAN. Due to our cali-bration process, the longer dwell time of CMOST19(leading to longer lasting effects of adenoma removal)would be offset by a higher rate of direct cancer whichcannot be prevented by endoscopic screening. As in pre-vious studies, when MISCAN, CRC-SPIN, and SimCRCwere frequently tested in parallel to increase robustnessof predictions, different versions of CMOST can be runfor increased robustness of predictions. Our data con-firm adenoma dwell time as a critical parameter for thenatural history of CRC; however, we demonstrate thatafter calibration for relevant clinical endpoints, similarresults can be achieved with models using considerablydifferent dwell times.Currently available epidemiological data do not allow
for distinguishing whether CMOST8, CMOST13, orCMOST19 reflects the natural history of CRC best. Wewere unable to calibrate models with less than 8 years ofadenoma dwell time suggest that this parameter isbounded, at least for a given set of benchmarks. Predic-tions of all CMOST versions regarding overall CRC inci-dence and mortality reduction and protection from left-sided CRC were well within the confidence interval of alarge endoscopic CRC prevention trial. In the future, re-sults of colonoscopy CRC prevention trials will furtherinform microsimulation models regarding the preven-tion of right-sided CRC.According to the standard health economic defini-
tions, an intervention is considered cost-effective if thecosts remain below 100,000 USD per life year gained[64, 65]. Colonoscopy screening in that sense is a cost-effective intervention. In agreement with the results of
Prakash et al. BMC Medical Informatics and Decision Making (2017) 17:80 Page 13 of 16
numerous previous microsimulations [66, 67], screeningcosts of a single screening colonoscopy remains belowthe accepted limit of 100,000 USD per life years gained.Our results also largely agree with an earlier study basedon a Markov model, recommending a single colonos-copy at age 60 years as a highly cost-effective screeningstrategy [68]. Several previous computational studies re-ported an even better cost-effectiveness than our study,and some studies even predicted CRC screening to becost saving [66]. These discrepancies are largely due todifferent cost assumptions. Past studies used Medicaredata from the years 1999-2003 [46, 69] with some stud-ies even considering the cost of death due to reasonsother than cancer. In contrast, the cost assumptions inthe present study were based on the Medicare reim-bursement schedule from 2012. Therefore, in previousmicrosimulations screening tended to be cheaper ortreatment costs were higher compared to ours, makingour cost calculations conservative.Our tool provides flexibility to easily implement and
evaluate basically all CRC screening options provided in-formation regarding test sensitivity, specificity, risks andcosts are provided. Examples include DNA based serumand stool tests or imaging based screening methods. Fur-thermore, big efforts are currently underway to ensurethe quality of colonoscopy as the most frequently usedCRC screening tools: Modifications in the proceduresuch as endoscope inversion in the cecum to improveadenoma detection there, adjustments in bowel prepar-ation to improve “cleanliness” of the colon, enforcing aretraction time of colonoscopy of at least 6 min havebeen shown to increase adenoma detection rates. How-ever, these procedures have direct or indirect costslinked to a longer time of the investigation, higher de-mands for documentation or patient and physician edu-cation. Our tool will enable to assess the benefits of eachmodification and put it into perspective by comparisonwith increased costs. An incremental cost-effectivenessratio of 100’000 USD per LYG will determine, whetherany modification should be recommended or advisedagainst.Our microsimulation has also several inherent limita-
tions: i) Key parameters of the natural history of CRCare unknown. This is especially relevant for the adenomadwell time, the time from the appearance of an adenomauntil its transition to preclinical CRC. However, we pro-vide three versions of CMOST spanning a wide range ofreasonable assumptions for this parameter, enabling sen-sitivity analyses. ii) The serrated adenoma pathway is notexplicitly considered by our model. While implementa-tion of an additional adenoma path with preferential dis-tribution of serrated adenoma lesions in the right colonand lower detectability by colonoscopy is technicallyfeasible, most characteristics of serrated adenoma
epidemiology remain unknown, reducing model calibra-tion to guess work. However, our model allows for car-cinoma directly developing from normal mucosa with aright-colonic preference implemented, at least partiallyaccounting for the serrated adenoma path. iii) Ourmodel does not account for benign non-adenomatouspolyps. iv) CMOST has been calibrated to contemporaryCRC incidence data. This contrasts previous models,which were calibrated using data of the year 1977, beforethe introduction of CRC screening. For these reasons,CRC incidence for MISCAN, SimCRC, and CRC-SPINremains higher than for CMOST. Several studies indi-cate that the decrease in CRC incidence observed withinthe last decades is not only due to CRC screening butmight also be due to usage of non-steroidal antirheu-matic drugs [70] or changes in smoking [71] and nutri-tion [72]. These different effects cannot be disentangled.
ConclusionsIn summary, we have introduced CMOST, a new CRCmicrosimulation tool, freely available under a generalpublic license. Predictions of our model regarding thenatural history of CRC and CRC screening were similarto predictions of published CRC microsimulation toolsand an endoscopic CRC screening study, confirming thevalidity of our model. CMOST predicts CRC screening bycolonoscopy to be highly cost-efficient with an optimaltime point of a single colonoscopy for maximum cost-efficiency of approximately 61 years. Our computationsconfirm adenoma dwell time as a critical parameter forCRC microsimulation models; however, similar results forvarious effects of colonoscopy screening including inci-dence reduction, cost-efficiency, and optimal time pointswere obtained with a dwell time of 8, 13, and 19 years.Our tool enables assessment of many practical questions
in current gastroenterology. For instance, cost-effectivenessof new CRC screening approaches, or of incrementalchanges of existing screening approaches such as improve-ments in colonoscopy screening by improved bowel prepar-ation or physician training can be assessed. Additionally,cost-effectiveness of CRC screening at extremes of age, co-morbidities or risks could be addressed. Basically, mostpractical question regarding screening or treatment of CRCwhich can be expressed in terms of risks and costs, our toolshould be able to answer, perhaps after modification of thecode. Thereby, the flexibility of our model enables adapta-tion also to countries with different CRC epidemiology suchas in developing countries. Additional case studies will im-prove the practical value of our program in the future.The main limitations of our tool is the limitation in our
knowledge of CRC, making assumptions for adenomadwell time and the distribution of risks for adenoma pro-gression and initiation necessary. Furthermore, several as-pects of the natural history of CRC such as the serrated

Prakash et al. BMC Medical Informatics and Decision Making (2017) 17:80 Page 14 of 16
adenoma pathway are not reflected by our program tolimit complexity. Results of ongoing randomized CRCscreening trials using colonoscopy (expected within 5-10years) will improve the validity of predictions of our tool.
Additional files
Additional file 1: Table S1. All versions of CMOST were calibratedrelative to the 9 categories indicated below (105 data points). Forparameters with gender differences (early and advanced adenomaprevalence, cancer incidence) the parameter for the whole population wasadjusted with a correction factor for males and females. For stagedistribution of symptomatic and asymptomatic cancer the distribution oftime spent in a given stage as well as the stage at which the cancer wouldbe symptomatic was adjusted to yield in a sojourn time of 3 years and theindicated stage distributions (benchmarks 8 and 9). (DOCX 32 kb)
Additional file 2: Table S7. Costs of colonoscopy and itscomplications. (DOCX 13 kb)
Additional file 3: Table S8. Stage dependent costs of cancertreatment. (DOCX 13 kb)
Additional file 4: Manual and Literature. (DOCX 40 kb)
Additional file 5: Table S9. Simulation of rectosigmoidoscopyscreening for prevention of CRC according to randomized controlledtrials (intention to treat analysis). Modeling of these studies providesadditional validation of our model. (DOCX 19 kb)
Additional file 6: Table S2. Comparison of CMOST with othermicrosimulation models [64]: Individuals with and without preclinicaldisease at age 55 (adenomas, undiagnosed cancer) were identified andthe cancer rates over the next 20 years were compared. (DOCX 13 kb)
Additional file 7: Table S3. Comparison of CMOST models with othermicrosimulation models [64]: For cancer diagnosed at the indicated ages(55, 65 or 75 years) the percentage of cancer developing over the last≤10 years or ≤20 years before cancer diagnosis (i.e. adenomatousprecursor present) is indicated. (DOCX 14 kb)
Additional file 8: Table S4. Comparison of CMOST models with othermicrosimulation models [64]: Adenoma dwell time cancer sojourn timeand overall dwell time are indicated. Direct cancer was ignored forcalculations of dwell time. (DOCX 14 kb)
Additional file 9: Table S5. Comparison of CMOST models with othermicrosimulation models [65]: Predicted incidence reduction of variousscreening interventions. (DOCX 13 kb)
Additional file 10: Table S6. Comparison of CMOST models with othermicrosimulation models [65]: Predicted mortality reduction of variousscreening interventions. (DOCX 13 kb)
AbbreviationsCMOST: Colon modeling with open source tool; CRC: Colorectal cancer; CRC-SPIN: Colorectal cancer simulated population model for incidence andnatural history; ICER: Incremental cost effectiveness ratio; LYG: Life yearsgained; MISCAN: Microsimulation screening analysis; SimCRC: Simulationmodel of colorectal cancer (SimCRC)
AcknowledgementsThe authors would like to thank Stephan R. Vavricka, Christine Manser, LucBiedermann, Patric Urfer, Roger Wanner, and Urs Marbet for stimulatingdiscussions, and help with thorough literature research. We would like tothank Martin Fox, BSSE Basel and the management of the Brutus and Eulercomputer clusters at ETH Zurich for technical support.
FundingThis work was supported by Swiss Cancer League grant No. KFS-2977-08-2012 and the Helmut Horten Foundation.
Availability of data and materialsThe proposed tool is available under https://gitlab.com/misselwb/CMOST
Authors’ contributionsMP: Study design, data analysis and manuscript preparation; BL: Scientificconcept, critical review of the manuscript; NB: Scientific concept, criticalreview of the manuscript; HH: data analysis and manuscript preparation, PV:data analysis and manuscript preparation, PB: Scientific concept, studydesign; AS: Scientific concept, study design, manuscript preparation; BM:Scientific concept, study design, data analysis and manuscript preparation.All listed authors have seen and have approved the final draft submitted.
Competing interestsThe authors declare that they have no competing interests.
Consent for publicationNot applicable
Ethics approval and consent to participateNo human or animal data was used for this study, therefore ethics approvalwas not necessary.
Publisher’s NoteSpringer Nature remains neutral with regard to jurisdictional claims inpublished maps and institutional affiliations.
Author details1Division of Gastroenterology, University Hospital Zurich (USZ), Rämistrasse100, 8091 Zurich, Switzerland. 2Department of Biosystems Science andEngineering, ETH Zurich, 4058 Basel, Switzerland. 3SIB Swiss Institute ofBioinformatics, 4058 Basel, Switzerland. 4The Portland VA Medical Center,P3-GI, 3710 SW US Veterans Hospital Road, Portland, OR 97239, USA.
Received: 25 October 2016 Accepted: 30 April 2017
References1. Jemal A, Siegel R, Ward E, Hao Y, Xu J, Thun MJ. Cancer statistics, 2009. CA
Cancer J Clin. 2009;59(4):225–49.2. Center MM, Jemal A, Ward E. International trends in colorectal cancer
incidence rates. Cancer Epidemiol Biomarkers Prev. 2009;18(6):1688–94.3. Jones S, Chen W-D, Parmigiani G, Diehl F, Beerenwinkel N, Antal T, Traulsen
A, Nowak MA, Siegel C, Velculescu VE, et al. Comparative lesion sequencingprovides insights into tumor evolution. Proc Natl Acad Sci U S A. 2008;105(11):4283–8.
4. Winawer S, Fletcher R, Rex D, Bond J, Burt R, Ferrucci J, Ganiats T, Levin T,Woolf S, Johnson D, et al. Colorectal cancer screening and surveillance:clinical guidelines and rationale-Update based on new evidence.Gastroenterology. 2003;124(2):544–60.
5. Heitman SJ, Ronksley PE, Hilsden RJ, Manns BJ, Rostom A, Hemmelgarn BR.Prevalence of adenomas and colorectal cancer in average risk individuals: asystematic review and meta-analysis. Clin Gastroenterol Hepatol. 2009;7(12):1272–8.
6. Winawer SJ, Zauber AG, Fletcher RH, Stillman JS, O'Brien MJ, Levin B, SmithRA, Lieberman DA, Burt RW, Levin TR, et al. Guidelines for colonoscopysurveillance after polypectomy: a consensus update by the US multi-societytask force on colorectal cancer and the American cancer society.Gastroenterology. 2006;130(6):1872–85.
7. van Ballegooijen M, Rutter CM, Knudsen AB, Zauber AG, Savarino JE,Lansdorp-Vogelaar I, Boer R, Feuer EJ, Habbema JDF, Kuntz KM. Clarifyingdifferences in natural history between models of screening: the case ofcolorectal cancer. Med Decis Mak. 2011;31(4):540–9.
8. Kuntz KM, Lansdorp-Vogelaar I, Rutter CM, Knudsen AB, van Ballegooijen M,Savarino JE, Feuer EJ, Zauber AG. A systematic comparison ofmicrosimulation models of colorectal cancer: the role of assumptions aboutadenoma progression. Med Decis Making. 2011;31(4):530–9.
9. Lee GH, Malietzis G, Askari A, Bernardo D, Al-Hassi HO, Clark SK. Is right-sided colon cancer different to left-sided colorectal cancer? - a systematicreview. Eur J Surg Oncol. 2015;41(3):300–8.
10. Gupta S, Balasubramanian BA, Fu T, Genta RM, Rockey DC, Lash R. Polypswith advanced neoplasia are smaller in the right than in the left colon:implications for colorectal cancer screening. Clin Gastroenterol Hepatol.2012;10(12):1395–401. e1392.

Prakash et al. BMC Medical Informatics and Decision Making (2017) 17:80 Page 15 of 16
11. Heitman SJ, Hilsden RJ, Au F, Dowden S, Manns BJ. Colorectal cancerscreening for average-risk North Americans: an economic evaluation. PLoSMed. 2010;7(11):e1000370.
12. Atkin WS, Edwards R, Kralj-Hans I, Wooldrage K, Hart AR, Northover JMA,Parkin DM, Wardle J, Duffy SW, Cuzick J, et al. Once-only flexiblesigmoidoscopy screening in prevention of colorectal cancer: a multicentrerandomised controlled trial. Lancet. 2010;375(9726):1624–33.
13. Schoen RE, Pinsky PF, Weissfeld JL, Yokochi LA, Church T, Laiyemo AO,Bresalier R, Andriole GL, Buys SS, Crawford ED, et al. Colorectal-cancerincidence and mortality with screening flexible sigmoidoscopy. N Engl JMed. 2012;366(25):2345–57.
14. Elmunzer BJ, Hayward RA, Schoenfeld PS, Saini SD, Deshpande A, Waljee AK.Effect of flexible sigmoidoscopy-based screening on incidence andmortality of colorectal cancer: a systematic review and meta-analysis ofrandomized controlled trials. PLoS Med. 2012;9(12):e1001352.
15. Holme O, Loberg M, Kalager M, Bretthauer M, Hernan MA, Aas E, Eide TJ,Skovlund E, Schneede J, Tveit KM, et al. Effect of flexible sigmoidoscopyscreening on colorectal cancer incidence and mortality: a randomizedclinical trial. JAMA. 2014;312(6):606–15.
16. Shroff J, Thosani N, Batra S, Singh H, Guha S. Reduced incidence andmortality from colorectal cancer with flexible-sigmoidoscopy screening: ameta-analysis. World J Gastroenterol. 2014;20(48):18466–76.
17. Bokemeyer B, Bock H, Huppe D, Duffelmeyer M, Rambow A, Tacke W, KoopH. Screening colonoscopy for colorectal cancer prevention: results from aGerman online registry on 269000 cases. Eur J Gastroenterol Hepatol. 2009;21(6):650–5.
18. Brenner H, Hoffmeister M, Stegmaier C, Brenner G, Altenhofen L, Haug U. Riskof progression of advanced adenomas to colorectal cancer by age and sex:estimates based on 840,149 screening colonoscopies. Gut. 2007;56(11):1585–9.
19. Manser CN, Bachmann LM, Brunner J, Hunold F, Bauerfeind P, Marbet UA.Colonoscopy screening markedly reduces the occurrence of coloncarcinomas and carcinoma-related death: a closed cohort study.Gastrointest Endosc. 2012;76(1):110–7.
20. Winawer SJ, Zauber AG, Ho MN, Obrien MJ, Gottlieb LS, Sternberg SS, WayeJD, Schapiro M, Bond JH, Panish JF, et al. Prevention of colorectal - cancerby colonoscopic polypectomy. N Eng J Med. 1993;329(27):1977–81.
21. Quintero E, Castells A, Bujanda L, Cubiella J, Salas D, Lanas A, Andreu M,Carballo F, Morillas JD, Hernandez C, et al. Colonoscopy versus fecalimmunochemical testing in colorectal-cancer screening. N Eng J Med. 2012;366(8):697–706.
22. Burt RW, Cannon JA, David DS, Early DS, Ford JM, Giardiello FM, HalversonAL, Hamilton SR, Hampel H, Ismail MK, et al. Colorectal cancer screeningclinical practice guidelines in oncology. J Natl Compr Canc Netw. 2013;11(12):1538–75.
23. Hewitson P, Glasziou P, Watson E, Towler B, Irwig L. Cochrane systematicreview of colorectal cancer screening using the fecal occult blood test(hemoccult): an update. Am J Gastroenterol. 2008;103(6):1541–9.
24. Rutter CM, Savarino JE. An evidence-based microsimulation model forcolorectal cancer: validation and application. Cancer Epidemiol BiomarkersPrev. 2010;19(8):1992–2002.
25. Zauber AG, Lansdorp-Vogelaar I, Knudsen AB, Wilschut J, van BallegooijenM, Kuntz KM. Evaluating test strategies for colorectal cancer screening: adecision analysis for the U.S. Preventive Services Task Force. Ann InternMed. 2008;149(9):659–69.
26. Wilschut JA, Hol L, Dekker E, Jansen JB, Van Leerdam ME, Lansdorp-VogelaarI, Kuipers EJ, Habbema JD, Van Ballegooijen M. Cost-effectiveness analysis ofa quantitative immunochemical test for colorectal cancer screening.Gastroenterology. 2011;141(5):1648–55. e1641.
27. Lansdorp-Vogelaar I, van Ballegooijen M, Zauber AG, Boer R, Wilschut J,Winawer SJ, Habbema JD. Individualizing colonoscopy screening by sex andrace. Gastrointest Endosc. 2009;70(1):96–108. 108 e101-124.
28. Lansdorp-Vogelaar I, van Ballegooijen M, Zauber AG, Boer R, Wilschut J,Habbema JD. At what costs will screening with CT colonography becompetitive? a cost-effectiveness approach. Int J Cancer. 2009;124(5):1161–8.
29. Knudsen AB, Zauber AG, Rutter CM, Naber SK, Doria-Rose VP, Pabiniak C,Johanson C, Fischer SE, Lansdorp-Vogelaar I, Kuntz KM. Estimation ofbenefits, burden, and harms of colorectal cancer screening strategies:modeling study for the US preventive services task force. JAMA. 2016;315(23):2595–609.
30. van Ballegooijen M, Rutter CM, Knudsen AB, Zauber AG, Savarino JE,Lansdorp-Vogelaar I, Boer R, Feuer EJ, Habbema JD, Kuntz KM. Clarifying
differences in natural history between models of screening: the case ofcolorectal cancer. Med Decis Making. 2011;31(4):540–9.
31. Colorectal Cancer Model Profiles [https://cisnet.cancer.gov/colorectal/profiles.html]
32. Filippakis GM, Zografos G, Pararas N, Lanitis S, Georgiadou D, FilippakisMG. Spontaneous regression of rectal polyps following abdominalcolectomy and ileorectal anastomosis for familial adenomatouspolyposis, without sulindac treatment: report of four cases. Endoscopy.2007;39(7):665–8.
33. Hoff G, Foerster A, Vatn MH, Sauar J, Larsen S. Epidemiology of polyps inthe rectum and colon. Recovery and evaluation of unresected polyps2 years after detection. Scand J Gastroenterol. 1986;21(7):853–62.
34. Hofstad B, Vatn MH, Andersen SN, Huitfeldt HS, Rognum T, Larsen S, OsnesM. Growth of colorectal polyps: redetection and evaluation of unresectedpolyps for a period of three years. Gut. 1996;39(3):449–56.
35. Steinbach G, Lynch PM, Phillips RK, Wallace MH, Hawk E, Gordon GB,Wakabayashi N, Saunders B, Shen Y, Fujimura T, et al. The effect ofcelecoxib, a cyclooxygenase-2 inhibitor, in familial adenomatous polyposis.N Eng J Med. 2000;342(26):1946–52.
36. Nishihara R, Wu K, Lochhead P, Morikawa T, Liao X, Qian ZR, Inamura K, KimSA, Kuchiba A, Yamauchi M, et al. Long-term colorectal-cancer incidenceand mortality after lower endoscopy. N Eng J Med. 2013;369(12):1095–105.
37. Schoen RE, Pinsky PF, Weissfeld JL, Yokochi LA, Church T, Laiyemo AO,Bresalier R, Andriole GL, Buys SS, Crawford ED, et al. Colorectal-cancerincidence and mortality with screening flexible sigmoidoscopy. N Eng JMed. 2012;366(25):2345–57.
38. Segnan N, Armaroli P, Bonelli L, Risio M, Sciallero S, Zappa M, Andreoni B,Arrigoni A, Bisanti L, Casella C, et al. Once-only sigmoidoscopy in colorectalcancer screening: follow-up findings of the Italian randomized controlledtrial–SCORE. J Natl Cancer Inst. 2011;103(17):1310–22.
39. Brenner H, Hoffmeister M, Arndt V, Stegmaier C, Altenhofen L, HaugU. Protection from right- and left-sided colorectal neoplasms aftercolonoscopy: population-based study. J Natl Cancer Inst. 2010;102(2):89–95.
40. Brenner H, Chang-Claude J, Seiler CM, Rickert A, Hoffmeister M. Protectionfrom colorectal cancer after colonoscopy: a population-based, case-controlstudy. Ann Intern Med. 2011;154(1):22–30.
41. Zheng W, Rutter CM. Estimated mean sojourn time associated withhemoccult SENSA for detection of proximal and distal colorectal cancer.Cancer Epidemiol Biomarkers Prev. 2012;21(10):1722–30.
42. Niv Y, Hazazi R, Levi Z, Fraser G. Screening colonoscopy for colorectal cancer inasymptomatic people: a meta-analysis. Dig Dis Sci. 2008;53(12):3049–54.
43. O'Connell JB, Maggard MA, Ko CY. Colon cancer survival rates with the newAmerican joint committee on cancer sixth edition staging. J Natl CancerInst. 2004;96(19):1420–5.
44. Arias E. United States life tables, 2008. Natl Vital Stat Rep. 2012;61(3):1–64.45. van Rijn JC, Reitsma JB, Stoker J, Bossuyt PM, van Deventer SJ, Dekker E.
Polyp miss rate determined by tandem colonoscopy: a systematic review.Am J Gastroenterol. 2006;101(2):343–50.
46. Knudsen AB, Lansdorp-Vogelaar I, Rutter CM, Savarino JE, van BallegooijenM, Kuntz KM, Zauber AG. Cost-effectiveness of computed tomographiccolonography screening for colorectal cancer in the medicare population. JNatl Cancer Inst. 2010;102(16):1238–52.
47. Arora G, Mannalithara A, Singh G, Gerson LB, Triadafilopoulos G. Risk ofperforation from a colonoscopy in adults: a large population-based study.Gastrointest Endosc. 2009;69(3):654–64.
48. Gatto NM, Frucht H, Sundararajan V, Jacobson JS, Grann VR, Neugut AI. Riskof perforation after colonoseopy and sigmoidoscopy: a population-basedstudy. J Natl Cancer Inst. 2003;95(3):230–6.
49. Williams AR, Balasooriya BA, Day DW. Polyps and cancer of the large bowel:a necropsy study in Liverpool. Gut. 1982;23(10):835–42.
50. Pendergrass CJ, Edelstein DL, Hylind LM, Phillips BT, Iacobuzio-Donahue C,Romans K, Griffin CA, Cruz-Correa M, Tersmette AC, Offerhaus GJ, et al.Occurrence of colorectal adenomas in younger adults: an epidemiologicnecropsy study. Clin Gastroenterol Hepatol. 2008;6(9):1011–5.
51. Bokemeyer B, Bock H, Hüppe D, Düffelmeyer M, Rambow A, Tacke W, KoopH. Screening colonoscopy for colorectal cancer prevention: results from aGerman online registry on 269000 cases. Eur J Gastroenterol Hepatol. 2009;21(6):650–5.
52. Institute NC: Surveillance, Epidemiology and End Results - SEER 9 RegsPublic Use. Available from: www.seercancergov 2004.

Prakash et al. BMC Medical Informatics and Decision Making (2017) 17:80 Page 16 of 16
53. Schoepfer A, Marbet UA. Colonoscopic findings of symptomatic patients aged50 to 80 years suggest that work-up of tumour suspicious symptoms hardlyreduces cancer-induced mortality. Swiss Med Wkly. 2005;135(45-46):679–83.
54. Lagarias JC, Reeds JA, Wright MH, Wright PE. Convergence properties of thenelder–mead simplex method in low dimensions. SIAM J Optim. 1998;9(1):112–47.
55. Rex DK, Helbig CC. High yields of small and flat adenomas with high-definition colonoscopes using either white light or narrow band imaging.Gastroenterology. 2007;133(1):42–7.
56. Cancer trends progress report – 2011/2012 update. National CancerInstitute, NIH, DHHS, Bethesda, MD, 2012.
57. Lam AK, Chan SS, Leung M. Synchronous colorectal cancer: clinical,pathological and molecular implications. World J Gastroenterol. 2014;20(22):6815–20.
58. Atkin WS, Edwards R, Kralj-Hans I, Wooldrage K, Hart AR, Northover JM,Parkin DM, Wardle J, Duffy SW, Cuzick J, et al. Once-only flexiblesigmoidoscopy screening in prevention of colorectal cancer: a multicentrerandomised controlled trial. Lancet. 2010;375(9726):1624–33.
59. Bressler B, Paszat LF, Chen Z, Rothwell DM, Vinden C, Rabeneck L. Rates ofnew or missed colorectal cancers after colonoscopy and their risk factors: apopulation-based analysis. Gastroenterology. 2007;132(1):96–102.
60. Regula J, Rupinski M, Kraszewska E, Polkowski M, Pachlewski J, Orlowska J,Nowacki MP, Butruk E. Colonoscopy in colorectal-cancer screening fordetection of advanced neoplasia. N Engl J Med. 2006;355(18):1863–72.
61. Lieberman DA, Rex DK, Winawer SJ, Giardiello FM, Johnson DA, Levin TR.Guidelines for colonoscopy surveillance after screening and polypectomy: aconsensus update by the US multi-society task force on colorectal cancer.Gastroenterology. 2012;143(3):844–57.
62. Kuntz KM, Lansdorp-Vogelaar I, Rutter CM, Knudsen AB, van Ballegooijen M,Savarino JE, Feuer EJ, Zauber AG. A systematic comparison ofmicrosimulation models of colorectal cancer: the role of assumptions aboutadenoma progression. Med Decis Mak. 2011;31(4):530–9.
63. Zauber AG, Lansdorp-Vogelaar I, Knudsen AB, Wilschut J, van BallegooijenM, Kuntz KM. Evaluating test strategies for colorectal cancer screening: adecision analysis for the U.S. preventive services task force. Ann Intern Med.2008;149(9):659–69.
64. Weinstein MC. Principles of cost-effective resource allocation in health careorganizations. Int J Technol Assess Health Care. 1990;6(1):93–103.
65. Weinstein MC. Decision rules for incremental cost-effectiveness analysis.Elgar Companion to Health Economics 2006:469-478.
66. Lansdorp-Vogelaar I, Knudsen AB, Brenner H. Cost-effectiveness of colorectalcancer screening. Epidemiol Rev. 2011;33(1):88–100.
67. Sharaf RN, Ladabaum U. Comparative effectiveness and cost-effectiveness ofscreening colonoscopy vs. sigmoidoscopy and alternative strategies. Am JGastroenterol. 2013;108(1):120–32.
68. Sonnenberg A, Delco F. Cost-effectiveness of a single colonoscopy inscreening for colorectal cancer. Arch Intern Med. 2002;162(2):163–8.
69. Yabroff KR, Lamont EB, Mariotto A, Warren JL, Topor M, Meekins A, BrownML. Cost of care for elderly cancer patients in the United States. J NatlCancer Inst. 2008;100(9):630–41.
70. Smitten AL, Simon TA, Hochberg MC, Suissa S. A meta-analysis of theincidence of malignancy in adult patients with rheumatoid arthritis. ArthritisRes Ther. 2008;10(2):R45.
71. Botteri E, Iodice S, Bagnardi V, Raimondi S, Lowenfels AB, Maisonneuve P.Smoking and colorectal cancer: a meta-analysis. JAMA. 2008;300(23):2765–78.
72. Willett WC. Diet and cancer - an evolving picture. JAMA. 2005;293(2):233–4.
• We accept pre-submission inquiries
• Our selector tool helps you to find the most relevant journal
• We provide round the clock customer support
• Convenient online submission
• Thorough peer review
• Inclusion in PubMed and all major indexing services
• Maximum visibility for your research
Submit your manuscript atwww.biomedcentral.com/submit
Submit your next manuscript to BioMed Central and we will help you at every step: