Cmjs presentation
18
CMJS Presentation Rajan Middar Malcolm Daniels Scott Porter 1
Transcript of Cmjs presentation

CMJS Presentation
Rajan Middar
Malcolm Daniels
Scott Porter
1

Process• Film two different members performing a CMJ
(60sec max)
• Analyze videos using Kinovea
• Complete several assignments using the data
2

HypothesisIf we perform CMJS for one minute then
our jump height will decline as time goes
on
3
•Record 2 different video sets of 1:00 minute max. countermovement jump squats
•Sagital perspective
•Download the videos onto a computer and analyze

Methods of Analysis• Video
• Visual
• Timing
• Data recording
• Photographic
4

Collection Methods• Video replay
• Kinovea
• Microsoft Excel
• Side by side photographic comparisons
5

Camera• IPhone 4s
• 8.00 Megapixels
• Records video with audio, at a rate of 30 frames
per second
6

Kinovea• Is a video player for all sport
• Made to slow down and the technique of athletes
• Allows users to view two videos side by side and
synchronize them at a common time
• Allows measuring of distances and times
• Provides tracking to follow values or trajectories of
athletes
7

Excel• Spreadsheet program
• Allows for recording of statistics
• Capable of making charts and graph to show
results
8
First 10 accepted jumps:
• All but 2 were < or = to 84
Last 10 accepted jumps:
• Spikes to 103, 108, & 116
Total average joint angle: 84.8 degrees
Min angle: 65 Max Angle: 116
9
Results - MalcolmJoint Angle

Results - Malcolm
First 10 accepted jumps:
• Roller coasters from 0.4 to 0.6
Last 10 accepted jumps:
• Very inconsistent with spikes to 1.14 and 1.02
Total average flight time: 0.5
Min. Flight time: 0.3 Max: 1.14
10
Flight Time

Results - Malcolm
First 10 accepted jumps:
• Average 0.34 peaks at 0.64
Last 10 accepted jumps:
• The average drops to 0.24 (spikes to 1.59 and 1.28)
Total average jump height 0.34
Min. Jump height: 0.27 Max: 1.59
11
Jump Height

First 10 accepted jumps:
• 5 measured at 90
Last 10 accepted jumps:
• Spikes to 100, 102 & 108
• Only one jump at 90
Total average joint angle: 94.1 degrees
Min angle: 80 Max Angle: 10812
Results - ScottJoint Angle
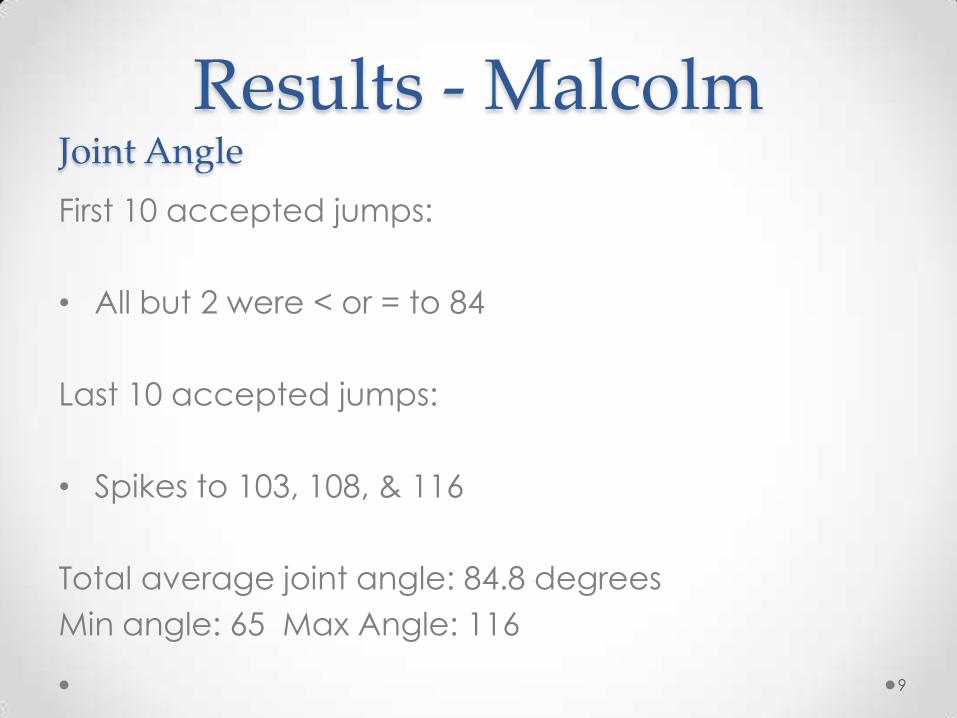
Results - Scott
First 10 accepted jumps:
• Ranges from .2 - .76
Last 10 accepted jumps:
• Ranges from .19-.34
Total average flight time: 0.33
Min. Flight time: 0.1 Max: 0.76
13
Flight Time

Results - Scott
First 10 accepted jumps:
• Average 0.16 peaks at 0.71
Last 10 accepted jumps:
• 6 jumps < 0.09
Total average jump height 0.16
Min. Jump height: 0.01 Max: 0.71
14
Jump Height

Potential Errors• Measuring angles in Kinovea
• Finding exact time for take off
• Finding exact time for flight
15

How to Increase Accuracy• Solid background
• Dark clothes and markers
• Camera with tripod
• Use a guide for jump height
16

Support/Reject Hypothesis
Hypothesis: Does fatigue affect jump height?
According to our findings, fatigue negatively affects
jump height
17
0
0.2
0.4
0.6
0 20 40 60
Hei
gh
t (m
)
Number of Jumps
Jump Height vs Jump Number
Jump Height

Questions?
18