
Cloud Provider Connectivity in the Flat Internet
17
Cloud Provider Connectivity in the Flat Internet Todd Arnold † Jia He † Weifan Jiang † Matt Calder ‡† Italo Cunha ♮ † Vasileios Giotsas ◦ Ethan Katz-Bassett † † Columbia University ‡ Microsoft ♮ Universidade Federal de Minas Gerais ◦ Lancaster University ABSTRACT The Tier-1 ISPs have been considered the Internet’s backbone since the dawn of the modern Internet 30 years ago, as they guarantee global reachability. However, their influence and importance are waning as Internet flattening decreases the demand for transit services and increases the importance of private interconnections. Conversely, major cloud providers—Amazon, Google, IBM, and Microsoft—are gaining in importance as more services are hosted on their infrastructures. They ardently support Internet flattening and are rapidly expanding their global footprints, which enables them to bypass the Tier-1 ISPs and other large transit providers to reach many destinations. In this paper we seek to quantify the extent to which the cloud providers’ can bypass the Tier-1 ISPs and other large transit providers. We conduct comprehensive measurements to identify the neighbor networks of the major cloud providers and combine them with AS relationship inferences to model the Internet’s AS-level topology to calculate a new metric, hierarchy-free reachability, which characterizes the reachability a network can achieve without traversing the networks of the Tier-1 and Tier-2 ISPs. We show that the cloud providers are able to reach over 76% of the Internet without traversing the Tier-1 and Tier-2 ISPs, more than virtually every other network. CCS CONCEPTS • Networks → Logical / virtual topologies; Public Internet ; Net- work architectures; Topology analysis and generation. KEYWORDS Internet topology, AS relationships, Routing, Traceroute, BGP ACM Reference Format: Todd Arnold, Jia He, Weifan Jiang, Matt Calder, Italo Cunha, Vasileios Giotsas, and Ethan Katz-Bassett. 2020. Cloud Provider Connectivity in the Flat Internet. In ACM Internet Measurement Conference (IMC ’20), October 27–29, 2020, Virtual Event, USA. ACM, New York, NY, USA, 17 pages. https:// doi.org/10.1145/3419394.3423613 Permission to make digital or hard copies of all or part of this work for personal or classroom use is granted without fee provided that copies are not made or distributed for profit or commercial advantage and that copies bear this notice and the full citation on the first page. Copyrights for components of this work owned by others than ACM must be honored. Abstracting with credit is permitted. To copy otherwise, or republish, to post on servers or to redistribute to lists, requires prior specific permission and/or a fee. Request permissions from [email protected]. Our original results correctly filtered leaked routes announced directly to ASes deploying peer locking. However, the original results incorrectly allowed routes leaked to ASes that do not deploy peer locking to later propagate through ASes that do deploy peer locking. This led to an underestimation of the benefits of peer locking. As our original results already showed that peer locking significantly reduces the propagation of leaked routes, the conclusions remain unchanged. Figures 7, 8, and 9 replace the corresponding figures in the original paper and show the increased resilience from peer locking. We make corresponding changes to Section 8.2 to reflect the new results. Please cite the IMC paper when referring to this work. 1 INTRODUCTION Internet flattening, the shortening of paths between destinations due to more densely connected topology [29, 39, 57], has fundamen- tally altered the Internet’s structure over the past decade. Today the preponderance of Internet traffic is generated and transmit- ted by a handful of networks, and it is essentially invisible to the traditional Internet hierarchy because it transpires over private interconnects [71, 87, 115, 118]. The increased interconnectivity between networks bypasses the transit networks which comprise the traditional hierarchical Internet’s upper echelons, such as the Tier-1 and Tier-2 ISPs, thereby reducing reliance on their services and putting them under increasing economic pressure [91]. Contributing to transit networks’ decline in revenue, traffic volume, and relevance is an increasing dependence on top cloud provider networks, especially Amazon, Google, IBM, and Microsoft. The cloud providers have well-provisioned WANs to convey ten- ant traffic [83], interconnect with thousands of other networks [8, 26], support service requirements at any scale, and are deploying Points of Presence (PoPs) and datacenters at a rapid pace [121]. Many businesses, including several of the Internet’s largest compa- nies [11, 35, 56, 73], host their frontend and/or backend systems on (multiple [119]) cloud provider infrastructure(s). With the increased reliance on cloud provider infrastructures and shift away from transit [91], it is essential to understand to what extent the cloud providers are able to operate independently from the traditional Internet hierarchy and facilitate connectivity to pub- lic facing services hosted on their infrastructures. Specifically, we are interested in understanding how close the cloud providers are to individually achieving global reachability without traversing the Tier-1 and Tier-2 ISPs. The extent to which the cloud providers can bypass the Tier-1 and Tier-2 ISPs has implications for future con- nectivity between networks, network resilience, the cloud providers driving further changes to the Internet’s topology, and predicting future changes that impact the cloud and transit provider networks. Despite undergoing much scrutiny, the Internet’s topology and routing remains relatively opaque due to shortcomings in existing measurement techniques and routing policies being considered proprietary. Prior studies examined cloud provider connectivity, such as showing an order of magnitude more direct connectivity for cloud providers than earlier work [26]. Others explored how central large content providers and CDNs are to the Internet [22, 23], basing their comparison on the connectivity of the Tier-1 ISPs. The studies look at the cloud providers’ degree of connectivity and the shortening of paths, but they do not examine the networks the cloud providers use to deliver traffic (e.g., whether they bypass the Tier-1 and Tier-2 ISPs). There are metrics to measure the influence of a network on the Internet, such as customer cone (the set of Autonomous Systems (ASes) that an AS can reach using links to customer networks [64]) and transit degree (the number of unique
Transcript of Cloud Provider Connectivity in the Flat Internet

Cloud Provider Connectivity in the Flat InternetTodd Arnold
†Jia He
†Weifan Jiang
†Matt Calder
‡†
Italo Cunha♮†
Vasileios Giotsas◦
Ethan Katz-Bassett†
†Columbia University
‡Microsoft
♮Universidade Federal de Minas Gerais
◦Lancaster University
ABSTRACT
The Tier-1 ISPs have been considered the Internet’s backbone
since the dawn of the modern Internet 30 years ago, as they
guarantee global reachability. However, their influence and
importance are waning as Internet flattening decreases the demand
for transit services and increases the importance of private
interconnections. Conversely, major cloud providers—Amazon,
Google, IBM, and Microsoft—are gaining in importance as more
services are hosted on their infrastructures. They ardently
support Internet flattening and are rapidly expanding their
global footprints, which enables them to bypass the Tier-1 ISPs
and other large transit providers to reach many destinations.
In this paper we seek to quantify the extent to which the
cloud providers’ can bypass the Tier-1 ISPs and other large transit
providers. We conduct comprehensive measurements to identify
the neighbor networks of the major cloud providers and combine
them with AS relationship inferences to model the Internet’s
AS-level topology to calculate a new metric, hierarchy-free
reachability, which characterizes the reachability a network can
achieve without traversing the networks of the Tier-1 and Tier-2
ISPs. We show that the cloud providers are able to reach over 76%
of the Internet without traversing the Tier-1 and Tier-2 ISPs, more
than virtually every other network.
CCS CONCEPTS
• Networks → Logical / virtual topologies; Public Internet; Net-work architectures; Topology analysis and generation.
KEYWORDS
Internet topology, AS relationships, Routing, Traceroute, BGP
ACM Reference Format:
Todd Arnold, Jia He, Weifan Jiang, Matt Calder, Italo Cunha, Vasileios
Giotsas, and Ethan Katz-Bassett. 2020. Cloud Provider Connectivity in the
Flat Internet. In ACM Internet Measurement Conference (IMC ’20), October27–29, 2020, Virtual Event, USA. ACM, New York, NY, USA, 17 pages. https://
doi.org/10.1145/3419394.3423613
Permission to make digital or hard copies of all or part of this work for personal or
classroom use is granted without fee provided that copies are not made or distributed
for profit or commercial advantage and that copies bear this notice and the full citation
on the first page. Copyrights for components of this work owned by others than ACM
must be honored. Abstracting with credit is permitted. To copy otherwise, or republish,
to post on servers or to redistribute to lists, requires prior specific permission and/or a
fee. Request permissions from [email protected].
Our original results correctly filtered leaked routes announced directly to ASes deployingpeer locking. However, the original results incorrectly allowed routes leaked to ASes thatdo not deploy peer locking to later propagate through ASes that do deploy peer locking.This led to an underestimation of the benefits of peer locking. As our original resultsalready showed that peer locking significantly reduces the propagation of leaked routes,the conclusions remain unchanged. Figures 7, 8, and 9 replace the corresponding figuresin the original paper and show the increased resilience from peer locking. We makecorresponding changes to Section 8.2 to reflect the new results.Please cite the IMC paper when referring to this work.
1 INTRODUCTION
Internet flattening, the shortening of paths between destinations
due to more densely connected topology [29, 39, 57], has fundamen-
tally altered the Internet’s structure over the past decade. Today
the preponderance of Internet traffic is generated and transmit-
ted by a handful of networks, and it is essentially invisible to the
traditional Internet hierarchy because it transpires over private
interconnects [71, 87, 115, 118]. The increased interconnectivity
between networks bypasses the transit networks which comprise
the traditional hierarchical Internet’s upper echelons, such as the
Tier-1 and Tier-2 ISPs, thereby reducing reliance on their services
and putting them under increasing economic pressure [91].
Contributing to transit networks’ decline in revenue, traffic
volume, and relevance is an increasing dependence on top cloud
provider networks, especially Amazon, Google, IBM, and Microsoft.
The cloud providers have well-provisioned WANs to convey ten-
ant traffic [83], interconnect with thousands of other networks [8,
26], support service requirements at any scale, and are deploying
Points of Presence (PoPs) and datacenters at a rapid pace [121].
Many businesses, including several of the Internet’s largest compa-
nies [11, 35, 56, 73], host their frontend and/or backend systems on
(multiple [119]) cloud provider infrastructure(s).
With the increased reliance on cloud provider infrastructures
and shift away from transit [91], it is essential to understand to what
extent the cloud providers are able to operate independently from
the traditional Internet hierarchy and facilitate connectivity to pub-
lic facing services hosted on their infrastructures. Specifically, we
are interested in understanding how close the cloud providers are
to individually achieving global reachability without traversing the
Tier-1 and Tier-2 ISPs. The extent to which the cloud providers can
bypass the Tier-1 and Tier-2 ISPs has implications for future con-
nectivity between networks, network resilience, the cloud providers
driving further changes to the Internet’s topology, and predicting
future changes that impact the cloud and transit provider networks.
Despite undergoing much scrutiny, the Internet’s topology and
routing remains relatively opaque due to shortcomings in existing
measurement techniques and routing policies being considered
proprietary. Prior studies examined cloud provider connectivity,
such as showing an order of magnitude more direct connectivity
for cloud providers than earlier work [26]. Others explored how
central large content providers and CDNs are to the Internet [22, 23],
basing their comparison on the connectivity of the Tier-1 ISPs. The
studies look at the cloud providers’ degree of connectivity and the
shortening of paths, but they do not examine the networks the
cloud providers use to deliver traffic (e.g., whether they bypass the
Tier-1 and Tier-2 ISPs). There are metrics to measure the influence
of a network on the Internet, such as customer cone (the set of
Autonomous Systems (ASes) that an AS can reach using links to
customer networks [64]) and transit degree (the number of unique

IMC ’20, October 27–29, 2020, Virtual Event, USA T. Arnold et al.
neighbors that appear on either side of an AS in adjacent links [64]).
The metrics are focused on how many networks an AS can provide
transit services for, but do not capture how or where much of the
Internet’s traffic flows because they lack visibility into edge (e.g.,cloud) network connectivity [25, 77, 115].
Our first contribution is to quantify the degree to which the
cloud providers can bypass the Tier-1 and Tier-2 ISPs when serving
publicly facing cloud-hosted services. To do so, we model an AS-
level topology graph and calculate the number of networks that
are reachable by the cloud providers without traversing the Tier-1
and Tier-2 ISPs. Our model combines AS relationship data from
BGP feeds [15] with comprehensive traceroute measurements from
inside each cloud provider to identify neighbors (§4). Combining
the two datasets overcomes the shortfalls of each, presenting a
more thorough view of cloud provider connectivity than prior
studies [22, 23, 26]. Google and Microsoft validated that 85-89% of
our inferred neighbors are correct (§5).
We use the modeled topology to introduce a new metric,
hierarchy-free reachability, that quantifies the level of indepen-
dence the cloud providers are able to achieve by measuring the
number of networks which are still reachable without the Tier-1
and Tier-2 ISPs. We show that the cloud providers are more
independent than virtually every other network (§6), and each has
the potential to reach at least 76% of networks without traversing
the Tier-1 and Tier-2 ISPs at the time of our measurements. We
also examine which networks the cloud providers use to reach
destinations when bypassing the Tier-1 and Tier-2 ISPs (§7). The
cloud provider’s independence also has security implications; Tier-
1 ISPs are known to propagate routing leaks [96], and their large
footprints help to unwittingly propagate attacks with widespread
effects. We show that the cloud providers’ independence also
protects them from the effects of route leaks (§8).
Our second contribution is a detailed examination of how the
cloud providers are able to achieve such a degree of independence
from the large transit providers despite their different strategies for
establishing connectivity to other networks (§9). We examine the
infrastructure of the cloud providers, specifically PoP deployment
and proximity to large user populations. We consolidate multiple
public data resources, such as network maps, providers’ online PoP
listings, Peering DB [81], and rDNS information to generate topolo-
gies for the four cloud providers and many Tier-1 and Tier-2 ISPs.
We show that the deployment strategies are closely tied to prox-
imity to user population centers and that the similarities between
the cloud provider and Tier-1 and Tier-2 ISPs’ deployments help to
enable the cloud providers’ independence.
2 BACKGROUND
2.1 The Good Old Hierarchical Internet
The conventional view of the Internet is a tiered, hierarchical topol-
ogy where edge networks comprise the hierarchy’s basal layer [29,
39, 57, 64]. At the apex are the Tier-1 ISPs which have large global
networks and are fully interconnected with each other [57, 114].
Key to the hierarchical topology is the concept of transit. A network
is a transit provider if it allows traffic from external sources to tra-
verse its infrastructure to reach external destinations. Lower tiers
pay higher tier networks for transit services to access the rest of
the Internet. The Tier-1 ISPs establish settlement-free peering agree-
ments amongst themselves, meaning they interconnect with each
other and do not charge each other for transit. These agreements
assure the Internet’s global reachability property.
The protocol for exchanging reachability information between
networks is BGP. A network, or AS, establishes a neighbor relation-ship with another AS. These interconnected neighbors exchange
information about the destination IP prefixes each is willing to trans-port traffic towards. Any pair of ASes are free to establish neighbor
connections between themselves if they both agree to do so.
2.2 Internet Flattening
An amalgamation of factors converged to drive Internet flattening.
One factor was the rise of Internet eXchange Points (IXPs) and coloca-tion facilities (colos) [24, 70], which facilitate inter-AS connectivity
through public (shared capacity and peering) or private intercon-
nections (dedicated AS-to-AS peering and capacity also known as
Private Network Interconnects (PNIs)) [3]. The increased direct
connectivity available at IXPs reduces transit costs and affords im-
proved control over routing, utilization, and performance [26, 89].
Parallel to IXP growth, cloud and content providers made sub-
stantial investments towards expanding their global footprints. The
cloud providers deploy PoPs at IXPs and colocation facilities for
closer proximity to user ISPs. They are also deploying enormous
datacenters at a rapid pace; for example, Microsoft doubled the
number of datacenter locations (a.k.a regions) across the globe
from 2015 - 2018 [121]. Finally, they built massive private WANs to
interconnect their datacenters and PoPs, investing billions of dol-
lars towards network infrastructure [90] and collectively now own
or lease approximately 50% of global undersea fiber capacity [13].
Not all cloud providers have private global WANs, and not all
cloud providers route tenant services across their WAN. Each of the
four providers we focus on have an expansive, global private WAN
and route at least some tenant traffic across their WANs [119]. By
default, Amazon tenant traffic egress/ingresses near the datacenter
rather than using their WAN, but Amazon does offer services to
route tenant traffic across its WAN [4].
With the capital investment in infrastructure, the cloud providers
now function as total service environments. Even some of the
largest online companies (e.g., Netflix, Apple, Spotify, Lyft) relyheavily on the cloud providers, and some are beginning to use the
features of multiple cloud providers [56]. Amazon, Google, IBM,
and Microsoft are the marketplace’s top players [91, 116].
2.3 AS Topology Graphs
Analyzing the Internet at the AS-level is an area of considerable
research. Methods to create an AS-level topology rely on the as-
sumption that most interconnects between a pair of ASes can be
classified as either Peer-to-Peer (p2p) or Customer-to-Provider (c2p)
(p2c depending on perspective) [36]. For p2c relationships, a cus-
tomer pays a provider to carry its traffic to other networks. In a p2p
relationship the two peer ASes inform each other of routes through
their customers, not provider or other peer networks.
Links are classified based on the valley-free assumption, meaning
each path consists of zero or more c2p links, zero or one p2p links,

Cloud Provider Connectivity in the Flat Internet IMC ’20, October 27–29, 2020, Virtual Event, USA
followed by a segment of zero or more p2c links. Models often as-
sume that networks prefer to use p2c links over p2p and prefer p2p
over c2p [37]. The current state of the art algorithm for inferring AS
relationships to construct AS-level topology graphs is Problink [53].
An implication of valley-free routing is that many p2p links are
only visible to an AS and its customers. Since topologies are built
from a small number of Vantage Points (VPs), they are unable to
see p2p links from other parts of the Internet.
3 GOALS
The cloud providers continue to expand theirWANs, PoPs, and peer-
ing footprints, and more services depend on their infrastructures,
we want to understand their independence from the traditional
Internet hierarchy to reach the rest of the Internet. To determine
the cloud providers’ independence we need to answer:
Goal 1: To what extent are the cloud providers able to bypass
the Internet hierarchy when serving their cloud tenant traf-
fic? (§§ 6 to 8) Extensive interconnectivity between ASes reduces
transit costs and improves control over routing, utilization, and
performance [26, 46, 68, 89]. It also renders the traffic invisible to
all but the parties involved. To understand the cloud providers’
independence from the Tier-1 and Tier-2 ISPs, we need to identify
the cloud providers’ connectivity and develop a method to quantify
their potential to deliver hosted services without traversing the
networks of the Tier-1 and Tier-2 ISPs.
Goal 2: What are the characteristics of the cloud providers’
PoP deployment strategies? (§9) During the decade of Internet
flattening, the cloud providers were able to deploy massive net-
works to support delivering hosted services. To interconnect with
more remote networks, the cloud providers had to expand their
infrastructure and establish PoPs around the world. To understand
how the cloud providers are able to achieve independence, we seek
to understand the geographic coverage and proximity to user pop-
ulations of cloud and transit providers’ network PoP deployments.
4 MEASUREMENT METHODOLOGY
To evaluate the extent and impact of the cloud provider’s intercon-
nectivity, we consolidate multiple datasets and measurements.
4.1 AS Topology Graph and Measurements
We determine reachability between different networks by modeling
the AS-level topology of the Internet. There are shortfalls to using
either of the two most common tools for mapping Internet topolo-
gies: BGP feeds and traceroutes. By combining the two sources, we
leverage the benefits of each while minimizing their weaknesses.
AS-level topology graph. BGP feeds lack visibility into edge net-
work connectivity [25, 32, 77] and routing policies [5, 77] based on
the number and location of the BGP monitors. Despite bias and
shortfalls, BGP feeds provide a high level of visibility and com-
pleteness for c2p links and those of the Tier-1 and Tier-2 ISPs [41,
53, 64, 77]. There is considerable prior work for constructing AS-
level topologies from BGP feeds [36, 37, 52, 53, 64, 77]. We use the
CAIDA September 2020 AS-Relationship dataset based on public
BGP feeds that also incorporates Ark traceroute data for generating
our topology graph [15].
Augmenting the AS-level topology graph with traceroutes
from the cloud. Publicly available BGP feeds have good coverage
of Tier-1 and Tier-2 ISPs [77]. However, they have limited visibility
into edge network interconnectivity; peering connections at the
edge are only visible to the two directly connected networks and are
invisible to BGP monitors further up the Internet’s hierarchy [25,
77, 115]. Even though the CAIDA dataset incorporates traceroute
data, the vantage points are not embedded within any of the cloud
provider networks [17]; unless the VP is inside the cloud provider
network, it will miss a considerable number of the cloud providers’
peers [26, 32, 77]. Since BGP feeds fail to capture most edge network
peering sessions, we augment our topology model.
To provide a more complete picture of cloud providers’ connec-
tivity we issue traceroutes originating inside the cloud provider
networks. Traceroutes also suffer bias and can deliver distorted
router-level paths. The logical location of VPs or the number of
locations limits visibility into available paths [32]. Additionally,
dropped packets, unresponsive hops, or load balancing can result
in inferring false links [62, 65, 108]. We only consider the directly
connected neighbors of the cloud providers from our traceroutes;
we do not augment the AS-level topology graph with information
gleaned beyond the cloud provider’s neighbors.
We add p2p links into the topology graph between the cloud AS
and neighbor ASes identified in the traceroute measurements. Since
BGP feeds have a high success rate identifying c2p links [53, 64, 77]
but miss nearly all edge peer links [77], we can safely assume newly
identified links are peer links. When a connection identified in a
traceroute already exists in the CAIDA dataset, we do not modify
the previously identified link type.
Issuing and analyzing traceroutes. We create VMs in multiple
locations per cloud provider (12 for Google, 20 for Amazon, 11 for
Microsoft, and 6 for IBM). From each VMwe issue ICMP traceroutes,
using Scamper [60], to every routable IPv4 prefix. We restrict our
measurements at each VM to 1000 pps to avoid rate limiting. We
also conduct smaller sets of supplemental traceroutes to look for
path changes by selecting one prefix originated by each AS [19].
To sanitize our traceroute dataset and identify neighbors we
iteratively map IP addresses to ASes, first using PeeringDB for any
IP addresses where it contains a mapping, then the Team Cymru IP-
to-ASN mapping tool [99], and finally whois to identify the owning
AS. We use PeeringDB as our primary source because we focus on
identifying peerings, and some peering routers use addresses that
are not globally routable but may be in PeeringDB as they are useful
to configure peerings. For example, we saw several unresolved IP
addresses in the 193.238.116.0/22 range, which is not announcedin BGP but belongs to NL-IX and is used by IXP members [82].
We will demonstrate in Section 5 that this supplement makes a
significant difference. We only retain traceroutes that include a
cloud provider hop immediately adjacent to a hop mapped to a
different AS, with no intervening unresponsive or unmapped hops.
By combining our traceroute-inferred cloud peers with those
visible in the CAIDA dataset, we observe many more peers than are
seen in the CAIDA dataset alone: 333 vs. 1,389 peers for Amazon,
818 vs. 7,757 for Google, 3,027 vs. 3,702 for IBM, and 315 vs. 3,580 for
Microsoft. BGP feeds do not see 90% of Google (open peering policy)
and Microsoft (selective peering policy) peers. Both Amazon and

IMC ’20, October 27–29, 2020, Virtual Event, USA T. Arnold et al.
IBM have selective peering policies, and CAIDA alone identified a
higher fraction of Amazon and IBM’s neighbors, but did not detect
76% and 19%, respectively.
2015 datasets. As a comparison point, we also use data from prior
work in 2015 (§6.5). For our reachability retrospective, we need both
an AS-relationship dataset and a comprehensive traceroute dataset
outbound from the cloud providers for the same time period. We
used the CAIDA AS-relationship dataset from September 2015 [14]
and the traceroute dataset from a prior study which also issued
traceroutes outbound from cloud provider VMs to the rest of the
Internet [26]. We used the same methods we applied to our data
to combine the past CAIDA and traceroute datasets to create a
historical AS-level topology map.
4.2 PoP Topology Maps
To understand the similarities between the cloud and large
providers’ PoP deployment strategies, we construct city-level
topology graphs. We use network maps provided by individual
ASes when available [1, 9, 31, 48, 75, 79, 80, 92, 94, 98, 102, 104, 106,
107, 110, 112, 123]. Prior work on topology maps posited that since
networks are trying to provide information and sell their networks,
the maps would only be published if accurate [30, 55]. We also
incorporate router locations from looking glass websites if avail-
able [47, 50, 51, 58, 74, 78, 93, 97, 100, 101, 103, 105, 109, 111, 122].
We combine the maps with two additional information sources.
The first source is to incorporate data from PeeringDB [81]. Data
from PeeringDB is generally reliable, as shown in prior works [59],
and is considered trustworthy and authoritative by many opera-
tional networks, including some of the Internet’s largest [12].
The second source is router hostnames, since the hostnames
often encode location information hints such as airport code or
other abbreviations [63]. To gather hostnames, we issued reverse
DNS (rDNS) requests for every IP address announced by the cloud
providers and Tier-1 and Tier-2 ISPs. To identify which hostnames
belong to routers, we first manually issued traceroutes to random
IP addresses within each AS to find candidate hostnames. When an
AS has rDNS entries, we found that router hostnames were very
clearly distinguished from non-routers (e.g., NTT router hostnames
belong to gin.ntt.net). We used two methods to extract location
information from router hostnames. The first was to manually
inspect each set of hostnames and generate a regular expression
to extract locations. The second method was to resolve aliased
IP addresses/hostnames using midar [18, 54], then use the aliases
as input for sc_hoiho to generate a naming convention regular
expression [61, 63]. We had identical results for the two methods,
except several ASes produced no results from sc_hoiho due to a
low number of alias groups.
The two rDNS methods did not uncover any PoPs that did not
appear in PeeringDB or the available maps, lending support to their
completeness. We see that there are varying degrees of publicly
available data. AT&T for instance provides a map and rDNS data,
but no entries in PeeringDB. Also notable, Amazon has a network
graph and an active presence in PeeringDB, but it does not have
any router hostnames in rDNS. For networks that did respond to
rDNS entries, only 73% of PoPs had rDNS entries. Detailed PoP and
rDNS entry numbers are available in Table 3, in Appendix C.
4.3 Population and AS Type
One of the main reasons for Internet flattening is to improve per-
formance of users accessing hosted services [26], so we want to
assess how cloud provider reachability relates to user populations.
We use data provided by the Asia-Pacific Network Information
Centre (APNIC), which uses ad-based measurements to estimate
the number and percentage of Internet users in an AS [2]. CAIDA
classifies AS into three types [16]: content, transit/access, or enter-
prise. If CAIDA identifies an AS as transit/access and the AS has
users in the APNIC dataset, we classify it as access.
Second, we examine the cloud providers’ geographic PoP de-
ployment strategy relative to user populations. We use the latest
population density data [34], which provides per square kilometer
population counts, and topology graphs (§4.2), to estimate popula-
tion within different radii of network PoPs.
4.4 Limitations
Many virtual cloud interconnects are invisible to the Internet
hierarchy. Discovering an interconnect between networks requires
having a VP that uses a route that traverses the link. Because p2p
links are not announced to providers, observing them requires
having a VP in one of the peers or one of their customer cones.
Cloud providers generally do not have customers, and they peer
with many ASes at the edge which lack any or many customers,
and so these links tend to be invisible to traditional mapping efforts,
which lack VPs in cloud providers and most edge ASes.
By using a VP in the cloud, we observe the cloud provider’s links
that are made available to public cloud tenants. However, it is also
possible for a cloud provider peer to connect to the cloud but NOT
make it available to public cloud tenants, instead only using the
interconnect to access private cloud resources and/or the cloud
provider’s hosted service (e.g., Office 365) [67, 119]. In particular,
Virtual Private Interconnections (VPIs) [10, 27, 66, 119], are often
configured to be private to let cloud customers, even those without
their own AS, have direct access to their own cloud resources (but
not to other VMs hosted in the cloud) without traversing the public
Internet. VPI can be facilitated by cloud exchanges, which allow any
customer to form virtual peering sessions with any participating
cloud provider at any of the cloud exchange’s facilities [119]. These
private VPIs will be invisible to our measurements.
Recent studies discussed VPIs and noted that existing methods
are not capable of identifying these types of connections [118, 119].
VPIs represent a complementary aspect of cloud provider networks
that do not commonly carry traffic from general publicly facing
cloud hosted services, so we view them as out of scope and they
would not be a target of our measurements.
Cloud providers can interfere with measurements, manipulat-
ing header contents, rate limiting measurement traffic, or denying
traffic based on protocol or content. For example, Google is known
to drop packets with IP Options enabled [42] or to manipulate TTL
values for different networking services such as Virtual Private
Clouds (VPCs) [45]. Cloud providers also tunnel traffic between
nodes [85, 117], which can make it difficult or nearly impossible to
know the physical path between their internal hops.
Filtering ormanipulation by the cloud providers can render tradi-
tional measurement techniques impotent. For example, prior work
Cloud Provider Connectivity in the Flat Internet IMC ’20, October 27–29, 2020, Virtual Event, USA
could not issue traceroutes from Microsoft [26] or from Google’s
standard networking tier [8]. In our paper, the key property we infer
from traceroutes is the set of ASes neighboring the cloud providers.
In Section 5, we describe validation provided by Microsoft and
Google demonstrating that 85-89% of neighbors we infer are cor-
rect, suggesting that manipulation had little to no impact on our
key results. Close inspection of geographic and other patterns in
our traceroutes also suggests we are correctly inferring borders.
Underestimating reachability of other networks which are
not our measured cloud providers, Tier-1 ISPs, or Tier-2 ISPs. By
combining neighbors identified in traceroutes with the data from
BGP data feeds, we are able to get a more complete view of the
cloud providers’ connectivity. However, since BGP feeds are esti-
mated to miss up to 90% of edge network peer connections [25, 77],
it is likely that we underestimate the interconnectivity for other
networks (e.g., Facebook or Apple). Comprehensively identifying
the number of peers for other non-cloud networks is challenging
due to measurement budgets and a lack of vantage points, so an
efficient method to uncover other edge networks’ neighbors is an
area for future research.
5 VALIDATION OF NEIGHBOR INFERENCES
Validation of final results. Most of our paper’s results depend
on the set of peers we infer for the cloud providers. To validate this
data, we requested validation from each cloud provider. Microsoft
and Google provided feedback regarding true and false positives –
whether ASes we identified as neighbors are actual neighbors or
not–as well as false and true negatives–whether ASes we identi-
fied as not neighbors are actual neighbors or not. For both cloud
providers, the feedback indicated that the false discovery rate (FDR),
𝐹𝑃/(𝐹𝑃 + 𝑇𝑃), was between 11–15%. For the false negative rate
(FNR), 𝐹𝑁 /(𝐹𝑁 +𝑇𝑃), the rate was higher, although Google could
not provide an exact rate; Microsoft data showed 21%, meaning
the cloud providers have even more neighbors which we did not
see in our measurements. Any approach that, like ours, relies on
traceroutes from the cloud, has inherent limitations. The cloud
providers have many more PoPs than cloud datacenters to measure
from, and so cloud-based measurements cannot necessarily uncover
every path used from every PoPs. Microsoft verified that a number
of peers that we missed–false negatives–only provide routes to a
single PoP, far from cloud datacenters, so those paths are unlikely
to ever be used from available VPs.
Additional information from Microsoft helps put these results in
perspective. Microsoft has an order of magnitude more peers from
IXP route servers than direct peers (bilateral IXP peers and PNI
peers), andmost peers missed by our measurements are route server
peers, potentially including “invisible” links which are challenging
to identify (§4.4). However, from the cloud providers’ perspective,
not all peers are equal. The huge number of route server peers in
total handle only 18% of Microsoft’s global Internet traffic, while
the much smaller number of direct peers handle 82%. Like other
networks, Microsoft prefers direct over router server peers for
capacity and reliability reasons [88, 89]. Microsoft confirmed that
we identified direct peers that account for 93% of Microsoft’s direct
peer traffic (i.e., 93%× 82% = 76% of global traffic). The route server
peers that we identified account for some additional portion of
global traffic from the 18% sent to such peers, but Microsoft was
unable to provide per-peer traffic volumes for route server peers.
This validation suggests that we identify the vast majority of
cloud provider peers and, in particular, of the important peers by
traffic volume, while introducing a modest amount of noise in terms
of false positives. Since our keymetrics rely on and demonstrate that
the cloud providers are very well connected to many peers, the fact
that we identify most important peers, only have a small fraction of
extra peers (false positives), and have fewer extra peers than missed
peers (false negatives) suggests that our conclusions on overall
connectivity likely fall somewhere between a slight overestimate
and (more likely) a slight underestimate.
Iterative improvement to reach final results. The cloud
providers provided feedback to us over multiple iterations, which
helped to improve our accuracy. Our initial neighbor sets for each
cloud provider had FDR of ∼50% and FNR of 23–50%. Microsoft
provided us with a few example destinations that were causing
false inferences. We used the feedback to refine our methodology
in ways we detail in the rest of this section, eventually reaching the
final methodology and final numbers we use in the rest of the paper
(reflecting 11% FDR and and 21% FNR). We used the improved
methodology to update our results for other cloud providers, and
Google indicated that the updated results improved our accuracy
to 15% FDR and substantially fewer false negatives, essentially
serving as an independent validation of the improvements.
We investigated causes for inaccuracy and discovered an incor-
rect assumption. We initially assumed that, in identifying neighbors
from traceroutes, a single unknown or unresponsive hop between
the last cloud provider hop and the first resolved non-cloud provider
hop was unlikely to be an intermediate AS, so we inferred a direct
connection between the cloud provider and the first resolved hop’s
AS. This proved to be the leading cause for inaccuracy. When the
hop is unresponsive, we now simply discard the traceroute.
In our measurements, the far more common scenario is that the
intermediate hop responded, but its IP address was not resolvable
using the Team Cymru IP-to-ASN mapping tool. Manually inspect-
ing individual examples revealed that unresolved IP addresses were
registered in whois and frequently belonged to IXPs but were not
advertised globally into BGP. To resolve these hops to ASes, we
now use PeeringDB (when an AS lists the IP address) or whois
information. Adding these steps decreased our FDR for Microsoft
to 8% and our FNR to 34%.
To identify additional location-specific neighbors, we added VMs
in additional locations beyond our initial set, reaching the numbers
reported in Section 4.1. Measurements from the additional locations
reduced our FNR to 24%, but increased our Microsoft FDR to 16%.
Our final step was to prefer the PeeringDB IXP IP address dataset
for AS resolution over Team Cymru’s. Manually inspecting false
negatives revealed examples of IXP addresses whose prefixes are
advertised globally into BGP, so they resolved to an IXP AS using
Cymru. However, PeeringDB resolved the individual IP to another
AS present at the IXP. Adding this step improved both rates. Mi-
crosoft data indicated our FDR lowered to 11% and FNR to 21%.
There exist opportunities to tune methodology to different trade-
offs between false positives and false negatives. For example, there
are networks where an unresolved hop does belong to the same AS

IMC ’20, October 27–29, 2020, Virtual Event, USA T. Arnold et al.
Figure 1: An example topology for calculating reachability. From the
cloud provider perspective, the topology depicts the types of transit
providers which are restricted for provider-free reachability ( 1○,
§6.2), Tier-1-free reachability ( 2○, §6.3), and hierarchy-free reacha-
bility ( 3○, §6.4). The shaded availability depicts the final calculation
for which an AS is reachable (e.g., ISP A is reachable for provider-free
reachability, but not for Tier-1-free reachability.)
as the first resolved hop. As another example, Amazon uses early
exit for most tenant traffic, rather than routing tenant traffic across
their WAN, and so measurements from different Amazon locations
often use different routes to the same destination. So, issuing mea-
surements from more locations tends to decrease false negatives
(uncovers more peers) but also can increase false positives as errors
accumulate as more measurements are issued. Improving neighbor
identification, especially since the cloud providers have far more
PoPs than datacenters, is an open problem.
6 CLOUD PROVIDER INDEPENDENCE
In this section we describe our process for calculating the cloud
providers’ potential to bypass large transit providers. We examine
the cloud providers’ reachability while bypassing three sets of tran-
sit providers: their individual transit providers (§6.2), also the Tier-1
ISPs (§6.3), and additionally the Tier-2 ISPs (§6.4). We also examine
reachability for the Tier-1 and Tier-2 ISPs while bypassing each
other in order to provide a means of gauging the cloud providers’
degree of independence and examine the Tier-1 and Tier-2 ISPs
independence from one another. We calculate how reachability
has changed during the past five years (§6.5), how it compares to
customer cone (§6.6), and who the cloud providers are unable to
reach under our constraints (§6.7).
6.1 Quantifying Reachability
Here we discuss how we use the AS-level topology graph to calcu-
late the cloud providers’ potential to reach the rest of the Internet
while bypassing different sets of transit provider networks. We use
the topology graph (§4.1) and a BGP simulator to simulate route
propagation on the Internet while enforcing valley-free routing and
common routing policies: preferring customer over peer links and
preferring peer over provider links [37]. We allow all paths tied for
best to propagate, without breaking ties. Enforcing best practice
routing policies helps ensure that the emulated paths reflect paths
traffic is likely to actually take [5] (we show that our simulated
paths do follow paths seen in traceroutes in Appendix A).
We classify a given origin AS, 𝑜 , as reachable by any individ-
ual AS, 𝑡 , if the origin announces a prefix and 𝑡 receives the an-
nouncement. The route is propagated over the topology graph 𝐺
(§4.1), in order to model best practice route propagation. We de-
fine the reachability for 𝑜 as the subset of individual ASes in the
topology graph that receives a valid path, 𝑝 , to 𝑜 . More precisely,
reach(𝑜,𝐺) = {𝑡 | 𝑝𝑡 ≠ ∅,∀𝑡 ∈ 𝐺}. We generally calculate reacha-
bility for the full, augmented AS-level topology graph 𝐼 (§4.1) or
for subgraphs where we exclude a set of nodes, for example 𝐼 \𝑇1to restrict routes from propagating through the Tier-1 ISPs.
To assess the degree of the cloud providers’ independence and
potential to bypass the Internet hierarchy, we calculate reacha-
bility by propagating routes from an origin network, 𝑜 , through
all networks except three sets of transit providers: the given ori-
gin’s transit providers (𝑃𝑜 ), Tier-1 ISPs (𝑇1), and Tier-2 ISPs (𝑇2). By
not propagating routes through the three sets of transit providers,
we use a subgraph of the full Internet topology. So, we define the
reachability determined using the resultant Internet subgraph as
hierarchy-free reachability: reach(𝑜, 𝐼 \ 𝑃𝑜 \𝑇1 \𝑇2). We examine
how bypassing each additional set affects reachability.
For example, consider calculating reachability from the cloud
provider’s perspective in the topology depicted in Fig. 1 for all three
sets of transit providers. The origin, which in this case is the cloud
provider, announces prefixes in each separate scenario. To calculate
provider-free reachability, announcements from the origin are not
allowed to propagate via its providers ( 1○, §6.2) which results in
a reachability of five ASes since the cloud can reach all peers and
their customers (all ovals except white). For Tier-1-free reachability,
we additionally do not propagate announcements via the Tier-1
ISPs ( 2○, §6.3) which reduces the cloud provider’s reachability to
four ASes, as ISP-A (in light gray) becomes unreachable. Finally, for
hierarchy-free reachability announcements are also not propagated
via Tier-2 ISPs ( 3○, §6.4) which reduces the cloud’s reachability to
two due to its p2p links with user ISPs 2 and 3 (in dark gray).
6.2 Bypassing Transit Providers
We first examine reachability when a given network bypasses its
transit providers, as identified in the CAIDA dataset. More specifi-
cally, we calculate reach(𝑜, 𝐼 \ 𝑃𝑜 ), which we refer to as provider-free reachability. We exclude the given network’s transit providers
because one goal of increasing extensive interconnectivity is to re-
duce transit costs [26, 46, 68, 89]. The cloud providers aggressively
pursue interconnectivity, and we want to assess the independence
their connectivity affords them. Restricting origins to not use their
transit providers will not affect the Tier-1 ISPs’ reachability, since
they have no transit providers and instead mutually peer to achieve
global reachability. For the other networks, reachability while by-
passing their transit providers shows their reachability based on
the richness of their peering connections.
The results can be seen for each cloud , Tier-1 , and Tier-2 in
Fig. 2. The Tier-1 ISPs have the maximum possible reachability
(69,488 ASes). Figure 2 also shows there are two non-Tier-1 ISPs
which have full reachability: PCCW (AS 3491), and Liberty Global
(AS 6830). PCCW and Liberty Global have no transit providers,
according to the CAIDA dataset, but they are not defined as Tier-1
ISPs in the dataset we use [120]. Google has nearly full reachability,
even though they have three transit providers in the September
2020 dataset [15]: Tata (AS 6453) and GTT (AS 3257) which are
Tier-1 ISPs, as well as Durand do Brasil (AS 22356). Even without

Cloud Provider Connectivity in the Flat Internet IMC ’20, October 27–29, 2020, Virtual Event, USA
Leve
l 3 HEGo
ogle
Micr
osof
tIB
MCo
gent
Zayo
Telia
GTT
NTT
TELI
N PT
Amaz
onPC
CWVo
cus
RETN
Telst
raTa
taCo
mca
stKP
NCN
Net VZ
Kore
a Te
leIt
Spar
kle
AT&T
KCOM TD
CFi
bren
oire
Tele
foni
caOr
ange
Stea
lthVo
dafo
neIIJ
apan
Lib. G
lob.
Brit.
Tel
eTe
le2
KDDI
D Te
leko
mSp
rint PT
Spiri
tIn
tern
apEa
syne
tFi
berR
ing
Cloud, Tier-1, and Tier-2 networks reachability, sorted by Hierarchy-free Reachability
20K
40K
60K
Num
ber o
f ASe
s Rea
chab
le
CloudReachabilityI \ Po
I \ Po \ T1I \ Po \ T1 \ T2
Tier1ReachabilityI \ Po
I \ Po \ T1I \ Po \ T1 \ T2
Tier2ReachabilityI \ Po
I \ Po \ T1I \ Po \ T1 \ T2
Figure 2: Reachability for the cloud providers, Tier-1, and Tier-2 ISPs, sorted by descending hierarchy-free reachability. The stacked bars
represent reachability calculated using multiple subgraphs of the Internet topology: excluding per network transit providers (provider-free
reachability, §6.2,reach(𝒐, 𝑰 \ 𝑷𝒐) for cloud , Tier-1 , and Tier-2 ), also bypassing Tier-1 ISPs (Tier-1-free reachability, §6.3,reach(𝒐, 𝑰 \ 𝑷𝒐 \ 𝑻1)for cloud , Tier-1 , and Tier-2 ), and also bypassing Tier-2 ISPs (hierarchy-free reachability, §6.4, reach(𝒐, 𝑰 \ 𝑷𝒐 \ 𝑻1 \ 𝑻2) , cloud , Tier-1 , andTier-2 ). Since the Tier-1 ISPs do not have providers, their reachability depicts the maximum possible (69,488 ASes). The cloud providers are
among the least affected by each reachability constraint, demonstrating their ability reach a large portion of the Internet while bypassing the
Tier-1 and Tier-2 ISPs.
the use of their transit providers, there are only 174 networks that
Google cannot reach when bypassing its transit providers.
The other cloud providers – Microsoft (64,475 ASes), IBM (63,927
ASes), and Amazon (62,831 ASes) – are able to reach a large por-
tion of networks when bypassing their individual transit providers.
Their calculated reachability is slightly lower than, but still compa-
rable to most of the Tier-2 ISPs (e.g., Hurricane Electric at 66,279ASes). Amazon is affected the most by removing transit providers
since they have 20 according to CAIDA, but they are still able to
reach 90.0% of all ASes. This reinforces intuitions about the exten-
sive reach of the cloud providers’ peerings.
6.3 Bypassing the Tier-1 ISPs
Next we consider independence from the Tier-1 ISPs in addition
to transit providers, more specifically we calculate reach(𝑜, 𝐼 \𝑃𝑜 \𝑇1). We refer to this calculation as Tier-1-free reachability. We
select the Tier-1 ISPs because they are considered to be the top of
the traditional Internet hierarchy [53], and one of the originally
identified goals of Internet flattening was to bypass the Tier-1
ISPs [39], so we want to analyze the cloud providers ability to
bypass them in particular. Even though the Tier-1 ISPs cooperate to
provide global reachability, they still compete for customers so we
want to examine their potential to bypass each other. The results
for each cloud , Tier-1 , and Tier-2 can be seen in Fig. 2.
Since the Tier-1 ISPs all peer with each other, they all see a de-
crease in their reachability compared to bypassing only individual
transit providers, where they had reachability to the entire Internet.
Some Tier-1 ISPs see a much greater reduction than others. Level 3
(AS 3356) sees the lowest decrease in reachability of 4,929 ASes,
while Orange (AS 5511) sees the largest decrease of 14,334 ASes.
Overall, the varied decrease in calculated reachability shows that
some individual Tier-1 ISPs more aggressively pursue interconnec-
tivity outside of the Tier-1 ISPs than others and/or they have a
larger number of customers.
The Tier-2 ISPs see a slightly larger decrease in reachability than
the Tier-1 ISPs, but most have a reachability that is equivalent with
the Tier-1 ISPs, indicating they, too, have a high degree of inde-
pendence from the Tier-1 ISPs. Some of the Tier-2 ISPs see little
decrease in reachability when bypassing the Tier-1 ISPs relative to
when bypassing their providers. For example, KCOM’s providers
are all Tier-1 ISPs and KCOM has few peer relationships with any
Tier-1 ISP outside of their transit providers. As a result, they see
a greater reduction in reachability from provider-free reachability
than Tier-1-free reachability. Most Tier-2 ISPs do see a decrease,
with Hurricane Electric (AS 6939) only seeing a decrease of 4,805
ASes, while KDDI (AS 2516) sees a decrease in calculated reacha-
bility of 14,634 ASes. This shows that some of the Tier-2 ISPs are
more independent from the Tier-1 ISPs than others.
The cloud providers are amongst the least impacted. Google
(62,439 ASes) can still reach 89.9% of ASes; Amazon (57,096 ASes)
has the lowest calculated reachability of the four but is still able to
reach 82.2% of ASes while bypassing their transit providers and the
Tier-1 ISPs. Google’s calculated reachability decreased the most, by
6,875 ASes, while Microsoft had the lowest and only declined by
3,427 ASes. This difference is due to Google peering with 15 Tier-1
ISPs, while Microsoft counts 7 Tier-1 ISPs as transit providers.
6.4 Hierarchy-free Reachability
We consider bypassing the Tier-2 ISPs in addition to the Tier-1
ISPs and a given network’s transit providers. More specifically, we
calculate hierarchy-free reachability as reach(𝑜, 𝐼 \ 𝑃𝑜 \ 𝑇1 \ 𝑇2).We include the Tier-2 ISPs because they are also large regional or

IMC ’20, October 27–29, 2020, Virtual Event, USA T. Arnold et al.
global transit providers, they are highly connected, and the cloud
providers use several as transit providers. For example, Hurricane
Electric is considered a Tier-2 ISP but is consistently in the top 10
networks based on customer cone size [15], and top two for transit
and node degrees [53]. The Tier-1 ISPs also rely on Tier-2 ISPs
as customers (§6.4 and Appendix B). The set of Tier-1 ISPs is not
universally agreed upon, so we select the Tier-1 and Tier-2 ISPs as
defined in prior work [53].
Results for each cloud , Tier-1 , and Tier-2 are in Fig. 2. We can
see that a handful of the Tier-1 and Tier-2 ISPs saw less impact
to their calculated reachability than when bypassing only transit
providers or when bypassing transit providers plus Tier-1 ISPs.
For example, of the Tier-1 ISPs, Level 3 (AS 3356), Telia (AS 1299),
and Cogent (AS 174) had a greater reduction when bypassing other
Tier-1 ISPs. Level 3 once again had the lowest decrease in calculated
reachability at 3,405 ASes. There are a handful of Tier-1 ISPs whose
reachability incurs an enormous decrease when bypassing the Tier-
2 ISPs, indicating they rely heavily on those networks to reach
many destinations (we examine two examples in Appendix B).
Amongst the Tier-2 ISPs, Hurricane Electric (AS 6939 with 2,493
ASes) and Vocus (AS 4826 with 3,328 ASes) saw less reduction
in reachability than when bypassing the Tier-1 ISPs and transit
providers. This shows these networks havemore potential to bypass
the Tier-2 ISPs than the Tier-1 ISPs.
Once again, the cloud providers were amongst the least impacted,
indicating they have a high degree of independence from the Tier-
2 ISPs also. Google’s decrease was the lowest at only 3,517 ASes,
while Amazon’s was the greatest at 5,735 ASes. Overall, the cloud
providers are amongst the least impacted by each change, demon-
strating that they have a high degree of freedom from each group of
transit provider networks. Similarly, Hurricane Electric and Level 3
show little impact to their reachability, highlighting their indepen-
dence from the Tier-1 and Tier-2 ISPs.
Hierarchy-free reachability for Top 20 ASes. If we expand
our calculations for reachability and examine the top 20 ASes by
hierarchy-free reachability (Table 1, 2020 results on right side), six
of the networks are Tier-1 ISPs and two are Tier-2 ISPs , alongside
four other transit providers, whereas the top 20 for customer cone
are almost exclusively transit networks (not shown).
The rest of the top 20 networks by hierarchy-free reachability
are a mixture of major cloud providers and other cloud/content
providers. Amazon, Google, IBM, and Microsoft occupy three of
the top five, and all four are in the top twenty positions, including
the third spot which is occupied by Google. This confirms our
initial hypothesis that the cloud providers have a high degree of
independence from the Tier-1 and Tier-2 ISPs. These results also
show there are a considerable number of networks with a high level
of independence from the Tier-1 and Tier-2 ISPs, although edge
networks are likely brought down due to lack of visibility [115].
6.5 Reachability over Time
We also want to examine to what degree the cloud providers’ in-
dependence has evolved in the five years since the scope of their
interconnectivity was identified in prior work [26]. We were pro-
vided access to the traceroute data from the prior work [26], which
allowed us to apply our methodology for calculating hierarchy-free
2015
# Network (AS)
Reachability
(%)
1 Level 3 (3356) 43,413 (83.4%)
2 Google (15169) 42,347 (81.7%)
2 HE (6939) 41,876 (80.8%)
4 Cogent (174) 39,113 (75.5%)
5 StackPath (12989)39,068 (75.4%)
6 WV Fiber (19151)38,756 (74.8%)
7 RETN (9002) 37,796 (73.0%)
8 NTT (2914) 37,543 (72.5%)
9 IBM (36351) 37,203 (71.8%)
10 IPTP (41095) 37,048 (71.5%)
11 Telia (1299) 36,906 (71.2%)
12 iiNet (4739) 36,846 (71.1%)
13 Init7 (13030) 36,814 (71.1%)
14 MTS PJSC (8359) 36,786 (71.0%)
15 Telstra (10026) 36,322 (70.1%)
16 GTT (3257) 36,238 (70.0%)
17 PCCW (3491) 36,109 (69.7%)
18 TDC (3292) 36,001 (69.5%)
19 Swisscom (3303) 35,772 (69.1%)
20 Zayo (6461) 35,686 (68.9%)
62 Microsoft (8075) 32,436 (62.6%)
206 Amazon (16509) 29,905 (57.7%)
2020
# Network (AS)
Reachability
(%, % change)
1 Level 3 (3356) 61,154 (90.2%, 6.8%)
2 HE (6939) 58,981 (87.0%, 6.2%)
3 Google (15169) 58,922 (86.9%, 5.2%)
4 Microsoft (8075) 57,357 (84.6%, 22.0%)
5 IBM (36351) 55,714 (82.2%, 10.4%)
6 Cogent (174) 55,049 (81.2%, 5.7%)
7 Zayo (6461) 54,489 (80.4%, 11.5%)
8 Telia (1299) 54,324 (80.1%, 8.9%)
9 GTT (3257) 53,388 (78.7%, 8.7%)
10 SG.GS (24482) 53,157 (78.4%, 9.7%)
11 COLT (8220) 52,256 (77.1%, 12.9%)
12 G-Core Labs (199524) 51,820 (76.4%, 27.4%)
13 NTT (2914) 51,374 (75.8%, 3.3%)
14 Wikimedia (14907) 51,204 (75.5%, 25.7%)
15Core-Backbone (33891)51,110 (75.4%, 12.7%)
16 WV FIBER (19151) 51,083 (75.3%, 0.5%)
17 TELIN PT (7713) 50,919 (75.1%, 18.6%)
18 Amazon (16509) 50,867 (75.0%, 17.3%)
19 Swisscom (3303) 50,758 (74.9%, 5.8%)
20 IPTP (41095) 50,606 (74.6%, 3.1%)
Table 1: Comparison of hierarchy-free reachability for the top 20
networks, from September 2015 and September 2020. We apply the
same methodology to calculate hierarchy-free reachability for each
dataset (§§ 4.1 and 6.1). We can see that Google was one of the most
independent networks, even in 2015. The other three cloud providers
have dramatically increased their ability to bypass Tier-1 and Tier-2
ISPs over the past five years.
reachability by combining the prior traceroute data and the CAIDA
dataset from September 2015 which contains 51,801 ASes. The 2015
dataset did not include traceroutes for Microsoft. Also, the dataset
applied its own IP to AS mapping, which likely has a non-trivial
percentage of false positives based on our validation efforts with the
cloud providers (§5). This likely causes us to overestimate the cloud
providers’ 2015 reachability, but it provides us a rough estimate for
comparing the changes over time.
Comparing the percentage of reachable ASes for each of the top
networks (Table 1), most have gained 5-6% in reachability, showing
that independence from the Tier-1 and Tier-2 ISPs is increasing.
One notable change is that in 2015, only Google (#2) and IBM (#9)
appear in the top 20. We can see that over the past five years, Ama-
zon and Microsoft have significantly increased their independence
from the Tier-1 and Tier-2 ISPs. We analyzed and compared the
differences in path length from these two datasets, which is in Ap-
pendix E. Even though the cloud providers increased reachability,
it has had little impact on the distributions of their path lengths, as
their rate of adding new peers has trailed the Internet’s expansion.
6.6 Hierarchy-free Reachability versus
Customer Cone
There are various metrics for examining properties of the Internet
and its networks. One is customer cone, which for “AS X is the
set of ASes that X can reach using only p2c links. . . an indication
of the market power of an AS” [53]. Even though customer cone
is effective at measuring the number of ASes that the Tier-1 ISPs
and other large networks provide transit for, it fails to capture
the increased interconnectivity amongst networks and the shifting

Cloud Provider Connectivity in the Flat Internet IMC ’20, October 27–29, 2020, Virtual Event, USA
Figure 3: Comparison of hierarchy-free reachability (y-axis) and customer cone (x-axis) calculations using the September 2020 CAIDA dataset
for all ASes. Both metrics are a count of the total number of qualifying ASes; note the x-axis is in log scale. There are considerably more ASes
with hierarchy-free reachability comparable to that of the large provider networks, confirming the scale of flattening’s impact on reachability.
traffic patterns across those interconnections. As a result, it is not
representative of a network’s importance in a flattened Internet.
To examine whether customer cone still reflects the importance
of various networks, we calculate hierarchy-free reachability for
every AS on the Internet, which we compare against their customer
cone. This can be seen in Fig. 3, with hierarchy-free reachability on
the y-axis and customer cone for each AS on the x-axis, in log scale.
The figure depicts the four cloud providers (blue circles), Tier-1
ISPs (red square), Tier-2 ISPs (green diamonds), content providers
(small orange circles), provider networks (purple diamonds), access
networks (gray circles), and all other networks (brown X).
Other than the Tier-1 and Tier-2 ISPs, which have both high
hierarchy-free reachability and large customer cones, there is lit-
tle correlation between the two metrics. Although customer cone
captures aspects of the influence and market power of an AS, it
is not designed for and is not capable of capturing Internet flat-
tening’s effect on a network. For example, Sprint (AS 1239) is #32
for customer cone and is considered a Tier-1 ISP. However, their
hierarchy-free reachability rank is 2,978. Without the other Tier-
1 ISPs, Sprint relies heavily on a handful of Tier-2 ISPs to reach
many destinations. For additional details regarding examples of low
hierarchy-free reachability for Tier-1 ISPs, please see Appendix B.
There are relatively few networks that possess a large customer
cone; there are 8,374 networks with hierarchy-free reachability
≥ 1, 000, but only 51 networks with a customer cone ≥ 1, 000. One
reason for so few networks with a large customer cone is that there
is little incentive for a network to incur the costs of purchasing
transit from multiple providers beyond a primary and secondary
provider. Another reason is that establishing direct connectivity
to cloud and content providers is free1and is supposed to provide
improved performance [7, 8, 26], so the majority of traffic no longer
flows through transit providers [71, 87, 115, 118].
Hierarchy-free reachability shows that a considerable number
of networks have high reachability when bypassing the Tier-1 and
Tier-2 ISPs, which suggests that customer cone–dominated by the
1Connectivity is free in terms of data transferred. Purchasing ports and space in an
IXP or colo do incur charges.
Level 3 HE Google Microsoft IBM Cogent Zayo Telia GTT NTT TELIN PT AmazonASes not reachable per AS under constraints of provider-free reachabilty
0
5K
10K
15K
20K
Num
ber o
f Unr
each
able
ASe
s
6.54 5.67 5.98 6.15 6.54 5.98 6.27 5.77 6.04 5.82 5.93 6.25
58.34 61.99 62.79 60.39 59.98 58.98 57.21 58.28 57.81 56.99 57.96 57.9323.2413.77 13.31
16.6416.48 18.15 21.29 18.91 20.40
20.50 19.16 18.85
11.8918.57 17.91
16.8217.00 16.89 15.23 17.04 15.75
16.69 16.95 16.97EnterpriseAccessTransitContent
Figure 4: The number of unreachable ASes for the top four cloud
providers and top eight transit providers when bypassing the Tier-1
and Tier-2 ISPs. The unreachable networks per provider are sepa-
rated into four types (§4.3). The numbers in each bar is the percentage
of unreachable networks that type represents for the given provider.
Google, IBM, and Microsoft focus their peering efforts on reaching
access networks.
large tier 1 and 2 networks–does not paint a complete picture of in-
fluence.. Customer cone is a top-down transit provider-centric view,
while hierarchy-free reachability provides a method to gauge di-
rectness of connectivity to edge networks. Customer cone captures
which ASes an AS can reach following only p2c links. Hierarchy-
free reachability also considers which ASes an AS can reach via its
peers, since a goal of peering connectivity is to bypass the hierarchy
and bring together lower tier networks to exchange traffic.
6.7 Unreachable Networks
We have seen that the cloud providers have a high degree of inde-
pendence from the Tier-1 and Tier-2 ISPs. Here we examine what
types of networks the cloud providers, Tier-1 ISPs, and Tier-2 ISPs
are unable to reach when bypassing the Tier-1 and Tier-2 ISPs. Net-
work types are classified into four categories (§4.3) as seen in Fig. 4:
content , access , transit , and enterprise .
Examining which types of networks each provider is unable to
reach when bypassing the Tier-1 and Tier-2 ISPs can reveal their
peering strategies. Google, IBM, and Microsoft focus their peer-
ing efforts on reaching user (access) networks. Hurricane Electric,
which has an open peering policy while most large transit providers’
peering policies are restrictive, more closely resembles Google, IBM,

IMC ’20, October 27–29, 2020, Virtual Event, USA T. Arnold et al.
Figure 5: Example topology for calculating reliance. Ties are not
broken, so 𝑡 will receive three best paths to reach the origin, 𝑜:
𝑥 → 𝑢 → 𝑜 , 𝑥 → 𝑣 → 𝑜 , and 𝑦 → 𝑤 → 𝑜 . Since 𝑥 appears in two best
paths received by 𝑡 , rely(𝑜, 𝑥) = 2/3 AS, whereas reliance for 𝑢, 𝑣,
𝑤, and 𝑦 is 1/3 AS.
andMicrosoft’s percentages than other Tier-1 and Tier-2 ISPs. Ama-
zon’s percentages more closely resemble those of the other transit
providers, with fewer unreachable networks in the enterprise and
transit categories compared to the other three cloud providers.
7 HOW CLOUDS REACH OTHER NETWORKS
After examining the extent of the cloud providers’ reachability, we
also want to analyze the degree to which the cloud providers rely
on other ASes to reach the rest of the Internet and whether the
cloud providers’ efforts to bypass the Tier-1 and Tier-2 ISPs has
shifted their reliance onto other networks.
7.1 Calculating Reachability Reliance
To calculate reliance we use all simulated paths tied for best accord-
ing to the Gao-Rexford model, without breaking ties. We define the
reliance rely(𝑜, 𝑎) of any origin, 𝑜 , on any other individual AS, 𝑎,
as the fraction of best paths received in which 𝑎 appears for every
individual network 𝑡 to 𝑜 . For example, consider the topology in
Fig. 5 where an individual network, 𝑡 , receives three best paths
to reach 𝑜 , with one AS, 𝑥 , appearing in two best paths. In this
example, 𝑜’s reliance on 𝑥 is 2/3 AS and rely(𝑜, 𝑡) = 1.
In assessing reliance, there are two extreme conditions. The first
is a purely hierarchical Internet topology with no peering links
between networks except for those between the Tier-1 ISPs. In
such a topology, every network relies on its transit provider(s)
for the full Internet, and each of the Tier-1 ISPs for a portion of
the Internet depending on which Tier-1 ISP the AS (or its transit
provider) connects to. For example, if we considered Google in the
fully hierarchical network, and consider only one of its providers,
Tata (AS 6453) [15], its reliance on that transit provider would be
69,488, and Google’s reliance on the set of other Tier-1 ISPs would
be 54,887 ASes (69, 488 − 14, 601, which is Tata’s customer cone).
The other extreme is a completely flat network, where every
network is fully meshed and there are only peering connections
between networks. Any individual network would only use each
network to reach that network, meaning every network has a re-
liance of 1AS on every other network. We assume that in this
topology networks do not provide transit for others.
7.2 Cloud Provider Reliance
We map reliance for the four cloud providers after calculating
hierarchy-free reachability (§6.4), where the cloud providers bypass
their individual transit providers, Tier-1 ISPs, and Tier-2 ISPs. Fig-
ure 6 shows the cloud providers’ reliance on individual ASes (x-axis,
Cloud #1 (AS, rely) #2 (AS, rely) #3 (AS, rely)
Amazon
Durand do Brasil
(AS 22356, 5889.6)
Rostelecom
(AS 12389, 1508.7)
Bharti Airtel
(AS 9498, 1220.2.1)
Rostelecom
(AS 12389, 716.6)
Lightower Fiber
(AS46887, 686.6)
Colt
(AS 8220, 587.3)
IBM
Bharti Airtel
(AS 9498, 1483.4)
Rostelecom
(AS 12389, 1197.6)
Colt
(AS 8220, 770.1)
Microsoft
Lightower Fiber
(AS46887, 727.8)
PJSC
(AS 3216, 715.4)
Bharti Airtel
(AS 9498, 711.3)
Table 2: For each cloud provider, the table shows the top three net-
works in terms of reliance. There are some networks that show up
in the top three for more than one cloud provider.
using intervals of 25 for bins and readability), and the number of
ASes that have a specific reliance (y-axis, in log scale).
Overall, we can see the cloud providers generally have low re-
liance on any individual network. The cloud providers have a re-
liance of ≤ 600 for all but a handful of networks. IBM and Ama-
zon are the only two cloud providers with reliance ≥ 800 for any
network. The top three reliance per cloud provider can be seen in
Table 2. Amazon has the highest reliance on any individual network,
5,889 ASes for Durand do Brasil (AS 22356) (not shown in Fig. 6 for
readability), but they also had the fewest number of neighbors.
Gauging where the cloud providers are with respect to the two
extreme hierarchies (fully meshed and fully hierarchical), we can
see that the cloud providers’ reliance is closer to a completely
flat topology than hierarchical. The cloud providers do still have
a handful of networks they rely on, but their reliance on other
networks is much closer to 1 than it is to the other extreme.
8 RESILIENCE TO ROUTE LEAKS
We examined cloud providers’ extensive interconnectivity and the
degree to which it enables them to bypass the traditional Internet
hierarchy. One of the implications of this independence is that the
cloud providers should have a level of protection from certain types
of networking attacks, such as improved security against route
leaks—when a network announces another network’s IP address
space and attracts its traffic—which have been reported to disrupt
cloud provider services and operations [43, 72, 84, 96].
8.1 Methodology
In this section we evaluate a cloud provider’s resilience to route
leaks (and prefix hijacks, which are intentional malicious route
leaks) using simulations. We configure our simulation of route
propagation (§4.1) such that amisconfigured AS is leaking the same
prefix announced by a cloud provider and compute which route
is preferred by every other AS. We assume transit networks apply
no route filters beyond valley-free routing and that the leaked
routes have the same prefix length as the legitimate routes, so the
two routes compete for propagation based on AS-path length. We
compute all paths tied for best according to the Gao-Rexford model,
without breaking ties, and consider an AS as detoured if any one ofits best routes are towards the misconfigured AS. This makes our
results a worst case analysis and bypasses the need for identifying
a single best route for ASes in the Internet, which is challenging

Cloud Provider Connectivity in the Flat Internet IMC ’20, October 27–29, 2020, Virtual Event, USA
0 200 400 600 800 1000 1200 1400 1600Reliance per cloud provider using hierarchy-free reachability
0100
101
102
103
104
Num
ber o
f ASe
s with
give
n re
lianc
e
AmazonGoogle
IBMMicrosoft
Figure 6: Histogram for the cloud providers’ reliance on different networks. We can see that rely = 1 for the majority of networks for each of
the cloud providers, and they have low reliance on all but a handful of networks. Amazon is the lone cloud provider that has high reliance
(5,889 ASes) on a single network, Durand do Brasil (AS 22356) (not pictured for readability).
due to insufficient information to perform tie-breaking [5, 40]. We
use the same 2015 and 2020 datasets used in previous sections.
8.2 Resilience vs Peering Footprint
We run simulations where each cloud provider’s routes are leaked
by a misconfigured AS. We also consider the cloud provider under
different announcement configurations. We run 5000 simulations
per configuration, choosing the misconfigured AS at random. Fig-
ure 8 shows the cumulative distribution function for the fraction of
detoured ASes (i.e., those ASes that route to the misconfigured AS)
across all simulations for Google in the 2020 topology.
The misconfigured AS always leaks routes to all its neighbors.
The announce to all line shows results when Google announces
its routes to all neighbors. For comparison, the average resilienceline shows the average fraction of ASes detoured for a random
(legitimate) origin AS and a random misconfigured AS. For each of
200 randomly chosen misconfigured ASes, we randomly choose 200
victim origin ASes and calculate their average resilience. Our results
show Google’s footprint provides significantly stronger resilience
compared to a random origin AS.
Manually inspecting cases where the leaker attracts traffic from
more than 20% of ASes found leakers with multiple well-connected
providers (e.g., Tier-1 and Tier-2 ISPs). Google peers with many
networks, and these networks will prefer leaked route from cus-
tomers over peer routes from Google. To verify this, we also show
results for a scenario where Google announces to all its neighbors,
and different subsets of Google’s neighbors deploy filters such that
they discard routes for Google’s prefixes that they receive from any
network other than Google (a.k.a. peer locking [76]), limiting the
propagation of leaked routes. We consider three scenarios in terms
of which neighbors deploy peer locking: Tier-1 neighbors, Tier-1
and Tier-2 neighbors, and all neighbors. Figure 8 indicates that peer
locking Tier-1 and Tier-2 neighbors would limit even the worst
leaks to 20% of the ASes in the Internet, and global peer locking
would make Google virtually immune to route leaks.
Figure 8 also shows results simulating Google only announcing
its prefixes to Tier-1 and Tier-2 ISPs (including its provider in the
September 2020 dataset [15], Tata). This scenario, which ignores
Google’s rich peering with lower tier and edge ASes, shows signifi-
cantly reduced resilience against route leaks. In fact, since Google
peers with most Tier-1 and Tier-2 ISPs (instead of buying transit),
Google’s resilience in this configuration is worse than that of a
random origin AS. While adding peers improves resilience against
route leaks as it makes routes shorter, changing a relationship such
that an AS receives a route from a peer rather than from a customer
decreases resilience as it makes announcements less preferred.
Figures 7a to 7d are similar to Figure 8 and show the fraction
of ASes detoured when Microsoft, Amazon, IBM, and Facebook
announce their routes under different configurations. The averageresilience line is the same in all graphs. The results show that all
cloud providers are resilient to route leaks. Peer locking is slightly
more effective for Google because it has more peers and fewer
transit providers; conversely, we note other cloud providers would
be more resilient to leaks than Google if they announced their
routes only to Tier-1, Tier-2, and providers.
8.3 Fraction of Users Impacted
Figure 9 shows the fraction of users whose ASes have detoured
routes for different route announcement configuration from Google.
Figure 9 is similar to Fig. 8, but weights detoured ASes by their
estimated population, as given by APNIC’s population database [2].
Results are similar to the fraction of ASes detoured, with a slight
skew to the left, indicating that some of the ASes that are detoured
serve a relatively small fraction of users.
8.4 Resilience over time
Figure 10 shows the fraction of detoured ASes when Google an-
nounces routes to all its peers, and compares results for the topology
in 2015 and 2020. Although Google’s peering footprint grew be-
tween 2015 and 2020, we find that the resilience against route leaks
decreased slightly. We identify two possible explanations for this
result. First, although Google’s peering footprint grew, Google also
turned some of its providers into peers. As discussed earlier, more
peers increase resilience, but turning providers into peers decreases

IMC ’20, October 27–29, 2020, Virtual Event, USA T. Arnold et al.
0 20 40 60 80 100ASes Detoured (%)
0.0
0.2
0.4
0.6
0.8
1.0
Cum
. Fra
c. o
f Misc
onfig
ured
ASe
s
Announce to all, global peer lockAnnounce to all, T1+T2 peer lockAnnounce to all, T1 peer lockAnnounce to allAnnounce to T1, T2, and providersAverage resilience
(a) Microsoft
0 20 40 60 80 100ASes Detoured (%)
0.0
0.2
0.4
0.6
0.8
1.0
Cum
. Fra
c. o
f Misc
onfig
ured
ASe
s
Announce to all, global peer lockAnnounce to all, T1+T2 peer lockAnnounce to all, T1 peer lockAnnounce to allAnnounce to T1, T2, and providersAverage resilience
(b) Amazon
0 20 40 60 80 100ASes Detoured (%)
0.0
0.2
0.4
0.6
0.8
1.0
Cum
. Fra
c. o
f Misc
onfig
ured
ASe
s
Announce to all, global peer lockAnnounce to all, T1+T2 peer lockAnnounce to all, T1 peer lockAnnounce to allAnnounce to T1, T2, and providersAverage resilience
(c) IBM
0 20 40 60 80 100ASes Detoured (%)
0.0
0.2
0.4
0.6
0.8
1.0
Cum
. Fra
c. o
f Misc
onfig
ured
ASe
s
Announce to all, global peer lockAnnounce to all, T1+T2 peer lockAnnounce to all, T1 peer lockAnnounce to allAnnounce to T1, T2, and providersAverage resilience
(d) Facebook
Figure 7: Percent of detoured ASes when cloud providers announce routes under different scenarios while a randomly selected misconfigured
AS leaks the cloud provider’s prefix.
0 20 40 60 80 100ASes Detoured (%)
0.0
0.2
0.4
0.6
0.8
1.0
Cum
. Fra
c. o
f Misc
onfig
ured
ASe
s
Announce to all, global peer lockAnnounce to all, T1+T2 peer lockAnnounce to all, T1 peer lockAnnounce to allAnnounce to T1, T2, and providersAverage resilience
Figure 8: Percent of detoured ASes when
Google announces routes under different sce-
narios while a randomly selected misconfig-
ured AS leaks one of Google’s prefixes. The
results show that Google’s peering footprint
makes it resilient against route leaks.
0 20 40 60 80 100Users Detoured (%)
0.0
0.2
0.4
0.6
0.8
1.0
Cum
. Fra
c. o
f Misc
onfig
ured
ASe
sAnnounce to all, global peer lockAnnounce to all, T1+T2 peer lockAnnounce to all, T1 peer lockAnnounce to allAnnounce to T1, T2, and providersAverage resilience
Figure 9: Percent of users in detoured ASes
when Google announces routes under differ-
ent scenarios. The results show that Google’s
peering footprint protects a large fraction of
the user population from route leaks.
0 20 40 60 80 100ASes Detoured (%)
0.0
0.2
0.4
0.6
0.8
1.0
Cum
. Fra
c. o
f Misc
onfig
ured
ASe
s
20152020
Figure 10: Percent of detoured ASes when
Google announces routes to all its peers in the
2015 and 2020 Internet. Results show small
improvement in resilience, as Google reduced
its number of providers and most new peers
are small edge ASes.
resilience. Second, Google’s peering footprint was already substan-
tial in 2015 [20]. Most of the new peers are small ASes at the edge of
the Internet’s topology, which provide less protection against route
leaks (e.g., stub networks transit traffic for no other AS). We find
similar small resilience changes for Amazon and IBM (omitted).
9 CLOUD PROVIDER POP DEPLOYMENTS
CHARACTERISTICS
The cloud providers have built large, private networks to help
achieve their extensive interconnectivity and reachability. We now
shift to examining their networks’ characteristics in terms of PoP
deployment locations and proximity to user populations. We obtain
the PoP locations by consolidating publicly available datasets (§4.2).
During the past ten years, the major cloud providers shifted
investments towards delivering their own content rather than rely-
ing on the public Internet and large transit providers for that task.
One of our goals is to analyze characteristics of the cloud provider
networks in comparison to each other and those of the Tier-1 and
Tier-2 ISPs, since the cloud providers claim their WANs provide
premium performance compared to transit networks [4, 44, 69].
The Tier-1 ISPs depend on each other to provide global reachability,
but some are regionally focused, as are some Tier-2 ISPs, so we
examine the networks both collectively as well as individually.
Geographic deployment. Figure 11 depicts the PoP deployment
locations of the cloud and transit providers. The figure shows a
500 km radius around the PoP locations of the cloud providers
(purple circles), transit providers (green circles), or both (blue cir-
cles). The PoPs are plotted over the world’s per km population
density [34]. We can see that the cloud providers have a similar
deployment strategy to the Tier-1 ISPs, but have primarily deployed
around large population centers and are highly concentrated in
North America, Europe, and Asia. The cloud providers’ PoPs are a
Cloud providers only
Transit providers only
Cloud and transit providers
No Data
0
1
5
25
100
250
1,000
5,000
10,000
>10,000
Figure 11: PoP deployment locations, with a 500km radius, overlayed
on population density per km [34], for the cloud providers (purple
circle), transit providers (green circles), or both (blue circles). Both
cohorts focus their deployment strategies near high population den-
sity centers, with the transit providers having more unique locations
than the cloud providers.
subset of the transit providers, except two locations, Shanghai and
Beijing, where the cloud providers are present but transit providers
are not. The Tier-1 and Tier-2 ISPs have over a dozen locations
where the cloud providers are not present, and have a larger de-
ployment presence in South America, Africa, and the Middle East.
Proximity to user populations. We also examine the percentage
of population that falls within a 500, 700, and 1000 km radius of each
PoP since large cloud and content providers use those distances as
benchmarks for directing users to a close PoP [21, 88]. We can see
the difference in population coverage per distance in Fig. 12 per con-
tinent grouped by type (Fig. 12a) and per provider (Fig. 12b). Collec-
tively the cloud providers are slightly behind for population cover-
age worldwide, with a difference of 4.49% at 500km, 4.26% at 700km
and 5.45% at 1000km (Fig. 12a), but the higher number of PoPs does
not gain much for the transit providers in terms of population cover-
age. The cloud providers have dense coverage in Europe and North
America, and similar coverage to transit providers in Oceania and
Asia despite the areas’ geographic challenges, which include the

Cloud Provider Connectivity in the Flat Internet IMC ’20, October 27–29, 2020, Virtual Event, USA0 20 40 60 80 100
TelxiusZayo
VodafoneAT&TTelia
TelstraOrange
GTTIBMNTTTISHE
PCCWTata
AmazonGoogleSprint
Microsoft
Cloud ProviderPopulation Coverage500km PoP radius700km PoP radius1000km PoP radiusTransit ProviderPopulation Coverage500km PoP radius700km PoP radius1000km PoP radius
0 20 40 60 80 100Population coverage (%)
World
SouthAmerica
NorthAmerica
Europe
Africa
Asia
OceanaCloud ProviderPopulation Coverage500km PoP radius700km PoP radius1000km PoP radiusTransit ProviderPopulation Coverage500km PoP radius700km PoP radius1000km PoP radius
(a)
0 20 40 60 80 100Population coverage (%)
TelxiusZayo
VodafoneAT&TTelia
TelstraOrange
GTTIBMNTTTISHE
PCCWTata
AmazonGoogleSprint
Microsoft
Cloud ProviderPopulation Coverage500km PoP radius700km PoP radius1000km PoP radiusTransit ProviderPopulation Coverage500km PoP radius700km PoP radius1000km PoP radius
0 20 40 60 80 100Population coverage (%)
Africa
Asia
Oceana
NorthAmerica
Europe
SouthAmerica
World
Cloud ProviderPopulation Coverage500km PoP radius700km PoP radius1000km PoP radiusTransit ProviderPopulation Coverage500km PoP radius700km PoP radius1000km PoP radius
(b)
Figure 12: Percent of population within 500/700/1000 km of PoPs
per provider type per continent (Fig. 12a) and per provider (Fig. 12b).
relatively large distances between locations and the requirement
to run undersea cables [28, 95]. Individual cloud providers cover
larger populations than individual transit providers (Fig. 12b), with
Amazon, Google, and Microsoft covering a higher percentage of
population than other networks besides Sprint.
10 RELATEDWORK
Other work identified flattening [29, 39] and the growing role of
hypergiants, networks that host, generate, and/or distribute most
Internet content [57]. One effort identified hypergiants using infor-
mation contained in PeeringDB [12]. Another looked at whether the
hypergiants should be considered part of the Internet’s core [22, 23].
We focus on major cloud providers to evaluate their connectivity
and how they reach other networks. We show the cloud providers
have higher reachability than all but a handful of networks.
Past studies analyzed flattening and cloud providers [7, 8, 26, 113].
One recent study examined the interconnections of Amazon, espe-
cially across VPI at cloud exchanges to identify their peering infras-
tructure [118]. Our initial methodology (§4) for identifying peer
networks was virtually identical to these past studies. We then re-
fined our methods based on validation from the cloud providers (§5),
and we use our measurements of connectivity to explore the im-
pacts of the discovered neighbors by incorporating them into the
AS-level topology graph to show how the cloud providers’ intercon-
nectivity enables them to reach a significant portion of the Internet,
even when bypassing Tier-1 and Tier-2 ISPs.
Web hosting has consolidated onto a handful of hosting providers
(e.g., Google, Amazon, and Cloudflare to name a few). Only 17.5%
of the most popular IPv4 and 8.3% of IPv6 sites are hosted on the
sites’ own address space (e.g., YouTube on Google) [49]. Prior work
shows the extent of web hosting consolidation [49], and the cloud
providers are amongst the largest infrastructures supporting con-
solidation. We do not look at the amount of consolidation, but our
work shows how the sites hosted on the cloud providers’ infrastruc-
tures benefit from the cloud providers’ interconnectivity to bypass
the hierarchical Internet.
The state of the art for annotating AS peering relationships
is ProbLink [53], which seeks to improve the accuracy of AS-
Rank [64]. We do not seek to improve or modify these algorithms,
but use their datasets to construct our AS-level Internet topology,
and combine the clique discovered by the two algorithms in order
to identify the prevalent transit providers to bypass in our analyses
using the AS-Level topology.
AS-Rank and other works seek to create metrics that identify the
level of influence and importance of various networks based on dif-
ferent attributes. Customer cone and transit degree from AS-Rank
measure importance based on how much transit a network pro-
vides, while node degree only looks at the raw number of neighbors
for a given network, not the impact of those neighbors [64]. Other
work investigated which ASes demonstrate high “inbetweenness”
on the Internet [33]. However, the study did not enforce realism
(e.g., valley-free routing); enforcing best practice routing policieshelps ensure that the emulated paths reflect paths traffic is likely
to actually take [5].
11 CONCLUSIONS AND FUTUREWORK
Hierarchy-free reachability presents a method to quantify the im-
pact and extent of Internet flattening by examining the potential of
networks to bypass the Tier-1 and Tier-2 ISPs. Even though tran-
sit services still provide critical redundancy to cloud and content
providers, the four major cloud providers can reach a significant
portion of the Internet without relying on the Tier-1 and Tier-2 ISPs.
At the time of our measurements, their potential to do so is greater
than all but a handful of networks. The potential to bypass the
Tier-1 and Tier-2 ISPs decreases transit providers’ relevance and
affects the flow of traffic on the Internet. Additionally, hierarchy-
free reachability shows there are thousands of networks which are
also able to reach a sizable portion of the Internet without travers-
ing the Tier-1 and Tier-2 ISPs, an insight that is not captured in
other metrics which seek to measure networks’ importance to the
Internet. As the structure and interactions of ASes on the Internet
shifts, we should continue to assess and re-evaluate the metrics we
use to determine the influence of individual ASes. We must also
continue to refine and validate our tools and methodologies for
mapping the Internet and its interconnections. Continued research
into networks that benefit from flattening and consolidation can
improve our understanding of impacts on users and the Internet.
Acknowledgements.We appreciate the valuable feedback from
our shepherd Walter Willinger and the IMC reviewers. We would

IMC ’20, October 27–29, 2020, Virtual Event, USA T. Arnold et al.
especially like to thank Ricky Mok and Brandon Schlinker for pro-
viding access to traceroute datasets. This work was partly funded
by NSF awards CNS-1740883, CNS-1413978, and CNS-1836872.
REFERENCES
[1] Level 3. [n.d.]. Network Map. http://www.centurylink-business.com/demos/
network-maps.html.
[2] APNIC. [n.d.]. Visible ASNs: Customer Populations (Est.). https://stats.labs.
apnic.net/aspop/.
[3] Bernhard Ager, Nikolaos Chatzis, Anja Feldmann, Nadi Sarrar, Steve Uhlig,
and Walter Willinger. 2012. Anatomy of a Large European IXP. In Proc. of theConference of the ACM Special Interest Group on Data Communication (SIGCOMM’12).
[4] Amazon Web Services. [n.d.]. Introducing AWS Global Accelera-
tor. https://aws.amazon.com/about-aws/whats-new/2018/11/introducing-
aws-global-accelerator/.
[5] Ruwaifa Anwar, Haseeb Niaz, David Choffnes, Ìtalo Cunha, Phillipa Gill, and
Ethan Katz-Bassett. 2015. Investigating Interdomain Routing Policies in the
Wild. In Proc. of the ACM Internet Measurement Conference (IMC ’15).[6] APNIC. [n.d.]. Visible ASNs: Customer Populations (Est.). https://web.archive.
org/web/20150821035757/http://stats.labs.apnic.net/aspop/.
[7] Todd Arnold, Matt Calder, Italo Cunha, Arpit Gupta, Harsha V Madhyastha,
Michael Schapira, and Ethan Katz-Bassett. 2019. Beating BGP is Harder than we
Thought. In Proc. of the ACM Workshop on Hot Topics in Networks (HotNets ’19).[8] Todd Arnold, Ege Gürmeriçliler, Georgia Essig, Arpit Gupta, Matt Calder,
Vasileios Giotsas, and Ethan Katz-Bassett. 2020. (How Much) Does a Private
WAN Improve Cloud Performance?. In IEEE Conference on Computer Communi-cations (INFOCOM ’20).
[9] AT&T. [n.d.]. Network Map. https://www.att.com/Common/attrev1/
att_global_network_final.pdf.
[10] AWS. [n.d.]. AWS Direct Connect. https://aws.amazon.com/directconnect/.
[11] Timm Böttger, Felix Cuadrado, Gareth Tyson, Ignacio Castro, and Steve Uhlig.
2018. Open Connect Everywhere: A Glimpse at the Internet Ecosystem through
the Lens of the Netflix CDN. In SIGCOMM Comput. Commun. Rev. (CCR).[12] Timm Böttger, Felix Cuadrado, and Steve Uhlig. 2018. Looking for Hypergiants
in PeeringDB. In SIGCOMM Comput. Commun. Rev. (CCR).[13] Doug Brake. 2019. Submarine Cables: Critical Infrastructure for Global Com-
munications. http://www2.itif.org/2019-submarine-cables.pdf.
[14] CAIDA. [n.d.]. CAIDA Serial-1, Sep 2015 Dataset. http://data.caida.org/datasets/
as-relationships/serial-1/20150901.as-rel.txt.bz2.
[15] CAIDA. [n.d.]. CAIDA Serial-2 Dataset. http://data.caida.org/datasets/as-
relationships/serial-2/.
[16] CAIDA. [n.d.]. Inferred AS to Organizations Mapping Dataset.
[17] CAIDA. [n.d.]. Archipelago Monitor Locations. https://www.caida.org/projects/
ark/locations/.
[18] CAIDA. [n.d.]. MIDAR tool. https://www.caida.org/tools/measurement/midar/.
[19] CAIDA. [n.d.]. Routeviews Prefix to AS mappings Dataset for IPv4 and IPv6.
https://www.caida.org/data/routing/routeviews-prefix2as.xml.
[20] Matt Calder, Xun Fan, Zi Hu, Ethan Katz-Bassett, John Heidemann, and Ramesh
Govindan. 2013. Mapping the Expansion of Google’s Serving Infrastructure. In
Proc. of the ACM Internet Measurement Conference (IMC ’13).[21] Calder, Matt and Flavel, Ashley and Katz-Bassett, Ethan and Mahajan, Ratul
and Padhye, Jitendra. 2015. Analyzing the Performance of an Anycast CDN. In
Proc. of the ACM Internet Measurement Conference (IMC ’15).[22] E. Carisimo, C. Selmo, J. Alvarez-Hamelin, and A. Dhamdhere. 2019. Studying
the Evolution of Content Providers in IPv4 and IPv6 Internet Cores. ComputerComm. (Sep 2019).
[23] EstebanCarisimo, Carlos Selmo, J. Ignacio Alvarez-Hamelin, andAmoghDhamd-
here. 2018. Studying the Evolution of Content Providers in the Internet Core. In
Proc. of the Network Traffic Measurement and Analysis Conference (TMA) (TMA’18).
[24] Nikolaos Chatzis, Georgios Smaragdakis, Anja Feldmann, and Walter Willinger.
2015. Quo Vadis Open-IX? SIGCOMM Comput. Commun. Rev. (Jan. 2015).[25] Kai Chen, David R. Choffnes, Rahul Potharaju, Yan Chen, Fabian E. Bustamante,
Dan Pei, and Yao Zhao. 2009. Where the Sidewalk Ends: Extending the Inter-
net AS Graph Using Traceroutes from P2P Users. In Proc. of the InternationalConference on Emerging Networking Experiments And Technologies (CoNEXT’09).
[26] Yi-Ching Chiu, Brandon Schlinker, Abhishek Balaji Radhakrishnan, Ethan Katz-
Bassett, and Ramesh Govindan. 2015. Are We One Hop Away from a Better
Internet?. In Proc. of the ACM Internet Measurement Conference (IMC ’15).[27] Google Cloud. [n.d.]. Cloud Interconnect. https://cloud.google.com/
interconnect/docs.
[28] Tyler Cooper. 2019. Google and Other Tech Giants are Quietly Buying up the
Most Important Part of the Internet. https://venturebeat.com/2019/04/06/google-
and-other-tech-giants-are-quietly-buying-up-the-most-important-part-of-
the-internet/.
[29] Amogh Dhamdhere and Constantine Dovrolis. 2010. The Internet is Flat: Mod-
eling the Transition from a Transit Hierarchy to a Peering Mesh. In Proc. of theInternational Conference on Emerging Networking Experiments And Technologies(CoNEXT ’10).
[30] Ramakrishnan Durairajan, Subhadip Ghosh, Xin Tang, Paul Barford, and Brian
Eriksson. 2013. Internet Atlas: A Geographic Database of the Internet. In Proc.of the 5th ACM Workshop on HotPlanet (HotPlanet ’13).
[31] Hurricane Electric. [n.d.]. Network Map. https://he.net/about_network.html.
[32] Damien Fay, Hamed Haddadi, Andrew Thomason, Andrew W. Moore, Richard
Mortier, Almerima Jamakovic, Steve Uhlig, and Miguel Rio. 2010. Weighted
Spectral Distribution for Internet Topology Analysis: Theory and Applications.
IEEE/ACM Transactions on Networking (ToN) (2010).[33] Romain Fontugne, Anant Shah, and Emile Aben. 2018. The (Thin) Bridges of
AS Connectivity: Measuring Dependency Using AS Hegemony. In Proc. of theInternational Conference on Passive and Active Network Measurement (PAM ’18).
[34] Center for International Earth Science Information Network CIESIN
Columbia University. 2018. Gridded Population of the World, Version 4
(GPWv4): Population Density, Revision 11. Accessed 22 Feb 2020. (2018).
https://doi.org/10.7927/H49C6VHW.
[35] Natalie Gagliordi. 2017. AWS Infrastructure is NowBehind threeMain Streaming
Media Providers. https://www.zdnet.com/article/aws-infrastructure-is-now-
behind-three-main-streaming-media-providers/.
[36] Lixin Gao. 2001. On inferring autonomous system relationships in the Internet.
IEEE/ACM Transactions on Networking (ToN).[37] Lixin Gao and Jennifer Rexford. 2001. Stable Internet Routing without Global
Coordination. IEEE/ACM Transactions on Networking (ToN) (2001).[38] Manaf Gharaibeh, Anant Shah, Bradley Huffaker, Han Zhang, Roya Ensafi, and
Christos Papadopoulos. 2017. A Look at Router Geolocation in Public and
Commercial Databases. In Proc. of the ACM Internet Measurement Conference(IMC ’17).
[39] Phillipa Gill, Martin Arlitt, Zongpeng Li, and Anirban Mahanti. 2008. The Flat-
tening Internet Topology: Natural Evolution, Unsightly Barnacles or Contrived
Collapse?. In Proc. of International Conference on Passive and Active NetworkMeasurement (PAM ’08).
[40] Phillipa Gill, Michael Schapira, and Sharon Goldberg. 2012. Modeling on Quick-
sand: Dealing with the Scarcity of Ground Truth in Interdomain Routing Data.
SIGCOMM Comput. Commun. Rev. 42, 1 (2012).[41] Vasileios Giotsas, Matthew Luckie, Bradley Huffaker, and kc claffy. 2014. In-
ferring Complex AS Relationships. In Proc. of the ACM Internet MeasurementConference (IMC ’14).
[42] Brian Goodchild, Yi-Ching Chiu, Rob Hansen, Haonan Lu, Matt Calder, Matthew
Luckie, Wyatt Lloyd, David Choffnes, and Ethan Katz-Bassett. 2017. The Record
Route Option is an Option! . In Proc. of the ACM Internet Measurement Conference(IMC ’17).
[43] Dan Goodin. 2017. “Suspicious” event routes traffic for big-name sites through
Russia. https://arstechnica.com/information-technology/2017/12/suspicious-
event-routes-traffic-for-big-name-sites-through-russia/.
[44] Google. [n.d.]. Google Network Service Tiers. https://cloud.google.com/
network-tiers/.
[45] Google. [n.d.]. Virtual Private Cloud (VPC) Documentation: Traceroute to
external IP addresses. https://cloud.google.com/vpc/docs/vpc#traceroute.
[46] Google. 2019. Google Edge Network: Peering. https://peering.google.com/#/
options/peering.
[47] GTT. [n.d.]. Looking Glass. http://www.as3257.net/lg/.
[48] GTT. [n.d.]. Network Map. https://www.gtt.net/us-en/our-network/.
[49] Nguyen Phong Hoang, Arian Akhavan Niaki, Michalis Polychronakis, and
Phillipa Gill. 2020. The Web is Still Small after More than a Decade. SIGCOMMComput. Commun. Rev. (CCR) (April 2020).
[50] Hurricane Electric. [n.d.]. Looking Glass. http://lg.he.net.
[51] IBM. [n.d.]. Looking Glass. http://lg.softlayer.com.
[52] Jianhong Xia and Lixin Gao. 2004. On the evaluation of AS relationship infer-
ences [Internet reachability/traffic flow applications]. In IEEE Global Telecom-munications Conference (GLOBECOM ’04).
[53] Yuchen Jin, Colin Scott, Amogh Dhamdhere, Vasileios Giotsas, Arvind Krishna-
murthy, and Scott Shenker. 2019. Stable and Practical AS Relationship Inference
with ProbLink. In 16th USENIX Symposium on Networked Systems Design andImplementation (NSDI 19).
[54] Ken Keys, Young Hyun, Matthew Luckie, and Kim Claffy. 2013. Internet-Scale
IPv4 Alias Resolution with MIDAR. IEEE/ACM Transactions on Networking (ToN)(2013).
[55] Simon Knight, Hung X. Nguyen, Nickolas Falkner, Rhys Bowden, and Matthew
Roughan. 2011. The Internet Topology Zoo. IEEE Journal on Selected Areas inCommunications (2011).
[56] John Koetsier. 2019. Report: Apple Is One Of Amazon’s Biggest Customers,
Spending Over $350 Million Per Year. https://www.forbes.com/sites/
johnkoetsier/2019/04/22/report-apple-is-one-of-amazons-biggest-customers-
spending-over-350m-per-year/#2a05048d11c4.
https://www.zdnet.com/article/aws-infrastructure-is-now-behind-three-main-streaming-media-providers/
https://www.zdnet.com/article/aws-infrastructure-is-now-behind-three-main-streaming-media-providers/
https://www.zdnet.com/article/aws-infrastructure-is-now-behind-three-main-streaming-media-providers/

Cloud Provider Connectivity in the Flat Internet IMC ’20, October 27–29, 2020, Virtual Event, USA
[57] Craig Labovitz, Scott Iekel-Johnson, Danny McPherson, Jon Oberheide, and
Farnam Jahanian. 2010. Internet Inter-domain Traffic. In Proc. of the ACM SpecialInterest Group on Data Communication (SIGCOMM ’10).
[58] Level 3. [n.d.]. Looking Glass. https://lookingglass.centurylink.com/.
[59] Aemen Lodhi, Natalie Larson, Amogh Dhamdhere, Constantine Dovrolis, and kc
claffy. 2014. Using PeeringDB to Understand the Peering Ecosystem. SIGCOMMComput. Commun. Rev. (2014).
[60] Matthew Luckie. [n.d.]. Scamper. https://www.caida.org/tools/measurement/
scamper/.
[61] Matthew Luckie. [n.d.]. sc_hoiho. https://www.caida.org/tools/measurement/
scamper/.
[62] Matthew Luckie, Amogh Dhamdhere, Bradley Huffaker, David Clark, and kc
claffy. 2016. bdrmap: Inference of Borders Between IP Networks. In Proc. of theACM Internet Measurement Conference (IMC ’16).
[63] Matthew Luckie, Bradley Huffaker, and k claffy. 2019. Learning Regexes to
Extract Router Names from Hostnames. In Proc. of the Internet MeasurementConference (IMC ’19).
[64] Matthew Luckie, Brian Huffaker, Amogh Dhamdhere, Vasileios Giotsas, and kc
claffy. 2013. AS Relationships, Customer Cones, and Validation. In Proc. of theACM Internet Measurement Conference (IMC ’13).
[65] Pietro Marchetta, Antonio Montieri, Valerio Persico, Antonio Pescapé, Ítalo
Cunha, and Ethan Katz-Bassett. 2016. How and how much traceroute confuses
our understanding of network paths. In 2016 IEEE International Symposium onLocal and Metropolitan Area Networks (LANMAN ’16).
[66] Microsoft. [n.d.]. Azure ExpressRoute. https://azure.microsoft.com/en-us/
services/expressroute/.
[67] Microsoft. [n.d.]. What is Azure ExpressRoute. https://docs.microsoft.com/en-
us/azure/expressroute/expressroute-introduction.
[68] Microsoft. [n.d.]. Set up peering with Microsoft. https://docs.microsoft.com/en-
us/azure/internet-peering/overview.
[69] Microsoft. [n.d.]. What is routing preference (preview)? https://docs.microsoft.
com/en-us/azure/virtual-network/routing-preference-overview.
[70] Alexandros Milolidakis, Romain Fontugne, and Xenofontas Dimitropoulos. 2019.
Detecting Network Disruptions At Colocation Facilities. In IEEE Conference onComputer Communications (INFOCOM ’19).
[71] Reza Motamedi, Bahador Yeganeh, Balakrishnan Chandrasekaran, Reza Rejaie,
Bruce M. Maggs, and Walt Willinger. 2019. On Mapping the Interconnections
in Today’s Internet. IEEE/ACM Transactions on Networking (ToN) (2019).[72] RIPE NCC. 2020. Youtube Hijacking: A RIPE NCC RIS case study.
[73] Jordan Novet. 2019. Apple spends more than $30 million on Ama-
zon’s cloud every month, making it one of the biggest AWS cus-
tomers. https://www.cnbc.com/2019/04/22/apple-spends-more-than-30-
million-on-amazon-web-services-a-month.html.
[74] NTT. [n.d.]. Looking Glass. https://www.gin.ntt.net/looking-glass/.
[75] NTT. [n.d.]. Network Map. https://www.us.ntt.net/about/ipmap.cfm.
[76] NTT. 2016. Deployment of NTT “Peer Locking” route leak prevention mecha-
nism. http://instituut.net/~job/peerlock_manual.pdf.
[77] Ricardo Oliveira, Dan Pei, Walter Willinger, Beichuan Zhang, and Lixia Zhang.
2010. The (in)Completeness of the Observed Internet AS-Level Structure. ToN(Feb. 2010).
[78] Orange. [n.d.]. Looking Glass. https://looking-glass.opentransit.net/.
[79] Orange. [n.d.]. Network Map. https://www.orange-business.com/en/
connectivity.
[80] PCCW. [n.d.]. Network Map. https://www.pccwglobal.com/company/about-
us/global-reach/.
[81] PeeringDB. [n.d.]. https://peeringdb.com.
[82] PeeringDB. [n.d.]. Neutral IX. https://www.peeringdb.com/ix/64.
[83] Prajakta Joshi. [n.d.]. Introducing Network Service Tiers: Your Cloud Net-
work, Your Way. https://cloudplatform.googleblog.com/2017/08/introducing-
Network-Service-Tiers-your-cloud-network-your-way.html.
[84] Qrator Radar. 2020. This is how you deal with route leaks. https://blog.qrator.
net/en/how-you-deal-route-leaks_69/.
[85] Waleed Reda, Kirill L. Bogdanov, Alexandros Milolidakis, Marco Chiesa, Gerald
Q. Maguire Jr., and Dejan Kostić. 2018. Path Persistence in the Cloud: A Study
on the Effects of Recent Traffic Engineering Trends In Cloud Provider Networks.
In SIGCOMM Comput. Commun. Rev. (CCR).[86] RIPE NCC. [n.d.]. RIPE IPmap. https://ipmap.ripe.net/.
[87] Sandvine. 2019. Sandvine Global Internet Phenomena Report: September 2019.
[88] Brandon Schlinker, Ítalo Cunha, Yi-Ching Chiu, Srikanth Sundaresan, and Ethan
Katz-Bassett. 2019. Internet Performance from Facebook’s Edge. In Proc. of theACM Internet Measurement Conference (IMC ’19).
[89] Brandon Schlinker, Hyojeong Kim, Timothy Cui, Ethan Katz-Bassett, Harsha V
Madhyastha, Italo Cunha, James Quinn, Saif Hasan, Petr Lapukhov, and Hongyi
Zeng. 2017. Engineering Egress with Edge Fabric: Steering Oceans of Content
to the World. In Proc. of the ACM Special Interest Group on Data Communication(SIGCOMM ’17).
[90] Ben Treynor Sloss. 2018. Expanding Our Global Infrastructure With New
Regions and Subsea Cables. https://blog.google/topics/google-cloud/expanding-
our-global-infrastructure-new-regions-and-subsea-cables/.
[91] The Internet Society. 2019. Consolidation in the Internet Economy How will
consolidation impact the Internet’s technical evolution and use? https://future.
internetsociety.org/2019/.
[92] Telecom Italia Sparkle. [n.d.]. Network Map. https://www.tisparkle.com/our-
assets/global-backbone.
[93] Sprint. [n.d.]. Looking Glass. https://www.sprint.net/lg/.
[94] Sprint. [n.d.]. Network Map. https://www.sprint.net/network_maps.php.
[95] Adam Stariano. 2019. How the Internet Travels Across Oceans. https://www.
nytimes.com/interactive/2019/03/10/technology/internet-cables-oceans.html.
[96] Tom Strickx. 2019. How Verizon and a BGP Optimizer Knocked Large Parts of
the Internet Offline Today. https://blog.cloudflare.com/how-verizon-and-a-
bgp-optimizer-knocked-large-parts-of-the-internet-offline-today/.
[97] Tata Communications. [n.d.]. Looking Glass. http://lg.as6453.net/bin/lg.cgi.
[98] Tata Communications. [n.d.]. Network Map. https://www.tatacommunications.
com/map/.
[99] Team Cymru. [n.d.]. IP-to-ASN Mapping. http://www.team-cymru.com/IP-
ASN-mapping.html.
[100] Telecom Italia Sparkle. [n.d.]. Looking Glass. https://gambadilegno.noc.seabone.
net/lg/.
[101] Telia. [n.d.]. Looking Glass. https://lg.telia.net/.
[102] Telia. [n.d.]. Network Map. https://www.teliacarrier.com/Our-Network/
Network-map.html.
[103] Telstra. [n.d.]. Looking Glass. https://lg.telstraglobal.com/.
[104] Telstra. [n.d.]. Network Map. https://www.telstraglobal.com/company/our-
network/network-map.
[105] Telxius. [n.d.]. Looking Glass. https://telxius.com/en/looking-glass-3/.
[106] Telxius. [n.d.]. Network Map. https://telxius.com/network/.
[107] Verizon. [n.d.]. Network Map. https://enterprise.verizon.com/why-verizon/
#network.
[108] Kevin Vermeulen, Justin P. Rohrer, Robert Beverly, Olivier Fourmaux, and Timur
Friedman. 2020. Diamond-Miner: Comprehensive Discovery of the Internet’s
Topology Diamonds. In 17th USENIX Symposium on Networked Systems Designand Implementation (NSDI ’20).
[109] Vocus. [n.d.]. Looking Glass. http://tools.vocus.com.au/lg.
[110] Vocus. [n.d.]. Network Map. https://www.vocus.co.nz/our-network.
[111] Vodafone. [n.d.]. Looking Glass. https://portal.vodafone.com/web/lookingglass.
[112] Vodafone. [n.d.]. Network Map. http://globalnetworkmap.vodafone.com/.
[113] Yangyang Wang and Keyao Zhang. 2016. Quantifying the Flattening of Inter-
net Topology. In Proc. of the 11th International Conference on Future InternetTechnologies (CFI ’16).
[114] Mark Winther. 2006. Tier 1 ISPs: What They Are and Why They Are Important.Technical Report. International Data Corporation.
[115] Florian Wohlfart, Nikolaos Chatzis, Caglar Dabanoglu, Georg Carle, and Walter
Willinger. 2018. Leveraging Interconnections for Performance: The Serving
Infrastructure of a Large CDN. In Proc. of the ACM Special Interest Group onData Communication (SIGCOMM ’18).
[116] Molly Wood. [n.d.]. We Need to Talk About ‘Cloud Neutrality’. Wired. https://
www.wired.com/story/we-need-to-talk-about-cloud-neutrality/.
[117] Kok-Kiong Yap, Murtaza Motiwala, Jeremy Rahe, Steve Padgett, Matthew Holli-
man, Gary Baldus, Marcus Hines, Taeeun Kim, Ashok Narayanan, Ankur Jain,
et al. 2017. Taking the Edge off with Espresso: Scale, Reliability and Programma-
bility for Global Internet Peering. In Proc. of the ACM Special Interest Group onData Communication (SIGCOMM) (SIGCOMM ’17).
[118] Bahador Yeganeh, Ramakrishnan Durairajan, Reza Rejaie, and Walter Willinger.
2019. How Cloud Traffic Goes Hiding: A Study of Amazon’s Peering Fabric. In
Proc. of the Internet Measurement Conference (IMC ’19).[119] Bahador Yeganeh, Ramakrishnan Durairajan, Reza Rejaie, and Walter Willinger.
2020. A First Comparative Characterization of Multi-cloud Connectivity in
Today’s Internet.
[120] YuchenJin. [n.d.]. ProbLink Code. https://github.com/YuchenJin/ProbLink.
[121] Jason Zander. 2018. Microsoft Expands Cloud Services in Europe and
into Middle East to Meet Growing Customer Demand. Microsoft.
https://blogs.microsoft.com/blog/2018/03/14/microsoft-expands-cloud-
services-in-europe-and-into-middle-east-to-meet-growing-customer-
demand/.
[122] Zayo. [n.d.]. Looking Glass. http://lg.zayo.com/lg.cgi.
[123] Zayo. [n.d.]. Network Map. https://www.zayo.com/global-network.

IMC ’20, October 27–29, 2020, Virtual Event, USA T. Arnold et al.
A SIMULATED PATHS REFLECT ACTUAL
PATHS
Our methods for quantifying reachability and reliance use simu-
lated prefix announcements based on a generated AS-level topology
graph. The topology graph was modeled from the CAIDA AS rela-
tionship dataset [15], which we augmented with additional neigh-
bors based on traceroute measurements from VMs hosted in each
of the cloud providers (§4.1). Since we are simulating the AS-level
topology and networks’ routing policies, we want to verify that our
simulated paths reflect actual paths taken by traffic.
We compared all the paths tied for best, plus alternate paths, cal-
culated by our model against the paths taken by our traceroute data
sourced from inside each cloud provider’s network while remov-
ing invalid traceroutes (§4.1). We also did not consider traceroutes
that did not reach the destination AS. Overall, our simulated paths
contained the true path for 73.3% of the traceroutes from Amazon,
91.9% from Google, 82.9% from IBM, and 85.4% from Microsoft. We
hypothesize that the reason for Amazon’s lower percentage is due
to the fact that they do not allow tenant traffic to traverse their
backbone by default, so there is more variation in the actual paths
taken from Amazon because hosted VMs are not allowed to use
directly connected neighbors at a distant PoP.
B CASE STUDY: EXAMINING TIER-1
RELIANCE ON TIER-2 NETWORKS
In §6.4, we saw that the cloud providers have low reliance on any
individual network, which is also reflected by their high hierarchy-
free reachability. Most Tier-1 and Tier-2 ISPs have high hierarchy-
free reachability, however, there were a small number of Tier-1 ISPs
that had a sizeable reduction in hierarchy-free reachability when
bypassing the Tier-2 ISPs in addition to the other Tier-1 ISPs. The
Tier-1 ISPs are supposed to be the backbone of the Internet, so we
want to examine the reliance of the hierarchy-free reachability out-
liers to understand why their reachability decreases so significantly,
and to compare the differences in their peering strategies versus
the cloud providers and other Tier-1 and Tier-2 ISPs.
Sprint (AS 1239) saw the greatest decrease, and Deutsche
Telekom (AS 3320) saw the second greatest decrease. Sprint
declined from 55,385 when bypassing the Tier-1 ISPs to 32,568
when also bypassing the Tier-2 ISPs, while Deutsche Telekom
declined from 55,990 when bypassing the Tier-1 ISPs to 33,307
when also bypassing the Tier-2 ISPs. To determine why they
see such a decline in reachability, we calculated the reachability
reliance for each to determine which of the Tier-2 ISPs had the
greatest effect on Sprint and Deutsche Telekom’s reachability.
To calculate reliance, we map the reliance based on Sprint and
Deutsche Telekom’s reachability results using Tier-1-free reachabil-
ity (bypassing the other Tier-1 ISPs, §6.3). Under closer examination,
without the other Tier-1 ISPs Sprint relies primarily on Hurricane
Electric, PCCW, Comcast, Liberty Global, Vodafone, and Telstra.
Bypassing only these six Tier-2 ISPs reduces Sprint’s reachability to
35,199, which covers almost the entire decrease in their reachability.
Deutsche Telekom has a strong reliance on several Tier-2 ISPs,
primarily: Hurricane Electric, PCCW, Comcast, Liberty Global,
Vodafone, and RETN. Bypassing these six Tier-2 ISPs reduces
Network (AS)
# Graph
PoPs
# Router/
Interface
Hostnames % rDNS
NTT (2914) 49 7166 100
Hurricane Electric (6939) 112 5613 99.1
AT&T (7018) 39 11020 92.3
Tata (6453) 94 5470 90.4
Google (15169) 56 29833 89.2
PCCW (3491) 69 948 85.5
Vodafone (1273) 31 4618 83.9
Zayo (6461) 36 2878 83.3
Sprint (1239) 95 2270 67.4
Telxius (12956) 60 628 66.7
Telia (1299) 121 10073 65.4
Microsoft (8075) 117 7195 45.32
Telecom Italia Sparkle (6762) 78 2669 39.7
Orange (5511) 30 701 26.7
Amazon (16509) 78 0 0.0%
Table 3: Percentage of PoP locations for each network that were
confirmed using rDNS. Some networks actively maintain rDNS and
PeeringDB records and have high confirmation percentages. Overall,
we were able to confirm 73% of the PoPs we identified creating our
topology graphs using rDNS, which shows a lack of information
available in rDNS.
Deutsche Telekom’s reachability to 35,743, which covers almost
the entire decrease in their reachability.
This highlights the starkly different strategies for some of the
Tier-1 and Tier-2 ISPs. Sprint and Deutsche Telekom, for example,
rely heavily on the hierarchical topology to establish interconnec-
tivity and for reachability, while others (e.g., Level 3) have diver-sified their connectivity and reduced their reliance on individual
networks. It also shows that Sprint and Deutsche Telekom’s re-
liance are closer to the purely hierarchical structure than the cloud
providers and other Tier-1 and Tier-2 ISPs.
C POP AND RDNS ENTRIES
We combined available topology maps, PeeringDB, and rDNS data
to construct a PoP level map of the cloud providers, Tier-1 ISPs,
and Tier-2 ISPs. The number of PoPs and the percentage visible in
rDNS can be seen in Table 3.
D GEOLOCATION PROCESS
Since geolocation databases are known to be inaccurate, especially
for routers [38], we geolocated traceroute IP addresses with an
approach similar to the active geolocation technique from RIPE
IPmap [86] and identical to prior work [8]:
(1) We derive candidate locations for IP address X, by deter-
mining its ASN ASNX, and finding the set of ⟨facility, city⟩locations listed for ASNX in PeeringDB [81]. If there are lo-
cation hints in rDNS, we only use candidates locations that
match it.
2Private conversation with a Microsoft operator regarding the low rDNS coverage.
The operator confirmed that the lack of rDNS coverage data was not due to incorrect
maps, but due to the lack of rDNS entries.
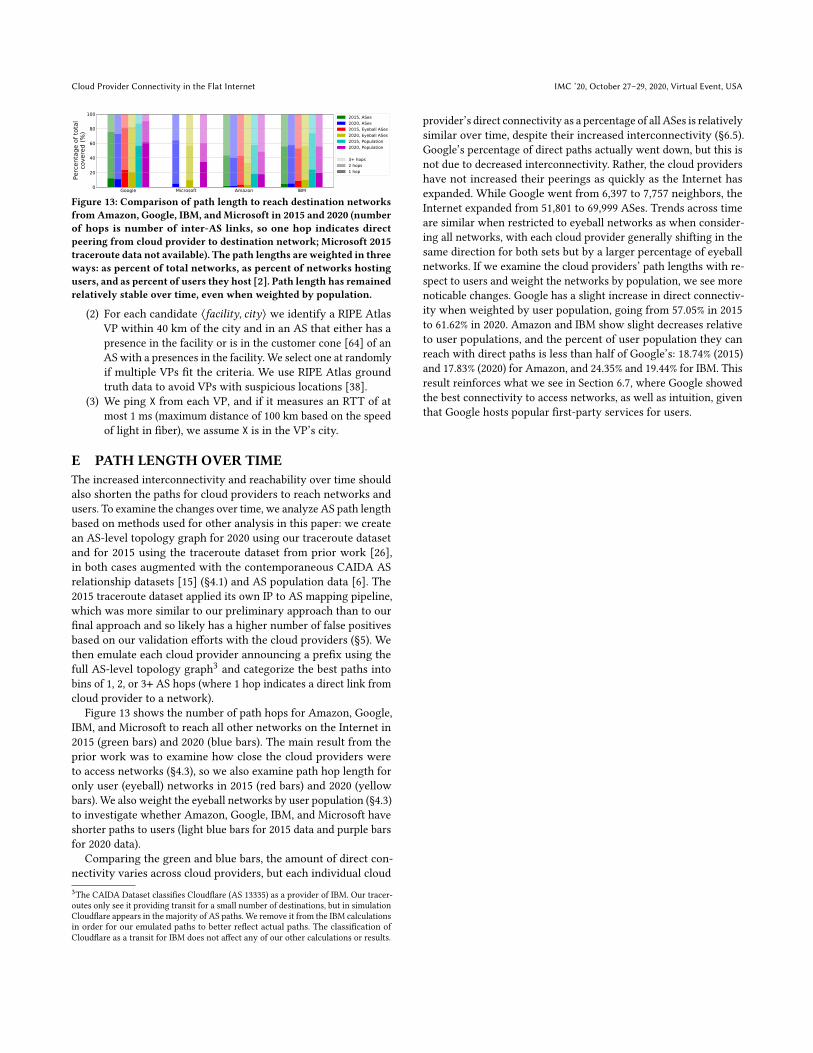
Cloud Provider Connectivity in the Flat Internet IMC ’20, October 27–29, 2020, Virtual Event, USA
Google Microsoft Amazon IBM0
20
40
60
80
100
Perc
enta
ge o
f tot
alco
vere
d (%
)
2015, ASes2020, ASes2015, Eyeball ASes2020, Eyeball ASes2015, Population2020, Population
3+ hops2 hops1 hop
Figure 13: Comparison of path length to reach destination networks
from Amazon, Google, IBM, and Microsoft in 2015 and 2020 (number
of hops is number of inter-AS links, so one hop indicates direct
peering from cloud provider to destination network; Microsoft 2015
traceroute data not available). The path lengths are weighted in three
ways: as percent of total networks, as percent of networks hosting
users, and as percent of users they host [2]. Path length has remained
relatively stable over time, even when weighted by population.
(2) For each candidate ⟨facility, city⟩ we identify a RIPE Atlas
VP within 40 km of the city and in an AS that either has a
presence in the facility or is in the customer cone [64] of an
AS with a presences in the facility. We select one at randomly
if multiple VPs fit the criteria. We use RIPE Atlas ground
truth data to avoid VPs with suspicious locations [38].
(3) We ping X from each VP, and if it measures an RTT of at
most 1 ms (maximum distance of 100 km based on the speed
of light in fiber), we assume X is in the VP’s city.
E PATH LENGTH OVER TIME
The increased interconnectivity and reachability over time should
also shorten the paths for cloud providers to reach networks and
users. To examine the changes over time, we analyze AS path length
based on methods used for other analysis in this paper: we create
an AS-level topology graph for 2020 using our traceroute dataset
and for 2015 using the traceroute dataset from prior work [26],
in both cases augmented with the contemporaneous CAIDA AS
relationship datasets [15] (§4.1) and AS population data [6]. The
2015 traceroute dataset applied its own IP to AS mapping pipeline,
which was more similar to our preliminary approach than to our
final approach and so likely has a higher number of false positives
based on our validation efforts with the cloud providers (§5). We
then emulate each cloud provider announcing a prefix using the
full AS-level topology graph3and categorize the best paths into
bins of 1, 2, or 3+ AS hops (where 1 hop indicates a direct link from
cloud provider to a network).
Figure 13 shows the number of path hops for Amazon, Google,
IBM, and Microsoft to reach all other networks on the Internet in
2015 (green bars) and 2020 (blue bars). The main result from the
prior work was to examine how close the cloud providers were
to access networks (§4.3), so we also examine path hop length for
only user (eyeball) networks in 2015 (red bars) and 2020 (yellow
bars). We also weight the eyeball networks by user population (§4.3)
to investigate whether Amazon, Google, IBM, and Microsoft have
shorter paths to users (light blue bars for 2015 data and purple bars
for 2020 data).
Comparing the green and blue bars, the amount of direct con-
nectivity varies across cloud providers, but each individual cloud
3The CAIDA Dataset classifies Cloudflare (AS 13335) as a provider of IBM. Our tracer-
outes only see it providing transit for a small number of destinations, but in simulation
Cloudflare appears in the majority of AS paths. We remove it from the IBM calculations
in order for our emulated paths to better reflect actual paths. The classification of
Cloudflare as a transit for IBM does not affect any of our other calculations or results.
provider’s direct connectivity as a percentage of all ASes is relatively
similar over time, despite their increased interconnectivity (§6.5).
Google’s percentage of direct paths actually went down, but this is
not due to decreased interconnectivity. Rather, the cloud providers
have not increased their peerings as quickly as the Internet has
expanded. While Google went from 6,397 to 7,757 neighbors, the
Internet expanded from 51,801 to 69,999 ASes. Trends across time
are similar when restricted to eyeball networks as when consider-
ing all networks, with each cloud provider generally shifting in the
same direction for both sets but by a larger percentage of eyeball
networks. If we examine the cloud providers’ path lengths with re-
spect to users and weight the networks by population, we see more
noticable changes. Google has a slight increase in direct connectiv-
ity when weighted by user population, going from 57.05% in 2015
to 61.62% in 2020. Amazon and IBM show slight decreases relative
to user populations, and the percent of user population they can
reach with direct paths is less than half of Google’s: 18.74% (2015)
and 17.83% (2020) for Amazon, and 24.35% and 19.44% for IBM. This
result reinforces what we see in Section 6.7, where Google showed
the best connectivity to access networks, as well as intuition, given
that Google hosts popular first-party services for users.