Cloud Infrastructure Services - Tech Data Cloud · Source: Canalys estimates, Cloud Analysis,...
15
Cloud infrastructure services Market overview Q 3 2018
Transcript of Cloud Infrastructure Services - Tech Data Cloud · Source: Canalys estimates, Cloud Analysis,...

Cloud infrastructure services
Market overview Q3 2018
Cloud migration still growing strongly
43.4%
47.0% 47.2% 47.1%
45.5%
40%
42%
44%
46%
48%
50%
Q32017
Q42017
Q12017
Q22018
Q32018
Growth trend
North America39.8%
EMEA39.1%
Asia Pacific77.0%
Latin America22.0%
Growth by region Leading providers
Worldwide cloud infrastructure services market summary
US$20.8 billion 45.5%Q3 2018
Rank Q3 2018 share Growth
#1 32.0%
#2 17.0%
#3 8.4%
Source: Canalys estimates, Cloud Analysis, November 2018
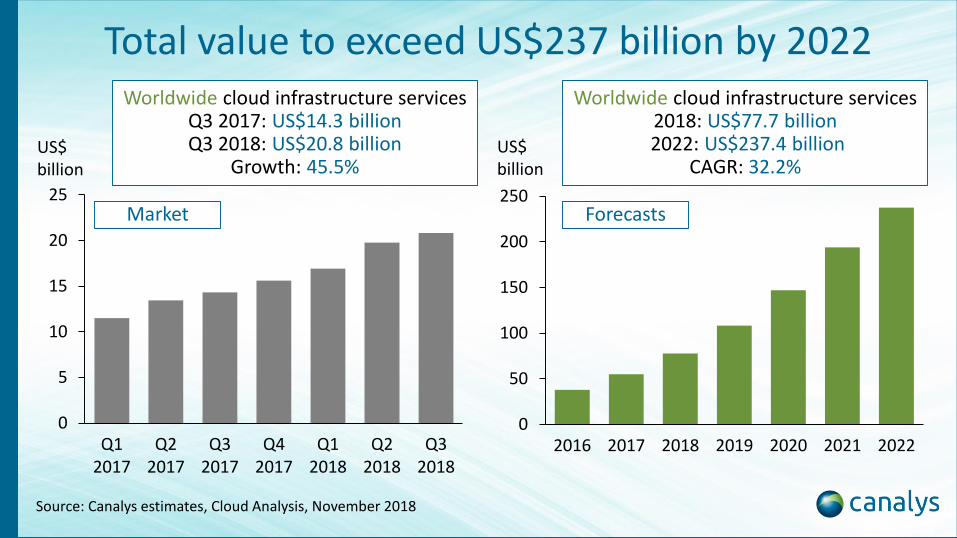
Total value to exceed US$237 billion by 2022
US$ billion
Source: Canalys estimates, Cloud Analysis, November 2018
Worldwide cloud infrastructure services2018: US$77.7 billion2022: US$237.4 billion
CAGR: 32.2%
0
5
10
15
20
25
Q12017
Q22017
Q32017
Q42017
Q12018
Q22018
Q32018
US$ billion
Worldwide cloud infrastructure servicesQ3 2017: US$14.3 billionQ3 2018: US$20.8 billion
Growth: 45.5%
ForecastsMarket
0
50
100
150
200
250
2016 2017 2018 2019 2020 2021 2022

Top three strengthen their dominanceWorldwide cloud infrastructure services – leading providers
Leading providersMarket share
Q3 2017Market share
Q3 2018Year-on-year
revenue growthAmazon AWS 32.0% 32.0% 45.3%
Microsoft Azure 14.0% 17.0% 76.3%Google Cloud 6.1% 8.4% 101.5%Alibaba Cloud 3.1% 4.0% 87.2%
IBM Cloud 5.2% 4.0% 11.4%Salesforce 3.5% 3.4% 43.8%
Oracle Cloud 2.8% 2.2% 14.9%NTT Communications 1.2% 0.9% 9.7%
Tencent Cloud 0.4% 0.8% 185.5%China Telecom 0.4% 0.5% 82.7%
Others 31.3% 26.9% 17.0%All vendors 100% 100% 45.5%
Source: Canalys estimates, Cloud Analysis, November 2018

-20%
-10%
0%
10%
20%
30%
40%
0% 20% 40% 60% 80% 100% 120% 140% 160% 180% 200%
Year-on-year growth
Quarter-on-quarter growth Cloud infrastructure service provider worldwide growth rates and size
Source: Canalys estimates, Cloud Analysis, November 2018
IBM
MicrosoftOracle
Alibaba
Salesforce
Amazon AWS
Tencent
NTT
China Telecom
Six of the top 10 from US, three from ChinaWorldwide cloud infrastructure services market Q3 2018
Competitive environment
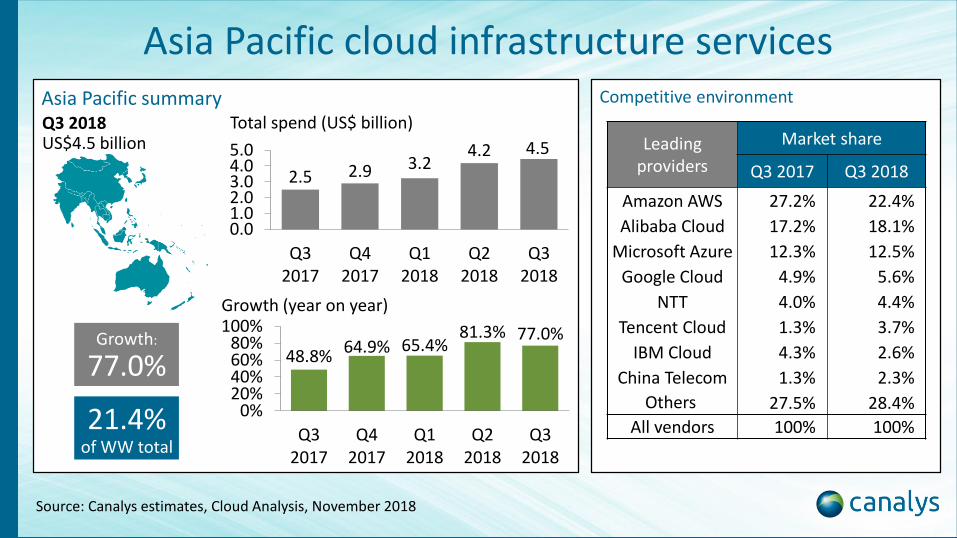
Asia Pacific cloud infrastructure services
Leadingproviders
Market share
Q3 2017 Q3 2018
Amazon AWS 27.2% 22.4%
Alibaba Cloud 17.2% 18.1%
Microsoft Azure 12.3% 12.5%
Google Cloud 4.9% 5.6%
NTT 4.0% 4.4%
Tencent Cloud 1.3% 3.7%
IBM Cloud 4.3% 2.6%
China Telecom 1.3% 2.3%
Others 27.5% 28.4%
All vendors 100% 100%
Asia Pacific summary
Growth:
77.0%
21.4%of WW total
Total spend (US$ billion)
Growth (year on year)
2.5 2.9 3.24.2 4.5
0.01.02.03.04.05.0
Q32017
Q42017
Q12018
Q22018
Q32018
Bill
ion
s
48.8%64.9% 65.4%
81.3% 77.0%
0%20%40%60%80%
100%
Q32017
Q42017
Q12018
Q22018
Q32018
Source: Canalys estimates, Cloud Analysis, November 2018
Q3 2018US$4.5 billion

Competitive environment
EMEA cloud infrastructure services
Leadingproviders
Market share
Q3 2017 Q3 2018
Amazon AWS 33.6% 35.5%
Microsoft Azure 14.8% 18.9%
Google Cloud 6.4% 9.2%
IBM Cloud 5.4% 4.3%
Oracle Cloud 3.3% 2.7%
Salesforce 2.4% 2.6%
Alibaba Cloud 0.0% 0.2%
Tencent Cloud N/A 0.1%
Others 34.1% 26.6%
All vendors 100% 100%
EMEA summary
Growth:
39.1%
22.6%of WW total
Total spend (US$ billion)
Growth (year on year)
3.4 3.6 3.94.5 4.7
0.01.02.03.04.05.0
Q32017
Q42017
Q12018
Q22018
Q32018
Bill
ion
s
41.3% 44.1% 44.1% 40.3% 39.1%
0%10%20%30%40%50%
Q32017
Q42017
Q12018
Q22018
Q32018
Source: Canalys estimates, Cloud Analysis, November 2018
Q3 2018US$4.7 billion

Competitive environment
Latin America cloud infrastructure services
Leadingproviders
Market share
Q3 2017 Q3 2018
Amazon AWS 31.1% 35.5%
Microsoft Azure 14.7% 26.6%
Google Cloud 6.3% 19.1%
IBM Cloud 5.6% 10.2%
Salesforce 2.0% 4.5%
Oracle Cloud 1.8% 1.6%
Others 38.5% 2.5%
All vendors 100% 100%
Latin America summary
Growth:
22.0%
3.3%of WW total
Total spend (US$ billion)
Growth (year on year)
0.6 0.6 0.6 0.7 0.7
0.00.20.40.60.8
Q32017
Q42017
Q12018
Q22018
Q32018
Bill
ion
s
50.0%41.3% 36.0%
24.8% 22.0%
0%
20%
40%
60%
Q32017
Q42017
Q12018
Q22018
Q32018
Source: Canalys estimates, Cloud Analysis, November 2018
Q3 2018US$0.7 billion

Competitive environment
North America cloud infrastructure services
Leadingproviders
Market share
Q3 2017 Q3 2018
Amazon AWS 32.9% 34.1%
Microsoft Azure 14.1% 17.8%
Google Cloud 6.3% 9.0%
Salesforce 4.5% 4.6%
IBM Cloud 5.3% 4.3%
Oracle Cloud 2.8% 2.3%
Alibaba Cloud 0.1% 0.1%
Others 34.0% 27.8%
All vendors 100% 100%
North America summary
Growth:
39.8%
52.8%of WW total
7.9 8.5 9.1 10.5 11.0
0.0
5.0
10.0
15.0
Q32017
Q42017
Q12018
Q22018
Q32018
Bill
ion
s
42.2% 43.3% 43.8% 40.9% 39.8%
0%
20%
40%
60%
Q32017
Q42017
Q12018
Q22018
Q32018
Total spend (US$ billion)
Growth (year on year)
Source: Canalys estimates, Cloud Analysis, November 2018
Q3 2018US$11.0 billion

Global infrastructure coverage
AWS gains momentum from enterprise segmentWorldwide summary
Growth:
45.3%Share:
32.0%Rank:
1
Q3 2018US$6.7 billion
Initiatives and announcements• Introduced a new memory
optimized instance type in EC2, aimed at large in-memory SAP HANA databases.
• Further strengthened its on-premises capabilities with the availability of its Relational Database Service on VMware platform for hybrid deployments.
• Released Aurora Serverless, which aims to automate the provision and scalability of database servers for customers.
• Announced plans to build its first cloud region in Cape Town, South Africa, consisting of three Availability Zones to support businesses in Africa.
41.9% 44.7%49.2% 48.3%45.3%
0%
20%
40%
60%
Q32017
Q42017
Q12018
Q22018
Q32018
Growth (year on year)
• Australia• China• India• Japan
• Singapore• S Korea• Hong Kong*
• France• Germany• Ireland• UK
• Bahrain*• Sweden*• S Africa*
• Brazil
• Canada• US East• US West
• GovCloud West
• GovCloud East*
Source: Canalys estimates, Security Analysis, September 2018 *Announced coverage

Global infrastructure coverage
Azure Hybrid Benefits pushes cloud migrationWorldwide summary
Growth:
76.3%Share:
17.0%Rank:
2
Q3 2018US$3.5 billion
Initiatives and announcements• Expanded its GPU-supported
services, with instance types based on Nvidia V100, P100 and P40 to push containers for deep learning and HPC adoption.
• Introduced new AI services, which automate the use of algorithms for model training, to exploit machine learning workloads.
• Announced new AZs in its North Europe and West US regions.
• Added eight new features to Azure Stream Analytics to improve its capabilities for IoT edge, data testing on Visual Studio and SQL database.
89.8%97.8%92.7% 88.6%
76.3%
0%
20%
40%
60%
80%
100%
120%
Q32017
Q42017
Q12018
Q22018
Q32018
Growth (year on year)
• Australia• China• Hong Kong• India
• Japan• Singapore• S Korea
• France• Germany• Ireland• UK
• Netherlands• Norway*• Switzerland*• S Africa*• UAE*
• Brazil
• Canada• NC US• East US• US DoD
• SC US• West US• WC US• US Gov
Source: Canalys estimates, Security Analysis, September 2018 *Announced coverage

Global infrastructure coverage
Multi-cloud adopters help drive GoogleWorldwide summary
Growth:
101.5%Share:
8.4%Rank:
3
Q3 2018US$1.7 billion
Initiatives and announcements• Introduced a container-native
load-balancing service specific for applications hosted on its Kubernetes Engine for enhanced performance and security.
• Upgraded its cloud storage portfolio, with new dual-regional and multi-regional backup options.
• Added new features to Apigee, its API management suite, to optimize users’ API operation and facilitate their access across multiple Google cloud services.
• Extended its Virtual Private Cloud to cover its Cloud SQL database service.
75.7%85.1% 89.1%
107.8% 101.5%
0%
20%
40%
60%
80%
100%
120%
Q32017
Q42017
Q12018
Q22018
Q32018
Growth (year on year)
• Australia• Hong Kong• India• Japan
• Singapore• Taiwan
• Belgium• Finland• France• Germany
• Netherlands• UK• Switzerland*
• Brazil
• Canada• US West• US East
• US Central
Source: Canalys estimates, Security Analysis, September 2018 *Announced coverage
Global infrastructure coverage
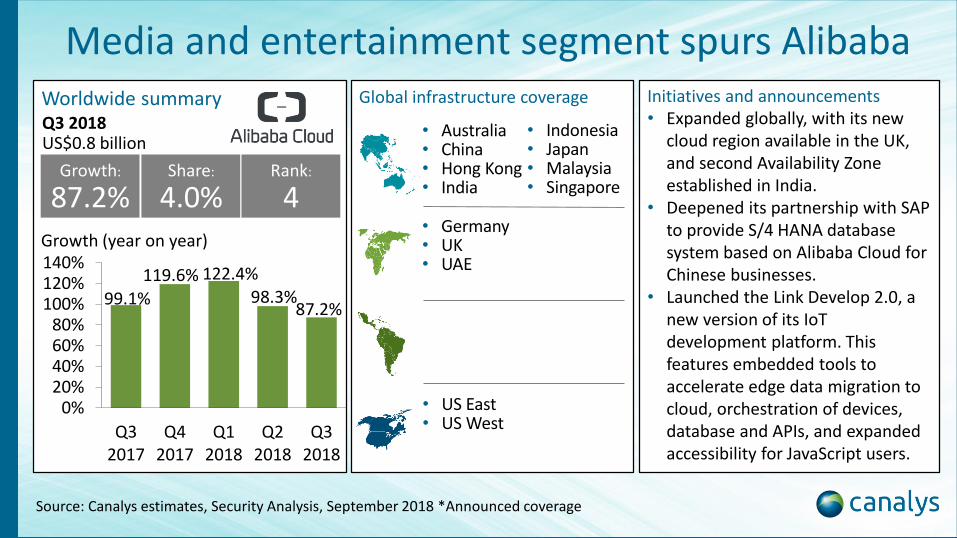
Media and entertainment segment spurs AlibabaWorldwide summary
Growth:
87.2%Share:
4.0%Rank:
4
Q3 2018US$0.8 billion
Initiatives and announcements• Expanded globally, with its new
cloud region available in the UK, and second Availability Zone established in India.
• Deepened its partnership with SAP to provide S/4 HANA database system based on Alibaba Cloud for Chinese businesses.
• Launched the Link Develop 2.0, a new version of its IoT development platform. This features embedded tools to accelerate edge data migration to cloud, orchestration of devices, database and APIs, and expanded accessibility for JavaScript users.
99.1%
119.6% 122.4%98.3%
87.2%
0%20%40%60%80%
100%120%140%
Q32017
Q42017
Q12018
Q22018
Q32018
Growth (year on year)
• Australia• China• Hong Kong• India
• Indonesia• Japan• Malaysia• Singapore
• Germany• UK• UAE
• US East• US West
Source: Canalys estimates, Security Analysis, September 2018 *Announced coverage

Cloud infrastructure services
Market overview Q3 2018

Americas: Suite 317, 855 El Camino Real, Palo Alto, CA 94301, US | tel: +1 650 681 4488
APAC: Room 310, Block A, No 98 Yanping Road, Jingan District, Shanghai 200042, China | tel: +86 21 2225 2888
APAC: 133 Cecil Street, Keck Seng Tower, #13-02/02A, Singapore 069535 | tel: +65 6671 9399
EMEA: Diddenham Court, Lambwood Hill, Grazeley, Reading RG7 1JQ, UK | tel: +44 118 984 0520
email: [email protected] | web: www.canalys.com
The written content of this document represents our interpretation and analysis of information generally available to the public or released by responsible individuals in the subject companies, but is not guaranteed as to accuracy or completeness. It does not contain information provided to us in confidence by the industry. Market data contained in this document represents Canalys’ best estimates based on the information available to it at the time of publication.
Canalys has a liberal policy with regard to the re-use of information that it provides to its clients, whether within reports, databases, presentations, emails or any other format. A client may circulate Canalys information to colleagues within his or her organization worldwide, including wholly-owned subsidiaries, but not to a third party. For the avoidance of doubt, sharing of information is not permitted with organizations that are associated with the client by a joint venture, investment or common shareholding. If you wish to share information with the press or use any information in a public forum then you must receive prior explicit written approval from Canalys.