UKOUG Conference 2007 Luca Canali, CERN IT A Closer Look inside Oracle ASM.
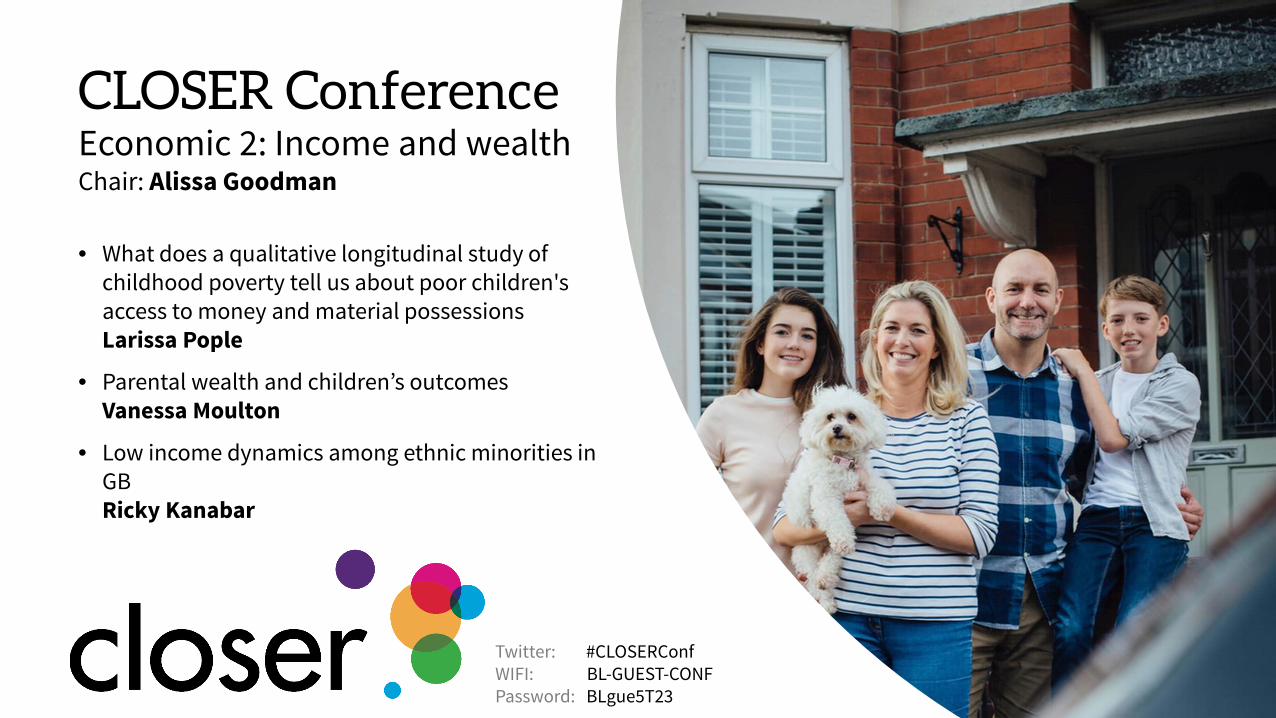
CLOSER ConferenceEconomic 2: Income and wealthChair: Alissa Goodman
• What does a qualitative longitudinal study of childhood poverty tell us about poor children's access to money and material possessionsLarissa Pople
• Parental wealth and children’s outcomes Vanessa Moulton
• Low income dynamics among ethnic minorities in GB Ricky Kanabar
Twitter: #CLOSERConfWIFI: BL-GUEST-CONFPassword: BLgue5T23
30 June 2017 2
Understanding Childhoods: Children’s perspectives on money and possessionsLarissa Pople
CLOSER conference

09 November 2017 3
Background
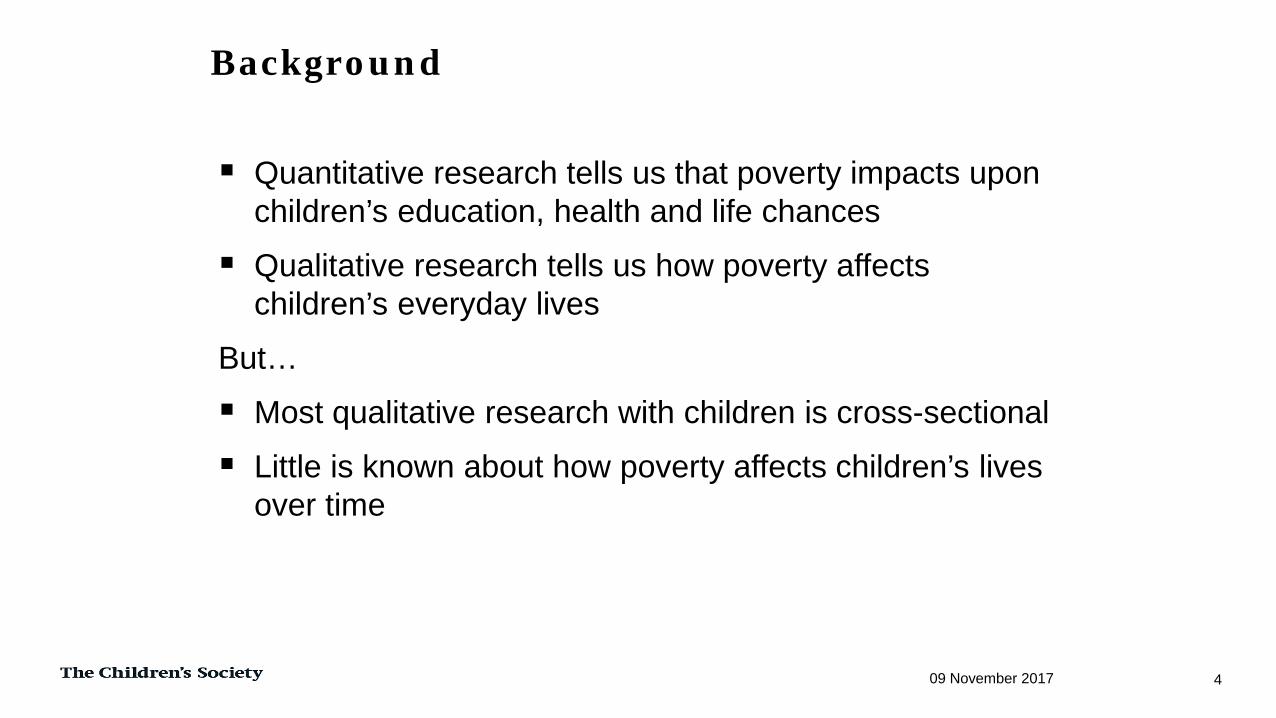
Quantitative research tells us that poverty impacts upon children’s education, health and life chances
Qualitative research tells us how poverty affects children’s everyday lives
But…
Most qualitative research with children is cross-sectional
Little is known about how poverty affects children’s lives over time
Background
09 November 2017 4
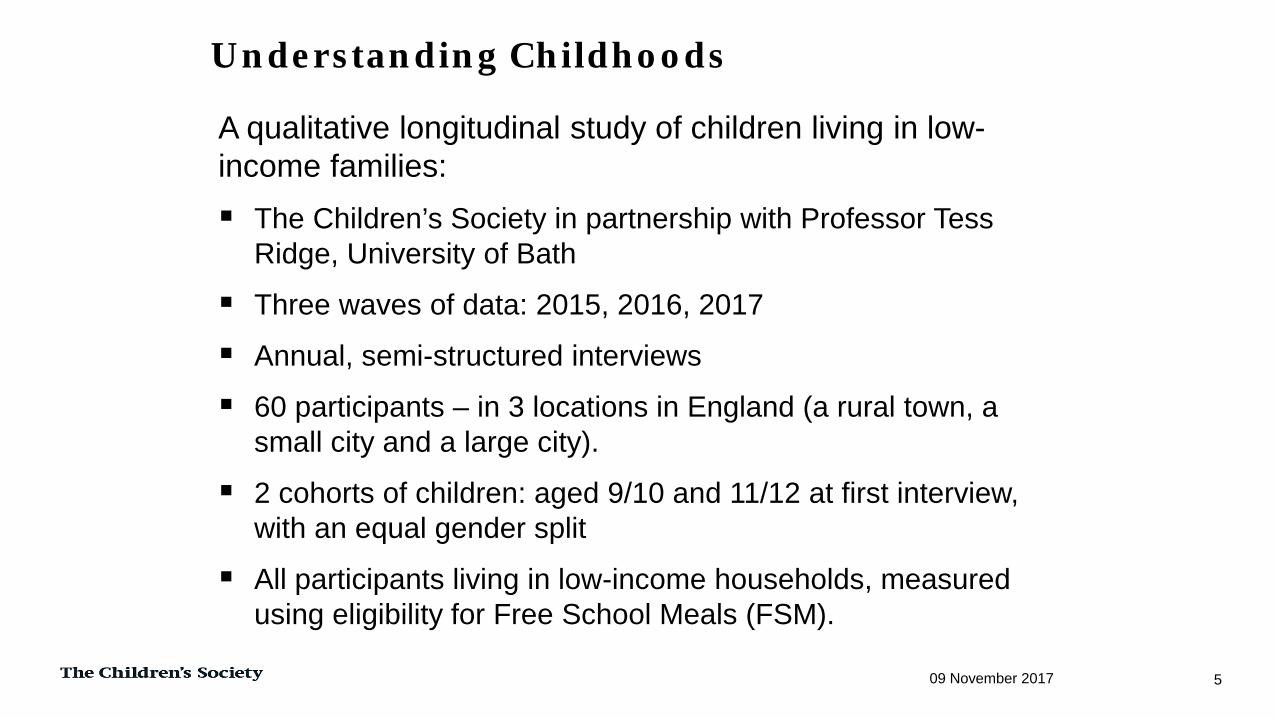
A qualitative longitudinal study of children living in low-income families: The Children’s Society in partnership with Professor Tess
Ridge, University of Bath
Three waves of data: 2015, 2016, 2017
Annual, semi-structured interviews
60 participants – in 3 locations in England (a rural town, a small city and a large city).
2 cohorts of children: aged 9/10 and 11/12 at first interview, with an equal gender split
All participants living in low-income households, measured using eligibility for Free School Meals (FSM).
Understanding Childhoods
09 November 2017 5
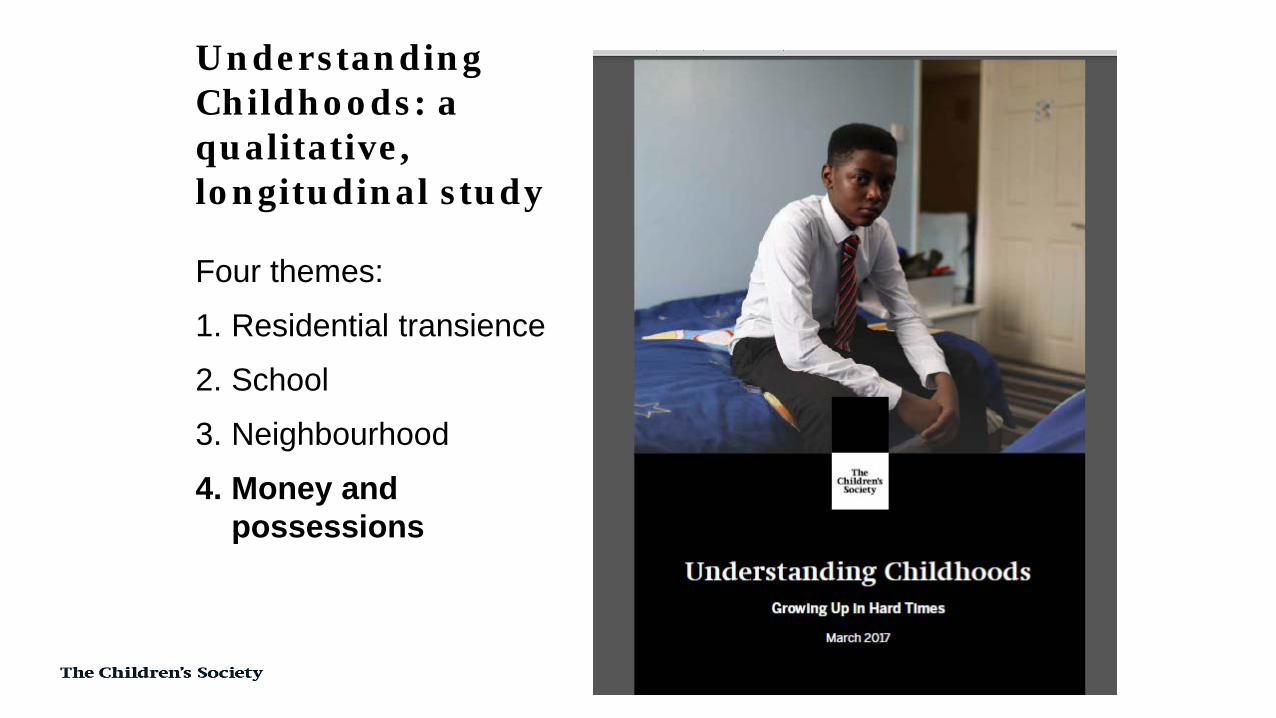
Understanding Childhoods: a qualitative, longitudinal study
Four themes:
1. Residential transience
2. School
3. Neighbourhood
4. Money and possessions
Money and possessions
09 November 2017 7
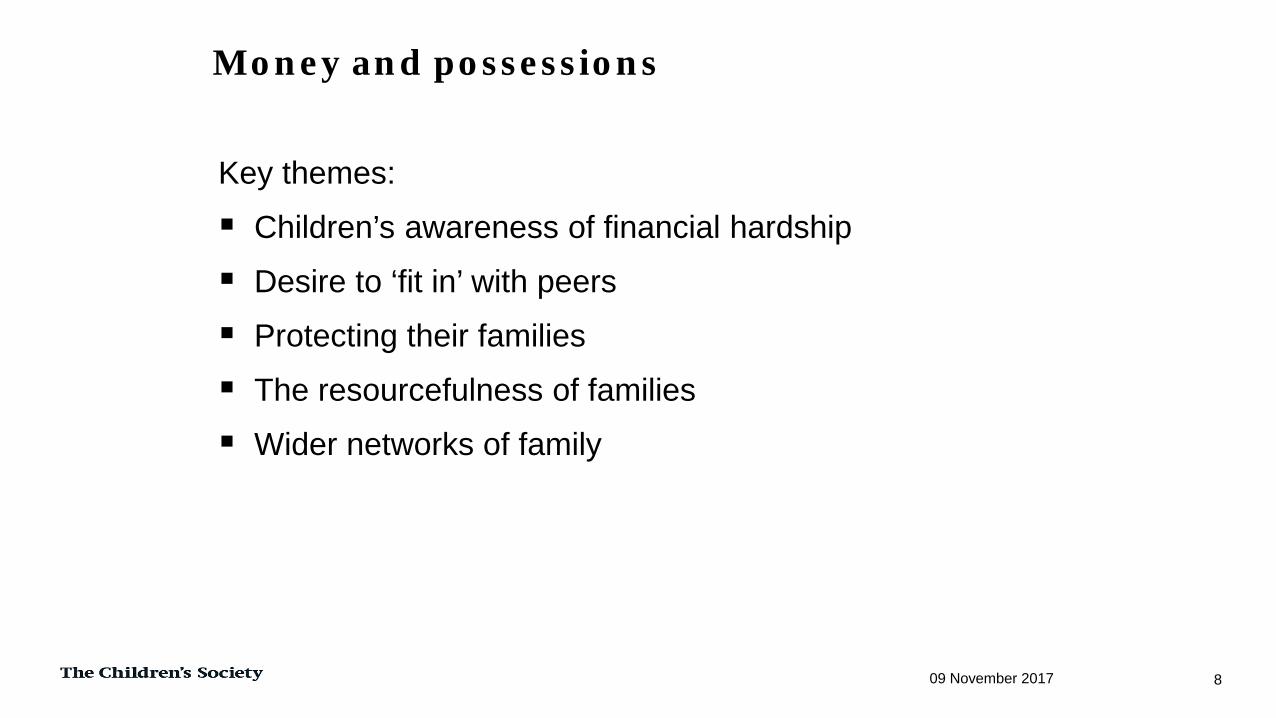
Key themes:
Children’s awareness of financial hardship
Desire to ‘fit in’ with peers
Protecting their families
The resourcefulness of families
Wider networks of family
Money and possessions
09 November 2017 8
“Because mum’s buying all of this stuff for us, she never knows when she might run out of money.’” Boy, 11
“We go to Aldi or Pound Stretchers, because Pound Stretchers is only, like, for food, it’s £1 per decent meal.” Girl, 9
“We still get, like, a couple of holidays off, but we just have a staycation, like, have a couple of tents into the house and then we just try to have an outside campfire that my dad builds that’s really big…” Girl, 9
Awareness of financial hardship
09 November 2017 9
“I don’t want to have too much money where we just think that we’re snobs and really rich…and we don’t care about anyone else and I start falling out with my friends because I've got loads of money. I just want like money, just normal money.’” Girl, 11
“If [I’m looking for] the new Adidas shoes and if I'm like ‘they're a bit expensive’ and they could, say, have a little offer on them and when they have an offer on them, I'm like ‘oh yes.’” Boy, 11
Fitting in
09 November 2017 10
“I do have a phone but it’s not like one of those modern ones; it’s just simple.” Boy, 11
“The screen [on the tablet] is cracked like that and you can’t press anything in the cracked part.” Girl, 9
“We don’t have a computer at my mum’s and our TV is broken... The computer homework is quite hard because I don’t have a computer.” Boy, 11
Technology
09 November 2017 11
“Well, I kind of know [not to ask mum for money] because my brother was like, ‘oh, I wanted to go football’…and he asked my mum to go yesterday and he said, ‘Mum, can I have £2?’…and then my mum said, ‘No, I haven’t got any money.’” Girl, 11
“Sometimes I save [my pocket money] up but sometimes I spend it on shopping like, I don’t know, food, toilet roll, butter, bread, stuff like that, yes.” Boy, 11
Protecting their families
09 November 2017 12
“If my friends say ‘Can I stop at yours tonight?’ and my mum says yes but then they say ‘Will you ask your mum if you can buy loads of munchies for us so we can have like a proper munch out’ and then I say ‘Yes, of course, I’ll ask her, I’ll go ask her’ and then I’ll just walk downstairs, sit downstairs, watch TV for five minutes then come back and tell them that I've asked her and she said no…because I don’t really want to ask her for loads of things because if she says no, I'm going to feel bad.’” Girl, 11
Protecting their families
09 November 2017 13
“My mum don’t mind how much it is…she would say ‘okay’ but she don’t have enough money for it, she’d be like ‘I’ll get it for you tomorrow’ and make sure.” Girl, 11
“My mum got a new phone, because this one is like not working properly [so she gave hers to me].” Girl, 11
The resourcefulness of children and families
09 November 2017 14
“I get pocket money from my nan and she gives me £5 every week but now she’s putting it in my bank account, so now I've got lots of money at my house now and I'm just saving it and saving it and saving it and saving it.” Boy, 11
“I’d ask my dad [for money] and my dad says ‘I’m going to send it to you on Saturday’ and then I wait until Saturday, he doesn’t send it. That’s what he’s done to me lots of times…My sister’s dad always sends her money and I sometimes feel a little bit embarrassed…There are so many trips that I’ve missed because…I haven’t got money and stuff.” Girl, 11
Extended networks of family and friends
09 November 2017 15
Longitudinal insights
09 November 2017 16
The longitudinal design enabled:
Growing familiarity between researcher and participant
More detailed understanding
Retrospective insights (into past experiences)
Changes over time
Key transitions
Age differences
Methodological insights
09 November 2017 17
Wave 1: Mum long-term illness; Dad doing informal, low-paid work; sister has a violent boyfriend; unfriendly neighbours; begging:
“We try to beg people for money because we only have £10. And mostly my dad picks whose turn it is to try to see if they can get someone to give us, like, £10 a month.”
Waves 2 & 3: Better feelings about neighbourhood, sister has new boyfriend:
“I go round [to our neighbours] and they come round mine. They have like little kids as well that I can play with and like whenever I come round there I get treated.”“[The shopkeeper] would say alright I’ll save you however much money [if they don’t have enough] and then like they mostly care and watch out for us and like if my mum was like really bad and like I was still at school they would offer to put it in the car, drive it there.”
Case study: Penny
09 November 2017 18
Waves 2 & 3: Dad and sister have better jobs, more money around, even went on holiday
“[Things] are quite a bit better because my dad gets paid more […] he works extra hours and he also has three jobs if you count the work he has currently over night.”
“It feels better, like, now I can afford like the things that I need, like, new shoes if I needed them”
“Sometimes [my sister is] the one that gets me the phones. She’s the one that earns the money, like, she would save up for like ridiculous amounts of weeks and then if it was like my birthday or Christmas she would get me like, a massive present [like a phone].”
Case study: Penny
09 November 2017 19
Wave 1: Mum long-term illness and single parent; very little money around, and few possessions:
“Everybody else has a phone. Loads of people have phones. Everybody in my class has a phone.”
“We don’t have a computer at my mum’s and our TV is broken...”
“I know that [Mum] has no money at all most of the time so I do sort of, if I see something, I will sort of ask and if she says no I sort of [don’t] go on because I know that she’s got no money.”
Grandmother plays an important role:
“[Nan's house] is kind of different because my nan’s got quite a lot more money than my mum and it’s sort of like I go from one house to another and it’s like completely different environments.”
“Each week I get a fiver from my nan.”
Case study: Andrew
09 November 2017 20
Waves 2 & 3: Financial situation is the same, role of extended family continues to be critical
“My brother bought me a Wii U... Wait... He bought me the game for Christmas, and he also took me to see the new Star Wars film for Christmas.” “If we’re out of money and we don’t have much food, [my brother] will pop to the shops and buy some bread and milk and stuff like that, some essentials.”“[Mum] really couldn’t afford [pocket money] because basically when it gets to Friday she has no money to do anything. Usually we will run out of electricity, gas and just have to sit in darkness for about an hour before [my brother] gets home and gets the money.”
Case study: Andrew
09 November 2017 21
09 November 2017 22
Some concluding thoughts
There were large differences in our sample in terms of children ‘having’ or ‘not having’ money and material possessions
Some were clearly missing out. Others, on the face of it, were not, although many of these were ‘making do’ e.g. sharing, hand-me-downs, or using items that are broken / not working
Children and families displayed a range of coping strategies
Importance of family networks – especially grandmothers – in protecting children from deprivation
Insights from longitudinal design
Summary
09 November 2017 23
Charity Registration No. 221124
Thank you…Any further questions?
http://www.childrenssociety.org.uk/[email protected]
The Children’s Society has helped change children’s lives for over a century.
We expose injustice and address hard truths, tackling child poverty and neglect head on. We fight for change based on the experiences of every child we work with and the solid evidence we gather.
Through our campaigning, commitment and care, we are determined to give every child in this country the greatest possible chance in life.
09 November 2017 25
About us
Vanessa Moulton, Bilal Nasim, Ludovica Gambaro, George Ploubidis & Alissa Goodman
CLOSER conference 2 November 2017
Motivation Wealth measures at MCS5
• Information collected• Construction of variables
Research objectives Methods Results Conclusions
Outline
Wealth is a stock of resources: measured at one point in time but accumulated over time
4 components: property, financial, physical, pension
Wealth could be a more accurate indicator of longer term economic resources of the family and a family’s access to opportunities and advantages (Oliver and Shapiro, 1995)
What is wealth and why should we be interested in it?
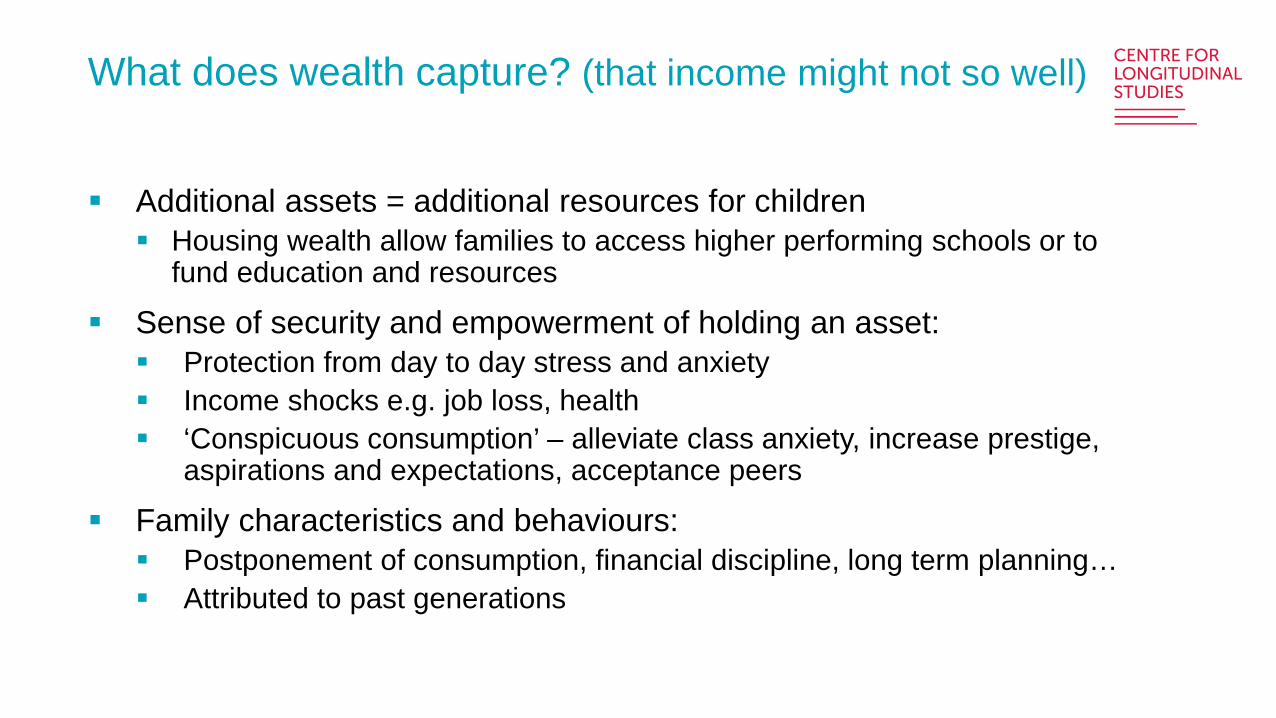
Additional assets = additional resources for children Housing wealth allow families to access higher performing schools or to
fund education and resources
Sense of security and empowerment of holding an asset: Protection from day to day stress and anxiety Income shocks e.g. job loss, health ‘Conspicuous consumption’ – alleviate class anxiety, increase prestige,
aspirations and expectations, acceptance peers
Family characteristics and behaviours: Postponement of consumption, financial discipline, long term planning… Attributed to past generations
What does wealth capture? (that income might not so well)
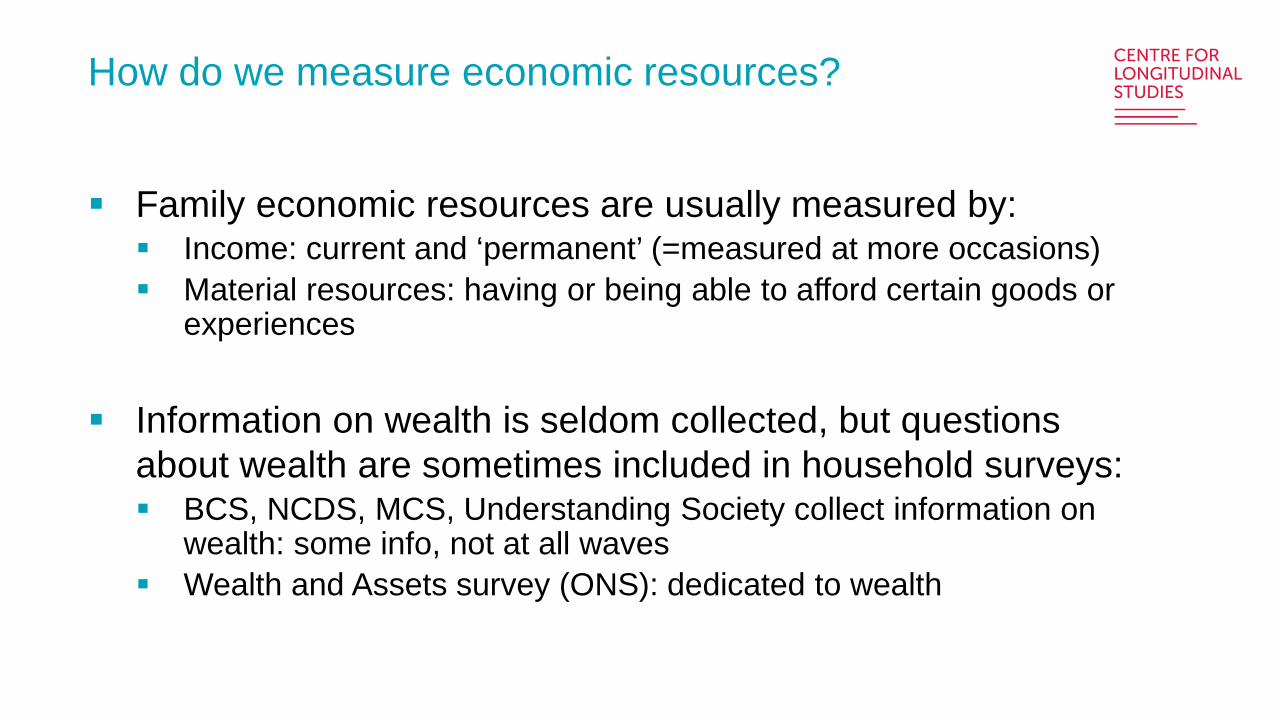
Family economic resources are usually measured by: Income: current and ‘permanent’ (=measured at more occasions) Material resources: having or being able to afford certain goods or
experiences
Information on wealth is seldom collected, but questions about wealth are sometimes included in household surveys: BCS, NCDS, MCS, Understanding Society collect information on
wealth: some info, not at all waves Wealth and Assets survey (ONS): dedicated to wealth
How do we measure economic resources?
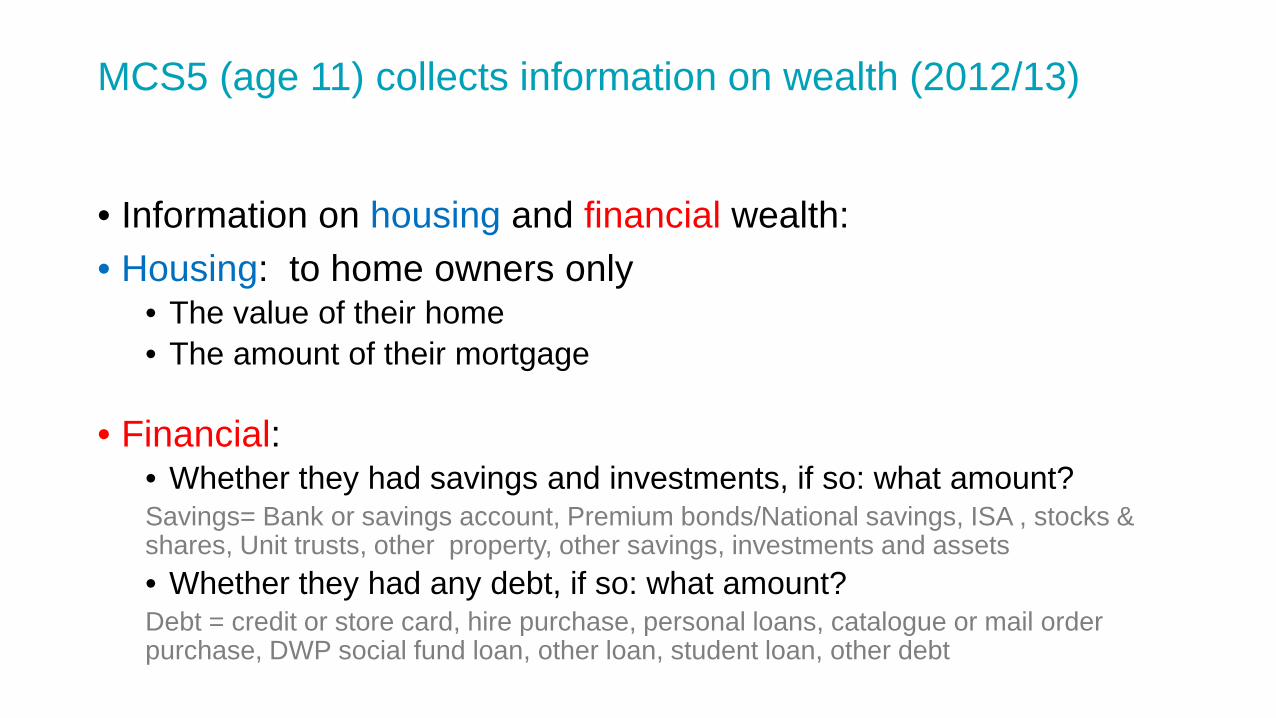
• Information on housing and financial wealth:• Housing: to home owners only
• The value of their home • The amount of their mortgage
• Financial: • Whether they had savings and investments, if so: what amount? Savings= Bank or savings account, Premium bonds/National savings, ISA , stocks & shares, Unit trusts, other property, other savings, investments and assets• Whether they had any debt, if so: what amount?Debt = credit or store card, hire purchase, personal loans, catalogue or mail order purchase, DWP social fund loan, other loan, student loan, other debt
MCS5 (age 11) collects information on wealth (2012/13)
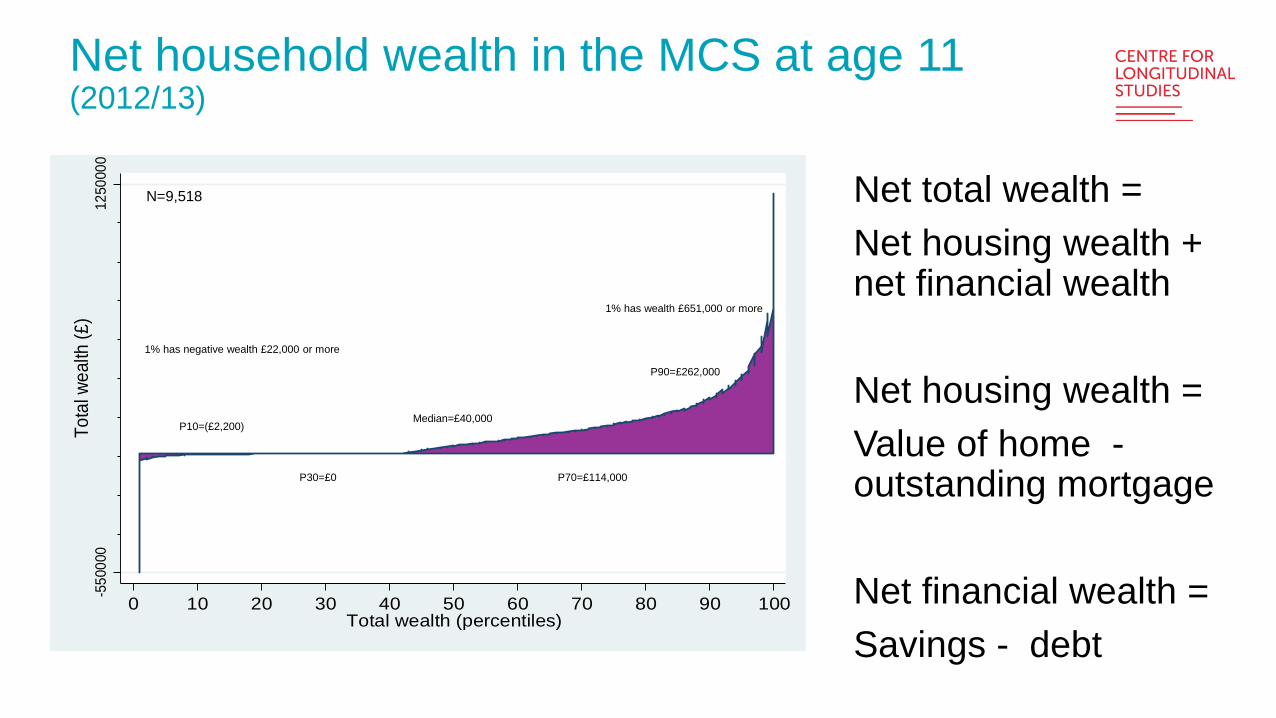
Net household wealth in the MCS at age 11(2012/13)
-550
000
1250
000
Tota
l wea
lth (£
)
0 10 20 30 40 50 60 70 80 90 100Total wealth (percentiles)
Net total wealth = Net housing wealth + net financial wealth
Net housing wealth = Value of home -outstanding mortgage
Net financial wealth =Savings - debt
N=9,518
P10=(£2,200)
1% has negative wealth £22,000 or more
P30=£0
Median=£40,000
P70=£114,000
P90=£262,000
1% has wealth £651,000 or more
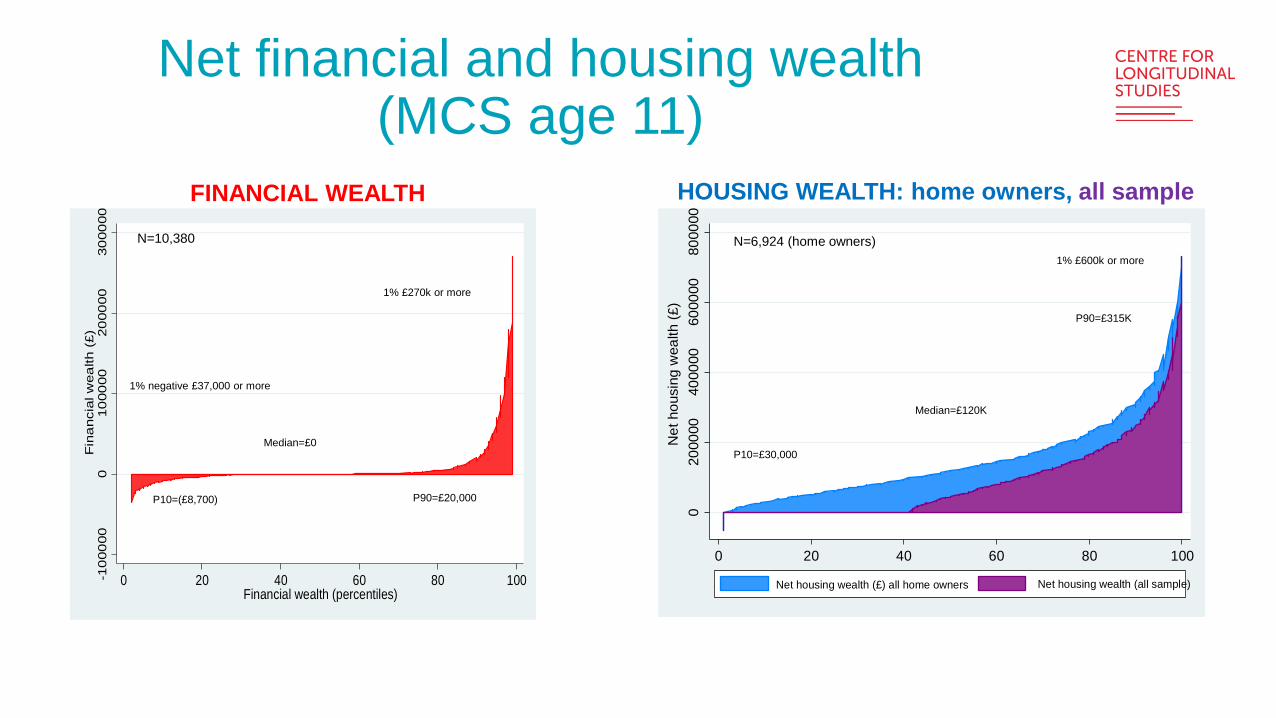
Net financial and housing wealth (MCS age 11)
-10
0000
010
0000
2000
0030
0000
Fin
anc
ial w
ealth
(£)
0 20 40 60 80 100Financial wealth (percentiles)
020
0000
4000
0060
0000
8000
00N
et h
ousi
ng w
ealth
(£)
0 20 40 60 80 100
Net housing wealth (£) all home owners Net housing wealth (all sample)
N=10,380
Median=£0
1% negative £37,000 or more
1% £270k or more
P10=(£8,700) P90=£20,000
N=6,924 (home owners)
P10=£30,000
Median=£120K
P90=£315K
1% £600k or more
FINANCIAL WEALTH HOUSING WEALTH: home owners, all sample
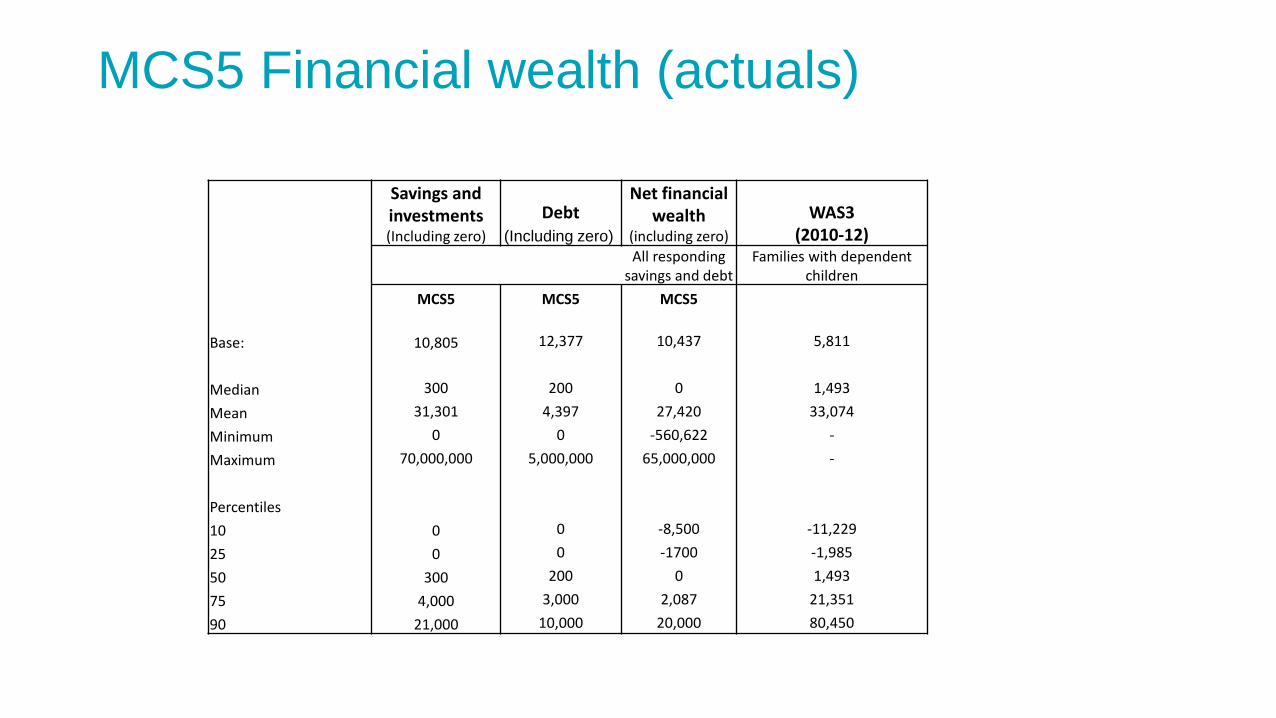
MCS5 Financial wealth (actuals)
Savings and investments(Including zero)
Debt(Including zero)
Net financial wealth
(including zero)WAS3
(2010-12)All responding
savings and debtFamilies with dependent
childrenMCS5 MCS5 MCS5
Base: 10,805 12,377 10,437 5,811
Median 300 200 0 1,493Mean 31,301 4,397 27,420 33,074Minimum 0 0 -560,622 -Maximum 70,000,000 5,000,000 65,000,000 -
Percentiles10 0 0 -8,500 -11,22925 0 0 -1700 -1,98550 300 200 0 1,49375 4,000 3,000 2,087 21,35190 21,000 10,000 20,000 80,450
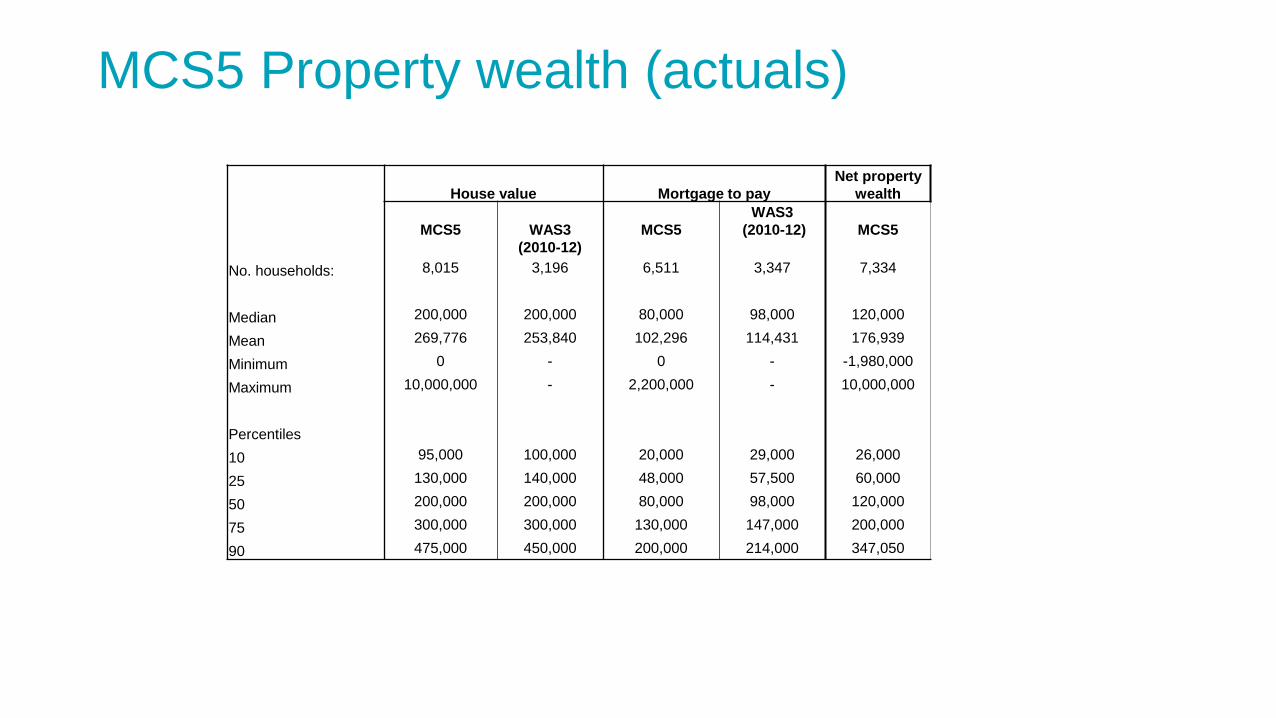
MCS5 Property wealth (actuals)
House value Mortgage to payNet property
wealth
MCS5 WAS3 (2010-12)
MCS5WAS3
(2010-12) MCS5
No. households: 8,015 3,196 6,511 3,347 7,334
Median 200,000 200,000 80,000 98,000 120,000
Mean 269,776 253,840 102,296 114,431 176,939
Minimum 0 - 0 - -1,980,000
Maximum 10,000,000 - 2,200,000 - 10,000,000
Percentiles10 95,000 100,000 20,000 29,000 26,000
25 130,000 140,000 48,000 57,500 60,000
50 200,000 200,000 80,000 98,000 120,000
75 300,000 300,000 130,000 147,000 200,000
90 475,000 450,000 200,000 214,000 347,050
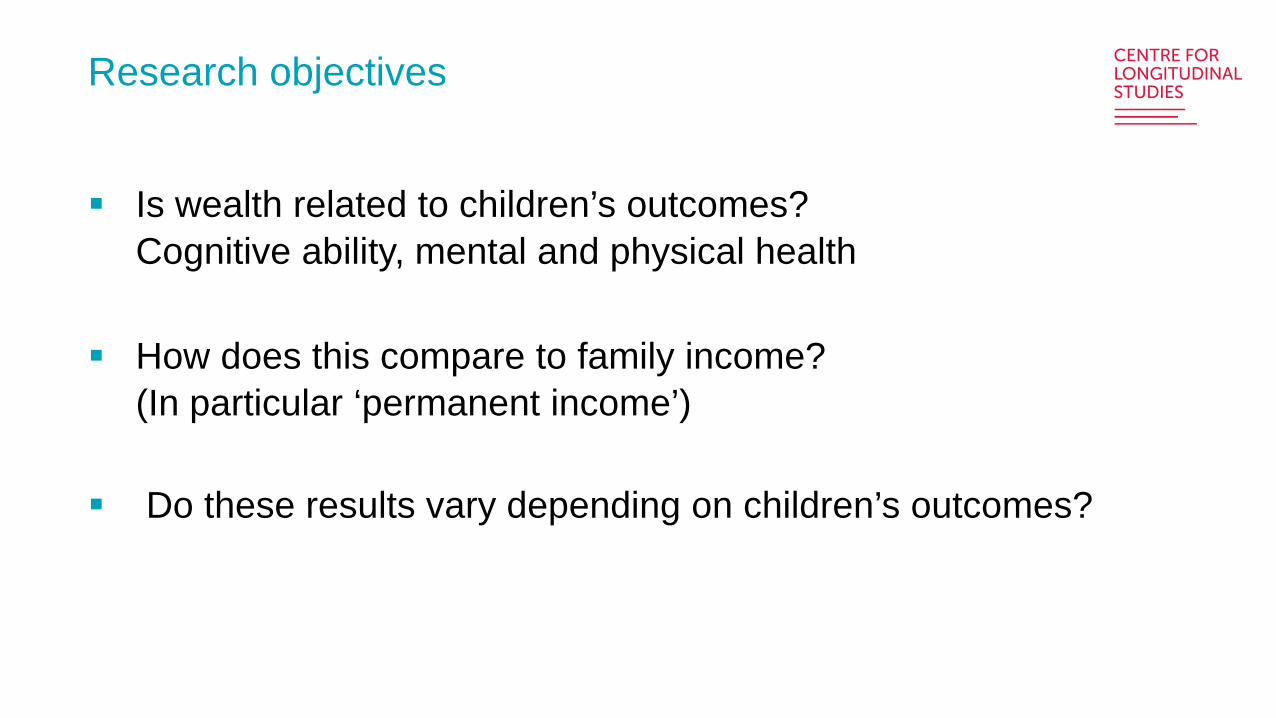
Is wealth related to children’s outcomes?Cognitive ability, mental and physical health
How does this compare to family income?(In particular ‘permanent income’)
Do these results vary depending on children’s outcomes?
Research objectives
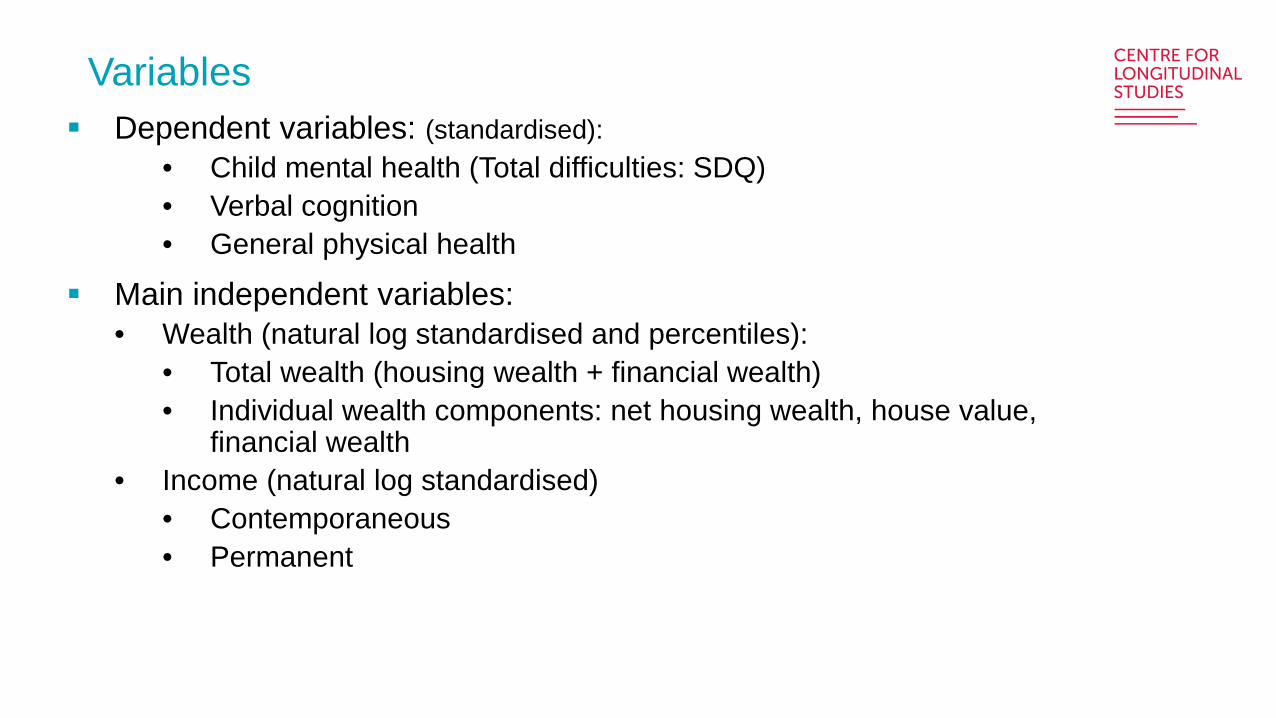
Dependent variables: (standardised): • Child mental health (Total difficulties: SDQ)• Verbal cognition• General physical health
Main independent variables: • Wealth (natural log standardised and percentiles):
• Total wealth (housing wealth + financial wealth)• Individual wealth components: net housing wealth, house value,
financial wealth• Income (natural log standardised)
• Contemporaneous• Permanent
Variables
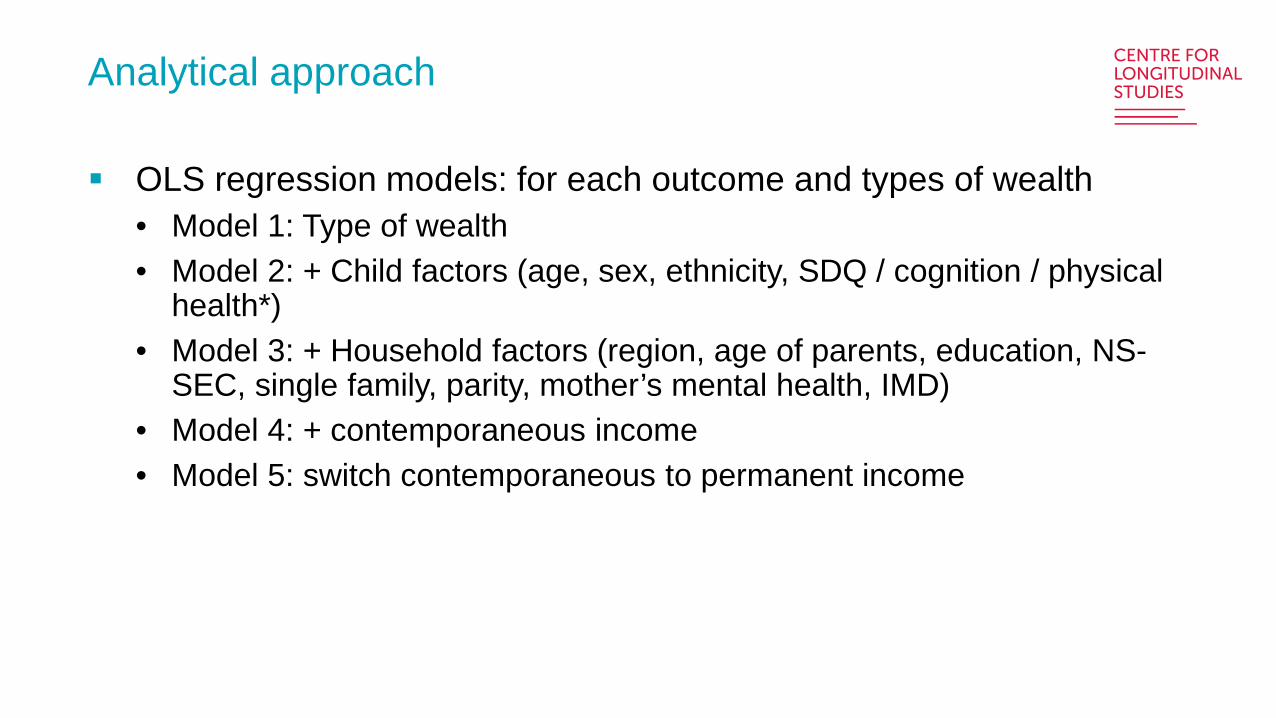
OLS regression models: for each outcome and types of wealth• Model 1: Type of wealth • Model 2: + Child factors (age, sex, ethnicity, SDQ / cognition / physical
health*)• Model 3: + Household factors (region, age of parents, education, NS-
SEC, single family, parity, mother’s mental health, IMD)• Model 4: + contemporaneous income• Model 5: switch contemporaneous to permanent income
Analytical approach
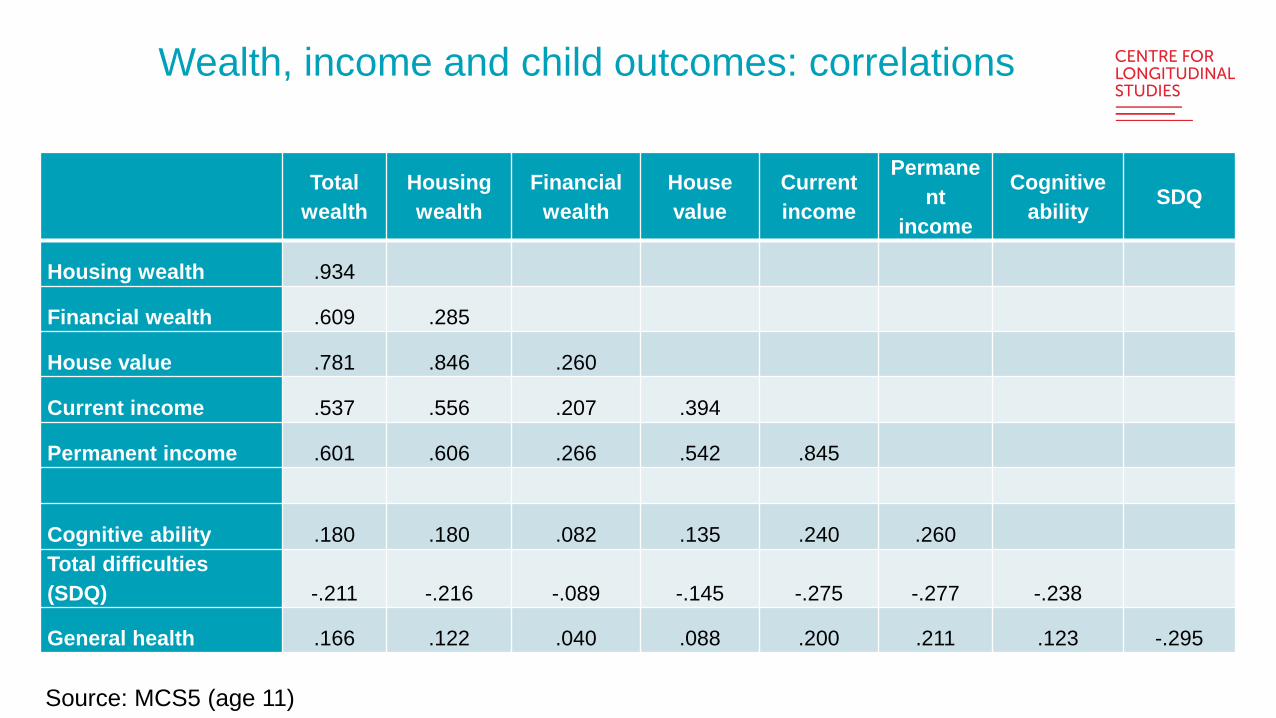
Wealth, income and child outcomes: correlations
Total wealth
Housing wealth
Financial wealth
House value
Current income
Permanent
income
Cognitive ability SDQ
Housing wealth .934
Financial wealth .609 .285
House value .781 .846 .260
Current income .537 .556 .207 .394
Permanent income .601 .606 .266 .542 .845
Cognitive ability .180 .180 .082 .135 .240 .260Total difficulties (SDQ) -.211 -.216 -.089 -.145 -.275 -.277 -.238
General health .166 .122 .040 .088 .200 .211 .123 -.295
Source: MCS5 (age 11)
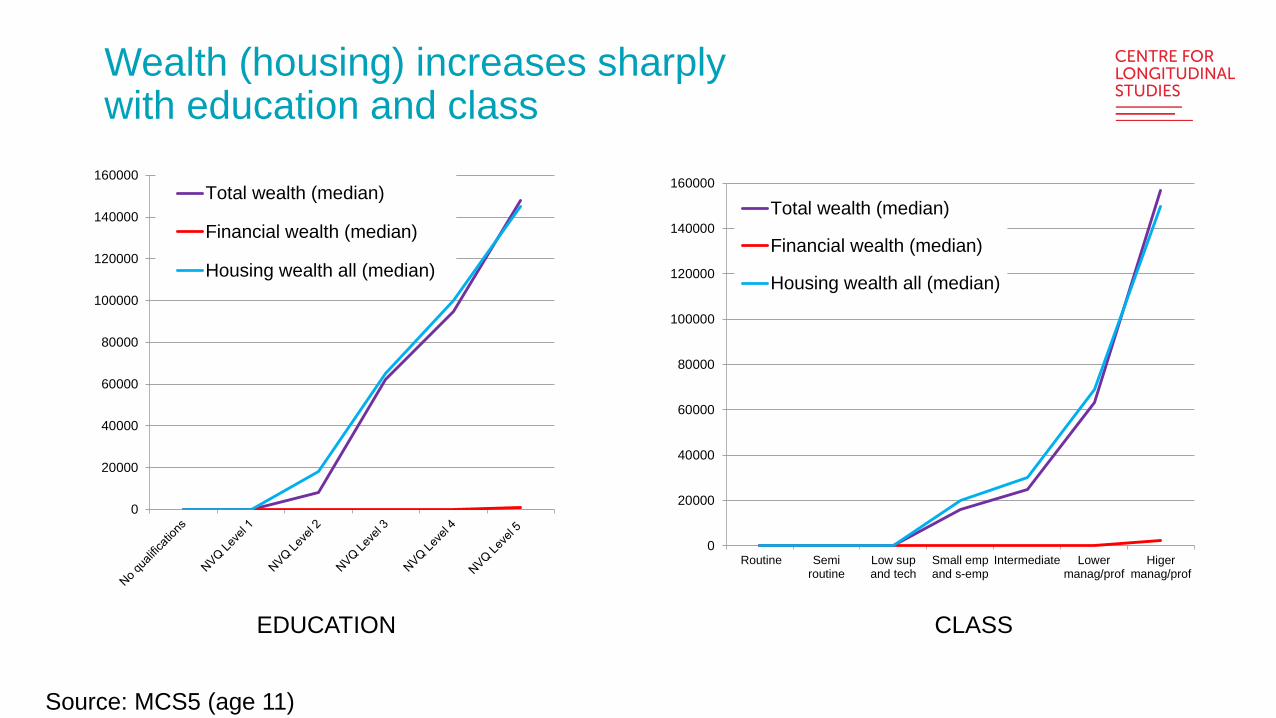
Wealth (housing) increases sharply with education and class
0
20000
40000
60000
80000
100000
120000
140000
160000Total wealth (median)
Financial wealth (median)
Housing wealth all (median)
0
20000
40000
60000
80000
100000
120000
140000
160000
Routine Semiroutine
Low supand tech
Small empand s-emp
Intermediate Lowermanag/prof
Higermanag/prof
Total wealth (median)
Financial wealth (median)
Housing wealth all (median)
EDUCATION CLASS
Source: MCS5 (age 11)
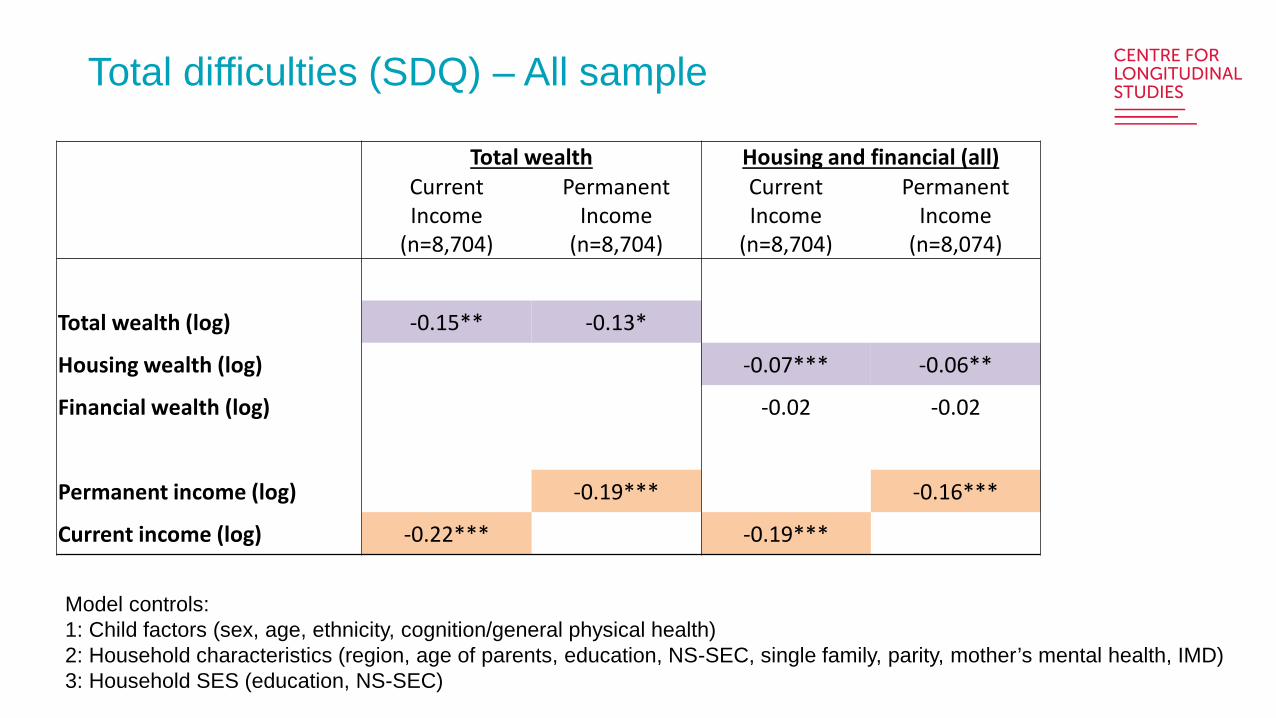
Total difficulties (SDQ) – All sample
Model controls:1: Child factors (sex, age, ethnicity, cognition/general physical health)2: Household characteristics (region, age of parents, education, NS-SEC, single family, parity, mother’s mental health, IMD)3: Household SES (education, NS-SEC)
Total wealth Housing and financial (all)CurrentIncome
(n=8,704)
PermanentIncome
(n=8,704)
CurrentIncome
(n=8,704)
PermanentIncome
(n=8,074)
Total wealth (log) -0.15** -0.13*
Housing wealth (log) -0.07*** -0.06**
Financial wealth (log) -0.02 -0.02
Permanent income (log) -0.19*** -0.16***
Current income (log) -0.22*** -0.19***
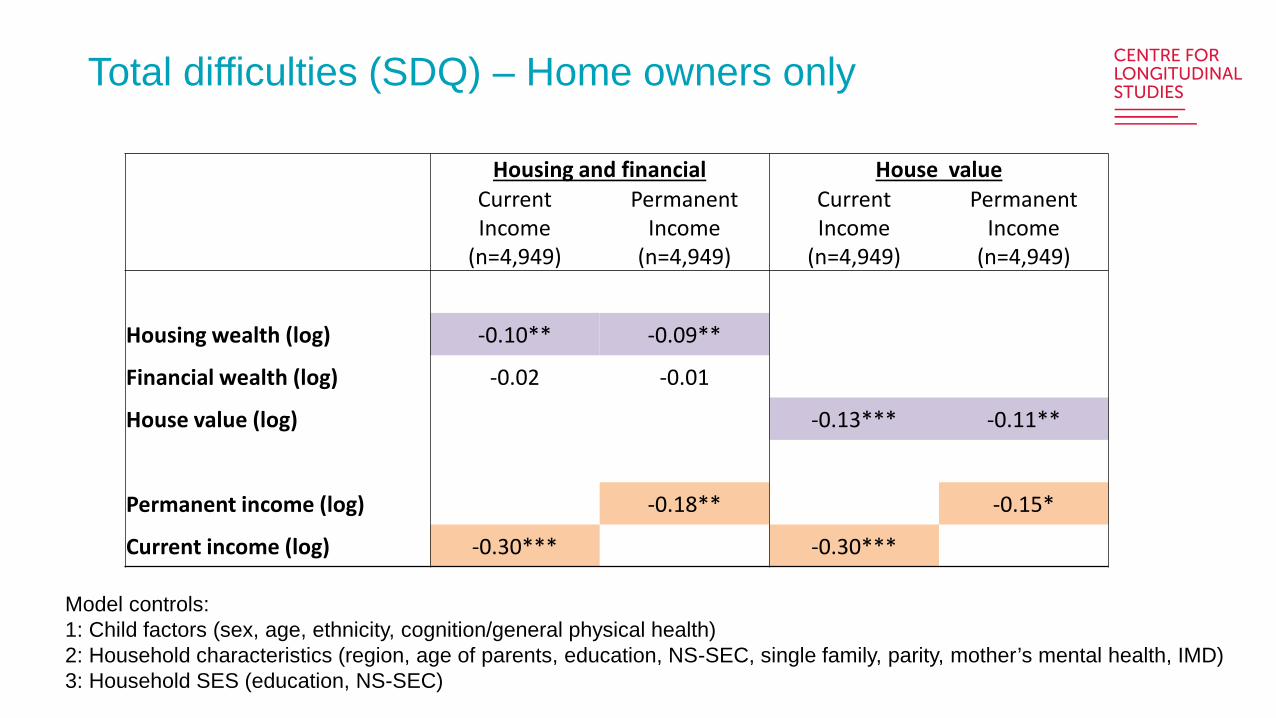
Total difficulties (SDQ) – Home owners only
Model controls:1: Child factors (sex, age, ethnicity, cognition/general physical health)2: Household characteristics (region, age of parents, education, NS-SEC, single family, parity, mother’s mental health, IMD)3: Household SES (education, NS-SEC)
Housing and financial House valueCurrentIncome
(n=4,949)
PermanentIncome
(n=4,949)
CurrentIncome
(n=4,949)
PermanentIncome
(n=4,949)
Housing wealth (log) -0.10** -0.09**
Financial wealth (log) -0.02 -0.01
House value (log) -0.13*** -0.11**
Permanent income (log) -0.18** -0.15*
Current income (log) -0.30*** -0.30***
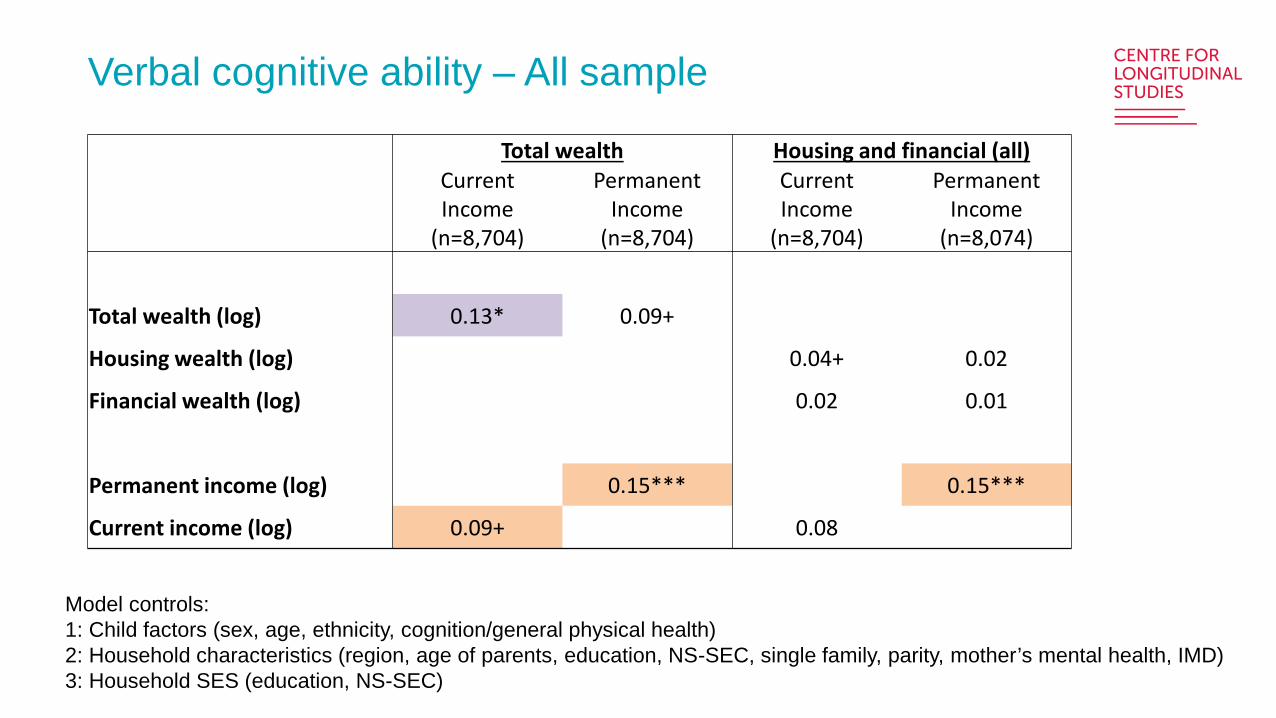
Verbal cognitive ability – All sample
Model controls:1: Child factors (sex, age, ethnicity, cognition/general physical health)2: Household characteristics (region, age of parents, education, NS-SEC, single family, parity, mother’s mental health, IMD)3: Household SES (education, NS-SEC)
Total wealth Housing and financial (all)CurrentIncome
(n=8,704)
PermanentIncome
(n=8,704)
CurrentIncome
(n=8,704)
PermanentIncome
(n=8,074)
Total wealth (log) 0.13* 0.09+
Housing wealth (log) 0.04+ 0.02
Financial wealth (log) 0.02 0.01
Permanent income (log) 0.15*** 0.15***
Current income (log) 0.09+ 0.08
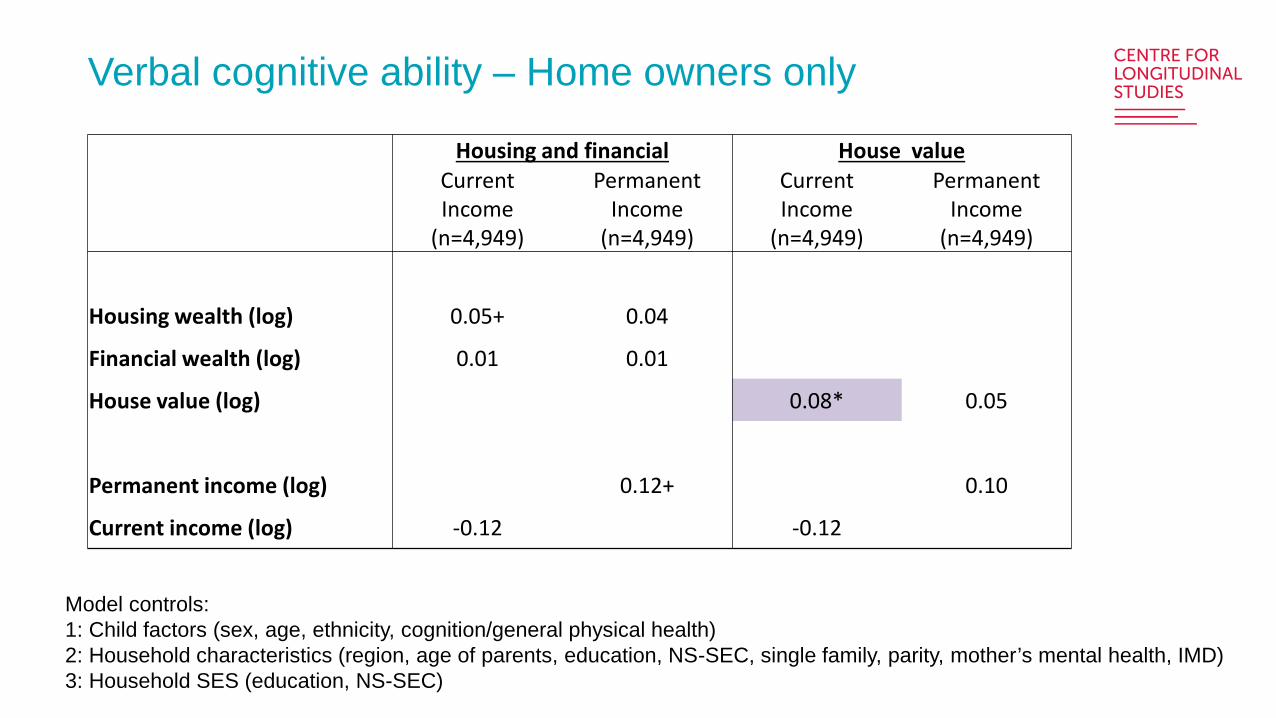
Verbal cognitive ability – Home owners only
Model controls:1: Child factors (sex, age, ethnicity, cognition/general physical health)2: Household characteristics (region, age of parents, education, NS-SEC, single family, parity, mother’s mental health, IMD)3: Household SES (education, NS-SEC)
Housing and financial House valueCurrentIncome
(n=4,949)
PermanentIncome
(n=4,949)
CurrentIncome
(n=4,949)
PermanentIncome
(n=4,949)
Housing wealth (log) 0.05+ 0.04
Financial wealth (log) 0.01 0.01
House value (log) 0.08* 0.05
Permanent income (log) 0.12+ 0.10
Current income (log) -0.12 -0.12
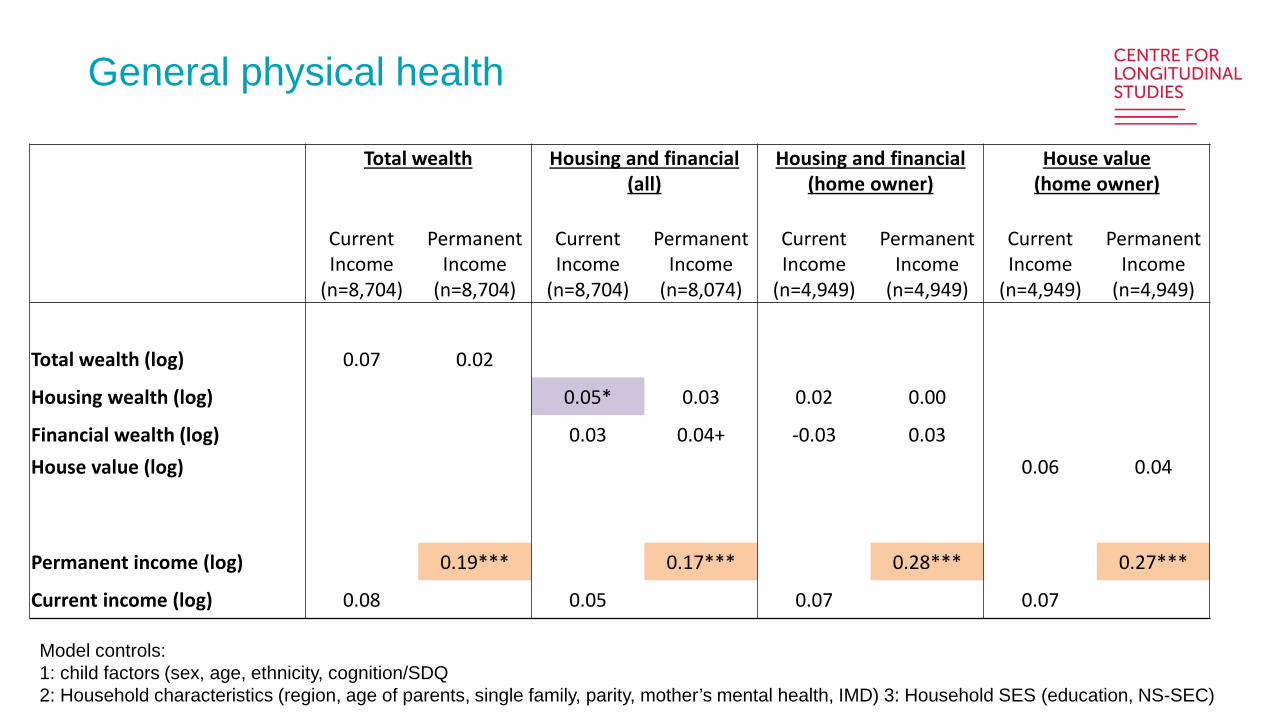
General physical health
Model controls:1: child factors (sex, age, ethnicity, cognition/SDQ 2: Household characteristics (region, age of parents, single family, parity, mother’s mental health, IMD) 3: Household SES (education, NS-SEC)
Total wealth Housing and financial (all)
Housing and financial (home owner)
House value(home owner)
CurrentIncome
(n=8,704)
PermanentIncome
(n=8,704)
CurrentIncome
(n=8,704)
PermanentIncome
(n=8,074)
CurrentIncome
(n=4,949)
PermanentIncome
(n=4,949)
CurrentIncome
(n=4,949)
PermanentIncome
(n=4,949)
Total wealth (log) 0.07 0.02
Housing wealth (log) 0.05* 0.03 0.02 0.00
Financial wealth (log) 0.03 0.04+ -0.03 0.03House value (log) 0.06 0.04
Permanent income (log) 0.19*** 0.17*** 0.28*** 0.27***
Current income (log) 0.08 0.05 0.07 0.07
Wealth seems to be related to child outcomes at age 11 Driven by housing wealth: because low financial wealth? Measurement
error?
Mental health associated with housing wealth, even after controlling for family SES, including ‘permanent income’
Fewer peer problems related to greater total and housing wealth Less hyperactivity related to greater total, housing and financial wealth
Family stress model? Conspicuous consumption? Time invested in children reduces accumulation wealth and vice versa?
Recap and conclusions
Verbal cognitive ability explained by ‘permanent income’ (and other household SES in particular education) rather than wealth Would the result be different in the case of other cognitive measures e.g.
maths? Future work: other abilities and/or educational outcomes
General physical health was better explained by ‘permanent income’ than by wealth: At age 11 few children were children in poor health Future work: investigate specific health issues (e.g. asthma)
Recap and conclusions
Thank you
An initiative by the Economic and Social Research Council, with scientific leadership by the Institute for Social and Economic Research, University of Essex, and survey delivery by NatCen Social Research and Kantar Public
Low income dynamics among ethnic minorities in GBVictor Hernandez Perez, Ricky Kanabar and Alita Nandi
Institute for Social and Economic Research, University of Essex UCL CLOSER conferenceInequalities: a longitudinal perspective
2nd November 2017
Motivation & literature I
• Ethnic minorities in the UK face higher risks of being unemployed, having part-time jobs or working in less well-paid occupations than individuals from the white majority (Modood, 1997; Berthoud, 2002; Hills, 2010; Longhi, 2012).
• A higher proportion of ethnic minority individuals live in low income households than the white majority, although with substantial differences between and within ethnic groups (Platt, 2007; Nandi et al. 2010; DWP, 2017).
Motivation & literature II
• High rates of persistent low income (poverty) are indicative of systematic causes (such as discrimination) and is thus of serious concern to policy makers.
• Very little evidence on low income (poverty) persistence and entry among ethnic minorities in the UK, due to lack of suitable data.
• Few studies that have estimated poverty persistence among ethnic minorities have either not estimated models separately for the different ethnic groups or have not taken into account the initial conditions and non-random attrition
• Our contribution: separately analyse low income dynamics among 5 largest ethnic minority groups in GB (in addition to the white majority) accounting for initial conditions and non-random attrition.
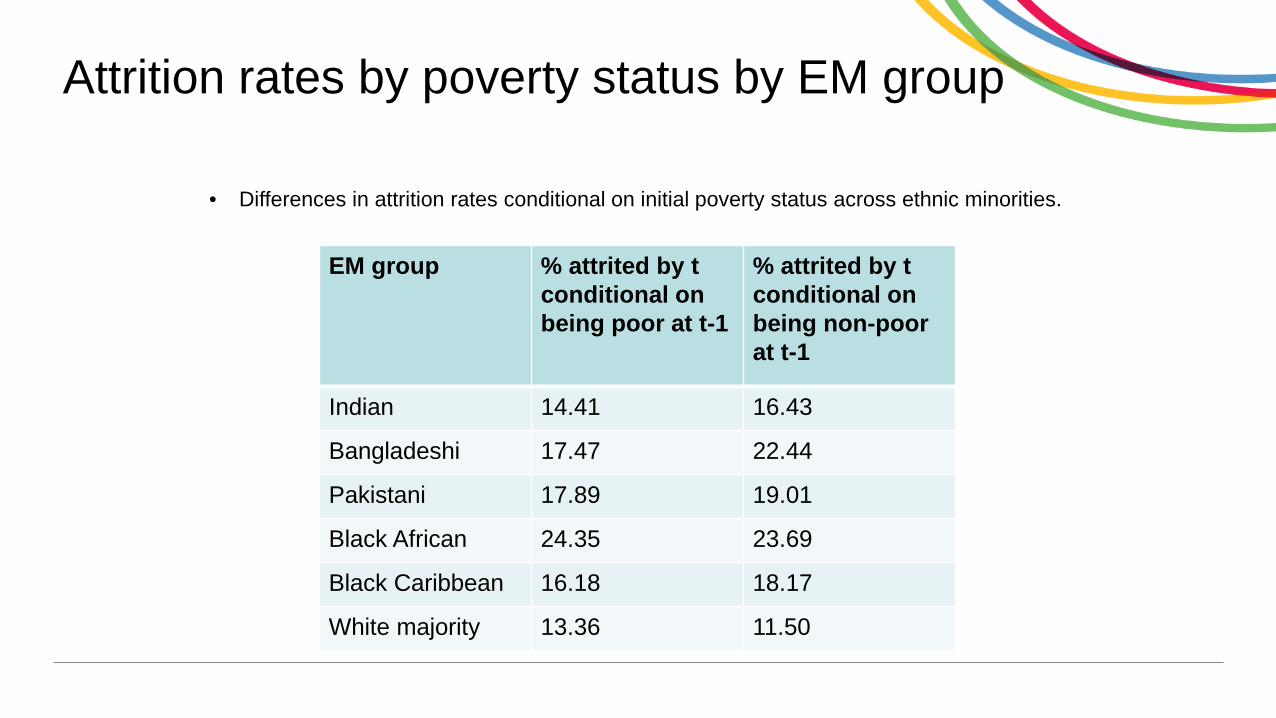
Attrition rates by poverty status by EM group
EM group % attrited by t conditional on being poor at t-1
% attrited by t conditional on being non-poor at t-1
Indian 14.41 16.43
Bangladeshi 17.47 22.44
Pakistani 17.89 19.01
Black African 24.35 23.69
Black Caribbean 16.18 18.17
White majority 13.36 11.50
• Differences in attrition rates conditional on initial poverty status across ethnic minorities.
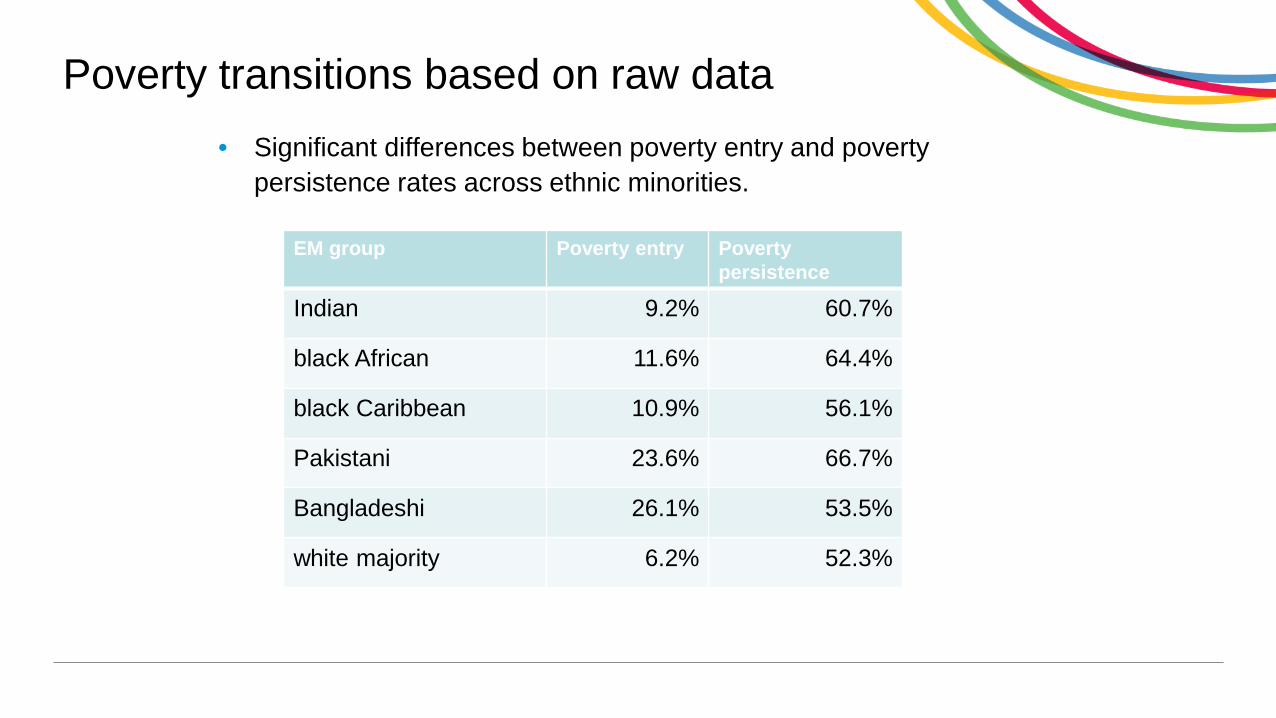
Poverty transitions based on raw data• Significant differences between poverty entry and poverty
persistence rates across ethnic minorities.
EM group Poverty entry Povertypersistence
Indian 9.2% 60.7%
black African 11.6% 64.4%
black Caribbean 10.9% 56.1%
Pakistani 23.6% 66.7%
Bangladeshi 26.1% 53.5%
white majority 6.2% 52.3%
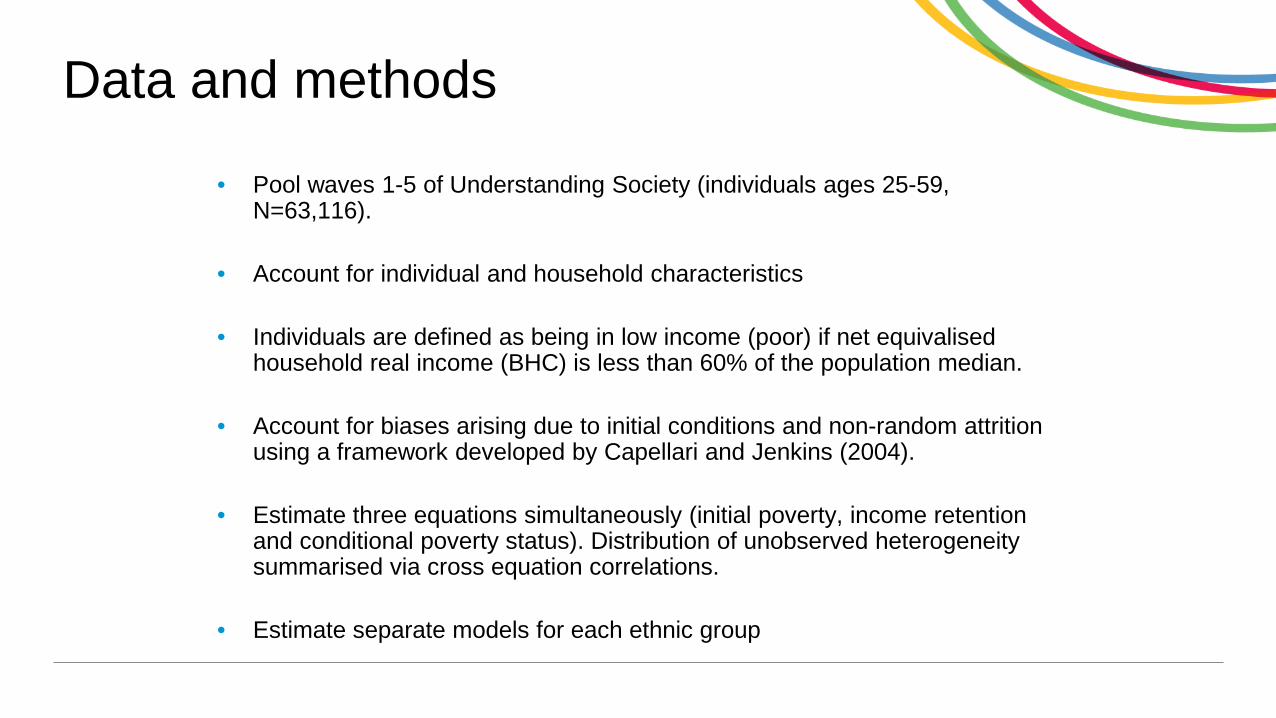
Data and methods
• Pool waves 1-5 of Understanding Society (individuals ages 25-59, N=63,116).
• Account for individual and household characteristics
• Individuals are defined as being in low income (poor) if net equivalised household real income (BHC) is less than 60% of the population median.
• Account for biases arising due to initial conditions and non-random attrition using a framework developed by Capellari and Jenkins (2004).
• Estimate three equations simultaneously (initial poverty, income retention and conditional poverty status). Distribution of unobserved heterogeneity summarised via cross equation correlations.
• Estimate separate models for each ethnic group
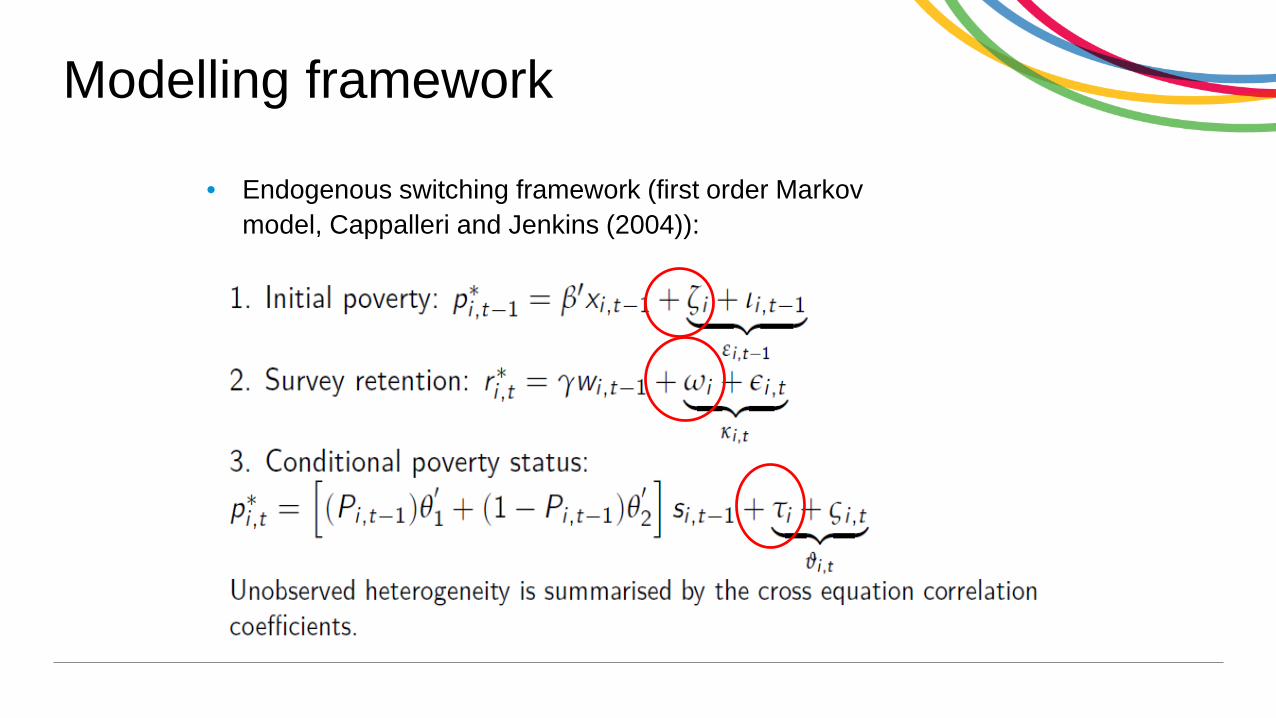
Modelling framework
• Endogenous switching framework (first order Markov model, Cappalleri and Jenkins (2004)):
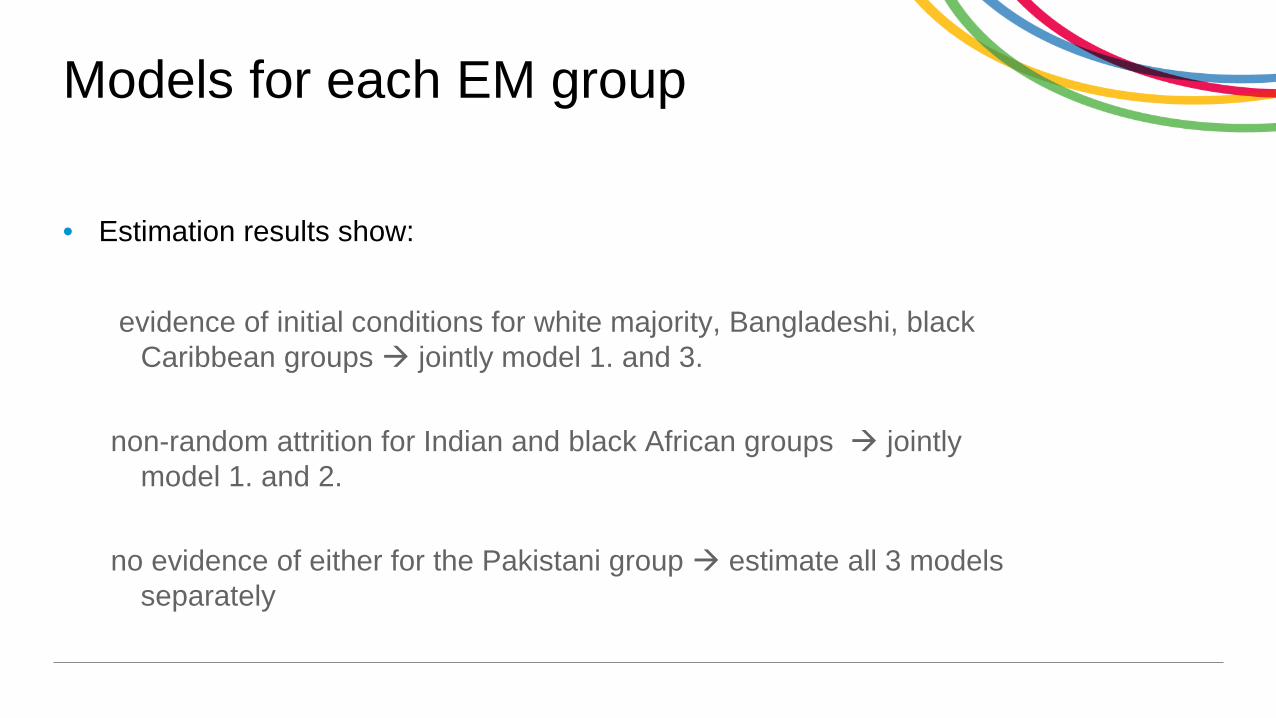
Models for each EM group
• Estimation results show:
evidence of initial conditions for white majority, Bangladeshi, black Caribbean groups jointly model 1. and 3.
non-random attrition for Indian and black African groups jointly model 1. and 2.
no evidence of either for the Pakistani group estimate all 3 models separately
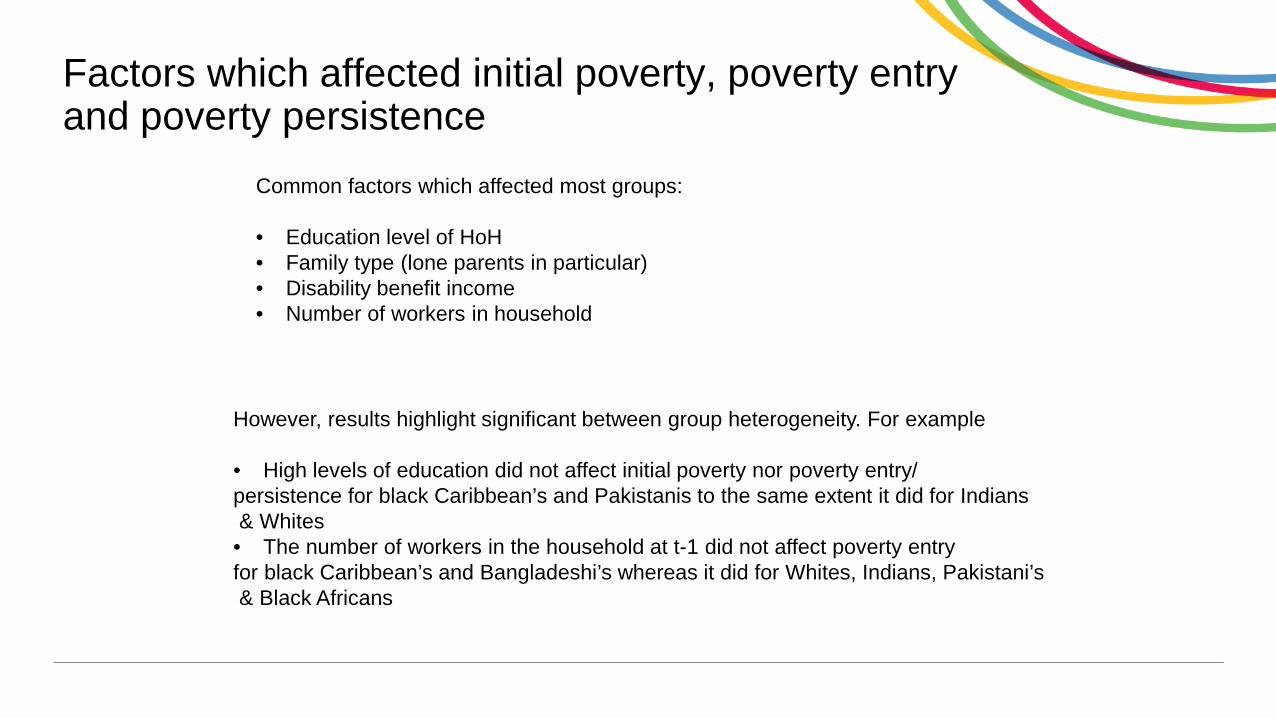
Factors which affected initial poverty, poverty entry and poverty persistence
Common factors which affected most groups:
• Education level of HoH• Family type (lone parents in particular)• Disability benefit income • Number of workers in household
However, results highlight significant between group heterogeneity. For example
• High levels of education did not affect initial poverty nor poverty entry/persistence for black Caribbean’s and Pakistanis to the same extent it did for Indians& Whites• The number of workers in the household at t-1 did not affect poverty entryfor black Caribbean’s and Bangladeshi’s whereas it did for Whites, Indians, Pakistani’s& Black Africans
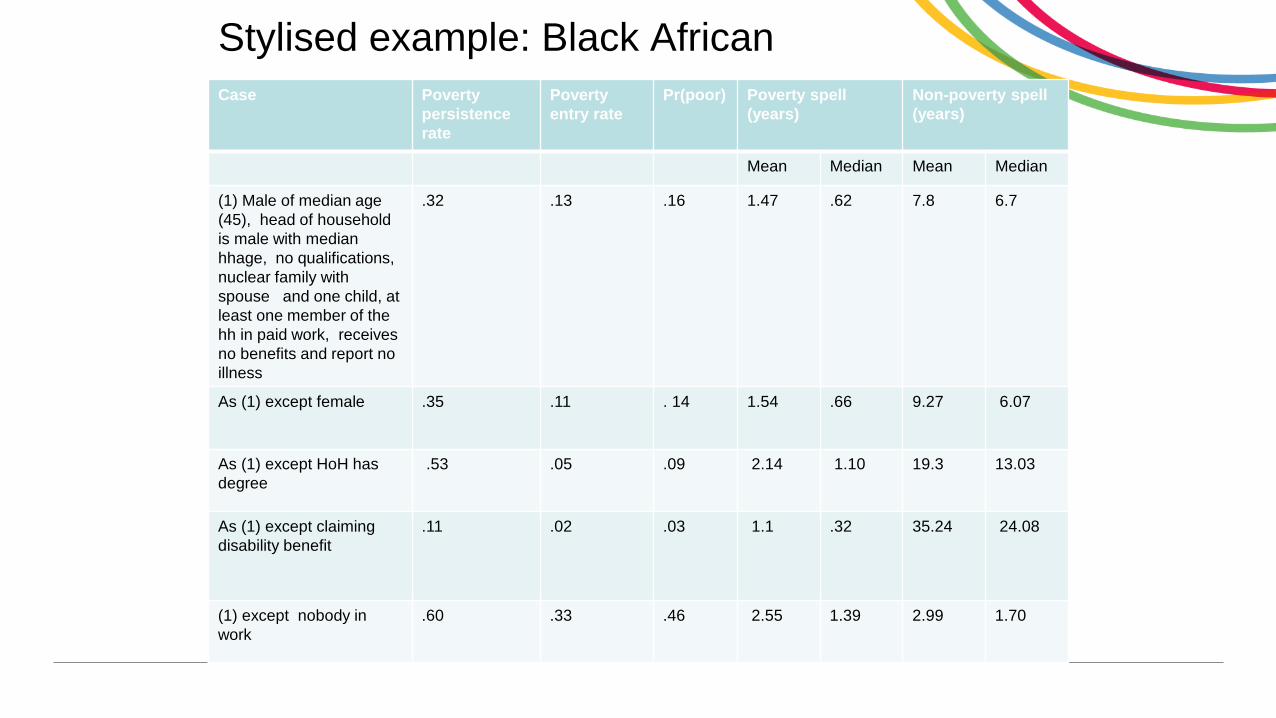
Stylised example: Black AfricanCase Poverty
persistencerate
Poverty entry rate
Pr(poor) Poverty spell (years)
Non-poverty spell (years)
Mean Median Mean Median
(1) Male of median age (45), head of household is male with median hhage, no qualifications, nuclear family with spouse and one child, at least one member of the hh in paid work, receives no benefits and report no illness
.32 .13 .16 1.47 .62 7.8 6.7
As (1) except female .35 .11 . 14 1.54 .66 9.27 6.07
As (1) except HoH has degree
.53 .05 .09 2.14 1.10 19.3 13.03
As (1) except claimingdisability benefit
.11 .02 .03 1.1 .32 35.24 24.08
(1) except nobody in work
.60 .33 .46 2.55 1.39 2.99 1.70
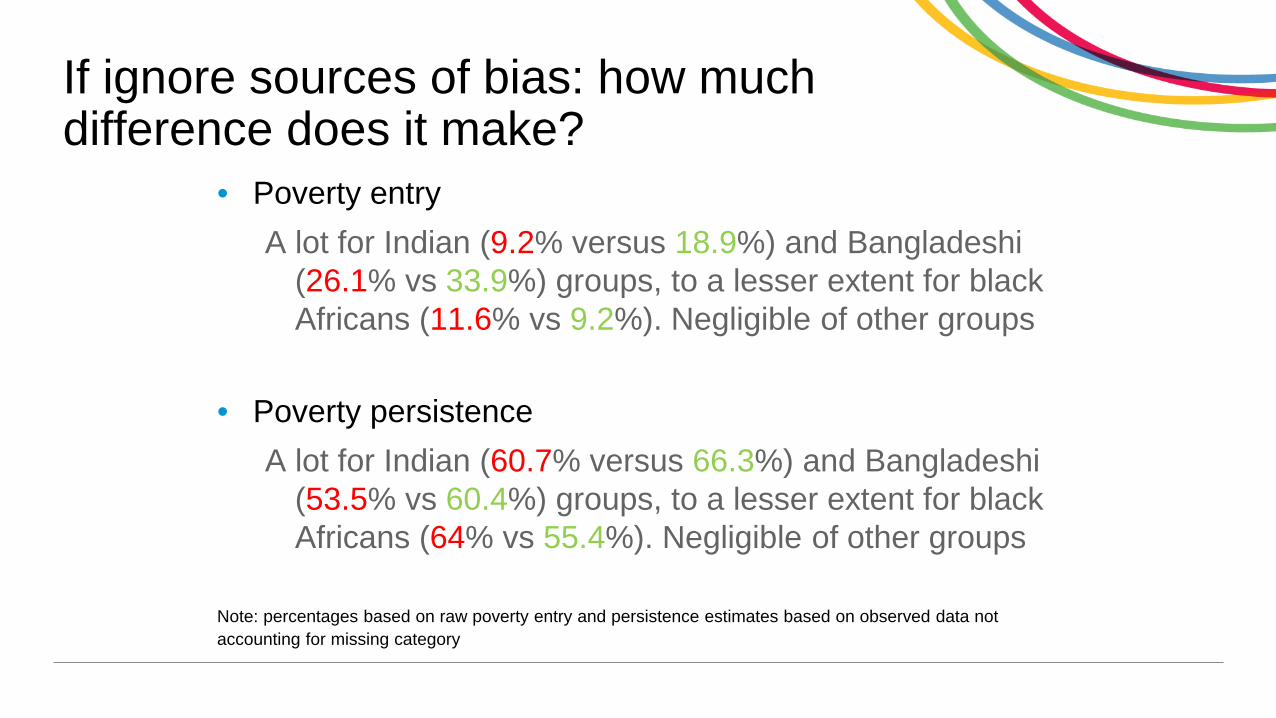
If ignore sources of bias: how much difference does it make?
• Poverty entryA lot for Indian (9.2% versus 18.9%) and Bangladeshi
(26.1% vs 33.9%) groups, to a lesser extent for black Africans (11.6% vs 9.2%). Negligible of other groups
• Poverty persistence A lot for Indian (60.7% versus 66.3%) and Bangladeshi
(53.5% vs 60.4%) groups, to a lesser extent for black Africans (64% vs 55.4%). Negligible of other groups
Note: percentages based on raw poverty entry and persistence estimates based on observed data not accounting for missing category
Scarring effects of being in poverty
• Does being in poverty last year affect likelihood of being poor in current year, even after controlling for observable and unobservable characteristics.
• Yes, results show that GSD account for large proportion of ASD for all groups.
Conclusions
• First estimates of low income dynamics for ethnic minority groups accounting for two important potential sources of bias
• For researchers and policy analysts: group specific framework for modelling low income dynamics
• Substantial variation between and within group heterogeneity
• GSD accounts for a large proportion of ASD across all ethnic groups; but less than white majority.
• Current work: Exploring variation in poverty entry and persistence rates by group- implications for policy.