

CLOSER Conference · CLOSER Conference Neighbourhood 1: Neighbourhood & mental health Chair: Emily...
88
CLOSER Conference Neighbourhood 1: Neighbourhood & mental health Chair: Emily Murray • Does your childhood neighbourhood have a bearing on self-rated health in later life? Owen Nicholas • A longitudinal study of neighbourhood effects on trajectories of depressive symptoms using data from the Avon Longitudinal Study of Parents and Children (ALSPAC) Alex Kwong • "Does my neighbourhood make me ill?" Exposure to small-area disadvantage and health trajectories over time Lucy Prior • Testing for critical periods of neighbourhood effects across the life course on mid-to-later life health and well being Stephen Jivraj Twitter: #CLOSERConf WIFI: BL-GUEST-CONF Password: BLgue5T23
Transcript of CLOSER Conference · CLOSER Conference Neighbourhood 1: Neighbourhood & mental health Chair: Emily...

CLOSER ConferenceNeighbourhood 1: Neighbourhood & mental healthChair: Emily Murray
• Does your childhood neighbourhood have a bearing on self-rated health in later life?Owen Nicholas
• A longitudinal study of neighbourhood effects on trajectories of depressive symptoms using data from the Avon Longitudinal Study of Parents and Children (ALSPAC)Alex Kwong
• "Does my neighbourhood make me ill?" Exposure to small-area disadvantage and health trajectories over timeLucy Prior
• Testing for critical periods of neighbourhood effects across the life course on mid-to-later life health and well beingStephen Jivraj
Twitter: #CLOSERConfWIFI: BL-GUEST-CONFPassword: BLgue5T23

Would growing up in neighbourhoods with less material deprivation have led to better later life self-rated health in the National Child Development Study cohort (1958)?
Owen Nicholas1, Emily Murray1, Paul Norman2, Stephen Jivraj1
“A lifecourse approach to Neighbourhood Effects” Leverhulme Trust Grant
1 University College London, UK. 2 University of Leeds, UK.
Leverhulme grant data
National Child Development Study (NCDS)• 1958 1-week birth cohort• England Scotland and Wales• N=18,554• followed through their lives to present day
linked to
Leverhulme grant data
Census• England, Scotland and Wales• 1971,1981,1991,2001, and 2011
Geography• Lower Super Output Area/Data Zones, 1,500 people, 2011 boundaries• 40,000 “neighbourhoods”
Townsend index combines levels of: • unemployment (of those who are economically active)• non-car ownership• non-home ownership and • household overcrowding (of all households) to measure neighbourhood material deprivation

Outline
Birth cohort
Data
Questions
Operational framework (crude)
Answers
Conclusions

Birth cohortThe interdependence of neighbourhood characteristics and mother’s/family characteristics

In a week in 1958…
For a given neighbourhood, women in that neighbourhood were more or less likely to give birth depending on their characteristics.
Those chances varied from neighbourhood to neighbourhood depending on contemporary neighbourhood characteristics.
Births were assigned randomly according to these chances and the characteristics at birth of the cohort member depended on contemporary woman’s family and neighbourhood characteristics.
In this talk I will conflate “woman” and “family”.

DataWhat data am I going to use in this talk? Not very much.

Timeline of data
Cohort member’s age
0 10 3316
Exposure Outcome
Sex of cohort
member
Father’s occupational
classNeighbourhood
TownsendsSelf-rated health at
33,36,43,50,55
Residential neighbourhood &prior number of
moves
13
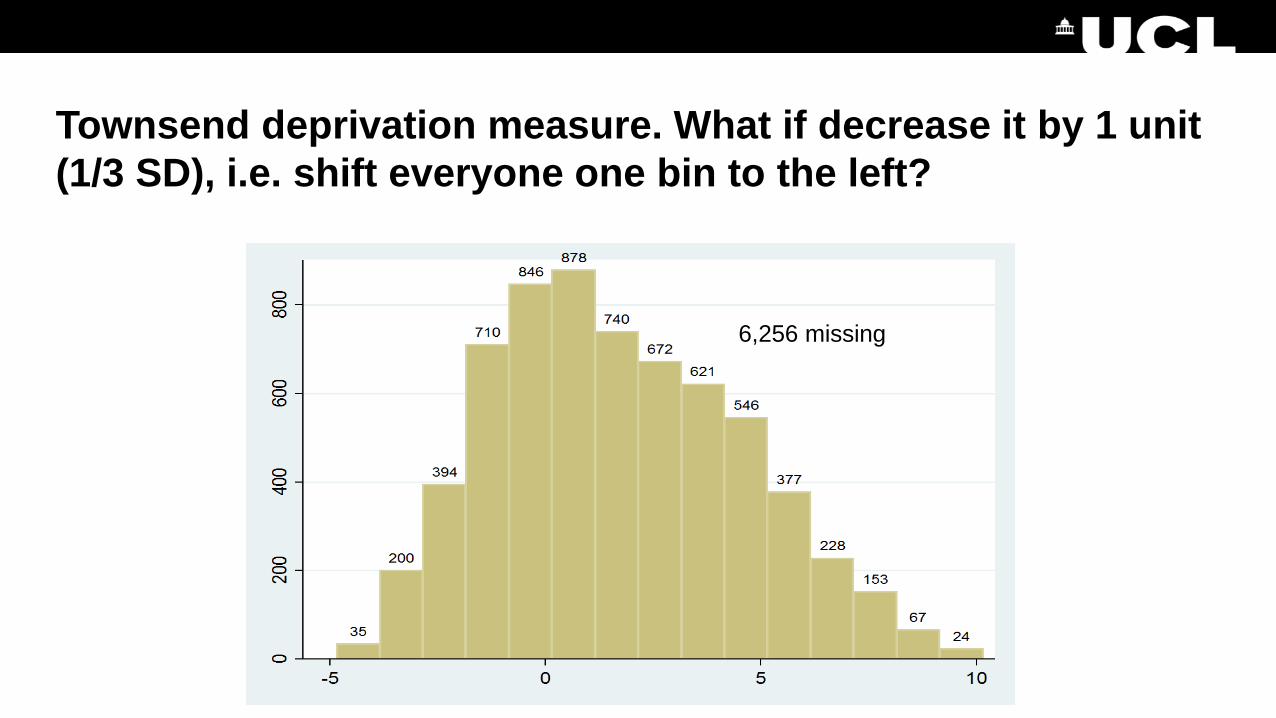
Townsend deprivation measure. What if decrease it by 1 unit (1/3 SD), i.e. shift everyone one bin to the left?
6,256 missing
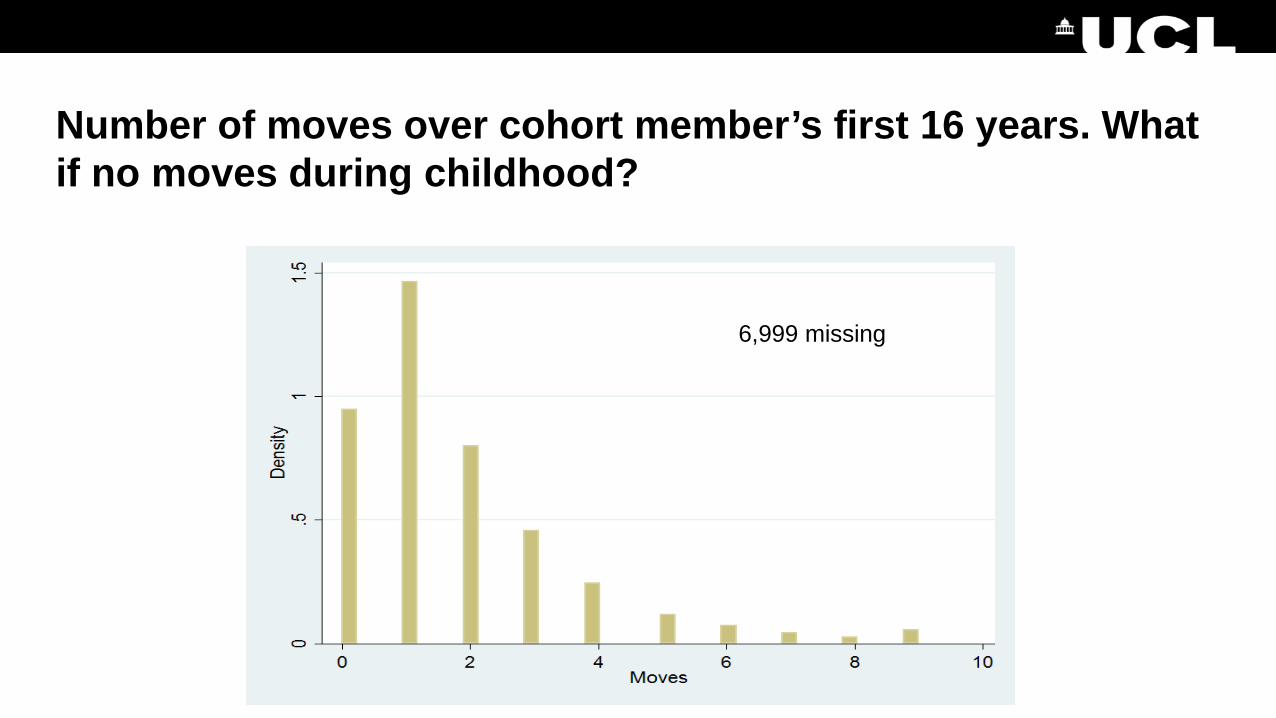
Number of moves over cohort member’s first 16 years. What if no moves during childhood?
6,999 missing

Sex
Sex
Male 9,596
Female 8,958

Father’s occupational class
ClassNot applicable 625SC III manual 2,575SC III non-man. 582SC IV manual 913SC IV non-manual 104Social class I 295Social class II 1,073Social class V 327
3,283 missing

Outcome various measures of self-rated health (SRH) at 33 and 55.
Self-rated health at 33 CountExcellent 2,213Good 3,445Fair 733Poor 103
I will assume that missing data in self-rated health is not an effect of contemporaneous self-rated health
7,283 missing

Stability of dataUnder time and motion

For convenience I am going to assume thatFather’s occupational class is stable under moves and time
• so I can take value at age 10 to be value at age 0
and so too is Townsend
• the data tells us that the variability of neighbourhood Townsend over 13 years is 15% of between neighbourhood variability in Townsend so good correlation
• however there is evidence from BHPS1 that new births lead to moves to better areas, and unemployment leads to moves to worse areas
I will take the value of Townsend age 13 for neighbourhood age 16 to be the value at age 0
• “measurement error” which might lead to regression dilution bias• it would be better to impute both quantities for age 01 Birgitta Rabe (2010) JRSS A

Interventional questionsWhat might have happened if…?

Perhaps we can address the following two interventional questions
(1) If each cohort member had been born in a neighbourhood with 1 unit better Townsend
(2) and had grown up without moving
would later life self-rated health have been better in this cohort?
(2) is appealing because it might provide convincing information about “childhood neighbourhood effects” as the birth neighbourhood remains counterfactually unchanged during childhood

Operational frameworkIgnoring a lot of detail at my peril

Question 1: Baseline and follow up
Neighbourhood characteristics
Family characteristics
Outcome
• No common causes since we had a random draw from a joint distribution of baseline neighbourhood and family characteristics
• Within levels of family characteristics, back door paths from neighbourhood characteristics to outcome are blocked

Effect of neighbourhood characterised by its Townsend measure
Neighbourhood Townsend
Family characteristics
Outcome
Within levels of family and member characteristics and C we can estimate the association of neighbourhood Townsend with outcome
• to estimate the effect that a neighbourhood with that Townsend has on the outcome
Cohort member characteristics
C
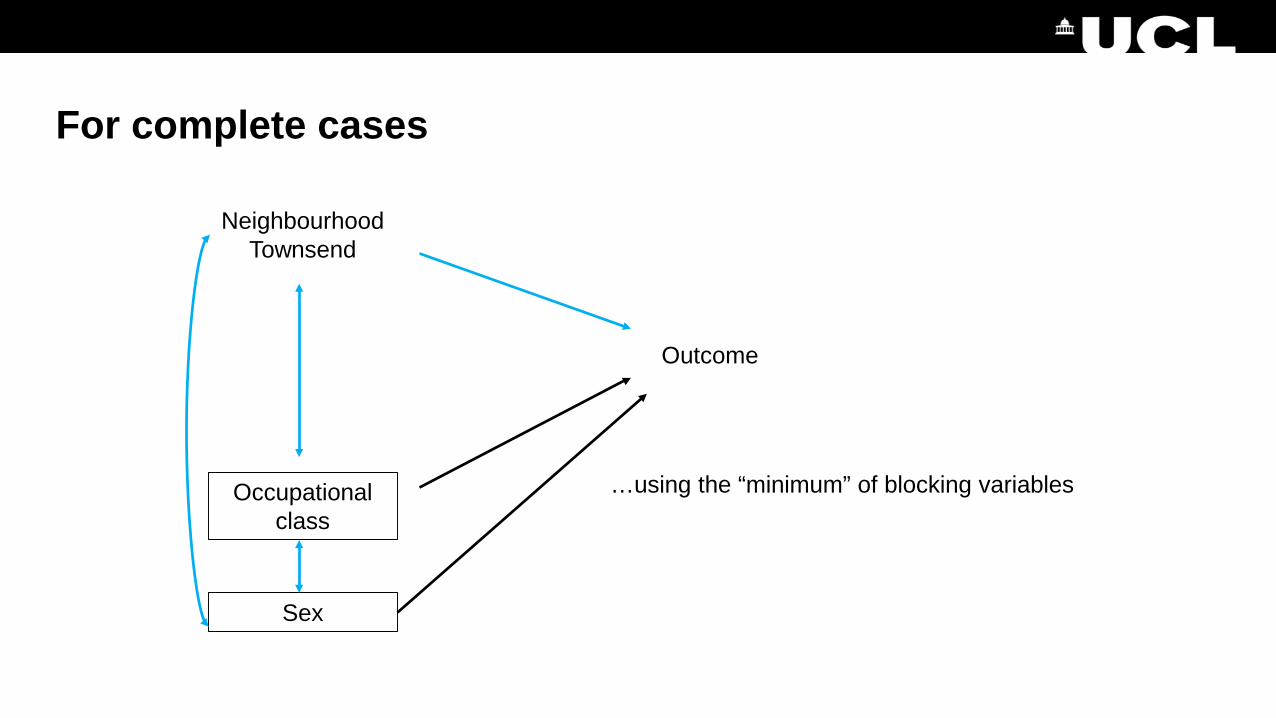
For complete cases
Neighbourhood Townsend
Occupational class
Outcome
…using the “minimum” of blocking variables
Sex

Self-rated health at age 33. N = 11,291.Red bars are estimates of 1 unit change in Townsend.
Proportional odds1.042 (1.021-1.063)

Self-rated health at age 55. N = 11,291.
Proportional odds1.031 (1.014-1.050)

Question 2We need to include moves as an intermediate variable

The naïve analysis
Neighbourhood Townsend
Occupational class
Moves up to 16
Sex
Outcome at 33
This time we want to intervene jointly on• moves up to 16 (set it to zero)• neighbourhood Townsend (decrease it by 1)
Unmeasured common causes

Self-rated health at age 33. N = 11,291.(i) Moves = 0(ii) Townsend = Townsend-1
Proportional odds1.048 (1.022-1.074)

Self-rated health at age 55. N = 11,291.(i) Moves = 0(ii) Townsend = Townsend-1
Proportional odds1.024 (1.006-1.043)

ConclusionsAt last

I assumed that• father’s occupational class and cohort member’s sex are sufficient to block
back door paths• there were no strong extra common causes
– both these assumptions are questionnableand that father’s occupational class and neighbourhood Townsend are stable
– probably ok, but need some imputationand that there was no effect of the final outcome on missing data.
I found having a birth neighbourhood of lower Townsend to lead to sustained improvement on self-rated health in cohort members of the National Child Development Study who had sufficient relevant data
– this needs to be extended to the full cohort.
Thank [email protected]

MRC Integrative Epidemiology Unit
A longitudinal study of neighbourhood effects on trajectories of depressive symptoms using data from the Avon Longitudinal Study of Parents and Children (ALSPAC)
Alex Kwong, George Leckie, Nic Timpson & David ManleySchool of Geographical Sciences/Centre for Multilevel Modelling/MRC Integrative Epidemiology Unit1/11/2017
@asfkwong

MRC Integrative Epidemiology Unit
Contents
• Why study depression?• Neighbourhood effects on depression• Current study: Neighbourhoods and trajectories of DS

MRC Integrative Epidemiology Unit
Why study depression?
• Depression is a common mental illness which affects more than 300 million people worldwide (World Health Organisation, 2017)
• Associated with: • Increased substance use • Impaired educational attainment• Increased risk of suicide (Thapar et al., 2012)
• Predicted by:• Gender• Genetics• Early life experiences
• Identifying mechanisms is important for treatments and interventions

MRC Integrative Epidemiology Unit
Neighbourhood effects on depression
• Research indicates that neighbourhood deprivation (ND) is positively associated with depression & depressive symptoms (DS)• People living in high ND are more likely to be exposed to:
• Violence/criminal behaviour• Noise pollution• Fewer access to health resources
• ND may act as a buffer or stressor for DS (Kim, 2008)• Females at greater risk of DS from ND (O’Campo et al., 2015)
• HOWEVER – not universal across the literature• Mixed findings from systematic reviews – perhaps no neighbourhood effects
(Richardson et al., 2015)

MRC Integrative Epidemiology Unit
Neighbourhood effects on depression (cont…)
• ALSO:• Most studies use cross sectional designs OR• Case-control studies OR• Poorly modelled using inadequate models
• Problems with reverse causation/selection bias• Can use longitudinal data (with repeated measures) to overcome some of the challenges
• Neighbourhood stress positively associated with depressive symptoms at 13 and 18 (Solmi et al., 2017)
• Can extend this to examine how depressive symptoms change over a period of time

MRC Integrative Epidemiology Unit
The current study
• How neighbourhood deprivation at birth might influence DS trajectories across childhood, through adolescence and into young adulthood:• Lasting effects of early ND?• Greater susceptibility for females?
• Use rich longitudinal data over a 24ish year period• With DS data over a 14 year period
• Use multilevel modelling to estimate trajectories
• Disclaimer: • So far we have only explored ND at birth and trajectories
• Will be getting more data soon

MRC Integrative Epidemiology Unit
Methods
• Participants were from the Avon Longitudinal Study of Parents and Children (ALSPAC)• Outcome:
• Depressive symptoms – measured via the short mood and feelings questionnaire (SMFQ)
• A 13 item questionnaire, validated in numerous studies (Turner et al., 2014; McKenzie et al., 2012)
– 0-26 where 26 is max depression• Measured on 8 occasions – from late childhood (10.65 years) to young adulthood (22.8 years)

MRC Integrative Epidemiology Unit
Methods (cont…)
• Predictors/covariates• Townsend deprivation index (quartiles)
• Low, low to moderate, moderate & high• Gender – Identified at birth• Maternal SES at birth
• Used multilevel modelling with a random intercept and random slope model to estimate trajectories of DS• 3 level longitudinal model
• Occasions within individuals within neighbourhoods

MRC Integrative Epidemiology Unit
Sample description
• We had 8172 individuals with data on ND and at least one measurement of the SMFQ:• Resulting in 35,149 measurements
• We had 6690 individuals when including SES as a covariate• Resulting in 30,074 measurements• Graphs reported are adjusted for SES

MRC Integrative Epidemiology Unit
Results – All deprivation with DS

MRC Integrative Epidemiology Unit
Results – Low vs high deprivation

MRC Integrative Epidemiology Unit
Results – Low-to-mod vs moderate deprivation

MRC Integrative Epidemiology Unit
Results – Low vs high deprivation with gender

MRC Integrative Epidemiology Unit
Results – Low males vs high females
MRC Integrative Epidemiology Unit
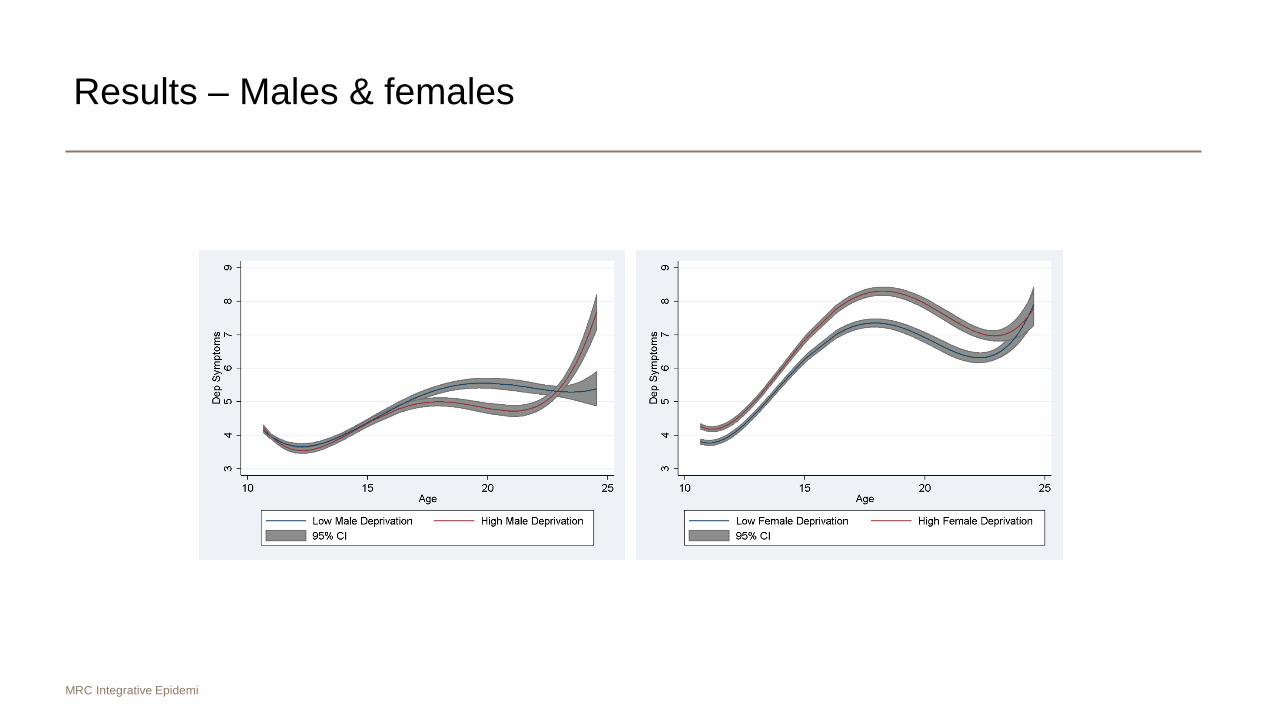
Results – Males & females

MRC Integrative Epidemiology Unit
Discussion
• Neighbourhood deprivation (ND) seems to be positively associated with trajectories of depressive symptoms• Effect mainly driven between low and high ND• But also through gender as well
• Highlighted by low male deprivation vs high female deprivation• Females more susceptible to ND that has lasting effects on DS?
• Results remain after adjusting for SES• Some evidence that ND at birth is independent of personal and household
characteristics

MRC Integrative Epidemiology Unit
Discussion (cont…)
• Low ND early in life may protect against later DS• High ND early in life may predispose someone to higher DS• Not enough to establish causality
• But ND may be one mechanism that contributes to DS• Gender may play a role in the association between ND and DS
• High ND females had the highest trajectories• Support and interventions could be aimed at females early on to prevent/reduce this
• BUT: • Contrasts previous research that females moving into high ND at birth have better DS (Brazil
& Clark, 2017)– Need to untangle this relationship further

MRC Integrative Epidemiology Unit
Strengths and weaknesses
• We use individual level longitudinal data over a 24ish year period• With repeated measures of DS
• Large sample size > 6000• Appropriately modelled using MLM
• BUT:• Only have ND data at birth
• Results may change when we include later ND • Only have included SES but some evidence suggests life course events remove association
between ND and DS• Will need to explore this further in our analysis

MRC Integrative Epidemiology Unit
Conclusion
• The ND research is mixed and findings still unclear• ND may act as a stressor or buffer for depression or DS
• OR no effects of ND on DS at all…• We provide evidence for higher ND impacting on trajectories of DS
• High deprivation females maybe at the most risk of DS• Interventions/support to help those at risk
• In order to establish causality we need rich longitudinal data • With better methods

MRC Integrative Epidemiology Unit
Acknowledgements
• Thank you!
• Hannah Sallis• Evie Stergiakouli• Oliver Davis
• The ALSPAC team and families & the ESRC
@asfkwong

Does my neighbourhood make me ill?Exposure to small-area disadvantage and health trajectories over time
09 November 2017
51Email: [email protected]
Lucy Prior, David Manley, and Kelvyn Jones
This work is funded by a PhD Scholarship on the Advanced Quantitative Methods pathway by the ESRC

Research Questions
• How does mental health change over time?• What is the variation in mental health trajectories over time?• Are mental health inequalities evident in terms of sex,
socioeconomic position and low social capital?• Does heightened exposure to area deprivation relate to worse
mental health over time?
Email: [email protected] 53
09 November 2017

Data
British Household Panel Survey (BHPS) (1991-2009)~10,000 individuals ~5,000 households
Understanding Society (UKHLS) (2010-2015)BHPS sample joined at Wave 2
UK Census 1991, 2001 and 2011
Email: [email protected] 54
09 November 2017
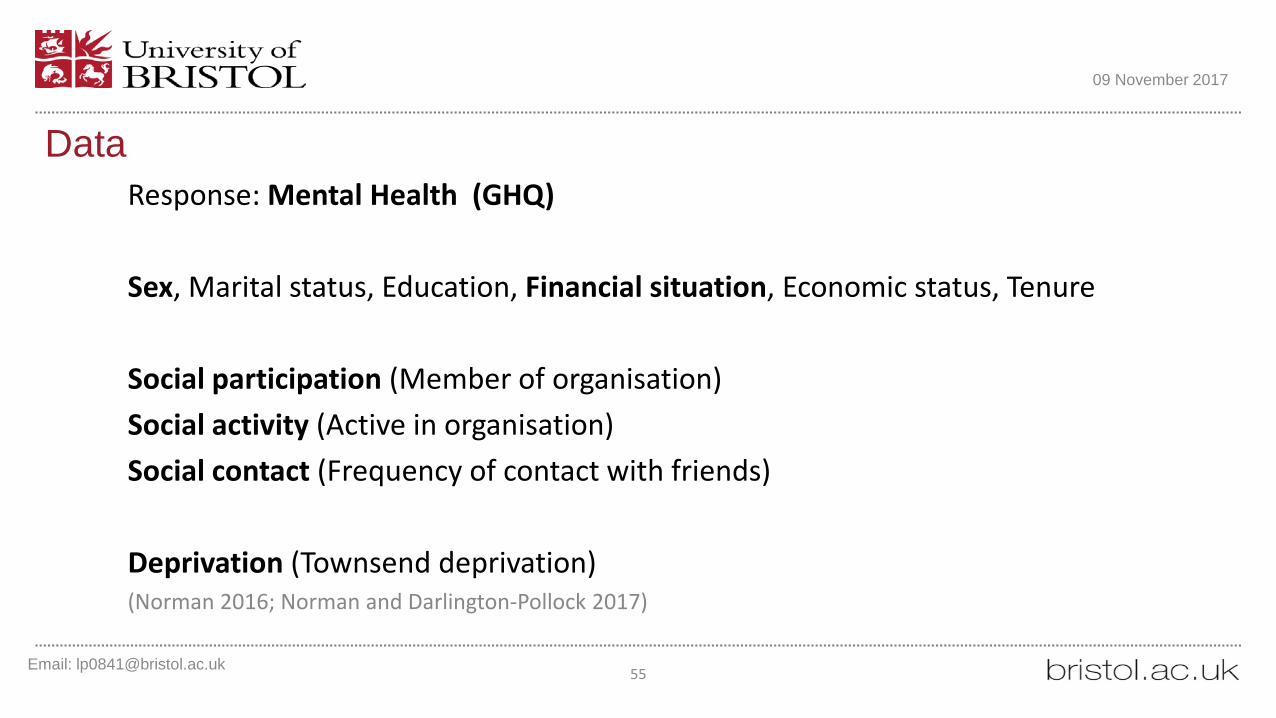
DataResponse: Mental Health (GHQ)
Sex, Marital status, Education, Financial situation, Economic status, Tenure
Social participation (Member of organisation)Social activity (Active in organisation)Social contact (Frequency of contact with friends)
Deprivation (Townsend deprivation) (Norman 2016; Norman and Darlington-Pollock 2017)
Email: [email protected] 55
09 November 2017
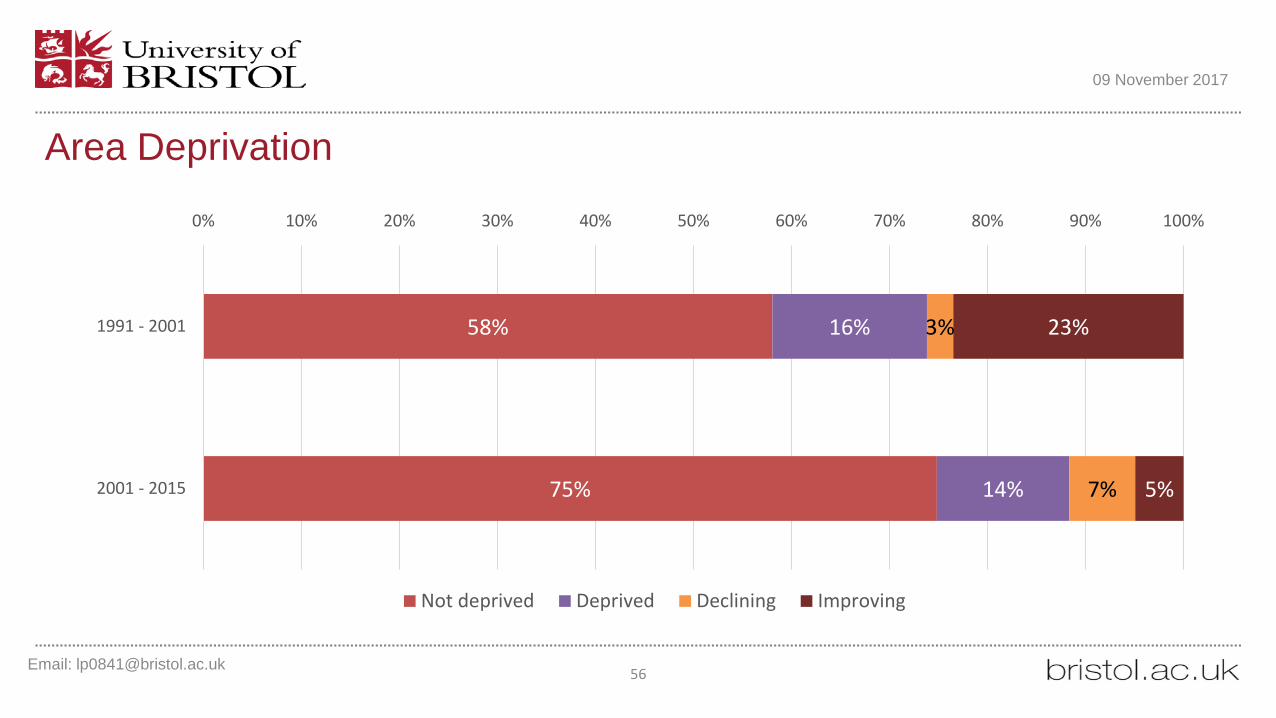
Area Deprivation
Email: [email protected] 56
09 November 2017
58%
75%
16%
14%
3%
7%
23%
5%
0% 10% 20% 30% 40% 50% 60% 70% 80% 90% 100%
1991 - 2001
2001 - 2015
Not deprived Deprived Declining Improving
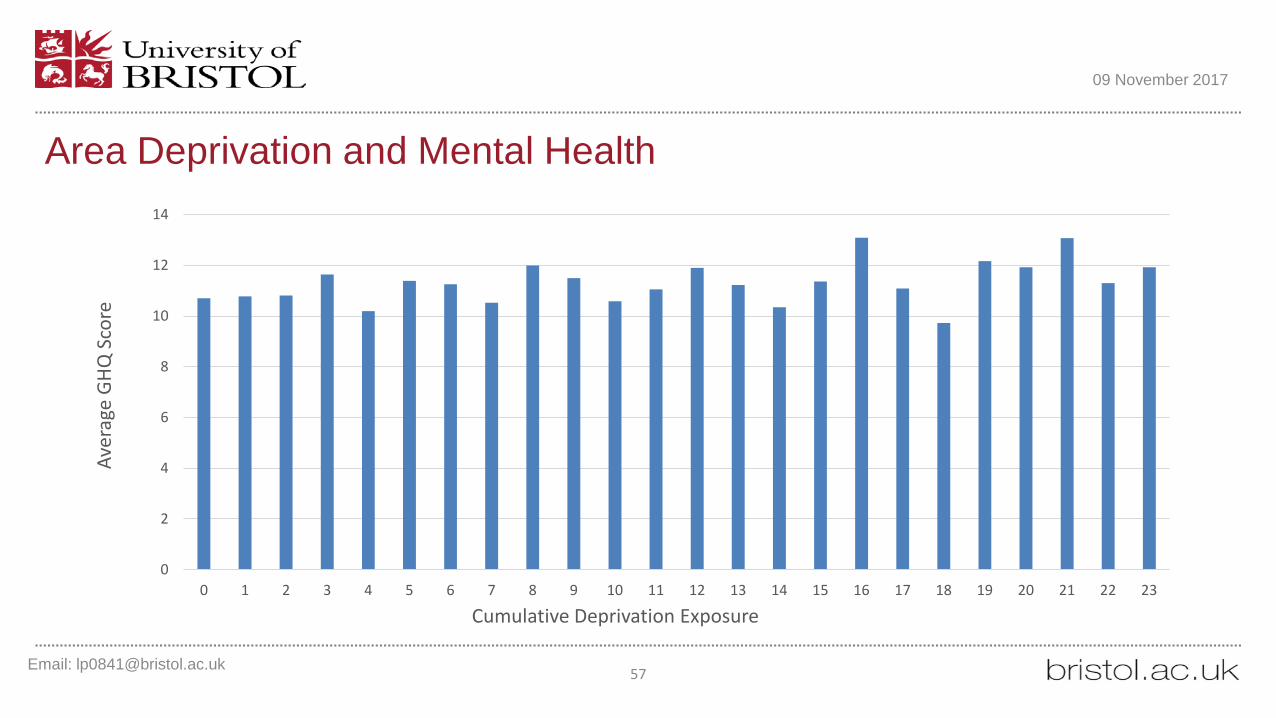
Area Deprivation and Mental Health
Email: [email protected] 57
09 November 2017
0
2
4
6
8
10
12
14
0 1 2 3 4 5 6 7 8 9 10 11 12 13 14 15 16 17 18 19 20 21 22 23
Aver
age
GHQ
Sco
re
Cumulative Deprivation Exposure

Health over time
Email: [email protected] 58
09 November 2017
5
6
7
8
9
10
11
12
13
14
15
1 2 3 4 5 6 7 8 9 10 11 12 13 14 15 16 17 18 19 20 21 22 23
GHQ
Sco
re
Wave

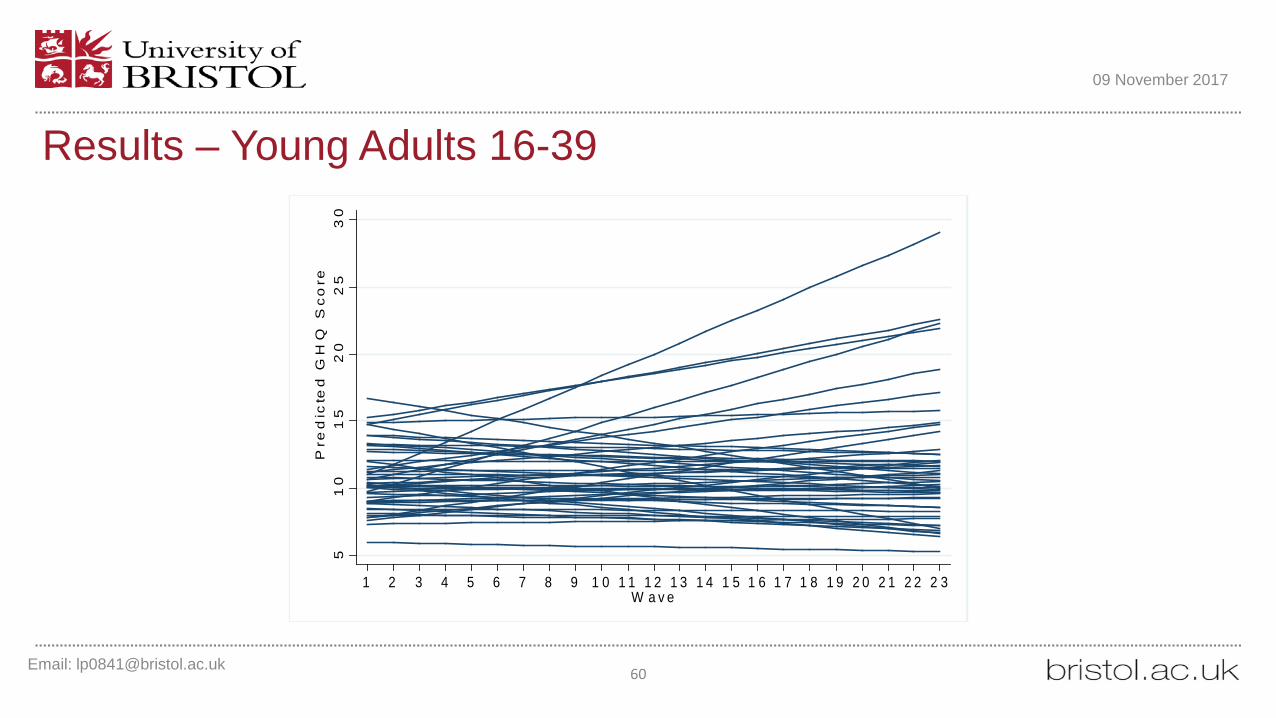
MethodsLife-course
Young adults (16-39) Middle aged (40-64)Older adults (65+)
Multilevel model growth curvesLevel 1 – ObservationsLevel 2 – Individuals Level 3 – Neighbourhoods
Email: [email protected] 59
09 November 2017
Email: [email protected] 60
09 November 2017
51
01
52
02
53
0P
red
icte
d G
HQ
Sc
ore
1 2 3 4 5 6 7 8 9 1 0 1 1 1 2 1 3 1 4 1 5 1 6 1 7 1 8 1 9 2 0 2 1 2 2 2 3W a v e
Results – Young Adults 16-39
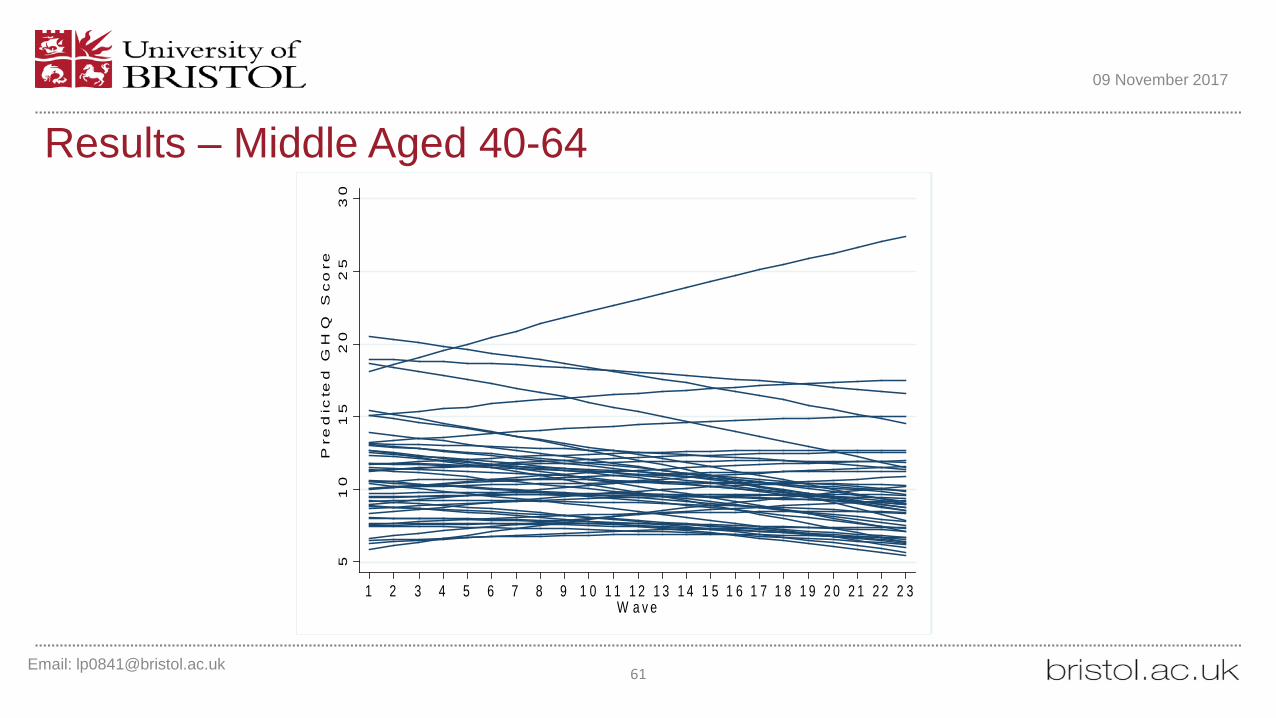
Results – Middle Aged 40-64
Email: [email protected] 61
09 November 2017
51
01
52
02
53
0P
red
icte
d G
HQ
Sc
ore
1 2 3 4 5 6 7 8 9 1 0 1 1 1 2 1 3 1 4 1 5 1 6 1 7 1 8 1 9 2 0 2 1 2 2 2 3W a v e

Results – Older Adults 65+
Email: [email protected] 62
09 November 2017
51
01
52
0P
red
icte
d G
HQ
Sc
ore
1 2 3 4 5 6 7 8 9 1 0 1 1 1 2 1 3 1 4 1 5 1 6 1 7 1 8 1 9 2 0 2 1 2 2 2 3W a v e

Email: [email protected] 63
09 November 2017
5
6
7
8
9
10
11
12
13
14
15
1 2 3 4 5 6 7 8 9 10 11 12 13 14 15 16 17 18 19 20 21 22 23
GHQ
Sco
re
Wave
Predicted
Observed
Time – Young Adults

Email: [email protected] 64
09 November 2017
Time – Middle Aged
5
6
7
8
9
10
11
12
13
14
15
1 2 3 4 5 6 7 8 9 10 11 12 13 14 15 16 17 18 19 20 21 22 23
GHQ
Sco
re
Wave
Predicted
Observed
Email: [email protected] 65
09 November 2017
5
6
7
8
9
10
11
12
13
14
15
1 2 3 4 5 6 7 8 9 10 11 12 13 14 15 16 17 18 19 20 21 22 23
GHQ
Sco
re
Wave
Predicted
Observed
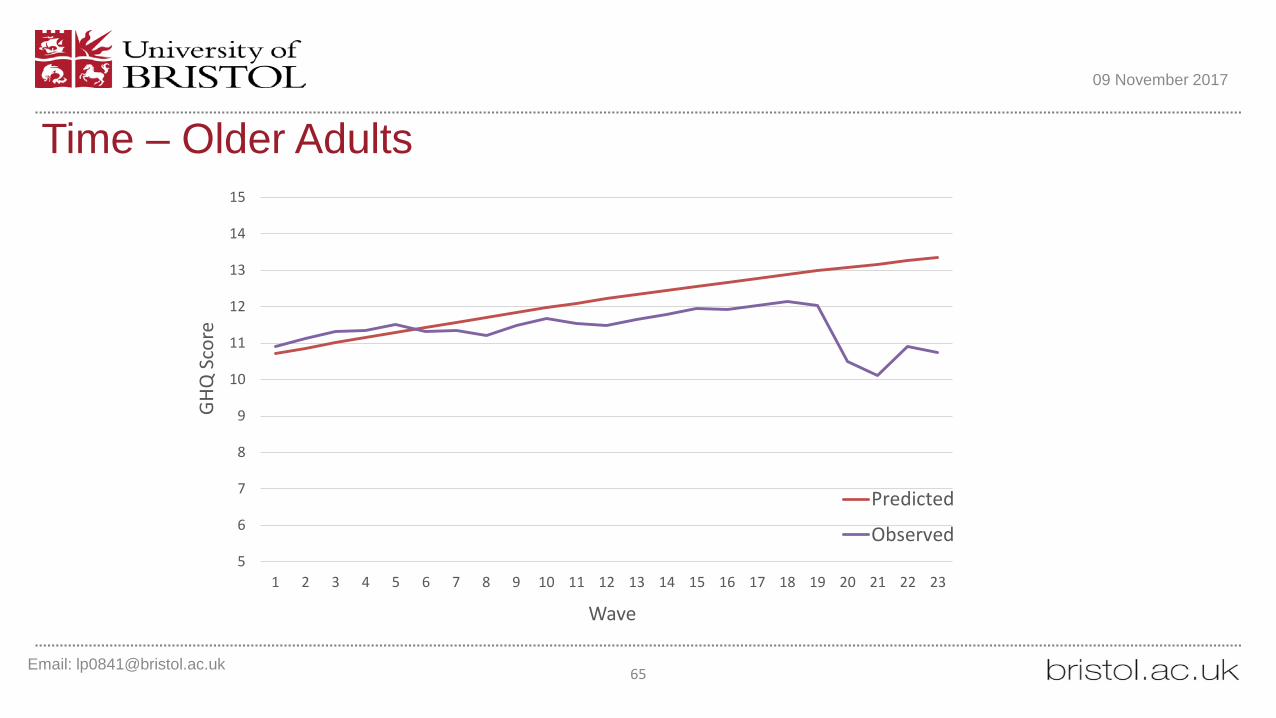
Time – Older Adults

Email: [email protected] 66
09 November 2017
Sex/Gender
9.5
10
10.5
11
11.5
12
12.5
Male Female
Pred
icte
d GH
Q S
core
Young Adults
Middle Aged
Older Adults

Email: [email protected] 67
09 November 2017
Financial Situation
9
10
11
12
13
14
Comfortable/Alright Just getting by Finding it difficult
Pred
icte
d GH
Q S
core
Young Adults
Middle Aged
Older Adults

Email: [email protected] 68
09 November 2017
Social Participation
9
9.5
10
10.5
11
11.5
12
12.5
13
Not a member Member
Pred
icte
d GH
Q S
core
Young Adults
Middle Aged
Older Adults

Email: [email protected] 69
09 November 2017
Social Activity
9
9.5
10
10.5
11
11.5
12
12.5
13
Not active Active
Pred
icte
d GH
Q S
core
Young Adults
Middle Aged
Older Adults

Email: [email protected] 70
09 November 2017
Social Contact
10
10.5
11
11.5
12
12.5
13
1 2 3 4 5 6 7 8 9 10 11 12
Pred
icte
d G
HQ S
core
Social Contact
Young AdultsMiddle AgedOlder Adults

Email: [email protected] 71
09 November 2017
Area Deprivation
9
9.5
10
10.5
11
11.5
12
12.5
13
Q1 Q2 Q3 Q4 Q5
Pred
icte
d GH
Q S
core
Young Adults
Middle Aged
Older Adults

Summary• There is considerable variation in trajectories of mental health over time• Women consistently demonstrate worse mental health• Those finding it difficult to get by have substantially worse mental health• Social activity and social participation are similarly related to mental health.• Degree of social contact relates to mental health, but only for the 16-39 year old
age group.• Exposure to area deprivation did not relate significantly to mental health over
time
Email: [email protected] 72
09 November 2017

Testing for critical period of neighbourhood effects across the life course on later life wellbeing
Stephen JivrajDepartment of Epidemiology and Public Health
University College London
With Owen Nicholas, Emily Murray and Paul Norman
CLOSER ConferenceBritish Library
1-2 November 2017
Department of Epidemiology and Public Health

Research questions
• How important are neighbourhood effects across the life course on health and wellbeing?
• Are these effects more important at certain points during the life course?

Data
• 1958 National Child Development Study and British Cohort Study 1970 birth cohort studies
• Linked to Townsend deprivation scores measured at censuses, 1971-2011 at 2011 lower super output boundaries

Outcome variables at age 42/55
• Self-rated health: in general, would you say your health is...– excellent, very good, good, fair or poor
• BMI: self-reported height and weight
• Mental wellbeing: Warwick-Edinburgh Mental Well-being (BCS70) and Control, Autonomy, Self-realisation and Pleasure (NCDS)

Exposure: Townsend deprivation index
• Inputs
• Unemployment
• Non-home ownership
• No car access
• Overcrowding

Statistical analysis
Age 16
Age 30/33
Age 42/55
1 2
• Cross-classified multilevel model
Study sweep
Neighbourhood
Cohort member

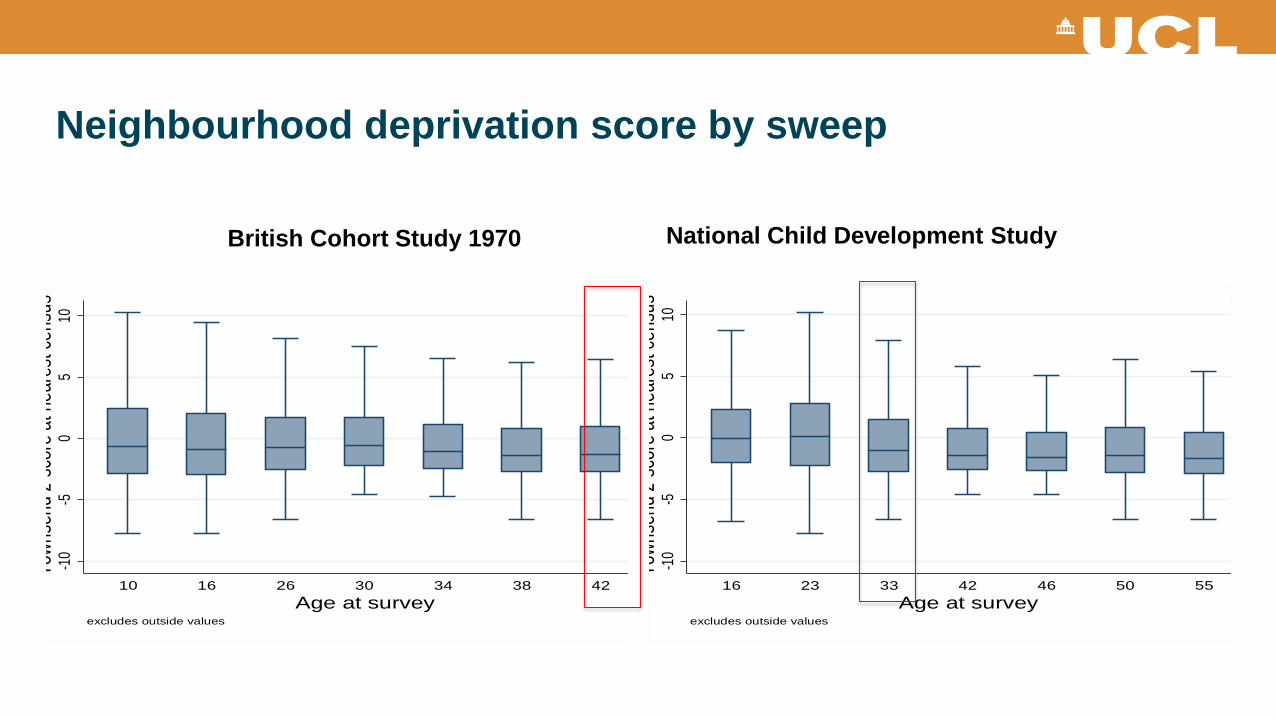
Neighbourhood deprivation score by sweep -1
0-5
05
10To
wnse
nd z
scor
e at n
eare
st ce
nsus
10 16 26 30 34 38 42Age at survey
excludes outside values
-10
-50
510
Town
send
zsc
ore a
t nea
rest
cens
us
16 23 33 42 46 50 55Age at survey
excludes outside values
British Cohort Study 1970 National Child Development Study

Poor-rated health (%) by neighbourhood deprivation decile
National Child Development Study British Cohort Study 1970
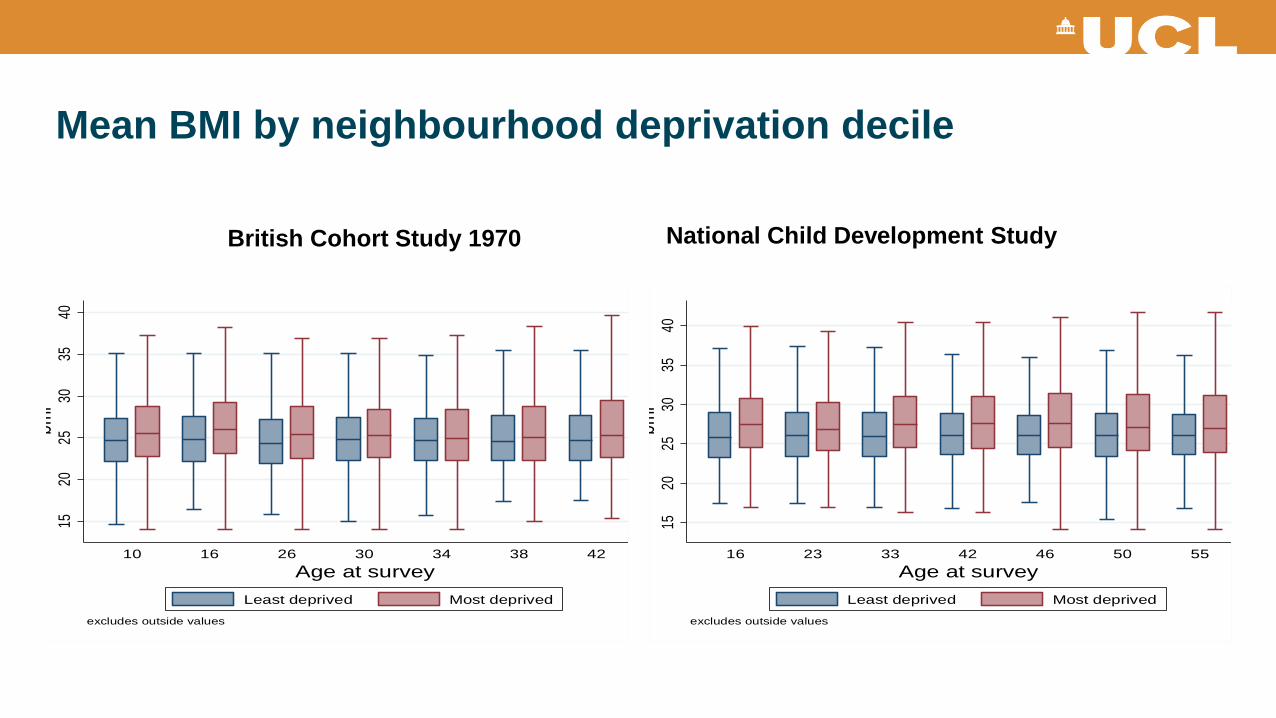
Mean BMI by neighbourhood deprivation decile15
2025
3035
40bm
i
10 16 26 30 34 38 42Age at survey
excludes outside values
Least deprived Most deprived
1520
2530
3540
bmi
16 23 33 42 46 50 55Age at survey
excludes outside values
Least deprived Most deprived
British Cohort Study 1970 National Child Development Study

Mean mental wellbeing by neighbourhood deprivation decile20
3040
5060
70we
mwbs
10 16 26 30 34 38 42Age at survey
excludes outside values
Least deprived Most deprived
05
1015
20ca
sp
16 23 33 42 46 50 55Age at survey
excludes outside values
Least deprived Most deprived
British Cohort Study 1970 National Child Development Study

Neighbourhood variance cross-classified variance components models
British Cohort Study 1970 National Child Development Study
Neighbourhood σ2 Neighbourhood σ2

Summary
• Neighbourhood effect is small across the life course (3-9% total variance)
• Neighbourhood variation is constant across the life course
• Neighbourhood deprivation-later life wellbeing association stronger in later life, except for BMI