CLNR Trial Analysis - RTTR for Underground · PDF filevarious cable circuits under...
38
Copyright Northern Powergrid (Northeast) Limited, Northern Powergrid (Yorkshire) Plc, British Gas Trading Limited, University of Durham, and EA Technology Ltd, 2014 CLNR Trial Analysis Real-Time Thermal Rating – Underground Cables DOCUMENT NUMBER CLNR-L131 AUTHORS Peter Davison, Newcastle University ISSUE DATE 22/12/2014
Transcript of CLNR Trial Analysis - RTTR for Underground · PDF filevarious cable circuits under...
Copyright Northern Powergrid (Northeast) Limited, Northern Powergrid (Yorkshire) Plc, British Gas Trading Limited, University of Durham,
and EA Technology Ltd, 2014
CLNR Trial Analysis
Real-Time Thermal Rating – Underground Cables
DOCUMENT NUMBER CLNR-L131 AUTHORS Peter Davison, Newcastle University ISSUE DATE 22/12/2014

1 Copyright Northern Powergrid (Northeast) Limited, Northern Powergrid (Yorkshire) Plc, British Gas Trading Limited,
University of Durham and EA Technology Ltd, 2014
Contents
1 Executive Summary ........................................................................................................... 3
2 Introduction ..................................................................................................................... 4
3 Real-Time Thermal Rating of Underground Cables ............................................................. 5
3.1 Introduction ................................................................................................................................ 5
3.1.1 Sustained Rating ..................................................................................................................... 5
3.1.2 Cyclic Rating ............................................................................................................................ 5
3.1.3 Distribution Rating .................................................................................................................. 5
3.2 Cable Model ................................................................................................................................ 5
4 Cable and Site Installation Details...................................................................................... 7
4.1 EHV Cable .................................................................................................................................... 7
4.2 HV Cable...................................................................................................................................... 7
4.3 LV Cable ...................................................................................................................................... 8
4.4 Nominal P17 Cable Ratings ........................................................................................................ 8
4.4.1 EHV and HV cables .................................................................................................................. 8
4.4.2 LV Site ...................................................................................................................................... 8
4.5 EHV and HV Site Installation ...................................................................................................... 9
4.6 LV Site Installation .................................................................................................................... 10
5 Sensitivity Analysis.......................................................................................................... 11
6 Ambient Parameters ....................................................................................................... 13
6.1 Influence of Ambient Air Temperature on Soil Temperatures ............................................... 13
6.2 Soil and Cable Temperatures ................................................................................................... 14
7 Load Currents ................................................................................................................. 15
7.1 EHV ............................................................................................................................................ 15
7.2 HV .............................................................................................................................................. 16
7.3 LV .............................................................................................................................................. 17
7.4 Peak Currents ........................................................................................................................... 17
8 Model Validation ............................................................................................................ 19
9 Sustained, Cyclic and Distribution Ratings ........................................................................ 20
9.1 Best and Worst Case Ambient Conditions ............................................................................... 21
9.1.1 EHV and HV Sites ................................................................................................................... 21
9.1.2 LV Site .................................................................................................................................... 22
2 Copyright Northern Powergrid (Northeast) Limited, Northern Powergrid (Yorkshire) Plc, British Gas Trading Limited,
University of Durham and EA Technology Ltd, 2014
9.2 EHV ............................................................................................................................................ 22
9.3 HV .............................................................................................................................................. 22
9.4 LV .............................................................................................................................................. 23
9.5 Comparison to existing P17 ratings ......................................................................................... 23
10 Real Time Thermal Rating Results .................................................................................... 25
10.1 Real Time Thermal Rating Cumulative Distribution Functions ........................................... 27
11 Load Scaling – Cable Temperature Analysis ...................................................................... 30
11.1 EHV Cable .............................................................................................................................. 31
11.2 HV Cable................................................................................................................................ 32
11.3 LV Cable ................................................................................................................................ 33
11.4 Final Load Scaling Results..................................................................................................... 34
12 Conclusions .................................................................................................................... 35
13 References ...................................................................................................................... 36
3 Copyright Northern Powergrid (Northeast) Limited, Northern Powergrid (Yorkshire) Plc, British Gas Trading Limited,
University of Durham and EA Technology Ltd, 2014
1 Executive Summary
This report details findings from the Underground Cable RTTR trials carried out as part of the CLNR
project. Trials have been carried out at 3 separate voltage levels covering a wide variety of cable
construction types. The CRATER and Dynamic CRATER cable rating tools provided by EA Technology
Ltd. have been used to generate the ratings in this analysis.
An analysis of the ambient parameters measured at each of the sites, in addition to a sensitivity
analysis of the model has been carried out. Ratings in line with those from P17 [1] have been
calculated to better represent the conditions at each of the monitoring sites for comparison.
Increased visibilities of conditions ‘at site’ are certain to give more accurate results than those from
tabulated, pre-determined conditions. To that end, soil thermal resistivities, soil ambient
temperatures and real-time loading values have been monitored. These will allow comparison, in
particular against the typically used Industry standard Load Curve G, used in the calculation of the
cable Cyclic and Distribution ratings.
At the HV and EHV sites even in the best case scenarios of low load, low ambient temperature and
low soil thermal resistivity a de-rating of the cable from the calculated P17 rating values appears to
be necessary. At the LV sites, in the best case scenarios, an increase over the P17 values is possible.
Both the EHV and LV cables are relatively lightly loaded, however the HV cable shows a peak
utilisation of 76.69% of the Sustained P17 rating.
Cumulative distribution functions of the observed RTTR values have been created, with percentiles
chosen to be representative of the percentage time for which an RTTR can be used with and without
some form of direct management.
At the HV site, with the most conservatively chosen percentile of the RTTR distribution a peak load
of 138.9% (352 A) of the original peak load can be accommodated. At the LV site with a similarly
chosen percentile a peak load of 382.37% (642 A) of the original is possible.

4 Copyright Northern Powergrid (Northeast) Limited, Northern Powergrid (Yorkshire) Plc, British Gas Trading Limited,
University of Durham and EA Technology Ltd, 2014
2 Introduction
This report details findings from the Underground Cable Real-Time Thermal Rating (RTTR) trials
carried out as part of the CLNR project. Power system components are limited in their current
carrying capacity by the conditions which surround them, in the case of Underground Cables, levels
of ambient soil temperature and soil thermal resistivity all affect the ability to transfer power. Higher
soil temperatures and soil thermal resistivities result in a reduced ability to transfer heat away from
the cable’s outer surface leading to reduced loading capability.
Real time thermal ratings (RTTRs) rely on real-time ambient conditions and necessary modelling
parameters to provide increased visibility with regards to asset capability. Within the scope of the
CLNR project, three cable voltage levels have been monitored in 2 locations. 33kV and 6kV
monitoring was carried out at the Rise Carr Primary substation site in Darlington, with 0.4kV
monitoring at the Darlington Melrose LV Secondary substation.
Equipment was installed at the LV substation in February 2013 and in November 2013 at the Rise
Carr HV and EHV sites. Details of the installation are given here, however the lessons learned report
which discusses the Underground Cable RTTR methods provides greater levels of detail.
The data analysis period for this report covers from initial installation to the end of October 2014.
Multiple cable and ambient parameters have been measured at each of the locations and will be
discussed in this report.
This report has used the CRATER and Dynamic CRATER modelling tools to generate the ratings of the
various cable circuits under investigation.
5 Copyright Northern Powergrid (Northeast) Limited, Northern Powergrid (Yorkshire) Plc, British Gas Trading Limited,
University of Durham and EA Technology Ltd, 2014
3 Real-Time Thermal Rating of Underground Cables
3.1 Introduction
As part of existing BAU network operation, 3 ratings exist for underground cables in the UK. These
are the Sustained rating, the Cyclic rating and the Distribution rating. Each has a particular meaning
and time of use but are all related [2].
3.1.1 Sustained Rating
This is essentially the steady-state rating of the conductor. The current rating is the maximum load
that can be applied, such that the pre-determined maximum conductor temperature is not
exceeded.
3.1.2 Cyclic Rating
Since power system loading is typically non-constant and can often be expressed as a time-repeating
cycle, appropriate increases can often be made to the Sustained rating, taking into account the
variable nature of the network loading. A 24 hour profile of normalised hourly load values has been
typically used (the industry standard Load Curve G) to generate cyclic ratings. This is the case in the
presently used standard for the rating of underground power cables, P17. The Cyclic rating relies on
prior calculation of the Sustained rating.
3.1.3 Distribution Rating
The distribution rating follows on from the cyclic rating in its approach. For typical operation a cyclic
scenario is present. An emergency then occurs at the peak of the cycle. The load increases whilst the
shape of the cycling load is maintained. At the end of the ‘emergency period’ the conductor
temperature has reached its maximum. Typically (and also for this report) Distribution ratings are
calculated for a utilisation of 50%, i.e. the pre-emergency peak is 50% of the emergency peak.
3.2 Cable Model
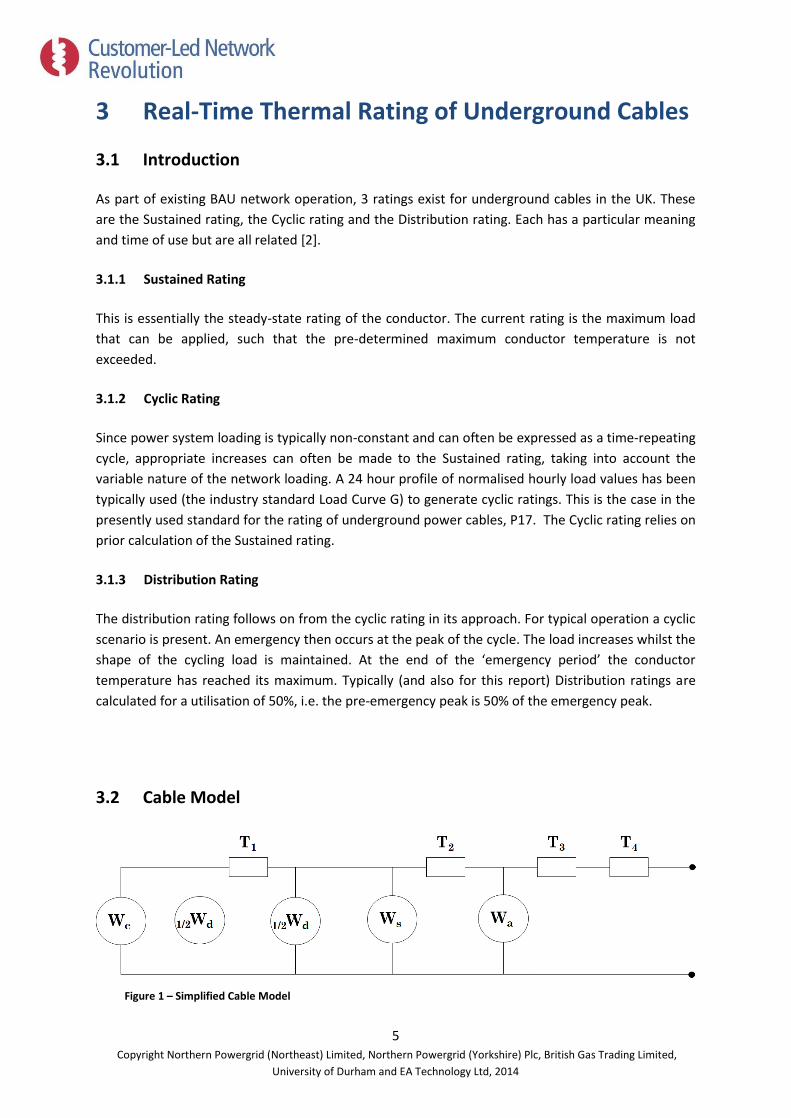
Figure 1 – Simplified Cable Model

6 Copyright Northern Powergrid (Northeast) Limited, Northern Powergrid (Yorkshire) Plc, British Gas Trading Limited,
University of Durham and EA Technology Ltd, 2014
In order to model the thermal response of the underground cable to changes in ambient parameters
a model of the cable and its various components is necessary. For this report the CRATER software
programme has been used to calculate the sustained, cyclic and distribution ratings of the cable,
however, as a brief introduction, the various components of the cable will be discussed.
An electrical analogy is often used to represent the various thermal exchanges both inside and
outside of the conductor construction. Thermal components are modelled as resistances and
capacitances and are formed into an RC ladder network, Figure 1 shows the simplified model of
underground cable where capacitances have been ignored at the present.
The components in circles represent the losses in various parts of the cable construction. Wc
represents the losses in the conductor, often expressed as the I2R losses. Wd represents losses in the
dielectric material (the insulation). Ws and Wa refer to losses in the sheath and armour respectively.
The ‘T’ components refer to the various thermal resistances, with T1 referring to the thermal
resistance between the conductor and the sheath, T2 is the thermal resistance of the bedding
between the sheath and the armour. T3 is the thermal resistance of the outer serving of the cable
and T4 is the thermal resistance between the cable outer surface and the cable surroundings.

7 Copyright Northern Powergrid (Northeast) Limited, Northern Powergrid (Yorkshire) Plc, British Gas Trading Limited,
University of Durham and EA Technology Ltd, 2014
4 Cable and Site Installation Details
Only basic installation details will be given here as the Lessons Learned report covering underground
cables contains more information regarding the site topography and installation methods of the
monitoring devices.
4.1 EHV Cable
This cable construction details which have been used to generate cable ratings using the CRATER
software are as follows:
Three single-core cables
240mm2 Aluminium stranded conductor
XLPE insulation
Installed in triplex formation, direct in the ground
Copper screened (area: 35mm2)
Nominal circuit voltage of 33kV
The modelled burial depth of the cable is 1000mm
Polyethylene outer covering
Max. Conductor temperature = 90oC
During the course of the trial, the EHV cable construction was altered to reflect the section which is
most likely to provide the thermal bottleneck for the circuit. After this alteration the cable is
assumed to have the following construction:
Three-core cable
0.3 in2 Aluminium stranded conductor
Paper insulation
Copper screened (area: 35mm2)
Nominal circuit voltage of 33kV
The modelled burial depth of the cable is 1000mm
Compounded jute and fibrous material outer covering
Max. Conductor temperature = 65oC
4.2 HV Cable
Three-core cable
0.2 in2 Copper stranded conductor
Paper insulation
Belted common lead sheath
Installed direct in the ground
Compounded jute and fibrous material outer covering
Nominal circuit voltage of 11kV (CRATER does not contain a 6kV function)
The modelled burial depth of the cable is 1000mm.
Max. Conductor temperature = 65oC

8 Copyright Northern Powergrid (Northeast) Limited, Northern Powergrid (Yorkshire) Plc, British Gas Trading Limited,
University of Durham and EA Technology Ltd, 2014
4.3 LV Cable
Three-core PILS/STA cable
0.3 in2 Copper shaped stranded conductor (modelled in CRATER as 185mm2)
Paper insulation
Belted common lead sheath
Installed direct in the ground
Compounded jute and fibrous material outer covering
Nominal circuit voltage of 0.4kV
Max. Conductor temperature = 80oC
The modelled burial depth of the cable is 450mm
4.4 Nominal P17 Cable Ratings
4.4.1 EHV and HV cables
EHV and HV cable ratings come from P17 Parts 1-3 [1]. Only distribution type ratings are given for
non-metric sized cables in P17. EHV (1) refers to the 240mm2 single core conductors, whilst EHV (2)
refers to the 0.3in2 3 core cable. Unless otherwise stated, P17 comparable ratings calculated ratings
are for the following conditions:
Ambient Soil Temperature: 10oC
Soil Thermal Resistivity: 0.9 m.K/W
Burial depth: 800mm
Conditions at site are designed to represent the burial depth at site more accurately. These are not
intended to be the finally calculated ratings for these circuits. This will be discussed in more detail in
later sections which consider the best and worst case ratings, based on the actual monitored
conditions at site.
From this point onwards, the calculated values of “P17 ratings at Site” will be used as the nominal
ratings. For the EHV Site, the limiting EHV (2) configuration will be used unless otherwise stated.
P17 (A) Calculated P17 Rating in CRATER (A) Calculated P17 Rating at Site in CRATER (A)
Sustained Cyclic Distribution Sustained Cyclic Distribution Sustained Cyclic Distribution
EHV (1) 482 552 611 477 548 606 467 540 606
EHV (2) 490 421 476 514 413 471 514
HV 385 323 357 384 318 354 384
4.4.2 LV Site
P17 does not give figures for LV cables therefore a slightly different approach has been employed.
Northern Powergrid uses a set of tabulated ratings for LV cables, rated at an ambient soil
temperature of 15oC. From usage of the CRATER model the ratings shown in the tables appear
closest to the following conditions:

9 Copyright Northern Powergrid (Northeast) Limited, Northern Powergrid (Yorkshire) Plc, British Gas Trading Limited,
University of Durham and EA Technology Ltd, 2014
Burial Depth: 600mm (Nominal burial depth is given to be 500mm in the spreadsheet)
Soil Ambient Temperature: 15pC
Soil Thermal Resistivity: 1 m.K/W
LV Ratings (A)
Sustained Cyclic Distribution
LV Rating from NPg Tables 445 507 538
NPg conditions calculated with CRATER (500mm depth) 454 514 541
NPg conditions with modified burial depth calculated with CRATER (600mm depth)
446 508 541
LV Rating Calculated with P17 conditions (10oC Soil Ambient Temp, 500mm burial, Soil Thermal Resistivity = 0.9)
489 550 577
LV Rating Calculated with P17 conditions (10oC Soil Ambient Temp, 450mm burial, Soil Thermal Resistivity = 0.9)
494 553 577
LV Rating Calculated with EATL conditions (450mm burial, Soil Thermal Resistivity = 1)
476 537 562
For future analysis, the LV ratings shown for the P17 rating conditions of 10oC soil ambient
temperature, 0.9 Soil Thermal Resistivity and 450mm burial depth will be used as the nominal rating
for this circuit.
It is also important to note that the ratings quoted in the Northern Powergrid rating tables are not a
fixed parameter, various de-rating factors taking into account differing soil ambient temperatures,
burial depths and soil thermal resistivities are available, and give similar results to those calculated
in the CRATER program for differing conditions.
4.5 EHV and HV Site Installation
The following details show the various measurements which were made at the Rise Carr primary
substation. Unless otherwise specified, the measurements are used for both the HV and EHV cables.
Soil Temperature (Ambient) – Located on the HV side of the Rise Carr primary substation,
close to the boundary fence, in order to remove any influence from other cables on site. This
is at a burial depth of 900mm.
Soil Temperature (Close to cable) – This is located 130mm above the uppermost of the
triplex group of EHV cables. Located 180mm horizontally away from the HV cable.
Sheath Temperature – measured on the surface of both the EHV and HV cables. The EHV
measurement is attached to the uppermost of the triplex cables.
Soil Thermal conductivity – This is located 620mm from the wall of the substation building
on the EHV side of the compound. The tip of the probe is 530mm below the surface and
measures both temperature and soil thermal conductivity. Soil temperature is also
measured by the device at a depth of ≈415mm below the surface.

10 Copyright Northern Powergrid (Northeast) Limited, Northern Powergrid (Yorkshire) Plc, British Gas Trading Limited,
University of Durham and EA Technology Ltd, 2014
4.6 LV Site Installation
Soil Temperature (Ambient) – This is located at a burial depth of 1000mm.
Soil Temperature (Close to cable) – Located 60mm horizontally away from the cable at a
depth of 450mm.
Sheath Temperature – measured on the surface of the LV cables.
Soil Thermal conductivity – This is located at a depth 400mm, Soil temperature is also
measured by the device.

11 Copyright Northern Powergrid (Northeast) Limited, Northern Powergrid (Yorkshire) Plc, British Gas Trading Limited,
University of Durham and EA Technology Ltd, 2014
5 Sensitivity Analysis
In order to model the thermal behaviour of the cable as a whole, the analysis must be broken down
into two sections. The internal heat transfers of the cable are largely governed by the cable
construction and therefore are not subject to this sensitivity analysis. The external conditions
surrounding the cable affect its ability to transfer heat away from the surface, and a number of
factors are involved.
This section will consider three influential factors on rating, the soil thermal resistivity, soil
temperature and the burial depth of the cable.
For all three cables, the nominal rated conditions are an ambient soil temperature of 10oC and a soil
thermal resistivity of 0.9 m.K / W. For the EHV and HV cables the nominal burial condition is directly
buried at 800mm, for the LV cable the depth is 500mm.
For reference, Table 1 shows the minimum and maximum values of the two ambient variables
(burial depth is fixed) under consideration at the EHV/HV and LV sites.
Soil Thermal Resistivity (m.K/W) Soil Ambient Temperature (oC)
Maximum Minimum Maximum Minimum
EHV and HV Site 2.27 0.72 17.10 6.50
LV Site 1.04 0.23 15.80 5.00
Table 1 – Minimum and Maximum Ambient Values at the EHV/HV and LV Sites
Figure 2 – Effect of Ambient Soil Temprature on rating

12 Copyright Northern Powergrid (Northeast) Limited, Northern Powergrid (Yorkshire) Plc, British Gas Trading Limited,
University of Durham and EA Technology Ltd, 2014
Figure 3 - Effect of Soil Thermal Resistivity on rating
Figure 4 - Effect of Cable Burial Depth on rating
As shown in Figure 2 and Figure 3 ambient soil temperature and soil thermal resistivity have the
greatest effect on rating. Reduction in soil thermal resistivity (for example by using sand as the cable
backfill) is likely to be the easiest method for increasing the rating of a circuit.
Lower burial depths give an increase in rating; however this sensitivity does not consider the
additional correlation with increased ambient soil temperatures at lower burial depths.

13 Copyright Northern Powergrid (Northeast) Limited, Northern Powergrid (Yorkshire) Plc, British Gas Trading Limited,
University of Durham and EA Technology Ltd, 2014
6 Ambient Parameters
6.1 Influence of Ambient Air Temperature on Soil Temperatures
This section studies the effects of ambient air temperature on corresponding soil temperatures at
various depths. As expected, those soil measurements which are closer to the surface seem to
display greater sensitivity to the measured air temperature. This is shown by the ambient soil
temperature measurements (typically lower burial depth than other measurements: see previous
section for depths) which are higher than those measured by the soil thermal conductivity probe in
the Winter period, due to a reduced influence from surface behaviour. The converse is true in the
Summer period, where the temperatures are now greater at the surface.
Figure 5 – Ambient Temperatures measured at the LV site
Figure 6 - Ambient Temperatures measured at the EHV/HV site
14 Copyright Northern Powergrid (Northeast) Limited, Northern Powergrid (Yorkshire) Plc, British Gas Trading Limited,
University of Durham and EA Technology Ltd, 2014
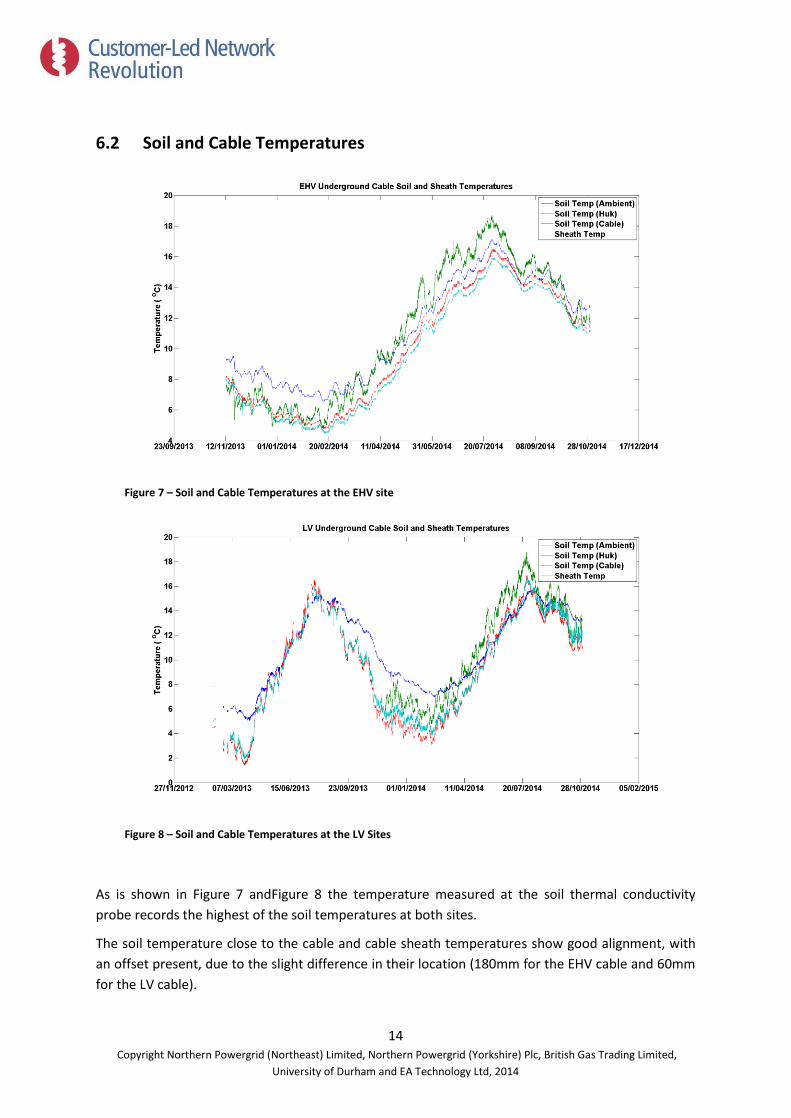
6.2 Soil and Cable Temperatures
Figure 7 – Soil and Cable Temperatures at the EHV site
Figure 8 – Soil and Cable Temperatures at the LV Sites
As is shown in Figure 7 andFigure 8 the temperature measured at the soil thermal conductivity
probe records the highest of the soil temperatures at both sites.
The soil temperature close to the cable and cable sheath temperatures show good alignment, with
an offset present, due to the slight difference in their location (180mm for the EHV cable and 60mm
for the LV cable).

15 Copyright Northern Powergrid (Northeast) Limited, Northern Powergrid (Yorkshire) Plc, British Gas Trading Limited,
University of Durham and EA Technology Ltd, 2014
7 Load Currents
In order to calculate suitably accurate cycling ratings at the various UGC monitoring sites, it was first
necessary to check the observed load currents for network abnormalities such as N-1 events. A
number of such events were found, although their duration was found to be minimal in relation to
the length of the whole data collection period. The following section shows the original collected
data and the resultant profiles after data cleaning. Given the relatively short duration of network
anomalies, the data was simply declared null for the relevant periods.
7.1 EHV
Figure 9 – EHV Original Monitored Currents
Figure 10 – EHV Filtered Currents

16 Copyright Northern Powergrid (Northeast) Limited, Northern Powergrid (Yorkshire) Plc, British Gas Trading Limited,
University of Durham and EA Technology Ltd, 2014
7.2 HV
Figure 11 – HV Original Monitored Currents
Figure 12 – HV Filtered Currents

17 Copyright Northern Powergrid (Northeast) Limited, Northern Powergrid (Yorkshire) Plc, British Gas Trading Limited,
University of Durham and EA Technology Ltd, 2014
7.3 LV
Figure 13 – LV Original Monitored Currents
Figure 14 – LV Filtered Currents
The noticeable increase in load current after the 22nd of July 2014 is due to reconfiguration of the
network between the Darlington Melrose Link Box and the Harrowgate Hill secondary substation.
7.4 Peak Currents
P17 at Site (A) Peak Load (A)
Sustained Cyclic Distribution
EHV (1) 467 540 606 99.9
EHV (2) 413 471 514 99.9
HV 318 354 384 253.4
LV (post-reconfiguration) 494 553 577 332.3
LV 494 553 577 167.9
Table 2 – Peak Currents at each of the rating sites

18 Copyright Northern Powergrid (Northeast) Limited, Northern Powergrid (Yorkshire) Plc, British Gas Trading Limited,
University of Durham and EA Technology Ltd, 2014
Percentage Present Utilisation at Peak Load
Sustained Cyclic Distribution
EHV (1) 21.39% 18.50% 16.49%
EHV (2) 24.19% 21.21% 19.44%
HV 79.69% 71.58% 65.99%
LV 67.27% 60.09% 57.59%
LV (pre-reconfiguration) 33.99% 30.36% 29.10%
Table 3 – Percentage utilisation at peak load
As can be seen in Table 2, there is significant headroom on the EHV cable to allow for load increase
with a peak utilisation of 24.19% of the sustained rating. The HV system is loaded beyond 50%
capacity at peak, with a maximum utilisation of 79.69% of the sustained rating. The LV system is, as
per the EHV system relatively lightly loaded, with a peak usage of 33.99% of the sustained rating.
After network reconfiguration, where the load now contains that from the Harrowgate Hill
substation the utilisation clearly increases, to a peak of 67.27% of the sustained rating.
The cyclic and distribution utilisation factors are naturally lower as is to be expected.

19 Copyright Northern Powergrid (Northeast) Limited, Northern Powergrid (Yorkshire) Plc, British Gas Trading Limited,
University of Durham and EA Technology Ltd, 2014
8 Model Validation
Figure 15 and Figure 16 show the measured and predicted sheath temperatures for the HV cable
calculated in the CLNR field trials. The offset between the two parameters is more clearly visible in
Figure 16. There appears to be good agreement between the two data series, with and offset of
roughly 2oC.
Figure 15 – Measured and Predicted Sheath Temperatures (HV Cable)
Figure 16 – Measured and Predicted Sheath Temperatures (HV Cable)

20 Copyright Northern Powergrid (Northeast) Limited, Northern Powergrid (Yorkshire) Plc, British Gas Trading Limited,
University of Durham and EA Technology Ltd, 2014
9 Sustained, Cyclic and Distribution Ratings
At each of the underground cable monitoring sites sustained, cyclic and distribution ratings have
been calculated based on the actual observed conditions. These are intended for comparison with
the present P17 tabulated values.
Sustained ratings have been calculated based on the worst and best case conditions shown at each
site. Informed by the results of the sensitivity analysis discussed previously the worst case conditions
are a high ambient soil temperature and high soil thermal resistivity. The sustained rating is
essentially the steady state continuous rating of the cable which will result in the conductor
maximum temperature being reached, potentially after a long period of time.
Since the Cyclic and Distribution ratings are independent of the load profile magnitude, the Load
Loss Factor (LLF) becomes the significant indicator. The LLF is defined as:
𝐿𝐿𝐹 =
1
24
∑ 𝐼𝑖223
𝑖=0
𝐼𝑀𝐴𝑋2
Where 𝐼𝑖 refers to the 24 hourly normalised load values.
For reference the industry standard Load Curve G has a LLF of 0.5061. LLF’s have been calculated for
a weekly average dataset taken from all monitoring sites. The maximum and minimum weekly LLF
values have been then used to calculate a range of possible Cyclic and Distribution ratings.
Ratings have also been calculated for using the actual observed values of ambient soil temperature
and soil thermal resistivity during the weeks of minimum and maximum LLF. Weekday and Weekend
ratings have been calculated since there is often a significant difference between the loading
patterns of weekdays and weekends.
Figure 17 – EHV Minimum and Maximum LLF Load Profiles

21 Copyright Northern Powergrid (Northeast) Limited, Northern Powergrid (Yorkshire) Plc, British Gas Trading Limited,
University of Durham and EA Technology Ltd, 2014
Figure 18 - LV Minimum and Maximum LLF Load Profiles
9.1 Best and Worst Case Ambient Conditions
In order to determine the range of potential observed ratings the raw monitored data has been
converted into a series of hourly data. The data is then split into a weekly dataset, subdivided into
weekday and weekend datasets, to take into account the differing load profiles at these times.
Average weekday and weekend soil ambient temperatures and thermal resistivities are then
calculated for each week. The worst and best case conditions are then as follows, a combination of
the highest weekly (weekday and weekend) values of soil temperature and soil thermal resistivity
and the load profile which has the highest load loss factor. The best case conditions are the exact
opposite of these conditions. The potential non-coincidence of high ambient soil temperature and
soil thermal resistivity is not considered here, these ratings are simply intended to provide an
indicator of the potential worst and best case ratings at each of the sites based on the monitored
conditions, as opposed to pre-determined tabulated data.
9.1.1 EHV and HV Sites
2013 2014
Weekday Soil Ambient Temp Soil Thermal Resistivity Soil Ambient Temp Soil Thermal Resistivity
Worst Case 9.29 1.4456 16.8951 2.1149
Best Case 7.4552 1.3358 6.9048 1.2810
Weekend
Worst Case 9.1210 1.4448 16.9811 2.1389
Best Case 7.5 1.3603 6.9013 1.3191

22 Copyright Northern Powergrid (Northeast) Limited, Northern Powergrid (Yorkshire) Plc, British Gas Trading Limited,
University of Durham and EA Technology Ltd, 2014
Table 4 – Best and Worst Case ambient conditions – EHV and HV Site
9.1.2 LV Site
2013 2014
Weekday Soil Ambient Temp Soil Thermal Resistivity Soil Ambient Temp Soil Thermal Resistivity
Worst Case 15.1631 0.8929 15.5404 0.8427
Best Case 5.2233 0.7683 7.0613 0.7250
Weekend
Worst Case 15.1358 0.8959 15.5768 0.8457
Best Case 5.4923 0.7655 7.1428 0.7243
Table 5 - Best and Worst Case ambient conditions – LV Site
9.2 EHV
2013 2014
Weekday Sustained Cyclic Distribution Sustained Cyclic Distribution
Worst Case 389 419 519 315 352 416
Best Case 407 491 564 415 493 565
Weekend
Worst Case 390 467 539 314 353 418
Best Case 404 493 567 410 497 570
Table 6 – EHV Best and Worst Case Ratings
9.3 HV
2013 2014
Weekday Sustained Cyclic Distribution Sustained Cyclic Distribution
Worst Case 276 312 350 223 249 287
Best Case 288 338 377 293 346 384
Weekend Worst Case 276 324 363 222 246 285
Best Case 286 337 375 290 341 380
Table 7 - HV Best and Worst Case Ratings

23 Copyright Northern Powergrid (Northeast) Limited, Northern Powergrid (Yorkshire) Plc, British Gas Trading Limited,
University of Durham and EA Technology Ltd, 2014
9.4 LV
2013 2014
Weekday Sustained Cyclic Distribution Sustained Cyclic Distribution
Worst Case 477 526 548 485 530 552
Best Case 539 653 684 542 639 666
Weekend Worst Case 476 519 538 484 527 545
Best Case 538 642 671 542 632 659
Table 8 - LV Best and Worst Case Ratings
9.5 Comparison to existing P17 ratings
2013 2014
EHV Sustained Cyclic Distribution Sustained Cyclic Distribution
Worst Case 0.94 0.89 1.01 0.76 0.75 0.81
Best Case 0.99 1.04 1.10 1.00 1.05 1.10
Weekend
Worst Case 0.94 0.99 1.05 0.76 0.75 0.81
Best Case 0.98 1.05 1.10 0.99 1.06 1.11
HV
Worst Case 0.87 0.88 0.91 0.70 0.70 0.75
Best Case 0.91 0.95 0.98 0.92 0.98 1.00
Weekend
Worst Case 0.87 0.92 0.95 0.70 0.69 0.74
Best Case 0.90 0.95 0.98 0.91 0.96 0.99
LV
Worst Case 0.97 0.95 0.95 0.98 0.96 0.96
Best Case 1.09 1.18 1.19 1.10 1.16 1.15
Weekend
Worst Case 0.96 0.94 0.93 0.98 0.95 0.94
Best Case 1.09 1.16 1.16 1.10 1.14 1.14
Table 9 – Sustained, Cyclic and Distribution ratings for best case and worst case scenarios
Table 9 shows the best and worst case scenario Sustained, Cyclic and Distribution ratings at each of
the sites. Values in red indicate where a reduction in the present P17 value would be necessary, if
such a scenario was to occur. Perhaps as is to be expected, a reduction is necessary at all sites if the
worst case scenario was to occur. Since this scenario occurs at a high soil thermal resistivity and a
high soil ambient temperature, the coincidence of these conditions is potentially unlikely to occur.
At the LV site, in the best case scenario, an increase can always be made to the P17 rating with a
maximum increase of 16%. At the EHV and HV sites however, even for a best case scenario it
appears that the cables at this site need to be de-rated. This is most likely due to the very high

24 Copyright Northern Powergrid (Northeast) Limited, Northern Powergrid (Yorkshire) Plc, British Gas Trading Limited,
University of Durham and EA Technology Ltd, 2014
values of soil thermal resistivity observed at this site, however since P17 contains de-rating factors
for non-standard conditions this does not appear to be a particularly singular problem.
25 Copyright Northern Powergrid (Northeast) Limited, Northern Powergrid (Yorkshire) Plc, British Gas Trading Limited,
University of Durham and EA Technology Ltd, 2014
10 Real Time Thermal Rating Results
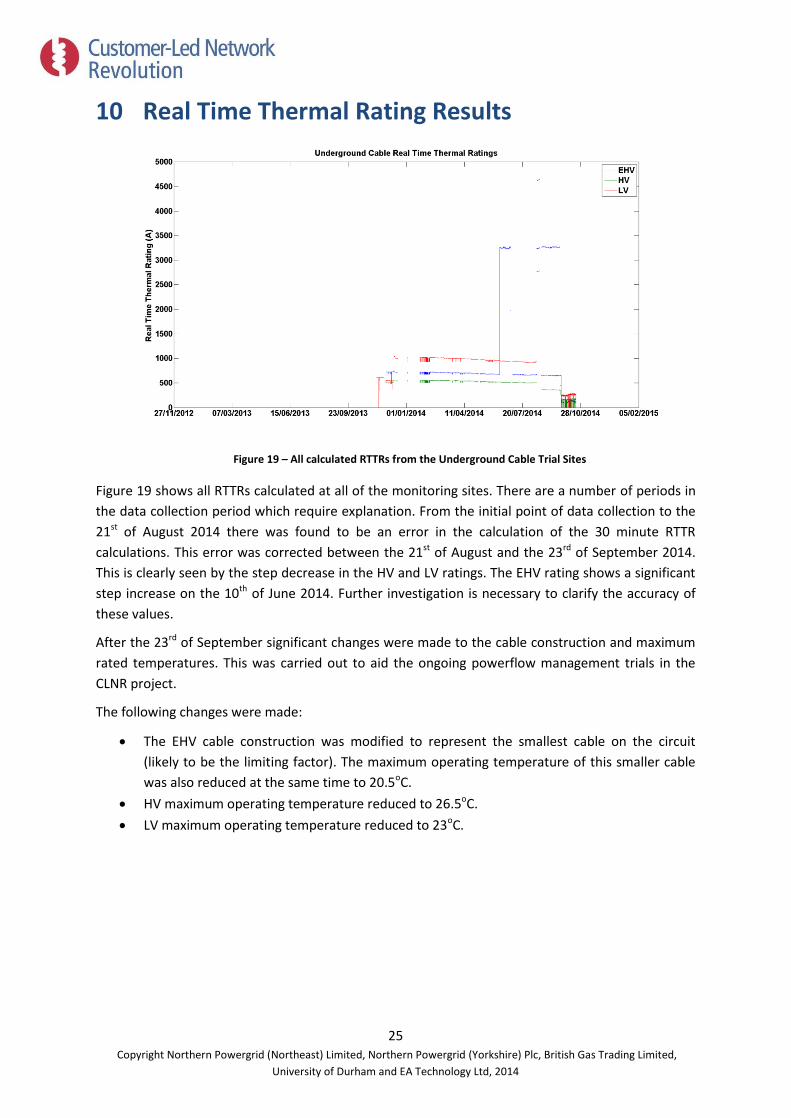
Figure 19 – All calculated RTTRs from the Underground Cable Trial Sites
Figure 19 shows all RTTRs calculated at all of the monitoring sites. There are a number of periods in
the data collection period which require explanation. From the initial point of data collection to the
21st of August 2014 there was found to be an error in the calculation of the 30 minute RTTR
calculations. This error was corrected between the 21st of August and the 23rd of September 2014.
This is clearly seen by the step decrease in the HV and LV ratings. The EHV rating shows a significant
step increase on the 10th of June 2014. Further investigation is necessary to clarify the accuracy of
these values.
After the 23rd of September significant changes were made to the cable construction and maximum
rated temperatures. This was carried out to aid the ongoing powerflow management trials in the
CLNR project.
The following changes were made:
The EHV cable construction was modified to represent the smallest cable on the circuit
(likely to be the limiting factor). The maximum operating temperature of this smaller cable
was also reduced at the same time to 20.5oC.
HV maximum operating temperature reduced to 26.5oC.
LV maximum operating temperature reduced to 23oC.
26 Copyright Northern Powergrid (Northeast) Limited, Northern Powergrid (Yorkshire) Plc, British Gas Trading Limited,
University of Durham and EA Technology Ltd, 2014
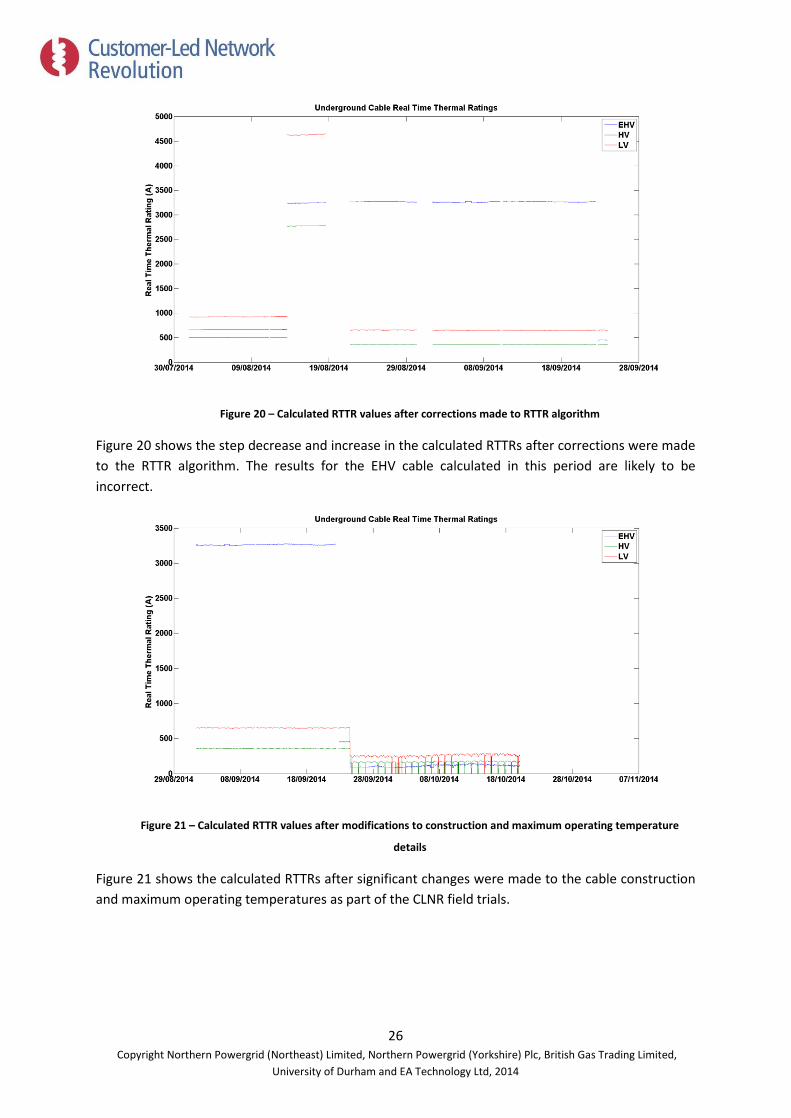
Figure 20 – Calculated RTTR values after corrections made to RTTR algorithm
Figure 20 shows the step decrease and increase in the calculated RTTRs after corrections were made
to the RTTR algorithm. The results for the EHV cable calculated in this period are likely to be
incorrect.
Figure 21 – Calculated RTTR values after modifications to construction and maximum operating temperature
details
Figure 21 shows the calculated RTTRs after significant changes were made to the cable construction
and maximum operating temperatures as part of the CLNR field trials.

27 Copyright Northern Powergrid (Northeast) Limited, Northern Powergrid (Yorkshire) Plc, British Gas Trading Limited,
University of Durham and EA Technology Ltd, 2014
10.1 Real Time Thermal Rating Cumulative Distribution Functions
Since the calculation of the RTTRs was only deemed to be correct between the 21st of August 2014
and the 23rd of September 2014 this period has been taken to generate CDFs of the observed ratings
at the sites. After modifications were made to the algorithm, there were noticeable step increases
and decreases in the calculated ratings. Since the peak loads can occur at any point in the monitored
data, it is perhaps not fundamentally correct to compare RTTRs for the August-September period
against peak loads; however, as shown in Figure 20, the ratings remain relatively constant in the pre
and post modification periods. Due to this, and for the purposes of attempting to quantify the
potential contribution of RTTR for underground cables, a peak-load analysis has been carried out.
Results for the EHV cable are for the final implementation of the smaller cable, with a reduced
operating temperature. Since these results give significantly smaller results than those for the actual
cable construction they are included here for only for completeness.
Figure 22 – Cumulative Distribution Function of RTTR values at the EHV site

28 Copyright Northern Powergrid (Northeast) Limited, Northern Powergrid (Yorkshire) Plc, British Gas Trading Limited,
University of Durham and EA Technology Ltd, 2014
Figure 23 – Cumulative Distribution Function of RTTR values at the HV site
Figure 24 – Cumulative Distribution Function of RTTR values at the LV site
P17 Rating Values at Site Percentage of time for which RTTR can be used
Sustained Cyclic Distribution 99 95 80
EHV (A) 355 420 470 63 89 91
HV (A) 318 354 384 352 354 357
LV (A) 494 553 577 642 646 649
Table 10 – Percentiles of observed RTTRs at the UGC sites
29 Copyright Northern Powergrid (Northeast) Limited, Northern Powergrid (Yorkshire) Plc, British Gas Trading Limited,
University of Durham and EA Technology Ltd, 2014
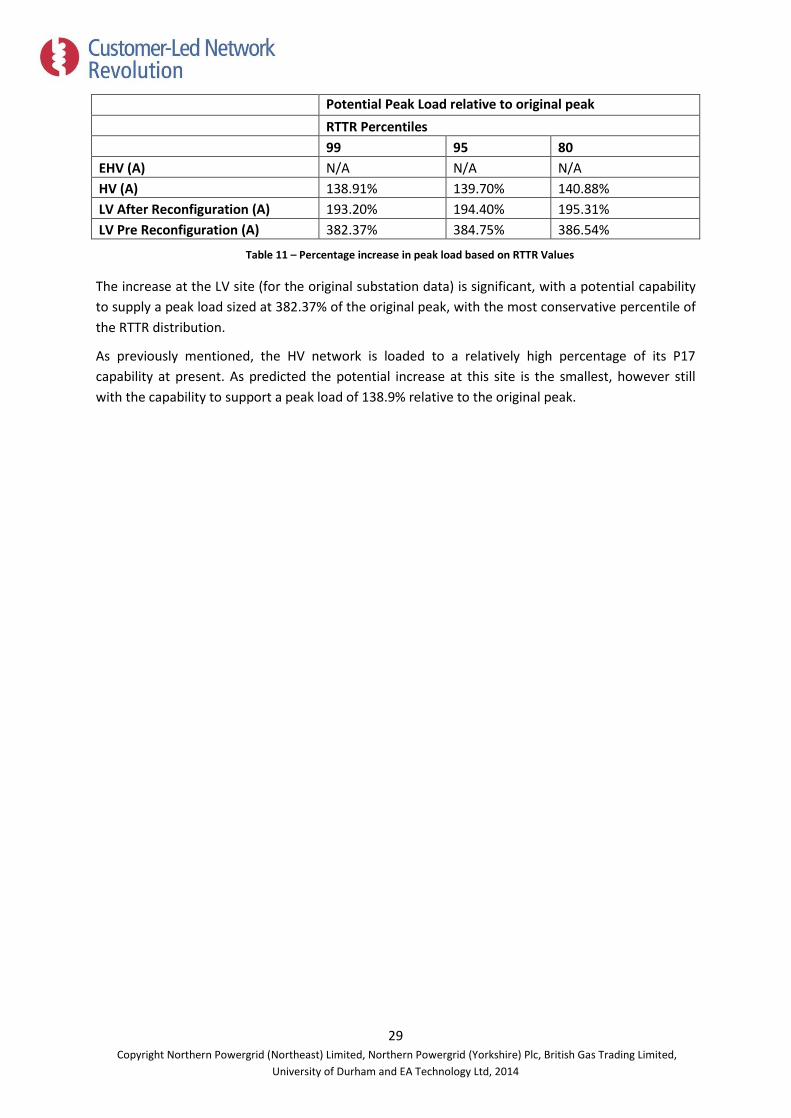
Potential Peak Load relative to original peak
RTTR Percentiles
99 95 80
EHV (A) N/A N/A N/A
HV (A) 138.91% 139.70% 140.88%
LV After Reconfiguration (A) 193.20% 194.40% 195.31%
LV Pre Reconfiguration (A) 382.37% 384.75% 386.54%
Table 11 – Percentage increase in peak load based on RTTR Values
The increase at the LV site (for the original substation data) is significant, with a potential capability
to supply a peak load sized at 382.37% of the original peak, with the most conservative percentile of
the RTTR distribution.
As previously mentioned, the HV network is loaded to a relatively high percentage of its P17
capability at present. As predicted the potential increase at this site is the smallest, however still
with the capability to support a peak load of 138.9% relative to the original peak.

30 Copyright Northern Powergrid (Northeast) Limited, Northern Powergrid (Yorkshire) Plc, British Gas Trading Limited,
University of Durham and EA Technology Ltd, 2014
11 Load Scaling – Cable Temperature Analysis
With the usage of Dynamic CRATER, the conductor temperature of the cable can be determined
based on a set of circuit loading values. Dynamic CRATER takes a series of 12 weeks of half hourly
data which can then be scaled or modified. For this analysis the measurement data from the trials
has been converted into a series of half hourly measurements. The average values of soil thermal
resistivity and soil ambient temperature have been calculated for the required periods. A series of
48 weeks of data split into 4 periods of 12 weeks has been analysed for the EHV and HV sites. A set
of 72 weeks of data has been analysed at the LV site.
Results are shown for each site individually showing the maximum conductor temperature observed
based on the new loading conditions. These are then finally consolidated in one results table.
Figure 25 – Plot of the Dynamic CRATER output

31 Copyright Northern Powergrid (Northeast) Limited, Northern Powergrid (Yorkshire) Plc, British Gas Trading Limited,
University of Durham and EA Technology Ltd, 2014
11.1 EHV Cable
For the EHV cable the maximum circuit rated temperature is 65oC.
New Peak Load (A) Maximum Conductor Temperature (oC)
1 2 3 4 1 2 3 4
397.66 391.72 374.65 373.81 63 64
399.11 393.15 376.02 375.17 63 64
400.56 394.58 377.38 376.54 63 65
402.01 396.01 378.75 377.90 64 65
403.46 397.44 380.12 379.27 64 65
404.91 398.87 381.49 380.63 65 64 66
406.36 400.30 382.85 381.99 65 65
407.82 401.73 384.22 383.36 66 65
409.27 403.16 385.59 384.72 66
410.72 404.59 386.96 386.09
412.17 406.02 388.32 387.45
413.62 407.45 389.69 388.82
415.07 408.88 391.06 390.18
416.52 410.30 392.42 391.54 64
417.97 411.73 393.79 392.91 64
419.43 413.16 395.16 394.27 65
420.88 414.59 396.53 395.64 65
422.33 416.02 397.89 397.00 66
Table 12 – EHV Circuit 12 Week Maximum loads

32 Copyright Northern Powergrid (Northeast) Limited, Northern Powergrid (Yorkshire) Plc, British Gas Trading Limited,
University of Durham and EA Technology Ltd, 2014
11.2 HV Cable
For the HV cable the maximum circuit rated temperature is 65oC.
New Peak Load (A) Maximum Conductor Temperature (oC)
1 2 3 4 1 2 3 4
343.74 333.70 257.59 288.70 62 61
346.18 336.07 259.42 290.75 63 62
348.62 338.44 261.24 292.80 64 63
351.06 340.80 263.07 294.84 65 64
353.50 343.17 264.90 296.89 65 65
355.93 345.54 266.72 298.94 66 65
358.37 347.90 268.55 300.99 66 64
360.81 350.27 270.38 303.03 64
363.25 352.64 272.20 305.08 65
365.69 355.01 274.03 307.13 66
424.19 411.81 317.87 356.27 64
426.63 414.17 319.70 358.32 64
429.07 416.54 321.53 360.36 65
431.51 418.91 323.36 362.41 66
Table 13 - HV Circuit 12 Week Maximum loads

33 Copyright Northern Powergrid (Northeast) Limited, Northern Powergrid (Yorkshire) Plc, British Gas Trading Limited,
University of Durham and EA Technology Ltd, 2014
11.3 LV Cable
For the LV cable the maximum circuit rated temperature is 80oC.
New Peak Load (A) Maximum Conductor Temperature (oC)
1 2 3 4 5 6 1 2 3 4 5 6
692.14 80
693.35 80
694.55 81
638.71 80
639.51 80
640.31 81
636.94 80
637.89 80
638.85 80
639.81 80
640.77 80
641.73 81
667.08 80
668.42 80
669.75 80
671.09 81
667.88 79
669.14 80
670.39 80
671.65 80
672.91 81
618.86 80
619.77 81
Table 14 - LV Circuit 12 Week Maximum loads

34 Copyright Northern Powergrid (Northeast) Limited, Northern Powergrid (Yorkshire) Plc, British Gas Trading Limited,
University of Durham and EA Technology Ltd, 2014
11.4 Final Load Scaling Results
New Peak Load (A) P17 rating at Site (A)
EHV 413 471 514
Maximum 407.82
Minimum 380.63
HV 318 354 384
Maximum 355.93
Minimum 307.13
LV 494 553 577
Maximum 694.55
Minimum 619.77
Table 15 – Maximum and Minimum Possible Peak Loads after load scaling
The minimum possible peak loads for the EHV and HV sites show slight reductions below the P17
sustained ratings, though this is to be expected as these P17 numbers represent a soil temperature
of 10oC and thermal resistivity of 0.9. Again, this is not to say that the ratings employed at the sites
are incorrect, merely that caution is necessary when rating cable circuits and that with increased
monitoring, more accurate results can be generated, avoiding the potential for overrating.
In the converse scenario, the LV maximum loads are significantly higher than the P17 ratings due to
the favourable soil thermal resistivities and ambient temperatures.

35 Copyright Northern Powergrid (Northeast) Limited, Northern Powergrid (Yorkshire) Plc, British Gas Trading Limited,
University of Durham and EA Technology Ltd, 2014
12 Conclusions
Increases to the current levels of circuit loading have been shown to be possible, particularly when
considering the calculated RTTRs. Due to the high level of soil thermal resistivity at the Rise Carr EHV
and HV sites it is recommended that further analysis be carried out when considering the nominal
ratings of these circuits. The ambient conditions at the LV site appear more in line with those which
are tabulated in P17.
Simply replacing the cable thermal backfill with materials of lower soil thermal resistivity (typically
sand) appears to be a sensible first step when aiming to increase the circuit capacity of underground
cables. As shown in the sensitivity analysis in this report, the value of ambient soil thermal resistivity
greatly affects the cable rating.
Whilst decreases are potentially required to the ratings (based on nominal P17 conditions) at the
EHV and HV sites, the level of circuit utilisation at present indicates that this will not affect the
maximum present loading capability.
The results shown in Table 9 suggest that for the best case conditions, de-rating is potentially
necessary, however these P17 rating conditions are representative of a much lower soil thermal
resistivity. Whilst cables may need to be de-rated against these numbers, they simply represent the
actual conditions at site, resulting in fewer opportunities for circuit overloading.

36 Copyright Northern Powergrid (Northeast) Limited, Northern Powergrid (Yorkshire) Plc, British Gas Trading Limited,
University of Durham and EA Technology Ltd, 2014
13 References
[1] "Engineering Recommendation P17 - Current Rating Guide for Distribution Cables," 1976.
[2] G. Le Poidevin, "STP Module 5 - S5196_3 - Dynamic Ratings of Underground Power Cables," 2009.

4
Copyright Northern Powergrid (Northeast) Limited, Northern Powergrid (Yorkshire) Plc, British Gas Trading Limited, University of Durham and EA Technology Ltd, 2014
For enquires about the project
contact [email protected]
www.networkrevolution.co.uk