Clinical and subclinical endometritis induced alterations ... · RESEARCH ARTICLE Open Access...
21
RESEARCH ARTICLE Open Access Clinical and subclinical endometritis induced alterations in bovine endometrial transcriptome and miRNome profile Dessie Salilew-Wondim 1† , Sally Ibrahim 1† , Samuel Gebremedhn 1 , Dawit Tesfaye 1* , Maike Heppelmann 2 , Heinrich Bollwein 4 , Christiane Pfarrer 3 , Ernst Tholen 1 , Christiane Neuhoff 1 , Karl Schellander 1 and Michael Hoelker 1 Abstract Background: Clinical and subclinical endometritis are known to affect the fertility of dairy cows by inducing uterine inflammation. We hypothesized that clinical or subclinical endometritis could affect the fertility of cows by disturbing the molecular milieu of the uterine environment. Here we aimed to investigate the endometrial molecular signatures and pathways affected by clinical and subclinical endometritis. For this, Holstein Frisian cows at 42–60 days postpartum were classified as healthy (HE), subclinical endometritis (SE) or clinical endometritis (CE) based on veterinary clinical examination of the animals and histological evaluation the corresponding endometrial biopsies. Endometrial transcriptome and miRNome profile changes and associated molecular pathways induced by subclinical or clinical endometritis were then investigated using GeneChip® Bovine Genome Array and Exiqon microRNA PCR Human Panel arrays, respectively. The results were further validated in vitro using endometrial stromal and epithelial cells challenged with subclinical and clinical doses of lipopolysaccharide (LPS). Result: Transcriptome profile analysis revealed altered expression level of 203 genes in CE compared to HE animals. Of these, 92 genes including PTHLH, INHBA, DAPL1 and SERPINA1 were significantly upregulated, whereas the expression level of 111 genes including MAOB, CXCR4, HSD11B and, BOLA, were significantly downregulated in CE compared to the HE animal group. However, in SE group, the expression patterns of only 28 genes were found to be significantly altered, of which 26 genes including PTHLH, INHBA, DAPL1, MAOB, CXCR4 and TGIF1 were common to the CE group. Gene annotation analysis indicated the immune system processes; G-protein coupled receptor signaling pathway and chemotaxis to be among the affected functions in endometritis animal groups. In addition, miRNA expression analysis indicated the dysregulation of 35 miRNAs including miR-608, miR-526b* and miR-1265 in CE animals and 102 miRNAs including let-7 family (let-7a, let-7c, let-7d, let-7d*, let-7e, let-7f, let-7i) in SE animals. Interestingly, 14 miRNAs including let-7e, miR-92b, miR-337-3p, let-7f and miR-145 were affected in both SE and CE animal groups. Further in vitro analysis of selected differentially expressed genes and miRNAs in endometrial stroma and epithelial cells challenged with SE and CE doses of LPS showed similar results to that of the array data generated using samples collected from SE and CE animals. Conclusion: The results of this study unraveled endometrial transcriptome and miRNome profile alterations in cows affected by subclinical or clinical endometritis which may have a significant effect on the uterine homeostasis and uterine receptivity. Keywords: Endometritis, Bovine, Transcriptome, miRNome, Inflammation * Correspondence: [email protected] † Equal contributors 1 Department of Animal Breeding and Husbandry, Institute of Animal Science, Endenicher Allee 15, 53115 Bonn, Germany Full list of author information is available at the end of the article © 2016 Salilew-Wondim et al. Open Access This article is distributed under the terms of the Creative Commons Attribution 4.0 International License (http://creativecommons.org/licenses/by/4.0/), which permits unrestricted use, distribution, and reproduction in any medium, provided you give appropriate credit to the original author(s) and the source, provide a link to the Creative Commons license, and indicate if changes were made. The Creative Commons Public Domain Dedication waiver (http://creativecommons.org/publicdomain/zero/1.0/) applies to the data made available in this article, unless otherwise stated. Salilew-Wondim et al. BMC Genomics (2016) 17:218 DOI 10.1186/s12864-016-2513-9
Transcript of Clinical and subclinical endometritis induced alterations ... · RESEARCH ARTICLE Open Access...
RESEARCH ARTICLE Open Access
Clinical and subclinical endometritisinduced alterations in bovine endometrialtranscriptome and miRNome profileDessie Salilew-Wondim1†, Sally Ibrahim1†, Samuel Gebremedhn1, Dawit Tesfaye1*, Maike Heppelmann2,Heinrich Bollwein4, Christiane Pfarrer3, Ernst Tholen1, Christiane Neuhoff1, Karl Schellander1 and Michael Hoelker1
Abstract
Background: Clinical and subclinical endometritis are known to affect the fertility of dairy cows by inducing uterineinflammation. We hypothesized that clinical or subclinical endometritis could affect the fertility of cows by disturbingthe molecular milieu of the uterine environment. Here we aimed to investigate the endometrial molecular signaturesand pathways affected by clinical and subclinical endometritis. For this, Holstein Frisian cows at 42–60 days postpartumwere classified as healthy (HE), subclinical endometritis (SE) or clinical endometritis (CE) based on veterinary clinicalexamination of the animals and histological evaluation the corresponding endometrial biopsies. Endometrialtranscriptome and miRNome profile changes and associated molecular pathways induced by subclinical or clinicalendometritis were then investigated using GeneChip® Bovine Genome Array and Exiqon microRNA PCR Human Panelarrays, respectively. The results were further validated in vitro using endometrial stromal and epithelial cells challengedwith subclinical and clinical doses of lipopolysaccharide (LPS).
Result: Transcriptome profile analysis revealed altered expression level of 203 genes in CE compared to HE animals. Ofthese, 92 genes including PTHLH, INHBA, DAPL1 and SERPINA1 were significantly upregulated, whereas the expressionlevel of 111 genes including MAOB, CXCR4, HSD11B and, BOLA, were significantly downregulated in CE compared tothe HE animal group. However, in SE group, the expression patterns of only 28 genes were found to be significantlyaltered, of which 26 genes including PTHLH, INHBA, DAPL1, MAOB, CXCR4 and TGIF1 were common to the CE group.Gene annotation analysis indicated the immune system processes; G-protein coupled receptor signaling pathway andchemotaxis to be among the affected functions in endometritis animal groups. In addition, miRNA expression analysisindicated the dysregulation of 35 miRNAs including miR-608, miR-526b* and miR-1265 in CE animals and 102 miRNAsincluding let-7 family (let-7a, let-7c, let-7d, let-7d*, let-7e, let-7f, let-7i) in SE animals. Interestingly, 14 miRNAs includinglet-7e, miR-92b, miR-337-3p, let-7f and miR-145 were affected in both SE and CE animal groups. Further in vitro analysisof selected differentially expressed genes and miRNAs in endometrial stroma and epithelial cells challenged with SEand CE doses of LPS showed similar results to that of the array data generated using samples collected from SE and CEanimals.
Conclusion: The results of this study unraveled endometrial transcriptome and miRNome profile alterations in cowsaffected by subclinical or clinical endometritis which may have a significant effect on the uterine homeostasis anduterine receptivity.
Keywords: Endometritis, Bovine, Transcriptome, miRNome, Inflammation
* Correspondence: [email protected]†Equal contributors1Department of Animal Breeding and Husbandry, Institute of Animal Science,Endenicher Allee 15, 53115 Bonn, GermanyFull list of author information is available at the end of the article
© 2016 Salilew-Wondim et al. Open Access This article is distributed under the terms of the Creative Commons Attribution4.0 International License (http://creativecommons.org/licenses/by/4.0/), which permits unrestricted use, distribution, andreproduction in any medium, provided you give appropriate credit to the original author(s) and the source, provide a link tothe Creative Commons license, and indicate if changes were made. The Creative Commons Public Domain Dedication waiver(http://creativecommons.org/publicdomain/zero/1.0/) applies to the data made available in this article, unless otherwise stated.
Salilew-Wondim et al. BMC Genomics (2016) 17:218 DOI 10.1186/s12864-016-2513-9

BackgroundDuring the early lactation period, the majority of high pro-ducing dairy cows usually enter in a state of negative en-ergy balance due to reduced voluntary feed intake [1, 2].This phenomenon in turn compromises the host innateand acquired defense mechanisms and the cows then be-come susceptible to various uterine disorders [3, 4] andbacterial infections that could cause subclinical and clin-ical endometritis [3, 5–8]. Indeed, during bacterial infec-tion of the uterus, the immune cells along with theendometrial epithelial and storma1cells generate the im-mune response of the uterus against the invading patho-gens [9]. The innate pathogen defense mechanism isbelieved to be involved in complicated molecular mecha-nisms, while contracting with foreign bodies. Therefore,unravelling the endometrial molecular pathways and func-tional alteration that could be triggered during uterine in-fection may help to identify biomarkers associated withclinical and/or subclinical endometritis. So far, only veryfew attempts have been conducted to identify molecu-lar signatures associated with subclinical or clinicalendometritis in cattle. For instance, increased levelsof interleukin 6 (IL6), interleukin 8 (IL8), tumour ne-crosis factor alpha (TNFA) and β-actin expressionlevels have been reported in cows with endometrialproportion of polymorphonuclear neutrophils (PMNs)higher than 18 % [10]. Similarly, increased levels ofIL1A and IL1RN in cows affected with subclinical orclinical endometritis have been reported [11]. Apartfrom the cytokines, understanding the global tran-scriptome profile changes occurring in the endomet-rium is essential to understand the impact ofendometritis on uterine gene expression landscape.On this regard, previously, we have detected slightendometrial gene expression changes in dairy cowsclassified as sub clinically sick with endometritisbased on endometrial PMN proportion of cytobrushsamples [12]. In that study, however, the classificationscheme used to categorize cows as sub clinically sickor healthy seems to be very weak to discriminate mo-lecular alterations that could occur in animals affectedby endometritis. Thus, here we thought that using acombination of veterinary clinical examination of theanimals along with the histological analysis of thecorresponding endometrial biopsy could be a betteroption to investigate the molecular and biochemicalchanges that could occur in the endometrium due tosubclinical or clinical endometritis. Therefore, thepresent study aimed to investigate the endometrialtranscriptome profile changes (mRNA and miRNA ex-pression levels) and associated molecular pathways indairy cows classified as subclinical or clinical endo-metritis based on clinical diagnosis and histologicalevaluation of the endometrial biopsies.
ResultsIncidence of subclinical or clinical endometritisTo comprehend the prevalence of subclinical and clin-ical endometritis, first clinical diagnosis was performedin each of the 45 cows by an experienced veterinarianand the corresponding endometrial biopsies were sub-jected to histological assessment. Due to insufficientquality of their biopsies, seven cows were excluded fromfurther analysis. Out of the remaining 38 cows, 71.1 %were classified as healthy based on the results of clinicaldiagnosis and histological evaluation of the correspond-ing endometrial biopsies. In contrast, 6 out of the 38(15.8 %) cows were found to be clinically healthywhereas the histological examination of their corre-sponding endometrial biopsies indicated the presence ofacute and chronic forms of endometritis (presence lym-phocytes or/and granulocytes). On the other hand, boththe clinical diagnosis and histological assessment ontheir biopsy also indicated that 13.2 % of the cows wereaffected by endometritis whereas 5.3 % the cows diag-nosed as clinically sick were found to be healthy basedon histological investigation of the endometrial biopsies.Therefore, those clinically sick cows with the presenceof chronic and/or acute endometrial inflammation onthe corresponding endometrial biopsies were consideredas affected by clinical endometritis (CE). Clinicallyhealthy animals with acute and/or chronic endometritison their endometrial cytology were considered as sub-clinical endometritis (SE) group and those animals whichdidn’t show a sign of sickness during clinical diagnosisand histological evaluation of their endometrial biopsieswere considered as healthy (HE) group.
Endometrial gene expression changes in cows affected byclinical endometritisTo investigate the effect of clinical endometritis on theendometrial gene expression, the total RNAs isolatedfrom endometrial biopsies of CE and HE animal groupswere amplified, biotin labelled and hybridized to theGeneChip® Bovine Genome Array (Affymetrix, CA,USA). Three hybridizations were performed for each ofthe CE or HE group and the normalized signals inten-sities of the CE animal group were compared to the nor-malized signals intensities of the HE group. Duringanalysis, one of the arrays in the HE group didn’t passthe quality control parameters and thus it was removedfrom the analysis. The gene expression profile showedthat the expression levels of 203 gene transcripts weredysregulated (absolute fold change ≥ 2, p ≤ 0.008 andfalse discovery rate (FDR) ≤ 0.30) in CE compared to HEanimals (Fig. 1a, Additional file 1: Table S1). Of these,the expression levels of 92 genes including PTHLH,INHBA, DAPL1, CLDN10, P2RY14 and MAOB were in-creased while the mRNA expression levels of 111 genes
Salilew-Wondim et al. BMC Genomics (2016) 17:218 Page 2 of 21

including SCARA5, HSD11B2, TPPP3, JUN, ATF3, BOLAand PTGDS were downregulated in the CE animals(Fig. 1b).
Endometrial gene expression changes in cows affected bysubclinical endometritisTo investigate the effects of subclinical endometritis onthe endometrial transcriptome profile of postpartumdairy cows, the endometrial gene expression patterns ofthe SE animals were compared with the endometrialgene expression patterns of the HE animals using a simi-lar protocol described above for the CE animals. Accord-ingly, from a total of 8472 genes that exhibited a highsignal intensity above the background, 483 gene tran-scripts were altered by ≥ 2 fold regulation in SE groupscompared to HE ones, of which the expression levels of231 genes were increased while the expression levels of252 transcripts were reduced in the former compared tothe latter group. However, the expression level of only28 gene transcripts were significantly differentially
expressed between SE and HE animals. From these,PTHLH, INHBA, DAPL1, KCNB2, MAOB and GPR133were the top among the upregulated genes, whileMAMDC2, SLC16A1, ALPL, NDRG2, NFIB, LAPTM4B,CXCR4 and TGIF1 were the top among the suppressedones in the SE animal group (Fig. 2, Additional file 2:Table S2).
Genes affected both in subclinical and clinicalendometritis animal groupsAfter identification of differentially expressed genes inCE and SE animals, we merged the two data to identifythe common genes that were affected in both animalgroups. Interestingly, 26 of the 28 significantly alteredgenes in SE group were also significantly dysregulated inCE animal group (Fig. 3a). However, the expressionlevels of 177 significantly altered genes in CE were notsignificantly affected in the SE animals (Fig. 3a).Apart from significantly differentially expressed genes,
we also looked into the expression trends of all 8472
Fig. 1 Dysregulated genes in CE compared to HE animals. a The expression patterns and the hierarchical clustering of 203 genes within andbetween the biological samples of CE and HE animal groups. The red and green colors indicate the up and downregulated gene expression patterns,respectively. b The fold change and p value of 111 downregulated (green dots) and 92 upregulated genes (red dots) in CE compared to HE animals.The names of some genes are indicated and some others are omitted to enhance visibility. Log2FC on the X axis indicates the fold change differencein log 2 scale. Positive log2FC values represent the upregulation of genes, while negative log2FC values indicate downregulation of genes in CEcompared to the HE animal group. The Y axis indicates the p value (bold faced) and FDR (italics in bracket)
Salilew-Wondim et al. BMC Genomics (2016) 17:218 Page 3 of 21

genes, which exhibited high signal intensity above thebackground to get a broader overview about the overallgene expression tendencies in SE and CE with referenceto the healthy animals. The result of this analysis indi-cated that the gene expression patterns in SE and CE an-imals against the HE groups were found to show asimilar direction and thus those genes which weredownregulated or upregulated in SE were found to bedownregulated or upregulated in CE animal group onlywith a few exceptions (Fig. 3b).
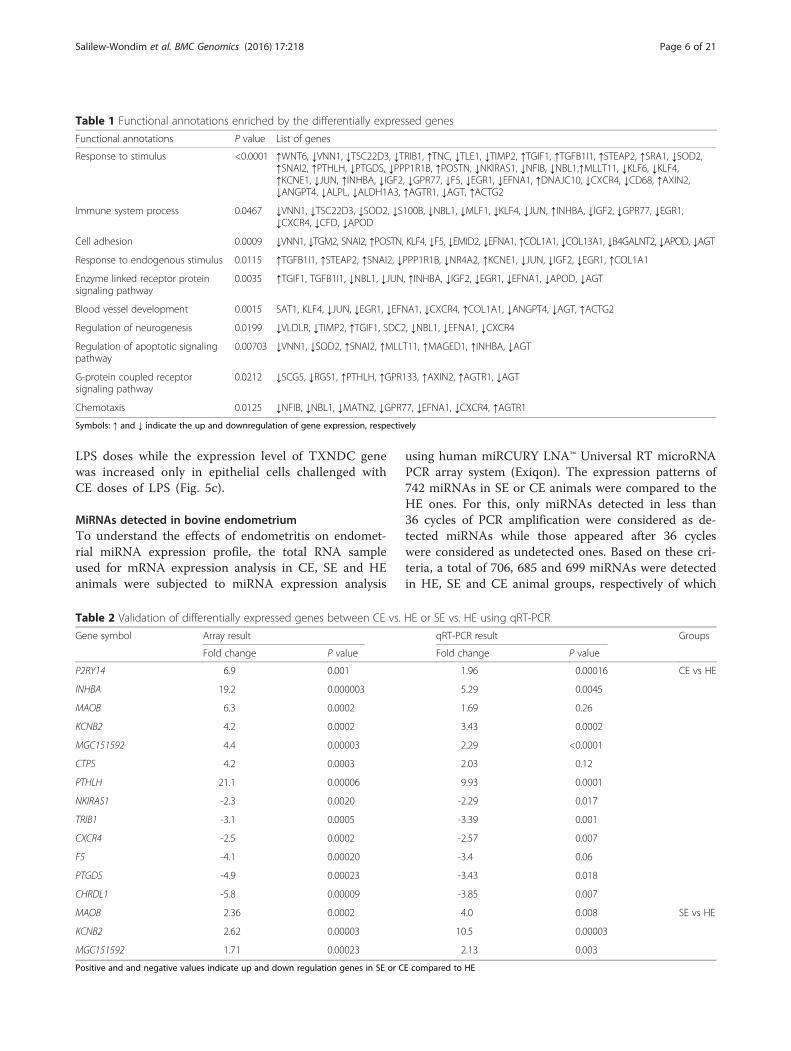
Functional classification of dysregulated genesTo get insight about the functional alterations that couldoccur in SE or CE animals due to the dysregulatedgenes, gene ontology enrichment analysis was performedusing the G profiler software. Immune system process,cell adhesion, regulation of neurogenesis, regulation ofapoptotic signaling pathway, G-protein coupled receptorsignaling pathway and chemotaxis were found to be af-fected in animals affected by endometritis. Furthermore,
except INHBA, all differentially expressed genes whichare involved in immune system process were downregu-lated in cows affected by endometritis (Table 1).
Validation of candidate differentially expressed geneusing quantitative reverse transcription PCR (qRT-PCR)The the gene expression differences between SE andHE, CE and HE revealed by the microarray analysiswere further confirmed using qRT-PCR. To do this,13 differenitally expressed genes incldung P2RY14,INHBA, MAOB, KCNB2, PTHLH, NKIRAS1, TRIB1and CXCR4 were randomly selected and the transcriptabaundances of these genes in samples derived fromSE, CE and HE animal groups were measured usingqRT-PCR. Accordingly, the results obtained fromqRT-PCR analyses were in agreement with the arrayresults (Table 2). In additon, the microarray and theqRT-PCR results were positively correlated with cor-relation coffient of 0.8.
Fig. 2 The list of differentially expressed genes between SE and HE animal groups. a The expression patterns and the hierarchical clustering of 28genes within and between the biological samples. The red and green colors indicate up and downregulated gene expression patterns, respectively.b The fold change and p value of downregulated genes (green dots) and the upregulated genes (red dots) in SE compared to HE. The names of somegenes are indicated and some others are omitted to enhance visibility. The Affymetrix ID is provided for the transcripts which have no official genesymbol. Log2FC on the X axis indicates the fold change difference in log2 scale. Positive log2FC values represent the upregulation while negativelog2FC values indicate downregulation of genes in SE animals compared to the HE group. The Y axis indicates the p value (bold faced) and the FDR(italics in bracket)
Salilew-Wondim et al. BMC Genomics (2016) 17:218 Page 4 of 21

The experssion patterns of selected candidatedifferentially expressed genes in endometrial epithelialand stroma cells challenged with lipopolysacharide (LPS)in vitroTranscriptome profile alterations detected in SE orCE animals by the microarray and qRT-PCR analyseswere further evaluated in endometrial cells challengedwith SE or CE equivalent doses of LPS in vitro. Toachieve this, endometrial stromal and epithelial cellscollected from healthy non pregnant cows were chal-lenged with clinical (3 μg/ml) or subclinical (0.5 μg/ml) doses of LPS. After the challenge, a significant in-crease in TNFα and IL-6 protein levels and a higherPGE2 to PGF2α ratio were observed in epithelial andstromal spent culture media indicating the effective-ness of LPS challenge to induce inflammation in bothcell types (Fig. 4). We then analyzed the expression
patterns of nine candidate genes in LPS challengedendometrial epithelial and endometrial cells. The re-sults showed that the expression patterns of threegenes (MLLlT11, INHBA and PTHLH) which were in-creased in both SE and CE animals were also foundto be upregulated in both endometrial epithelial andstroma cells challenged with SE and CE equivalent ofLPS (Fig. 5a). Similarly, the expression profiles ofthree candidate genes (JUN, PTGDS, EMID2) whichexhibited a significant reduction in CE animals werealso reduced in endometrial epithelial cells challengedwith both SE and CE equivalent doses of LPS(Fig. 5b). In addition, among the three candidategenes (TXNDC, COL6A3, LBH) that were significantlyincreased only in CE animal group, the expressionlevels of COL6A3 and LBH were increased in bothcell types challenged by SE and CE equivalents of
Fig. 3 Significantly dysregulated genes both in SE and CE animals compared to HE group. a The heatmap illustrating the expression patterns of26 commonly dysregulated genes in SE and CE animals. The red and green colors in the heatmap indicate high and low expression level ofgenes, respectively. b The scatter plot showing the relative expression patterns of 8472 genes in SE and CE compared to the HE animal group.The relative expression of SE compared to the HE group (Log2 fold change) is indicated in the X axis while the relative expression of CE animalscompared to the HE group (log2 fold change) is plotted in the Y axis. Negative values in the X and Y axis indicated the downregulation of geneswhile positive values indicated upregulated genes
Salilew-Wondim et al. BMC Genomics (2016) 17:218 Page 5 of 21
LPS doses while the expression level of TXNDC genewas increased only in epithelial cells challenged withCE doses of LPS (Fig. 5c).
MiRNAs detected in bovine endometriumTo understand the effects of endometritis on endomet-rial miRNA expression profile, the total RNA sampleused for mRNA expression analysis in CE, SE and HEanimals were subjected to miRNA expression analysis
using human miRCURY LNA™ Universal RT microRNAPCR array system (Exiqon). The expression patterns of742 miRNAs in SE or CE animals were compared to theHE ones. For this, only miRNAs detected in less than36 cycles of PCR amplification were considered as de-tected miRNAs while those appeared after 36 cycleswere considered as undetected ones. Based on these cri-teria, a total of 706, 685 and 699 miRNAs were detectedin HE, SE and CE animal groups, respectively of which
Table 1 Functional annotations enriched by the differentially expressed genes
Functional annotations P value List of genes
Response to stimulus <0.0001 ↑WNT6, ↓VNN1, ↓TSC22D3, ↓TRIB1, ↑TNC, ↓TLE1, ↓TIMP2, ↑TGIF1, ↑TGFB1I1, ↑STEAP2, ↑SRA1, ↓SOD2,↑SNAI2, ↑PTHLH, ↓PTGDS, ↓PPP1R1B, ↑POSTN, ↓NKIRAS1, ↓NFIB, ↓NBL1,↑MLLT11, ↓KLF6, ↓KLF4,↑KCNE1, ↓JUN, ↑INHBA, ↓IGF2, ↓GPR77, ↓F5, ↓EGR1, ↓EFNA1, ↑DNAJC10, ↓CXCR4, ↓CD68, ↑AXIN2,↓ANGPT4, ↓ALPL, ↓ALDH1A3, ↑AGTR1, ↓AGT, ↑ACTG2
Immune system process 0.0467 ↓VNN1, ↓TSC22D3, ↓SOD2, ↓S100B, ↓NBL1, ↓MLF1, ↓KLF4, ↓JUN, ↑INHBA, ↓IGF2, ↓GPR77, ↓EGR1,↓CXCR4, ↓CFD, ↓APOD
Cell adhesion 0.0009 ↓VNN1, ↓TGM2, SNAI2, ↑POSTN, KLF4, ↓F5, ↓EMID2, ↓EFNA1, ↑COL1A1, ↓COL13A1, ↓B4GALNT2, ↓APOD, ↓AGT
Response to endogenous stimulus 0.0115 ↑TGFB1I1, ↑STEAP2, ↑SNAI2, ↓PPP1R1B, ↓NR4A2, ↑KCNE1, ↓JUN, ↓IGF2, ↓EGR1, ↑COL1A1
Enzyme linked receptor proteinsignaling pathway
0.0035 ↑TGIF1, TGFB1I1, ↓NBL1, ↓JUN, ↑INHBA, ↓IGF2, ↓EGR1, ↓EFNA1, ↓APOD, ↓AGT
Blood vessel development 0.0015 SAT1, KLF4, ↓JUN, ↓EGR1, ↓EFNA1, ↓CXCR4, ↑COL1A1, ↓ANGPT4, ↓AGT, ↑ACTG2
Regulation of neurogenesis 0.0199 ↓VLDLR, ↓TIMP2, ↑TGIF1, SDC2, ↓NBL1, ↓EFNA1, ↓CXCR4
Regulation of apoptotic signalingpathway
0.00703 ↓VNN1, ↓SOD2, ↑SNAI2, ↑MLLT11, ↑MAGED1, ↑INHBA, ↓AGT
G-protein coupled receptorsignaling pathway
0.0212 ↓SCG5, ↓RGS1, ↑PTHLH, ↑GPR133, ↑AXIN2, ↑AGTR1, ↓AGT
Chemotaxis 0.0125 ↓NFIB, ↓NBL1, ↓MATN2, ↓GPR77, ↓EFNA1, ↓CXCR4, ↑AGTR1
Symbols: ↑ and ↓ indicate the up and downregulation of gene expression, respectively
Table 2 Validation of differentially expressed genes between CE vs. HE or SE vs. HE using qRT-PCR
Gene symbol Array result qRT-PCR result Groups
Fold change P value Fold change P value
P2RY14 6.9 0.001 1.96 0.00016 CE vs HE
INHBA 19.2 0.000003 5.29 0.0045
MAOB 6.3 0.0002 1.69 0.26
KCNB2 4.2 0.0002 3.43 0.0002
MGC151592 4.4 0.00003 2.29 <0.0001
CTPS 4.2 0.0003 2.03 0.12
PTHLH 21.1 0.00006 9.93 0.0001
NKIRAS1 -2.3 0.0020 -2.29 0.017
TRIB1 -3.1 0.0005 -3.39 0.001
CXCR4 -2.5 0.0002 -2.57 0.007
F5 -4.1 0.00020 -3.4 0.06
PTGDS -4.9 0.00023 -3.43 0.018
CHRDL1 -5.8 0.00009 -3.85 0.007
MAOB 2.36 0.0002 4.0 0.008 SE vs HE
KCNB2 2.62 0.00003 10.5 0.00003
MGC151592 1.71 0.00023 2.13 0.003
Positive and and negative values indicate up and down regulation genes in SE or CE compared to HE
Salilew-Wondim et al. BMC Genomics (2016) 17:218 Page 6 of 21

654 miRNAs were detected in all animal groups. Al-though 93–96 % of the detected miRNAs were commonin all groups, some miRNAs detected in HE animalswere absent in SE or CE groups and vice-versa (Fig. 6).Among these, miR-938, miR-519c-3p, miR-1265, miR-498 and miR-488 were exclusively detected only in HEanimals and 10 miRNAs including miR-608, miR-625*,miR-218-1*, miR-888*, miR-1184 and miR-1264 were de-tected only in SE and CE animal groups. However, 29miRNAs such as miR-890*, miR-296-5p, miR-617, miR-181c*, miR-889, miR-520a-5p and miR-641 were absentin SE but these miRNAs were detected in HE and CEanimals (Fig. 6).
Endometrial miRNA expression profile in cows affected byclinical endometritisTo investigate the effect of clinical endometritis on theendometrial miRNA expression profile, the miRNA ex-pression levels of CE animals were analyzed with refer-ence to the miRNA expression patterns of HE animals.For this, the miRNA expression data was analyzed usingthe RT2 profiler PCR array data analysis tool, http://
pcrdataanalysis.sabiosciences.com/pcr/arrayanalysis.php.The result indicated that the expression levels of 35miRNAs were significantly altered (absolute foldchange > 1.5, p < 0.05) in CE compared to the HE ani-mals (Fig. 7) of which the expression levels of 7 miRNAswere significantly increased, while the expression levelsof 28 miRNAs were reduced in CE group. The absolutefold change of differentially expressed miRNAs rangedbetween 1.5 and 3147. For instance, miR-608 and miR-526b* were the top among the upregulated miRNAswhile miR-1265, miR-196b, miR-498 and miR-1204 werethe top among the downregulated miRNAs in CE animalgroup (Fig. 7). The hierarchical clustering, the expres-sion pattern and the fold changes differences along withthe corresponding p values of the differentially expressedmiRNAs are presented in Fig. 7.
Endometrial miRNA expression pattern in cows affectedby subclinical endometritisTo comprehend the consequence of subclinical endo-metritis on the endometrial miRNA expression profile,the miRNA expression of SE animal was compared to
Fig. 4 The protein level of TNF alpha & IL6 and PGE2: PGF2aa ratio in the cell culture supernatant measured using ELISA in endometrial cellschallenged with clinical and subclinical doses of LPS. Control epithelial and control stroma cells describe unchallenged epithelial and stroma cells,respectively. Clin LPS epithelial cells and clin LPS stroma cells designate endometrial epithelial cells and stroma cells challenged with CE equivalents ofLPS, respectively whereas sub LPS epithelial cells and sub LPS stroma cells describe the endometrial epithelial cells and stroma cells challenged with SEequivalents of LPS, respectively. * P < 0.05, ** P < 0.01, *** P < 0.001
Salilew-Wondim et al. BMC Genomics (2016) 17:218 Page 7 of 21

the HE following the same methodological approachemployed for the CE group. Accordingly, the expressionlevel of 102 miRNAs were significantly differentiallyexpressed (absolute fold change > 1.5, p < 0.05) betweenthe SE and HE animal groups. Of these, the expressionlevels of 11 miRNAs were significantly increased whilethe expression levels of 95 miRNAs were reduced in SEanimal group (Additional file 3: Figure S1, Additional file4: Table S3). Moreover, miR-361-5p, miR-1184 and miR-218-1* were the top among the upregulated miRNAswhile miR-1265, miR-20b*, miR-520d-5p and miR-506were the top among the downregulated miRNAs in theSE animals. Interestingly, the expression level of certainmiRNA families namely, the let 7 family (let-7a, let-7c,let-7d, let-7d*, let-7e, let-7f, let-7i), miR-181 family (miR-181a, miR-181b), miR-30 family (miR-30b*, miR-30c-2*,
miR-30e), miR-425 family (miR-425, miR-425*), miR-92family (miR-92a, miR-92a-1*, miR-92b) and miR-196family (miR-196a, and miR-196b) were repressed in SEanimal group.
MiRNAs dysregulated in both subclinical and clinicalendometritisSince both SE and CE animals were affected by endo-metritis, we further extended our analysis to identifymiRNAs affected in both animal groups. To performthis, we considered all miRNAs detected in all animalgroups. This analysis has revealed that, the expressionpattern of miRNAs in SE and CE animal groups tendedto show a similar pattern when the expression level ofboth animal groups were compared to the expressionlevel of the HE animals. From these, the expression
Fig. 5 The expression pattern of candidate genes in the endometrial epithelial and stroma cells challenged with CE and SE doses of LPS in vitrofor those upregulated both in SE and CE (a), downregulated in SE (b) or upregulated in CE group (c). Control epithelial and control stroma cellsdescribe unchallenged epithelial and stroma cells, respectively. Clin LPS epithelial cells and clin LPS stroma cells designate endometrial epithelialcells and stroma cells challenged with CE equivalents of LPS, respectively whereas sub LPS epithelial cells and sub LPS stroma cells describe theendometrial epithelial cells and stroma cells challenged with SE equivalents of LPS, respectively. * P < 0.05, ** P < 0.01, *** P < 0.001
Salilew-Wondim et al. BMC Genomics (2016) 17:218 Page 8 of 21

levels of 120 miRNAs exhibited ≥ 2 fold regulations inSE and CE animals. Of these, the expression levels 47and 51 miRNAs were found to be up and downregu-lated, respectively in both animal groups compared tothe HE ones and the expression levels of 32 miRNAsshowed opposite trend in SE and CE animals (Fig. 8).Nevertheless, when the criteria were set to absolute foldchange > 1.5 and p < 0.05, only 14 miRNAs were com-monly significantly differentially expressed in both SEand CE animals compared to the HE groups (Fig. 9).
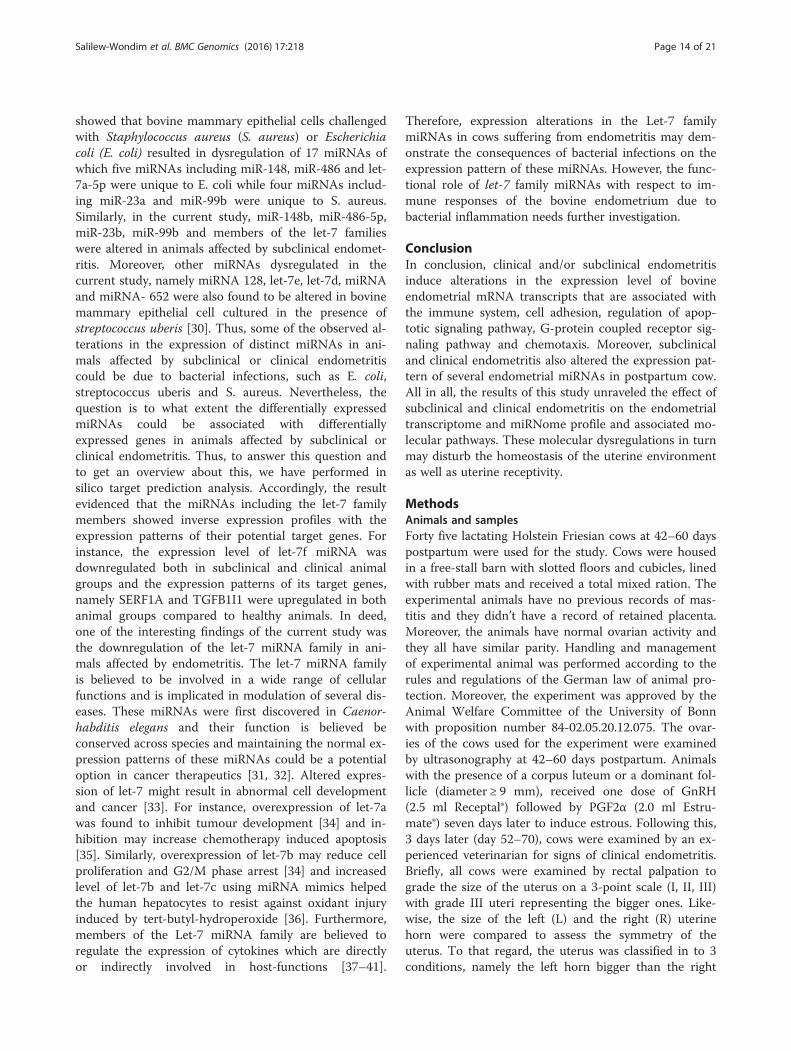
Experssion analysis of candidate miRNAs in endometrialepithelial and stroma cells challenged withlipopolysacharide (LPS) in vitroEndometrial miRNA expression pattern alteration iden-tified in SE and CE animals using PCR based miRNAplatform arrays were further validated in bovine endo-metrial cells challenged with clinical and subclinicalendometritis equivalent doses of LPS in vitro. For this, 6candidate miRNAs, namely those downregulated both inSE and CE animals (miR-1265, miR-1204, miR-1203 andmiR-196b), downregulated only in SE animals (miR-210)or only in CE animals (miR-21) were quantified in LPSchallenged epithelial and stromal endometrial cells. Theexpression levels of these candidate miRNAs were foundto be reduced in both epithelial and stromal endometrial
cells challenged with clinical and subclinical equivalentsof LPS doses (Fig. 10).
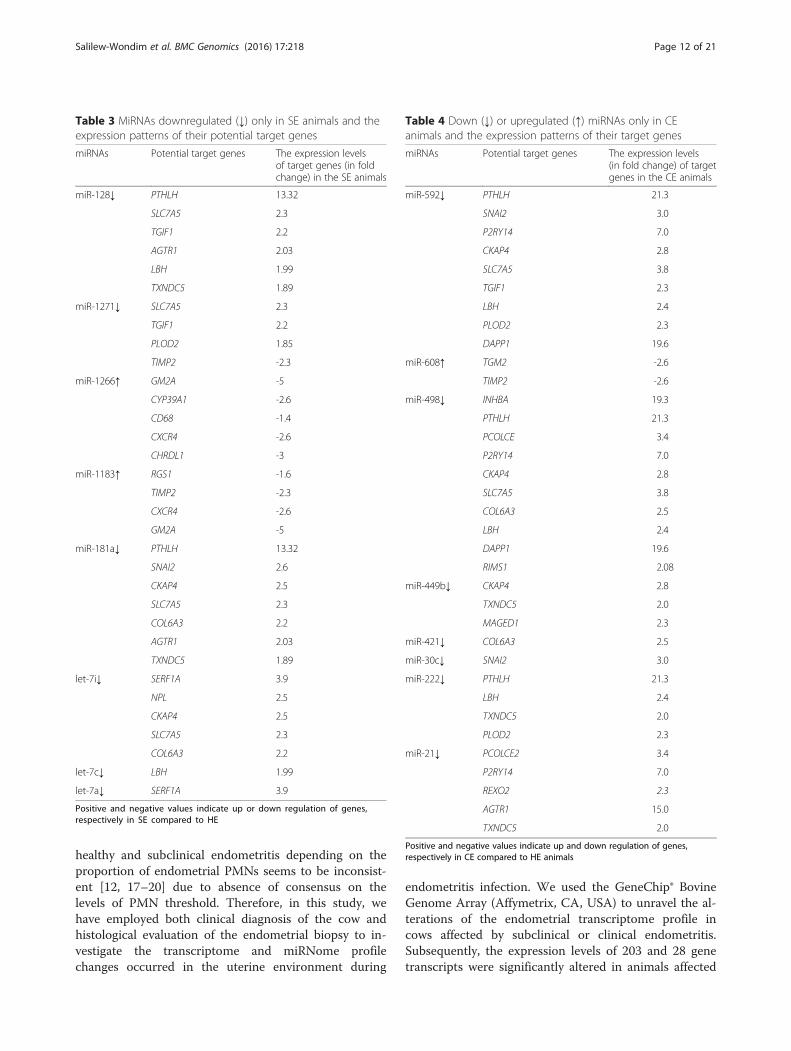
Comparative analysis of differentially expressed miRNAsand differentially expressed genesAfter performing the microRNA and mRNA expres-sion profiles from the same sample, the relationshipbetween differentially expressed miRNAs and mRNAswas in silico predicted to understand whether theaffected miRNAs in SE and CE animal groups couldhave a possible association with differentiallyexpressed genes. For this, the corresponding targetgenes of the differentially expressed miRNAs werepredicted using the web-based miRNA- target geneprediction tool (http://c1.accurascience.com/miRe-cords/). Genes predicted by at least three predictiontools were considered as potential targets of a specificmiRNA. Consequently, the expression trends of 8 dif-ferentially expressed miRNAs (miR-128, miR-1271,miR-181a, let-7i, let-7c and let-7a) in SE animal groupwere found to show opposite expression pattern rela-tive to their potential target genes (Table 3). Likewise,in the CE animals, one upregulated and eight down-regulated miRNAs exhibited a reciprocal expressionpattern with expression pattern of their correspondingpotential target gene (Table 4). Similarly, both in SE
Fig. 6 Venn diagram indicating exclusively and commonly expressed miRNAs in SE; CE and HE animal groups
Salilew-Wondim et al. BMC Genomics (2016) 17:218 Page 9 of 21

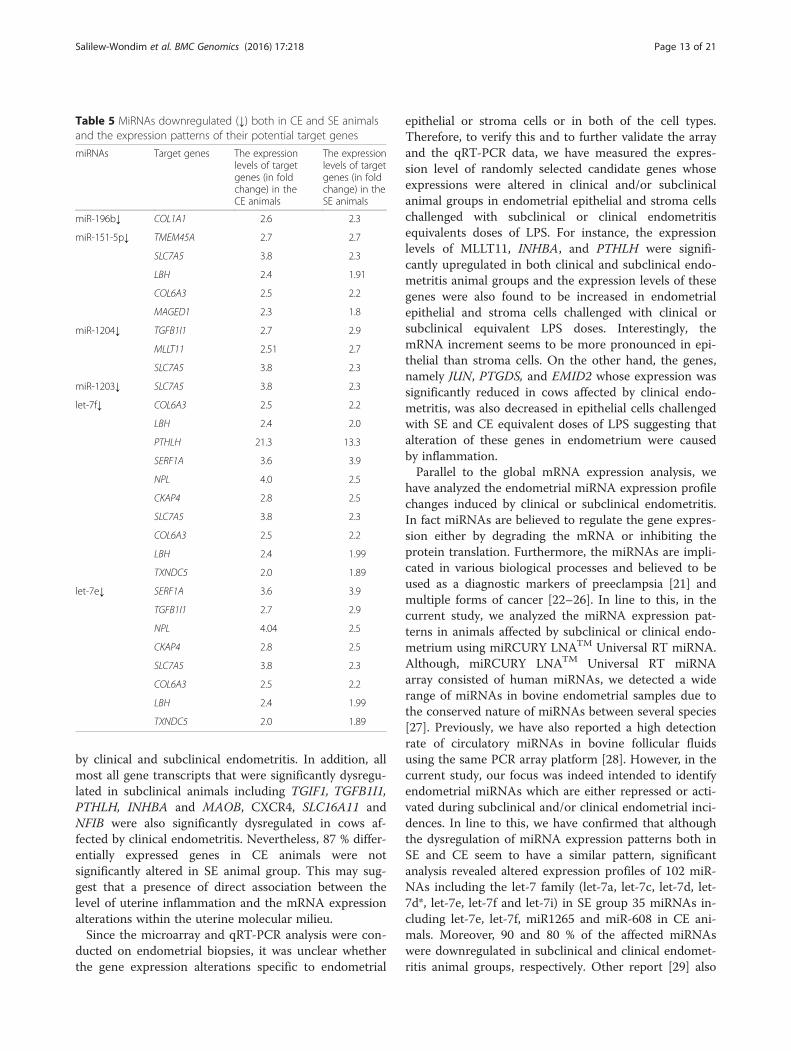
and CE animals, the expression profile of 6 dysregu-lated miRNAs exhibited a reciprocal expression pat-terns with the expression patterns of their potentialtarget genes (Table 5).
DiscussionPostpartum uterine inflammation due to bacterial infec-tion is one of the major problems impairing the product-ive and reproductive performance of dairy cows.Nevertheless, during bacterial infection, the endomet-rium may respond to the invasion of foreign body by ac-tivating or repressing certain biochemical and molecularsignals. Therefore, understanding these molecular eventscould be a step forward to craft a potential roadmap foridentifying diagnostic molecular markers that could beused as indicators of subclinical and/or clinical endomet-ritis incidence. Previously, we have demonstrated thepresence of limited endometrial gene expression alter-ations in dairy cows categorized as subclinical andhealthy based on the threshold PMN value of > 0 or =0
[12]. Unlike to that study, however, in the current study,the effects of endometritis on the expression patterns ofendometrial coding genes and small non coding geneswere investigated using endometrial samples obtainedfrom cows classified as subclinical (SE) or clinical endo-metritis (CE) based on clinical examination of the ani-mals and histological evaluation of the correspondingendometrial samples. Based on this analysis, in thepresent study, about 29.0 % of cows were found to be af-fected by endometritis at day 52–70 postpartum whichis lower compared to our previous report [12] andothers [13, 14]. These differences might be associatedwith postpartum periods at which the cows were investi-gated and the methodological approaches employed tocategorize cows. For instance, counting the proportionof polymorphonuclear neutrophils (PMNs) in endomet-rial cytology samples collected either by cytobrush orpunch forceps has been the most commonly used diag-nostic tool to identify cows affected by subclinical endo-metritis [13, 15–17]. However, classification of cows as
Fig. 7 The heatmap describing the expression patterns and hierarchical clustering of differentially expressed miRNAs between CE and HE animals.The red and green colors indicate high and low expression patterns, respectively. Thee biological replicates were used for each animal group.FC = fold change
Salilew-Wondim et al. BMC Genomics (2016) 17:218 Page 10 of 21

Fig. 8 The scatter plot showing the expression patterns of 742 miRNAs in SE and CE compared to the HE animal group. The relativeexpression of SE compared to HE (Log2 fold change) is indicated in the X axis while the relative expression of CE animal groups relativeto HE (log2 fold change) is plotted in the Y axis. Negative log2 fold and positive log2 fold change values in the X and Y axis indicatedthe upregulated and downregulation of miRNAs, respectively. Only the names of some dysregulated miRNAs are indicated toenhance visibility
Fig. 9 The heatmap indicating the expression patterns of the dysregulated miRNAs both in SE and CE compared to HE animal group. The redand green colors indicate high and low miRNA expression, respectively. FC = the relative expression in fold changes
Salilew-Wondim et al. BMC Genomics (2016) 17:218 Page 11 of 21
healthy and subclinical endometritis depending on theproportion of endometrial PMNs seems to be inconsist-ent [12, 17–20] due to absence of consensus on thelevels of PMN threshold. Therefore, in this study, wehave employed both clinical diagnosis of the cow andhistological evaluation of the endometrial biopsy to in-vestigate the transcriptome and miRNome profilechanges occurred in the uterine environment during
endometritis infection. We used the GeneChip® BovineGenome Array (Affymetrix, CA, USA) to unravel the al-terations of the endometrial transcriptome profile incows affected by subclinical or clinical endometritis.Subsequently, the expression levels of 203 and 28 genetranscripts were significantly altered in animals affected
Table 3 MiRNAs downregulated (↓) only in SE animals and theexpression patterns of their potential target genes
miRNAs Potential target genes The expression levelsof target genes (in foldchange) in the SE animals
miR-128↓ PTHLH 13.32
SLC7A5 2.3
TGIF1 2.2
AGTR1 2.03
LBH 1.99
TXNDC5 1.89
miR-1271↓ SLC7A5 2.3
TGIF1 2.2
PLOD2 1.85
TIMP2 -2.3
miR-1266↑ GM2A -5
CYP39A1 -2.6
CD68 -1.4
CXCR4 -2.6
CHRDL1 -3
miR-1183↑ RGS1 -1.6
TIMP2 -2.3
CXCR4 -2.6
GM2A -5
miR-181a↓ PTHLH 13.32
SNAI2 2.6
CKAP4 2.5
SLC7A5 2.3
COL6A3 2.2
AGTR1 2.03
TXNDC5 1.89
let-7i↓ SERF1A 3.9
NPL 2.5
CKAP4 2.5
SLC7A5 2.3
COL6A3 2.2
let-7c↓ LBH 1.99
let-7a↓ SERF1A 3.9
Positive and negative values indicate up or down regulation of genes,respectively in SE compared to HE
Table 4 Down (↓) or upregulated (↑) miRNAs only in CEanimals and the expression patterns of their target genes
miRNAs Potential target genes The expression levels(in fold change) of targetgenes in the CE animals
miR-592↓ PTHLH 21.3
SNAI2 3.0
P2RY14 7.0
CKAP4 2.8
SLC7A5 3.8
TGIF1 2.3
LBH 2.4
PLOD2 2.3
DAPP1 19.6
miR-608↑ TGM2 -2.6
TIMP2 -2.6
miR-498↓ INHBA 19.3
PTHLH 21.3
PCOLCE 3.4
P2RY14 7.0
CKAP4 2.8
SLC7A5 3.8
COL6A3 2.5
LBH 2.4
DAPP1 19.6
RIMS1 2.08
miR-449b↓ CKAP4 2.8
TXNDC5 2.0
MAGED1 2.3
miR-421↓ COL6A3 2.5
miR-30c↓ SNAI2 3.0
miR-222↓ PTHLH 21.3
LBH 2.4
TXNDC5 2.0
PLOD2 2.3
miR-21↓ PCOLCE2 3.4
P2RY14 7.0
REXO2 2.3
AGTR1 15.0
TXNDC5 2.0
Positive and negative values indicate up and down regulation of genes,respectively in CE compared to HE animals
Salilew-Wondim et al. BMC Genomics (2016) 17:218 Page 12 of 21
by clinical and subclinical endometritis. In addition, allmost all gene transcripts that were significantly dysregu-lated in subclinical animals including TGIF1, TGFB1I1,PTHLH, INHBA and MAOB, CXCR4, SLC16A11 andNFIB were also significantly dysregulated in cows af-fected by clinical endometritis. Nevertheless, 87 % differ-entially expressed genes in CE animals were notsignificantly altered in SE animal group. This may sug-gest that a presence of direct association between thelevel of uterine inflammation and the mRNA expressionalterations within the uterine molecular milieu.Since the microarray and qRT-PCR analysis were con-
ducted on endometrial biopsies, it was unclear whetherthe gene expression alterations specific to endometrial
epithelial or stroma cells or in both of the cell types.Therefore, to verify this and to further validate the arrayand the qRT-PCR data, we have measured the expres-sion level of randomly selected candidate genes whoseexpressions were altered in clinical and/or subclinicalanimal groups in endometrial epithelial and stroma cellschallenged with subclinical or clinical endometritisequivalents doses of LPS. For instance, the expressionlevels of MLLT11, INHBA, and PTHLH were signifi-cantly upregulated in both clinical and subclinical endo-metritis animal groups and the expression levels of thesegenes were also found to be increased in endometrialepithelial and stroma cells challenged with clinical orsubclinical equivalent LPS doses. Interestingly, themRNA increment seems to be more pronounced in epi-thelial than stroma cells. On the other hand, the genes,namely JUN, PTGDS, and EMID2 whose expression wassignificantly reduced in cows affected by clinical endo-metritis, was also decreased in epithelial cells challengedwith SE and CE equivalent doses of LPS suggesting thatalteration of these genes in endometrium were causedby inflammation.Parallel to the global mRNA expression analysis, we
have analyzed the endometrial miRNA expression profilechanges induced by clinical or subclinical endometritis.In fact miRNAs are believed to regulate the gene expres-sion either by degrading the mRNA or inhibiting theprotein translation. Furthermore, the miRNAs are impli-cated in various biological processes and believed to beused as a diagnostic markers of preeclampsia [21] andmultiple forms of cancer [22–26]. In line to this, in thecurrent study, we analyzed the miRNA expression pat-terns in animals affected by subclinical or clinical endo-metrium using miRCURY LNATM Universal RT miRNA.Although, miRCURY LNATM Universal RT miRNAarray consisted of human miRNAs, we detected a widerange of miRNAs in bovine endometrial samples due tothe conserved nature of miRNAs between several species[27]. Previously, we have also reported a high detectionrate of circulatory miRNAs in bovine follicular fluidsusing the same PCR array platform [28]. However, in thecurrent study, our focus was indeed intended to identifyendometrial miRNAs which are either repressed or acti-vated during subclinical and/or clinical endometrial inci-dences. In line to this, we have confirmed that althoughthe dysregulation of miRNA expression patterns both inSE and CE seem to have a similar pattern, significantanalysis revealed altered expression profiles of 102 miR-NAs including the let-7 family (let-7a, let-7c, let-7d, let-7d*, let-7e, let-7f and let-7i) in SE group 35 miRNAs in-cluding let-7e, let-7f, miR1265 and miR-608 in CE ani-mals. Moreover, 90 and 80 % of the affected miRNAswere downregulated in subclinical and clinical endomet-ritis animal groups, respectively. Other report [29] also
Table 5 MiRNAs downregulated (↓) both in CE and SE animalsand the expression patterns of their potential target genes
miRNAs Target genes The expressionlevels of targetgenes (in foldchange) in theCE animals
The expressionlevels of targetgenes (in foldchange) in theSE animals
miR-196b↓ COL1A1 2.6 2.3
miR-151-5p↓ TMEM45A 2.7 2.7
SLC7A5 3.8 2.3
LBH 2.4 1.91
COL6A3 2.5 2.2
MAGED1 2.3 1.8
miR-1204↓ TGFB1I1 2.7 2.9
MLLT11 2.51 2.7
SLC7A5 3.8 2.3
miR-1203↓ SLC7A5 3.8 2.3
let-7f↓ COL6A3 2.5 2.2
LBH 2.4 2.0
PTHLH 21.3 13.3
SERF1A 3.6 3.9
NPL 4.0 2.5
CKAP4 2.8 2.5
SLC7A5 3.8 2.3
COL6A3 2.5 2.2
LBH 2.4 1.99
TXNDC5 2.0 1.89
let-7e↓ SERF1A 3.6 3.9
TGFB1I1 2.7 2.9
NPL 4.04 2.5
CKAP4 2.8 2.5
SLC7A5 3.8 2.3
COL6A3 2.5 2.2
LBH 2.4 1.99
TXNDC5 2.0 1.89
Salilew-Wondim et al. BMC Genomics (2016) 17:218 Page 13 of 21
showed that bovine mammary epithelial cells challengedwith Staphylococcus aureus (S. aureus) or Escherichiacoli (E. coli) resulted in dysregulation of 17 miRNAs ofwhich five miRNAs including miR-148, miR-486 and let-7a-5p were unique to E. coli while four miRNAs includ-ing miR-23a and miR-99b were unique to S. aureus.Similarly, in the current study, miR-148b, miR-486-5p,miR-23b, miR-99b and members of the let-7 familieswere altered in animals affected by subclinical endomet-ritis. Moreover, other miRNAs dysregulated in thecurrent study, namely miRNA 128, let-7e, let-7d, miRNAand miRNA- 652 were also found to be altered in bovinemammary epithelial cell cultured in the presence ofstreptococcus uberis [30]. Thus, some of the observed al-terations in the expression of distinct miRNAs in ani-mals affected by subclinical or clinical endometritiscould be due to bacterial infections, such as E. coli,streptococcus uberis and S. aureus. Nevertheless, thequestion is to what extent the differentially expressedmiRNAs could be associated with differentiallyexpressed genes in animals affected by subclinical orclinical endometritis. Thus, to answer this question andto get an overview about this, we have performed insilico target prediction analysis. Accordingly, the resultevidenced that the miRNAs including the let-7 familymembers showed inverse expression profiles with theexpression patterns of their potential target genes. Forinstance, the expression level of let-7f miRNA wasdownregulated both in subclinical and clinical animalgroups and the expression patterns of its target genes,namely SERF1A and TGFB1I1 were upregulated in bothanimal groups compared to healthy animals. In deed,one of the interesting findings of the current study wasthe downregulation of the let-7 miRNA family in ani-mals affected by endometritis. The let-7 miRNA familyis believed to be involved in a wide range of cellularfunctions and is implicated in modulation of several dis-eases. These miRNAs were first discovered in Caenor-habditis elegans and their function is believed beconserved across species and maintaining the normal ex-pression patterns of these miRNAs could be a potentialoption in cancer therapeutics [31, 32]. Altered expres-sion of let-7 might result in abnormal cell developmentand cancer [33]. For instance, overexpression of let-7awas found to inhibit tumour development [34] and in-hibition may increase chemotherapy induced apoptosis[35]. Similarly, overexpression of let-7b may reduce cellproliferation and G2/M phase arrest [34] and increasedlevel of let-7b and let-7c using miRNA mimics helpedthe human hepatocytes to resist against oxidant injuryinduced by tert-butyl-hydroperoxide [36]. Furthermore,members of the Let-7 miRNA family are believed toregulate the expression of cytokines which are directlyor indirectly involved in host-functions [37–41].
Therefore, expression alterations in the Let-7 familymiRNAs in cows suffering from endometritis may dem-onstrate the consequences of bacterial infections on theexpression pattern of these miRNAs. However, the func-tional role of let-7 family miRNAs with respect to im-mune responses of the bovine endometrium due tobacterial inflammation needs further investigation.
ConclusionIn conclusion, clinical and/or subclinical endometritisinduce alterations in the expression level of bovineendometrial mRNA transcripts that are associated withthe immune system, cell adhesion, regulation of apop-totic signaling pathway, G-protein coupled receptor sig-naling pathway and chemotaxis. Moreover, subclinicaland clinical endometritis also altered the expression pat-tern of several endometrial miRNAs in postpartum cow.All in all, the results of this study unraveled the effect ofsubclinical and clinical endometritis on the endometrialtranscriptome and miRNome profile and associated mo-lecular pathways. These molecular dysregulations in turnmay disturb the homeostasis of the uterine environmentas well as uterine receptivity.
MethodsAnimals and samplesForty five lactating Holstein Friesian cows at 42–60 dayspostpartum were used for the study. Cows were housedin a free-stall barn with slotted floors and cubicles, linedwith rubber mats and received a total mixed ration. Theexperimental animals have no previous records of mas-titis and they didn’t have a record of retained placenta.Moreover, the animals have normal ovarian activity andthey all have similar parity. Handling and managementof experimental animal was performed according to therules and regulations of the German law of animal pro-tection. Moreover, the experiment was approved by theAnimal Welfare Committee of the University of Bonnwith proposition number 84-02.05.20.12.075. The ovar-ies of the cows used for the experiment were examinedby ultrasonography at 42–60 days postpartum. Animalswith the presence of a corpus luteum or a dominant fol-licle (diameter ≥ 9 mm), received one dose of GnRH(2.5 ml Receptal®) followed by PGF2α (2.0 ml Estru-mate®) seven days later to induce estrous. Following this,3 days later (day 52–70), cows were examined by an ex-perienced veterinarian for signs of clinical endometritis.Briefly, all cows were examined by rectal palpation tograde the size of the uterus on a 3-point scale (I, II, III)with grade III uteri representing the bigger ones. Like-wise, the size of the left (L) and the right (R) uterinehorn were compared to assess the symmetry of theuterus. To that regard, the uterus was classified in to 3conditions, namely the left horn bigger than the right
Salilew-Wondim et al. BMC Genomics (2016) 17:218 Page 14 of 21
one (L > R), both horns being of equal size (L = R) andthe left horn smaller than the right one (L < R). Inaddition, the uterine cavity was checked for any signs offluid discharge. Moreover, all cows were subjected tovaginoscopic inspection to evaluate the color of the vagi-nal mucosa (pinkish vs. hyperaemic), grade of wetness(on a 5-point scale (I-V) with grade 5 vagina represent-ing the wettest ones), size of the external opening of thecervix and the presence of vaginal discharge. Collect-ively, all these indications were summarized as a clinicaldiagnosis with respect to endometrial health status ofthe cow. The endometrial biopsy samples were then col-lected using a uterine biopsy punch forceps. The biop-sies collected from each cow were bisected and a partwas placed in RNA later for further molecular analysis,the remaining part was used for histological analysis.Moreover, the biopsies were analyzed for presence of fi-brosis and presence of immune cells before categorizingthe corresponding endometrium samples as healthy,clinical or subclinical endometritis.
Histological evaluation of the endometrial biopsiesTo categorize the experimental animals as healthy,clinical or subclinical endometritis group, the corre-sponding endometrial biopsy samples were fixed in4 % formalin for 24 h and then rinsed in PBS beforebeing embedded in paraffin in an automated system.From the resulting paraffin blocks, 3 μm microtomesections were produced and deparaffinized in xylol.Then the sections were hematoxylin-eosin stained ac-cording to routine methods and examined under alight microscope by one observer (CP). After inspec-tion of the total area of each section and qualitativeevaluation, the animals were assigned to the followingdiagnoses: in apparent or inflammation (acute inflam-mation, or chronic inflammation). The criteria were1) the presence, amount and type of leukocytes, 2)the occurrence of solitary lymph follicles, 3) theamount of endo- and extravascular erythrocytes, 4)the degree of glandular fibrosis and luminal fibrin de-position. Acutely inflamed endometrium was charac-terized by a strong infiltration with leukocytes(majority neutrophil granulocytes) and erythrocytes aswell as the presence of fibrin depositions in the uter-ine lumen. A chronic affection was diagnosed whenmainly lymphocytes were found, solitary lymph folli-cles were present and endometrial glands showedsigns of fibrosis. In contrast, endometrium diagnosedas healthy contained only very few leukocytes and nosolitary lymph follicles. The histological sections ofendometrial samples of cows of which the corre-sponding endometrial samples were used for globalmRNA and miRNA expression analysis are shown inFig. 11.
Classification of the endometrial biopsy samplesThe endometrial biopsy samples were classified ashealthy (HE), subclinical endometritis (SE) and clin-ical endometritis (CE) based on the results of veterin-ary clinical examination of the cows and thehistological analysis of the corresponding endometrialbiopsies. Thus, endometrial biopsies derived fromcows that did not show signs of clinical endometritisand no indications of inflammation in their corre-sponding endometrial biopsies were classified as HEgroups and those biopsies obtained from cows whichwere clinically healthy, but showed signs of inflamma-tion based on histological evaluation of the biopsieswere considered as the SE group and endometrialsamples derived from cows that exhibited evidence ofendometritis both in clinical assessment andhistological evaluation were classified as CE group(Table 6).
RNA isolation from endometrial samplesTotal RNA enriched with miRNA was isolated fromthree biological replicates of SE, CE or HE cows usingmiRNeasy mini kit (QIAGEN GmbH, Hilden, Germany).Each cow from each animal group was considered asone biological replicate. The concentration of the RNAwas analyzed using the Nanodrop 8000 Spectrophotom-eter (Thermo Fisher Scientific Inc, DE, USA). The RNAquality was evaluated using Agilent 2100 Bioanalyzerwith RNA 6000 Nano LabChip® Kit (Agilent Technolo-gies Inc, CA, USA).
Array hybridization and scanningThe total RNA samples isolated from each SE, CE andHE in three biological replicates were subjected to geneexpression analysis using the GeneChip bovine Genomearray (Affymetrix, CA, USA). For this, we performedRNA amplification, cDNA synthesis, labelling and arrayhybridization for each of the three cows of SE, CE or HEgroup according to the recommendations and suggestionof the GeneChip®3′ IVT Express Kit (Affymetrix, CA,USA). Three hybridizations were preformed for each SE,CE or HE animals and the three hybridization repre-sented the biological replicates correspond to three ani-mals of SE, CE or HE group. The array slides were thenwashed and stained using the Fluidics Station 450/250(Affymetrix, CA, USA) following the GeneChip® expres-sion wash, stain and scan user manual. After 16 h ofhybridization, the arrays were scanned with the Gene-Chip™3000 laser confocal slide scanner (Affymetrix, CA,USA) integrated with GeneChip® Operating System(GCOS). The signal intensity of the control probes weremonitored during array scanning
Salilew-Wondim et al. BMC Genomics (2016) 17:218 Page 15 of 21
Array data analysis and visualizationAfter scanning, the data was normalized using GC ro-bust multi-array average analysis (GCRMA) [42] usingbioconductor packages (http://bioconductor.org) in theR environment (www.r-project.org). Linear models formicroarray data (LIMMA) [43] was employed to identifydifferentially expressed genes in SE and CE relative tothe HE animals Benjamini–Hochberg procedure of falsediscovery rate p value adjustment was used during ana-lysis [44]. The G- profiler analysis tool was used to in-vestigate the functional annotation of differentiallyexpressed genes [45]. The Heatmaps and clustering ofdifferentially expressed genes were constructed usingPermutMatrix software [46].
Quantitative Reverse Transcription Real Time polymeraseChain Reaction (qRT-PCR)The expression profiles of randomly selected differen-tially expressed genes were validated using SYBR Greenbased qRT-PCR using sequence specific primers (Table 7)designed using the online primer design tool (http://fro-do.wi.mit.edu/primer3/). The specificity and identity of
the gene fragments amplified by each primer pair wereverified by sequencing their PCR products using Geno-meLab™ GeXP Genetic Analysis System (BeckmanCoulter). Afterwards, the cDNA samples from SE, CEand HE sample group were synthesized by reverse tran-scription of equal amount of total RNA from each endo-metrial biopsy. The qRT-PCR was then performed in20 μl reaction volume containing iTaq SYBR GreenSupermix with ROX (Bio-Rad laboratories, Munich,Germany), the cDNA samples, the specific forward andreverse primer in the StepOnePlus™ Real-Time PCR Sys-tems (Applied Biosystems, Foster city, CA). At the endof each PCR reaction, the specificity the amplificationwas confirmed by evaluating the dissociation curve. Theabundance of each transcript in each sample was deter-mined using a comparative threshold cycle comparativeCt (2−ΔΔCT) method as described previously [47]. Thedata obtained from qRT-PCR was analyzed after the Ctvalue of the target genes was normalized with the Ctvalue of Glyceraldehyde-3-phosphate dehydrogenase(GAPDH). The qRT-PCR was performed in three bio-logical and two technical replicates. The Student’s t-test
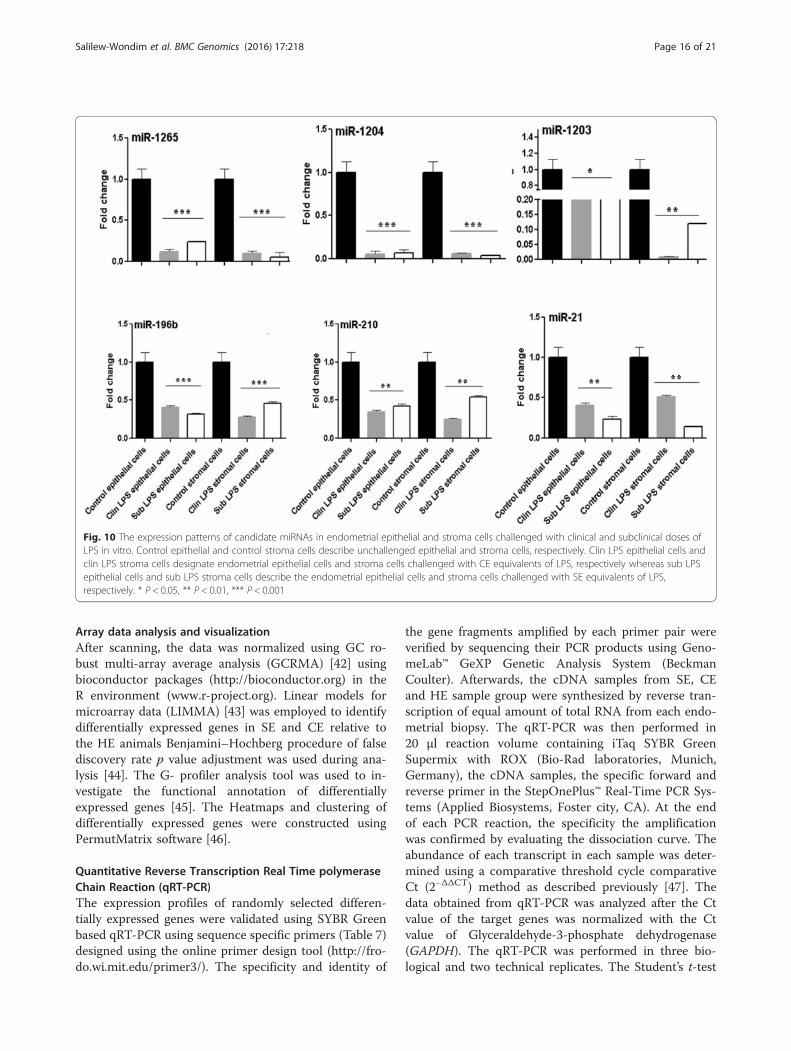
Fig. 10 The expression patterns of candidate miRNAs in endometrial epithelial and stroma cells challenged with clinical and subclinical doses ofLPS in vitro. Control epithelial and control stroma cells describe unchallenged epithelial and stroma cells, respectively. Clin LPS epithelial cells andclin LPS stroma cells designate endometrial epithelial cells and stroma cells challenged with CE equivalents of LPS, respectively whereas sub LPSepithelial cells and sub LPS stroma cells describe the endometrial epithelial cells and stroma cells challenged with SE equivalents of LPS,respectively. * P < 0.05, ** P < 0.01, *** P < 0.001
Salilew-Wondim et al. BMC Genomics (2016) 17:218 Page 16 of 21

or the least significant difference test procedure wasemployed to detect the mRNA expression differencesbetween the samples. Differences with p < 0.05 wereconsidered as significant.
MiRNA expression pattern analysis in SE, CE and HEanimalsThe expression of patterns of miRNAs in SE, CE andHE animals were investigated using the Exiqon micro-RNA PCR Human Panels (I + II) array technology. ThecDNA was synthesized from 88 ng of total RNA fromeach sample following the manufacturer’s protocol. Be-fore performing qRT-PCR reaction, the cDNA sampleswere diluted 100-fold and mixed with ready to useSYBR-Green mix. Then the master mix was roboticallydistributed on 384 well PCR plate containing miRNAspecific primers. The real time qRT-PCR was run in a7900H thermo cycler (ABI) using the following thermal-cycling parameters: 95 °C for 10 min, 40 cycle of 95 °Cfor 10 s, 60 °C for 1 min followed by a melting curveanalysis. The PCR data was analyzed using web-basedPCR array data analysis software RT2 profile PCR arraydata analysis (http://pcrdataanalysis.sabiosciences.com/pcr/arrayanalysis.php) and normalization was performedusing the geometric mean of miR-23a, miR-103, miR-191 and SNORD49A. To minimize the potential noise,miRNAs with Ct value higher than 36 were considered
as undetected. The data was generated from three bio-logical replicates of the SE, CE and HE sample groupsand the three biological replicates correspond to thesamples derived from three animals of SE, CE or HEgroup. Following this, comparative analysis of differen-tially expressed miRANs and differentially expressedgenes analyzed using miRecords (http://c1.accurascien-ce.com/miRecords/), an online animal miRNA-targetinteraction tool which integrates 12 miRNA-target pre-diction tools, including DIANA-microT, MicroInspector,miRanda, MirTarget2, miTarget, PicTar, PITA, andTargetScan.
Experssion analysis of candidate mRNA transcripts andmiRNAs in endometrial epithelial and stroma cellschallenged with lipopolysacharide (LPS) in vitroEndometrial cell culture was preformed to validate se-lected candidate genes and miRNAs obtained from thearray results. For this, endometrial cell were collectedfrom healthy non pregnant cows with no evidence ofgenital disease or microbial infection. The endomet-rial samples were cut into pieces and incubated in25 ml sterile digestive solution [50 mg trypsin III(Gibco)], 50 mg collagenase II (Sigma), and 10 μl de-oxyribonuclease I (Qiagen) in 100 ml phosphate buf-fer saline at 37 °C. The cell suspension was thenfiltered in a 40-μm mesh. The DMEM/F-12 medium
Fig. 11 Histological sections of endometrial samples of which the corresponding endometrial biopsies which were used for global mRNA andmiRNA expression analysis from cows classified as suffering from clinical endometritis (a), subclinical endometritis (b) and healthy animals (c)
Salilew-Wondim et al. BMC Genomics (2016) 17:218 Page 17 of 21

Table 6 Classification of experimental animals as HE, SE or CE based on clinical examination of the animals and histologicalevaluation of the corresponding endometrial biopsies
AnimalNr.
Rectal examination Vaginoscopic examination
Size(G I-III)
Symmetry(L vs. R)
Contractility(I-III)
Uterinecharge(yes/no)
Mucosalcolor
Wetness(I-V)
Cervixopening(mm)
Discharge(yes/no)
Clinicalexamination
Histologicalclassification
Overallclassification
245 III L > R I no pinkish II 3 no healthy in apparent HE
534 II L = R I no pinkish III 0 no healthy in apparent HE
549 IV L = R I-II no hyperaemic IV 6 no healthy in apparent HE
665 II L < < R II no pale III 6 no healthy in apparent HE
328 III L > R I no pinkish III 6 no healthy in apparent HE
613 II L = R II no pinkish III 3 no healthy in apparent HE
627 II L = R I no pinkish III 0 no healthy chronicinflammation
SE
602 II L > R I I ? pinkish II 3 no healthy in apparent HE
603 II L = R I no pinkish II 0 no healthy acuteinflammation
SE
550 III L < R II yes pinkish III 3 yes sick chronicinflammation
CE
369 II-III L > R I-II yes pinkish II 6 no healthy chronicinflammation
SE
444 II-III L > R K II no pinkish III 0 no healthy in apparent HE
459 II L = R I-II no pinkish II 0 no healthy in apparent HE
506 III L < < R ? no pinkish III 3 no healthy in apparent HE
432 III L > R II-III no pinkish II 3 no healthy in apparent HE
470 II L = R I no pinkish III 3 no healthy in apparent HE
445 III L < R II no pinkish III 6 no healthy in apparent HE
443 ? L < R I-II no pinkish II 3 no healthy ? ?
347 II-III L = R II no pinkish III 6 no healthy in apparent HE
329 IV L < R I-II yes pinkish III 3 yes sick chronicinflammation
CE
755 I-II L = R II no hyperaemic II 3 yes sick chronicinflammation
CE
702 I L = R II no pinkish II 0 no healthy in apparent HE
639 I L = R I-II no pinkish III 0 no healthy inflammation SE
618 I L > R II no pinkish II 0 no healthy inflammation SE
749 I-II L = R II no hyperaemic III 4.5 yes sick HE
721 I-II L = R II yes hyperaemic IV 9 no healthy inflammation SE
450 I-II L = R II-III no pinkish II 0 no healthy in apparent HE
469 I L = R III no pinkish III-IV 7.5 no healthy in apparent HE
723 I-II L = R II-III no pinkish III-IV 6 no healthy in apparent HE
737 I L = R I-II yes pinkish IV 9 yes sick in apparent HE
642 II L = R II no pinkish II-III 6 yes sick acuteinflammation
CE
665 III L > R II no pinkish III 3 no healthy in apparent HE
615 II-III L = R I-II no pinkish III 3 no healthy in apparent HE
764 I L = R I-II no pinkish II 3 no healthy in apparent HE
725 I-II L = R II no pinkish/hyperaemic
IV 7.5 no healthy ? ?
740 II L > R II no blassrosa II 6 no healthy ? ?
Salilew-Wondim et al. BMC Genomics (2016) 17:218 Page 18 of 21

Table 7 Genes and corresponding primers used for validation of the gene expression data using qRT-PCR
Accession No. Gene symbol Gene title Primer 5‘–3‘ Bp
NM_001077009 P2RY14 Bos taurus purinergic receptor P2Y, G-protein coupled, 14 F TATGCCAGCCATTTAGAGAGG 137
R GGAGGTGGGAATTCACAGAG
NM_174363.2 INHBA Bos taurus inhibin, beta A F GCAAGGTCAACATCTGCTGTA
R TACAACATGGACATGGGTCTC
NM_177944 MAOB Bos taurus monoamine oxidase B F CTATGGCTTTGTGCTTGTCCT 253
R TCCTGAGAGATGGGATAAAGC
NM_001024563.1 KCNB2 Bos taurus potassium voltage-gated channel, Shab-relatedsubfamily, member 2
F CTCTTTACTTTCTCCGCCAGA 282
R CATCTTGCACCCTTCTTGACT
NM_001083770.1 C16H1orf95 Bos taurus chromosome 16 open readingframe, human C1orf95
F GATAGACAGATTCCTGCCTGGT 268
R TGTTGAGTGTAATGGGGAAGG
NM_001077858.2 CTPS Bos taurus CTP synthase F AGGAAGAGGGAAACCAGAGAC 277
R CCCTTGAGCAAAGCTGTCTAC
NM_174753.1 PTHLH Bos taurus parathyroid hormone-like hormone F AGCAGAGACCTTCAGAAGACG 267
R GAAATTCAGCAGCACCAAGA
NM_001075835.1 NKIRAS1 Bos taurus NFKB inhibitor interacting Ras-like 1 F GACCTTTCGGAACAGAGACAG 265
R CACGGGTACCTAGAGGCAGT
NM_001101105.2 TRIB1 Bos taurus tribbles homolog 1 (Drosophila) F CGTGTATACCTCACGCACTGT 287
R CAGCAAACCCAGAGTCCTTAG
AF399642.1 CXCR4 Bos taurus CXC chemokine receptor 4, complete cds F CCACTCCAAAGGCTATCAGAA 287
R CTCTGCTCACAGAGGTGAGTG
NM_173879.2 F5 Bos taurus coagulation factor V (proaccelerin, labile factor) F GAACGGACTGGAAACCTTACA 252
R GCCCACTCTAAGTGGTTTGAT
NM_174791.4 PTGDS Bos taurus prostaglandin D2 synthase 21 kDa (brain) F AGGAAAGACCAGTGTGAGACG 285
R GAACACAATGCCTTCCTCTGT
XM_592894.6 CHRDL1 PREDICTED: Bos taurus chordin-like 1 F CCAGGTGTTCTCTGAAAGCTC 319
R GGTACTTATGGGCTTTGCTTG
BP the lengths of the DNA sequence (in base pair)
Table 6 Classification of experimental animals as HE, SE or CE based on clinical examination of the animals and histologicalevaluation of the corresponding endometrial biopsies (Continued)
606 I-II L = R II no pinkish III 7.5 yes sick ? ?
522 III L < < R II no pinkish II 3 no healthy in apparent HE
727 I-II ? I-II no pinkish II 0 no healthy in apparent HE
729 I-II L = R I-II no pinkish II 0 no healthy in apparent HE
728 II L = R I-II no pinkish II 0 no healthy ? ?
753 II L = R II-III no pinkish III-IV 3 no healthy in apparent HE
767 II L < R I-II no pale I 0 no healthy ? ?
736 I L = R II no pinkish II 3 yes sick ? ?
696 II-III l < R I-II yes hyperaemic IV 9 yes sick acuteinflammation
CE
L > R left horn larger than right uterine horn, L < R right horn larger than left uterine horn
Salilew-Wondim et al. BMC Genomics (2016) 17:218 Page 19 of 21

supplemented with 10 % fetal bovine serum wasadded to the filtrate and centrifuged at 100 × g for10 min. After two consecutive washes, the cells weresuspended in DMEM/F-12 containing 10 % fetal bo-vine serum, 10 μl/ml penicillin streptomycin and10 μl/ml fungizol and plated at a density of 1 × 10⁵
cells/ml in 24-well plates. The cells were then cul-tured at 37 °C, 5 % CO2 in a humidified incubator.
Stromal and epithelial cell separation andlipopolysaccharide (LPS) challengeThe endometrial stromal and epithelial cells were sepa-rated after 18 h of culture. For this, the cell suspensionwas collected leaving the attached cells in the plate.Those cells attached to the plate after 18 h of culturewere considered to be the stromal cells [48], whileothers which were in the cell suspension were consid-ered as epithelial cells. The cell suspension was thenplated to the new 24 well plate and cultured at 37 °C,5 % CO2 in a humidified incubator to allow the epithe-lial cells to adhere [49]. In addition, the stromal and epi-thelial cell identity was monitored based on theirmorphology [48]. At the stage of confluence, the epithe-lial and stromal cells were challenged with clinical (3 μg/ml) or subclinical (0.5 μg/ml) doses of ultra pure LPSfrom E. coli 0111:B4 strain- TLR4 ligand (Invitrogen) for24 h. These doses were similar to the uterine lumen ofsubclinical and clinical endometritis affected animals[50]. The supernatants and harvested cells were kept in–80 °C until further use. The cell culture supernatantwas used for measuring prostaglandin E2 (PGE2) andprostaglandin F2 alpha (PGF2α) levels using Enzyme-linked Immunosorbent Assay (ELISA). The absence ofimmune cells in the primary epithelial cell and stromalcultures was confirmed by measuring the expressionlevel of CD45 which is pan-leukocyte marker [51]. After-wards, the expression levels the candidate differentiallyexpressed gene transcripts and miRNAs were quantifiedin both endometrial and epithelial cells challenged withSE or CE equivalent doses of LPS.
Availability of supporting dataThe raw and normalized data gene expression data usedfor this manuscript have been deposited in the Gene Ex-pression Omnibus repository, with GEO accession num-ber GSE74987 (http://www.ncbi.nlm.nih.gov/geo/query/acc.cgi?acc=GSE74987).
Additional files
Additional file 1: Table S1. The list of differentially expressed genesbetween CE and HE animals along with their fold change, p values andFDR. (XLSX 31 kb)
Additional file 2: Table S2. The list of differentially expressed genesbetween SE and HE animals along with their fold change, p values andFDR. (XLSX 12 kb)
Additional file 3: Figure S1. The expression pattern and the hierarchicalclustering of differentially expressed miRNAs between SE and HE animalgroups. (TIF 130 kb)
Additional file 4: Table S3. The list of differentially expressed miRNAsbetween SE and HE animal groups. (XLSX 12 kb)
AbbreviationsCE: clinical endometritis; FDR: false discovery rate; HE: healthy animals;LPS: lipopolysaccharide; miRNA: microRNA; SE: subclinical endometritis.
Competing interestsThe authors declare that they have no competing interests.
Authors’ contributionsDSW: performed experiment, sample processing and array hybridization, dataanalysis, qRT-PCR analysis, interpreting the results and drafting and writingthe manuscript. SI: performed cell culture, qRT-PCR for genes and miRNAs incultured endometrial stroma and epithelial cells, read the manuscript. SG:performed PCR and fragment sequencing, read the manuscript. DT: designthe experiment, supervised the research, revised the manuscript and serve asa corresponding author. MH & HB: designed the experiment, collectexperimental samples and revised the manuscript. CP: pathohistologicalevaluation of the endometrial biopsies and revised the manuscript. ET &CN: revised the manuscript, KS: design the experiment, supervised thework and corrected the manuscript. MH: design the experiment, samplecollection & organization and revised the manuscript. All authors haveread and approved the manuscript.
AcknowledgementsThis study was financially supported by Zoetis, Animal Health.
Author details1Department of Animal Breeding and Husbandry, Institute of Animal Science,Endenicher Allee 15, 53115 Bonn, Germany. 2Clinic for Cattle, University ofVeterinary Medicine, 30173 Hannover, Germany. 3University of VeterinaryMedicine, 30173 Hannover, Germany. 4Clinic of Reproductive Medicine,Vetsuisse Faculty, University of Zurich, 8057 Zurich, Switzerland.
Received: 11 November 2015 Accepted: 23 February 2016
References1. Fenwick MA, Fitzpatrick R, Kenny DA, Diskin MG, Patton J, Murphy JJ, et al.
Interrelationships between negative energy balance (NEB) and IGFregulation in liver of lactating dairy cows. Domest Anim Endocrinol. 2008;34:31–44.
2. Wathes D, Fenwick M, Cheng Z, Bourne N, Llewellyn S, Morris D, et al.Influence of negative energy balance on cyclicity and fertility in the highproducing dairy cow. Theriogenology. 2007;68:S232–41.
3. Toni F, Vincenti L, Ricci A, Schukken YH. Postpartum uterine diseases andtheir impacts on conception and days open in dairy herds in Italy.Theriogenology. 2015;84:1206–14.
4. Sordillo LM, Contreras GA, Aitken SL. Metabolic factors affecting theinflammatory response of periparturient dairy cows. Anim Health Res Rev.2009;10:53–63.
5. Cheong SH, Nydam DV, Galvao KN, Crosier BM, Gilbert RO. Cow-level andherd-level risk factors for subclinical endometritis in lactating Holstein cows.J Dairy Sci. 2011;94:762–70.
6. Thatcher W, Santos J, Silvestre F, Kim I, Staples C. Perspective onphysiological/endocrine and nutritional factors influencing fertility in post‐partum dairy cows. Reprod Domest Anim. 2010;45:2–14.
7. Hammon DS, Evjen IM, Dhiman TR, Goff JP, Walters JL. Neutrophil functionand energy status in Holstein cows with uterine health disorders. VetImmunol Immunopathol. 2006;113:21–9.
8. Galvão K, Flaminio M, Brittin S, Sper R, Fraga M, Caixeta L, et al. Associationbetween uterine disease and indicators of neutrophil and systemic energystatus in lactating Holstein cows. J Dairy Sci. 2010;93:2926–37.
Salilew-Wondim et al. BMC Genomics (2016) 17:218 Page 20 of 21
9. Sheldon IM, Williams EJ, Miller AN, Nash DM, Herath S. Uterine diseases incattle after parturition. Vet J. 2008;176:115–21.
10. Ghasemi F, Gonzalez-Cano P, Griebel P, Palmer C. Proinflammatory cytokinegene expression in endometrial cytobrush samples harvested from cows withand without subclinical endometritis. Theriogenology. 2012;78:1538–47.
11. Gabler C, Drillich M, Fischer C, Holder C, Heuwieser W, Einspanier R.Endometrial expression of selected transcripts involved in prostaglandinsynthesis in cows with endometritis. Theriogenology. 2009;71:993–1004.
12. Hoelker M, Salilew-Wondim D, Drillich M, Christine G-B, Ghanem N, GoetzeL, et al. Transcriptional response of the bovine endometrium and embryo toendometrial polymorphonuclear neutrophil infiltration as an indicator ofsubclinical inflammation of the uterine environment. Reprod Fert Dev. 2012;24:778–93.
13. Gilbert RO, Shin ST, Guard CL, Erb HN, Frajblat M. Prevalence of endometritisand its effects on reproductive performance of dairy cows. Theriogenology.2005;64:1879–88.
14. Plöntzke J, Madoz L, De la Sota R, Drillich M, Heuwieser W. Subclinicalendometritis and its impact on reproductive performance in grazing dairycattle in Argentina. Anim Reprod Sci. 2010;122:52–7.
15. Kasimanickam R, Duffield T, Foster R, Gartley C, Leslie K, Walton J, et al.Endometrial cytology and ultrasonography for the detection of subclinicalendometritis in postpartum dairy cows. Theriogenology. 2004;62:9–23.
16. Sheldon IM, Lewis GS, LeBlanc S, Gilbert RO. Defining postpartum uterinedisease in cattle. Theriogenology. 2006;65:1516–30.
17. Barlund C, Carruthers T, Waldner C, Palmer C. A comparison of diagnostictechniques for postpartum endometritis in dairy cattle. Theriogenology.2008;69:714–23.
18. Galvão K, Frajblat M, Brittin S, Butler W, Guard C, Gilbert R. Effect ofprostaglandin F2alpha on subclinical endometritis and fertility in dairy cows.J Dairy Sci. 2009;92:4906–13.
19. Kasimanickam R, Duffield T, Foster R, Gartley C, Leslie K, Walton J, et al. Theeffect of a single administration of cephapirin or cloprostenol on thereproductive performance of dairy cows with subclinical endometritis.Theriogenology. 2005;63:818–30.
20. Drillich M, Tesfaye D, Rings F, Schellander K, Heuwieser W, Hoelker M.Effects of polymorphonuclear neutrophile infiltration into the endometrialenvironment on embryonic development in superovulated cows.Theriogenology. 2012;77:570–8.
21. Freeman DJ, Tham K, Brown EA, Rumley A, Lowe GD, Greer IA. Fetalcorticotrophin-releasing hormone mRNA, but not phosphatidylserine-exposing microparticles, in maternal plasma are associated with factor VIIactivity in pre-eclampsia. J Thromb Haemost. 2008;6:421–7.
22. Kopreski MS, Benko FA, Kwak LW, Gocke CD. Detection of tumor messengerRNA in the serum of patients with malignant melanoma. Clin Cancer Res.1999;5:1961–5.
23. Taylor DD, Gercel-Taylor C. MicroRNA signatures of tumor-derived exosomesas diagnostic biomarkers of ovarian cancer. Gynecol Oncol. 2008;110:13–21.
24. Mitchell PS, Parkin RK, Kroh EM, Fritz BR, Wyman SK, Pogosova-AgadjanyanEL, et al. Circulating microRNAs as stable blood-based markers for cancerdetection. Proc Natl Acad Sci U S A. 2008;105:10513–8.
25. Rabinowits G, Gercel-Taylor C, Day JM, Taylor DD, Kloecker GH. ExosomalmicroRNA: a diagnostic marker for lung cancer. Clin Lung Cancer. 2009;10:42–6.
26. Dasi F, Lledo S, Garcia-Granero E, Ripoll R, Marugan M, Tormo M, et al. Real-time quantification in plasma of human telomerase reverse transcriptase(hTERT) mRNA: a simple blood test to monitor disease in cancer patients.Lab Invest. 2001;81:767–9.
27. Berezikov E. Evolution of microRNA diversity and regulation in animals. NatRev Genet. 2011;12:846–60.
28. Sohel MMH, Hoelker M, Noferesti SS, Salilew-Wondim D, Tholen E, Looft C,et al. Exosomal and Non-exosomal transport of extra-cellular microRNAs infollicular fluid: implications for bovine oocyte developmental competence.PLoS One. 2013;8:e78505.
29. Jin W, Ibeagha-Awemu EM, Liang G, Beaudoin F, Zhao X. TranscriptomemicroRNA profiling of bovine mammary epithelial cells challenged withEscherichia coli or Staphylococcus aureus bacteria reveals pathogendirected microRNA expression profiles. BMC Genomics. 2014;15:181.
30. Lawless N, Foroushani AB, McCabe MS, O’Farrelly C, Lynn DJ. Nextgeneration sequencing reveals the expression of a unique miRNA profile inresponse to a Gram-positive bacterial infection. PLoS One. 2013;8:e57543.
31. Boyerinas B, Park SM, Hau A, Murmann AE, Peter ME. The role of let-7 in celldifferentiation and cancer. Endocr Relat Cancer. 2010;17:F19–36.
32. Wang Y, Hu X, Greshock J, Shen L, Yang X, Shao Z, et al. Genomic DNAcopy-number alterations of the let-7 family in human cancers. PLoS One.2012;7:e44399.
33. Roush S, Slack FJ. The let-7 family of microRNAs. Trends Cell Biol. 2008;18:505–16.
34. Liu C, Kelnar K, Vlassov AV, Brown D, Wang J, Tang DG. Distinct microRNAexpression profiles in prostate cancer stem/progenitor cells and tumor-suppressive functions of let-7. Cancer Res. 2012;72:3393–404.
35. Meng F, Henson R, Wehbe-Janek H, Smith H, Ueno Y, Patel T. The MicroRNAlet-7a modulates interleukin-6-dependent STAT-3 survival signaling inmalignant human cholangiocytes. J Biol Chem. 2007;282:8256–64.
36. Hou W, Tian Q, Steuerwald NM, Schrum LW, Bonkovsky HL. The let-7microRNA enhances heme oxygenase-1 by suppressing Bach1 andattenuates oxidant injury in human hepatocytes. Biochim Biophys Acta.2012;1819(11-12):1113–22.
37. Chen XM, Splinter PL, O’Hara SP, LaRusso NF. A cellular micro-RNA, let-7i,regulates Toll-like receptor 4 expression and contributes to cholangiocyteimmune responses against Cryptosporidium parvum infection. J Biol Chem.2007;282:28929–38.
38. Sung SY, Liao CH, Wu HP, Hsiao WC, Wu IH, Yu J, et al. Loss of let-7microRNA upregulates IL-6 in bone marrow-derived mesenchymal stemcells triggering a reactive stromal response to prostate cancer. PLoS One.2013;8:e71637.
39. Kumar M, Ahmad T, Sharma A, Mabalirajan U, Kulshreshtha A, Agrawal A,et al. Let-7 microRNA-mediated regulation of IL-13 and allergic airwayinflammation. J Allergy Clin Immunol. 2011;128:1077–85. e1071-1010.
40. Iliopoulos D, Hirsch HA, Struhl K. An epigenetic switch involving NF-kappaB,Lin28, Let-7 MicroRNA, and IL6 links inflammation to cell transformation.Cell. 2009;139:693–706.
41. Swaminathan S, Suzuki K, Seddiki N, Kaplan W, Cowley MJ, Hood CL, et al.Differential regulation of the Let-7 family of microRNAs in CD4+ T cellsalters IL-10 expression. J Immunol. 2012;188:6238–46.
42. Gharaibeh RZ, Fodor AA, Gibas CJ. Background correction usingdinucleotide affinities improves the performance of GCRMA. BMCBioinformatics. 2008;9:452.
43. Smyth GK. Limma: linear models for microarray data. In: Gentleman R, CareyV, Dudoit S, Irizarry R, Huber W, editors. Bioinformaticsand computationalbiology solutions using R and bioconductor. New York: Springer; 2005.
44. Benjamini Y, Hochberg Y. Controlling the false discovery rate: a practicaland powerful approach to multiple testing. Roy Statist Soc Ser:B. 1995;57:289–300.
45. Reimand J, Kull M, Peterson H, Hansen J, Vilo J. G:Profiler–a web-basedtoolset for functional profiling of gene lists from large-scale experiments.Nucleic Acids Res. 2007;35(Web Server issue):W193–200.
46. Caraux G, Pinloche S. PermutMatrix: a graphical environment to arrangegene expression profiles in optimal linear order. Bioinformatics. 2005;21:1280–1.
47. Livak KJ, Schmittgen TD. Analysis of relative gene expression data usingreal-time quantitative PCR and the 2(-Delta Delta C(T)) Method. Methods.2001;25:402–8.
48. Fortier MA, Guilbault LA, Grasso F. Specific properties of epithelial andstromal cells from the endometrium of cows. J Reprod Fertil. 1988;83:239–48.
49. Kim JJ, Fortier MA. Cell type specificity and protein kinase C dependency onthe stimulation of prostaglandin E2 and prostaglandin F2 alpha productionby oxytocin and platelet-activating factor in bovine endometrial cells. JReprod Fertil. 1995;103:239–47.
50. Herath S, Williams EJ, Lilly ST, Gilbert RO, Dobson H, Bryant CE, et al. Ovarianfollicular cells have innate immune capabilities that modulate theirendocrine function. Reproduction. 2007;134:683–93.
51. Herath S, Fischer DP, Werling D, Williams EJ, Lilly ST, Dobson H, et al.Expression and function of Toll-like receptor 4 in the endometrial cells ofthe uterus. Endocrinology. 2006;147:562–70.
Salilew-Wondim et al. BMC Genomics (2016) 17:218 Page 21 of 21