Climatological simulations of ozone and atmospheric ...
22
CLIMATE RESEARCH Clim Res Vol. 59: 207–228, 2014 doi: 10.3354/cr01211 Published online April 16 1. INTRODUCTION The Greater Cairo (GC) area in Egypt (population ~15 million) is the largest city in northern Africa and one of the 15 largest cities in the world (Demographia 2014). Urbanization and industrialization have in- creased rapidly over the past 50 yr, causing increased levels of air pollutants and numerous air quality ex- ceedances (Robaa & Hafez 2002, Robaa 2003, Zakey et al. 2008). This population-dense urban area has high anthropogenic emissions from transportation, industry, and waste burning common to global mega- cities (Molina & Molina 2004), and is further subject to seasonal enhancements of atmospheric aerosols © Inter-Research 2014 · www.int-res.com *Corresponding author: [email protected] Climatological simulations of ozone and atmospheric aerosols in the Greater Cairo region A. L. Steiner 1, *, A. B. Tawfik 1,6 , A. Shalaby 2 , A. S. Zakey 2 , M. M. Abdel-Wahab 3 , Z. Salah 2 , F. Solmon 4 , S. Sillman 1 , R. A. Zaveri 5 1 Department of Atmospheric, Oceanic and Space Sciences, University of Michigan, Ann Arbor, Michigan 48109-2143, USA 2 Egyptian Meteorological Authority, PO Box 11784, Cairo, Egypt 3 Department of Meteorology, Cairo University, PO Box 12613, Cairo, Egypt 4 Earth System Physics Group, International Centre for Theoretical Physics, 34151Trieste, Italy 5 Atmospheric Sciences and Global Change Division, Pacific Northwest National Laboratory, Richland, Washington 99352, USA 6 Present address: Center for Ocean-Land-Atmosphere Studies, Calverton, Maryland 20705-3106, USA ABSTRACT: An integrated chemistry–climate model (RegCM4-CHEM) simulates present-day climate, ozone and tropospheric aerosols over Egypt with a focus on northern Africa and the Greater Cairo (GC) region. The densely populated GC region is known for its severe air quality issues driven by high levels of anthropogenic pollution in conjunction with natural sources such as dust, and agricultural burning events. We find that current global emission inventories underesti- mate key pollutants such as nitrogen oxides and anthropogenic aerosol species. In the GC region, average ground-based observations of the daily July maximum nitrogen dioxide (NO 2 ) are 40 to 60 parts per billion by volume (ppbv) and are about 10 ppbv higher than modeled estimates, likely due to model grid cell resolution, improper boundary layer representation, and poor emissions inventories. Observed July daily maximum ozone concentrations range from 30 ppbv (winter) to 90 ppbv (summer). The model reproduces the seasonal cycle fairly well, but modeled July ozone is underestimated by approximately 10 ppbv and exhibits little interannual variability. For aerosols, springtime dust events dominate the seasonal aerosol cycle. The chemistry– climate model captures the springtime peak aerosol optical depth (AOD) of 0.7 to 1 but is slightly greater than satellite-derived AOD. Observed AOD decreases in the summer and increases again in the fall due to agricultural burning events in the Nile Delta; however, the model underestimates this observed AOD peak in fall, as standard emissions inventories underestimate the extent of this burning and the resulting aerosol emissions. Our comparison of modeled gas and particulate phase atmospheric chemistry in the GC region indicates that improved emissions inventories of mobile sources and other anthropogenic activities, specifically NO x and organic aerosols, are needed to improve air quality simulations in this region. KEY WORDS: Ozone · Mediterranean · Urban · Air quality Resale or republication not permitted without written consent of the publisher
Transcript of Climatological simulations of ozone and atmospheric ...

CLIMATE RESEARCHClim Res
Vol. 59: 207–228, 2014doi: 10.3354/cr01211
Published online April 16
1. INTRODUCTION
The Greater Cairo (GC) area in Egypt (population~15 million) is the largest city in northern Africa andone of the 15 largest cities in the world (Demographia2014). Urbanization and industrialization have in -creased rapidly over the past 50 yr, causing increased
levels of air pollutants and numerous air quality ex -ceedances (Robaa & Hafez 2002, Robaa 2003, Zakeyet al. 2008). This population-dense urban area hashigh anthropogenic emissions from transportation,industry, and waste burning common to global mega - cities (Molina & Molina 2004), and is further subjectto seasonal enhancements of atmospheric aerosols
© Inter-Research 2014 · www.int-res.com*Corresponding author: [email protected]
Climatological simulations of ozone andatmospheric aerosols in the Greater Cairo region
A. L. Steiner1,*, A. B. Tawfik1,6, A. Shalaby2, A. S. Zakey2, M. M. Abdel-Wahab3, Z. Salah2, F. Solmon4, S. Sillman1, R. A. Zaveri5
1Department of Atmospheric, Oceanic and Space Sciences, University of Michigan, Ann Arbor, Michigan 48109-2143, USA 2Egyptian Meteorological Authority, PO Box 11784, Cairo, Egypt
3Department of Meteorology, Cairo University, PO Box 12613, Cairo, Egypt4Earth System Physics Group, International Centre for Theoretical Physics, 34151Trieste, Italy
5Atmospheric Sciences and Global Change Division, Pacific Northwest National Laboratory, Richland, Washington 99352, USA
6Present address: Center for Ocean-Land-Atmosphere Studies, Calverton, Maryland 20705-3106, USA
ABSTRACT: An integrated chemistry–climate model (RegCM4-CHEM) simulates present-dayclimate, ozone and tropospheric aerosols over Egypt with a focus on northern Africa and theGreater Cairo (GC) region. The densely populated GC region is known for its severe air qualityissues driven by high levels of anthropogenic pollution in conjunction with natural sources such asdust, and agricultural burning events. We find that current global emission inventories underesti-mate key pollutants such as nitrogen oxides and anthropogenic aerosol species. In the GC region,average ground-based observations of the daily July maximum nitrogen dioxide (NO2) are 40 to60 parts per billion by volume (ppbv) and are about 10 ppbv higher than modeled estimates, likelydue to model grid cell resolution, improper boundary layer representation, and poor emissionsinventories. Observed July daily maximum ozone concentrations range from 30 ppbv (winter) to90 ppbv (summer). The model reproduces the seasonal cycle fairly well, but modeled July ozoneis underestimated by approximately 10 ppbv and exhibits little interannual variability. Foraerosols, springtime dust events dominate the seasonal aerosol cycle. The chemistry– climatemodel captures the springtime peak aerosol optical depth (AOD) of 0.7 to 1 but is slightly greaterthan satellite-derived AOD. Observed AOD decreases in the summer and increases again in thefall due to agricultural burning events in the Nile Delta; however, the model underestimates thisobserved AOD peak in fall, as standard emissions inventories underestimate the extent of thisburning and the resulting aerosol emissions. Our comparison of modeled gas and particulatephase atmospheric chemistry in the GC region indicates that improved emissions inventories ofmobile sources and other anthropogenic activities, specifically NOx and organic aerosols, areneeded to improve air quality simulations in this region.
KEY WORDS: Ozone · Mediterranean · Urban · Air quality
Resale or republication not permitted without written consent of the publisher

Clim Res 59: 207–228, 2014
from wind-blown dust during the spring and agricul-tural burning during the fall (El-Askary et al. 2009,El-Metwally et al. 2010, Marey et al. 2011). Whileindividual studies have investigated air quality atspecific locations in northern Africa, regional model-ing that includes atmospheric chemistry is stillneeded in the region. In this study, we implementeda coupled chemistry– climate model to simulate con-centrations of tropospheric ozone and atmosphericaerosols over a decadal time period in the GC region,with the goal of evaluating the model performance innorthern Africa and identifying emissions and modelshortcomings for future work.
While air quality is a known public health issue inCairo, knowledge of the issue in this region is limitedand few efforts have been made to model the re -gional emission sources and confounding climatefactors that drive gas and aerosol chemistry. One ofthe factors limiting the development of a comprehen-sive air quality plan is the relative paucity of ground-based observations of air pollutants in the GC region.Limited air quality observations by the EgyptianEnvironmental Affairs Agency (EEAA) and theEgyptian Meteorological Authority (EMA) are avail-able at select locations; however, these data have yetto be synthesized to provide a broader picture of thechemical environment in GC. Other observations ofatmospheric constituents have been conducted bythe Ministry of Health (Nasralla 1996) but these arecurrently unavailable to researchers for model evalu-ation. Surface ozone (O3) over Egypt has been ex -plored in a few studies with observational climatol-ogy based on the EEAA monitoring sites (Khoder2002, 2009, El-Hussainy et al. 2003). These observa-tions confirm a typical diurnal cycle of O3 concen -trations with midday maxima as observed at otherurban areas, as well as spring or summer seasonalmaxima depending on location.
Aerosol characterization and quantification in theGC region has received more interest in the lastdecade. Two recent field studies, the Cairo Air Im -provement Project (CAIP) (Abu-Allaban et al. 2002)and the Cairo Aerosol Characterization Experiment(CACHE) (Alfaro & Wahab 2006), were conducted tospecifically evaluate aerosols in Cairo. Results fromthe CAIP study focused on criteria pollutants, such astotal fine particulate matter (PM2.5) and coarse partic-ulate matter (PM10), while the CACHE study usedaerosol filter samples at one site from 2004 to 2006 toinvestigate aerosol composition (Favez et al. 2008a,2008b, Mahmoud et al. 2008). Results from theCACHE study highlight the contribution of biomassburning aerosol to organic carbon and the role of sec-
ondary organic aerosol (SOA) formation from insolu-ble species (Favez et al. 2008b). However, the resultsof these 2 studies have not been comprehensivelyintegrated into atmospheric chemistry modeling tounderstand the climatic and seasonal factors thatdrive air quality in the region.
Other recent studies have circumvented the lack ofground-based observations using satellite-derivedaerosol indices to investigate the seasonality ofaerosols over Cairo (El-Metwally et al. 2010, Mareyet al. 2010), and find that there are 2 distinct peaks inthe aerosol seasonal cycle relating to the spring duststorms and the fall agricultural burning of rice straw(Marey et al. 2011). The fall burning season and re -sulting poor air quality in Cairo is known colloquiallyas the ‘black cloud’ and, because of the intense airand health effects, has received much more attentionrecently (Mahmoud et al. 2008, Marey et al. 2010,2011).
Fewer modeling studies exist on the air quality andclimate of the GC region. Global atmospheric chem-istry models suggest elevated summer surface ozoneconcentrations in the Middle East (Lelieveld et al.2002), and recent studies have attributed this to acombination of local O3 production, the transport ofO3 aloft due to the Asian monsoon circulation system,and the low-level transport of European pollution(Lelieveld et al. 2002, Duncan et al. 2008, Joiner et al.2009, Liu et al. 2009, 2011). However, the local O3
contribution is not explicitly examined in these stud-ies as they are of coarse resolution and cannotaccount for the many uncertainties associated withlocal O3 production. While these results suggest aMiddle Eastern hotspot of tropospheric ozone thatmay be important from a climate forcing perspective,the lack of ground-based and vertical profile obser-vations in the region makes it difficult to confirm andquantify. Further, few high-resolution regional mod-eling studies to address this question exist.
The GC region is within a climate change hotspotregion. Studies suggest that the Middle East, NorthAfrican and Mediterranean regions are extremelysensitive to climate change compared to otherregions in the world due to combined effects of heatand drought stress on human and natural systems(Giorgi 2006). Changes in temperature and the watercycle may also affect the formation of secondary pol-lutants such as O3 and aerosols, which will likelyaffect air quality in the region. This highlights theimportant role of atmospheric chemical compositionon the climate in the region and the urgent need forcomprehensive atmospheric modeling studies thatincorporate both dynamics and chemistry.
208

Steiner et al.: Chemistry and climate in Cairo
This study implemented a chemistry– climate mo -del (Shalaby et al. 2012) that couples atmosphericchemistry with atmospheric dynamics, and simulta-neously solves for transport and chemistry. This cre-ates a 2-way interaction between the chemistry anddynamics of the atmosphere, and allows for theinvestigation of the complex interactions betweenatmospheric chemistry and climate in the region. Thegoals of this study were (1) to conduct simulationsover a poorly understood geographic region from theatmospheric chemistry perspective using a high- resolution, fully coupled chemistry– climate model,and (2) to evaluate the model to the furthest extentpossible given the limited ground-based and satel-lite-derived observational data.
2. MODEL DESCRIPTION AND APPLICATION
2.1. RegCM4-Chem
The RegCM4-CHEM is an online, coupled regionalchemistry– climate model described in Shalaby et al.(2012). The core atmospheric model dynamics arebased on the International Center for TheoreticalPhysics (ICTP) Regional Climate Model version 4.2(Giorgi et al. 2012) with integrated atmosphericchemistry that is calculated at a specified chemistrymodel time step. For the simulations presented here,we implement the Community Land Model version3.5 (CLM3.5) land surface model (Tawfik & Steiner2011), the Grell convection scheme for convectiveprecipitation (Grell 1993) and the SUBEX large-scalescheme for large-scale precipitation (Pal et al. 2000).
This version of RegCM-CHEM employs a con-densed version of the Carbon Bond Mechanism(CBM-Z; Zaveri & Peters 1999) with a fast, radical-balance based solver (Sillman 1991, Barth et al. 2002)for gas-phase chemistry. For atmospheric aerosols, itutilizes a simplified aerosol model for the simulationof anthropogenic and biomass burning aerosols (Sol-mon et al. 2006) and an online, interactive dustscheme (Zakey et al. 2006). The anthropogenic aero -sol scheme includes 3 primary aerosol species, in -cluding sulfate, black carbon (BC) and organic car-bon (OC). Sulfate is emitted in the gas phase as SO2,and converted to sulfate within the model by gas andaqueous reactions (Qian et al. 2001). BC and OC arederived from anthropogenic activities or biomassburning, and are allowed to age from hydrophobic tohydrophilic species in the atmosphere after emissionwith a timescale of 1.14 d (Solmon et al. 2006). Dust isemitted based on met e o ro lo gi cal conditions, soil type
and soil texture and in cludes the transport and evolu-tion of 4 size bins (Zakey et al. 2006). The model doesnot currently in clude the formation of SOA or thetreatment of more complex aerosol thermodynamicssuch as am mo ni um or nitrate aerosol, which likelyleads to an underestimation of the total aerosol mass.The inclusion of these aerosol types is currentlyunder development.
The model domain (Fig. 1) has a 60 km resolutionwith 160 grid cells in the zonal direction spanningfrom approximately 20° W to 50° E and 80 grid cells inthe meridional direction, spanning from approxi-mately 5° to 40° N with 18 vertical levels. While thehydrostatic dynamical core can be run at finer resolu-tions, the 60 km simulations presented here weredeveloped to include all major emission sources inthe region and capture the necessary large-scaledynamics. Specifically, domain selection was de sign -ed to capture the transport of European emissionsacross the Mediterranean to the GC region, as wellas the large-scale dynamical features such as theWest African monsoon and eastern Africa circulationnecessary to simulate the northern African climate.
Model simulations are conducted for an 11 yr timeperiod (1996−2006) with a 2 yr model spin up (1996−1997) that is discarded to allow for the equilibrationof soil moisture in the region. The final 9 yr (1998−2006) of the simulation are presented in this analysis.Meteorological boundary conditions were providedat 6 h intervals from the European Centre for Medi -um-Range Weather Forecasts (ECMWF) Interim data(ERA-Interim) (Dee et al. 2011). Monthly climatologyof chemical boundary conditions are provided by theMOZART model at a 2.8° × 2.8° (T42) resolution(Emmons et al. 2012).
2.2. Emissions
Emissions for RegCM4-CHEM were developedspecifically with 2 features in mind: (1) to implementglobal emissions inventories to allow flexibility indomain selection over multiple regions, and (2) toimplement the highest resolution data available foreach species required by the RegCM4-CHEM chem-ical mechanism (Shalaby et al. 2012). In this study,we include emissions inventories from the followingsources: Monitoring Atmospheric Composition andClimate/CityZen inventory (MACCity) (Lamarque etal. 2010), Reanalysis of the Tropospheric ChemicalComposition (RETRO) (Schultz et al. 2005), EmissionDatabase for Global Atmospheric Research (EDGAR)(Olivier et al. 2005, van Aardenne et al. 2005), and
209

Clim Res 59: 207–228, 2014
Precursors of Ozone and their Effects in the Tropo-sphere (POET) (Granier et al. 2005). Because eachemissions inventory provides a unique set of chemi-cal species at varying resolutions, an emissions pre-
processor was designed (Shalaby et al. 2012) to bilin-early interpolate each user-defined inventory fromtheir native grids to the model grid. The particularinventories used for each species are shown in
210
NOx (mg m–2 d–1) Alkanes (mg m–2 d–1)
Sulfate (mg m–2 d–1) Black carbon (mg m–2 d–1)
Organic carbon (mg m–2 d–1) Isoprene (mg m–2 d–1)
Fig. 1. Summer (JJA) emissions in the Mediterranean, Middle East and northern Africa averaged over 1998−2006 for (A) anthro-pogenic NOx, (B) anthropogenic alkanes (including butanes, ethane and propane), (C) anthropogenic sulfate, (D) anthropogenicblack carbon, (E) anthropogenic organic carbon, and (F) isoprene emissions. Panels (A) to (E) are based on the MACCity
inventory and panel (F) on the online MEGAN-CLM emissions model

Steiner et al.: Chemistry and climate in Cairo
Table 1. The POET, EDGAR, and RETRO inventoriesare only available through the year 2000, thereforesimulated years after this time use the monthly emis-sions from 2000 for the remainder of the simulation.The pre-processing of emissions results in a blend ofemission data sources implemented in these simula-tions, as described below. Emissions for the broaderdomain, including the Mediterranean region, theMiddle East, and northern Africa are shown in Fig. 1,and depict the regional emissions that may affecttransport into the GC region. Localized emissions inthe GC region are shown in Fig. 2.
2.2.1. Anthropogenic emissions
Anthropogenic emissions are based on the MACC-ity inventory, which spans the period 1990−2010,providing interannual variations in emissions duringthis simulation period. The MACCity inventory (La -marque et al. 2010) is based on a historical emissionsdataset developed to support the IntergovernmentalPanel for Climate Change (IPCC) fifth assessmentreport (AR5) for the Atmospheric Chemistry and Cli-mate Model Intercomparison Project (ACCMIP). It isavailable globally at 0.5° resolution and providesinformation on emissions of alkanes, alkenes, alde-hydes, alcohols, carbon mon oxide (CO), SO2, nitro-
gen oxides (NOx), BC and OC. In our simulations,emissions for most species are based on monthlyanthropogenic emissions and do not have pre scribeddiurnal emissions cycles. The one exception is that ofnitric oxide (NO) emissions, where a bi modal diurnalcycle is imposed on the monthly MACCity NO emis-sions to replicate 2 typically ob served rush hour traf-fic peaks while conserving the total monthly massflux of NOx to the atmosphere.
Climatological anthropogenic NOx emissions overthe model domain for the summer, i.e. in June, Julyand August (JJA), during the simulation years 1998to 2006 are high in industrialized regions in Europeand the Middle East, with perceptible ship tracksacross the Mediterranean and Red Sea (Fig. 1A).Other emissions hotspots for NOx are urban centersin Saudi Arabia, the Mediterranean coast of the Mid-dle East, and Southern Europe. Over the EgyptianNile Delta, anthropogenic NOx emissions graduallyincreased by about 15% from 1998 to 2006 (Fig. 2A)with an average winter emissions maximum of 15 mgm−2 d−1 (Fig. 2B).
Anthropogenic alkanes from this inventory are dis-played to indicate the location of anthropogenic vola -tile organic compound (VOC) emissions, althoughwe note that there are several VOC categories in -cluded in the CBM-Z mechanism that are not pre-sented here (see Shalaby et al. [2012] for VOC speci-
211
Compound name Compound Anthropogenic Vegetation Biomass Ocean CBM-Z abbreviation burning map
Nitrogen oxides NOx MACCity POET RETRO NOCarbon monoxide CO MACCity POET RETRO POET COFormaldehyde HCHO MACCity HCHOAcetone CH3COCH3 MACCity ALD2Sulfur dioxide SO2 MACCity EDGAR SO2Methane CH4 MACCity RETRO CH4Ethane C2H6 MACCity POET RETRO POET C2H6
Ethylene C2H4 MACCity POET RETRO POET C2H4
Propane C3H8 POET RETRO POET PARPropene C3H6 MACCity POET RETRO OLTButane C4H10 MACCity POET PARButene C4H8 MACCity OLIIsoprene C5H8 MEGAN POET POET ISOPToluene C7H8 MACCity RETRO TOLUXylene C8H10 MACCity RETRO XYLMethanol CH3OH MACCity POET POET MOHEthanol C2H5OH MACCity POET MOHOrganic carbon OC MACCity EDGAR Black carbon BC MACCity EDGAR
Table 1. Emissions inventories used to generate simulations of emissions of chemical compounds from different sources by theonline, coupled regional chemistry– climate model RegCM4-CHEM for the Greater Cairo region. See Section 2.2. for explana-tions of abbreviations used to designate the inventories. The final column shows the abbreviations used to designate the samecompounds in the condensed version of the Carbon Bond Mechanism (CBM-Z; Zaveri & Peters 1999) that is employed by this
version of RegCM4-CHEM

Clim Res 59: 207–228, 2014
ation details). For anthropogenic alkanes (Fig. 1B),summer (JJA) emissions are high (12 to 20 mg m−2
d−1) in the GC region, and there are several otheremissions hotspots along the Arabian Coast of theRed Sea and in Gulf cities in the United Arab Emi-rates, Qatar, and Kuwait. These high emissions ofanthropogenic alkanes of up to 100 mg m−2 d−1 arelikely linked to petrochemical production; however,ground-based data to evaluate the accuracies ofthese inventories are lacking. As with anthropogenicNOx, VOC emissions in GC exhibit clear seasonalcycles with maximum emissions in the winter months(Fig. 2B). Over the decade of the simulated period,
anthropogenic alkane emissions as estimated by theMACCity inventory increase by about 30% in Cairofrom 1998 to 2006 (Fig. 2A).
The spatial distributions of anthropogenic SO2 andBC emissions are shown in Fig. 1C,D, indicating thelocation of regional aerosol emission sources. As withanthropogenic NOx, SO2 emissions are largest inmajor urban areas, and the Egyptian Nile Deltaregion shows significant SO2 emissions of up to24 mg m−2 d−1 that rival other European emissionscenters (Fig. 1C). BC emissions are significantlylower, with few anthropogenic sources on the Africancontinent according to the MACCity inventory and a
212
ISOP (× 100)
OC (× 10)
BC (× 10)
SO2
NOx
Fig. 2. Regionally averaged modeled emissions over the Greater Cairo (GC) region in the period 1998−2006: (A) interannualand (B) seasonal emissions affecting ozone formation, including NOx, carbon monoxide (× 10−1) (CO), anthropogenic alkanes(ALK) and biogenic isoprene (× 102) (ISOP); (C) interannual and (D) seasonal emissions affecting aerosol formation includingsulfur dioxide (SO2), and anthropogenic black carbon (× 10) (BC) and organic carbon (× 10) (OC). Biomass burning emissions
are not significant during the seasonal cycle over this region based on current inventories

Steiner et al.: Chemistry and climate in Cairo 213
small emissions source in the Cairo region (Fig. 1D).Recent studies (Doumbia et al. 2012) show that urbanareas in western and central Africa have very highconcentrations of BC due to emissions from a varietyof mobile fuel sources; however these are not in -cluded in our current MACCity inventory and mayrepresent a further unrecorded emissions source inCairo. Overall, anthropogenic BC sources are likelyunderestimated over the GC region. Seasonal cyclesof the aerosol precursor SO2 and primary anthro-pogenic BC and OC show a slight seasonal cycle withhigher emissions in the winter (Fig. 2D), and a ~5%decrease in OC and a ~12% increase in BC over thesimulation period (Fig. 2C).
2.2.2. Biogenic volatile organic compounds (VOCs)
Biogenic VOCs are calculated online in the landsurface component of the climate model (Shalaby etal. 2012, Tawfik et al. 2012) using the MEGAN emis-sions model (Guenther et al. 2006), which allowsemissions to respond every 10 min to temperature,net surface radiation, and soil moisture as well as tothe monthly climatological, satellite-derived leafarea index (LAI). Generally, biogenic isoprene emis-sions are relatively small in the Nile Delta as com-pared to the forested regions in the Mediterraneanand the strong source in the tropics of Africa(Fig. 1F). Seasonal emissions in the Nile Delta reachup to 0.03 mg C m−2 d−1 (Fig. 2B), which is relativelysmall when compared to the anthropogenic emis-sions in the region. Further, these emissions decreasesignificantly in magnitude over the course of the sim-ulation (Fig. 2A) due to the effects of soil moisture onbiogenic emissions (Guenther et al. 2006), suggestingthat the slow drying of model soil water reduces thelocal emissions in northern Africa. This is an artifactof a soil moisture initialization with soils that are toowet for the region. The remaining biogenic speciesare provided by monthly average emissions fromPOET, which includes both terrestrial and oceansources (Table 1).
2.2.3. Biomass burning
Biomass burning emissions are provided by theRETRO, EDGAR and POET inventories. The RETROinventory includes many of the main biomass burn-ing species, such as NOx, alkanes, CH4, CO2, CO, asuite of VOC, and BC and OC. Generally, biomassburning as predicted by these inventories is low in
JJA and emissions are concentrated in the tropics(Fig. 1E). The contribution of fall burning, i.e. inSeptember, October and November (SON), in theNile Delta is not present in the existing globalinventories, and may be due to the underestimationof crop residue burning in some regions (McCarty2011). For example, satellite observations haveidentified fall aerosol events over the Nile Delta(Marey et al. 2010, 2011), but these emissions arenot likely present in global emissions inventories. Anew, daily fire emissions product based on satellitefire counts (Wiedinmyer et al. 2011) over the regionwas also tested to see if higher spatial and temporalresolution products improved the burning emissions.We found that the use of this product did notimprove the simulation of fire and fall agriculturalburning that frequently occurs for this region; thismay be due to the timing of the satellite crossoverand/or the difficulty of remotely sensing these typesof fire events (McCarty 2011). As will be discussedin Section 4.2.4, our simulation likely misses bio-mass-burning sources due to agricultural burning inthe region that cannot be captured by currentinventories and satellite products.
2.2.4. Dust emissions
Dust emissions are simulated in an online, inter-active dust scheme as defined by Zakey et al.(2006). Emissions are calculated at each time stepwithin RegCM using soil texture, representativesoil aggregate distributions, soil humidity, fractionalvegetation cover, and threshold frictional windsfrom CLM3.5. These variables drive a dust emissionflux in specified size bins from the fine to coarsemode, and in the simulations presented here weuse 4 dust size bins including the fine mode (0.01to 1.0 µm), the accumulation mode (1.0 to 2.5 µm),the coarse mode (2.5 to 5.0 µm), and a large sizemode (5 to 20 µm). Once emitted, dust in each sizebin is advected based on prognostic model equa-tions and removed via wet (washout and rainout)and dry deposition. Recent studies indicate that thestandard RegCM4 dust emission scheme performsreasonably well over northern Africa and the Medi-terranean after new model development on soilrepresentation and emission distribution and theuse of a different land surface model (Solmon et al.2006, 2012, Nabat et al. 2012). These parameteriza-tion and sub-model changes result in variations inthe dust emissions, as discussed in Section 4.2.3below.

Clim Res 59: 207–228, 2014214
2.3. Observations
2.3.1. Climate
Climate model temperature and precipitation areevaluated against the 0.5° gridded Climate ResearchUnit (CRU) surface air temperature and precipitationproducts (Mitchell & Jones 2005). This data set incor-porates observations from multiple ground-basedobservations over the time period 1900−2010 and isregridded to the climate model grid. We note that thestation distribution over northern Africa is one of thesparsest of all regions in the globe, and this mayintroduce some bias into our model evaluation.
2.3.2. Surface gas-phase observations
Generally, ground-based observations of air qualitycriteria pollutants and atmospheric aerosols are lim-ited in Egypt and the GC region. Ground-based ob-servations of 2 gas-phase species, O3 and NO2, areprovided from a suite of observational stations fromthe Environmental Information and Monitoring Pro-gram (EIMP) directed by the EEAA. The EIMP-EEAAmeasures several trace gases (including PM10, NOx,SO2 and CO) at approximately 42 sites across Egypt,with 14 in the GC area. Here we present observationsduring the simulation time period for O3 and NO2
concentrations from eleven of the EIMP-EEAA sites(locations shown in Fig. 3), noting that not all siteswere operational during the entire simulation timeperiod. Generally, observations are collected on anhourly basis at each of these sites throughout theyear; however, hourly data is not archived and is un-available. Mean monthly 24 h maxima of these spe-cies are recorded and are used for this analysis. Thesesites are located in a variety of settings, including ur-ban, residential and industrial. The measurementspresented here in clude a cluster of sites in the centerof Cairo, including Abbaseya (urban/residential),Giza CU (residential), Qualaly (urban center; alsocalled El-Kolaly in some reports), Gemhoroya (streetcanyon; also called El-Gomhoryia). Also included are2 sites to the north, Kaha (background/ residential)and Shoubra El-Kheima (industrial/residential), NasrCity (residen tial) to the west, Fum Khalig (roadsite/urban near the Nile shore) and Tabbin (industrial/residential) to the south, and Maadi (residential) andthe Sixth of October (residential/ urban/ industrial) inthe southwest portion of the GC area. To understandthe behavior of the model over GC and the Nile Deltaregion and compare with observations, modeled data
is averaged over 9 grid boxes (outlined box in Fig. 3)corresponding to the region.
2.3.3. Satellite-derived aerosol optical depth (AOD)
We implement satellite-derived observations ofaero sol optical depth (AOD) at 550 nm from the Moderate Resolution Imaging Spectroradiometer(MODIS) on the Terra and Aqua satellites to evaluatethe simulated AOD from the RegCM (data availablefrom the NASA Giovanni portal http:// disc. sci. gsfc.nasa. gov/ giovanni/overview/ index. html). Two dif-ferent AOD values are available from each satellite:the ‘Dark Target’ product and the ‘Deep Blue’ prod-uct. The ‘Deep Blue’ AOD product was developed toseparate out the radiative effects of aerosols overhighly reflective surfaces, such as those that arepresent in our northern Africa domain. This uses theblue channels of radiation, where the contribution ofthe surface reflectivity to the signal is relatively low,and is generally thought to provide better retrievalsover highly reflective surfaces (Shi et al. 2012). Satel-lite data is compared to modeled data surroundingthe Cairo region (as defined by the outlined region inFig. 3), and these products are discussed in the modelevaluation in Section 4.2.4.
[O3] (ppbv)
Fig. 3. Greater Cairo averaging region (black box) and sta-tions within the averaging region. Color contours are the
JJA climatological model ozone concentrations

Steiner et al.: Chemistry and climate in Cairo
3. Model climatology
Here we provide an evaluation of the ability ofRegCM4-CHEM to simulate the region’s tempera-ture and precipitation, which are 2 key climateaspects that can be important for the evaluation ofatmospheric chemistry in the region. In December,January and Feburary (DJF), surface air tempera-tures in northern Africa are from 275 to 285 K(Fig. 4A), and the model under-predicts tempera-tures in the Sahara by up to 5 K but only by 0.1 K inthe GC region (Table 2). These winter cool biasesover desert regions are similar to those in otherRegCM4 simulations (Giorgi et al. 2012) and havebeen attributed to the simulation of desert albedoand land- surface parameterizations. This bias is un -likely to affect atmospheric chemistry in the region,as most of the photochemical activity occurs duringthe summer months. In the summer, the average JJAtemperature is between 300 and 310 K (Fig. 4B), withbiases ranging from +3 to −3 K de pending on thelocation (Fig. 4D) and a warm bias of about 2 K in theGC region (Table 2). The summer temperature bias
has the potential to accelerate atmospheric photo-chemistry in the region, as discussed in Section 4.1.2.
As expected in northern Africa, precipitation is rarewith slight amounts in DJF (Fig. 5). The majority ofcontinental precipitation is focused in the tropics dur-ing the JJA rainy season (Fig. 5B). Domain precipita-tion biases are less than 10 mm mon−1, with the modelexhibiting slightly more precipitation than ob servedover northern Africa in both seasons (Fig. 5C,D). Thisslight positive precipitation bias found over the Sa-hara during winter may explain some of the coolerthan observed temperatures (Fig. 4C). However, mostof the model precipitation bias occurs in the tropics inJJA, with some of central Africa exhibiting large wetbiases and the western coastal region exhibiting adry bias. JJA precipitation in this region is controlledby the placement and strength of the West AfricanMonsoon, and prior RegCM testing in this regionshows mean absolute biases of 30 to 50% (Giorgi etal. 2012), consistent with our study. Other RegCMsimulations in this region have shown it is particularlysensitive to the land surface, treatment of desert dustand selection of the convection scheme (Davis et al.
215
2 m air temperature (K)
DJF JJA
2 m air temperature bias (K)
–5 –3 –1
Fig. 4. Model 2 m surface air temperature (K) climatology for the period 1998−2006 for (A) DJF and (B) JJA; model biases com-pared with observed surface air temperatures based on Climate Research Unit (CRU) data (Mitchell & Jones 2005) for (C) DJF
and (D) JJA

Clim Res 59: 207–228, 2014
2009, Steiner et al. 2009, Solmon et al. 2012). Biases inthe GC region are small (typically less than 5 mmmo−1) and range from a 90% dry bias in the summer(due to the small magnitude) and a 10% dry bias inthe winter (Table 2). Precipitation biases of this mag-nitude are typical of many regional climate modelsimulations (Giorgi et al. 2012). Therefore despitesome modeled precipitation uncertainties in the trop-ics outside our area of interest, overall, the model canreproduce the GC region climatology.
4. Atmospheric chemistry: climatology and interannual variability
In this section we evaluate the gas-phase chemistry(Section 4.1) and atmospheric aerosols (Section 4.2)as simulated by the model over the GC region.
4.1. Gas-phase chemistry and ozone formation
4.1.1. Nitrogen oxides and carbon monoxide
Simulated climatological NOx concentrations aretypically less than 10 parts per billion by volume(ppbv), with larger concentrations in the tropics inDJF due to biomass burning emissions (Fig. 6A). Inthe GC region, a clear urban NOx signal is present ofup to 10 ppbv (Fig. 6A), with lower concentrations inthe summer (2 ppbv). The main source of NOx in theGC region is generated from automobile traffic andfossil fuel burning. Surface observations of the dailymaximum NO2 concentrations from 10 EIMP-EEAAsites in the region show that they range from ~20 to
216
Time period Surface air Precipitation temperature bias bias (K) (%) (mm mo−1) (%)
Annual −0.54 −0.18 −1.82 −53JJA 2.10 0.70 −0.85 −89SON −1.41 −0.47 −1.47 −74DJF 0.10 0.03 −0.29 −11MAM −2.63 −0.92 −4.41 −54
Table 2. Bias in annual and seasonal modeled climatologicaldata for the Greater Cairo region (1998−2006) compared to ob-served monthly Climatic Research Unit data (0.5° resolution)
(Mitchell & Jones 2005)
Precipitation bias (mm mo–1)
Precipitation (mm mo–1)
DJF JJA
Fig. 5. Model precipitation (mm mo−1) climatology for the period 1998−2006 for (A) DJF and (B) JJA; model biases compared with observed precipitation based on CRU data (Mitchell & Jones 2005) for (C) DJF and (D) JJA

Steiner et al.: Chemistry and climate in Cairo 217
120 ppbv, with some sites and locations reachingover 250 ppbv (Fig. 6C). Generally, values at mostsites range from 20 to 50 ppbv in the summer to ~80to 120 ppbv in the winter (Fig. 6C), consistent with anearlier single-site analysis (Khoder 2002). Severalsites exhibit exceptionally high concentrations. Forex ample, NO2 concentrations of 250 to 400 ppbv aremeasured at the Giza CU and Maadi sites in the win-ter of 2004, and of 150 to 220 ppbv at Giza CU,Abbaseya and Sixth of October in the winter of 2001.
Unfortunately, average 24 h monthly maximumNO2 concentrations from the model were not saved,therefore we cannot do a direct comparison of ob -served and modeled daily maximum NO2 for allyears and months. However, an average modeleddiurnal cycle of NO2 concentrations for July was re -tained (Fig. 6D), indicating NO2 maxima in the earlymorning and late afternoon of 15 to 20 ppbv, decreas-ing during midday to ~5 ppbv. In comparison, theobserved July station-averaged model maximum is
38 ppbv (with a range from 4 to 98 ppbv), a factor of2 greater compared with modeled values. In priorstudies with RegCM4-CHEM, an evaluation of NO2
over Europe showed that the model tended to over-predict observed NO2 concen trations, with relativelylow observed concentrations (ranging from 2 to10 ppbv at remote locations and 5 to 20 ppbv in urbanlocations) and modeled concentrations 2 to 20 ppbvhigher than observed, de pending on the region (Sha-laby et al. 2012). However in the GC region, ob -served surface NO2 is much higher than that ob -served in Europe and are of the same order ofmagnitude as other extremely polluted regions, suchas China (Liu et al. 2010, Xu et al. 2011).
There are several possible reasons for the largemeasured versus modeled discrepancies in NO2. Oneis instrument error and the overestimation of ob -served NO2, as the standard chemiluminescencemeasurement technique implemented at the Cairosites is known to overpredict NO2 concentrations
[NOX] (ppb)
Max
[NO
2] (
pp
bv)
DJF JJAJu
ly [N
O2]
(pp
bv)
Time (h)
Fig. 6. Climatological data (1998−2006): modeled mean midday (12:00 to 17:00 h local time) NOx concentrations for (A) DJFand (B) JJA; (C) observed ground-based mean monthly 24 h maximum NO2 concentrations at stations in the Greater Cairo(GC) region (see Fig. 3 for locations); (D) modeled average July diurnal cycle of NO2 concentrations (black) with the observedstation-averaged mean July 24 h maximum NO2 concentration (solid red line) and the range of minimum and maximum
observed concentrations (dotted red lines) at all GC stations

Clim Res 59: 207–228, 2014
(e.g. Dunlea et al. 2007). However, given the knownair quality problems in the GC region, it is plausiblethat concentrations are this high. Model errors couldalso drive the underestimation, including the rela-tively coarse grid resolution (60 km) that may dilutepoint NO2 sources within a large grid cell. The largediscrepancies between the local-scale and large-scale grid measurements will likely lead to a sub -stantial under-prediction of reactive gases such asNO2. Additionally, the boundary layer dynamics inRegCM4 may not sufficiently represent the regionand lead to low O3 concentrations in the boundarylayer. Because the European study (Shalaby et al.2012) conducted at a similar model resolution overEurope showed an NO2 bias opposite to this study,this suggests that emissions inventories may not ac -curately represent the urban pollutants in this region.Further investigation is needed to fully attribute andaddress this issue.
We also evaluate CO concentrations at the surface.Modeled CO concentrations are greatest in the win-ter (DJF; Fig. 7A), with surface concentrations over350 ppbv in the tropics due to biomass burning andup to 300 ppbv in the GC region (Fig. 7A,C). Concen-trations decrease in the summer to ~150 ppbv(Fig. 7B,C). We compare modeled surface CO con-centrations with those derived from the MOPITTsatellite (Bowman 2006). The model generally cap-tures the seasonal cycle in the GC region, althoughlacks the interannual variability displayed in thesatellite ob servations (Fig. 7C), despite a slight inter-annual variability of the emissions (Fig. 2A). Overall,the model tends to over-predict the surface CO con-centrations (Fig. 7D) with a weak correlation (R2 =0.36). This re sult is in contrast to other anthropogeni-cally related emissions such as NO2, which is under-estimated in the GC region (Fig. 6D), suggesting dis-crepancies in the emission sources.
218
[CO] (ppbv)
MOPITT surface [CO] (ppbv)
DJF JJA
[CO
] (p
pbv
)
[CO
] mo
del
ed (p
pbv
)
Fig. 7. Climatological (1998−2006) modeled mean midday (12:00 to 17:00 h local time) CO concentrations for (A) DJF and (B)JJA; (C) average modeled and MOPITT-derived surface CO concentrations over the Greater Cairo (GC) region; (D) correla-tion between modeled and MOPITT surface CO versus modeled CO in GC with the regression slope (correlation coefficient)

Steiner et al.: Chemistry and climate in Cairo
4.1.2. Ozone
Modeled midday mean tropospheric O3 concen-trations in DJF are relatively low over the Mediter-ranean and northern Africa, with daily maximumconcentrations from 40 to 50 ppbv (Fig. 8A) andhigher concentrations in the tropics (60 to 90 ppbv)due to biomass burning and isoprene sources. InJJA, O3 concentrations increase to 60 to 80 ppbv inthe Mediterranean with elevated concentrationsover the GC region (Fig. 8B). Monthly averages ofdaily maximum observations of O3 concentrationsat the ground sites in the GC area (locations inFig. 3) exhibit a seasonal cycle of O3 ranging from10–30 ppbv in winter to 70–100 ppbv in summer(Fig. 8C).
As with NO2 concentrations, the daily maximummodeled values were not saved, so a direct compari-
son of monthly mean values is not possible. However,the modeled July average diurnal cycle shows arange of O3 concentrations from 40 ppbv at night to65 ppbv during the day. The modeled July daily maximum is 10 ppbv lower than the climatological,station-averaged O3 maximum of 75 ppbv (range 47to 96 ppbv) (Fig. 7D), indicating an overall underesti-mation of summer O3 maxima in the GC area. As -suming that the main driver of the seasonal ampli-tude is photochemistry, the model likely underesti-mates O3 in large part due to the very low modeledNO2 concentrations (Fig. 6D), as local anthropogenicemissions are likely underestimated in the regionbased on current inventories. Another important fac-tor in the simulation of the urban O3 observations isthe relatively coarse model grid cell resolution of60 km. This resolution will not capture many of thelocal, air quality re sponses that are observed at the
219
[O3] (ppb)
Time (h)
DJF JJA
Max
[O3]
(pp
bv)
July
[O3]
(pp
bv)
Fig. 8. Climatological data (1998−2006): (A) modeled mean midday(12:00 to 17:00 h local time) ozone (O3) concentrations for(A) DJF and (B) JJA; (C) observed ground-based mean monthly 24 h maximum O3 concentration at the 5 stations in theGreater Cairo (GC) region with observed O3 (see Fig. 3); (D) modeled mean July diurnal cycle of O3 concentrations (black)with the observed station-averaged mean July 24 h maximum O3 concentration (solid red line) and the range of minimum and
maximum observed concentrations at the 5 GC stations with observed O3

Clim Res 59: 207–228, 2014220
stations and likely is an important factor in theunder estimate of modeled NO2 and O3.
There is a noticeable interannual variability in theobserved O3 surface concentrations, with the years2003 and 2004 exhibiting relatively low summermaximum O3 concentrations (70 to 80 ppbv) and theyear 2006 exhibiting relatively high summer maxi-mum O3 concentrations (up to 105 ppbv at somesites). Generally, the model does not simulate theseasonal amplitude exhibited by the observations.Average modeled concentrations are 40 to 45 ppbv inwinter and increase up to 65 ppbv in summer, whileexhibiting very little interannual variability (resultsnot shown). This lack of modeled interannual vari-ability was also noted in the European RegCM4-CHEM study (Shalaby et al. 2012) and attributed tothe lack of interannual variability in the lateral andtop boundary conditions. Prior studies show that tro-pospheric O3 in the Europe and the Middle East isaffected by the top boundary condition and transportfrom the stratosphere (Katragkou et al. 2010), al -though this was held constant in these simulations.
We also evaluate the vertical profile of O3 as simu-lated by the model to investigate the role of transportfrom high altitudes, which has been shown to pro-duce an O3 hotspot in the Middle East (Lelieveld etal. 2002). Using the online coupled chemistry–climate model, we can investigate this feature andthe role of local O3 production versus O3 transportedfrom the stratosphere. The vertical distribution of O3
indicates high concentrations of up to 90 ppbv nearthe model top (approximately 100 mb) due to the topmodel layer incorporating part of the stratosphere(Fig. 9A). Some of this stratospheric O3 is mixeddown into the model troposphere up to about500 hPa, although we note that other studies indicatethat this mixing may occur down into the free tropo-sphere (Tyrlis et al. 2013) and this downward mixingap pears to be underestimated by the model. From20° to 50° E, re gional surface O3 production con-tributes to higher concentrations of O3 in the lowertroposphere. This local O3 production coincides withurban areas, such as the GC region (visible at 30° E),producing local O3 concentrations of ~65 ppbv in themodel. This suggests that if the emission sources arebeing modeled correctly, some of the O3 hotspotnoted in the Middle East may be partly due to localsurface O3 production, adding to the penetration ofstratospheric O3 in the region.
As noted in Section 3.0, the RegCM-CHEM pre-dicts a slight cool bias in the in the winter and a warmbias in the summer in the GC region (Table 2). Typi-cally, O3 tends to increase with increasing tempera-
tures (Steiner et al. 2010). If the model’s warm biaswere affecting O3 production, we would expect thatthe model would also over-predict summer O3 forma-tion. However, the model under-predicts O3 concen-trations in the summer and it is therefore unlikelythat the O3 bias is due to the temperature bias.Therefore, the warm bias may allow more O3 to beproduced in the model given the limited NOx. Over-all, this analysis indicates that the missing anthro-pogenic NOx in the model is the driver of an underes-timation of local O3 production.
4.2. Aerosol
4.2.1. Sulfate
The RegCM4-CHEM simulates sulfate aerosolbased on a simple sulfate conversion scheme thatconverts SO2 to sulfate (SO4
2−) through (1) gas-phase
[O3] (ppb)
A
B
O3 production (ppt s–1)
0
300
400
500
700
850
45°E
0 45°E
700
850
8
4
4
0
Fig. 9. Modeled climatological summer (JJA) vertical pro-files for the period 1998–2006 averaged over 30° N latitudefor (A) O3 concentration and (B) net O3 chemical production
(production − loss)

Steiner et al.: Chemistry and climate in Cairo 221
oxidation of SO2 by OH, and (2) aqueous formationthough the formation of HSO3
− and SO3−2 ions that
then react with H2O2 to form sulfate (Qian et al. 2001,Solmon et al. 2006). This oxidation scheme under-predicts sulfate over the USA (Owen & Steiner 2012)but still provides a computationally efficient methodfor estimation of sulfate aerosol. Over the modeldomain, sulfate formation is linked to SO2 emissions(Fig. 1C), which are predominantly near urban areas,shipping lanes and sites of fossil fuel combustion.Because Egypt is located beneath a subsidenceregion, there is also transported sulfate from Europe,in addition to local production.
Modeled sulfate concentrations are highest in JJAand SON, with concentrations >10 µg m−3 over theMediterranean Red Sea and the Arabian Peninsula(Fig. 10A−D). Over the GC region, modeled sulfateconcentrations are the dominant species in theanthro pogenic aerosol contribution, compared torelatively low concentrations of BC and OC(Fig. 11). While SO2 emissions peak in DJF, sulfateis highest in JJA and SON (Fig. 11B) when warmertemperatures increase OH concentrations andatmospheric SO2 oxidation peaks. Modeled sulfatealso exhibits seasonal interannual variability, withsome summers showing lower concentrations thanothers (e.g. 2000 and 2003; Fig. 11A). We also com-pare modeled sulfate concentrations (10 µg m−3; Fig.11A,B) with aerosol speciation data (Fig. 11A–D)from the CACHE field experiment at the Giza CUsite from November 2004 to May 2006, which coin-cides with our modeling time period (Favez et al.2008a). The observed CACHE sulfate concentra-tions range from 10 to 20 µg m−3 (Fig. 11A,B), yield-ing a model underestimate of 2 to 10 µg m−3. Addi-tionally, the ob ser vations show little seasonalvariability in sulfate concentrations over the 3 yr ofmeasurements, unlike the model that shows anincrease in summer concentrations.
Earlier observations indicate a seasonal maximumconcentration of sulfate in the winter, when relativelyhigher relative humidity enhances chemical conver-sion (Shakour & Zakey 1998). We correlate themonthly modeled sulfate anomaly (µg m−3, as calcu-lated compared to the 1998 to 2009 model mean) withthe modeled specific humidity (kg kg−1) (Fig. 11C) toshow that the sulfate anomaly is correlated withatmospheric moisture content (R2 = 0.55), as sulfategrowth is a strong function of relative humidity (Qianet al. 2001). While we do see evidence of increasedhumidity increasing sulfate concentrations in themodel (Fig. 11C), this does not translate to anincrease in winter sulfate concentrations. The mod-
eled seasonal sulfate cycle is driven by atmosphericoxidation, and comparison with ground-based obser-vations in the continental USA indicates that oxida-tion is underestimated in the model (Owen & Steiner2012). The underestimation of sulfate in all seasonssuggests that SO2 emissions may be too low in thisregion and that the model is missing some of theatmospheric oxidation processes that may lead tounderestimation in the winter.
4.2.2. Black and organic carbon
Simulated BC and OC provide relatively small con-tributions to the overall aerosol burden, likely due tomissing anthropogenic emissions sources from in -ventories as discussed in Section 2.2. AnthropogenicBC and OC emissions from the GC and Nile Deltaareas are evident in all seasons (Fig. 10), with greateremissions (Fig. 2) and resulting concentrations in thewinter and early spring (Fig. 11B). Despite largeremissions of primary an thropogenic OC than BC(Fig. 2C,D), the modeled atmospheric concentrationsof both species are similar in magnitude. SimulatedBC concentrations are typically ~1 µg m−3, which is 5to 12 µg m−3 lower than the observed measurementsat Cairo University (Fig. 11A,B) (Favez et al. 2008a),with a greater bias in the winter (12 µg m−3) than thesummer (5 to 6 µg m−3).
Modeled OC concentrations of 1 µg m−3 are evenlower than those observed, with observed concentra-tions reaching up to 8 µg m−3 during the 2005 CACHEexperiment in Cairo (not shown), 25 to 30 µg m−3 dur-ing the fall burning events (Mahmoud et al. 2008) and~30 µg m−3 in other seasons (Favez et al. 2008a)(Fig. 11A,B). This discrepancy is likely due to (1)missing local emissions in the global emissions inven-tories that may not accurately capture anthropogenicOC emissions from industry or mobile sources, aswell as (2) the lack of modeled SOA formation whichis an important contributor to the OC burden. Favezet al. (2008b) suggest that SOA formation in Cairo issignificant and both water-soluble and water-insolu-ble species are important in the region, likelyderiving from a suite of mobile sources. Comparisonof the model with these measurements suggests thatwe are underestimating the OC by up to a factor of 10in some seasons, and this underestimate is similar toother important mobile emissions such as NO2. Thisunderscores the importance of secondary anthro-pogenic SOA formation in the region and its inclusionin regional chemistry– climate models, and highlightsan area of future model development.

Clim Res 59: 207–228, 2014222
30°N 20
°
10° 0°
30°N 20
°
10° 0°
30°N 20
°
10° 0°
30°N 20
°
10°
15°W
15°E
30°
45°
0°15
°W15
°E30
°45
°0°
15°W
15°E
30°
45°
0°15
°W15
°E30
°45
°0°
[Aer
osol
] (µg
m–3
)
SO
ND
JFM
AM
JJA
Sul
fate
Dus
t(P
M10
)
Org
anic
carb
on
Bla
ckca
rbo
n
Fig
. 10.
Sea
son
al m
odel
ed c
lim
atol
ogic
alae
roso
l con
cen
trat
ion
s fo
r th
e p
erio
d 1
998
–200
6 ae
roso
l sp
ecie
s (A
−D
) su
lfat
e, (
E−
H)
bla
ck c
arb
on, (
I−L
) or
gan
ic c
arb
on, a
nd
(M
−P
) d
ust
, as
coar
se p
arti
cula
te m
atte
r (P
M10
)
Steiner et al.: Chemistry and climate in Cairo
4.2.3. Dust
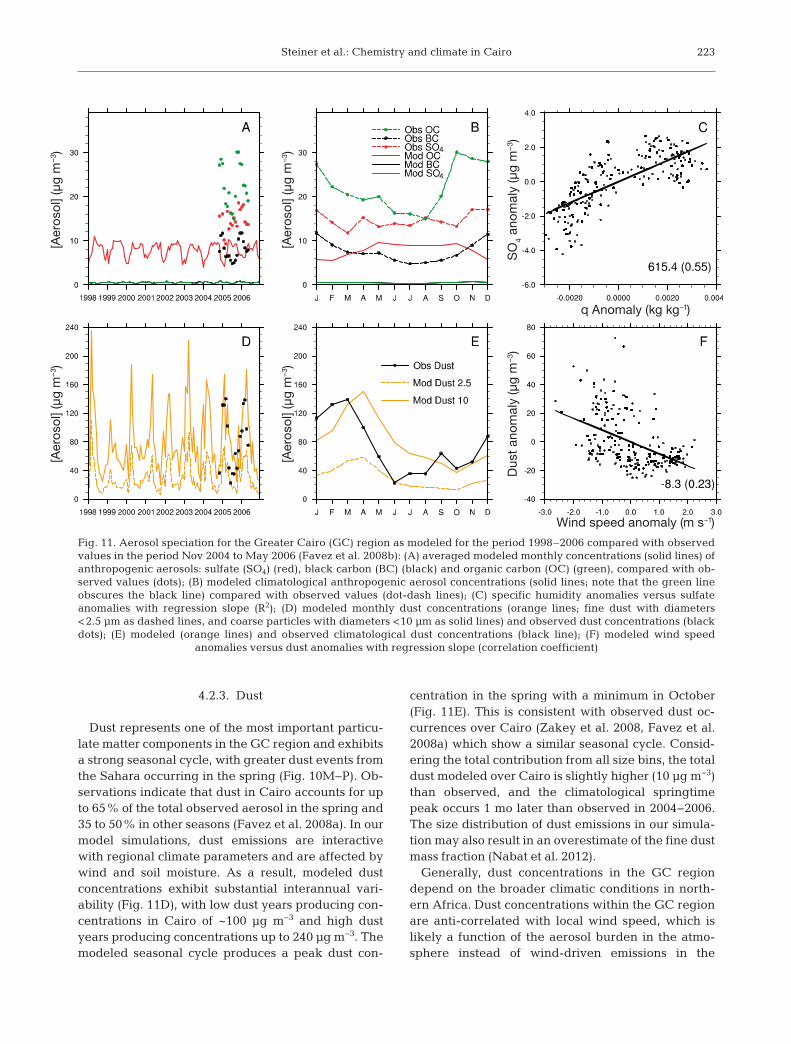
Dust represents one of the most important particu-late matter components in the GC region and ex hibitsa strong seasonal cycle, with greater dust events fromthe Sahara occurring in the spring (Fig. 10M−P). Ob-servations indicate that dust in Cairo accounts for upto 65% of the total observed aerosol in the spring and35 to 50% in other seasons (Favez et al. 2008a). In ourmodel simulations, dust emissions are interactivewith regional climate parameters and are affected bywind and soil moisture. As a result, modeled dustconcentrations exhibit substantial interannual vari-ability (Fig. 11D), with low dust years producing con-centrations in Cairo of ~100 µg m−3 and high dustyears producing concentrations up to 240 µg m−3. Themodeled seasonal cycle produces a peak dust con-
centration in the spring with a minimum in October(Fig. 11E). This is consistent with observed dust oc-currences over Cairo (Zakey et al. 2008, Favez et al.2008a) which show a similar seasonal cycle. Consid-ering the total contribution from all size bins, the totaldust modeled over Cairo is slightly higher (10 µg m−3)than observed, and the climatological springtimepeak occurs 1 mo later than ob served in 2004− 2006.The size distribution of dust emissions in our simula-tion may also result in an overestimate of the fine dustmass fraction (Nabat et al. 2012).
Generally, dust concentrations in the GC regiondepend on the broader climatic conditions in north-ern Africa. Dust concentrations within the GC regionare anti-correlated with local wind speed, which islikely a function of the aerosol burden in the atmo -sphere instead of wind-driven emissions in the
223[A
eros
ol] (
µg m
–3)
[Aer
osol
] (µg
m–3
)
[Aer
osol
] (µg
m–3
)[A
eros
ol] (
µg m
–3)
SO
4 an
omal
y (µ
g m
–3)
Dus
t an
omal
y (µ
g m
–3)
Wind speed anomaly (m s–1)
q Anomaly (kg kg–1)
Fig. 11. Aerosol speciation for the Greater Cairo (GC) region as modeled for the period 1998–2006 compared with observedvalues in the period Nov 2004 to May 2006 (Favez et al. 2008b): (A) averaged modeled monthly concentrations (solid lines) ofanthropogenic aerosols: sulfate (SO4) (red), black carbon (BC) (black) and organic carbon (OC) (green), compared with ob-served values (dots); (B) modeled climatological anthropogenic aerosol concentrations (solid lines; note that the green lineobscures the black line) compared with observed values (dot-dash lines); (C) specific humidity anomalies versus sulfateanomalies with regression slope (R2); (D) modeled monthly dust concentrations (orange lines; fine dust with diameters<2.5 µm as dashed lines, and coarse particles with diameters <10 µm as solid lines) and observed dust concentrations (blackdots); (E) modeled (orange lines) and observed climatological dust concentrations (black line); (F) modeled wind speed
anomalies versus dust anomalies with regression slope (correlation coefficient)

Clim Res 59: 207–228, 2014
source region (Fig. 11F). Therefore, the discrepan-cies be tween ob served and modeled dust concentra-tions can be at tributed to the prescription of soilaggregate distributions, which determine thresholdfriction velocities, sandblasting efficiency and itsratio to the effective vertical dust flux. These verysensitive para meters have been revised in the latestRegCM version, and show a substantial reduction ofdust fluxes, concentrations and AOD as compared tothe results presented here.
4.2.4. Aerosol optical depth
Despite the lack of consistent aerosol speciationdata at ground-based sites, the model’s ability to sim-ulate the climatology of total AOD can be evaluatedby comparing with satellite-derived observations.The annual cycle of modeled AOD peaks at 0.7 inspring (MAM) due to dust, decreasing in JJA to 0.2and increasing slightly in the fall to 0.35 due to sec-ondary sulfate and dust contributions (Fig. 12A−D).On a seasonal basis, the MODIS ‘Dark Product’ Terraand Aqua satellite retrievals show a similar patternas modeled, with a springtime peak typically attrib-uted to dust that is slightly lower (AOD = 0.5) thanmodeled and a second peak in September (AOD =0.55) associated with biomass burning that is higherthan modeled (Fig. 12E,F). However the Aqua andTerra ‘Deep Blue’ retrievals exhibit a different sea-sonal cycle that does not exhibit the fall peak of bio-mass burning. Additionally, the Terra ‘Deep Blue’retrieval observes a different seasonal cycle than theother 3 products, with a JJA maximum and the lackof a spring dust peak. With the exception of the Terra‘Deep Blue’ retrieval, these comparisons with theremotely sensed AOD data suggest that the dustmodel is producing too much particulate matter fromthe Sahara in the spring. Ground-based AERONETdata (not shown) support the ‘Dark Product’ MODISretrievals, as they typically show a fall peak in the500 nm portion of the spectrum (El-Metwally et al.2010, Marey et al. 2011).
5. DISCUSSION AND CONCLUSIONS
We used the model RegCM4-CHEM to conduct adecadal scale simulation of coupled chemistry andclimate over northern Africa and the Mediterranean,with a specific focus on the GC region. Because thisregion is undergoing massive transformation interms of its social, political and economic climate, this
work provides a baseline for understanding the inter-action between atmospheric chemistry and climate inthe region. Additionally, this study presents the firstclimatological simulations of tropospheric O3 andaerosols in the GC region to assess the ability of mod-els to simulate air quality. Because this study wasdesigned to provide a broad evaluation of the modelin the northern Africa region, we selected a relativelycoarse grid cell resolution (60 km) in order to captureall emissions that may affect this broad area. Ourresults indicate that this resolution is too coarse tofully understand the air quality factors in the urbancore of Cairo; however, they can provide insight intofuture air quality modeling efforts for the GC region.
We find that the global emissions inventories usedover the GC region tend to under-predict key anthro-pogenic species, such as NOx and anthropogenicblack and organic carbon. The model greatly under-estimates average July daily maximum NO2 concen-trations by 15 ppbv (Fig. 6D), and this could be attrib-uted to missing local mobile emissions, or therelatively coarse model grid cell resolution (60 km)and its reduced ability to capture boundary layerdynamics related to urban air quality. Because simi-lar resolution simulations in Europe did not indicatethis NO2 discrepancy, this suggests that the underes-timate is due to the local GC emissions inventory. Foratmospheric aerosols, our model simulations gener-ally under-predict the fall burning events that areimportant for air quality in this season. Most majorglobal inventories does not include the fall agricul-tural biomass burning that occurs in the Nile Deltaregion, and even new, satellite-derived fire productsmay not be able to detect these low-temperatureburns due to the nature of the burning itself as wellas the satellite overpass time in the Nile Delta. Addi-tionally, our urban aerosol analysis is limited by thelack of secondary organic aerosol (SOA) formation inthe current model, as prior studies and this modelcomparison indicate that this is an important compo-nent of the total aerosol concentration in all seasons(Favez et al. 2008a). Because biogenic volativeorganic compounds (VOC) emissions are low in theGC region, understanding organic aerosol and therole of SOA formation from anthropogenic emissionsin Cairo will be necessary for the accurate simulationof aerosols in the region, and future model simula-tions will improve upon these known weaknesses.Finally, ground-level concentrations in highly pol-luted areas are affected by other sources emittingpollutants at the surface, including the cement indus-try, metal smelters, brick factories, aluminum, petro-chemical and chemical production, and sugar fac -
224

Steiner et al.: Chemistry and climate in Cairo
tories. All of these industries are likely not well char-acterized by the global emissions inventories imple-mented in this study.
The simulation of tropospheric O3 in the regionremains a challenge. The regional chemistry– climatemodel captures the general seasonal cycle of O3, butthe model underestimates the observed July summermaxima by 10 ppbv in the GC region. Previous stud-ies have suggested that this may be due to transport
from other regions but our evaluation of local NO2
ob servations versus modeled values indicate thatlocal O3 production is under-predicted in the modeland can be regionally important. Future work willinvestigate the role of model resolution, emissionsinventories, and photochemical processing to reducethis bias.
Overall, this study highlights the need to improveinventories in the region to account for unique local
225
AOD
DJF MAM
JJA SON
AO
D
AO
D
Fig. 12. Modeled climatological aerosol optical depth (AOD) (unitless) for the period 1998–2006 for (A) JJA, (B) SON, (C) DJF,and (D) MAM. Cairo-averaged AOD for (E) modeled monthly AOD as compared with observed AOD by MODIS Terra andAqua satellites using 2 retrieval algorithms, the ‘Dark Product’ retrievals (MOD_T and MOD_A, from the Terra and Aquasatellites, respectively) and ‘Deep Blue’ retrievals (MDB_T and MDB_A) and (F) climatological modeled and observed AOD

Clim Res 59: 207–228, 2014
sources of biomass burning and regional atmosphericchemistry. Despite the poor air quality of Cairo, airquality studies in the region have historically beenvery limited, in part due to the lack of complete androbust air quality observations. We hope that thisfoundational work will motivate an increase thenumber and diversity of air quality measurements inthis region. Future work at the Egyptian Meteorolog-ical Authority will use this framework to continue toevaluate and assess air quality over the GC regionand Nile Delta.
Acknowledgements. This work was supported through agrant from the US-Egypt Joint Board on Scientific and Tech-nological Collaboration to A.S.Z. and A.L.S. (NSF AGS-0809255) and the European Union’s Seventh FrameworkProgramme (FP/2007−2011) within the project MEGAPOLI(grant agreement no. 212520). We thank the InternationalCentre for Theoretical Physics, Trieste, Italy and the EarthSystem Physics group for providing administrative and com-putational support for this project. Participation of R.A.Z. inthis study was partially supported by the US Department ofEnergy’s Atmospheric System Research (ASR) program. Wealso gratefully acknowledge Louisa Emmons at NCAR forproviding MOZART chemical boundary conditions for thesesimulations. Additionally, we thank Olivier Favez, StephaneAlfaro, and Jean Sciare for graciously providing CACHEobservational data.
LITERATURE CITED
Abu-Allaban M, Gertler AW, Lowenthal DH (2002) A pre-liminary apportionment of the sources of ambient PM10,PM2.5, and VOCs in Cairo. Atmos Environ 36: 5549−5557
Alfaro SC, Wahab MA (2006) Extreme variability of aerosoloptical properties: the Cairo Aerosol CHaracterizationExperiment case study. In: Perrin A, Sari-Zizi NB, Demai-son J (eds) Remote sensing of the atmosphere for environ-mental security. Springer, Dordrecht, p 285–299
Barth MC, Hess PG, Madronich S (2002) Effect of marineboundary layer clouds on tropospheric chemistry as ana-lyzed in a regional chemistry transport model. J GeophysRes, Atmos107: AAC 7-1−7-12
Bowman KP (2006) Transport of carbon monoxide from thetropics to the extratropics. J Geophys Res Atmos 111:D02107, doi:10.1029/2005JD006137
Davis N, Bowden J, Semazzi F, Xie L, Onol B (2009) Cus-tomization of RegCM3 Regional Climate Model for East-ern Africa and a tropical Indian Ocean domain. J Clim22: 3595−3616
Dee DP, Uppala SM, Simmons AJ, Berrisford P and others(2011) The ERA-interim reanalysis: configuration andperformance of the data assimilation system. QJR Mete-orol Soc 137: 553−597
Demographia (2014) Demographia world urban areas, 10thannual edition. www. demographia. com
Doumbia EHT, Liousse C, Galy-Lacaux C, Ndiaye SA andothers (2012) Real time black carbon measurements inWest and Central Africa urban sites. Atmos Environ 54: 529−537
Duncan BN, West JJ, Yoshida Y, Fiore AM, Ziemke JR
(2008) The influence of European pollution on ozone inthe Near East and northern Africa. Atmos Chem Phys 8: 2267−2283
Dunlea EJ, Herndon SC, Nelson DD, Volkamer RM and oth-ers (2007) Evaluation of nitrogen dioxide chemilumines-cence monitors in a polluted urban environment. AtmosChem Phys 7: 2691−2704
El-Askary H, Farouk R, Ichoku C, Kafatos M (2009) Trans-port of dust and anthropogenic aerosols across Alexan-dria, Egypt. Ann Geophys 27: 2869−2879
El-Hussainy FM, Sharobiem WM, Ahmed DM (2003) Sur-face ozone observations in Egypt. Q J Hung Met Serv107: 133−152
El-Metwally M, Alfaro SC, Wahab MMA, Zakey AS,Chatenet B (2010) Seasonal and inter-annual variabilityof the aerosol content in Cairo (Egypt) as deduced fromthe comparison of MODIS aerosol retrievals with directAERONET measurements. Atmos Res 97: 14−25
Emmons LK, Hess PG, Lamarque JF, Pfister GG (2012)Tagged ozone mechanism for MOZART-4, CAM-chemand other chemical transport models. Geosci Model Dev5: 1531−1542
Favez O, Cachler H, Sciare J, Alfaro SC, El-Araby TM,Harhash MA, Abdelwahab MM (2008a) Seasonality ofmajor aerosol species and their transformations in Cairomegacity. Atmos Environ 42: 1503−1516
Favez O, Sciare J, Cachier H, Alfaro SC, Abdelwahab MM(2008b) Significant formation of water-insoluble second-ary organic aerosols in semi-arid urban environment.Geophys Res Lett 35: L15801, doi: 10.1029/ 2008 GL 034446
Giorgi F (2006) Climate change hot-spots. Geophys Res Lett33: L08707, doi: 10.1029/2006GL025734.
Giorgi F, Coppola E, Solmon F, Mariotti L and others (2012)RegCM4: model description and preliminary tests overmultiple CORDEX domains. Clim Res 52: 7−29
Granier C, Guenther A, Lamarque JF, Mieville A and others(2005) POET, a database of surface emissions of ozone pre-cursors. www.aero.jussieu.fr/projet/ACCENT/ POET. php
Grell GA (1993) Prognostic evaluation of assumptions usedby cumulus parameterizations. Mon Weather Rev 121: 764−787
Guenther A, Karl T, Harley P, Wiedinmyer C, Palmer PI,Geron C (2006) Estimates of global terrestrial isopreneemissions using MEGAN (Model of Emissions of Gasesand Aerosols from Nature). Atmos Chem Phys 6: 3181−3210
Joiner J, Schoeberl MR, Vasilkov AP, Oreopoulos L, PlatnickS, Livesey NJ, Levelt PF (2009) Accurate satellite-derived estimates of the tropospheric ozone impact onthe global radiation budget. Atmos Chem Phys 9: 4447−4465
Katragkou E, Zanis P, Tegoulias I, Melas D and others (2010)Decadal regional air quality simulations over Europe inpresent climate: near surface ozone sensitivity to exter-nal meteorological forcing. Atmos Chem Phys 10: 11805−11821
Khoder MI (2002) Atmospheric conversion of sulfur dioxideto particulate sulfate and nitrogen dioxide to particulatenitrate and gaseous nitric acid in an urban area. Chemo-sphere 49: 675−684
Khoder MI (2009) Diurnal, seasonal and weekdays-week-ends variations of ground level ozone concentrations inan urban area in greater Cairo. Environ Monit Assess149: 349−362
Lamarque JF, Bond TC, Eyring V, Granier C and others
226

Steiner et al.: Chemistry and climate in Cairo
(2010) Historical (1850−2000) gridded anthropogenicand biomass burning emissions of reactive gases andaerosols: methodology and application. Atmos ChemPhys 10: 7017−7039
Lelieveld J, Berresheim H, Borrmann S, Crutzen PJ and oth-ers (2002) Global air pollution crossroads over the Medi-terranean. Science 298: 794−799
Liu JJ, Jones DBA, Worden JR, Noone D, Parrington M, KarJ (2009) Analysis of the summertime buildup of tropos-pheric ozone abundances over the Middle East andNorth Africa as observed by the Tropospheric EmissionSpectrometer instrument. J Geophys Res, Atmos 114: D05304, doi: 10.1029/2008JD010993
Liu XH, Zhang Y, Cheng SH, Xing J and others (2010)Understanding of regional air pollution over China usingCMAQ. I. Performance evaluation and seasonal varia-tion. Atmos Environ 44: 2415−2426
Liu JJ, Jones DBA, Zhang S, Kar J (2011) Influence of inter-annual variations in transport on summertime abun-dances of ozone over the Middle East. J Geophys Res116: D20310, doi: 10.1029/2011JD016188.
Mahmoud KF, Alfaro SC, Favez O, Wahab MMA, Sciare J(2008) Origin of black carbon concentration peaks inCairo (Egypt). Atmos Res 89: 161−169
Marey HS, Gille JC, El-Askary HM, Shalaby EA, El-RaeyME (2010) Study of the formation of the ‘black cloud’ andits dynamics over Cairo, Egypt, using MODIS and MISRsensors. J Geophys Res Atmos 115: D21206, doi: 10.1029/2010JD014384
Marey HS, Gille JC, El-Askary HM, Shalaby EA, El-RaeyME (2011) Aerosol climatology over Nile Delta based onMODIS, MISR and OMI satellite data. Atmos Chem Phys11: 10637–10648
McCarty JL (2011) Remote sensing-based estimates ofannual and seasonal emissions from crop residue burn-ing in the continguous United States. J Air Waste ManagAssoc 61: 22−34
Mitchell TD, Jones PD (2005) An improved method of con-structing a database of monthly climate observations andassociated high-resolution grids. Int J Climatol 25: 693−712
Molina MJ, Molina LT (2004) Megacities and atmosphericpollution. J Air Waste Manag Assoc 54: 644−680
Nabat P, Solmon F, Mallet M, Kok JF, Somot S (2012) Dustemission size distribution impact on aerosol budget andradiative forcing over the Mediterranean region: aregional climate model approach. Atmos Chem Phys 12: 10545−10567
Nasralla MM (1996) Air pollution and air quality measur-ments in Egypt: a report for the Regional Office for Eastern Mediterranean. World Health Organization,Alexandria
Olivier J, van Aardenne J, Dentener FJ, Ganzeveld L, PetersJ (2005) Recent trends in global greenhouse gas emis-sions: regional trends and spatial distribution of keysources. In: Van Amstel A (ed) Proc 4th Int Symp on Non-CO2 Greenhouse Gases (NCGG4), Utrecht, July 4−6,2005. Millpress, Rotterdam, p 325−330
Owen RC, Steiner AL (2012) Effect of emissions inventoryversus climate model resolution on radiative forcing andprecipitation over the continental United States. J Geo-phys Res 117: D05201 doi: 10.1029/2011JD016096
Pal JS, Small EE, Eltahir EAB (2000) Simulation of regional-scale water and energy budgets: representation of sub-grid cloud and precipitation processes within RegCM.
J Geophys Res 105: 29579−29594Qian Y, Giorgi F, Huang Y, Chameides W, Luo C (2001)
Regional simulation of anthropogenic sulfur over EastAsia and its sensitivity to model parameters. Tellus BChem Phys Meterol 53: 171−191
Robaa SM (2003) Urban-suburban/rural differences overgreater Cairo, Egypt. Atmosfera 16: 157−171
Robaa SM, Hafez YY (2002) Monitoring urbanizationgrowth in Cairo City. J Eng Appl Sci 49: 667−679
Schultz M, Rast S, van het Bolscher M, Pulles T and others(2005) Emission data sets and methodologies for estimat-ing emissions. Max Planck Institute for Meteorology,Hamburg
Shakour A, Zakey AS (1998) The relationship between sul-phur dioxide and sulphate in the Cairo atmosphere. CenEur J Occup Env Med 4: 82−90
Shalaby A, Zakey AS, Tawfik AB, Solmon F and others(2012) Implementation and evaluation of online gas-phase chemistry within a regional climate model(RegCM-CHEM4). Geosci Model Dev 5: 741−760
Shi Y, Zhang J, Reid JS, Hyer EJ, Hsu NC (2012) Criticalevaluation of the MODIS Deep Blue aerosol opticaldepth product for data assimilation over North Africa.Atmos Meas Tech Discuss 5: 7815−7864
Sillman S (1991) A numerical-solution for the equations oftropospheric chemistry based on an analysis of sourcesand sinks of odd hydrogen. J Geophys Res 96: 20735−20744
Solmon F, Giorgi F, Liousse C (2006) Aerosol modelling forregional climate studies: application to anthropogenicparticles and evaluation over a European/African do -main. Tellus B Chem Phys Meterol 58: 51−72
Solmon F, Elguindi N, Mallet M (2012) Radiative and cli-matic effects of dust over West Africa, as simulated by aregional climate model. Clim Res 52: 97−113
Steiner AL, Pal JS, Rauscher SA, Bell JL and others (2009)Land surface coupling in regional climate simulations ofthe West African monsoon. Clim Dyn 33: 869−892
Steiner AL, Davis AJ, Sillman S, Owen RC, Michalak AM,Fiore AM (2010) Observed suppression of ozone forma-tion at extremely high temperatures due to chemical andbiophysical feedbacks. Proc Natl Acad Sci USA 107: 19685−19690
Tawfik AB, Steiner AL (2011) The role of soil ice in land-atmosphere coupling over the United States: a soil moisture-precipitation winter feedback mechanism.J Geophys Res 116: D02113, doi: 10.1029/2010JD014333
Tawfik AB, Stoeckli R, Goldstein A, Pressley S, Steiner AL(2012) Quantifying the contribution of environmentalfactors to isoprene flux interannual variability. AtmosEnviron 54: 216−224
Tyrlis E, Lelieveld J, Steil B (2013) The summer circulationover the eastern Mediterranean and the Middle East: influence of the South Asian monsoon. Clim Dyn 40: 1103−1123
van Aardenne J, Dentener FJ, Olivier J, Peters J (2005) TheEDGAR 3.2 Fast Track 2000 dataset (32FT2000). Emis-sion Data Base for Global Atmospheric Research. http://themasites.pbl.nl/tridion/en/themasites/edgar/ emission_ data/edgar32/index-2.html
Wiedinmyer C, Akagi SK, Yokelson RJ, Emmons LK, Al-Saadi JA, Orlando JJ, Soja AJ (2011) The Fire INventoryfrom NCAR (FINN): a high resolution global model toestimate the emissions from open burning. Geosci ModelDev 4: 625−641
227

Clim Res 59: 207–228, 2014
Xu J, Ma JZ, Zhang XL, Xu XB and others (2011) Measure-ments of ozone and its precursors in Beijing during sum-mertime: impact of urban plumes on ozone pollution indownwind rural areas. Atmos Chem Phys 11: 12241−12252
Zakey AS, Solmon F, Giorgi F (2006) Implementation andtesting of a desert dust module in a regional climatemodel. Atmos Chem Phys 6: 4687−4704
Zakey AS, Abdel-Wahab MM, Pettersson JBC, Gatari MJ,Hallquist M (2008) Seasonal and spatial variation ofatmospheric particulate matter in a developing megacity,the Greater Cairo, Egypt. Atmosfera 21: 171−189
Zaveri RA, Peters LK (1999) A new lumped structure photo-chemical mechanism for large-scale applications. J Geo-phys Res 104: 30387−30415
228
Editorial responsibility: Helmut Mayer, Freiburg, Germany
Submitted: April 29, 2013; Accepted: November 18, 2013Proofs received from author(s): March 27, 2014