Clim. Past Discuss., ...
17
1 Timing and Structure of the 4.2 ka BP Event in the Indian Summer Monsoon Domain from an Annually-Resolved Speleothem Record from Northeast India Gayatri Kathayat 1* , Hai Cheng 1, 2* , Ashish Sinha 3 , Max Berkelhammer 4 , Haiwei Zhang 1 , Pengzhen Duan 1 , Hanying Li 1 , Xiangley Li 1 , Youfeng Ning 1 , Richard Lawrence Edwards 2 5 1 Institute of Global Environmental Change, Xi’an Jiaotong University, China 2 Department of Earth Sciences, University of Minnesota, Minneapolis, USA 3 Department of Earth Science, California State University Dominguez Hills, Carson, USA 4 Department of Earth and Environmental Sciences, University of Illinois, Chicago, USA 10 Correspondence to: Gayatri Kathayat ([email protected]) & Hai Cheng ([email protected]). Abstract A large array of proxy records suggests that the ‘4.2 ka event’ marks an ~ 300-year period 15 of major global climate anomaly. However, the climatic manifestation of this event, including its onset, duration, and termination, remain less clear in the Indian summer monsoon (ISM) domain. Here, we present a new speleothem oxygen isotope (δ 18 O) record from Mawmluh Cave, Northeast India, which provides an annually-resolved record of changes in ISM strength between ~4.440 and 3.780 ka BP. Our δ 18 O record is constrained 20 by 18 230 Th dates with an average age uncertainty of 13 years and a dating resolution of ~40 years, which allow us to characterize the timing and structure of the ‘4.2 ka event’ with an unprecedented detail. The overall expression of the 4.2 ka event in our record shares broad similarities with a previous δ 18 O record from the Mawmluh Cave as well as with other previous lower-resolution proxy reconstructions of the ISM. However, unlike 25 some previous ISM records, where the ‘4.2 ka event’ has been described as a singular multi-centennial period of anomalously weak ISM, our data suggest a more variable nature of ISM during this period. The ‘4.2 ka event’ in our record exhibits a three-stage structure, characterized by highly variable ISM between ~4.255 and 4.070 ka BP and a distinct pluvial phase from ~4.070-4.010 ka BP. The latter abruptly (<10 years) 30 culminated into a relatively weaker phase of ISM, which was punctuated by a number of multidecadal periods of anomalously drier condition. While our record shows evidence of a discernible beginning of the 4.2 ka event, there is no clear evidence of its ‘end’ thus, suggesting that the ISM experienced a major regime-shift or transition at ~ 4.0 ka BP. 35 Clim. Past Discuss., https://doi.org/10.5194/cp-2018-92 Manuscript under review for journal Clim. Past Discussion started: 16 August 2018 c Author(s) 2018. CC BY 4.0 License.
Transcript of Clim. Past Discuss., ...

1
Timing and Structure of the 4.2 ka BP Event in the Indian Summer Monsoon Domain
from an Annually-Resolved Speleothem Record from Northeast India
Gayatri Kathayat1*, Hai Cheng1, 2*, Ashish Sinha3, Max Berkelhammer4, Haiwei Zhang1, Pengzhen
Duan1, Hanying Li1, Xiangley Li1, Youfeng Ning1, Richard Lawrence Edwards2 5
1 Institute of Global Environmental Change, Xi’an Jiaotong University, China 2 Department of Earth Sciences, University of Minnesota, Minneapolis, USA 3 Department of Earth Science, California State University Dominguez Hills, Carson, USA 4 Department of Earth and Environmental Sciences, University of Illinois, Chicago, USA 10
Correspondence to: Gayatri Kathayat ([email protected]) & Hai Cheng ([email protected]).
Abstract
A large array of proxy records suggests that the ‘4.2 ka event’ marks an ~ 300-year period 15
of major global climate anomaly. However, the climatic manifestation of this event,
including its onset, duration, and termination, remain less clear in the Indian summer
monsoon (ISM) domain. Here, we present a new speleothem oxygen isotope (δ18O) record
from Mawmluh Cave, Northeast India, which provides an annually-resolved record of
changes in ISM strength between ~4.440 and 3.780 ka BP. Our δ18O record is constrained 20
by 18 230Th dates with an average age uncertainty of 13 years and a dating resolution of
~40 years, which allow us to characterize the timing and structure of the ‘4.2 ka event’
with an unprecedented detail. The overall expression of the 4.2 ka event in our record
shares broad similarities with a previous δ18O record from the Mawmluh Cave as well as
with other previous lower-resolution proxy reconstructions of the ISM. However, unlike 25
some previous ISM records, where the ‘4.2 ka event’ has been described as a singular
multi-centennial period of anomalously weak ISM, our data suggest a more variable
nature of ISM during this period. The ‘4.2 ka event’ in our record exhibits a three-stage
structure, characterized by highly variable ISM between ~4.255 and 4.070 ka BP and a
distinct pluvial phase from ~4.070-4.010 ka BP. The latter abruptly (<10 years) 30
culminated into a relatively weaker phase of ISM, which was punctuated by a number of
multidecadal periods of anomalously drier condition. While our record shows evidence
of a discernible beginning of the 4.2 ka event, there is no clear evidence of its ‘end’ thus,
suggesting that the ISM experienced a major regime-shift or transition at ~ 4.0 ka BP.
35
Clim. Past Discuss., https://doi.org/10.5194/cp-2018-92Manuscript under review for journal Clim. PastDiscussion started: 16 August 2018c© Author(s) 2018. CC BY 4.0 License.

2
1. Introduction
The interval between 4.2 and 3.9 ka BP (thousand years before present, where present =1950
AD) constitutes an important period of time from both climatological and archeological
perspectives (e.g., Weiss et al.,1993; Cullen et al., 2000; Staubwasser et al., 2003; 40
Berkelhammer et al., 2012). A global suite of proxy records shows widespread climate
anomalies during this time (commonly referred as the ‘4.2 ka event’) (e.g., Cullen et al., 2000;
Staubwasser et al., 2003; Arz et al., 2006; Drysdale et al., 2006; Menounos et al., 2008; Liu
and Feng, 2012; Berkelhammer et al., 2012; Dixit et al., 2014; Cheng et al. 2015; Nakamura et
al., 2016; Dixit et al., 2018; Railsback et al., 2018). Additionally, a number of archeological 45
studies also suggest that the ‘4.2 ka event’ may have been associated with a series of cultural
and societal changes in the Mediterranean, Middle East, Africa, South and East Asia (e.g.,
Weiss et al.,1993; Enzel et al., 1999; Cullen et al., 2000; Staubwasser et al., 2003; Marshall et.
al., 2011; Liu and Feng, 2012; Dixit et al., 2014; Weiss, 2016). For example, the ‘4.2 ka event’
has been proposed to have contributed to collapses of the early Bronze age civilizations, 50
including the Longshan Culture in China (Change, 1999; Liu and Feng, 2012), Egyptian Old
Kingdom by the Nile River (Stanley et al., 2003), and the Akkadian Empire in Mesopotamia
(Weiss et al.,1993; Cullen et al., 2000). In South Asia, the 4.2 ka event has been linked to a
weakening of the Indian summer monsoon (ISM) and the ensuing deurbanization of the Indus
Valley Civilization (Staubwasser et al., 2003; Madella and Fuller, 2006; Dixit et al., 2014; 55
Giosan et al., 2012; Berkelhammer et al., 2012; Kathayat et al., 2017; Dixit et al., 2018).
A number of proxy records from the Indian subcontinent suggest that a major weakening
of ISM occurred during the ‘4.2 ka event’ (Staubwasser et al., 2003; Berkelhammer et al., 2012;
Ponton et al., 2012., Dixit et al., 2014; Nakamura et al., 2016; Hong et al 2014; Hong et al.,
2016; Shukla et al., 2018) (Fig. 1). 60
This event has been generally described as an approximately a two centuries-long
interval of aridity, which was superimposed on a long-term gradually declining trend in ISM
in response to decreasing northern hemisphere summer insolation (e.g., Kathayat et al., 2017).
However, the timing, structure and magnitude of the 4.2 ka event in the ISM regime remain
unclear. For example, while a speleothem record from Mawmluh Cave in Northeast India 65
shows an abrupt onset of the event at ~4.1 ka BP (Berkelhammer et al., 2012), the
onset/duration timings of the 4.2 ka event in other records differ considerably (e.g.,
Staubwasser and Weiss, 2006; Prasad and Enzel, 2006; Nakamura et al., 2016; Dixit et al.,
2018). Furthermore, a speleothem oxygen isotope (δ18O) record from Sahiya Cave, North India
Clim. Past Discuss., https://doi.org/10.5194/cp-2018-92Manuscript under review for journal Clim. PastDiscussion started: 16 August 2018c© Author(s) 2018. CC BY 4.0 License.

3
(Kathayat et al., 2017) indicates a long-term drying trend in ISM from ~4200 to 3500 years but 70
does not contain a clear expression of the event.
Figure 1. Location map and spatial structure of mean JJAS precipitation and low-level
winds. (A) JJAS precipitation from the Tropical Rainfall Measuring Mission (TRMM). The
locations of Mawmluh Cave (white circle) and other proxy records mentioned in the text 75 (yellow circles and numbers). The numbering scheme is as follows: 1, Sahiya cave (Kathayat
et al., 2017); 2, Lake Rara (Nakamura et al., 2016); 3, Kotla Dhar (Dixit et al., 2014); 4,
Mawmluh Cave (Berkelhammer et al., 2012); and 5, Indus Delta (Staubwasser et al., 2003).
(B) 850 hPa-level monsoon vector from zoomed Laboratoire de Meteorologie Dynamique
(LMDZ) general circulation model with telescoping zooming (figure adapted and modified 80 from Sabin et al., 2013). The zoom version shows a well-defined cyclonic circulation with
westerlies on the southern flanks and easterly winds on the northern flanks of the Monsoon
Trough. The Mawmluh Cave is ideally located to record upstream variations in the overall
strength of the ISM (see text).
85
However, the latter may also stem from relatively large age uncertainties and low
temporal resolution of the Sahiya Cave record around this time interval, which preclude a
definitive assessment of the ‘4.2 ka event’ (Kathayat et al., 2017).
A high resolution (~ 6 years) δ18O record from Mawmluh Cave (KM-A), Northeast India
has previously provided a clear evidence of the ‘4.2 ka event’ from the ISM domain 90
(Berkelhammer et al. 2012). The 4.2 ka event in the KM-A record event can be described as a
‘pulse-like’ change in the ISM, characterized by a sharp increase in the speleothem 18O values
(implying weaker ISM) at ~ 4.07 ka, which was followed by a large and abrupt decrease in the
18O values at 3.88 ka BP. However, the exact timing and structure of the 4.2 ka event from
the KM-A sample has some uncertainty associated with the fact that it is only constrained by 95
only two 230Th dates. Furthermore, the termination of the event occurs near the top ~2 mm
Clim. Past Discuss., https://doi.org/10.5194/cp-2018-92Manuscript under review for journal Clim. PastDiscussion started: 16 August 2018c© Author(s) 2018. CC BY 4.0 License.

4
portion of KM-A, where the 18O values may have been potentially influenced by recent
morphological changes in the shape of KM-A stalagmite. Here, we provide two new replicated
speleothem δ18O records from Mawmluh Cave (ML.1 and ML.2) (Fig. 2) with an average δ18O
resolutions of ~1 and ~5-year, respectively. 100
Figure 2. Samples photograph: The total length of ML.1 and ML.2 samples is 315 & 311mm
respectively. The arrows indicate the dating sub-sampling location and the 230Th dates with the
2σ analytical error (also see Supplementary Table 1). The cm scale indicates the location of
isotopic measurements, enclosing the interval of interest within both the samples. 105
The ML.1 and ML.2 δ18O records span from 4.440 to 3.780 ka BP and 4.530 to 3.370 ka
BP, respectively. Our new record is sub-annually to annually resolved, has precise chronologic
constraints. The ML.1 and ML.2 chronologies are established by 18 230Th dates with age
uncertainty of ~13 years (average dating resolution of ~40 years) and 5 230Th dates with age 110
uncertainty of ~16 years, respectively (Fig. 3) (also see Supplementary Table 1), which allow
us to precisely characterize the timing, structure, and manifestation of the 4.2 ka event in the
ISM regime. Particularly, we aim to provide better constraints on the timing of the onset of the
event and refine the nature of the event’s termination.
115
Clim. Past Discuss., https://doi.org/10.5194/cp-2018-92Manuscript under review for journal Clim. PastDiscussion started: 16 August 2018c© Author(s) 2018. CC BY 4.0 License.
5
Figure 3. Age Models of ML.1 and ML.2 records. We adopted COPRA and generated 2000
realizations of age models to account for the dating uncertainties (2.5 and 97.5% quantile)
confidence limits. (A) ML-1 age models and modeled age uncertainties using 3 different age-120 modeling algorithms, COPRA (black), Bchron (purple) and ISCAM (red). The gray band
depicts the 95% confidence interval using COPRA. Error bars on 230Th dates represent a 2σ
analytical error. (B) ML.2 age model and modeled age uncertainties using COPRA.
2 Samples and Methods 125
2.1 Cave location, climatology & characteristics
Mawmluh Cave (25°15′32″N, 91°42′45″E, 1290 m asl) is located near the town of Sohra
(Cherrapunji) at the southern fringe of the Meghalaya Plateau, Northeast India (Fig. 1). The
mean annual rainfall is ~11,000 mm in the region, 70% of precipitation falls during the peak
ISM months (June-September) (Murata et al., 2007). The rainfall at the cave site during the 130
ISM period is mainly produced by convective systems and the low-level air parcels originated
from the Bay of Bengal, which propagates further northward and penetrate deep into the
Tibetan Plateau (Breitenbach et al., 2010; Sengupta and Sarkar, 2006). The non–monsoonal
component of the rainfall is trivial and consists of the westerly related moisture as well as
recycled local moisture (Breitenbach et al., 2010 and 2015; Berkelhammer et al., 2012). The 135
cave is overlain by ~30–100 m thick and heavily karstified host rock (limestone, sandstone,
and a ~40–100 cm thick coal layer) (Breitenbach et al., 2010). The soil layer above the cave is
rather thin (5–15 cm) and covered mainly by grasses and bushes. The cave monitoring data
(Breitenbach et al., 2010) indicate that the relative humidity inside the cave is more than 95%
even during the dry season (November to April). The temperature variations in the cave are 140
small (18.0–18.5°C) and close to the mean annual temperature of the area (Breitenbach et al.,
2010 and 2015). A 3-year monitoring study in Mawmluh Cave (Breitenbach et al., 2010)
Clim. Past Discuss., https://doi.org/10.5194/cp-2018-92Manuscript under review for journal Clim. PastDiscussion started: 16 August 2018c© Author(s) 2018. CC BY 4.0 License.
6
suggests that drip-water δ18O signals in the cave lag the local rainfall by less than 1 month, and
thus preserves the seasonal signal of ISM rainfall. Previous studies have indicated that
variations in the δ18O of speleothem calcite from Mawmluh Cave reflect changes in the 145
amount-weighted δ18O of precipitation (δ18Op) values (Breitenbach et al., 2010 and 2015;
Berkelhammer et al., 2012; Myers et al., 2015; Dutt et al., 2015).
2.2 Proxy Interpretation
The temporal δ18O variations in monsoonal rainfall and consequently in speleothem in 150
the study area have been previously interpreted to dominantly reflect spatially-integrated
upstream changes in the ISM strength (Sinha et al., 2011; Berkelhammer et al., 2012). A
number of studies with isotope-enabled general circulation models (GCMs) also suggest a
significant inverse relationship between ISM upstream summer (June to September) rainfall
amount and δ18Op variations over the Indian Subcontinent (e.g., Vuille et al., 2005; Pausata et 155
al., 2011; Berkelhammer et al., 2012; Sinha et al., 2015; Midhun and Ramesh, 2016). As such,
the low and high δ18O values of our records are used to refer to strong and weak monsoons,
respectively, consistent with a number of previous studies (e.g., Dayem et al., 2010;
Breitenbach et al., 2010; Sinha et al., 2011; Cheng et al., 2012; Sinha et al., 2011;
Berkelhammer et al., 2012; Breitenbach et al., 2015; Myers et al., 2015, Dutt et al., 2015; Cheng 160
et al., 2012; Kathayat et al., 2016; Kathayat et al., 2017).
2.3 Samples preparation
The ML.1 and ML.2 samples from Mawmluh Cave were collected ~4–5 m above the
cave floor in November 2015 ~700 meters from the cave entrance. The diameters of ML.1 and 165
ML.2 are ~170 and 165 mm, and the length ~315 and ~311 mm, respectively. Both stalagmite
samples were cut along their growth axes, using a thin diamond blade. The sub-samples for
isotopic measurements for the ML.1 and ML.2 samples were obtained from depths between
~125–250 mm and ~182–255 mm (with respect to the top), respectively. Accordingly, we
report our data with depths of zero set at 125 mm and 182 mm from the top for samples ML.1 170
and ML.2, respectively. Both samples do not have any visible changes in the texture or hiatuses
in the above intervals for this study (Fig. 2).
Clim. Past Discuss., https://doi.org/10.5194/cp-2018-92Manuscript under review for journal Clim. PastDiscussion started: 16 August 2018c© Author(s) 2018. CC BY 4.0 License.

7
2.4 230Th dating
Subsamples from ML.1 and ML.2 for 230Th dating (30 mg) were drilled using a 0.5 mm 175
carbide dental drill. The 230Th dating was performed at the Xi’an Jiaotong University, China
using Thermo-Finnigan Neptune-plus multi-collector inductively coupled plasma mass
spectrometers (MC-ICP-MS). The methods were described in Cheng et. al., 2000 and 2013).
We used standard chemistry procedures (Edwards et al., 1987) to separate uranium and thorium.
A triple-spike (229Th–233U–236U) isotope dilution method was used to correct instrumental 180
fractionation and to determine U/Th isotopic ratios and concentrations (Cheng et al., 2000;
Cheng et al., 2013). U and Th isotopes were measured on a MasCom multiplier behind the
retarding potential quadrupole in the peak-jumping mode using the standard procedures (Cheng
et al., 2000). Uncertainties in U/Th isotopic measurements were calculated offline at 2σ level,
including corrections for blanks, multiplier dark noise, abundance sensitivity, and contents of 185
the same nuclides in spike solution. The U decay constants are reported in Cheng et al. (2013).
Corrected 230Th ages assume the initial 230Th/232Th atomic ratio of 4.4 ±2.2 ×10⁻⁶, the values
for material at secular equilibrium with the bulk earth 232Th/238U value of 3.8. The corrections
are small because the uranium concentrations are high (~6 ppm) and detrital 232Th components
are low (average <170 ppt) in both the samples (Supplementary Table 1). 190
2.5 Age models
We obtained 18 and 5 230Th dates for samples ML. 1 and ML. 2, respectively. The
average dating resolution for ML.1 is ~40 years with a precision of ~ 13 years. In addition,
the portion of the 4.2 ka BP event (between 27 and 88 mm depth in ML.1) is constrained by a 195
total of 9 230Th dates with the average spacing of 7 mm between successive dates. All the dates
are in chronological order within an average dating uncertainty of ±12 years. The ML.1 and
ML.2 age models and associated uncertainties were constructed using COPRA (Constructing
Proxy Records from Age model) (Breitenbach et al., 2012), Bchron (Haslett et al., 2008) and
ISCAM (Fohlmeister, 2012) age modeling schemes (Fig. 3), respectively. All three modeling 200
schemes yielded nearly identical age models and the conclusions of this study are not sensitive
to the choice of the age models (Fig. 3).
Clim. Past Discuss., https://doi.org/10.5194/cp-2018-92Manuscript under review for journal Clim. PastDiscussion started: 16 August 2018c© Author(s) 2018. CC BY 4.0 License.
8
2.6 Stable isotope analysis 205
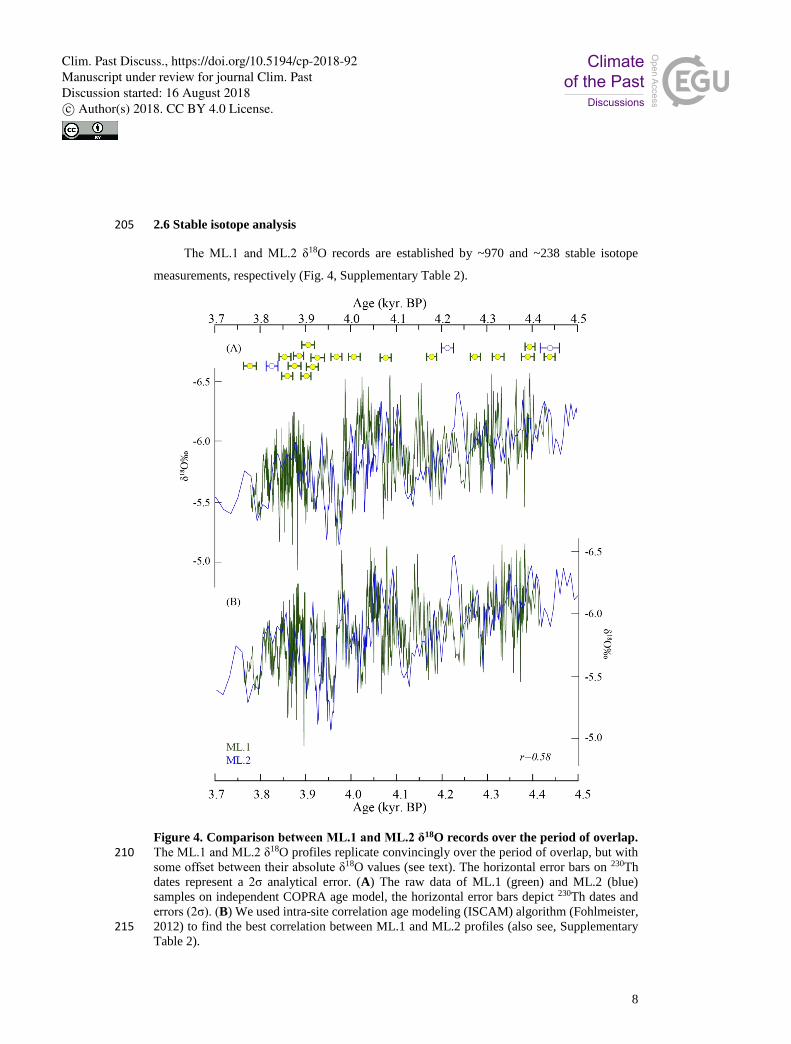
The ML.1 and ML.2 δ18O records are established by ~970 and ~238 stable isotope
measurements, respectively (Fig. 4, Supplementary Table 2).
Figure 4. Comparison between ML.1 and ML.2 δ18O records over the period of overlap.
The ML.1 and ML.2 δ18O profiles replicate convincingly over the period of overlap, but with 210 some offset between their absolute δ18O values (see text). The horizontal error bars on 230Th
dates represent a 2σ analytical error. (A) The raw data of ML.1 (green) and ML.2 (blue)
samples on independent COPRA age model, the horizontal error bars depict 230Th dates and
errors (2σ). (B) We used intra-site correlation age modeling (ISCAM) algorithm (Fohlmeister,
2012) to find the best correlation between ML.1 and ML.2 profiles (also see, Supplementary 215 Table 2).
Clim. Past Discuss., https://doi.org/10.5194/cp-2018-92Manuscript under review for journal Clim. PastDiscussion started: 16 August 2018c© Author(s) 2018. CC BY 4.0 License.

9
We used New Wave Micromill, a digitally controlled tri-axial micromill equipment, to
obtain subsamples. The subsamples (80 g) were continuously micromilled from ML. 1 and
ML. 2 with typical increments between 50 and 100m (dependent on growth-rates) along the
stalagmites growth axes. The δ18O and δ13C were measured using Finnigan MAT-253 mass 220
spectrometer coupled with an on-line carbonate preparation system (Kiel-IV) in the Isotope
Laboratory, Xi’an Jiaotong University. Results are reported in per mil (‰) relative to the
Vienna PeeDee Belemnite (VPDB) standard. Duplicate measurements of standards NBS19 and
TTB1 show a long-term reproducibility of ~0.1‰ (1σ) or better.
225
2.7 Replication
We assessed the replication between ML.1 and ML.2 δ18O records by using the ISCAM
(Intra-Site Correlation Age Modeling) algorithm (Fohlmeister, 2012). The ISCAM finds the
best correlation between the proxy records by using a Monte Carlo approach. Significant levels
were calculated against a red-noise background from 1,000 pairs of artificially simulated first-230
order autoregressive time series (AR1). The ML.1 and ML.2 δ18O time series on ISCAM
derived age models display a statistically significant correlation (r =0.58 at 95% confidence
level) during their contemporary growth period between ~4.4–3.8 ka BP. The minor
discrepancies between the two profiles may result from slight differences in their 230Th dating
resolution and/or growth rate variations (Fig. 4). 235
3 Results and Discussion
3.1 Results
The ML.1 and ML.2 δ18O values range between -6.6‰ and -4.4‰ with mean values of
-5.80‰ and -5.43‰, respectively. A slight but systematic offset in the mean δ18O values of 240
0.4‰ between the two records may possibly stem from karst-related difference in the drip and
/or degassing rates. Temporal resolutions of the ML.1 record range from ~0.1 to ~3 years with
an average resolution of ~1 year. The average temporal resolution of the ML.2 record is ~5
years (Figs. 4 and 5).
245
Clim. Past Discuss., https://doi.org/10.5194/cp-2018-92Manuscript under review for journal Clim. PastDiscussion started: 16 August 2018c© Author(s) 2018. CC BY 4.0 License.

10
3.2 Comparisons between KM-A and ML.1 and ML.2 δ18O records
The ML.1 and ML.2 δ18O record displays broad similarities with the previous KM-A δ18O
record from the same cave (Berkelhammer et al., 2012) but some differences are also evident 250
(Fig. 5).
Figure 5. Comparison between KM-A and ML.1, ML2: The KM-A stalagmite sample
picture from Mawmluh cave (Berkelhammer et al., 2012). The 4.2 ka event occurs at the top
portion of the sample (0-29 mm) which tapers towards the top and is constrained by three 230Th 255 dates (yellow dots). The dotted lines indicate the δ18O depth from 4400 to 3654 years BP on
the KM-A sample. Previously published stalagmite (KM-A) δ18O record (red) from Mawmluh
Cave (Berkelhammer et al., 2012). The raw δ18O profile (blue) from ML.2 (this study) is
overlaid by 6-years interpolated δ18O profile (green) of ML.1 (this study, also see,
Supplementary Table 2). The horizontal error bars (red, green and blue) on the 230Th dates 260 represent a 2σ analytical error. The vertical grey bar indicates the duration of the weak (driest
phase) ISM variability recorded between KM-A and ML δ18O profiles. The yellow bar
indicates the anomalously depleted δ18O values in KM-A record.
Clim. Past Discuss., https://doi.org/10.5194/cp-2018-92Manuscript under review for journal Clim. PastDiscussion started: 16 August 2018c© Author(s) 2018. CC BY 4.0 License.

11
The ‘4.2 ka event’ in the KM-A record manifest as a two-step change, marked by an initial 265
increase in δ18O values (~0.6‰) between ~4.315 and 4.303 ka followed by a second and more
abrupt increase between ~ 4.071 and 4.049 ka BP. The latter is characterized by the most
enriched δ 18O values over the entire record (~1.5‰ higher than the background values before
the event) (Fig. 5). The timing of most significant increase in both ML.1 and ML.2 δ18O values
is similar to that observed in the KM-A profile (within the margin of age uncertainties) however, 270
the amplitudes of δ18O change in our records are smaller by ~0.5 ‰ relative to the KM-A
profile (Fig. 5). The key difference between our and the KM-A records however, is the absence
of a sharp decrease in the δ18O values in ML.1/Ml.2 profiles after 3.88 ka BP, which mark the
termination of 4.2 ka event in the KM-A record. In contrast, the Ml.1/Ml.2 profiles exhibit a
longer-term gradual increase in the δ18O values throughout the entirety of the record, 275
punctuated by several intervals of anomalously enriched δ18O values. One plausible
explanation of the apparent differences between the two records could stem from partial
dissolution of top most portion of KM-A sample (Fig. 5), where the most depleted δ18O values
were recorded. This is evident from deposition of a layer of white aragonite that apparently
occurred in the recent several decades after at the top of the old portion of the KM-A stalagmite 280
(Fig. 5), implying a possibility that the structure of the ‘4.2 ka event’ in the KM-A record could
have been altered to some extent. It is unlikely this affected the onset of the event, as it is
consistent between all record, but it does suggest the event may be better described as a “regime
shift” as opposed to a “pulse”.
285
3.3 The ISM variability between 4.440 and 3.778 ka BP
A three-phase sequence of changes in the ML.1 δ18O record (Fig. 6) characterize the structure
of the ‘4.2 ka event’ in the ISM domain (Fig. 6). The first phase is marked by an abrupt
transition at ~4.255 ka BP from a pluvial-like condition (i.e., lower δ18O) to highly variable
ISM (dry/wet) state that lasted for ~185 years (Fig. 6). This pattern of change in ISM is broadly 290
consistent with other proxy records from the ISM region (e.g., Staubwasser et al., 2003;
Kathayat et al., 2017). Within this phase, we infer the presence of two distinct decadal-length
droughts (see Fig. 6 for definition) centered at about ~4.2 ka BP (~13 years) and ~4.175 ka BP
(~10 years), respectively (Fig. 6). The second phase, between ~4070 and ~4010 years BP, is
marked by persistently depleted δ18O values indicating a relatively stronger ISM period of ~60 295
years (Fig. 6). The third phase of the 4.2 ka event in ML.1 record is marked by an abrupt
Clim. Past Discuss., https://doi.org/10.5194/cp-2018-92Manuscript under review for journal Clim. PastDiscussion started: 16 August 2018c© Author(s) 2018. CC BY 4.0 License.
12
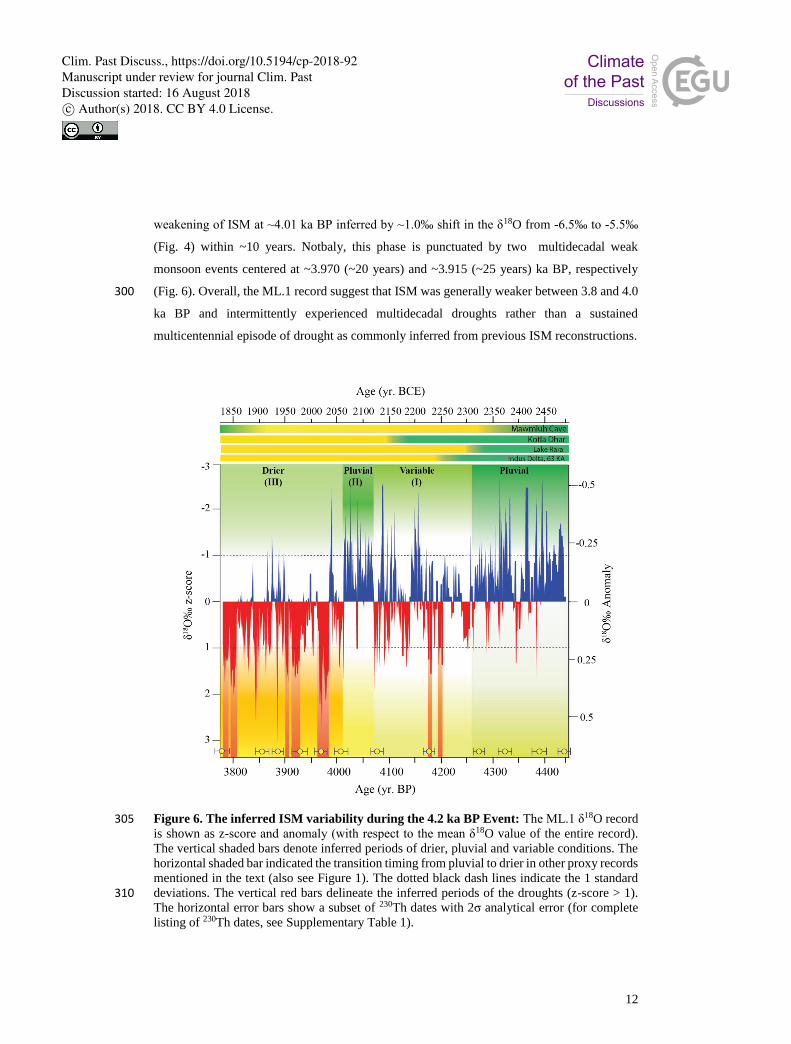
weakening of ISM at ~4.01 ka BP inferred by ~1.0‰ shift in the δ18O from -6.5‰ to -5.5‰
(Fig. 4) within ~10 years. Notbaly, this phase is punctuated by two multidecadal weak
monsoon events centered at ~3.970 (~20 years) and ~3.915 (~25 years) ka BP, respectively
(Fig. 6). Overall, the ML.1 record suggest that ISM was generally weaker between 3.8 and 4.0 300
ka BP and intermittently experienced multidecadal droughts rather than a sustained
multicentennial episode of drought as commonly inferred from previous ISM reconstructions.
Figure 6. The inferred ISM variability during the 4.2 ka BP Event: The ML.1 δ18O record 305 is shown as z-score and anomaly (with respect to the mean δ18O value of the entire record).
The vertical shaded bars denote inferred periods of drier, pluvial and variable conditions. The
horizontal shaded bar indicated the transition timing from pluvial to drier in other proxy records
mentioned in the text (also see Figure 1). The dotted black dash lines indicate the 1 standard
deviations. The vertical red bars delineate the inferred periods of the droughts (z-score > 1). 310 The horizontal error bars show a subset of 230Th dates with 2σ analytical error (for complete
listing of 230Th dates, see Supplementary Table 1).
Clim. Past Discuss., https://doi.org/10.5194/cp-2018-92Manuscript under review for journal Clim. PastDiscussion started: 16 August 2018c© Author(s) 2018. CC BY 4.0 License.

13
4 Conclusions 315
The ML.1/ML.2 records from Mawmluh Cave, Northeast India provide a new record of
ISM covering the period from ~4.440 to 3.780 ka BP. The record has unprecedented high-
resolution (annual) and precise age control (~13 years), thus characterizes the timing and
structure of the ‘4.2 ka event’ in much more detail. It is now evident that the ‘4.2 ka event’ in
Northeast India displays a three-phase structure: a dry (weak ISM) – wet (strong ISM) – dry 320
(weak ISM) rhythm corresponding to the first (~4.255–4.070 ka BP), second (~4.070–4.012 ka
BP) and third (~4.020–3.890 ka BP) phases, respectively as inferred from the 18O records.
The new record also provides the most precise ISM variability up till now in the time range,
which may potentially play a critical role in correlating and calibrating the climate variability
around the ‘4.2 ka event’ globally. 325
5 Author Contributions
330 G.K. and H.C. designed the research and experiments. GK wrote the first draft of the
manuscript. H.C. A.S. and M.B. revised the manuscript. G.K., H.C. and L.X.L. did the
fieldwork and collected the samples. G.K., H.C., H.W.Z., and R.L.E. conducted the 230Th
dating. G.K., P.Z.D. and L.H.Y conducted the oxygen isotope measurements. All authors
discussed the results and provided inputs on the manuscript. 335
6 Competing interests
The authors declare no competing financial interests.
340 7 Acknowledgments
We thank D.S. Chauhan, C.S. Chauhan, A.S. Kathayat, G. Kathayat, N. Pant, S. Melkani, C.
Dunnai, A. Dunnai, and C.J. Dunnai for their assistance during the fieldwork. Funding: This
work is supported by grants from Natural Science Foundation of China to G.K. (NSFC 345 41731174), H.C. (NSFC 41731174 and 4157020432) and H.W.Z. (NSFC 41502166).
8 Data and materials availability
All data needed to evaluate the conclusions in the paper are presented in the paper. Additional 350 data related to this paper may be requested from the authors. The data will be archived at the
NOAA National Climate Data Center (https://www.ncdc.noaa.gov/data-
access/paleoclimatology-data). Correspondence and requests for materials should be addressed
to G.K. ([email protected]) and H.C. ([email protected]).
355
Clim. Past Discuss., https://doi.org/10.5194/cp-2018-92Manuscript under review for journal Clim. PastDiscussion started: 16 August 2018c© Author(s) 2018. CC BY 4.0 License.

14
References:
Arz, H.W., Lamy, F., Pätzold, J.: A pronounced dry event recorded around 4.2 ka in brine sediments
from the northern Red Sea. Quaternary Research 66, 432–441, 2006.
Berkelhammer, M., Sinha, A., Stott, L., Cheng, H., Pausata, F., Yoshimura, K.: An abrupt shift in the
Indian monsoon 4000 years ago. Climates, landscapes, and civilizations, 75–88, 2012. 360
Breitenbach, S.F., Adkins, J.F., Meyer, H., Marwan, N., Kumar, K.K., Haug, G.H.: Strong influence of
water vapor source dynamics on stable isotopes in precipitation observed in Southern Meghalaya,
NE India. Earth and Planetary Science Letters 292, 212–220, 2010.
Breitenbach, S.F.M., Rehfeld, K., Goswami, B., Baldini, J.U.L., Ridley, H.E., Kennett, D.J., Prufer,
K.M., Aquino, V.V., Asmerom, Y., Polyak, V.J., Cheng, H., Kurths, J., Marwan, N.: COnstructing 365
Proxy Records from Age models (COPRA). Clim. Past 8, 1765–1779, 2012.
Breitenbach, S.F.M., Lechleitner, F.A., Meyer, H., Diengdoh, G., Mattey, D., Marwan, N.: Cave
ventilation and rainfall signals in dripwater in a monsoonal setting – a monitoring study from NE
India. Chemical Geology 402, 111–124, 2015.
Chang K.C.: China on the eve of the Historical Period. In: Loewe M and and Shaughnessy EL (eds) 370
The Cambridge History of Ancient China – From the Origins of Civilization to 221 BC. New York:
Cambridge University Press, pp. 37–73, (1999).
Cheng, H., Edwards, R., Hoff, J., Gallup, C., Richards, D., Asmerom, Y.: The half-lives of uranium-
234 and thorium-230. Chemical Geology 169, 17–33, 2000.
Cheng, H., Zhang, P., Spötl, C., Edwards, R., Cai, Y., Zhang, D., Sang, W., Tan, M., An, Z.: The 375
climatic cyclicity in semiarid‐arid central Asia over the past 500,000 years. Geophysical Research
Letters 39, 2012.
Cheng, H., Edwards, R.L., Shen, C.-C., Polyak, V.J., Asmerom, Y., Woodhead, J., Hellstrom, J., Wang,
Y., Kong, X., Spötl, C.: Improvements in 230 Th dating, 230 Th and 234 U half-life values, and
U–Th isotopic measurements by multi-collector inductively coupled plasma mass spectrometry. 380
Earth and Planetary Science Letters 371, 82–91, 2013.
Cheng, H., Sinha, A., Verheyden, S., Nader, F.H., Li, X.L., Zhang, P.Z., Yin, J.J., Yi, L., Peng, Y.B.,
Rao, Z.G., Ning, Y.F., Edwards, R.L.: The climate variability in northern Levant over the past
20,000 years. Geophysical Research Letters 42, 8641–8650, 2015.
Cheng, H., Edwards, R.L., Sinha, A., Spötl, C., Yi, L., Chen, S., Kelly, M., Kathayat, G., Wang, X., Li, 385
X.: The Asian monsoon over the past 640,000 years and ice age terminations. Nature 534, 640-
646, 2016.
Cullen, H.M., Hemming, S., Hemming, G., Brown, F., Guilderson, T., Sirocko, F.: Climate change and
the collapse of the Akkadian empire: Evidence from the deep sea. Geology 28, 379–382, 2000.
Clim. Past Discuss., https://doi.org/10.5194/cp-2018-92Manuscript under review for journal Clim. PastDiscussion started: 16 August 2018c© Author(s) 2018. CC BY 4.0 License.

15
Dayem, K. E., Molnar, P., Battisti, D. S., & Roe, G. H.: Lessons learned from oxygen isotopes in 390
modern precipitation applied to interpretation of speleothem records of paleoclimate from eastern
Asia. Earth and Planetary Science Letters, 295(1), 219–230, 2010.
Dixit, Y., Hodell, D.A., Giesche, A., Tandon, S.K., Gázquez, F., Saini, H.S., Skinner, L.C., Mujtaba,
S.A., Pawar, V., Singh, R.N.: Intensified summer monsoon and the urbanization of Indus
Civilization in northwest India. Scientific reports 8, 4225–, 2018. 395
Dixit, Y., Hodell, D.A., Petrie, C.A.: Abrupt weakening of the summer monsoon in northwest India~
4100 yr ago. Geology 42, 339–342, 2014.
Drysdale, R., Zanchetta, G., Hellstrom, J., Maas, R., Fallick, A., Pickett, M., Cartwright, I., Piccini, L.:
Late Holocene drought responsible for the collapse of Old World civilizations is recorded in an
Italian cave flowstone. Geology 34, 101–104, 2006. 400
Dutt, S., Gupta, A. K., Clemens, S. C., Cheng, H., Singh, R. K., Kathayat, G., & Edwards, R. L.: Abrupt
changes in Indian summer monsoon strength during 33,800 to 5500 years BP. Geophysical
Research Letters, 42(13), 5526-5532, 2015
Edwards, R.L., Chen, J., Wasserburg, G.: 238 U 234 U 230 Th 232 Th systematics and the precise
measurement of time over the past 500,000 years. Earth and Planetary Science Letters 81, 175–405
192, 1987.
Enzel, Y., Ely, L.L., Mishra, S., Ramesh, R., Amit, R., Lazar, B., Rajaguru, S.N., Baker, V.R., Sandler,
A.: High-resolution Holocene environmental changes in the Thar Desert, northwestern India.
Science 284, 125–128, 1999.
Fohlmeister, J.: A statistical approach to construct composite climate records of dated archives. 410
Quaternary Geochronology 14, 48–56, 2012.
Giosan, L., Clift, P.D., Macklin, M.G., Fuller, D.Q., Constantinescu, S., Durcan, J.A., Stevens, T.,
Duller, G.A., Tabrez, A.R., Gangal, K.: Fluvial landscapes of the Harappan civilization.
Proceedings of the National Academy of Sciences 109, E1688-E1694, 2012.
Haslett, J., Parnell, A.: A simple monotone process with application to radiocarbon‐dated depth 415
chronologies. Journal of the Royal Statistical Society: Series C (Applied Statistics) 57, 399–418,
2008.
Hong, B., Hong, Y., Uchida, M., Shibata, Y., Cai, C., Peng, H., Zhu, Y., Wang, Y., Yuan, L.: Abrupt
variations of Indian and East Asian summer monsoons during the last deglacial stadial and
interstadial. Quaternary Science Reviews 97, 58-70, 2014. 420
Hong, B., Uchida, M., Hong, Y., Peng, H., Kondo, M., Ding, H.: The respective characteristics of
millennial-scale changes of the India summer monsoon in the Holocene and the Last Glacial.
Palaeogeography, Palaeoclimatology, Palaeoecology 496, 155-165, 2018.
Kathayat, G., Cheng, H., Sinha, A., Spötl, C., Edwards, R.L., Zhang, H., Li, X., Yi, L., Ning, Y., Cai,
Y., Lui, W.L., Breitenbach, S.F.M.: Indian monsoon variability on millennial-orbital timescales. 425
Scientific Reports 6, 24374, 2016.
Clim. Past Discuss., https://doi.org/10.5194/cp-2018-92Manuscript under review for journal Clim. PastDiscussion started: 16 August 2018c© Author(s) 2018. CC BY 4.0 License.

16
Kathayat, G., Cheng, H., Sinha, A., Yi, L., Li, X., Zhang, H., Li, H., Ning, Y., Edwards, R.L.: The
Indian monsoon variability and civilization changes in the Indian subcontinent. Science advances
3, e1701296, 2017.
Liu, F., Feng, Z.: A dramatic climatic transition at ~4000 cal. yr BP and its cultural responses in Chinese 430
cultural domains. Holocene 22, 1181e1197, 2012.
Madella, M., Fuller, D.Q.: Palaeoecology and the Harappan Civilisation of South Asia: a
reconsideration. Quaternary Science Reviews 25, 1283–1301, 2006.
Marshall, M.H., Lamb, H.F., Huws, D., Davies, S.J., Bates, R., Bloemendal, J., Boyle, J., Leng, M.J.,
Umer, M., Bryant, C.: Late Pleistocene and Holocene drought events at Lake Tana, the source of 435
the Blue Nile. Global and Planetary Change 78, 147–161, 2011.
Menounos, B., Clague, J.J., Osborn, G., Luckman, B.H., Lakeman, T.R., Minkus, R.: Western Canadian
glaciers advance in concert with climate change circa 4.2 ka. Geophysical Research Letters 35,
2008.
Midhun, M., & Ramesh, R.: Validation of δ18O as a proxy for past monsoon rain by multi-GCM 440
simulations. Climate dynamics, 46(5-6), 1371–1385, 2016.
Murata, F., Hayashi, T., Matsumoto, J., Asada, H.: Rainfall on the Meghalaya plateau in northeastern
India—one of the rainiest places in the world. Natural Hazards 42, 391–399. 2007.
Myers, C.G., Oster, J.L., Sharp, W.D., Bennartz, R., Kelley, N.P., Covey, A.K., Breitenbach, S.F.:
Northeast Indian stalagmite records Pacific decadal climate change: Implications for moisture 445
transport and drought in India. Geophysical Research Letters 42, 4124–4132, 2015.
Nakamura, A., Yokoyama, Y., Maemoku, H., Yagi, H., Okamura, M., Matsuoka, H., Miyake, N., Osada,
T., Adhikari, D.P., Dangol, V.: Weak monsoon event at 4.2 ka recorded in sediment from Lake
Rara, Himalayas. Quaternary International 397, 349–359, 2016.
Pausata, F. S., Battisti, D. S., Nisancioglu, K. H., & Bitz, C. M.: Chinese stalagmite [delta] 18O 450
controlled by changes in the Indian monsoon during a simulated Heinrich event. Nature
Geoscience, 4(7), 474-480., 2011.
Ponton, C., Giosan, L., Eglinton, T.I., Fuller, D.Q., Johnson, J.E., Kumar, P., Collett, T.S.: Holocene
aridification of India. Geophysical Research Letters 39, 2012.
Prasad, S., Enzel, Y.: Holocene paleoclimates of India. Quaternary Research 66, 442–453, 2006. 455
Railsback, L.B., Liang, F., Brook, G., Voarintsoa, N.R.G., Sletten, H.R., Marais, E., Hardt, B., Cheng,
H., Edwards, R.L.: The timing, two-pulsed nature, and variable climatic expression of the 4.2 ka
event: A review and new high-resolution stalagmite data from Namibia. Quaternary Science
Reviews 186, 78–90, 2018.
Sabin, T., Krishnan, R., Ghattas, J., Denvil, S., Dufresne, J.-L., Hourdin, F., Pascal, T.: High resolution 460
simulation of the South Asian monsoon using a variable resolution global climate model. Climate
dynamics 41, 173–194, 2013.
Clim. Past Discuss., https://doi.org/10.5194/cp-2018-92Manuscript under review for journal Clim. PastDiscussion started: 16 August 2018c© Author(s) 2018. CC BY 4.0 License.

17
Sengupta, S., Sarkar, A.: Stable isotope evidence of dual (Arabian Sea and Bay of Bengal) vapour
sources in monsoonal precipitation over north India. Earth and Planetary Science Letters 250, 511–
521, 2006. 465
Shukla, T., Mehta, M., Jaiswal, M.K., Srivastava, P., Dobhal, D., Nainwal, H., Singh, A.K.: Late
Quaternary glaciation history of monsoon-dominated Dingad basin, central Himalaya, India.
Quaternary Science Reviews 181, 43-64, 2018.
Sinha, A., Kathayat, G., Cheng, H., Breitenbach, S.F., Berkelhammer, M., Mudelsee, M.,
Biswas, J., Edwards, R.: Trends and oscillations in the Indian summer monsoon rainfall 470
over the last two millennia. Nature communications 6, 2015.
Sinha, A., Berkelhammer, M., Stott, L., Mudelsee, M., Cheng, H., Biswas, J.: The leading mode of
Indian Summer Monsoon precipitation variability during the last millennium. Geophysical
Research Letters 38, 2011
Stanley, J.-D., Krom, M.D., Cliff, R.A., Woodward, J.C.: Nile flow failure at the end of the Old 475
Kingdom, Egypt: strontium isotopic and petrologic evidence. Geoarchaeology: Int. J. 18, 395e402,
2003.
Staubwasser, M., Sirocko, F., Grootes, P., Segl, M.: Climate change at the 4.2 ka BP termination of the
Indus valley civilization and Holocene south Asian monsoon variability. Geophysical Research
Letters 30, 2003. 480
Vuille, M., Werner, M., Bradley, R. S., & Keimig, F.: Stable isotopes in precipitation in the Asian
monsoon region. Journal of Geophysical Research: Atmospheres, 110(D23), n/a-n/a. doi:
10.1029/2005JD006022, 2005.
Weiss, H.: Global megadrought, societal collapse and resilience at 4.2-3.9 ka BP across the
mediterranean and west asia. PAGES 24, 62–63, 2016. 485
Weiss, H., Courty, M.-A., Wetterstrom, W., Guichard, F., Senior, L., Meadow, R., Curnow, A.: The
genesis and collapse of third millennium north Mesopotamian civilization. Science 261, 995–1004,
1993.
Clim. Past Discuss., https://doi.org/10.5194/cp-2018-92Manuscript under review for journal Clim. PastDiscussion started: 16 August 2018c© Author(s) 2018. CC BY 4.0 License.