Client - Sustainability Victoria/media/resources/documents... · Web viewNEPCSC Waste Paint Final...
170
Study into stocks and flows, market analysis and processing capacity of waste paint Final Report National Environment Protection Council Service Corporation 6 June 2014 Nolan Consulting Pty Ltd
Transcript of Client - Sustainability Victoria/media/resources/documents... · Web viewNEPCSC Waste Paint Final...

Study into stocks and flows, marketanalysis and processing capacity of
waste paintFinal Report
National Environment Protection CouncilService Corporation
6 June 2014A190-01
Nolan Consulting Pty Ltd


Insert Report Date
Table of Contents
Executive Summary...................................................................................i
1. Introduction.....................................................................................1
1.1 Process to establish a voluntary paint stewardship scheme................11.2 Definition of waste paint......................................................................11.3 Scope of study......................................................................................11.4 Report..................................................................................................2
2. Study methodology.........................................................................3
2.1 Collection and collation of paint consumption data.............................32.2 Collection and collation of waste paint data........................................42.3 Material flow analysis..........................................................................52.4 Preparation of draft report...................................................................52.5 Refinement of MFA and submission of the final report.......................5
3. Paint sales.......................................................................................6
3.1 Purpose................................................................................................63.2 Primary data sources...........................................................................63.3 Secondary data sources.......................................................................73.4 2012/13 Paint consumption...............................................................10
4. Current systems and processes......................................................12
4.1 Purpose..............................................................................................134.2 Household hazardous chemical collection programs.........................134.3 Industry led PaintCare trial................................................................224.4 Current waste paint collection systems..............................................224.5 Current waste paint disposal/ recycling pathways.............................244.6 Potential waste paint disposal/ recycling pathway.............................26
5. Trade painter survey......................................................................27
5.1 Purpose..............................................................................................275.2 Overview of the trade painter industry..............................................275.3 Survey questions and participants.....................................................295.4 Findings from master painters survey................................................305.5 Survey of NIP&D Participants.............................................................345.6 Comparison with 2010 trade painter survey outcomes.....................34
6. Waste paint in garbage, recycling and illegally disposed.................35
6.1 Purpose..............................................................................................356.2 Garbage and recycling total quantities...............................................356.3 Proportion of waste paint in garbage and recycling streams.............386.4 Proportion of waste paint that is packaging.......................................426.5 Paint density......................................................................................436.6 Processing at liquid waste treatment plants......................................436.7 Illegal dumping...................................................................................43
Study into stocks and flows, market analysis and processing capacity of waste paint Nolan Consulting Pty Ltd
document.docx

Insert Report Date
7. Material flow outcomes.................................................................45
7.1 Purpose..............................................................................................467.2 Overview of key calculations..............................................................467.3 Disposal and recycling pathways........................................................467.4 Trends in stockpiling...........................................................................50
8. Data reliability...............................................................................52
9. Conclusions....................................................................................53
9.1 Sales...................................................................................................539.2 Current systems and processes..........................................................539.3 Trade painter practices.......................................................................549.4 Waste paint in disposal and recycling pathways................................549.5 Material flows....................................................................................549.6 Data reliability....................................................................................55
10. References.....................................................................................56
11. Glossary of terms...........................................................................58
AppendicesA Stakeholders consultedB Graphs of paint sales – 2002/03 to 2012/13C Figures showing municipalities serviced by HHC collection programs
List of Figures3.1 Estimated 2012/13 paint consumption within jurisdictions3.2 Annual paint consumption (2002/03 to 2012/13)4.1 Victorian municipalities serviced with household chemical collections
(including waste paint) in 2012/134.2 NSW municipalities serviced with household chemical collections (including
waste paint) in 2012/134.3 South Australia municipalities serviced with household chemical collections
(including waste paint) in 20144.4 Tasmanian municipalities serviced with household chemical collections
(including waste paint) from March 2009 – December 20124.5 Western Australian municipalities serviced with household chemical collections
(including waste paint) in 2012/134.6 Queensland municipalities serviced with household chemical collections
(including waste paint) in 2012/134.7 ACT household chemical collections localities (including waste paint) in
2012/134.8 Northern Territory municipalities serviced with household chemical collections
(including waste paint) in 2012/13
Study into stocks and flows, market analysis and processing capacity of waste paint Nolan Consulting Pty Ltd
document.docx

Insert Report Date
4.9 HHC collection programs -1994/95 to 2012/13 waste paint quantities (tonne/yr)
4.10 HHC collection programs collections of unused paint as a percentage of retail sales, by weight (2012/13)
5.1 Trade waste survey - Duration of paint in stockpile before disposal 5.2 Trade waste survey – estimated annual waste paint disposal via pathways
(tonne/yr) 6.1 Australian waste and recycling quantities (tonne/yr) 7.1 Retail waste paint estimated 2012/13 disposal and recycling pathways7.2 Trade waste paint estimated 2012/13 disposal and recycling pathways7.3 Total waste paint estimated 2012/13 disposal and recycling pathways7.4 Total waste paint estimated 2012/13 disposal and recycling water and solvent
based waste paint and packaging estimates7.5 Estimated paint consumption, use, storage, and disposal 2012/13 ratios for
retail, trade and total (as percentages)7.6 Retail, trade and total stockpile projections (waste paint only) – 2012/13 to
2022/23 – Do nothing case
Study into stocks and flows, market analysis and processing capacity of waste paint Nolan Consulting Pty Ltd
document.docx

Insert Report Date
Abbreviations
A&D Architectural and decorative
ABC Adelaide Brighton Cement
ABS Australian Bureau of Statistics
ACBPS Australian Customs and Border Protection Service
ACCC Australian Competition and Consumer Commission
ACT Australian Capital Territory
APMF Australian Paint Manufacturers Federation
C&I Commercial and industrial
C&D Construction and demolition
DECCW NSW Department of Environment, Climate Change and Water
DFAT Department of Foreign Affairs and Trade
DYH Detox Your Home
GfK Gesellschaft für Konsumforschung (market research company)
GlobalPSC Global Product Stewardship Council
HDPE High density polyethylene
HHW Household hazardous waste
HHC Household hazardous chemical
ICL Independent Cement and Lime Group
Kg Kilogram
L Litre
MFA Material flow analysis
MPA Master Painters Association
MWAC Municipal Waste Advisory Council of the West Australian Local Government Association
NSW New South Wales
NIP&D National Institute of Painting & Decorating
PP Polypropylene
PPG Pittsburgh Plate Glass ( a paint manufacturing company)
TCDs Total collection days
WA DEC West Australian Department of Environment and Conservation
WALGA West Australian Local Government Association
WPIWG Waste Paint Implementation Working Group
ZWSA Zero Waste South Australia
Study into stocks and flows, market analysis and processing capacity of waste paint Nolan Consulting Pty Ltd
document.docx
Insert Report Date
Appendix BSite photographs
Executive SummaryE.1 Purpose
A list of products proposed for consideration under the Product Stewardship Act 2011 during the next financial year is published each year to provide certainty to the community and business about what is being considered for coverage under the Product Stewardship Act. The publication of the list also fulfils the requirement that any future mandatory or co-regulatory approach be preceded by twelve months’ notice before a particular product can have such a regulatory approach applied. Waste A&D paint was included on the 2013-2014 Product List. The case for a voluntary paint stewardship scheme was prepared by Global Product Stewardship Council (2013) on behalf of Sustainability Victoria and the Australian Paint Manufacturers’ Federation.The stewardship scheme is intended to include architectural and decorative (A&D) paint as well as woodcare products (stains and decking oils). The scheme will exclude A&D paint and woodcare products that are applied to a surface (i.e. used). The scheme applies to any unused portion of paint that is subsequently disposed of by consumers as waste paint and paint packaging.The waste paints proposed to be captured by the voluntary stewardship scheme are:
“all decorative and architectural paints from trade and domestic sources including woodcare products (stains and decking oils) and their respective containers”.
This definition excludes spray packs (aerosols), bagged render, texture coatings, isocynates, paint strippers, industrial coatings and anti-fouling paints.
Page iStudy into stocks and flows, market analysis and processing capacity of waste paintLandfill Name and Address
Nolan Consulting Pty Ltddocument.docx
Insert Report Date
Appendix BSite photographs
The Waste Paint Implementation Working Group (WPIWG) was formed in 2013 to oversee the scheme’s implementation.
E.2 Scope of this report
For the development of the scheme it is essential that there is a sound understanding of the material flows for waste paint generated by householders and trade painters.Nolan Consulting in association with Sustainable Resource Use has been engaged by the National Environment Protection Council Service Corporation to prepare a report into stocks and flows, market analysis and processing capacity of the targeted waste paint in Australia.The report provides information on: the annual consumption (sales) and disposal rates of paint at the national and state
levels; the amount of residual paint including a breakdown into that which is stockpiled and
that requiring disposal; the current processes of how residual waste paint is being disposed, including a
breakdown of waste paint; andthe current systems/processes in place to collect and process residual waste paint, their collection rates and capacities.
Page iiStudy into stocks and flows, market analysis and processing capacity of waste paintLandfill Name and Address
Nolan Consulting Pty Ltddocument.docx
Insert Report Date
Appendix BSite photographs
E-3 Findings
Sales1. 152.7 million litres of water based and solvent based A&D paints, including imports,
was sold into the Australian market in 2012/13. Retail sales accounted for 43% of all sales. The paint to be included in the voluntary product stewardship scheme as per the waste paint definition accounted for 126.7 million litres in 2012/13.
2. 94% of the paint sales proposed to be subject to the voluntary product stewardship scheme is A&D paint. The remaining six percent is woodcare products (wood stains, lacquers, and oils).
3. 90% of paint sales are water based paints with remaining 10% being solvent based. The solvent based paints are less widely used than a decade ago.
4. On a volumetric basis, 68% of paint is sold in steel packaging with 32 percent sold in plastic packaging. The plastic packaging is currently limited to 10 L and 15 L units and is typically about 65% of the weight of steel packaging for the equivalent packaging unit size.
5. The specific gravity of paint is about 1.3 kg/L for water based paint and about 1.2 kg/L for solvent based paint.
6. The proportion of total paint sales, by volume, that are retail sales has fluctuated around an average of about 40% over the past decade. It has increased from 38% in 2008/09 to 43.5% in 2012/13.
7. Based upon historical trends zero growth in paint sales is assumed over the next decade.
Current systems and processes
Page iiiStudy into stocks and flows, market analysis and processing capacity of waste paintLandfill Name and Address
Nolan Consulting Pty Ltddocument.docx

Insert Report Date
Appendix BSite photographs
8. All Household Hazardous Chemical (HHC) collection programs include waste paint.9. Victoria, NSW, South Australia and Western Australia have State sponsored HHC
collection programs. HHC collection programs in Queensland, the ACT and the Northern Territory are provided by individual Councils. No formal HHC collection program with waste paint treatment is currently provided in Tasmania.
10. HHC collections occur from temporary (mobile) and permanent drop off sites.11. In 2012/13 a total of 2,760 tonne of waste paint, including packaging, is estimated
to have been collected through the HHC programs across the nation. This is an increase of over 2,200 tonne since 2003/04. The States of NSW, Victoria and Queensland collected close to 80% of the 2012/13 total.
12. Apart from the PaintCare trial undertaken in Victoria in 2013 there have been no dedicated collection programs for waste paint generated by trade painters.
13. Most solvent based waste paint is either used as a high calorific value fuel source for cement kilns or is distilled to recover solvents for reuse with the residual sludge generally used as a fuel source.
14. Most water based waste paint is immobilised and disposed of to landfill with the bulk of the remainder being used as a low calorific value fuel source.
15. Research is underway to develop new treatment and recycling pathways for waste paint with a particular focus on water based paint.
Trade painter practices16. About 32% of the waste paint in trade painter stockpiles is destined for disposal.
The three most popular disposal pathways from the stockpile are (i) solidify and landfill disposal, (ii) donation and (iii) Council drop off site. The primary direct disposal pathway is to leave the waste paint with the customers.
Page ivStudy into stocks and flows, market analysis and processing capacity of waste paintLandfill Name and Address
Nolan Consulting Pty Ltddocument.docx

Insert Report Date
Appendix BSite photographs
17. The average trade painter business stockpile is 568 L. This is slightly less than the 604 L found as part of the Victorian trade painter survey conducted in 2010.
Waste paint in disposal and recycling pathways18. The quantity of waste paint in garbage and recyclables put out for collection by
residents and businesses has been estimated from available waste audit data. 19. Waste paint, including packaging, is estimated to range between 0.05% and 0.14%
by weight of household kerbside garbage. Waste paint, including packaging, is estimated to be about 0.008% of household kerbside recyclables.
20. Waste paint in the C&I and C&D waste stream is estimated to be 0.05%, and in the C&I and C&D recycling stream is estimated to be 0.01%.
21. About 320 tonne/year of trade waste paint is estimated to be disposed of to industrial liquid treatment plants.
22. The illegal disposal of waste paint to sewer and stormwater is estimated to be around 100 tonne/year. It has fallen over the past decade as a result of education and the access to HHC collection programs.
Material flows23. 152.7 million litres of water-based and solvent-based A&D paints, including imports,
was sold into the Australian market in 2012/13.24. On average 92.8% by weight of the A&D and woodcare paint that is sold into the
Australian market is used. 25. On average 7.2% by weight of the A&D and woodcare paint that is sold into the
Australian market is waste arising (both stockpiled and paint requiring disposal).
Page vStudy into stocks and flows, market analysis and processing capacity of waste paintLandfill Name and Address
Nolan Consulting Pty Ltddocument.docx
Insert Report Date
Appendix BSite photographs
26. Of this 7.2%, approximately 1.1% of the overall annual paint sales, by weight, contributes to an increase in the waste paint stockpile.
27. Therefore, the remaining 6.1% of paint consumed/sold annually in Australia becomes waste arising, or waste paint requiring disposal.
28. The total waste paint being stockpiled annually in Australia is estimated to be approximately 2,600 tonnes.
29. The total waste paint and packaging requiring disposal in Australia each year is estimated to be approximately 24,200 tonnes.
30. This can be broken down into the following:a) Total waste paint requiring disposal annually in Australia estimated to be
approximately 12,060 tonnes; andb) Total paint packaging requiring disposal annually in Australia estimated to be
approximately 12,130 tonnes.31. Of the estimated 12,060 tonnes of waste paint requiring disposal in 2012/13,
approximately 87% was water based and 13% was solvent based.32. The usage ‘efficiency’ of paint sold to the retail market is estimated to have
increased by 2.8% since 2002/03.33. The primary disposal pathway of waste paint is via collection with general waste
and disposal to landfill (3.2% of sales for retail and 4.0% for trade).34. For retail paint, the next largest disposal pathway, at 2.4%, is via the HHC collection
system.
Page viStudy into stocks and flows, market analysis and processing capacity of waste paintLandfill Name and Address
Nolan Consulting Pty Ltddocument.docx

Insert Report Date
Appendix BSite photographs
35. The significant increase in the HHC collection programs over the past decade, from 0.6% to 2.4% of retail sales, has resulted in a reduction in the rate of stockpile increase from 6.1% to 0.8%.
36. The increase in retail disposal/recycling from 4.6% in 2002/03 to 7.0% in 2012/13 is due to the increase in collection through the HHC collection programs. This has also resulted in a significant reduction in the rate of stockpile increase.
37. The rate of increase in the trade waste paint stockpile is estimated to be 60% greater than for the retail sector. This is in part due to limited access to designated drop off points. Trade painters have confirmed that the trade paint stockpile is increasing.
Recommendations
The highest priorities for future data collection to enhance the accuracy of the material flow analysis is considered to be through: auditing for waste paint in C&I and C&D waste and recycling streams; survey to estimate waste paint to packaging ratios for the key disposal routes; and physical survey to assist in quantifying current household stockpiles.
Page viiStudy into stocks and flows, market analysis and processing capacity of waste paintLandfill Name and Address
Nolan Consulting Pty Ltddocument.docx

Insert Report Date
Appendix BSite photographs
1. IntroductionA list of products proposed for consideration under the Product Stewardship Act 2011 during the next financial year is published each year to provide certainty to the community and business about what is being considered for coverage under the Product Stewardship Act. The publication of the list also fulfils the requirement that any future mandatory or co-regulatory approach be preceded by twelve months’ notice before a particular product can have such a regulatory approach applied. Waste A&D paint was included on the 2013-2014 Product List.
1.1 Process to establish a voluntary paint stewardship schemeThe Waste Paint Implementation Working Group (WPIWG) was formed in 2013 to oversee the scheme’s implementation. Sustainability Victoria in partnership with the paint industry is taking the lead on the development of a national waste paint stewardship scheme. The paint industry is represented by the Australian Paint Manufacturers’ Federation as well as manufacturers, retailers and trade painter associations.The case for a voluntary paint stewardship scheme was prepared by Global Product Stewardship Council (2013) on behalf of Sustainability Victoria and the Australian Paint Manufacturers’ Federation.
1.2 Definition of waste paintThe stewardship scheme is intended to include architectural and decorative (A&D) paint as well as woodcare products (stains and decking oils).The waste paint proposed to be captured by the voluntary stewardship scheme is:
“all decorative and architectural paints from trade and domestic sources including woodcare products (stains and decking oils) and their respective containers”.
Page 1Study into stocks and flows, market analysis and processing capacity of waste paintLandfill Name and Address
Nolan Consulting Pty Ltddocument.docx
Insert Report Date
Appendix BSite photographs
This definition excludes spray packs (aerosols), bagged render, texture coatings, isocynates, paint strippers, industrial coatings and anti-fouling paints.The term ‘waste paint’ is used in this report to represent all of the above categories that are intended to be captured by the scheme.
1.3 Scope of studyFor the development of the scheme it is essential that there is a sound understanding of the material flows for waste paint generated by householders and trade painters.Nolan Consulting in association with Sustainable Resource Use has been engaged by the National Environment Protection Council Service Corporation to research waste paint material flows through a study into stocks and flows, market analysis and processing capacity of the targeted waste paint in Australia.The following is addressed through the study: the annual consumption (sales) and disposal rates of A&D paint, analysis at both
national and state levels; the amount of residual paint including a breakdown into that which is stockpiled and
that requiring disposal; the current processes of how residual waste paint is being disposed, including a
breakdown of waste paint; and the current systems/processes in place in Australia to collect and process residual
waste paint, including a stocktake of current programs running in different states (administered by both state and local government), their collection rates and capacities, and contamination rates of the program.
Page 2Study into stocks and flows, market analysis and processing capacity of waste paintLandfill Name and Address
Nolan Consulting Pty Ltddocument.docx
Insert Report Date
Appendix BSite photographs
The study builds upon the outcomes of the Nolan-ITU (2004) “Paint and Paint Can Recovery – National Audit and Strategic Plan” which found that 10.5% of A&D paint that was sold into the Australian retail market is stockpiled for reuse.
1.4 ReportThis report presents the outcomes of the study.For ease of reading each report section presenting findings is commenced with a summary of the section outcomes.
Page 3Study into stocks and flows, market analysis and processing capacity of waste paintLandfill Name and Address
Nolan Consulting Pty Ltddocument.docx
Insert Report Date
Appendix BSite photographs
2. Study methodologyThe study methodology was presented in the detailed research input and methodology document which was approved by the NEPC Service Corporation.The methodology has comprised the following key elements:1. Collection and collation of paint consumption data.2. Collection and collation of waste paint data.3. Material flow analysis.4. Preparation of draft report.5. Refinement of MFA and reporting.6. Preparation and submission of final report.The method applied to each of these elements is described below.
2.1 Collection and collation of paint consumption dataThe paint stewardship scheme is intended to include architectural and decorative (A&D) paint as well as woodcare products.Volumetric consumption (sales) data from 2003 to 2012 has been obtained from GfK (Informark) quarterly surveys of the four largest manufacturers in Australia, undertaken on behalf of the Australian Paint Manufacturers’ Federation (APMF). This survey reports data as follows: for A&D and woodcare products;
Page 4Study into stocks and flows, market analysis and processing capacity of waste paintLandfill Name and Address
Nolan Consulting Pty Ltddocument.docx
Insert Report Date
Appendix BSite photographs
for state and territory jurisdictions; and retail and trade.The APMF represents paint and ink manufacturing companies operating across Australia. In addition, associate members are the suppliers of materials and services to the coatings industry. APMF members account for about 95% of all paint manufactured in Australia.The state and territory consumption data, as provided by the APMF, is aggregated for Victoria/Tasmania, Queensland/Northern Territory, and NSW/ACT. For these combined jurisdictions, estimates of the individual jurisdictions are made on a per capita basis.This data is then adjusted to account for sales by other APMF members, other Australian manufacturers and imports.The split between water based paint and solvent based paint is then made based upon industry advice. The volumetric data is then converted to weight estimates based on industry advice on typical water-based and solvent-based paint densities.A meeting was held with the APMF in Sydney on 10 th December 2013 to assist in the data collation.
Page 5Study into stocks and flows, market analysis and processing capacity of waste paintLandfill Name and Address
Nolan Consulting Pty Ltddocument.docx

Insert Report Date
Appendix BSite photographs
2.2 Collection and collation of waste paint dataData and information has been sought on the following waste paint pathways: household kerbside collections:
- garbage;- recycling;- hardwaste;
householder haulage of waste to landfills & transfer stations from residential sites; skips delivered to landfills/ transfer stations from residential sites; household hazardous chemical ( HHC) collection services; commercial and industrial waste to:
- landfill;- recycling;
construction and demolition waste to:- landfill;- recycling; and
illegal dumping (to sewer and stormwater).Information has also been sought on waste paint treatment and recovery processes.Nolan Consulting has been assisted by Department of the Environment, state and territory jurisdictions, water authorities, and waste treatment and recovery companies in the collection of this information. A full list of stakeholders that have been consulted is presented in Appendix A.
Page 6Study into stocks and flows, market analysis and processing capacity of waste paintLandfill Name and Address
Nolan Consulting Pty Ltddocument.docx

Insert Report Date
Appendix BSite photographs
For the majority of stakeholders, the data collection process involved: an initial telephone call; emailing a letter of introduction from the WPIWG Secretariat, with an accompanying
data request; receipt of the data; and follow up via email or phone for clarification or to finalise data sets.
2.2.1 State and territoriesState and territories were approached for information on collection programs, waste and recycling quantities and compositional surveys. NSW, South Australia, Victoria, Western Australia, and the ACT provided relevant data from their respective state/territory based or regional HHC collection programs. As HHC programs in Queensland are managed by local government councils, the twelve Councils comprising over 80% of the population were contacted to seek relevant information. The information received from these Councils was supplemented by preliminary survey information provided by the APMF.The Tasmanian HHC program was discontinued in December 2012. Information on the program up to that time is sourced from the review of the program undertaken by the Local Government Association of Tasmania (2013).Literature searches found that HHC collection programs are conducted by two of the four largest Northern Territory Councils. Collection volumes were estimated using per capita estimates applied to the populations of the two municipalities.
Page 7Study into stocks and flows, market analysis and processing capacity of waste paintLandfill Name and Address
Nolan Consulting Pty Ltddocument.docx

Insert Report Date
Appendix BSite photographs
2.2.2 Trade paintersA national survey of trade painter waste, paint stockpiling and disposal behaviour was conducted in December 2013 and January 2014 to assist in determining the trade waste paint stockpile and the disposal pathways.The survey was emailed by the State based Master Painters Associations and the National Institute of Painting & Decorating. In addition Dulux sought the participation of their trade painters in the Northern Territory. This followed a similar survey undertaken by the Master Painters Association of Victoria in 2009.
2.2.3 Water authoritiesMelbourne Water, Sydney Water, the Western Australian Water Authority, and South-East Water were approached for information on illegal waste paint disposal to stormwater and sewer.
2.2.4 Waste collection, treatment, processing and recovery companiesInformation on current and potential waste paint collection, treatment, recovery, and disposal systems were obtained from major liquid waste treatment companies including Toxfree, Veolia, Transpacific and Geocycle. These companies are estimated to manage over 90% of the waste paint collected through HHC collection programs across the nation.
2.3 Material flow analysisThe waste paint material flow analysis (MFA) has been prepared as an MS Excel based model.It tracks material consumption, stockpiling and disposal/recovery for all state and territory jurisdictions. While the focus of the analysis is the 2012/13 financial year it provides stockpile projections up to 2022/23 based upon no change to the current collection, treatment and recovery system.
Page 8Study into stocks and flows, market analysis and processing capacity of waste paintLandfill Name and Address
Nolan Consulting Pty Ltddocument.docx
Insert Report Date
Appendix BSite photographs
The outputs for the analysis are shown graphically including state/jurisdictional breakdowns and household/trade splits.Qualitative statements on source data reliability are provided.
2.4 Preparation of draft reportThe draft report was presented to the WPIWG at its 13th February 2014 meeting.
2.5 Refinement of MFA and submission of the final reportThis final report, including the MFA, has been prepared following consideration of WPIWG comments on the draft report.
Page 9Study into stocks and flows, market analysis and processing capacity of waste paintLandfill Name and Address
Nolan Consulting Pty Ltddocument.docx
Insert Report Date
Appendix BSite photographs
3. Paint salesKey outcomes – Paint sales
152.7 million litres of water based and solvent based A&D paints, including imports, was sold into the Australian market in 2012/13. Retail sales accounted for 43% of all sales. The paint to be included in the voluntary product stewardship scheme as per the waste paint definition accounted for 126.7 million litres in 2012/13.
Table 3-1: Paint consumption (2012/13) by million litres
Sector NSW ACT VIC TAS QLD NT SA WA Total
Retail 18.7 1.0 17.6 1.6 15.5 0.8 3.4 7.4 66.0
Trade 24.3 1.3 22.8 2.1 20.7 1.0 4.5 10.1 86.7
Total 43.0 2.2 40.4 3.7 36.2 1.8 7.9 17.5 152.7
Page 10Study into stocks and flows, market analysis and processing capacity of waste paintLandfill Name and Address
Nolan Consulting Pty Ltddocument.docx

Insert Report Date
Appendix BSite photographs
Source: GfK
Ninety four percent of the paint sales proposed to be subject to the voluntary product stewardship scheme is A&D paint. The remaining six percent is woodcare products (wood stains, lacquers, and oils).
Ninety percent of paint sales are water based paints with remaining 10% being solvent based. The solvent based paints are less widely used than a decade ago.
On a volumetric basis, 68 percent of paint is sold in steel packaging with the remaining 32% being sold in plastic packaging. The plastic packaging is currently limited to 10 L and 15 L units and is typically about 65% of the weight of steel packaging for the equivalent packaging unit size.
The density of paint is about 1.3 kg/L for water based paint and about 1.2 kg/L for solvent based paint.
The proportion of total paint sales, by volume, that are retail sales has fluctuated around an average of about 40% over the past decade. It has increased from 38% in 2008/09 to 43.5% in 2012/13.
Based upon historical trends zero growth in paint sales is assumed over the next decade.
3.1 PurposeThis section of the report presents the Architectural and Decorative (A&D) paint and woodcare products consumption (sales) data from 2002/03 through to 2012/13 together with other relevant consumption data including the estimated water to solvent based paint ratios, and packaging types and characteristics.
Page 11Study into stocks and flows, market analysis and processing capacity of waste paintLandfill Name and Address
Nolan Consulting Pty Ltddocument.docx
Insert Report Date
Appendix BSite photographs
3.2 Primary data sourcesThe primary data is the calendar year volumetric consumption (sales) data from 2003 to 2012, as well as the 2012/13 financial year, obtained from the four largest Australian manufacturers. The data, provided by APMF (2013), was sourced from GfK who provides market research services to the APMF. The data is broken down as follows: for A&D and woodcare products; for state and territory jurisdictions; and retail and trade.This paint is sold primarily through retail stores that may be dedicated paint, hardware, home or improvement stores or any other retail sites which sell paint.
Page 12Study into stocks and flows, market analysis and processing capacity of waste paintLandfill Name and Address
Nolan Consulting Pty Ltddocument.docx
Insert Report Date
Appendix BSite photographs
3.3 Secondary data sourcesThe consumption data is presented as follows: total national consumption; on a financial year basis; for individual states and territories; for retail and trade; for water and solvent based products; and by weight as well as volume.The assumptions used to estimate this information are described below.
3.3.1 Total national consumptionThe four major paint manufacturers in Australia are the Dulux Group, PPG, Valspar (incorporating Wattyl) and Haymes Paints. These APMF members have been providing A&D paint and Woodcare Products volumetric sales data to GfK since 2002/03. GfK collates this data under contract to the APMF. The aggregated data has been provided to Nolan Consulting for the sole purpose of preparing this report.APMF has supplied commercial in confidence information to Nolan Consulting to assist in determining the market share by volume that is unaccounted for in the GfK volumetric sales data. The unaccounted sales include sales from all other APMF members, all other Australian manufacturers, and from imports.After considering the commercial in confidence information Nolan Consulting is satisfied that with the following estimates of market share (by volume) of the four companies participating in the survey:
Page 13Study into stocks and flows, market analysis and processing capacity of waste paintLandfill Name and Address
Nolan Consulting Pty Ltddocument.docx

Insert Report Date
Appendix BSite photographs
A&D 90% Woodcare products 80%ABS data supported by Department of Foreign Affairs and Trade (DFAT) provided Australian Customs and Border Protection Service (ACBPS) information on paint imports and exports between 2003/04 and 2012/13 has been obtained. The ACBPS monitors paints, varnishes, enamels and lacquers within the following categories: polyesters, acrylic and vinyl polymers dispersed in a solvent; synthetic polymers or chemically modified natural polymers, dispersed in a solvent; acrylic or vinyl polymers, dispersed or a water based medium; and synthetic polymers or chemically modified natural polymers dispersed in a water
medium.In 2011/12 some 6.2 million litres of water based paint and 16.2 million litres of solvent based paint was imported. This may have included some A&D imports from Singapore which have since ceased. The APMF has advised that most of this paint is not the A&D and woodcare product paints which are intended to be captured by the product stewardship scheme. Furthermore it has advised that imports do not have a measurable impact on the Australian A&D sales.The ACBPS data reveals that a total of 10.2 million litres was exported over the 2011/12 financial year. Paint destined for the export market is not intended to be captured by the product stewardship scheme.
3.3.2 Financial year presentationThe calendar year volumetric consumption (sales) data from 2003 to 2012 has been converted to financial year data by averaging the data from the two relevant calendar years.
Page 14Study into stocks and flows, market analysis and processing capacity of waste paintLandfill Name and Address
Nolan Consulting Pty Ltddocument.docx
Insert Report Date
Appendix BSite photographs
3.3.3 Individual states and territories disaggregationThe state and territory consumption data presented in the GfK surveys is aggregated for Victoria/Tasmania, Queensland/Northern Territory, and NSW/ACT. This data has been disaggregated to the individual jurisdictions by using ABS 2012 population estimates. The jurisdiction splits that have been applied based upon this population data are presented in Table 3-2.Table 3-2: 2012 Jurisdictional splits (ABS, 2013)
Combined Jurisdictions
Individual jurisdictions
Splits applied
(%)
NSW/ACTNSW 95.1%
ACT 4.9%
VIC/TasVictoria 91.5%
Tasmania 8.5%
Queensland/NT
Queensland 95.3%
Northern Territory 4.7%
3.3.4 Retail and trade splitBased upon the 2012/13 consumption data the retail market was 43% (Table 3-4) of the combined retail and trade sales. The APMF reported a slight gain in retail in 2012/13 whereas trade sales have declined by 4% in 2012/13 and around 10% since 2010.
Page 15Study into stocks and flows, market analysis and processing capacity of waste paintLandfill Name and Address
Nolan Consulting Pty Ltddocument.docx

Insert Report Date
Appendix BSite photographs
3.3.5 Water and solvent based paint split All paint captured under the proposed voluntary product stewardship scheme can be classified as either latex (water-based) or solvent (oil-based) coatings.The APMF has advised that about 90% of the combined retail and trade paint by volume that is currently sold into the Australian market is water based with the remaining 10 % being solvent based. The breakdown assumes that almost all of the A&D paint is water based, except for preparatory coats and metal finishes, and that about 50% of woodcare products are water based.Nolan-ITU (2004) estimated that 88% of retail paint by volume that was sold into the Australian market in 2003 was water based with the remaining 12% being solvent based. This suggests a slight increase in the water based proportion since 2003.
3.3.6 Presentation by weightThe paint sales data is provided on a volumetric basis. As waste paint data is provided on a weight basis it has been necessary to convert volumetric data to weight data.Paint manufacturers have been consulted to provide advice on the paint density values to apply. The data is referenced as APMF (2014) “Paint packaging weights in 2013”.There is general industry agreement that the average density of water based paint is in the order of 1.3 kg/L, and that the average density of solvent based paint is in the order of 1.2 kg/L.
Page 16Study into stocks and flows, market analysis and processing capacity of waste paintLandfill Name and Address
Nolan Consulting Pty Ltddocument.docx

Insert Report Date
Appendix BSite photographs
3.3.7 Packaging units and typesA range of aggregated data on packaging units and packaging types has been provided by several Australian manufacturers. The collection of this data has been provided by the Interfirm Comparison Centre on behalf of the APMF to maintain confidentiality.Table 3-3 presents aggregated industry retail and trade paint sales estimates for packaging unit size, and material types for 2013. The data is presented to the nearest 0.5%. The table also presents approximate estimates of packaging weight (including handles for containers of 2 L and greater).Table 3-3: Paint packaging sizes and types by sales volumes, 2013 data (APMF, 2014)
Unit (Litre) TypeWeight
(g)Retail Trade
Water Solvent Water Solven
t
0.25 Metal 70 0.0% 0.0% 0.0% 0.0%
0.5 95 1.5% 1.5% 0.0% 0.5%
1 160 3.5% 6.5% 0.5% 1.5%
2 230 2.5% 0.5% 0.5% 0.5%
4 415 27.0% 9.5% 8.0% 28.0%
5 0.5% 0.0% 0.0% 0.0%
6 6.0% 0.0% 0.0% 0.0%
10 850 33.0% 16.5% 11.0% 48.0%
Page 17Study into stocks and flows, market analysis and processing capacity of waste paintLandfill Name and Address
Nolan Consulting Pty Ltddocument.docx
Insert Report Date
Appendix BSite photographs
Unit (Litre) TypeWeight
(g)Retail Trade
Water Solvent Water Solven
t
15 1,310 19.0% 65.5% 19.0% 19.5%
20 1,430 1.0% 0.0% 3.0% 2.0%
10 Plastic 580 4.0% 0.0% 21.5% 0.0%
15 785 2.0% 0.0% 36.5% 0.0%
Total 100.0% 100.0% 100.0% 100.0%
Page 18Study into stocks and flows, market analysis and processing capacity of waste paintLandfill Name and Address
Nolan Consulting Pty Ltddocument.docx

Insert Report Date
Appendix BSite photographs
Key information that can be gleaned from the 2013 data is shown in Table 3-3 is as follows: all solvent paint is sold in steel containers; plastic containers are only used for the 10 L and 15 L packaging units; very little paint is sold in 0.25 L, 2.0 L and 5 L units; over 50% of all retail and trade paint is sold in 10 L and 15 L packaging units; and trade painters generally use a greater proportion of 10 L to 20 L packaging units,
and a significantly greater portion of plastic units than the retail sector.The following trends in packaging have occurred over the past decade: the plastic packaging portion of the trade sector’s water based paint has increased
from less than 1% by units sold in 2009/10 to 42% by 2012/13; the ratio of plastic to steel packaging for the retail sector’s water based paint has
remained relatively static over the past decade; and there has been a significant increase in the proportion of 15 L packaging units sold
and an equivalent reduction in 20 L packaging units (by volume).On a volumetric basis, 68 percent of paint is sold in steel packaging with the remaining 32% sold in plastic packaging.As shown in Table 3-3 plastic packaging is only sold in the 10 L and 15 L containers. For the purpose of this project the weight of plastic packaging is estimated to be 65% of the weight of steel packaging for the same size container, this estimate has been confirmed by paint manufacturers.
Page 19Study into stocks and flows, market analysis and processing capacity of waste paintLandfill Name and Address
Nolan Consulting Pty Ltddocument.docx

Insert Report Date
Appendix BSite photographs
3.3.8 Future projectionsThe average annual growth in overall paint consumption by volume from 1996 to 2003 estimated to be 2.8%. From 2002/03 to 2012/13 the average growth rate has been 0.06% per year.It is assumed that zero growth in consumption will occur over the next ten years.
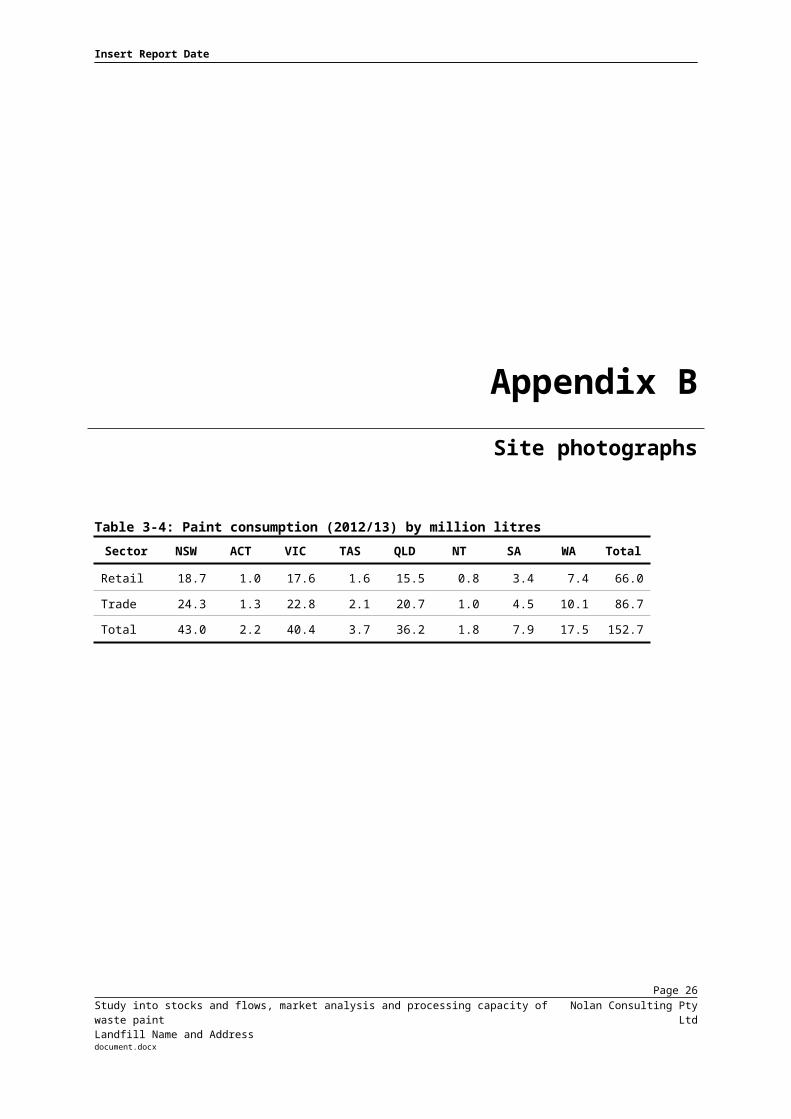
3.4 2012/13 Paint consumptionThe estimated paint consumption across jurisdictions in 2012/13 is presented in Table 3-4 and shown graphically in Figure 3-1. Table 3-4: Paint consumption (2012/13) by million litres
Sector NSW ACT VIC TAS QLD NT SA WA Total
Retail 18.7 1.0 17.6 1.6 15.5 0.8 3.4 7.4 66.0
Trade 24.3 1.3 22.8 2.1 20.7 1.0 4.5 10.1 86.7
Total 43.0 2.2 40.4 3.7 36.2 1.8 7.9 17.5 152.7
Page 20Study into stocks and flows, market analysis and processing capacity of waste paintLandfill Name and Address
Nolan Consulting Pty Ltddocument.docx
Insert Report Date
Appendix BSite photographs
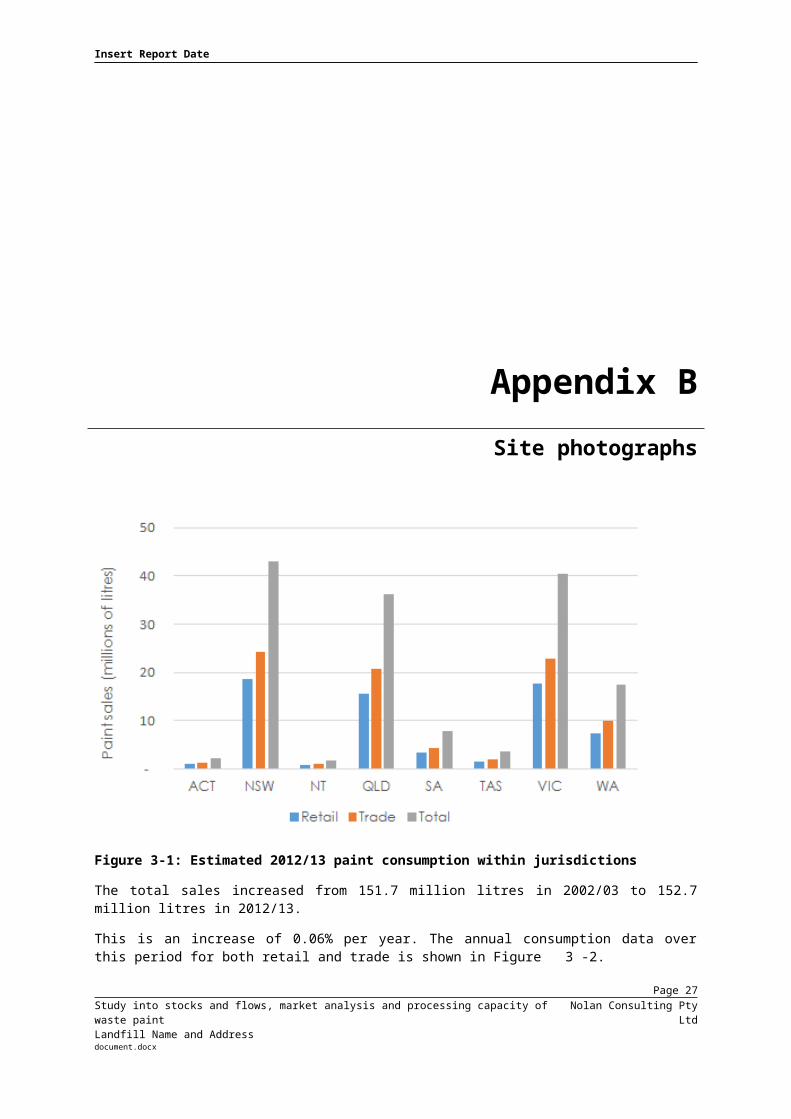
Figure 3-1: Estimated 2012/13 paint consumption within jurisdictions
The total sales increased from 151.7 million litres in 2002/03 to 152.7 million litres in 2012/13. This is an increase of 0.06% per year. The annual consumption data over this period for both retail and trade is shown in Figure 3-2.
Page 21Study into stocks and flows, market analysis and processing capacity of waste paintLandfill Name and Address
Nolan Consulting Pty Ltddocument.docx

Insert Report Date
Appendix BSite photographs
Figure 3-2: Annual paint consumption (2002/03 to 2012/13)
The proportion of the total sales that is retail is graphed in Appendix B. It averages about 40% and has increased from 38% in 2008/09 to 43.5% in 2012/13. Of the total volume 94% was A&D paint with 6% being woodcare product sales. Changes to this split over the past decade are shown graphically in Appendix B.
Page 22Study into stocks and flows, market analysis and processing capacity of waste paintLandfill Name and Address
Nolan Consulting Pty Ltddocument.docx

Insert Report Date
Appendix BSite photographs
4. Current systems and processesKey outcomes – current systems and processes
All Household Hazardous Chemical (HHC) collection programs include waste paint.
Victoria, NSW, South Australia and Western Australia have State sponsored HHC collection programs. HHC collection programs in Queensland, the ACT and the Northern Territory are provided by individual Councils. No formal HHC collection program with waste paint treatment is currently provided in Tasmania.
HHC collections occur from temporary (mobile) and permanent drop off sites.
In 2012/13 a total of 2,760 tonne of waste paint, including packaging, is estimated to have been collected by the HHC programs across the nation.
Table 4-5: Estimated waste paint, including packaging, collected through HHC collection programs (tonne)
Year Victoria NSW SA WA Qld Tas ACT NT Total
2012/13 population (million)
5.63 7.30 1.66 2.43 4.57 0.51 0.37 0.24 22.71
2003/04 228 199 47 - 118 - 28
2004/05 338 227 47 - 167 - 32
2005/06 411 287 84 - 215 - 36
2006/07 394 331 13 - 264 - 40
Page 23Study into stocks and flows, market analysis and processing capacity of waste paintLandfill Name and Address
Nolan Consulting Pty Ltddocument.docx

Insert Report Date
Appendix BSite photographs
2007/08 705 437 74 - 313 - 44
2008/09 611 472 79 - 362 - 48
2009/10 694 532 113 - 411 8 52
2010/11 780 716 94 - 459 16 55
2011/12 903 824 106 166 508 16 55
2012/13 849 901 106 270 557 8 55 19 2,760
Apart from the PaintCare trial undertaken in Victoria in 2013 there have been no dedicated collection programs for waste paint generated by trade painters.
Most solvent based waste paint is either used as a high calorific value fuel source for cement kilns or is distilled to recover solvents for reuse with the residual sludge generally used as a fuel source.
Most water based waste paint is immobilised and disposed of to landfill with the bulk of the remainder being used as a low calorific value fuel source.
Research is underway to develop new treatment and recycling pathways for waste paint with a particular focus on water based paint.
Page 24Study into stocks and flows, market analysis and processing capacity of waste paintLandfill Name and Address
Nolan Consulting Pty Ltddocument.docx

Insert Report Date
Appendix BSite photographs
4.1 PurposeThe section of the report describes: current household hazardous chemical (HHC) collection programs; the trade PaintCare trial; current paint collection systems; current waste paint disposal/ recycling pathways; and potential waste paint disposal/ recycling pathways.4.2 Household hazardous chemical collection programsTypically Household Hazardous Chemical (HHC) programs involve: collection at mobile events and from permanent collection facilities. transport to facilities for separation of paint from packaging; and transfer of separated products to end user/disposal.Formal collection arrangements for waste paint commenced in Victoria in 1994 through the HHC collection program. These programs now operate in most state and territory jurisdictions. The collections are generally separate from rural based agricultural and veterinary chemical collections which are managed through existing product stewardship schemes, including drumMUSTER and ChemClear.
Page 25Study into stocks and flows, market analysis and processing capacity of waste paintLandfill Name and Address
Nolan Consulting Pty Ltddocument.docx

Insert Report Date
Appendix BSite photographs
The need for similar waste paint collection arrangements for trade painters was investigated through the 2013 PaintCare trial.Nolan Consulting was able to obtain a high level of co-operation with state and local government and their collection contractors in obtaining each state’s HHC collection program waste paint data. The programs operating in each jurisdiction are described below.
4.2.1 VictoriaThe Detox Your Household (DYH) household hazardous collection program commenced in 1994.Information on the program has been sourced from the Sustainability Victoria (2011) DYH Strategic Review Public Report as well as mobile and permanent collection site databases. The Sustainability Victoria (2011) report analysed five years of performance data and looked at ways to improve the service delivery to the Victorian community. The DYH program commenced with a few half and full day mobile collection days in metropolitan Melbourne increasing to a peak of 38 in 2005/06 and falling to 31 in 2009/10. These collections are now provided to most metropolitan municipalities and medium/large provincial centres on a rotational basis. Waste paint is one of 31 materials that are collected at the mobile collection days. Packaging is limited to 20 L or 20 kg in size. Two permanent HHC sites were established in 2005/06 increasing to 13 in 2009/10. These sites are located at council depots with six in metropolitan Melbourne and seven in regional Victoria. Waste paint accounted for 53.5% of the HHC collected at the mobile sites over the 2005/06 to period 2009/10.
Page 26Study into stocks and flows, market analysis and processing capacity of waste paintLandfill Name and Address
Nolan Consulting Pty Ltddocument.docx

Insert Report Date
Appendix BSite photographs
The annual quantity of waste paint collected through Victoria’s HHC collection program at both temporary (mobile) and permanent sites are shown in Table 4-2. Table 4-2 also provides estimates for all other states.The annual quantity of paint collected at mobile sites decreased from 320.3 tonne in 2005/06 to 153.1 tonne in 2009/10 due to the introduction of the permanent sites. It has since increased to 186.7 tonne in 2012/13.Table 4-2 also demonstrates a gradual increase in the combined mobile and permanent sites from 10 tonne in 1994/95 to 193 tonne in 2002/03 and to a peak of 903 tonne in 2011/12. The data shows the significant increase in 2007/08 when the number of permanent sites had increased to seven. This increase is despite the reduction in the number of annual mobile collection events from 35 to 31. The locations of the Victorian permanent and 2012/13 temporary (mobile) drop off sites are shown in Figure 4-1 (Appendix C).
4.2.2 New South WalesThe NSW Household Chemical Clean Out program is a joint State and Local Government initiative that has been in place since March 2003. Information on the program has been sourced from the NSW EPA (2012) “Household Chemical CleanOut Program - Annual Report 2010–2011” as well as direct advice from the NSW EPA.The program provides periodic mobile collections in the Hunter, Central Coast, Illawarra and Greater Sydney regions. No permanent collection sites are provided. While the program is targeted at householders, an unknown quantity of trade paint is also collected through the program.
Page 27Study into stocks and flows, market analysis and processing capacity of waste paintLandfill Name and Address
Nolan Consulting Pty Ltddocument.docx
Insert Report Date
Appendix BSite photographs
The program collected HHCs in the above regions from 41 mobile collections in 2009/10 and 43 collections in 2010/11. The locations of the NSW 2012/13 temporary (mobile) drop off sites within the above regions are shown in Figure 4-2 (Appendix C).Waste paint has accounted for 55% by weight of the total material collected over the life of the program, 57% in 2009/10, and 61% in 2010/11. Annual waste paint collected under the program for the metropolitan region is presented in Table 4-1. The quantities of waste paint have increased from 199 tonne in 2003/04 to 757 tonne in 2012/13. The NSW EPA projects that this will approach 900 tonne for 2013/14.110 tonne was also collected outside of the metropolitan region in 2010/11. This has been pro-rated for 2011/12 and 2012/13 based upon the 2010/11 metropolitan to ‘outside of metro’ ratio.The NSW Government’s Waste Less Recycle More initiative commits $465.7 million over five years to deliver innovative waste avoidance and recycling programs, to combat illegal dumping, and to reduce littering BSW EPA (2013a). This initiative includes funding for Community Recycling Centres which aims to make it easier for households to recycle and remove problem wastes from kerbside bin systems by establishing a network of Community Recycling Centres and Services across NSW. The drop off centres that are to be supported will collect a core list of materials, including waste paint, free of charge to householders.
Page 28Study into stocks and flows, market analysis and processing capacity of waste paintLandfill Name and Address
Nolan Consulting Pty Ltddocument.docx
Insert Report Date
Appendix BSite photographs
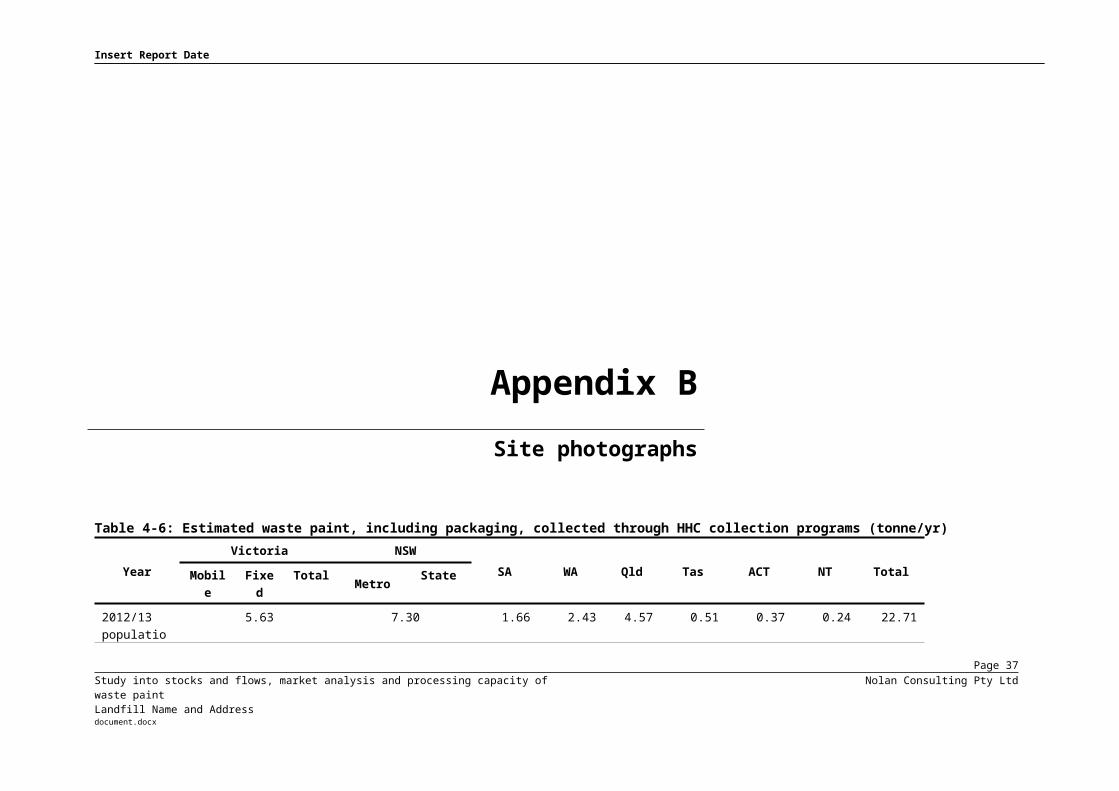
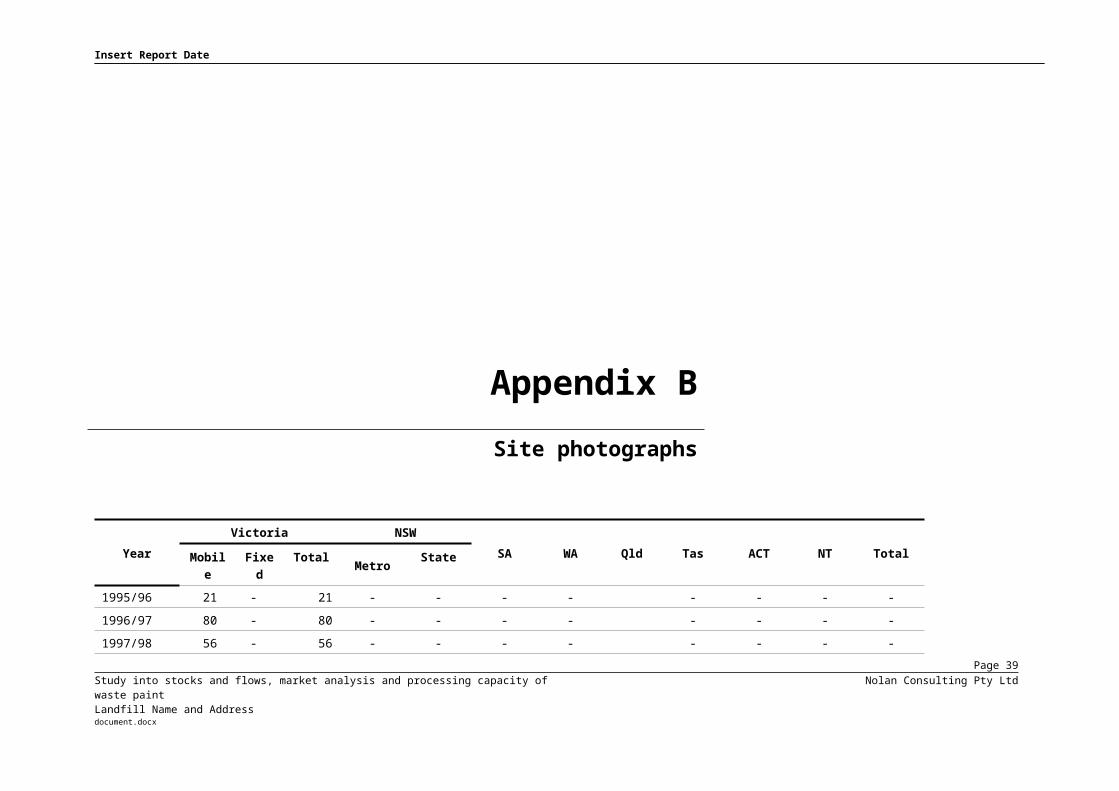
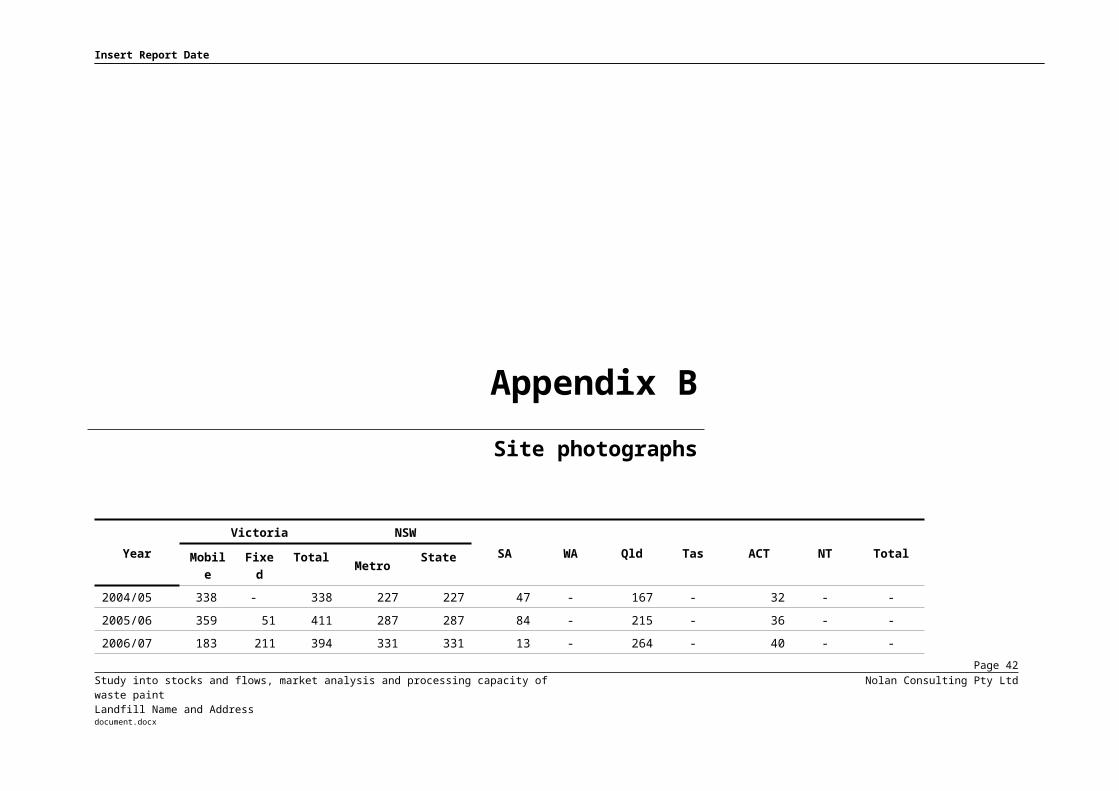
Table 4-6: Estimated waste paint, including packaging, collected through HHC collection programs (tonne/yr)
YearVictoria NSW
SA WA Qld Tas ACT NT TotalMobile
Fixed
Total Metro State
2012/13 population (million)
5.63 7.30 1.66 2.43 4.57 0.51 0.37 0.24 22.71
1994/95 10 - 10 - - - - - - - -Page 29
Study into stocks and flows, market analysis and processing capacity of waste paintLandfill Name and Address
Nolan Consulting Pty Ltddocument.docx
Insert Report Date
Appendix BSite photographs
YearVictoria NSW
SA WA Qld Tas ACT NT TotalMobile
Fixed
Total Metro State
1995/96 21 - 21 - - - - - - - -1996/97 80 - 80 - - - - - - - -1997/98 56 - 56 - - - - - - - -1998/99 111 - 111 - - - - - - - -
Page 30Study into stocks and flows, market analysis and processing capacity of waste paintLandfill Name and Address
Nolan Consulting Pty Ltddocument.docx
Insert Report Date
Appendix BSite photographs
YearVictoria NSW
SA WA Qld Tas ACT NT TotalMobile
Fixed
Total Metro State
1999/00 157 - 157 - - - - - - - -2000/01 175 - 175 - - - - - - - -2001/02 192 - 192 - - - - - - - -2002/03 193 - 193 - - - - 69 - 24 - -
Page 31Study into stocks and flows, market analysis and processing capacity of waste paintLandfill Name and Address
Nolan Consulting Pty Ltddocument.docx

Insert Report Date
Appendix BSite photographs
YearVictoria NSW
SA WA Qld Tas ACT NT TotalMobile
Fixed
Total Metro State
2003/04 228 - 228 199 199 47 - 118 - 28 - -2004/05 338 - 338 227 227 47 - 167 - 32 - -2005/06 359 51 411 287 287 84 - 215 - 36 - -2006/07 183 211 394 331 331 13 - 264 - 40 - -
Page 32Study into stocks and flows, market analysis and processing capacity of waste paintLandfill Name and Address
Nolan Consulting Pty Ltddocument.docx
Insert Report Date
Appendix BSite photographs
YearVictoria NSW
SA WA Qld Tas ACT NT TotalMobile
Fixed
Total Metro State
2007/08 242 464 705 437 437 74 - 313 - 44 - -2008/09 186 425 611 472 472 79 - 362 - 48 - -2009/10 157 537 694 532 532 113 No data 411 8 52 - -2010/11 159 621 780 602 716 94 No data 459 16 55 - -
Page 33Study into stocks and flows, market analysis and processing capacity of waste paintLandfill Name and Address
Nolan Consulting Pty Ltddocument.docx

Insert Report Date
Appendix BSite photographs
YearVictoria NSW
SA WA Qld Tas ACT NT TotalMobile
Fixed
Total Metro State
2011/12 257 646 903 692 824 106 166 508 16 55 - -2012/13 201 649 849 757 901 106 270 557 8 55 19 2,760
Page 34Study into stocks and flows, market analysis and processing capacity of waste paintLandfill Name and Address
Nolan Consulting Pty Ltddocument.docx

Insert Report Date
Appendix BSite photographs
4.2.3 South AustraliaInformation on the South Australian HHC program has been sourced directly from Zero Waste SA and from Transpacific.ZWSA funds a free State based HHC and farm chemical collection program. This provides households and farmers with the opportunity to drop off waste paint at one permanent metropolitan site and several metropolitan and rural sites through a mobile collection program. Transpacific holds the contract for the management and operation of the collection program.The free mobile collection program has been operating since 2004. In 2012/13 mobile collections occurred in Onkaparinga, Peterborough, Port Wakefield, Mitcham, Naracoorte, and Gambier, and Charles Sturt. These sites are open to all South Australian residents, and are generally held in the Autumn to early Winter period. The sites are typically Council depots, transfer stations, or landfills. The site locations change from year to year.The permanent drop off point is at Transpacific’s Dry Creek Depot in northern Adelaide. This facility accepts hazardous chemicals, including waste paint, from farmers and households from 9.00 am to 12.00 pm on the first Tuesday of every month. This is a free of charge service.The locations of the South Australian Dry Creek permanent drop off site and the proposed 2014 temporary (drop off sites) are shown in Figure 4-3 (Appendix C).
Page 35Study into stocks and flows, market analysis and processing capacity of waste paintLandfill Name and Address
Nolan Consulting Pty Ltddocument.docx
Insert Report Date
Appendix BSite photographs
The annual quantity of waste paint collected through the mobile collection program is presented in Table 4-2. The quantities of waste paint collected increased from 47 tonne in 2004/05 to 106 tonne in 2011/12.The disposal and recycling pathways for the mobile and permanent drop off sites are identical. Dry paint is fixed with other waste products and landfilled in a dedicated cell at the Inkerman landfill. Liquid water based paint is treated at the Transpacific liquid waste treatment facility. The residual waste paint is mostly immobilised and taken to the Inkerman landfill for disposal. A small component of the usable waste paint is recovered for reuse.The solvent based waste paint is processed at Transpacific’s solvent recovery facility. The solvent recovered from the distillation process is reused by industry and the sludge is transported interstate for further processing. It is understood, although not confirmed by Transpacific, that a significant component of the sludge is transported to Victoria for fuel production. Transpacific transports pressure paint cans to its Newcastle facility where the liquid is recovered and the cans are recycled.
4.2.4 TasmaniaTasmania does not currently have a formal HHC collection program.This has not always been the case. From March 2009 to December 2012 the Tasmanian ChemSafe Homes Tasmania program offered 34 mobile drop-off days across 24 local council jurisdictions, with 2,658 residents using the service. This HHC collection program was run by the Local Government Association of Tasmania and jointly funded by the State and Local Government. Waste paint was included as an acceptable material. The locations of the temporary (mobile) drop off sites over the three year period are shown in Figure 4.4 (Appendix C). The number of drop off days at each site ranged from one day to four days over the three year period.
Page 36Study into stocks and flows, market analysis and processing capacity of waste paintLandfill Name and Address
Nolan Consulting Pty Ltddocument.docx

Insert Report Date
Appendix BSite photographs
The annual quantity of waste paint collected through the mobile collection program is presented in Table 4-1. Over the three year period 56 tonne of waste paint was collected. This equates to about 16 tonne of waste paint/year. All of the collected material was bulked up and transported to Victoria for treatment. The Local Government Association of Tasmania (2013) ”Strategic Review of the Collection of Household Hazardous Waste” assessed the outcomes and effectiveness of the program and proposed that it should continue through permanent facilities for the collection, reuse, consolidation and transport of household chemicals including paint.Unfortunately funding was not forthcoming. As a consequence, while most Council’s still accept small quantities of waste paint at their transfer stations. The Southern Waste Strategy Authority, the Northern Tasmanian Waste Management Group and Launceston City Council have confirmed that water based and solvent based paints are generally dried before landfill disposal. In addition there a limited quantity of water based waste paint is reused by community groups.It is understood that the Cradle Coast Waste Management Group is considering establishing a new HHC collection program along Tasmania’s north-west coast. Furthermore Toxfree is seeking approval to establish a bulking facility in Rokeby which is located in the City of Clarence which is within the Greater Hobart area.
4.2.5 Western AustraliaThe Western Australian Household Hazardous Waste (HHW) Program involves mobile collections and collections from permanent facilities. In February 2011 the Minister for Environment announced funding for the next phase of the 2011 to 2015 HHW program. The program is funded by the Waste Authority through the Waste Avoidance and Resource Recovery Levy.
Page 37Study into stocks and flows, market analysis and processing capacity of waste paintLandfill Name and Address
Nolan Consulting Pty Ltddocument.docx

Insert Report Date
Appendix BSite photographs
Information on the program has been sourced from the Municipal Waste Advisory Council of Western Australia’s “Household Hazardous Waste Program Annual Report July 2011 – 30 June 2012” and “Household Hazardous Waste Program Annual Report 2012/2013” as well as specific advice from the Department of Environment Regulation.The program is limited to quantities of less than 20L or 20kg. Information on the collections provided is presented in Table 4-7. Table 4-7: Western Australian Household Hazardous Waste Program details
Year Mobile sites (temporary collection days)
Permanent facilities
2009 Twenty one. 18 collections from six sites (one in Geraldton with the remainder in Perth).
2011/12 Nil (Funding constraints). 13 sites.
2012/13 Seven fully funded and one co funded The two largest collections were in Joondalup and Gosnells. Regional collections were held at Busselton, Kalgoorlie and Broome.
13 sites.
2013/14 and 2014/15
Uncertain. Eight sites in Perth and six in regional centres.
The locations of the Western Australian permanent sites and 2012/13 temporary (mobile) drop off sites are shown in Figure 4-5 (Appendix C). Typical attendance at the 2012/13 mobile collection sites was between 100 to 200 cars per event.
Page 38Study into stocks and flows, market analysis and processing capacity of waste paintLandfill Name and Address
Nolan Consulting Pty Ltddocument.docx
Insert Report Date
Appendix BSite photographs
Waste paint accounted for 64% of the materials collected in 2011/12 and 55% in 2012/13. The annual quantity of waste paint collected through the mobile collection program for 2011/12 and 2012/13 is presented in Table 4-6. The 2012/13 quantity of 270 tonne exceeded the 2011/12 quantity of 166 tonne due to the increase in the number of mobile collections.HHC collected from permanent or TCDs are taken to the Toxfree facility in Kwinana.
4.2.6 QueenslandIn Queensland HHC collection programs are delivered by local government. Many local governments accept paint cans at transfer stations. Some Councils also hold free drop off days at transfer stations for residents and local trade painters.Several of the larger Councils offer HHC collection services at permanent and temporary collection sites. These services are generally available to householders and resident trade painter. For these HHC collection services, specialist liquid waste treatment contractors collect the waste paint for treatment and recycling or disposal of the immobilised paint. These contractors are required to comply with all relevant disposal requirements as paint is a regulated waste.For the larger Councils that offer HHC collection services conditions usually apply to the permanent collection sites and the temporary collection days. These conditions may include items must be in their original container, items must not be mixed, and a limit of one litre for each chemical or product. Each Council may choose whether to impose a disposal fee, and how much that fee will be. Disposal at transfer stations and landfills is often free to residents, with a charge usually applied to commercial waste.
Page 39Study into stocks and flows, market analysis and processing capacity of waste paintLandfill Name and Address
Nolan Consulting Pty Ltddocument.docx
Insert Report Date
Appendix BSite photographs
A survey of the 12 largest councils, by population was undertaken as part of the study. The population of these Council’s is about 81% of the State’s population. Of these 12 Councils, Rockhampton, Mackay, and Townsville do not have a HHC collection program.The nine Queensland Council’s with a HHC program in 2012/13 are shown in Table 4-8 together with summary details of the services. This indicates that 72% of the Queensland population are within a municipality for which a HHC collection service is available.Table 4-8: Queensland Council run HHC Collection programs
LGA nameProportion of Queensland population
No of sitesContractor
2102/13 Quantity (tonne)Permanent Temporary
Brisbane 0.24 4 1 Remondis 289.0
Gold Coast 0.12 2 - Toxfree 144.4
Moreton Bay(1) 0.09 5 - Transpacific 70.4
Sunshine Coast 0.07 8 - Toxfree 5.0
Logan 0.06 - 5 Toxfree 7.2
Ipswich 0.04 1 - Transpacific 2.3
Cairns(1) 0.04 4 - Unknown 29.1
Toowoomba 0.03 5 - Transpacific 8.0
Redland(1) 0.03 - 1 Toxfree 1.4
Total 0.72 556.8(1) 2012/13 quantities estimated by applying the average per household HHC collection quantities from the
Page 40Study into stocks and flows, market analysis and processing capacity of waste paintLandfill Name and Address
Nolan Consulting Pty Ltddocument.docx
Insert Report Date
Appendix BSite photographs
LGA nameProportion of Queensland population
No of sitesContractor
2102/13 Quantity (tonne)Permanent Temporary
other Queensland Councils to the households of these municipalities.
The Toowoomba service is provided by Allied Liquid Waste; a subsidiary of Transpacific. The amount of waste paint collected from Morton Bay, Cairns and Redland has been estimated by applying the average per household HHC collection quantities from the other Queensland Councils to the households of these municipalities. The average annual per household HHC collection quantities/person for the municipalities of Brisbane, Gold Coast, Sunshine Coast, Logan, Ipswich, and Toowoomba of 0.42 kg/household.Based upon the Nolan-ITU (2004) 69 tonne of waste paint being collected through Council programs in 2002/03. As shown in Table 4-8 this is estimated to have increased to 557 tonne in 2012/13. The permanent and temporary sites are generally located at transfer stations.The APMF has commenced a telephone survey of Queensland Councils to determine whether residences have access to drop of facilities for waste paint. The response to the survey of the 12 largest Councils, listed in Table 4-8 above, is consistent with the information obtained by Nolan Consulting.Figure 4.6 (Appendix C) is a map of suggested Councils and the extent of their HHC collection services, including paint. This indicates that nine of the 12 largest Councils have contracted drop off arrangements at Council depots whereby the waste paint is appropriately treated and disposed or reused. Other Councils that have a drop off service for which the waste paint is treated and then disposed of or recycled include the Noosa Shire, South Burnett Shire, and the Douglas Shire. Figure 4.6 (Appendix C) also shows the Councils for which the only disposal pathway for waste paint, if accepted, is to landfill.
Page 41Study into stocks and flows, market analysis and processing capacity of waste paintLandfill Name and Address
Nolan Consulting Pty Ltddocument.docx

Insert Report Date
Appendix BSite photographs
All Brisbane City Council transfers stations are operated by Remondis. Remondis contracts the collection of the waste paint stillages from the permanent sites to Toxfree at two sites and to Planet Paint at the other two sites. Toxfree bulks up the waste paint and transports the solvent based paint to the Dandenong Geocycle facility. Most of the water based paint is immobilised and disposed to landfill. Planet Paint recycles the solvent based waste paint to garage floor paint. Remondis contracts Transpacific to collect the waste paint from the temporary collections. For all Transpacific Queensland HHC local government collections water based paint is immobilised at its Narangba liquid treatment plant and then disposed to landfill. The solvent based paint is bulked up and used as a fuel source in the thermal plant. This includes the Toowoomba service for which the collected waste paint is also transported to the Narangba liquid treatment plant.For all Toxfree Queensland HHC local government collections the solvent based waste paint is transported to the Dandenong Geocycle facility and the water based paint is immobilised and disposed to landfill.For the Councils, without collections by contractors, small amounts of dried waste paint are allowed in the garbage and waste paint and empty paint tins with minimal paint residue can be placed in the recycling bin.
4.2.7 Australian Capital TerritoryWithin the ACT waste paint is currently accepted at Mugga Lane Resource Management Centre and the Mitchell Resource Management Centre. Both act as permanent drop-off points. The locations of these centres are shown in Figure 4-7 (Appendix C).The Nolan-ITU (2004) estimate of the waste paint collected HHC program within the ACT in 2002/03 was 24 tonne. This increased to 55 tonne in 2012/13.
Page 42Study into stocks and flows, market analysis and processing capacity of waste paintLandfill Name and Address
Nolan Consulting Pty Ltddocument.docx
Insert Report Date
Appendix BSite photographs
4.2.8 Northern TerritoryIn the Northern Territory HHC collection programs are delivered through local government services. A literature search has identified that Alice Springs and Darwin both provide drop off services for household chemicals including paint. The locations of these municipalities are shown in Figure 4-8 (Appendix C).The amount of waste paint collected from these two municipalities has been estimated by applying an average per household HHC collection quantity of 0.42 kg/household to recovery in these municipalities. The 2012/13 quantity collected is estimated to be 19 tonne.
4.2.9 HHC collection program summaryThe annual quantities of waste paint collected from the ACT, NSW, Queensland, South Australia, Tasmania, Victoria and Western Australian HHC collection programs, including packaging, are presented in Table 4-6.In 2012/13 the total quantity of waste paint, including packaging, captured nationally by the HHC collection programs is estimated to be 2,760 tonne. The historical growth in the HHC collection programs is shown in Figure 4-9.
Page 43Study into stocks and flows, market analysis and processing capacity of waste paintLandfill Name and Address
Nolan Consulting Pty Ltddocument.docx

Insert Report Date
Appendix BSite photographs
Figure 4-9: HHC collection program -1994/95 to 2012/13 waste paint quantities (tonne/yr)
Of the 7.2% unused paint from retail paint sales, current HHC state/territory collections collect the following estimated percentage, by weight, for the 2012/13 year (Figure 4-10).
Page 44Study into stocks and flows, market analysis and processing capacity of waste paintLandfill Name and Address
Nolan Consulting Pty Ltddocument.docx

Insert Report Date
Appendix BSite photographs
VIC ACT NSW QLD WA SA TAS0%
5%
10%
15%
20%
25%
30%
% in
201
2-13
Figure 4-10: HHC collection programs collections of unused paint as a percentage of retail sales, by weight (2012/13)
Estimates of water to solvent based waste paint fractions received through the jurisdictional HHC collection programs are presented in Table 4-9.Table 4-9: HHC collection program water based waste paint portion of total (by weight)
State Water based portio
Year Source
Page 45Study into stocks and flows, market analysis and processing capacity of waste paintLandfill Name and Address
Nolan Consulting Pty Ltddocument.docx
Insert Report Date
Appendix BSite photographs
n
Victoria 75% 2012 GlobalPSC (2013) “The Case for Voluntary Paint Stewardship”.
NSW64% 2009/10 NSW EPA (2012), “Household Chemical CleanOut Program-
Annual Report 2009–2010”.
61% 2010/11 NSW EPA (2012), “Household Chemical CleanOut Program- Annual Report 2010–2011”.
SA
70% Full program
2013 advice from Zero Waste SA.81% 2010/11
82% 2011/12
WA73% 2011/12 MWAC (2012), “Household Hazardous Waste Program
Annual Report 01 July 2011 – 30 June 2012”.
78% 2012/13 MWAC (2013) “Household Hazardous Waste Program Annual Report 2012/2013”.
As noted in Section 3.3.5 the water and solvent based paint consumption split has shifted in favour of water based paint over past decade to a 90% to 10% ratio. The lower waste paint water based paint fraction as shown in Table 4-9 indicates a time lag between purchase and disposal. ToxFree et al. (2013) advised that waste paint collections operating in countries with a more mature waste paint collection system report water to solvent based paint rations of about 85% to 15%.
Page 46Study into stocks and flows, market analysis and processing capacity of waste paintLandfill Name and Address
Nolan Consulting Pty Ltddocument.docx

Insert Report Date
Appendix BSite photographs
4.3 Industry led PaintCare trialThe industry-led pilot trade waste paint collection program, PaintCare, ran for six months from 1 March 2013 to 31 August 2013. The trial was funded by the APMF in partnership with Sustainability Victoria, DuluxGroup, Valspar, PPG and Haymes Paints.The purpose of the trial was to provide data on the potential volume of unwanted trade paint in the trade community as well as behaviour patterns of participating trade painters. This is reported in ToxFree et al. (2013) “PaintCare Trade Trial”.
The program was managed by Toxfree. Trade paint drop off sites were established at the Geelong, Bendigo, Melton, Monash, Shepparton and Mornington Detox Your Home (DYH) sites.Key results from the PaintCare trial were: Total quantity collected (including packaging): 127.6 tonnes Water to solvent based waste paint split: 69%/31% paint to packaging split: 77%/23% Steel to plastic packaging split 86%/14%The water to solvent based waste paint split is slightly lower than that found through the HHC collection programs.
4.4 Current waste paint collection systemsHHC collection systemsToxfree manages several State based HHC collection programs in partnership with state agencies including Sustainability Victoria, West Australian Local Government Association (WALGA) and the NSW EPA. It also managed the Victorian PaintCare trial.
Page 47Study into stocks and flows, market analysis and processing capacity of waste paintLandfill Name and Address
Nolan Consulting Pty Ltddocument.docx

Insert Report Date
Appendix BSite photographs
In the Victorian, NSW, and WA jurisdictions the waste paint, including packaging, is taken to a Toxfree facility where the waste paint is separated from the packaging. These facilities also include Chemsal facilities which were acquired by Toxfree in 2013. The facilities at located at: Laverton North, Victoria; Gillman, SA; St Marys, NSW; and Kwinana, Western Australia.Upon receival at facilities the paint cans are crushed in a HazPak 3000 densification machine, following a manual front end sort to separate into water based paint, solvent based paint, steel packaging, and plastic packaging. The HazPak machine removes waste paint residues from the packaging. Steel bales are sent to Norstar for recycling, and the plastic packaging is landfilled.In South Australia the HHC program is managed by Transpacific and the collected waste paint is initially treated at Transpacific’s Dry Creek Facility.In Queensland most local government HHC collection programs are managed by either ToxFree or Transpacific. Transpacific transports the waste paint to its Narangba liquid treatment plant.The current waste paint disposal/ recycling pathways from the household hazardous collection programs are listed in Table 4-10.Table 4-10: Household hazardous collection program disposal/ recycling pathways
State Water based Solvent based
Page 48Study into stocks and flows, market analysis and processing capacity of waste paintLandfill Name and Address
Nolan Consulting Pty Ltddocument.docx

Insert Report Date
Appendix BSite photographs
Queensland Immobilised and disposed of to landfill.
Recovery of solvent for reuse and thermal processing.
NSW Thermal processing in Victoria: Treated at the Geocycle Dandenong plant and used as a cement kiln fuel.
South Australia Immobilised and disposed of to landfill.
Recovery of solvent for reuse and thermal processing.
Victoria Thermal processing in Victoria: Treated at the Geocycle Dandenong plant and used as a cement kiln fuel.
Western Australia Water replacement in cement manufacture. (Prior to 2012 it was transported to Victoria).
Thermal processing in Victoria.
Tasmania Typically dried and disposed of to landfill.
Typically dried and disposed of to landfill.
It has not been possible to obtain the ACT and Northern Territory disposal/recycling pathway information. A further description of the current waste paint disposal/ recycling pathway is provided in Section 4.5.
Other waste paint drop off and treatment systemsSeveral liquid waste treaters are equipped to accept waste paint from both households and trade painters. The waste paint received at these treatment facilities is typically sourced from:
Page 49Study into stocks and flows, market analysis and processing capacity of waste paintLandfill Name and Address
Nolan Consulting Pty Ltddocument.docx

Insert Report Date
Appendix BSite photographs
householder and trade painter drop offs; dedicated waste company collections; and transfer stations with paint drop off areas that are operated by Councils and the
private sector. The Toxfree liquid waste treatment sites are listed in the above section as are the Transpacific Dry Creek, SA and Narangba Queensland sites. Transpacific also operates liquid waste treatment sites in Melbourne, Sydney and Newcastle.Veolia also operates several liquid waste treatment sites within Australia.Veolia has advised that although they do not receive waste paint collected through the HHC programs they do accept waste paint from waste collection contractors at their Brooklyn (Melbourne Victoria) and Kilburn (Adelaide SA) liquid waste treatment facilities. Waste paint received in Tasmania is sent to Melbourne for treatment. Veolia also has a WA joint venture with Transpacific servicing Perth and Kalgoorlie.Water-based paint from Veolia’s treatment plants is filtered through a press and the filtercake/sludge is stabilised with cement and sent to landfill. The solvent-based paint is sent to Geocycle in Dandenong for treatment into a cement kiln fuel or in the case of the Kilburn facility is mixed with other solvents to produce a fuel for a medical waste incinerator. Veolia also operates an indirect thermal facility where contaminated soil desorption occurs at 400ºC to strip mercury. Solvent based paint is partially used as a fuel for this facility.Veolia sends steel packaging to Sims for recycling and the plastic packaging is landfilled.Veolia has indicated that it is not constrained in accepting more waste paint and there are no technical barrier to the ongoing recovery of paint and paint cans.
Page 50Study into stocks and flows, market analysis and processing capacity of waste paintLandfill Name and Address
Nolan Consulting Pty Ltddocument.docx

Insert Report Date
Appendix BSite photographs
4.5 Current waste paint disposal/ recycling pathwaysThe primary current waste paint disposal/ recycling pathway for the HHC collection programs are: thermal processing; distillation and solvent recovery; and water replacement in cement manufacture.In addition small quantities of water based paint is used in the manufacture of compost.
4.5.1 Thermal processingThe primary disposal pathway for waste paint collected through chemical collection programs is use in cement kilns as an alternative fuel.
GeocycleAll of the Victorian, NSW, and Western Australian solvent based paint collected by Toxfree through the respective state HHC collection programs is sent to Geocycle’s Dandenong plant in Victoria. Victoria’s HHC water based waste paint is also sent to Geocycle. Geocycle is a wholly owned subsidiary of the Cement Australia group. Geocycle treats industrial by-products and wastes, including waste paint, for use in Cement Australia’s cement kilns.
Page 51Study into stocks and flows, market analysis and processing capacity of waste paintLandfill Name and Address
Nolan Consulting Pty Ltddocument.docx
Insert Report Date
Appendix BSite photographs
For waste paint that is accepted directly at the plant, the waste paint and packaging is put through an auger which breaks the cans. The cans are then shredded. The shredded mass is then washed with waste solvents from other sources. The steel packaging is then magnetically separated and sent via conveyor into a skip which is picked up by a steel recycler.As water based paint has a low calorific value it is blended with several high calorific value solvents, including solvent based waste paint. This increases the cost of the DYH program. The washed liquid is blended with other waste liquids to produce a single specification fuel. The fuel is then transported to the SA cement kilns for burning. The fuel results in cost savings in the generation of heat for the cement kiln process that consumes a large amount of energy. The residual products from this process are clinker, bottom ash, and fly ash.Most of the waste paint received by Geocycle in 2012/13 was sourced from the state based chemical collection programs managed by Toxfree).
Page 52Study into stocks and flows, market analysis and processing capacity of waste paintLandfill Name and Address
Nolan Consulting Pty Ltddocument.docx
Insert Report Date
Appendix BSite photographs
Other sources of waste paint to the Dandenong plant include consolidated customers including Transpacific and Geocycle’s waste paint community can drop at Dandenong. The waste paint community can drop facility is also available to trade painters.
4.5.2 Distillation and solvent recoveryTranspacific operates a solvent recovery facility at its Dry Creek Facility in South Australia. The solvent recovered from the distillation process is reused by industry and the sludge is transported interstate for further processing. It is understood, although not confirmed by Transpacific, that a significant component of the sludge is transported to Victoria for fuel production. A similar process is understood to be undertaken by Transpacific in Queensland.
4.5.3 Water replacement in cement manufactureThe water based waste paint collected through the Western Australian household chemical collection program is used as a water replacement in cement manufacture.
4.5.4 SummaryThere are a range of disposal/recycling pathways for waste paint and packaging. For waste paint, the options are thermal processing, water replacement in cement, and stabilisation followed by landfill. The options for steel packaging are landfill and recycling. Plastic packaging is landfilled.Estimates of ultimate disposal destinations based upon industry advice and knowledge is presented in Table 4-11.
Page 53Study into stocks and flows, market analysis and processing capacity of waste paintLandfill Name and Address
Nolan Consulting Pty Ltddocument.docx

Insert Report Date
Appendix BSite photographs
Table 4-11: Ultimate disposal destination (as percentages)
Disposal and Recovery Route Waste paint Steel packaging
Land
fill
Ther
mal
pr
oces
sing
, so
lven
t W
ith
Recy
cled
Ca
ns a
nd t
o se
wer
Stor
mw
ater
an
d Se
wer
Land
fill
Recy
cled
HHC collection programs - 89.3% 10.7% - - 100%
Kerbside collection Garbage 100% - - - 100% -
Recyclables - - 100% - - 100%
Hard waste 90% - 10% - 90% 10%
C&I and C&D collections Garbage 100% - - - 100% -
Recyclables - - 100% - - 100%
Self haul 90% - 10% - 90% 10%
Household skips 100% - - 100% -
Liquid treatment plants - 89.3% 10.7% - - 100%
Stormwater and sewer - - - 100 - -
Page 54Study into stocks and flows, market analysis and processing capacity of waste paintLandfill Name and Address
Nolan Consulting Pty Ltddocument.docx

Insert Report Date
Appendix BSite photographs
The ultimate disposal destinations for trade painter’s waste paint dropped off at liquid waste treatment plants are considered to be equivalent to the HHC collection program.
4.6 Potential waste paint disposal/ recycling pathway4.6.1 Polymer substitute for cementAlthough not a current end use, water based waste paint, through its mineral constituents, is a potential polymer substitute in cement. Toxfree has advised that although it has undertaken trials, it cannot find a commercial partner for using water based paint as a concrete additive.Sustainability Victoria has engaged Swinburne University to undertake research to investigate this potential application.The Independent Cement and Lime Group (ICL) is supporting Swinburne University in this research. ICL is a Port Melbourne based supplier of cement and cement-based products. It is a subsidiary of Adelaide Brighton in a joint venture with Barro Group and is Victoria’s leading supplier of cement and cement-blended products.
4.6.2 DewateringIndustry has suggested dewatering of water based paint through dehydration processes. At this stage the costs are understood to be higher than other options.
4.6.3 Other cement kilnsAdelaide Brighton Cement (ABC) is a major cement manufacturer in Australia. It has a cement kiln in Port Adelaide and another at Angaston the north-east of Adelaide. It is understood that the front end of these kilns could be reconfigured to accept waste paint as a fuel.
Page 55Study into stocks and flows, market analysis and processing capacity of waste paintLandfill Name and Address
Nolan Consulting Pty Ltddocument.docx

Insert Report Date
Appendix BSite photographs
4.6.4 Recovery of plastic packaging Plastic HPDE packaging is approximately 14% of the trade waste paint packaging and its use is increasing particularly for water based paint (Toxfree et al.; 2013)This packaging is currently being disposed to landfill as it is difficult to remove sufficient paint from the polypropylene (PP) and high density polyethylene (HDPE) packaging for recycling.Toxfree is investigating the recovery of waste paint plastic packaging and improving beneficial reuse outcomes through HazWaste Fund funding support. It is understood that the recycling of waste paint plastic packaging into new paint containers in New Zealand has been successfully implemented.
4.6.5 Paint reuse opportunitiesSwinburne University of Technology (2013) undertook a study into the end of life options, for waste paint in Australia. They found that paint reuse results in a reduction of illegal waste paint disposal and also reduces the need for new paint manufacturing.The survey of trade painters undertaken as part of this project (Section 5) has identified that some waste paint is either left with householders or is given away. Although a portion of this waste paint is likely to be reused the it is considered to be a minor contributor to paint consumption. For this reason it has not been included in the MFA.
Page 56Study into stocks and flows, market analysis and processing capacity of waste paintLandfill Name and Address
Nolan Consulting Pty Ltddocument.docx
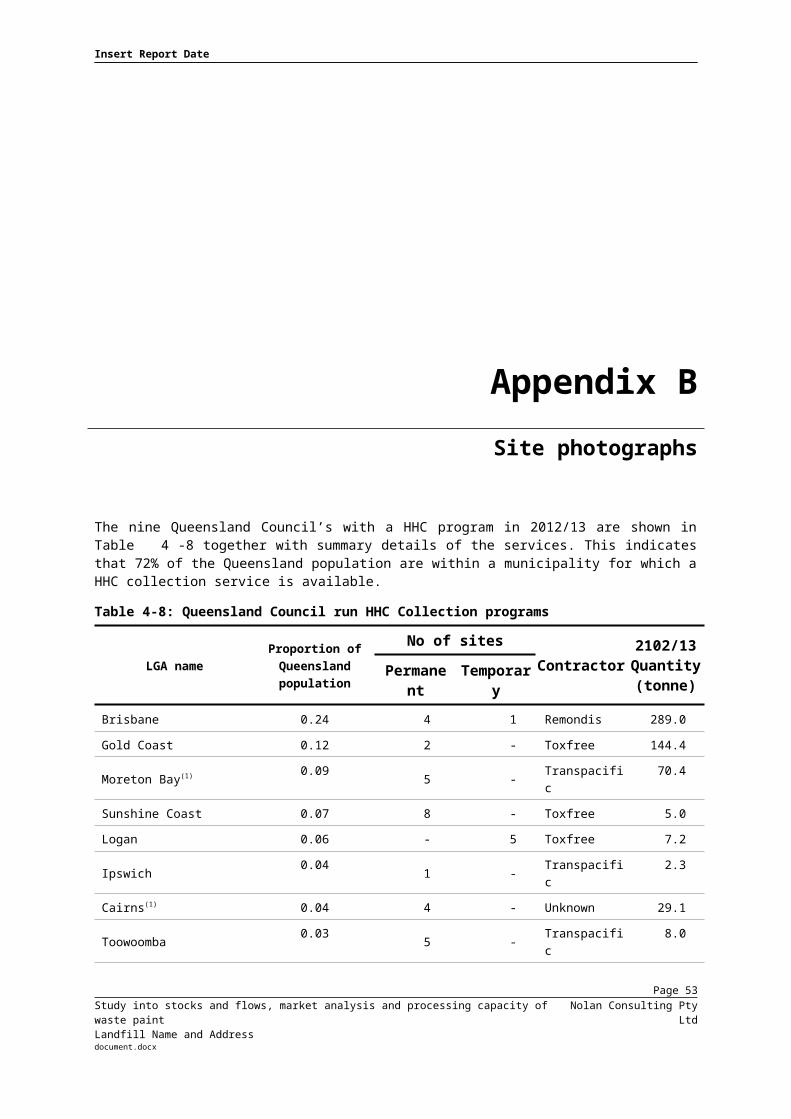
Insert Report Date
Appendix BSite photographs
5. Trade painter surveyKey outcomes – trade painter survey
275 trade painter organisations and 40 members of the National Institute of Painting & Decorating were surveyed in 2013/14 across all jurisdictions.
It was found that about 32% of the waste paint in trade painter stockpiles is destined for disposal.
Before disposal waste paint is stored in trade painter stockpiles for an average of 2.4 years.
Table 5-12: Estimated trade waste paint annual disposal quantitiesTrade waste disposal pathway %
Via stockpile
Solidify paint and dispose with rubbish 20.4%
Donate to friends & community groups 22.6%
Take to liquid waste treatment companies
8.1%
Council depots that accept waste paint 16.4%
Sub-total 67.5%
Direct disposal
Leave with customers 31.0%
Page 57Study into stocks and flows, market analysis and processing capacity of waste paintLandfill Name and Address
Nolan Consulting Pty Ltddocument.docx

Insert Report Date
Appendix BSite photographs
Trade waste disposal pathway %
Pour on ground 1.1%
To sewer 0.4%
Sub-total 32.5%
Total 100.0%
The average trade painter business stockpile is 568 L. This is slightly less than the 604 L found as part of the Victorian trade painter survey conducted in 2010.
5.1 PurposeA short survey of trade painters was undertaken as part of the study to gain a qualitative understanding of waste paint stockpiling and disposal behaviour by trade painters.
5.2 Overview of the trade painter industry5.2.1 Master Painters Associations State based Master Painter Associations are the primary representative bodies for trade painters in Australia.All of the state and territories, with the exception of Western Australia and the Northern Territory, have Master Painters Associations. These organisations are affiliated through the national Master Painters Association (MPA) federation.The Master Painters & Decorators Australia represents master painters in Western Australia.
Page 58Study into stocks and flows, market analysis and processing capacity of waste paintLandfill Name and Address
Nolan Consulting Pty Ltddocument.docx

Insert Report Date
Appendix BSite photographs
All MPAs and the Master Painters & Decorators Australia are membership based. The MPA has advised that its members include most of the major painting contractors, one of which has over 1,500 employees nationally. All painters that are members are certified. The membership of these associations, as shown in Table 5-13, has been estimated by one of the associations.Table 5-13: MPA membership by jurisdiction (estimated)
Jurisdiction Members
Victoria (Victoria) 420
Victoria (Tasmania) 30
NSW 800
ACT 80
South Australia 140
Queensland 330
Total 1800
The Master Painters & Decorators Australia (WA) is estimate to have 375 members. Dulux has advised that there are about 20 large trade painter organisations in the Northern Territory.
5.2.2 National Institute of Painting & Decorating The National Institute of Painting & Decorating (NIP&D) is an incorporated non-profit organisation for the Australian and Pacific painting industry.
Page 59Study into stocks and flows, market analysis and processing capacity of waste paintLandfill Name and Address
Nolan Consulting Pty Ltddocument.docx

Insert Report Date
Appendix BSite photographs
The NIP&D has a national database of readers who receive its weekly e-news. The painters who receive the weekly NIP&D e-news are as follows: ACT 88 NSW 613 QLD 560 SA 139 NT 63 TAS 88 WA 300 VIC 425 Total 2,276The NIP&D has advised that almost all of the e-news readers are trade painters. The NIP&D also advised that they also produce an on-line magazine for the painting industry with a readership of 40,000.
5.2.3 Total number of trade paintersAdvice was also sought from the Master Painters Association of Victoria on trade painter industry trends. They advised: There are approximately 8,000 painters in Victoria; 63 of the Victorian members are considered to be major (>$800,000 annual
turnover); and industry employment has been stable over the past decade.
Page 60Study into stocks and flows, market analysis and processing capacity of waste paintLandfill Name and Address
Nolan Consulting Pty Ltddocument.docx

Insert Report Date
Appendix BSite photographs
5.3 Survey questions and participantsThe short survey of trade painters was undertaken from December 2013 through to January 2014. The survey was undertaken electronically using SurveyMonkey. The results were aggregated by Nolan Consulting.The survey questions are summarised as follows:1. Advise on number of employees.2. State state/territory location.3. Estimate volume of paint that you have.4. What is the percentage of stored paint will be disposed (i.e. not reused by your
business)".5. If waste paint drop-off locations were made available to trade painters, what would
suit you best?6. Advise on disposal method.The invitation to participate in the survey was sent out to: all MPA jurisdictional members on 18th December 2013 (except for Victoria); MPA Victorian members on January 17th January 2014; Master Painters & Decorators Australia (WA) on 18th December 2013; Over 20 of Dulux’s major Northern Territory trader painter clients in late December
2013; and NIP&D national database of readers on 20th December 2013.
Page 61Study into stocks and flows, market analysis and processing capacity of waste paintLandfill Name and Address
Nolan Consulting Pty Ltddocument.docx

Insert Report Date
Appendix BSite photographs
The survey closed on 29th January 2014. The survey respondents are presented in Table 5-14.Table 5-14: Master painter survey respondents
Trade Painter organisation
Respondents
Estimated
Members
% of members
% of total responden
ts
ACT 10 80 12.5% 3.6%
New South Wales 67 800 8.4% 24.4%
Northern Territory 7 20 35.0% 2.5%
Queensland 48 330 14.5% 17.5%
South Australia 37 140 26.4% 13.5%
Tasmania 5 30 16.7% 1.8%
Victoria 54 420 12.9% 19.6%
Western Australia 47 375 12.5% 17.1%
Total 275 2,195 12.5% 100.0%Forty responses were obtained from the National Institute of Painting & Decorating. The split on a jurisdictional basis was as follows: NSW (11), Qld (7), SA (5), Vic (11), and WA (6).
Page 62Study into stocks and flows, market analysis and processing capacity of waste paintLandfill Name and Address
Nolan Consulting Pty Ltddocument.docx
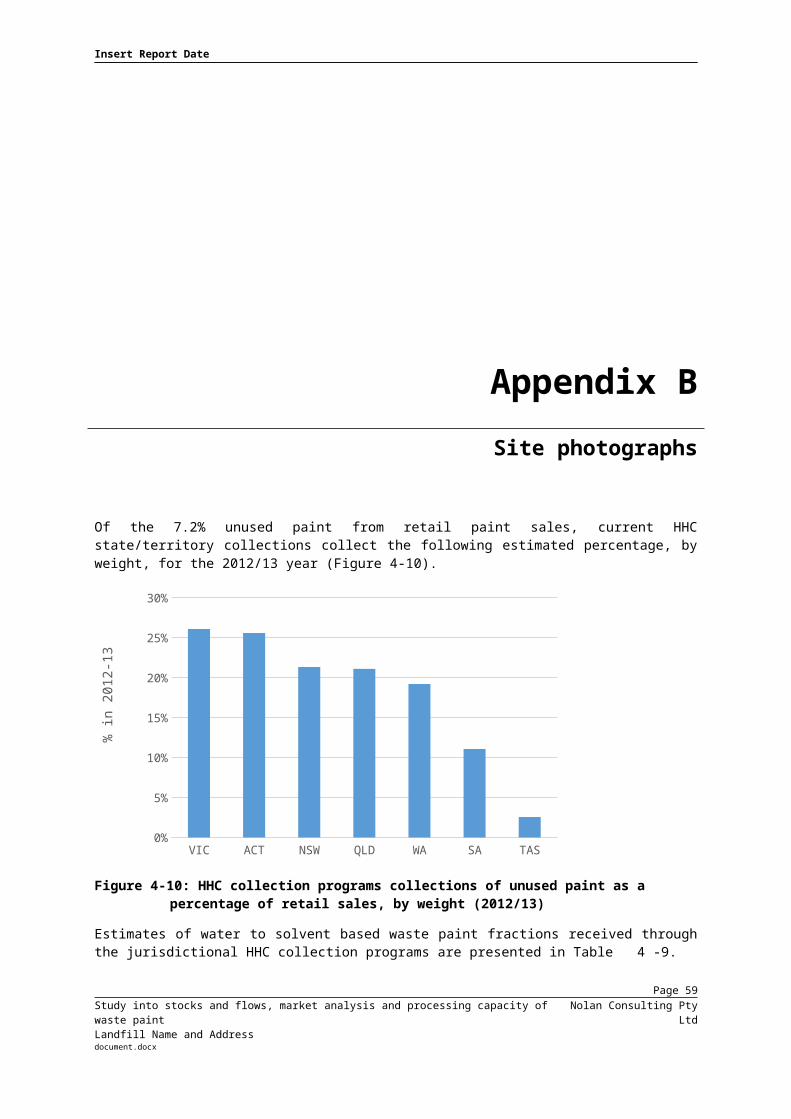
Insert Report Date
Appendix BSite photographs
5.4 Findings from master painters surveyThe survey found that over 80% of the trade painter businesses represent SMEs of less than 10 employees, and that less than 2% have more than 50 employees (Table 5-15).Table 5-15: Employee ranges for respondents
Employees
Respondents
No %
0 to 10 230 83.6%
11 to 19 24 8.7%
20 to 49 17 6.2%
50 to 199 1 0.4%
199+ 3 1.1%
Total 275 100.0%
The MPA (Victoria) also advised that its members include most of the major painting contractors including one employer that has over 1,000 employees nationally.Of the survey respondents 78% were located in metropolitan centres with the remainder being located within regional communities.
Page 63Study into stocks and flows, market analysis and processing capacity of waste paintLandfill Name and Address
Nolan Consulting Pty Ltddocument.docx

Insert Report Date
Appendix BSite photographs
5.4.1 Trade paint stockpileIn total the volume of paint stockpiled by the respondents was 156,453 L. The breakdown across the jurisdictions is presented in Table 5-16.Table 5-16: Trade paint stockpiles
Trade Painter organisation
Respondents
Stockpile (L)
(respondents)
Jurisdiction stockpile estimates
(Litres) (Tonnes) %
ACT 10 7,844 188,256 226 4.9%
New South Wales 67 41,545 1,488,179 1,786 38.4%
Northern Territory 7 2,480 21,257 26 0.5%
Queensland 48 26,489 546,336 656 14.1%
South Australia 37 14,940 169,589 204 4.4%
Tasmania 5 4,400 79,200 95 2.0%
Victoria 54 40,190 937,767 1,125 24.2%
Western Australia 47 18,565 444,375 533 11.5%
Total275 156,453 3,874,95
9 4,650 100.0%
Page 64Study into stocks and flows, market analysis and processing capacity of waste paintLandfill Name and Address
Nolan Consulting Pty Ltddocument.docx
Insert Report Date
Appendix BSite photographs
In the analysis of the 2010 Victorian trade painter survey Sustainability Victoria (2010) “Paint Product Stewardship Trial Proposal - Victorian Model” estimated the MPA Victorian members account for one sixth of the Victorian trade paint consumption.The number of trade painters employed in Victoria by MPA of Victoria members has been estimated through the survey to be about 3,000. As the there are about 8,000 painters in Victoria, this study has assumed that MPA members across the nation account for one third of total trade paint consumption.This assumption has been applied across all jurisdictions, after extrapolating from jurisdictional respondents to total membership, to obtain total jurisdictional estimates of the stockpiles.The 2012/13 national trade waste stockpile is estimated to be 4,650 tonne (excluding packaging).
Page 65Study into stocks and flows, market analysis and processing capacity of waste paintLandfill Name and Address
Nolan Consulting Pty Ltddocument.docx

Insert Report Date
Appendix BSite photographs
The survey identified that approximately 81.3% of the estimated stockpile is water based paint. This is generally higher than the portion water based waste paint that is collected in the HHC programs (Table 4-9) and considerably greater than the 69% that was collected in the PaintCare trial (Section4.3). This suggests that trade painters intend to use a greater portion of the water based paint than the solvent based paint.
5.4.2 Waste paint disposalSurvey participants were asked to estimate the waste paint in stockpile that they will dispose of rather than reuse. Respondents estimated that 31.9% of the waste paint would require eventual disposal. Participants were asked to estimate the length of time in which paint was stockpiled before disposal. The range of time prior to disposal is shown in Table 5-17.Table 5-17: Period before paint in stockpile is disposed
Range No. % Volume in storage
(L)
% by volume
0 to 6 months 20 7.3% 6,498 4.2%
6 to 12 months 66 24.0% 22,130 14.1%
12 to 24 months 67 24.4% 39,105 25.0%
24 to 36 months 57 20.7% 32,420 20.7%
More than 36 months 63 22.9% 55,400 35.4%
No response 2 0.7% 900 0.6%
Total 275 100.0% 156,453 100.0%
Page 66Study into stocks and flows, market analysis and processing capacity of waste paintLandfill Name and Address
Nolan Consulting Pty Ltddocument.docx

Insert Report Date
Appendix BSite photographs
The mean period of storage before disposal was 29 months (2.43 years). The duration in time within the stockpile prior to disposal is shown graphically in Figure 5-3.
4%
14%
25%
21%
35%
1%
0 to 6 months 6 to 12 months 12 to 24 months 24 to 36 monthsMore than 36 months No response
Figure 5-3: Trade waste survey - Duration of paint in stockpile before disposal
Participants were asked “If you need to dispose of some of your stored paint, how often would you use the nominated disposal methods”. The responses are presented in Table 5-18.Table 5-18: Disposal pathways from the stockpile
Page 67Study into stocks and flows, market analysis and processing capacity of waste paintLandfill Name and Address
Nolan Consulting Pty Ltddocument.docx
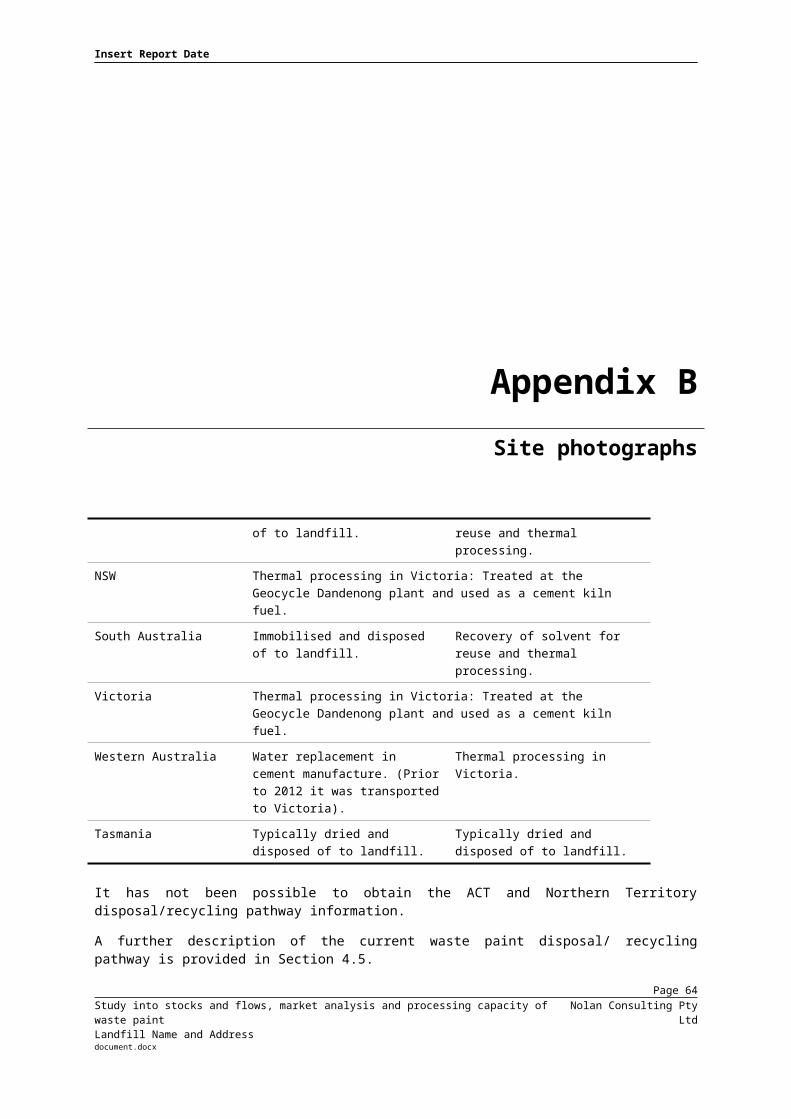
Insert Report Date
Appendix BSite photographs
Disposal pathway
Responses
Port
ion
of
disp
osal
via
th
is p
athw
ay
Alw
ays
Freq
uent
ly
Som
etim
es Ra
rely
Nev
er
Via stockpile
Solidify paint and dispose with rubbish 10% 24% 32% 18% 16% 20.4%
Donate to friends & community groups 10% 21% 44% 17% 8% 22.6%
Take to liquid waste treatment companies 5% 7% 14% 20% 55% 8.1%
Council depots that accept waste paint 12% 13% 28% 22% 24% 16.4%
Sub-total 67.5%
Direct disposal
Leave with customers 17% 50% 27% 3% 3% 31.0%
Pour on ground 0% 0% 5% 8% 87% 1.1%
To sewer 0% 0% 1% 5% 93% 0.4%
Sub-total 32.5%
Total 100.0%The portion of disposal via the pathways has been estimated by quantifying the frequencies.
Page 68Study into stocks and flows, market analysis and processing capacity of waste paintLandfill Name and Address
Nolan Consulting Pty Ltddocument.docx
Insert Report Date
Appendix BSite photographs
It should be noted that the ‘leave with customer’, ‘pour on ground’ and ‘to sewer’ disposal options are direct disposal pathways and not via the stockpile. It is therefore assumed that trade painters considered the question related to all disposal.
5.4.3 Estimate of annual trade paint disposalThe annual quantity of trade waste disposed of from the stockpile is assumed to be the estimated total stockpile of 4,650 tonne by the portion that is to be disposed via the stockpile (31.9%) divided by the time from entering the stockpile (2.43 years). On this basis the annual disposal from the stockpile is estimated to be 613 tonne. Based upon Table 5-6 this accounts for 67.5% of the total disposal. Accounting for the ’leave with customer’, ‘pour on ground’, and ‘to sewer’ disposal pathways the total annual disposal of trade waste is estimated from the survey to be 898 tonne.The estimated national trade waste annual disposal quantities (excluding packaging) are presented in Table 5-8 and shown graphically in Figure 5-4.Table 5-19: Estimated trade waste paint annual disposal quantities
Trade waste disposal pathway%
Quantity
(tonne)
Via stockpile
Solidify paint and dispose with rubbish 20.4% 184
Donate to friends & community groups 22.6% 205
Take to liquid waste treatment companies 8.1% 81
Council depots that accept waste paint 16.4% 143
Page 69Study into stocks and flows, market analysis and processing capacity of waste paintLandfill Name and Address
Nolan Consulting Pty Ltddocument.docx

Insert Report Date
Appendix BSite photographs
Trade waste disposal pathway%
Quantity
(tonne)
Sub-total 67.5% 613
Direct disposal
Leave with customers 31.0% 272
Pour on ground 1.1% 10
To sewer 0.4% 3
Sub-total 32.5% 285
Total 100.0% 898
The above trade waste disposal estimate of 898 tonne/year obtained from the trade survey is considerable lower than estimated from waste compositional data (See Table 7-27). For this reason auditing for waste paint in C&I and C&D waste and recycling streams is recommended as one of the highest priorities for future data collection (see Section 9.6).
Page 70Study into stocks and flows, market analysis and processing capacity of waste paintLandfill Name and Address
Nolan Consulting Pty Ltddocument.docx

Insert Report Date
Appendix BSite photographs
Figure 5-4: Trade waste survey – estimated annual waste paint disposal via pathways (tonne/yr)
The unused paint that is left with customers can be used for touch-ups and other general use. However, this paint may require clearing out by the households, in which case it is eligible for local HHC collections.
5.4.4 Trade painter interest in a co-ordinated drop of system63% of respondents advised that either weekday or weekend waste paint drop-off days would be acceptable. Weekdays were preferred by 23% and weekends were preferred by 14%.
Page 71Study into stocks and flows, market analysis and processing capacity of waste paintLandfill Name and Address
Nolan Consulting Pty Ltddocument.docx

Insert Report Date
Appendix BSite photographs
5.5 Survey of NIP&D ParticipantsThe results from the survey of National Institute of Painting & Decorating (NIP&D) participants were generally similar to the survey of MPA members. The majority of participants were SMEs. The proportion of solvent based paint was slightly lower than MPA members, and the proportion of waste paint in the stockpile to be disposed of was 33.4% as compared to the 31.9% in the MPA survey. The holding periods in the stockpile before disposal were almost identical.
5.6 Comparison with 2010 trade painter survey outcomesThe Sustainability Victoria (2010) “Paint Product Stewardship Trial Proposal - Victorian Model” summarised the outcome of a 2010 trade painter survey. 106 of 450 the Victorian MPA members responded to the survey. A comparison of key survey outcomes is presented in Table 5-20.Table 5-20: Comparison of 2010 and 2013/14 trade painter surveys
Survey outcomes 2010 2013/14
Average trade painter business stockpile (L) 604 568
Portion of stockpile to be disposed that is landfilled (%) 41% 19.8%
Page 72Study into stocks and flows, market analysis and processing capacity of waste paintLandfill Name and Address
Nolan Consulting Pty Ltddocument.docx

Insert Report Date
Appendix BSite photographs
6. Waste paint in garbage, recycling and illegally disposedKey outcomes – waste paint in disposal and recycling pathways
The quantity of waste paint in garbage and recyclables put out for collection by residents and businesses has been estimated from available waste audit data.
Waste paint, including packaging, is estimated to range between 0.05% and 0.14% by weight of household kerbside garbage. Waste paint, including packaging, is estimated to be about 0.008% of household kerbside recyclables.
Waste paint in the C&I and C&D waste stream is estimated to be 0.05%, and in the C&I and C&D recycling stream is estimated to be 0.01% of the total stream.
About 320 tonne/year of trade waste paint is estimated to be disposed of to industrial liquid treatment plants.
The illegal disposal of waste paint to sewer and stormwater is estimated to be 100 tonne/year. It appears to have fallen over the past decade, possibly as a result of education and improved access to HHC collection programs.
6.1 PurposeA significant component of waste paint is disposed of via waste and recycling collection services and direct drop offs.In addition to the waste paint captured through the HHC programs some householders and trade painters take waste paint directly to liquid waste treatment facilities. A small quantity of waste paint is also disposed of illegally via stormwater and the sewer.
Page 73Study into stocks and flows, market analysis and processing capacity of waste paintLandfill Name and Address
Nolan Consulting Pty Ltddocument.docx
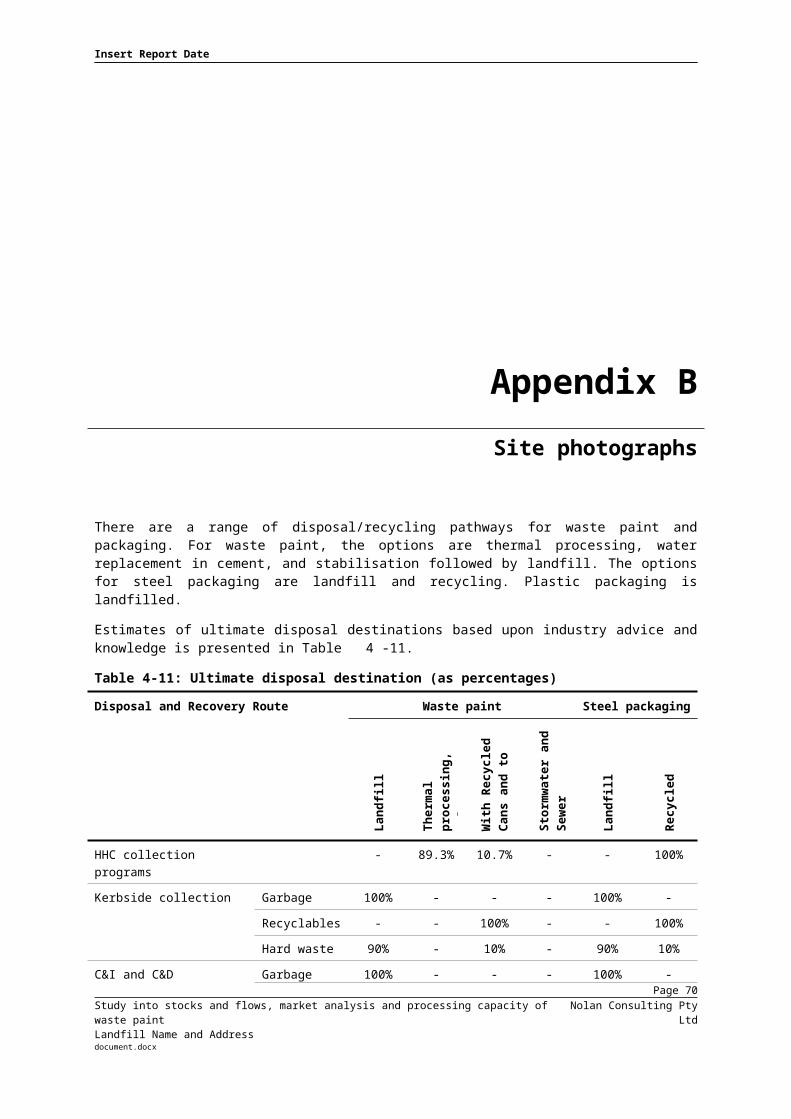
Insert Report Date
Appendix BSite photographs
Research into these disposal pathways is presented in this section.
6.2 Garbage and recycling total quantitiesThere are three primary waste and recycling streams. There are: municipal; commercial and industrial (C&I); and construction and demolition (C&D).Municipal can be split into domestic kerbside and other municipal services including (i) household hard waste, (ii) self haul to transfer stations and recycling facilities, and (iii) household skips to transfer stations. Total waste quantity data is generally available for each of these municipal waste streams.C&I and C&D data on both waste and recycling quantities is generally available for each jurisdiction.Estimates of the quantity of waste paint within these streams have been made as follows: determining total waste/recycling quantities; identifying best available compositional analysis through audits to determine waste
paint percentage; and multiplying the waste paint percentage by the total quantity.Estimated kerbside, C&I and C&D waste and recycling quantities for 2012/13 are presented in Table 6-21.
Page 74Study into stocks and flows, market analysis and processing capacity of waste paintLandfill Name and Address
Nolan Consulting Pty Ltddocument.docx
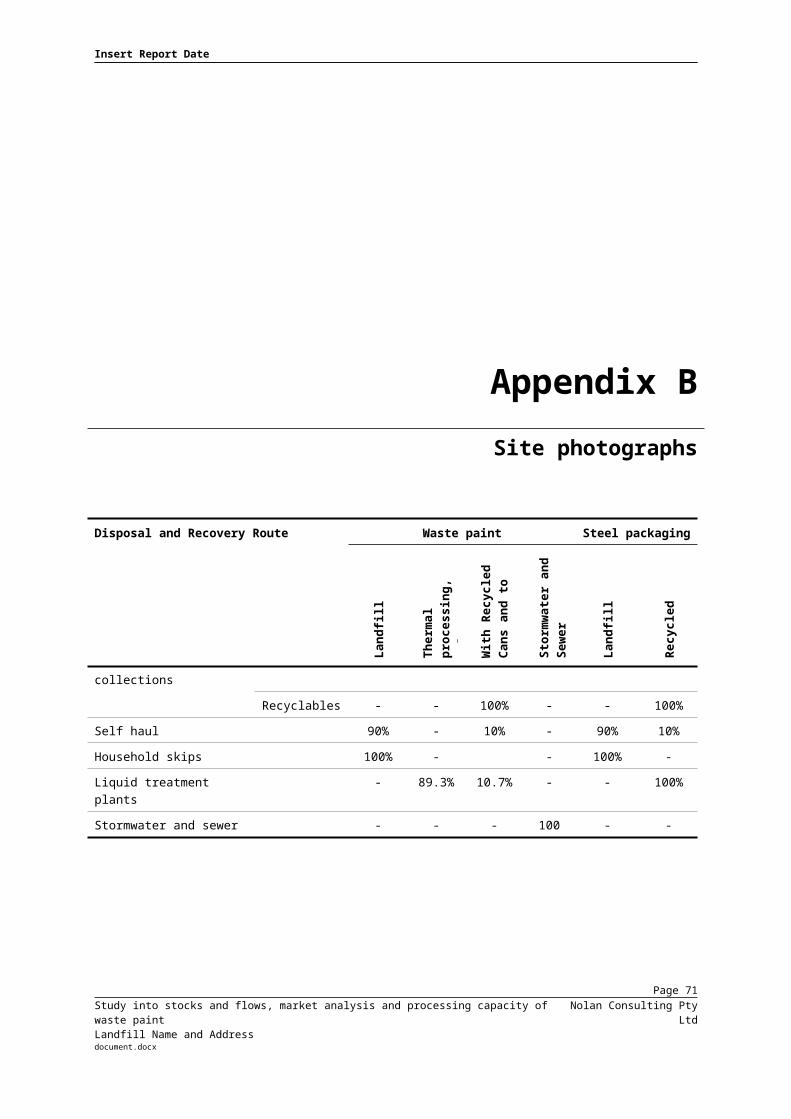
Insert Report Date
Appendix BSite photographs
Table 6-21: Estimated 2012/13 State and Territory garbage and recycling quantities (tonne)
State/Territory Kerbside C&I C&D
Waste Recycling
Waste Recycling
Waste Recycling
ACT 45,100 185,000 116,900 243,500 45,700 276,100
New South Wales 1,303,000
2,457,000
2,371,500
3,099,500 1,749,000
5,156,000
Northern Territory
113,900 13,600 40,600 13,600 124,700 400
Queensland 1,242,000
1,005,000
1,673,100
1,029,300 823,500 894,100
South Australia 262,700 446,000 183,200 446,900 433,700 1,239,200
Tasmania 130,400 86,300 235,400 70,500 38,800 0
Victoria 1,438,700
1,543,600
1,605,700
2,484,400 1,386,800
3,140,700
Western Australia 673,000 521,400 1,035,200
847,000 1,885,100
1,155,400
Total 5,208,800
6,257,900
7,261,600
8,234,700 6,487,300
11,861,900
Page 75Study into stocks and flows, market analysis and processing capacity of waste paintLandfill Name and Address
Nolan Consulting Pty Ltddocument.docx

Insert Report Date
Appendix BSite photographs
The total quantities of other municipal waste streams across all jurisdictions for 2012/13 are presented in Table 6-22.Table 6-22: Estimated 2012/13 State and Territory other municipal waste quantities (tonne)
Jurisdiction Household hardwaste Self-haul of
waste by householders
Skips to landfills/ transfer stations from residential
sites
ACT 10,100 17,800 2,900
New South Wales 196,400 302,400 59,300
Northern Territory 0 9800 1,000
Queensland 122,800 265,900 41,800
South Australia 44,600 69,100 4,600
Tasmania 13,800 21,400 5,900
Victoria 151,400 234,900 40,100
Western Australia 84,000 183,500 25,900
Total 623,100 1,104,800 181,500
The source of these estimates is provided below.
6.2.1 Kerbside garbage (waste)
Page 76Study into stocks and flows, market analysis and processing capacity of waste paintLandfill Name and Address
Nolan Consulting Pty Ltddocument.docx
Insert Report Date
Appendix BSite photographs
With the exception of South Australia and Western Australia, the kerbside garbage data has been obtained from the ‘total municipal waste to landfill’ information provided in the Department of the Environment (2013) “National Waste Reporting 2013” report. This report is an online resource presenting the most recently available picture of waste management and resource recovery in Australia. Most of the data in this report is for the 2010/11 financial year. In the absence of 2012/13 data the 2010/11 waste flow data have been assumed hold for the 2012/13 financial year.The kerbside garbage estimates have been obtained by subtracting the 'private delivery' from the ‘total municipal waste to landfill’. The South Australian data has been sourced from Rawtec (2013) “South Australia's Recycling Activity Survey 2011–12 Financial Year Report Zero Waste SA” and the Western Australia data from 2011–12 has been sourced from Hyder Consulting (2013). In both cases non-kerbside data has been subtracted.
6.2.2 Kerbside recyclingThe kerbside recycling data for a jurisdictions except for South Australia and Western Australia was obtained from the Department of the Environment (2013) “National Waste Reporting 2013” 2010–11 data. The South Australian and Western Australian sources are as per the kerbside waste. As the Department of the Environment (2013) information does not provide a split between municipal and C&I recycling data for the ACT, this split is estimated from the average allocation across the other jurisdictions.
6.2.3 C&I and C&D waste and recyclingThe annual C&I and C&D waste and recycling quantities data for most jurisdictions has been obtained from the Department of the Environment (2013) “National Waste Reporting 2013”.
Page 77Study into stocks and flows, market analysis and processing capacity of waste paintLandfill Name and Address
Nolan Consulting Pty Ltddocument.docx

Insert Report Date
Appendix BSite photographs
As for the kerbside recycling the split C&I, C&D, and municipal waste and recycling data for the ACT has been estimated from the average allocation across the other jurisdictions.For South Australian (for C&I only) and Western Australian (for C&I and C&D) the annual quantity data sources were as per the kerbside garbage. The Western Australian C&I waste estimate is calculated from the 2010/11 C&I recycling quantity of 847,012 tonne divided by the published recovery rate (45%) less the recycling quantity. The same method is applied to estimate the C&D waste quantity.
6.2.4 Other municipal wasteHard wasteHard waste collection services occur in many municipalities across Australia with the collection being more common in metropolitan areas. These collections are usually conducted annually but are sometimes twice annual or on an annual ‘at call’ basis. Some Councils recycle steel cans obtained from the hardwaste.Council information provided to households indicates that only empty paint cans or cans with dry paint residue would be collected. This is generally accepted by householders with only a minimal amount of liquid paint presented.The primary source of the hard waste quantities has been the NSW EPA (2013b) 2011/12 data set. This data was then applied to all other states except for the Northern Territory and Western Australia on a household pro rata basis. The hardwaste in the Northern Territory was assumed to be zero as data was not provided. The Western Australian data was sourced from WA DEC (2013b).
Page 78Study into stocks and flows, market analysis and processing capacity of waste paintLandfill Name and Address
Nolan Consulting Pty Ltddocument.docx
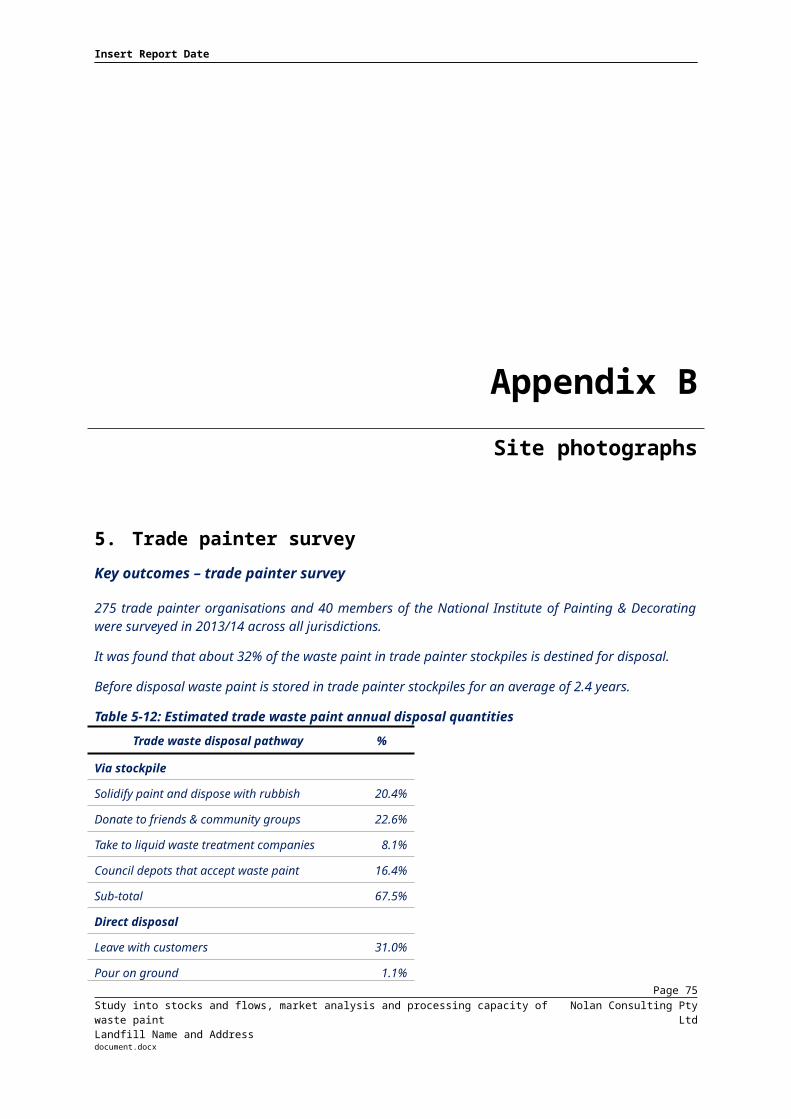
Insert Report Date
Appendix BSite photographs
Self haulAustralian householders have the opportunity to haul waste to transfer stations or directly to landfills in most parts of the country. This is commonly undertaken in trailers, small trucks and utes. At many sites, the loads can be disposed of without direct supervision. At some sites signage at entry gates advises that paint cannot be disposed of. This is controlled to varying degrees. At some sites loads are visually observed on entry and any liquid paint is rejected and householders are advised of alternative disposal methods (household chemical collections, liquid treatment plants). Many sites have no active control of paint disposal.The self haul data sources used are: Department of the Environment (2013) “National Waste Reporting 2013” for ACT
and Queensland. NSW Local Government Waste and Resource Recovery Data Report 2011–12 for
NSW. Local Government Waste and Recycling Census for Western Australia. per capita average of ACT and NSW data for all other jurisdictions.
Household skipsA well developed Australia wide industry exists providing 2 m3 to 8 m3 skips to households in urban areas. These skips are most commonly used during building renovations, site works or larger scale clean ups. The total skip waste quantities are based upon Nolan-ITU’s (2004) estimate of 2.5% of the total C&I waste stream.
Page 79Study into stocks and flows, market analysis and processing capacity of waste paintLandfill Name and Address
Nolan Consulting Pty Ltddocument.docx
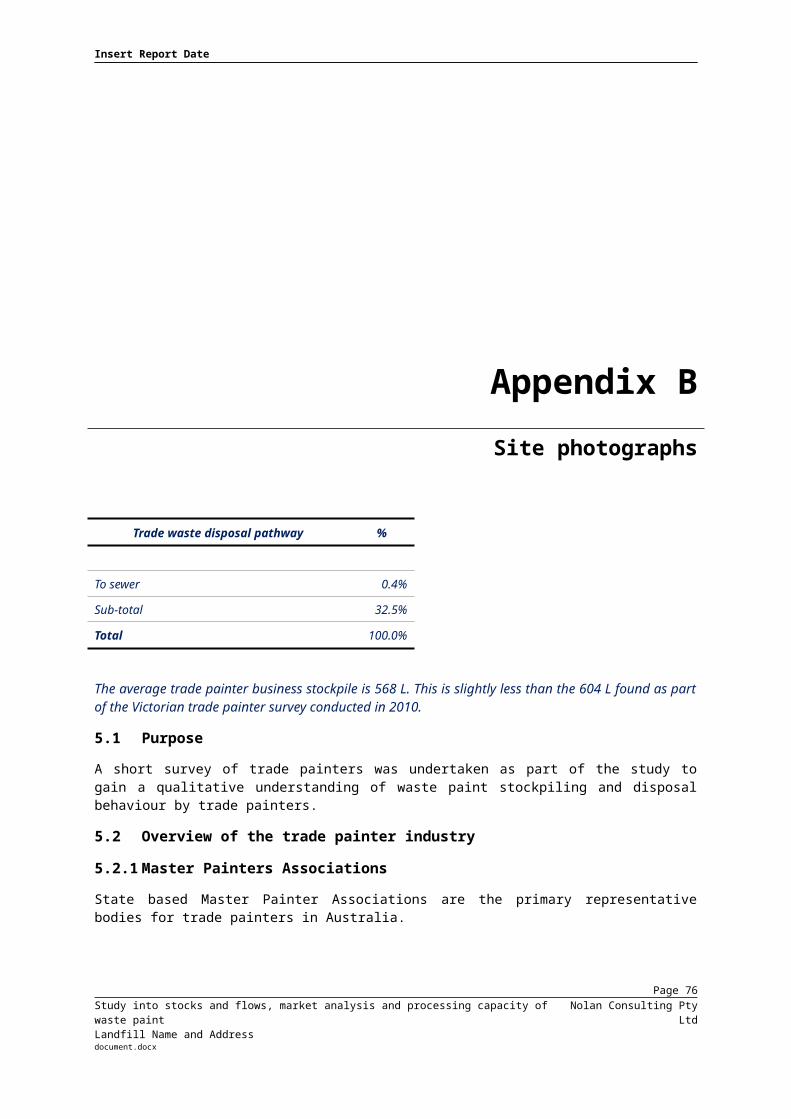
Insert Report Date
Appendix BSite photographs
6.3 Proportion of waste paint in garbage and recycling streamsThe fractions of the waste and recycling streams that are estimated to be waste paint have been obtained from a range of audits and surveys. The fractions applied to the MFA are presented below.
6.3.1 Kerbside garbageA primary paint waste paint disposal route is the kerbside garbage collection system. Disposal of paint cans with dried waste paint residue is accepted in kerbside garbage collections by many Councils. A limited number of householders, despite Council’s advice to the contrary, also dispose of liquid paint in the garbage bin.Sustainability Victoria engaged EC Sustainable (2013) conducted an audit of kerbside household waste and recycling bins throughout Victoria. The audits were conducted with four metropolitan and four non-metropolitan councils. A sample of 200 households were audited for garbage bins for each council and 200 recycling bins in the four non-metropolitan areas.Twelve paint cans were found within the 1600 garbage bins. Of the 9.7 kg/household/week EC Sustainable (2013) found that waste paint comprised 0.0079 kg. This is 0.08% of the total waste stream.The NSW EPA (2013c) domestic kerbside audit data suggests that paint makes up 0.14% of all waste in the garbage stream.APC Environmental Management (2009) “Kerbside domestic waste and recycling audit” for ACT No Waste, December 2009 found that 0.3% and 0.2% of the domestic garbage stream in the ACT contained hazardous wastes in 2007 and 2009 respectively. Hazardous wastes included paint, fluorescent lights and batteries. It is assumed that 25% of these wastes may be waste paint. On the basis of the 2009 audit an estimate of 0.05% is assumed.
Page 80Study into stocks and flows, market analysis and processing capacity of waste paintLandfill Name and Address
Nolan Consulting Pty Ltddocument.docx
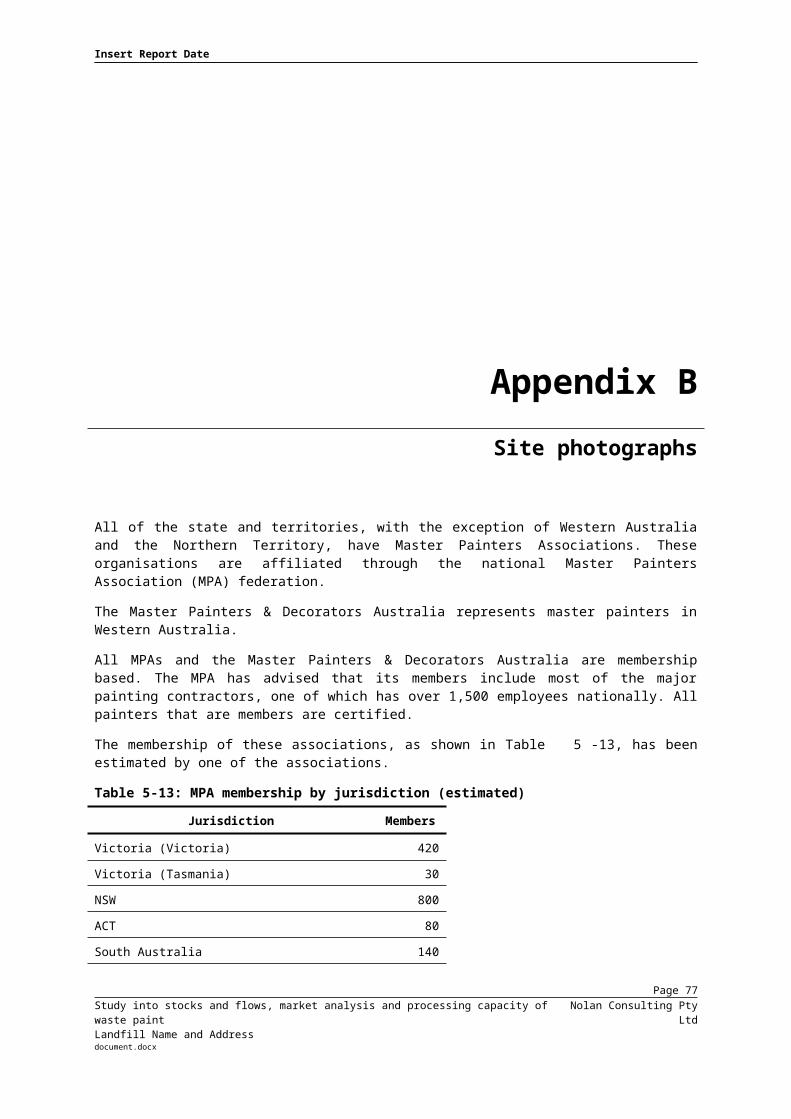
Insert Report Date
Appendix BSite photographs
Based upon the above research, the following estimates waste paint in kerbside garbage have been assumed for the MFA: ACT: 0.05% Victoria: 0.08% NSW: 0.14% All other states 0.10%The proportion of the garbage stream that is assumed to be waste paint in the other States (Northern Territory, Queensland, South Australia, Tasmania, and Western Australia) is the mean of the above recent Victorian and NSW audit estimates For comparison purpose the results of major kerbside garbage audits undertaken in Victoria, South Australia, NSW and Southern Tasmania in the early to mid-2000’s and reported by Nolan-ITU (2004) are presented in Table 6-23.Table 6-23: Paint residue and cans as a percentage of the total garbage stream
Audit Year Households Audited Paint Component
Victoria 2004 400 0.10%
South Australia 2002 1,330 0.21%
NSW 2003 400 0.09%
Southern Tasmania 2002 352 0.02%
Weighted Average - - 0.15%
In aggregate the adopted 2012/13 estimates are slightly lower than the 2002/03 audit estimates possibly as a result of the expansion in HHC collection programs.
Page 81Study into stocks and flows, market analysis and processing capacity of waste paintLandfill Name and Address
Nolan Consulting Pty Ltddocument.docx
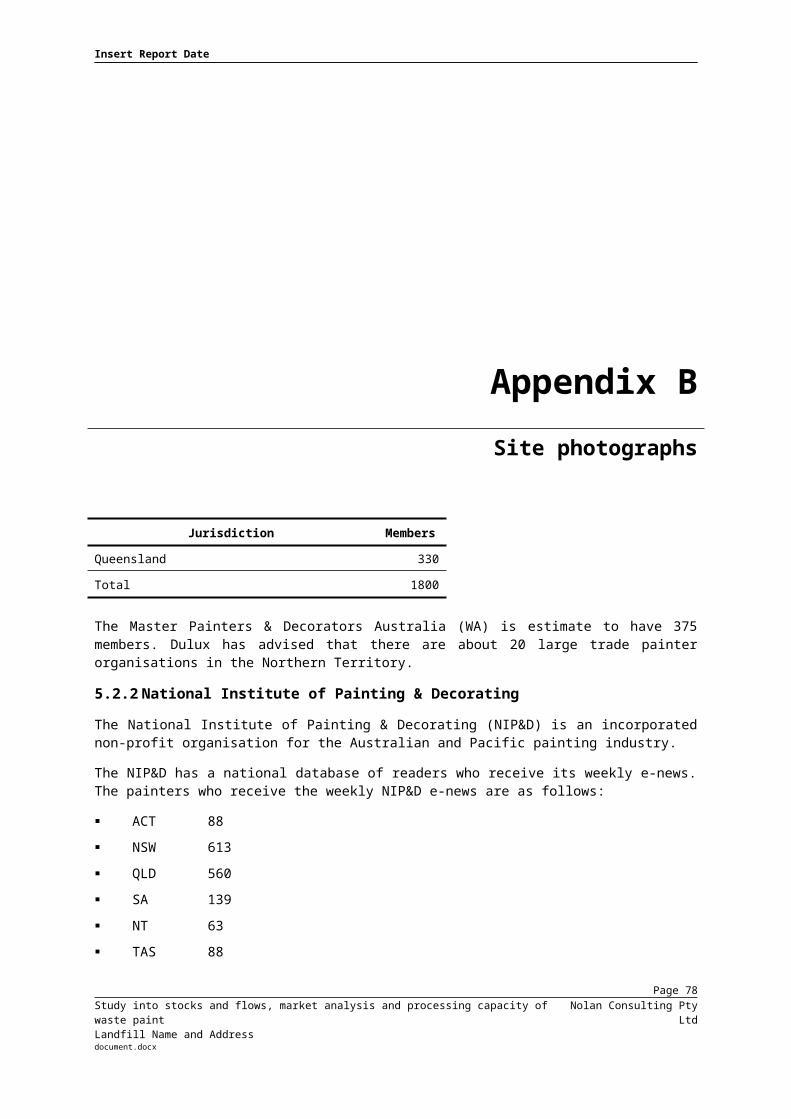
Insert Report Date
Appendix BSite photographs
6.3.2 Kerbside recyclingKerbside recycling services are now provided to most Australian households. Most Councils designate steel cans as a material that can be recycled through the kerbside service. Most Councils neither encourage nor discourage households from placing steel paint cans in with the kerbside recyclables. Where such information is provided it typically advises that any minor residual paint should be dry.All tin-plate steel paint cans in the kerbside recycling stream are recovered by magnetic separation at materials recovery facilities (MRFs) and sent for reprocessing.APC Environmental Management (2009)“Kerbside domestic waste and recycling audit”, for ACT No Waste, December 2009 found that hazardous wastes (paint, fluorescent lights and batteries) were found in the ACT’s kerbside recycling stream,The Australian Packaging Covenant (2013) “Annual Report 2013” determined that 44,100 tonnes of steel cans were recovered nationally in 2012/13. Audits of steel paint cans recovered at Victorian and NSW MRFs were carried out by Nolan-ITU (2004). The total steel can material audited was 1.94 tonnes of which 22.8 kg (1.18%) was paint cans and dried paint.
Page 82Study into stocks and flows, market analysis and processing capacity of waste paintLandfill Name and Address
Nolan Consulting Pty Ltddocument.docx

Insert Report Date
Appendix BSite photographs
Based upon the Nolan-ITU (2004) data, and in the absence of more recent audit data, it is estimated that there was about 520 tonnes of waste paint can recovery in 2012/13 through kerbside recycling collections. As the total national kerbside recycling rate for 2012/13 is estimated to be 6,257,853 tonne the waste paint composition across the total recycling stream is 0.008%. This is applied uniformly across all jurisdictions.
6.3.3 Industrial wasteFor the purposes of this study industrial waste includes commercial and industrial (C&I) waste, and construction and demolition (C&D) waste.Limited audit data is available to determine the waste paint fractions for these waste streams.The only relevant data source found is the NSW DECCW (2010) “Disposal based survey of the commercial and industrial waste stream in Sydney”.
Between June and August 2008, DECCW surveyed loads of mixed C&I waste that arrived at six landfills and six transfer stations in Sydney. This included visually assessing C&I loads at the selected 12 waste sites, and sorting by weight garbage bags generated by eight selected industry sectors that were dropped off at nine of the sites. For the mixed load surveys waste paint waste found be less than 0.2% of 'Other' wastes which is 2.0% of the total mixed load waste stream. As all or the wastes within the table of other wastes presented in NSW DECCW (2010) total a maximum of 7.2%, the waste paint share is estimated as 0.2*2/7.2 (0.056%). For the purpose if the MFA this is rounded down to 0.05 % as an acknowledgement that the 0.056% is an upper limit estimate based upon the data.
Page 83Study into stocks and flows, market analysis and processing capacity of waste paintLandfill Name and Address
Nolan Consulting Pty Ltddocument.docx

Insert Report Date
Appendix BSite photographs
The NSW EPA (2013c) advised that only extremely low amounts of paint are recorded as single material loads disposed at landfills (<5 tonnes in the Sydney Metropolitan Area for municipal waste and less that 5 tonnes for commercial and industrial waste). Based upon the total C&I waste stream sent to landfill in Sydney in 2007/08 of 2,223,856 tonnes, less than 5 tonne equates to 0.00022%. This is insignificant.There is no direct survey or audit data available for waste paint in the C&I recycling or the C&D waste and recycling streams.In the absence of any reliable survey data the proportion of waste paint in the C&I and C&D recycling streams is assumed to be 0.01%. This is the mean waste paint composition estimated across the nation for kerbside recycling.In the absence of any reliable survey data the proportion of waste paint in the C&D landfill streams is assumed to be 0.05%. This is the estimated waste paint composition in the C&I waste to landfill stream.
6.3.4 Other municipal wasteThe compositional analysis of other municipal wastes is largely based upon research undertaken by Nolan-ITU (2014).
Hard wasteThe quantity of waste paint disposed of through hard waste collections is based upon surveys carried out by Nolan-ITU in inner urban, middle suburbs and new emerging urban fringe areas during March 2004. A total of 824 households that had access to a hardwaste collection the within the next one or two days were surveyed.The total mass of waste paint was equivalent to 0.071 kg for each household provided with a hard waste collection service.
Page 84Study into stocks and flows, market analysis and processing capacity of waste paintLandfill Name and Address
Nolan Consulting Pty Ltddocument.docx

Insert Report Date
Appendix BSite photographs
The composition has then been calculated by multiplying this per household weight by the number of household serviced and dividing by the total quantity of hard waste collected within the jurisdiction.The estimated composition applied to each jurisdiction is presented in Table 6-24. Table 6-24: Estimated fraction of waste paint in hard waste collections
State Fraction
ACT 0.11%
NSW 0.10%
QLD 0.10%
SA 0.09%
TAS 0.11%
VIC 0.10%
WA 0.08%
No information on hard waste recovery in the Northern Territory was discovered during data collection for this study.
Household skipsA survey of skips from eighty four sites across Melbourne, including a wide range of sources, was conducted in April 2004 by Nolan-ITU (2004).
Page 85Study into stocks and flows, market analysis and processing capacity of waste paintLandfill Name and Address
Nolan Consulting Pty Ltddocument.docx

Insert Report Date
Appendix BSite photographs
The percentage of the surveyed waste that was waste paint, including containers, was 0.055%. In all 65.6 kg of waste paint, including containers, was found in the 119 tonne of waste.Paint residue and cans is a smaller fraction of the total waste from household skips when compared to self-hauled waste. This reflects the higher volume of soils, concrete, timber and other materials that dominate this disposal route.APC Environmental Management (2011) undertook a Skip bin waste composition audit at Mugga Lane Landfill on behalf of ACT NoWaste in 2011.The audit was carried out over five days to represent weekday activity of loads delivered to the landfill from skip bins. 210 skips were visually audited. Of these loads 70% was delivered by seven contractors. In total 52% of waste conveyed was from domestic origins, 28% from construction and demolition (C&D) and 15% commercial and industrial (C&I)waste. In all 0.059% of the waste paint from the skips was assumed to be recoverable. On the basis of all information the MFA assumes that 0.055% of the household skip waste is waste paint.
Self haulThe fraction of waste paint disposed of through self-haul to transfer stations and landfills is based upon surveys carried out by Nolan-ITU (2004) in inner urban, middle suburbs and new emerging urban fringe areas during March 2004. At a number of sites householders disposed of both empty/dry paint cans and liquid paint, even where this material is not allowed. At most sites there is no opportunity for recovery and therefore the material is landfilled. At a small number of sites staff actively recover steel, including paint cans, for recycling. The quantity of paint waste self-hauled to landfill was determined from audits of 191 vehicles.
Page 86Study into stocks and flows, market analysis and processing capacity of waste paintLandfill Name and Address
Nolan Consulting Pty Ltddocument.docx

Insert Report Date
Appendix BSite photographs
A total of 79 cans were recorded. Based upon empty clean steel can weights, the total weight of the steel cans was 44.6 kg, liquid paint was 38 kg, and dry paint was 11.1 kg. As the total load was 52.9 tonne this equates to a waste paint fraction of 0.176%.This estimate is well above current expectations and is higher than the hard waste and skip estimates. It is considered that the skip estimate of 0.055% is a more realistic current estimate.
6.4 Proportion of waste paint that is packagingAll the identified reporting of audited waste paint material aggregates both the waste paint and the paint packaging.The assumed proportions of the waste paint by weight that is can and paint (liquid and dry residues) for each of the disposal and recovery routes proportions are presented in Table 6-25.Table 6-25: Mass of product (as percentages)
Disposal and Recovery Route % Product by Weight
Packaging Liquid Paint
Dry Residue
Kerbside collected garbage 75 0 25
Kerbside collected recyclables 75 0 25
Kerbside collected hard waste 75 0 25
Self haul to transfer station and landfills 47 41 12
Household skips 47 41 12
Page 87Study into stocks and flows, market analysis and processing capacity of waste paintLandfill Name and Address
Nolan Consulting Pty Ltddocument.docx

Insert Report Date
Appendix BSite photographs
Disposal and Recovery Route % Product by Weight
Packaging Liquid Paint
Dry Residue
Household chemical collection programs 30 62.5 7.5
C&I and C&D waste 67 0 33
C&I and C&D recyclables 67 0 33
Liquid waste treatment plants 25 68.7 6.3
Sewer disposal (paint only) 0 100 0
These proportions are generally consistent with the Nolan-ITU (2004) estimates which were determined by a range of methods including advice from third parties, observations of residual amounts, and by direct weighing. Sustainability Victoria (2010) report that packaging within the DYH program collections is about 30% of the total weight.The minor adjustments only apply to the kerbside disposal and recovery routes and reflect the greater proportion of plastic packaging that is now sold into the market. This has resulted in a reduction in the packaging component from 80% to 75%.
6.5 Paint densitySpecific gravity estimates for water and solvent based paint are presented in Section 3.3.6. The Nolan–ITU (2004) assumption that the equivalent liquid weight for dry paint residue (water and solvent based) is twice the weight of the dry residue has been applied to the MFA.
Page 88Study into stocks and flows, market analysis and processing capacity of waste paintLandfill Name and Address
Nolan Consulting Pty Ltddocument.docx

Insert Report Date
Appendix BSite photographs
6.6 Processing at liquid waste treatment plantsThe low quantity of waste paint received at liquid waste treatment facilities that is sourced directly from householder drop offs (less than 1% of that sourced from transfer stations) is considered to be due to the cost of disposal and access to HHC collection programs. For the purpose of this study this is assumed to be zero.The quantity of trade painter sourced waste paint received at these facilities is estimated to be 320 tonne/year based upon the analysis of the trade painter survey. For comparison purposes the 2013 six month Victorian PaintCare trial generated 128 tonne over 6 months.
6.7 Illegal dumpingNolan-ITU (2004) referenced the Monash Centre for Environmental Management (1997) report titled “The Potential for Reduction and Recovery of Waste Paint in Melbourne”. This study referred to 22 000 L/year of waste paint being disposed of illegally via stormwater and sewer drains within metropolitan Melbourne. This converted to 148 tonne/yr nationally on a pro rata population basis.In its 2011 submission to the ACCC Melbourne Water advised that it supported the voluntary product stewardship scheme but did not provide any information on sewerage & stormwater system waste paint loadings.
Page 89Study into stocks and flows, market analysis and processing capacity of waste paintLandfill Name and Address
Nolan Consulting Pty Ltddocument.docx
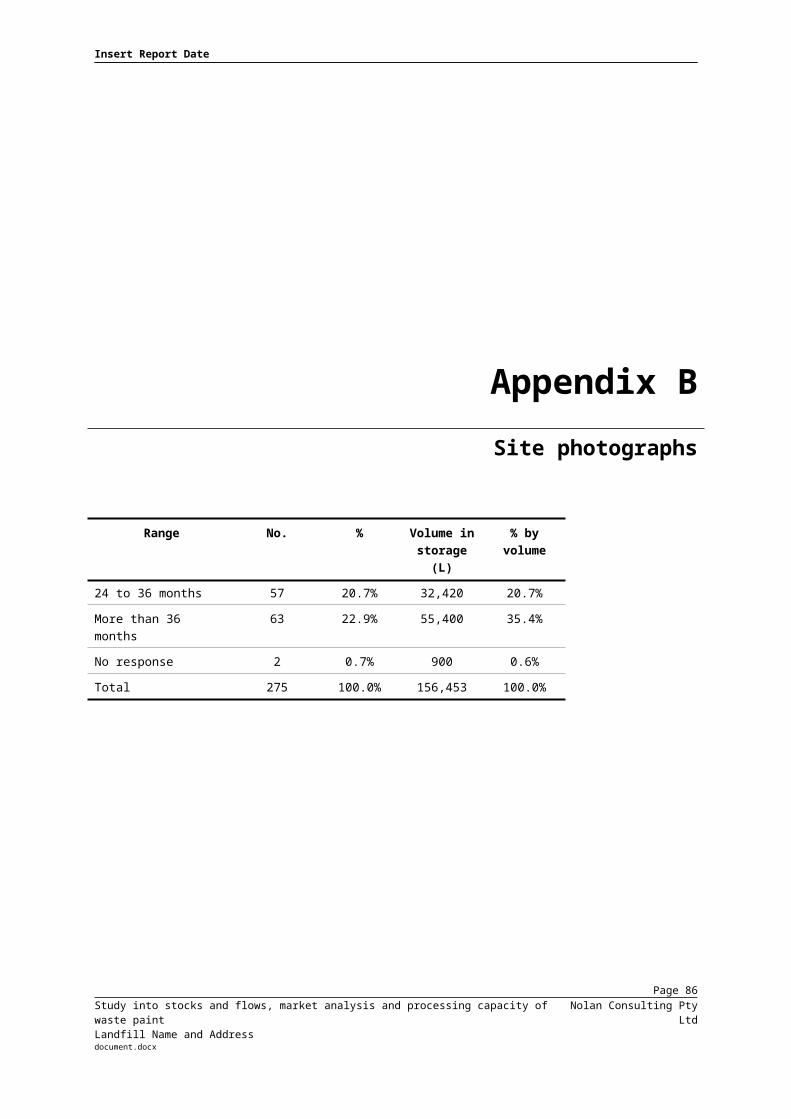
Insert Report Date
Appendix BSite photographs
South East Water advised that waste paint disposal to sewer and stormwater is not an active focus of research. The water industry recognises the challenges of managing contaminants from diffuse sources such as domestic properties (South East Water pers. comm., 2014). As a result, they rely on community education and HHC collection programs. It has been identified that the increase in resource recovery opportunities may result in a short term increase in the discharge of paint to sewer. The increase would be driven by customers cleaning out their paint tins prior to disposal for recycling. In the response to this risk the water industry may elect to increase its education campaigns. The water industry advocates appropriate labelling on paint packaging to educate customers not to wash paint down the drain.Sydney Water also advised that waste paint is not a focus of research as it is not considered to be a major concern. Its focus is on grease trap wastes from shopping centres and petrol stations. Sydney Water is unaware of any investigations of illegal disposal to stormwater and sewer in recent years. This is considered to be due to improved consumer awareness. Sydney Water advised that it would be extremely difficult to identify an illegal disposal of water based paint unless it entered a small treatment plant. The Water Corporation of Western Australia advised that waste paint is not a topic that comes up frequently as there are few reports of illegal disposal incidents. The Water Authority advised that the local authorities have good household hazardous waste collection services and education programs in place.In conclusion there is no evidence to suggest that illegal waste paint disposal to sewer and water is significant. Further the rate of disposal via these pathways is likely to have fallen over the last decade as a result of education and the access to HHC collection programs.
Page 90Study into stocks and flows, market analysis and processing capacity of waste paintLandfill Name and Address
Nolan Consulting Pty Ltddocument.docx

Insert Report Date
Appendix BSite photographs
The trade painter survey data estimated that about 10 tonne/yr was illegally disposed of (to sewer and stormwater as well as on the ground). The household sourced waste paint disposed to sewer and stormwater in 2012/13 is assumed to be 90 tonne/yr. This represents about a 40% reduction from the Nolan-ITU (2004) estimate which is indicative of industry advice that illegal disposal is a lesser problem now that it may have been a decade ago.
Page 91Study into stocks and flows, market analysis and processing capacity of waste paintLandfill Name and Address
Nolan Consulting Pty Ltddocument.docx
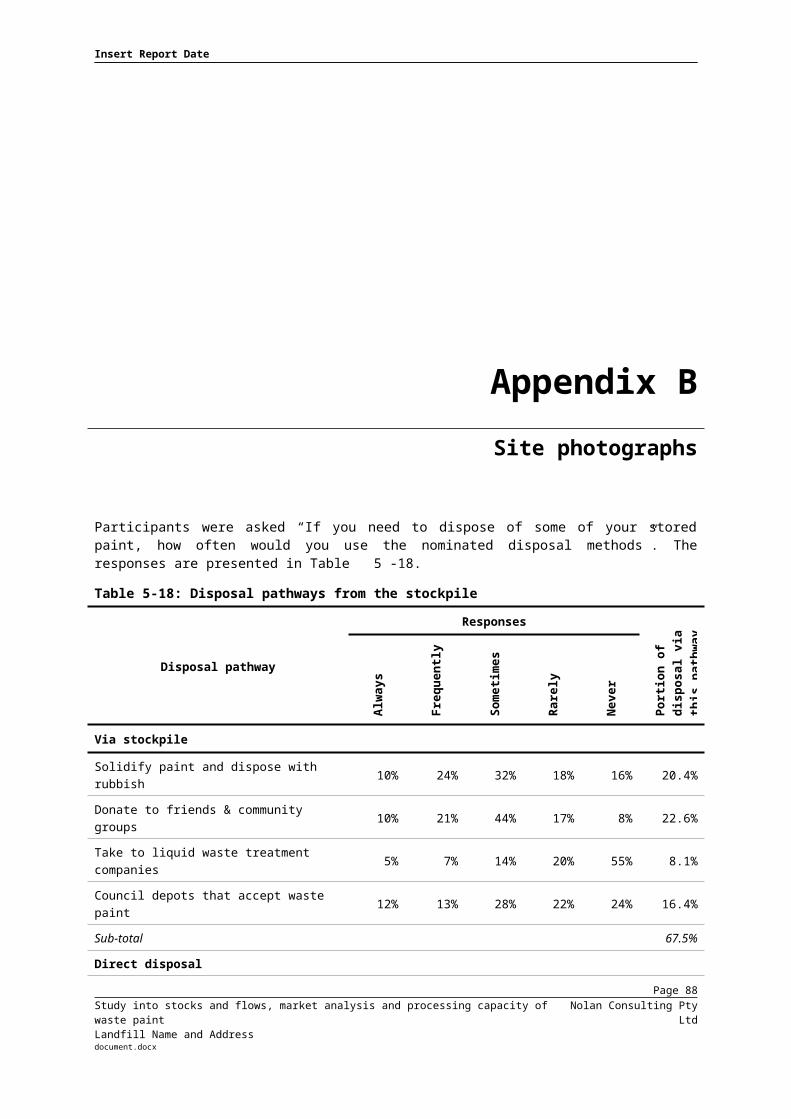
Insert Report Date
Appendix BSite photographs
7. Material flow outcomesKey outcomes – material flows
The primary outcome of the material flow analysis is the allocation of waste paint to the various pathways including stockpiling and disposal.
Table 7-26: Storage and disposal as a percentage of sales by weight (paint only)
Pathway2002/03 2012/13
Retail Retail Trade Total
Total Sales (tonne) 72,501 84,820 111,755 196,575
Use 89.4% 92.2% 93.2% 92.8%
Annual increase in storage (paint only) 6.1% 0.8% 1.3% 1.1%
Disposal/recycling route
Kerbside garbage 2.5% 3.2% - 1.4%
Kerbside recycling 0.2% 0.3% - 0.1%
Kerbside hardwaste 0.2% 0.4% - 0.2%
Self-haul of waste by householders 0.7% 0.6% - 0.2%
Skips to landfills/ transfer stations from residential sites 0.1% 0.1% - 0.0%
Household hazardous chemical (HHC) collections 0.6% 2.3% - 1.0%
Page 92Study into stocks and flows, market analysis and processing capacity of waste paintLandfill Name and Address
Nolan Consulting Pty Ltddocument.docx

Insert Report Date
Appendix BSite photographs
Trade hazardous chemical (THC) collections - - 0.2% 0.1%
Trade paint to landfill (C&I sources) - - 2.1% 1.2%
Trade paint to recycling (C&I sources) - - 0.5% 0.3%
Trade paint to landfill (C&D sources) - - 1.9% 1.1%
Trade paint to recycling (C&D sources) - - 0.7% 0.4%
Illegal dumping (retail) 0.2% 0.1% 0.0%
Illegal dumping (trade) - - 0.0% 0.0%
Total disposal 4.6% 7.0% 5.5% 6.1%
The significant increase in the HHC collection programs over the past decade, from 0.6% to 2.3% of retail sales, has resulted in a reduction in the rate of stockpile increase from 6.1% to 0.8%.
The increase in retail disposal/recycling from 4.6% in 2002/03 to 7.0% in 2012/13 is due to the increase in collection through the HHC collection programs. This has also resulted in a significant reduction in the rate of stockpile increase.
More waste paint is disposed of to landfill via the kerbside garbage system than is recovered by the HHC collection programs.
The rate of increase in the trade waste paint stockpile is estimated to be 60% greater than for the retail sector. This is in part due to limited access to designated drop off points.
Trade painters have confirmed that the trade paint stockpile is increasing.
Page 93Study into stocks and flows, market analysis and processing capacity of waste paintLandfill Name and Address
Nolan Consulting Pty Ltddocument.docx

Insert Report Date
Appendix BSite photographs
7.1 PurposeThe data underpinning the MFA is presented in Sections 3 to 6 of this report. The outcomes of the MFA are presented in this section. While the focus of the assessment is the present day material flows, a 10 year projection in the change of the retail and trade waste paint stockpile has been made.The primary data sources are in Section 4 for HHC collection program, Section 5 for trade waste paint disposal and Section 6 for all other waste paint disposal and recycling pathways.
7.2 Overview of key calculationsThe consumption data is as provided through the GfK surveys. The calculation methods used to determine the disposal quantities are described in Sections 4 to 6.The change in storage is estimated through the difference between paint packaging sales and paint packaging disposal via all of the disposal pathways. The total change in the stockpile is then calculated by adding the weight of the paint. The paint use is then calculated as consumption less disposal and less any increase in storage.
7.3 Disposal and recycling pathwaysA summary of the 2012/13 material flows is presented in Table 7-2.Figure 7-5 presents the estimated 2012/13 disposal and recycling quantities for all retail disposal pathways.
Page 94Study into stocks and flows, market analysis and processing capacity of waste paintLandfill Name and Address
Nolan Consulting Pty Ltddocument.docx

Insert Report Date
Appendix BSite photographs
Figure 7-5: Retail waste paint estimated 2012/13 disposal and recycling pathways
This indicates that while the HHC collection programs have been successful, there is still a large quantity disposed of to landfill via the kerbside garbage system.
Page 95Study into stocks and flows, market analysis and processing capacity of waste paintLandfill Name and Address
Nolan Consulting Pty Ltddocument.docx

Insert Report Date
Appendix BSite photographs
Table 7-27: Summary of 2012/13 waste paint material flows
Page 96Study into stocks and flows, market analysis and processing capacity of waste paintLandfill Name and Address
Nolan Consulting Pty Ltddocument.docx

Insert Report Date
Appendix BSite photographs
The relative proportions of the disposal and recycling pathways presented in Figure 7-1 are of a similar order to that presented in the Australian Bureau of Statistics survey on Environmental Issues: Waste Management, Transport and Motor Vehicle Usage of Mar 2012. This survey reported on household disposal pathways for waste paint and their containers. Responses, as shown in Table 7-3 were obtained from 974,600 households.Table 7-28: ABS 2012 survey - Ways households disposed of waste paint and their containers
Disposal pathway Proportion (%)
Collected from house as part of municipal kerbside recycling 13.6
Collected from house with the usual (non-recycled) garbage 34.8
Collected from house by a special service 5.2
Took it to a general/special area at the dump/waste transfer station 37.9
Took it to a business or shop/central point 8.3
Poured down the drain -(1)
Buried/gave away/sold 1.7
Other 1.2(1) Not available for publication, therefore assumed to be less than 1%.
Figure 7-6 presents the estimated 2012/13 disposal and recycling quantities for all trade paint disposal pathways. While the overall quantities are lower than for the retail waste paint, there is significant disposal to landfill.
Page 97Study into stocks and flows, market analysis and processing capacity of waste paintLandfill Name and Address
Nolan Consulting Pty Ltddocument.docx
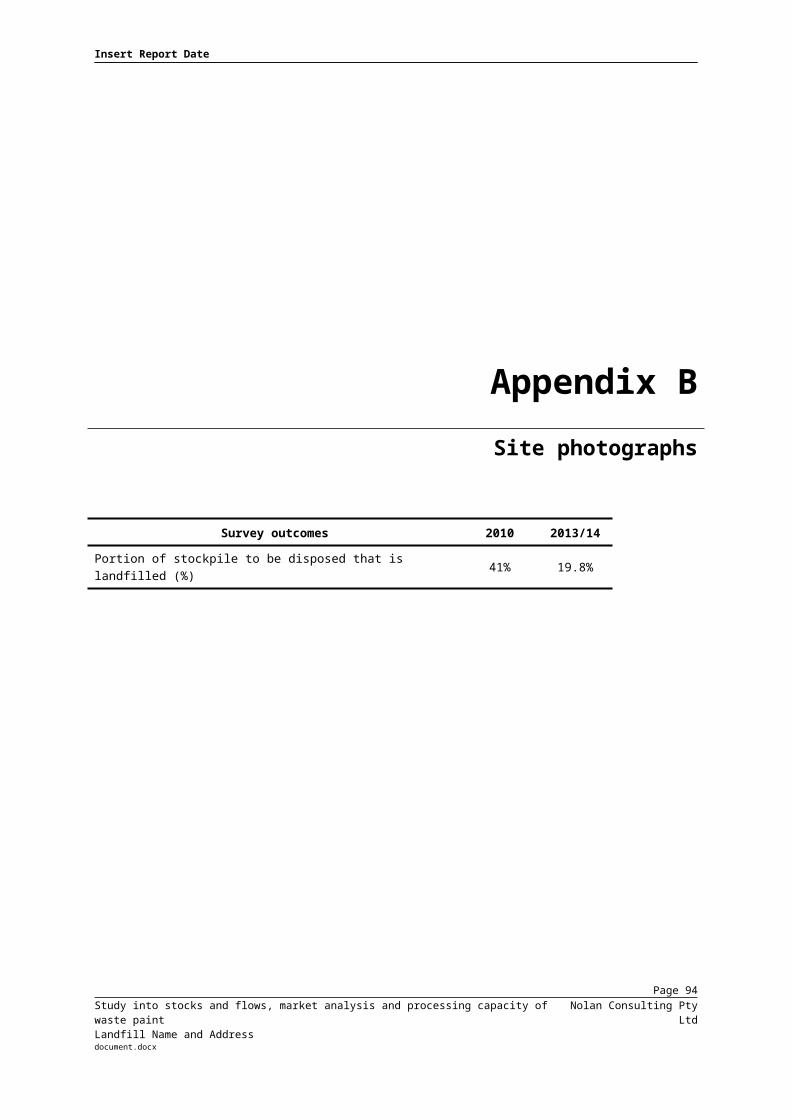
Insert Report Date
Appendix BSite photographs
Figure 7-6: Trade waste paint estimated 2012/13 disposal and recycling pathways
Figure 7-7 presents the estimated 2012/13 disposal and recycling quantities for all retail and trade paint disposal pathways. This confirms the significant opportunity to improve in waste paint recovery particularly from the waste streams being disposed of to landfill.
Page 98Study into stocks and flows, market analysis and processing capacity of waste paintLandfill Name and Address
Nolan Consulting Pty Ltddocument.docx

Insert Report Date
Appendix BSite photographs
Figure 7-7: Total waste paint estimated 2012/13 disposal and recycling pathways
Figure 7-8 presents the breakdown of the disposal and recycling quantities into water and solvent based paint as well as packaging.
Page 99Study into stocks and flows, market analysis and processing capacity of waste paintLandfill Name and Address
Nolan Consulting Pty Ltddocument.docx
Insert Report Date
Appendix BSite photographs
Figure 7-8: Total waste paint estimated 2012/13 disposal and recycling water and solvent based waste paint and packaging estimates
It is evident that water based paint should be the primary focus of the voluntary stewardship scheme and that consideration also need to be given to the packaging.Figure 7-9 presents the estimated paint consumption, use, storage, and disposal 2012/13 ratios for retail, trade and total (as percentages).
Page 100Study into stocks and flows, market analysis and processing capacity of waste paintLandfill Name and Address
Nolan Consulting Pty Ltddocument.docx

Insert Report Date
Appendix BSite photographs
Figure 7-9: Estimated paint consumption, use, storage, and disposal 2012/13 ratios for retail, trade and total (as percentages)
The storage and disposal estimates for the paint only, as fractions of consumption are presented in Table 7-1 for 2012/13. This table also compares the 2002/03 estimates for the retail sector.The slight increase in retail disposal/recycling from 4.6% in 2002/03 to 6.8% in 2012/13 is due to the increase in collection through the HHC collection programs. This has also resulted in a significant reduction in the rate of stockpile increase.
Page 101Study into stocks and flows, market analysis and processing capacity of waste paintLandfill Name and Address
Nolan Consulting Pty Ltddocument.docx

Insert Report Date
Appendix BSite photographs
Trade painters have confirmed that there is the trade paint stockpile is increasing.
7.4 Trends in stockpilingAs the annual paint sales are assumed to be static over the next decade and without an increase in the waste paint collections, with or without a stewardship program, the only projection than can be made is the change in storage.Very indicative estimates of the size of the stockpile of waste paint have been estimated by assuming: any stockpiled paint that is more than 10 years old is excluded; and the annual stockpile increases, as of 2012/13, are as shown in Table 7-27.Figure 7-10 presents the retail, trade and total stockpile projections for the next decade.
Page 102Study into stocks and flows, market analysis and processing capacity of waste paintLandfill Name and Address
Nolan Consulting Pty Ltddocument.docx
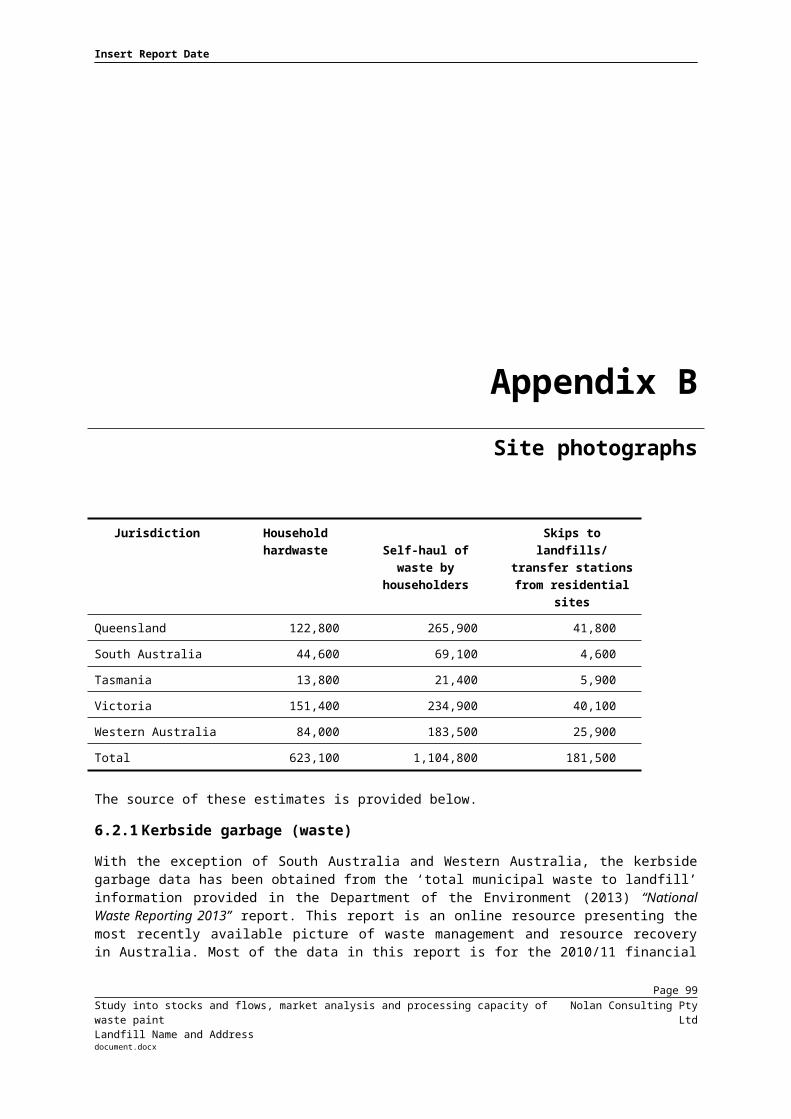
Insert Report Date
Appendix BSite photographs
Figure 7-10: Retail, trade and total stockpile projections (waste paint only) –
2012/13 to 2022/23 – Do nothing case
The projected 2012/13 trade waste paint stockpile of 17,000 tonne is significantly greater than estimated in the trade painter survey. Further research into the quantity of waste paint in both the retail and trade stockpiles is recommended.
Page 103Study into stocks and flows, market analysis and processing capacity of waste paintLandfill Name and Address
Nolan Consulting Pty Ltddocument.docx
Insert Report Date
Appendix BSite photographs
8. Data reliabilityThe reliability of key and significance of key data used in the MFA is presented in Table 8-1. Table 8-29: Data reliability
Data Accuracy Significance
Comment
Sales H H Provided by Industry
HHC collection program quantities M-H H Accurate in all states, except for some Queensland Councils and Northern Territory.
Waste paint in kerbside garbage M H Based upon audit data from most jurisdictions.
Waste paint in kerbside recycling L-M M Based upon audit data from only a few jurisdictions.
Waste paint in C&I and C&D waste streams
L H Very limited data based upon NSW audit.
Waste paint to packaging ratios in HHC collections
M-H M-H Provided through HHC program reporting.
Waste paint to packaging ratios in other disposal routes
L M-H Based upon 2003 audits, Nolan Consulting developed estimates, and some
Page 104Study into stocks and flows, market analysis and processing capacity of waste paintLandfill Name and Address
Nolan Consulting Pty Ltddocument.docx

Insert Report Date
Appendix BSite photographs
industry verification.
Current stockpile estimates L M-H Current estimates based upon MFA modelling with limited verification available.
It is recommended that the highest priorities for future data collection focus on: auditing for waste paint in C&I and C&D waste and recycling streams; survey to estimate waste paint to packaging ratios for the key disposal routes; and physical survey to assist in quantifying current stockpiles.
Page 105Study into stocks and flows, market analysis and processing capacity of waste paintLandfill Name and Address
Nolan Consulting Pty Ltddocument.docx

Insert Report Date
Appendix BSite photographs
9. Conclusions9.1 Sales1. 152.7 million litres of water based and solvent based A&D paints, including imports,
was sold into the Australian market in 2012/13. Retail sales accounted for 43% of all sales. The paint to be included in the voluntary product stewardship scheme as per the waste paint definition accounted for 126.7 million litres in 2012/13.
2. 94% of the paint sales proposed to be subject to the voluntary product stewardship scheme is A&D paint. The remaining six percent is woodcare products (wood stains, lacquers, and oils).
3. 90% of paint sales are water based paints with remaining 10% being solvent based. The solvent based paints are less widely used than a decade ago.
4. On a volumetric basis, 68% of paint is sold in steel packaging with 32% sold in plastic packaging. The plastic packaging is currently limited to 10 L and 15 L units and is typically about 65% of the weight of steel packaging for the equivalent packaging unit size.
5. The specific gravity of paint is about 1.3 kg/L for water based paint and about 1.2 kg/L for solvent based paint.
6. The proportion of total paint sales, by volume, that are retail sales has fluctuated around an average of about 40% over the past decade. It has increased from 38% in 2008/09 to 43.5% in 2012/13.
7. Based upon historical trends zero growth in paint sales is assumed over the next decade.
9.2 Current systems and processes
Page 106Study into stocks and flows, market analysis and processing capacity of waste paintLandfill Name and Address
Nolan Consulting Pty Ltddocument.docx
Insert Report Date
Appendix BSite photographs
8. All Household Hazardous Chemical (HHC) collection programs include waste paint.9. Victoria, NSW, South Australia and Western Australia have State sponsored HHC
collection programs. HHC collection programs in Queensland, the ACT and the Northern Territory are provided by individual Councils. No formal HHC collection program with waste paint treatment is currently provided in Tasmania.
10. HHC collections occur from temporary (mobile) and permanent drop off sites.11. In 2012/13 a total of 2,760 tonne of waste paint, including packaging, is estimated
to have been collected through the HHC programs across the nation. This is an increase of over 2,200 tonne since 2003/04. The States of NSW, Victoria and Queensland collect close to 80% of 2012/13 total.
12. Apart from the PaintCare trial undertaken in Victoria in 2013 there have been no dedicated collection programs for waste paint generated by trade painters.
13. Most solvent based waste paint is either used as a high calorific value fuel source for cement kilns or is distilled to recover solvents for reuse with the residual sludge generally used as a fuel source.
14. Most water based waste paint is immobilised and disposed of to landfill with the bulk of the remainder being used as a low calorific value fuel source.
15. Research is underway to develop new treatment and recycling pathways for waste paint with a particular focus on water based paint.
9.3 Trade painter practices16. About 32% of the waste paint in trade painter stockpiles is destined for disposal.
The three most popular disposal pathways from the stockpile are (i) solidify and landfill disposal, (ii) donation and (iii) Council drop off site. The primary direct disposal pathway is to leave the waste paint with the customers.
Page 107Study into stocks and flows, market analysis and processing capacity of waste paintLandfill Name and Address
Nolan Consulting Pty Ltddocument.docx

Insert Report Date
Appendix BSite photographs
17. The average trade painter business stockpile is 568 L. This is slightly less than the 604 L found as part of the Victorian trade painter survey conducted in 2010.
9.4 Waste paint in disposal and recycling pathways18. The quantity of waste paint in garbage and recyclables put out for collection by
residents and businesses has been estimated from available waste audit data. 19. Waste paint, including packaging, is estimated to range between 0.05% and 0.14%
by weight of household kerbside garbage. Waste paint, including packaging, is estimated to be about 0.008% of household kerbside recyclables.
20. Waste paint in the C&I and C&D waste stream is estimated to be 0.05%, and in the C&I and C&D recycling stream is estimated to be 0.01%.
21. About 320 tonne/year of trade waste paint is estimated to be disposed of to industrial liquid treatment plants.
22. The illegal disposal of waste paint to sewer and stormwater is estimated to be 100 tonne/year. It has fallen over the past decade as a result of education and the access to HHC collection programs.
9.5 Material flows23. 152.7 million litres of water-based and solvent-based A&D paints, including imports,
was sold into the Australian market in 2012/13.24. On average 92.8% by weight of the A&D and woodcare paint that is sold into the
Australian market is used. 25. On average 7.2% by weight of the A&D and woodcare paint that is sold into the
Australian market is waste arising (both stockpiled and paint requiring disposal).
Page 108Study into stocks and flows, market analysis and processing capacity of waste paintLandfill Name and Address
Nolan Consulting Pty Ltddocument.docx
Insert Report Date
Appendix BSite photographs
26. Of this 7.2%, approximately 1.1% of the overall annual paint sales, by weight, contributes to an increase in the waste paint stockpile.
27. Therefore, the remaining 6.1% of paint consumed/sold annually in Australia becomes waste arising, or waste paint requiring disposal.
28. The total waste paint being stockpiled annually in Australia is estimated to be approximately 2,600 tonnes.
29. The total waste paint and packaging requiring disposal in Australia each year is estimated to be approximately 24,200 tonnes.
30. This can be broken down into the following:a) Total waste paint requiring disposal annually in Australia estimated to be
approximately 12,060 tonnes; andb) Total paint packaging requiring disposal annually in Australia estimated to be
approximately 12,130 tonnes.
Page 109Study into stocks and flows, market analysis and processing capacity of waste paintLandfill Name and Address
Nolan Consulting Pty Ltddocument.docx

Insert Report Date
Appendix BSite photographs
31. Of the estimated 12,060 tonnes of waste paint requiring disposal in 2012/13, approximately 87% was water based and 13% was solvent based.
32. The usage ‘efficiency’ of paint sold to the retail market is estimated to have increased by 2.8% since 2002/03.
33. The primary disposal pathway of waste paint is via collection with general waste and disposal to landfill (3.2% of sales for retail and 4.0% for trade).
34. For retail paint, the next largest disposal pathway, at 2.4%, is via the HHC collection system.
35. The significant increase in the HHC collection programs over the past decade, from 0.6% to 2.4% of retail sales, has resulted in a reduction in the rate of stockpile increase from 6.1% to 0.8%.
36. The increase in retail disposal/recycling from 4.6% in 2002/03 to 7.0% in 2012/13 is due to the increase in collection through the HHC collection programs. This has also resulted in a significant reduction in the rate of stockpile increase.
37. The rate of increase in the trade waste paint stockpile is estimated to be 60% greater than for the retail sector. This is in part due to limited access to designated drop off points. Trade painters have confirmed that the trade paint stockpile is increasing.
9.6 Data reliability38. The highest priority for future data collection to enhance the accuracy of the
material flow analysis is considered to be through: auditing for waste paint in C&I and C&D waste and recycling streams;
Page 110Study into stocks and flows, market analysis and processing capacity of waste paintLandfill Name and Address
Nolan Consulting Pty Ltddocument.docx
Insert Report Date
Appendix BSite photographs
survey to estimate waste paint to packaging ratios for the key disposal routes; and
survey to assist in quantifying current stockpiles.
Page 111Study into stocks and flows, market analysis and processing capacity of waste paintLandfill Name and Address
Nolan Consulting Pty Ltddocument.docx
Insert Report Date
Appendix BSite photographs
10. ReferencesABS (2013), “3235.0 Population by Age and Sex, Regions of Australia, 30 June 2012”. Australian Bureau of Statistics. Viewed on 23 January 2014 at:ABS (2012), “Survey on Environmental Issues: Waste Management, Transport and Motor Vehicle Usage of Mar 2012”.APC Environmental Management (2009), “Kerbside Domestic Waste & Recycling Audit”, prepared for ACT NOWaste, December 2009APC Environmental Management (2011), “Skip bin composition audit at Mugga Lane Landfill”, prepared for ACT No Waste, May 2011.Australian Packaging Covenant (2013), “Annual Report 2013”.Australian Paint Manufacturers' Federation (2013), “Paint consumption by the retail and trade sectors from 2003-04 to 2011-12”.Australian Paint Manufacturers' Federation (2014), “Paint packaging weights in 2013”.Department of the Environment (2013), “National waste reporting 2013”, an online resource is available at the following link: http://www.environment.gov.au/node/34859. EC Sustainable (2013), “Victorian Statewide Garbage Bin Audits: Food, Household Chemicals and Recyclables”, prepared for Sustainability Victoria.Global Product Stewardship Council (2013) “The Case for Voluntary Paint Stewardship”, prepared for Sustainability Victoria and the Australian Paint Manufacturers’ Federation.Government of Australia (2011), “Product Stewardship Act 2011”.Hyder Consulting (2013), “Recycling activity in Western Australia 2010-11”, prepared for Department of Environment and Conservation on behalf of the Waste Authority, March 2013.
Page 112Study into stocks and flows, market analysis and processing capacity of waste paintLandfill Name and Address
Nolan Consulting Pty Ltddocument.docx

Insert Report Date
Appendix BSite photographs
Local Government Association of Tasmania (2013),” Strategic Review of the Collection of Household Hazardous Waste in Tasmania”, February 2013.Monash Centre for Environmental Management (1997), “The Potential for Reduction and Recovery of Waste Paint in Melbourne”.Municipal Waste Advisory Council of Western Australia (2012), “Household Hazardous Waste Program Annual Report 01 July 2011 – 30 June 2012”, August 2012.Municipal Waste Advisory Council of Western Australia (2013), “Household Hazardous Waste Program Annual Report 2012/2013”, dated 29 July 2013.Nolan-ITU (2004), “Paint and Paint Can Recovery – National Audit and Strategic Plan”, prepared for the Australian Paint Manufacturers’ Federation.NSW Department of Environment, Climate Change and Water (2010), “Disposal based survey of the commercial and industrial waste stream in Sydney”.NSW EPA (2012), “Household Chemical CleanOut Program - Annual Report 2010–2011”, June 2012.NSW EPA (2013a), “NSW Waste Avoidance and Resource Recovery Strategy 2013–21 (Draft)”.NSW EPA (2013b), “NSW Local Government Waste and Resource Recovery Data Report 2011/12”.NSW EPA (2013c), “NSW waste paint information request response”.Rawtec (2013), “South Australia's Recycling Activity Survey 2011–12 Financial Year Report Zero Waste SA”.Sustainability Victoria (2010), “Paint Product Stewardship Trial Proposal - Victorian Model”, January 2010.Sustainability Victoria (2011), “Detox Your Home Strategic Review Public Report”.
Page 113Study into stocks and flows, market analysis and processing capacity of waste paintLandfill Name and Address
Nolan Consulting Pty Ltddocument.docx

Insert Report Date
Appendix BSite photographs
Swinburne University of Technology (2013) “End‐of‐Life Options for Waste Paint In Australia”, prepared for Sustainability Victoria.ToxFree Solutions Ltd, Sustainability Victoria, Australian Paint Manufacturers Federation, Master Painters Australia (2013) “PaintCare Trade Trial” November 2013.WA Department of Environment and Conservation (2013b), “Local Government Waste and Recycling Census 2010-11”, Perth, Western AustraliaWA Local Government Association (2013), “Household Hazardous Waste Program Annual Report 2012–2013”.WA Waste Authority (2012), “Household Hazardous Waste Program Annual Report 2011–2012”.
Page 114Study into stocks and flows, market analysis and processing capacity of waste paintLandfill Name and Address
Nolan Consulting Pty Ltddocument.docx

Insert Report Date
Appendix BSite photographs
11. Glossary of termsTerm Description
A&D paint Architectural and decorative paint.
ChemClear A collection and disposal pathway for unwanted chemicals from Australian agricultural and veterinary chemical users.
drumMUSTER A recycling pathway for Australian agricultural and veterinary chemical users for eligible empty agvet chemical containers.
Paint Paint is any liquid that, after application to a substrate in a thin layer, converts to a solid film.
Permanent collections Household hazardous chemicals collections from permanent drop off site. Drop off occurs at a regular frequency.
Stockpile Unused paint stored for disposal or recycling.
Temporary collections One-off collections of household hazardous chemicals at temporary sites which may include Council depots. Transfer stations, resource recovery facilities. These collections are often referred to as mobile collections.
Waste paint Unused paint requiring disposal.For the proposed voluntary stewardship scheme it includes all decorative and architectural paints from trade and domestic sources including woodcare products (stains and decking oils) and their respective containers and excludes spray packs (aerosols), bagged render, texture coatings, isocynates, paint strippers, industrial coatings
Page 115Study into stocks and flows, market analysis and processing capacity of waste paintLandfill Name and Address
Nolan Consulting Pty Ltddocument.docx

Insert Report Date
Appendix BSite photographs
and anti-fouling paints.
Woodcare products Stains, oils, and lacquers for internal and external timber.
Page 116Study into stocks and flows, market analysis and processing capacity of waste paintLandfill Name and Address
Nolan Consulting Pty Ltddocument.docx

Insert Report Date
Appendix AStakeholders consulted
Study into stocks and flows, market analysis and processing capacity of waste paintLandfill Name and Address
Nolan Consulting Pty Ltddocument.docx
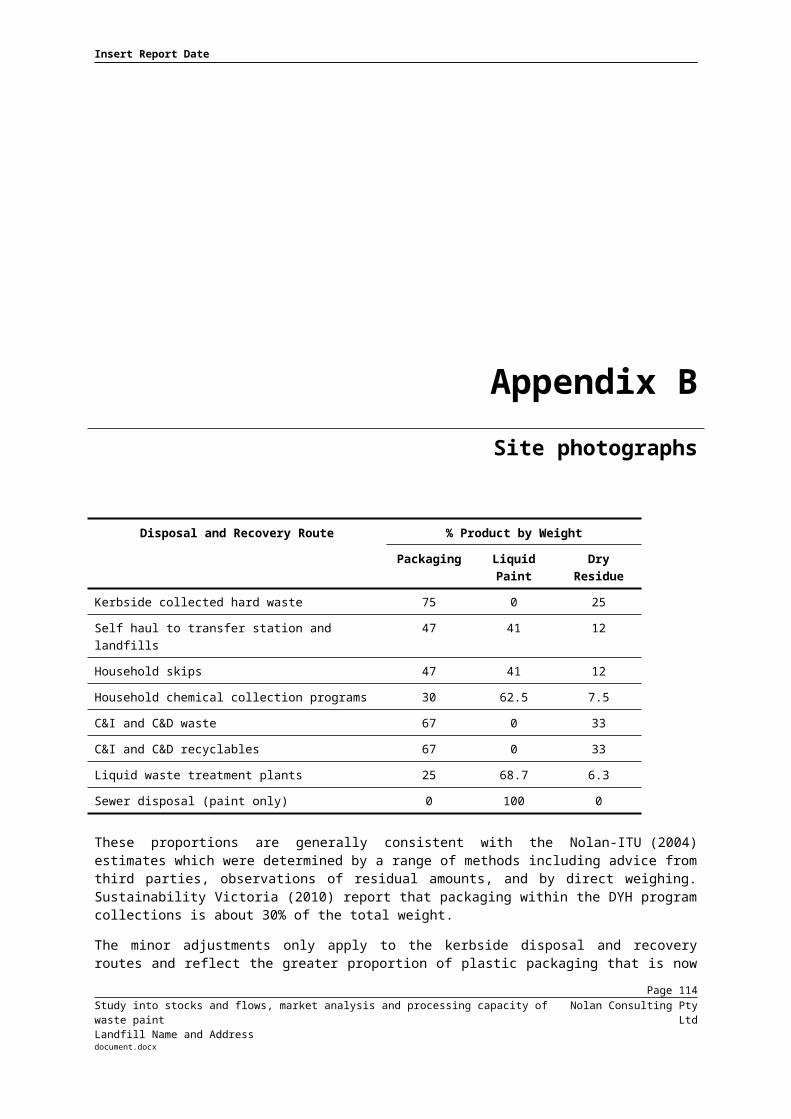
Insert Report Date
Appendix AStakeholders ConsultedThe following organisations assisted Nolan Consulting in the undertaking of this study.
Sector Organisation
Federal agencies Department of Environment (member of WPIWG)
State & Territory Jurisdictions
Sustainability Victoria (WPIWG Secretariat)
Queensland Dept. of Environment & Heritage Protection (member of WPIWG)
NSW Environment Protection Authority
Western Australia Department of Environment Regulation
Zero Waste SA
ACT Environment and Sustainable Development Directorate
Northern Territory Environment Protection Authority
Australian Paint Manufacturers’ Federation(member of WPIWG)
Dulux (member of WPIWG)
Valspar (member of WPIWG)
Retailers Bunnings (member of WPIWG)
Trade Painters Master Painters Association of Victoria and Tasmania (member of WPIWG)
Master Painters Association of NSW
Master Painters Association of Queensland
Master Painters Association of South Australia
Master Painters & Decorators Australia (WA)
National Institute of Painting & Decorating (NIP&D)
Water Authorities Melbourne Water
South East Water
Sydney Water
Water Corporation of WA
Waste paint collectors, treaters, and recyclers
Toxfree
Veolia
Transpacific (Transpacific)
Geocycle
Independent Cement and Lime (ICL)
Study into stocks and flows, market analysis and processing capacity of waste paintLandfill Name and Address
Nolan Consulting Pty Ltddocument.docx

Insert Report Date
Appendix BGraphs of paint sales – 2002/03 to
2012/13
Study into stocks and flows, market analysis and processing capacity of waste paintLandfill Name and Address
Nolan Consulting Pty Ltddocument.docx

Insert Report Date
Appendix BGraphs of paint sales – 2002/03 to 2012/13
Figure B-1: Retail paint consumption as a percentage of total (2002/03 to 2012/13)
Figure B-2: A&D and Woodcare paint sales (2002/03 to 2012/13)
Study into stocks and flows, market analysis and processing capacity of waste paintLandfill Name and Address
Nolan Consulting Pty Ltddocument.docx
Insert Report Date
Appendix CFigures showing municipalities
serviced by HHC collection programs
Study into stocks and flows, market analysis and processing capacity of waste paintLandfill Name and Address
Nolan Consulting Pty Ltddocument.docx

Insert Report Date
Appendix C
List of figures4.1 Victorian municipalities serviced with household chemical collections (including
waste paint) in 2012-134.2 NSW municipalities serviced with household chemical collections (including waste
paint) in 2012-134.3 South Australia municipalities serviced with household chemical collections
(including waste paint) in 20144.4 Tasmanian municipalities serviced with household chemical collections (including
waste paint) from March 2009 – December 20124.5 Western Australian municipalities serviced with household chemical collections
(including waste paint) in 2012-134.6 Queensland municipalities serviced with household chemical collections (including
waste paint) in 2012-134.7 ACT household chemical collections localities (including waste paint) in 2012/134.8 Northern Territory municipalities serviced with household chemical collections
(including waste paint) in 2012-13
Study into stocks and flows, market analysis and processing capacity of waste paintLandfill Name and Address
Nolan Consulting Pty Ltddocument.docx