Clearplan2030 livabilitysurvey results booklet
4
www.clearplan2030.org 20.5% 0.7% 0.5% 75.0% 1.3% 0.1% 1.9% Race Age The following informaon displays the demographics of the people who completed the survey. The survey was posted online at www.clearplan2030.org/surveys and paper copies were distributed at the first round of County Conversaon meengs (Spring of 2013), through the Elementary Schools across the region, and at other various meengs. The racial demographics and age distribuon matches nicely with the regional demographic make up. The region is composed of 74.6% Caucasians and 21.8% African-Americans. 25% < 19 20 — 24 25 — 34 35 — 44 45 — 54 55 — 59 60 — 64 65 — 74 75 — 84 85 + African American American Indian or Alaska Nave Asian Caucasian Hispanic Nave Hawaiian or Other Pacific Islander Two or More Races The work that provided the basis for this publicaon was supported by funding under an award by the U.S. Department of Housing and Urban Development. The Substance and findings of the work are dedicated to the public. The author and publisher are solely responsible for the accuracy of the statements and interpretaons contained in this publicaon. Such interpretaons do not necessarily reflect the views of the Government. 44% 34% 3% 15% 4% The CLEAR Plan 2030 (Community Livability for the East Alabama Region) is a planning project working to improve the livability of all residents in the 10-County East Alabama region the East Alabama Regional Planning and Development Commission serves. As a part of this planning process, a Livability Survey was conducted. Over 5,400 surveys were received between November 1st, 2012 and May 13, 2013, which exceeded the survey goal of 5,000 surveys. This equates to 1% of the Region’s 470,000 residents. The following pages display the survey results. Keep in mind over 44% of respondents said they think of their community as their neighborhood. Therefore, some of these answers are personal opinions and may be neighborhood specific. Neighborhood City Zip Code County Region Summer 2013
description
Â
Transcript of Clearplan2030 livabilitysurvey results booklet

www.clearplan2030.org
20.5%
0.7%
0.5%
75.0%
1.3%
0.1% 1.9% Race
Age
The following information displays the demographics of the people who completed the survey. The survey was posted online at www.clearplan2030.org/surveys and paper copies were distributed at the first round of County Conversation meetings (Spring of 2013), through the Elementary Schools across the region, and at other various meetings. The racial demographics and age distribution matches nicely with the regional demographic make up. The region is composed of 74.6% Caucasians and 21.8% African-Americans.
25%
< 19 20 — 24 25 — 34 35 — 44 45 — 54 55 — 59 60 — 64 65 — 74 75 — 84
85 +
African American
American Indian or Alaska Native
Asian
Caucasian
Hispanic
Native Hawaiian or Other Pacific Islander
Two or More Races
The work that provided the basis for this publication was supported by funding under an award by the U.S. Department of Housing and Urban
Development. The Substance and findings of the work are dedicated to the public. The author and publisher are solely responsible for the accuracy
of the statements and interpretations contained in this publication. Such interpretations do not necessarily reflect the views of the Government.
44%
34%
3%
15%
4%
The CLEAR Plan 2030 (Community Livability for the East Alabama Region) is a planning project working to improve the livability of all residents in the 10-County East Alabama region the East Alabama Regional Planning and Development Commission serves. As a part of this planning process, a Livability Survey was conducted. Over 5,400 surveys were received between November 1st, 2012 and May 13, 2013, which exceeded the survey goal of 5,000 surveys. This equates to 1% of the Region’s 470,000 residents. The following pages display the survey results. Keep in mind over 44% of respondents said they think of their community as their neighborhood. Therefore, some of these answers are personal opinions and may be neighborhood specific.
Neighborhood
City
Zip Code
County
Region
Summer 2013
Legend
Don’t Know Most/All Some None/Few
Affordable
health care
Accessible
health care
A safe &
secure place
to live
Healthy
environment
Healthy food
Exercise &
recreation
promoting a
healthy
lifestyle
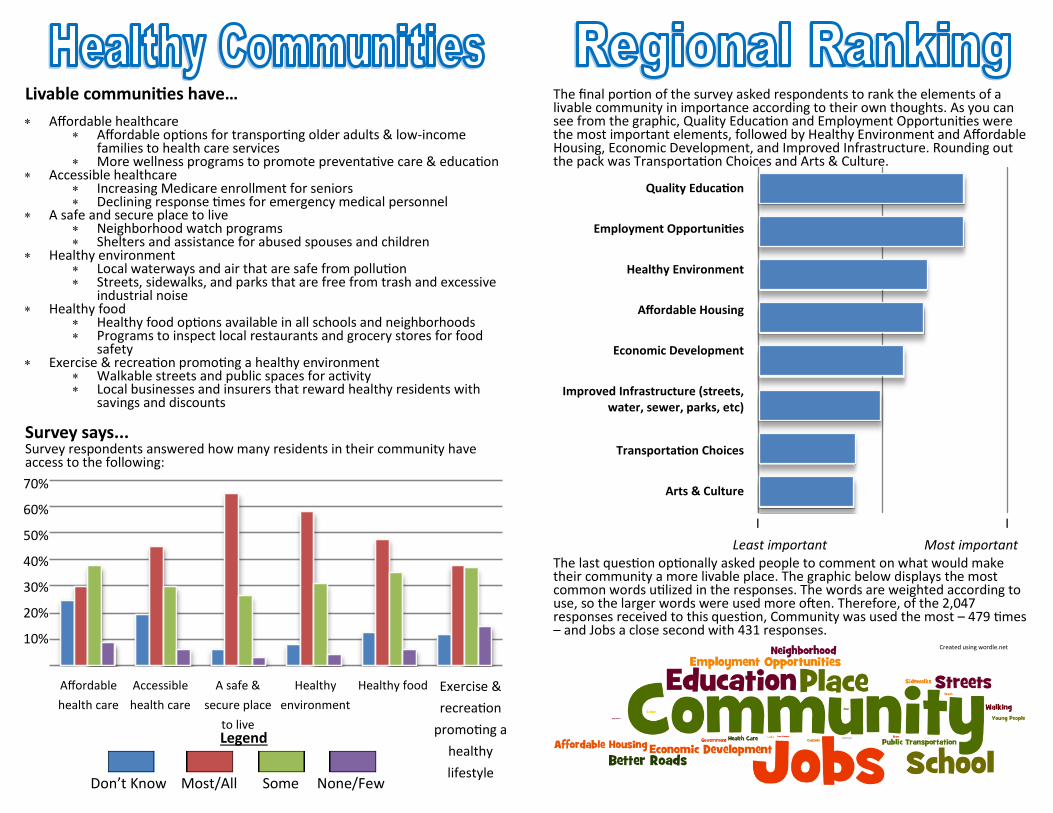
Livable communities have… Affordable healthcare
Affordable options for transporting older adults & low-income families to health care services
More wellness programs to promote preventative care & education Accessible healthcare
Increasing Medicare enrollment for seniors Declining response times for emergency medical personnel
A safe and secure place to live Neighborhood watch programs Shelters and assistance for abused spouses and children
Healthy environment Local waterways and air that are safe from pollution Streets, sidewalks, and parks that are free from trash and excessive
industrial noise Healthy food
Healthy food options available in all schools and neighborhoods Programs to inspect local restaurants and grocery stores for food
safety Exercise & recreation promoting a healthy environment
Walkable streets and public spaces for activity Local businesses and insurers that reward healthy residents with
savings and discounts
Survey says...
Survey respondents answered how many residents in their community have access to the following:
70%
60%
50%
40%
30%
20%
10%
Quality Education
Employment Opportunities
Healthy Environment
Affordable Housing
Economic Development
Improved Infrastructure (streets, water, sewer, parks, etc)
Transportation Choices
Arts & Culture
I I
Least important Most important
The final portion of the survey asked respondents to rank the elements of a livable community in importance according to their own thoughts. As you can see from the graphic, Quality Education and Employment Opportunities were the most important elements, followed by Healthy Environment and Affordable Housing, Economic Development, and Improved Infrastructure. Rounding out the pack was Transportation Choices and Arts & Culture. The last question optionally asked people to comment on what would make their community a more livable place. The graphic below displays the most common words utilized in the responses. The words are weighted according to use, so the larger words were used more often. Therefore, of the 2,047 responses received to this question, Community was used the most – 479 times – and Jobs a close second with 431 responses. Created using wordle.net

Employment
opportunities
Attractive
destinations and
services
High quality
education
Life long learning
opportunities
Legend
Don’t Know Most/All Some None/Few
Livable communities have… Employment opportunities
Good paying jobs accessible to all Outreach programs to connect retirees and job seekers of all ages
to new opportunities Attractive destinations and services
Amenities attractive to new businesses and brain power Access to high-speed internet and new technologies
High quality education The same level of public education quality and access for all
residents across age, race, and class Growing educational attainment levels (more people who continue
education beyond high school and community college) Life long learning opportunities
Opportunities for all ages to purse higher education and certifications
Opportunities for all ages to learn new technical skills, financial literacy, English as a Second Language (ESL), healthy eating and cooking practices
Survey says...
Survey respondents answered how many residents in their community have access to the following:
45%
40%
35%
30%
25%
20%
15%
10%
5%
Affordable housing
Quality housing
Public gathering space
Legend
Don’t Know Most/All Some None/Few
Livable communities have… Affordable housing
Residents spend less than 30% of their income on housing A variety of housing choices available for all incomes– including
rental and subsidized housing Quality housing
Home maintenance and repair assistance programs Programs for advising seniors on housing options and modification
services as they age Homes, yards, and residential public spaces that are well
maintained Public gathering spaces
Areas where people can come together — parks, civic centers, religious institutions.
Survey says...
Survey respondents answered how many residents in their community have access to the following:
50%
45%
40%
35%
30%
25%
20%
15%
10%
5%
Legend
Don’t Know Most/All Some None/Few
A variety of
transportation
options
Affordable
transportation
options
Accessible
transportation
options
Regional
transportation
coordination
Well
maintained
roads
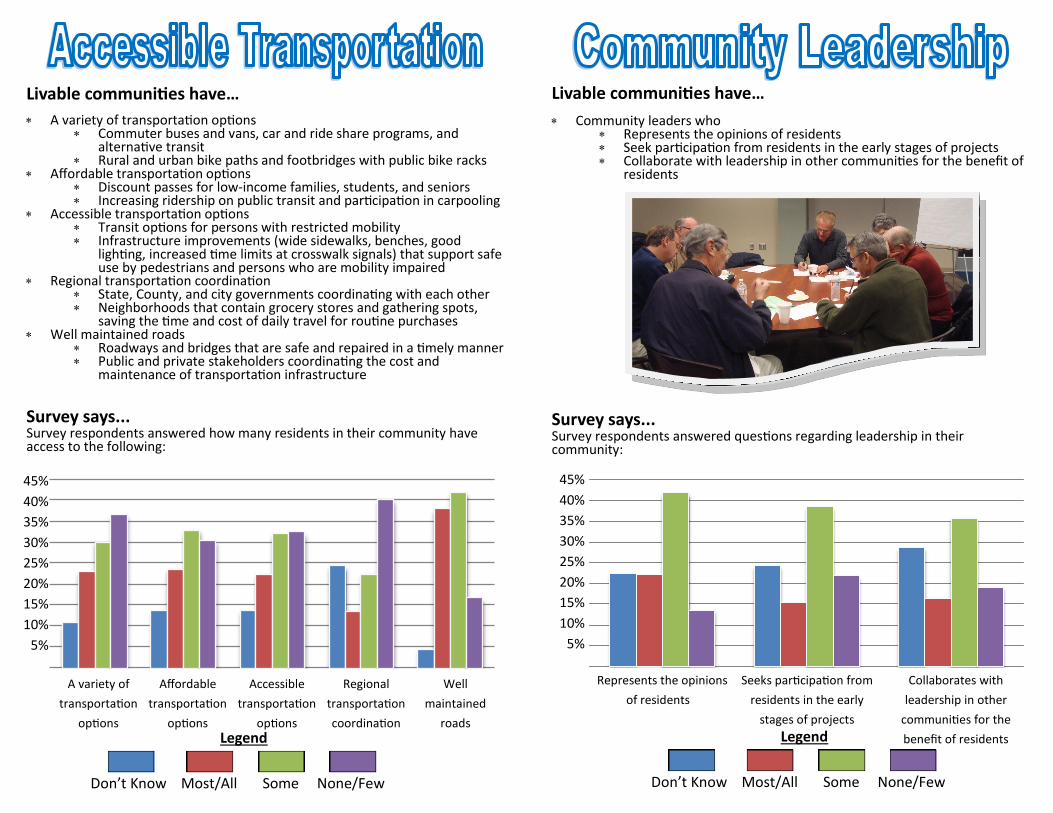
Livable communities have… A variety of transportation options
Commuter buses and vans, car and ride share programs, and alternative transit
Rural and urban bike paths and footbridges with public bike racks Affordable transportation options
Discount passes for low-income families, students, and seniors Increasing ridership on public transit and participation in carpooling
Accessible transportation options Transit options for persons with restricted mobility Infrastructure improvements (wide sidewalks, benches, good
lighting, increased time limits at crosswalk signals) that support safe use by pedestrians and persons who are mobility impaired
Regional transportation coordination State, County, and city governments coordinating with each other Neighborhoods that contain grocery stores and gathering spots,
saving the time and cost of daily travel for routine purchases Well maintained roads
Roadways and bridges that are safe and repaired in a timely manner Public and private stakeholders coordinating the cost and
maintenance of transportation infrastructure
Survey says...
Survey respondents answered how many residents in their community have access to the following:
45%
40%
35%
30%
25%
20%
15%
10%
5%
Legend
Don’t Know Most/All Some None/Few
Represents the opinions
of residents
Seeks participation from
residents in the early
stages of projects
Collaborates with
leadership in other
communities for the
benefit of residents
Livable communities have… Community leaders who
Represents the opinions of residents Seek participation from residents in the early stages of projects Collaborate with leadership in other communities for the benefit of
residents
Survey says...
Survey respondents answered questions regarding leadership in their community:
45%
40%
35%
30%
25%
20%
15%
10%
5%