Platteville Wisconsin presentation 10.23.12 broadband summit

Clean Water Legacy Project Final Report
Project Title: Evaluation of alternative surface-water monitoring protocols for
use in agriculture TMDL load allocation and BMP evaluation.
Submission Date: August 1, 2011
Submitted To: Adam Birr
Impaired Waters Technical Coordinator Minnesota Department of Agriculture 2300 Silver Creek Road Rochester, MN 55906
Prepared By:
Dennis Busch, Ph.D. Research Manager, UW-Platteville Pioneer Farm 29200 College Farm Rd Platteville, WI 53813 Phone 608-342-1657 Fax 608-342-1086 Email [email protected]
Brian Haggard, Ph.D. Director, Arkansas Water Resources Center 203 Engineering Hall Fayetteville, AR 72701 Phone 479-575-2879 Fax 479-575-2846 Email [email protected]
Research supported by:
In accordance with the American with Disabilities Act, an alternative form of communication is available upon
request. TDD: 1-800-627-3529. MDA is an equal opportunity employer and provider.

EXECUTIVE SUMMARY
Edge-of-field runoff driven by rainfall, snowmelt, or a combination of rain and snowmelt,
produce discharge events that vary greatly in total volume. It is difficult, if not impossible, to accurately
pre-program automated samplers so that both small and large events are sampled adequately. What
often occurs is insufficient samples are collected during small runoff events, and sampler capacity is
exceeded during large runoff events. To overcome this challenge, Pioneer Farm, in cooperation with the
United States Geological Survey, has monitored runoff events in real-time via remote connections and
adjusted the time between samples so that a much larger range of events can be monitored.
Unfortunately, this method increases costs due to increased technician labor and increased sample
handling and preparation.
The purpose this study was to evaluate two alternative methodologies for estimating discharge
and collection samples for nutrient and sediment analysis. The first alternative system (2-part FWC) used
an automated sampler that is capable of collecting samples based on two flow intervals simultaneously.
This allows one sampler to be set to two flow-weight compositing intervals- one interval for small events
and one for large events. The second system (SS Siphon) includes single-stage siphon samplers installed
at multiple flume depths in association with an integrated stage sensor-datalogger. Samplers were
installed at sites 2 and 8 at the University of Wisconsin-Platteville Pioneer Farm and snow and rainfall
driven runoff events were monitored to determine accuracy and precision of alternative sampling
techniques. Accuracy measurements are reported as relative percent accuracy and are calculated as a
difference from results determined by our current system (referred to as EPA method).
Experimental results indicate that the 2-part FWC method was able to adequately sample both
large and small events, but one of the replicate samplers produced significantly different total
phosphorus load; however, the actual difference in loads was small – the sum of event loads equaled
10.1 kg for the EPA method and 10.9 kg for the 2-part FWC method. The nitrogen and phosphorus loads
produced by replicate samplers were precise and strongly correlated to EPA method loads, which may
indicate a sampler bias. Discharge estimates as well as suspended sediment concentration and load
estimated by the 2-part FWC method did not differ significantly from EPA method. Due to reductions in
equipment costs, required technician labor, and sample handling, the 2-part FWC method would cost
slightly more than half that of the EPA method, assuming a three-year monitoring program.
The SS Siphon method did not produce significant differences in any of the measured
constituents (discharge, nutrient concentration, nutrient load, suspended sediment concentration, or
suspended sediment load). However, the sum of event load suspended sediment from siphon samplers
was 685 and 729 kg compared to 419 kg suspended sediment load determined by the EPA method.
While this method relies on low cost equipment, technician time required for operation and
maintenance is similar to the 2-part FWC method, therefore the cost of a multi-year monitoring project
will be similar for the two methods.

INTRODUCTION
This research project compared the current monitoring protocol used by UW-Platteville Pioneer
Farm and UW-Extension Discovery Farms that meet EPA guidelines (EPA), with two alternate low-cost
methods: 2-part flow-weighted automated sampling (2-Part FWC) and single-stage passive samplers (SS
Siphon).
Pioneer Farm monitoring methods (a.k.a. EPA Method) utilize a pre-calibrated H-flume (Figure
1) with a pressure transducer stage recorder to determine flow. Samples are triggered based on time
interval that is adjustable remotely via radio telemetry and internet communication. After collection,
samples are cooled in the refrigerated sampler until retrieved by a technician. A detailed description of
the current monitoring strategy at Pioneer Farm can be downloaded at the following
website:http://pubs.usgs.gov/of/2008/1015/pdf/ofr_2008-1015.pdf
Figure 1. Flume-wing-wall installations at Pioneer Farm.
In contrast, the 2-Part FWC method does not have remote access. Instead the ISCO 6712
sampler has the capability to collect samples based on two flow intervals simultaneously. This allows
one sampler with a 24 bottle carrousel to be set to two flow-weight compositing intervals: bottles 1-12
were set to 0.01 mm interval for small events, and sample bottles 13-24 were set to a 0.4 mm interval
for large events (figure 2). Flow is determined using the H-flume instrumented with an ultrasonic flow
meter. Samples collected by the 2-part sampler were not refrigerated.

Figure 2. Figure Surface-water monitoring equipment used for 2-Part FWC method.
The single-stage siphon sampler is a passive sampler, meaning that collects a sample without
any external control or activation. The sample begins to collect when surface-water height in the flume
exceeds the maximum height of the intake tube. This initiates a siphon and the sample bottle fills
rapidly. Three siphon samplers are located along side each flume with their intake tube sample heights
fixed inside the so that samples are collected at 0.2’, 0.5’, and 1.0’ stages (figure 3).
Figure 3. Surface-water monitoring equipment used for SS-Siphon method.
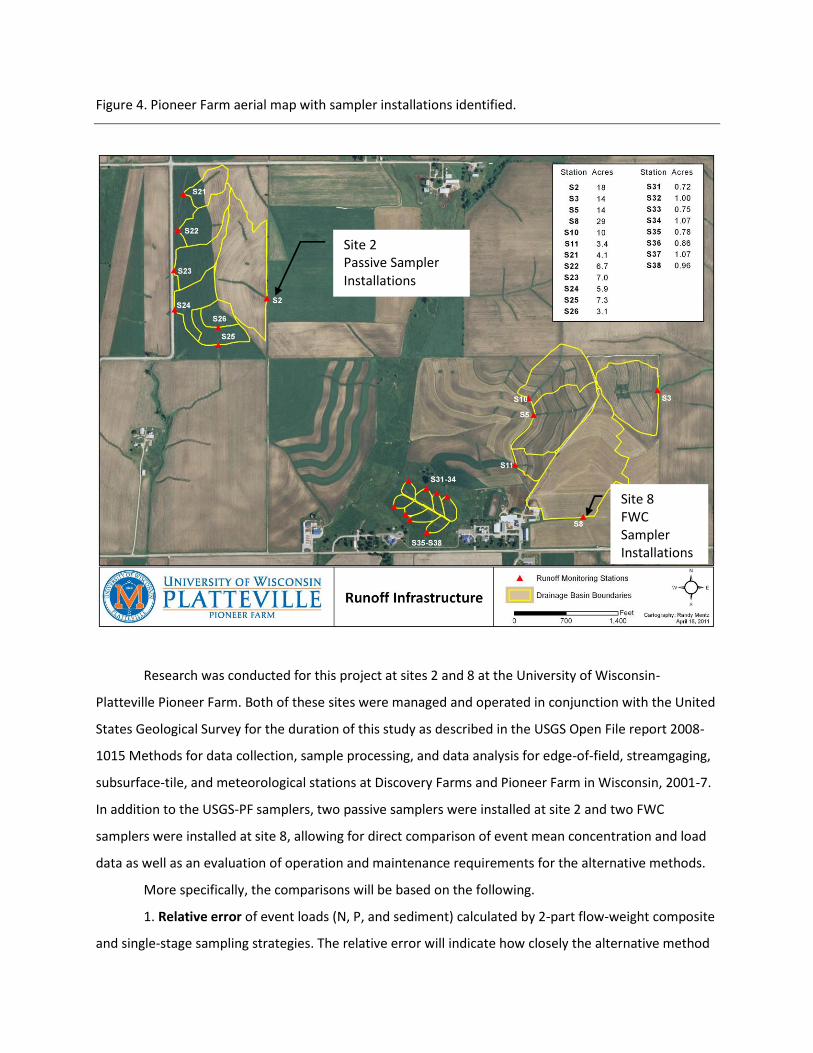
Figure 4. Pioneer Farm aerial map with sampler installations identified.
Research was conducted for this project at sites 2 and 8 at the University of Wisconsin-
Platteville Pioneer Farm. Both of these sites were managed and operated in conjunction with the United
States Geological Survey for the duration of this study as described in the USGS Open File report 2008-
1015 Methods for data collection, sample processing, and data analysis for edge-of-field, streamgaging,
subsurface-tile, and meteorological stations at Discovery Farms and Pioneer Farm in Wisconsin, 2001-7.
In addition to the USGS-PF samplers, two passive samplers were installed at site 2 and two FWC
samplers were installed at site 8, allowing for direct comparison of event mean concentration and load
data as well as an evaluation of operation and maintenance requirements for the alternative methods.
More specifically, the comparisons will be based on the following.
1. Relative error of event loads (N, P, and sediment) calculated by 2-part flow-weight composite
and single-stage sampling strategies. The relative error will indicate how closely the alternative method
Site 2 Passive Sampler Installations
Site 8 FWC Sampler Installations

compares to the EPA approved method. For example, a relative error of 90% would indicate that the
alternative method calculated a load that was 10% less than the actual load.
2. Precision of 2-part flow-weight composite and single-stage sampling methods. The precision,
or coefficient of variation (CV), will indicate how well the alternative methods are able reproduce load
estimates. If sampling methods are imprecise (have a large CV) they may not be useful in evaluating
BMPs. In the proposal it was indicated that the precision evaluation would be based on standard
deviation; however, the large variations in mean values makes that comparison difficult. The CV is a
ratio of the standard deviation to the sample mean; therefore events with large differences in sample
means can be directly compared.
3. Costs of alternative methods including: equipment, operation, and maintenance.
Tables in the following pages contain event monitoring results for discharge, total nitrogen, total
phosphorus, and suspended sediment. Section 1 lists event concentration and load data for the EPA and
FWC methods; describes error and precision of these estimates; and discusses cost of operation and
maintenance. Section 2 is similar the first section, but focuses on the single-stage siphon sampler
results. The third and final section presents recommendations for future research.
It is important to note that not all runoff events that occurred during the experiment are
included in this analysis. There were occasions when events were missed due to equipment failure or
operator error. Failures occurred on all systems- including the USGS-PF operated sites. For example,
large runoff events washed out the flume on site 8, sampler lines froze on site 2, batteries failed on site
8, and aquarod data was overwritten during runoff events of long duration. While failures were more
frequent with the FWC and SS-Siphon samplers when compared to the USGS-PF samplers, PF technicians
have been operating these systems for 8 years and are much more familiar with these systems. For this
reason, the comparisons on the following pages are based on events for which data was available from
both sampling systems. If all events were included, the observed differences may be more a result of
operator experience than inherent capabilities of sampling equipment.

SECTION WO ART LOW EIGHT OMPOSITE AMPLING 1. T -P F W C S
Table 1. Event discharge data for FWC sampling methods.
Discharge Relative Error Precision
Date EPA FWC-A FWC-B A B s.d. CV
1/24/2010
3/5/2010
3/9/2010
3/11/2010
6/5/2010
6/15/2010
6/23/2010
7/7/2010
7/23/2010
12/30/2010
2/14/2011
2/20/2011
3/1/2011
3/7/2011
(cf)
1,449
55,300
82,100
9,700
66
766
570
11,800
17,000
12,100
86,600
35,800
11,400
12,200
(cf)
1,380
51,400
86,000
11,200
90
702
784
12,900
18,300
13,500
83,600
36,800
15,700
12,700
(cf)
775
50,400
84,900
11,200
78
703
731
12,300
17,900
13,600
85,600
36,700
14,700
13,600
(%)
4.8
7.1
-4.8
-15.5
-36.4
8.4
-37.5
-9.3
-7.6
-11.6
3.5
-2.8
-37.7
-4.1
(%)
46.5
8.9
-3.4
-15.5
-18.2
8.2
-28.2
-4.2
-5.3
-12.4
1.2
-2.5
-28.9
-11.5
427.8
707.1
777.8
0.0
8.5
0.7
37.5
424.3
282.8
70.7
1414.2
70.7
707.1
636.4
0.40
0.01
0.01
0.00
0.10
0.00
0.05
0.03
0.02
0.01
0.02
0.00
0.05
0.05
Total 336,851 345,056 343,187 -2.4 -1.9 0.00
intercept
Slope
r squared
-883
1.01
0.99
-651
1.01
1.00
Obs P 0.33 0.40
The table above presents corrected (see the quality assurance project plan for a description of correction
methods) discharge data for the project. The comparative analysis for the flow-weight composite (FWC) sampling
technique included 14 events starting with the January 24th, 2010 event. Events monitored include snowmelt, rainfall,
and events driven by combinations of rain and snowmelt discharge.
Both FWC samplers (A and B) provided relatively accurate, precise estimates of event discharge. However, for
events of less than 12,000 cubic feet the relative error could be large (46.5% maximum). Regression analysis indicates
good correlation between the EPA discharge and FWC sampler A (r2 = 0.99) and FWC B sampler (r2 = 1) and a slope of
near 1 for both samplers. The coefficient of variation (CV, ratio of standard deviation to mean) for discharge
measurements, with the exception of the 1/24/2011 event, was less than 0.10- indicating a high precision of discharge
estimate.
The ultrasonic stage sensors used as part of the FWC method consistently exhibited more within variation than
those recorded by the Sutron bubble sensor used in the EPA method (data not shown). These issues were more
pronounced during snowmelt events. The manufacturer’s minimum operating temperature for this sensor was 32o F.
Alternative sensors available for this system may perform better under snowmelt conditions.

Table 2. Total nitrogen concentration and load data for FWC sampling methods.
Date
Concentration Error Prec. Load Error Prec.
EPA A B A B CV EPA A B A B CV
1/24/2010
3/5/2010
3/9/2010
3/11/2010
6/5/2010
6/15/2010
6/23/2010
7/7/2010
7/23/2010
12/30/2010
2/14/2011
2/20/2011
3/1/2011
3/7/2011
(mg/L)
3.6
7.0
4.3
8.9
3.8
3.8
4.5
6.1
1.1
1.5
4.2
3.1
4.8
5.7
(mg/L)
4.2
10.2
4.7
8.2
4.9
5.2
4.6
4.3
1.4
1.6
5.6
3.2
5.1
5.6
(mg/L)
3.8
9.9
5.0
6.6
4.6
5.6
4.6
4.3
1.3
2.0
5.7
3.0
5.1
5.0
(%)
-16.5
-44.5
-9.7
8.5
-30.2
-37.2
-2.0
29.3
-30.0
-11.0
-33.3
-3.6
-7.1
3.0
(%)
-3.3
-41.1
-16.9
25.6
-22.8
-48.7
-4.0
29.3
-19.1
-35.6
-36.2
1.0
-6.9
13.2
0.09
0.02
0.04
0.15
0.04
0.06
0.01
0.00
0.06
0.14
0.01
0.03
0.00
0.08
(kg)
0.15
11.00
10.00
2.45
0.01
0.08
0.07
2.03
0.53
0.50
10.30
3.11
1.54
1.98
(kg)
0.17
14.80
11.50
2.60
0.01
0.10
0.10
1.57
0.74
0.62
13.30
3.31
2.27
2.00
(kg)
0.08
14.20
12.10
2.11
0.01
0.11
0.10
1.49
0.67
0.76
13.90
3.16
2.11
1.92
(%)
-10.7
-34.5
-15.0
-6.1
-77.3
-26.2
-40.3
22.7
-40.5
-24.2
-29.1
-6.4
-47.4
-1.0
(%)
44.8
-29.1
-21.0
13.9
-44.7
-36.0
-33.3
26.6
-25.7
-52.6
-35.0
-1.6
-37.0
3.0
0.47
0.03
0.04
0.15
0.14
0.05
0.04
0.04
0.08
0.15
0.03
0.03
0.05
0.03
Totals 43.75 53.10 52.72 -21.4 -20.5 0.01
intercept
slope
r squared
1
0.79
0.75
1
0.78
0.62
0
0.78
0.99
0
0.76
0.99
Obs P 0.15 0.40 0.07 0.09
Total nitrogen concentrations estimated by the EPA method ranged from 1.1 to 7.0 mg/l. Estimates of total
nitrogen concentration generated by the FWC samplers were generally higher the EPA estimates- relative percent error
as large as 44.5%. This lead to increased load estimates for the FWC samplers- sum of loads for all events was about 9 kg
higher. However, the FWC samplers produced consistent (precise) results- CV values for concentration were less than
0.15.
While concentrations estimates for FWC methods were not significantly different from the EPA estimates, load
values for both samplers were significantly different from EPA load estimates at the 10% significance level. Regression
analysis of total nitrogen load estimates indicates a strong correlation between both FWC methods and the EPA method,
and that the FWC method predicts higher total nitrogen load (slope = 0.78 and 0.76). The CV data indicates that the two
FWC samplers produced comparable total nitrogen load estimates (CV < 0.15, excluding 1/24/10 event).
These results (low CV, high r2, and slope of 0.78) may indicate a systematic sampler, field method, or laboratory
method error. For example, results may be due to differing sample intake velocities which select preferentially for
specific particle sizes or differing sample collection points within the H-flume. Alternatively, errors may be introduced by
Pioneer Farm compositing and sub-sampling methods, UWSP churn splitting methods, or the time-based sampling
scheme utilized.

Table 3. Total phosphorus concentration and load for FWC sampling methods.
Concentration Error Prec. Load Error Prec.
Date EPA A B A B CV EPA A B A B CV
(mg/L) (mg/L) (mg/L) (%) (%) (kg) (kg) (kg) (%) (%)
1/24/2010 0.9 1.1 1.0 -22.1 -14.3 0.05 0.04 0.04 0.02 -15.9 39.0 0.44
3/5/2010 1.3 1.5 1.5 -11.9 -11.5 0.00 2.08 2.16 2.11 -3.8 -1.4 0.02
3/9/2010 1.5 1.5 1.5 0.7 0.7 0.00 3.49 3.63 3.58 -4.0 -2.6 0.01
3/11/2010 2.3 2.0 1.8 13.9 21.8 0.07 0.63 0.62 0.57 0.5 9.4 0.07
6/5/2010 2.3 2.2 2.3 4.9 1.4 0.03 0.00 0.01 0.00 -29.8 -16.7 0.08
6/15/2010 1.8 2.6 2.6 -45.5 -46.6 0.01 0.04 0.05 0.05 -33.4 -34.7 0.01
6/23/2010 1.8 1.8 1.9 -5.1 -5.7 0.00 0.03 0.04 0.04 -44.7 -35.8 0.04
7/7/2010 1.7 1.5 1.6 14.4 10.9 0.03 0.58 0.55 0.54 6.2 7.4 0.01
7/23/2010 0.9 1.0 1.0 -12.2 -9.7 0.02 0.42 0.51 0.49 -21.1 -15.9 0.03
12/30/2010 0.5 0.5 0.6 -2.0 -14.1 0.08 0.17 0.19 0.22 -14.3 -28.6 0.08
2/14/2011 0.6 0.8 0.8 -21.6 -24.5 0.02 1.58 1.86 1.95 -17.7 -23.4 0.03
2/20/2011 0.4 0.5 0.4 -7.6 0.5 0.05 0.43 0.47 0.44 -10.5 -1.9 0.06
3/1/2011 0.9 1.0 1.1 -7.6 -13.6 0.04 0.30 0.45 0.44 -48.0 -45.4 0.01
3/7/2011 1.0 0.9 0.9 4.7 10.7 0.05 0.34 0.34 0.34 0.9 0.3 0.00
Total
10.12 10.92 10.78 -7.8 -6.5 0.01
intercept 0 0 0 0
slope 0.89 0.87 0.95 0.95
r squared 0.83 0.80 1.00 0.99
Obs P 0.39 0.46 0.03 0.12
Event total phosphorus concentrations and loads estimated by the FWC method were very similar to loads
determined by the EPA method; however, due to the small magnitude of concentrations, the relative error in
percentage terms is large. As was the case with total nitrogen, FWC total phosphorus concentrations were consistently
higher than EPA concentrations and resulted in significantly higher loads for FWC sampler A (observed p value = 0.03),
even though the difference between the sum of event loads was only 0.8 kg, or 7.8%. Concentration values estimated
by the FWC samplers were also very precise- the maximum CV was 0.08 for the 3/1/2011 event.

Table 4. Suspended sediment concentration and load for FWC sampling method.
Concentration Error Prec. Load Error Prec.
Date EPA A B A B CV EPA A B A B CV
(mg/L) (mg/L) (mg/L) (%) (%) (kg) (kg) (kg) (%) (%)
1/24/2010 5.0 19.0 3.0 -280 40 1.03 0.21 0.74 0.07 -261 68 1.18
3/5/2010 8.0 26.0 26.0 -225 -225 0.00 12.50 37.80 37.10 -202 -197 0.01
3/9/2010 15.0 1.0 13.0 93 13 1.21 34.90 2.44 31.30 93 10 1.21
3/11/2010 17.0 11.0 14.0 35 18 0.17 4.67 3.49 4.46 25 4 0.17
6/5/2010 364.0 181.0 214.0 50 41 0.12 0.68 0.46 0.47 32 30 0.02
6/15/2010 305.0 359.0 332.0 -18 -9 0.06 6.62 7.14 6.61 -8 0 0.05
6/23/2010 85.0 132.0 121.0 -55 -42 0.06 1.37 2.93 2.50 -114 -82 0.11
7/7/2010 332.0 182.0 190.0 45 43 0.03 111.00 66.50 65.90 40 41 0.01
7/23/2010 33.0 74.0 105.0 -124 -218 0.24 15.90 38.40 53.30 -142 -235 0.23
12/30/2010 3.0 1.0 1.0 67 67 0.00 1.03 0.38 0.39 63 62 0.02
2/14/2011 6.0 5.0 8.0 17 -33 0.33 14.70 11.80 19.40 20 -32 0.34
2/20/2011 1.0 11.0 5.0 -
1000 -400 0.53 1.01 11.50 5.19 -
1039 -414 0.53
3/1/2011 1.0 16.0 14.0 -
1500 -
1300 0.09 0.32 7.13 5.81 -
2128 -
1716 0.14
3/7/2011 64.0 33.0 20.0 48 69 0.35 22.10 11.80 7.70 47 65 0.30
Total 227.01 202.51 240.20 10.8 -5.8 0.12
intercept 6 -2 0 0
slope 1.12 1.18 1.17 1.06
r squared 0.74 0.80 0.61 0.61
Obs P 0.48 0.47 0.73 0.85
Suspended sediment concentrations estimated by the 2-part FWC samplers varied dramatically from EPA
method estimates and among FWC samplers A and B but were not significantly different than EPA method
concentrations (observed p = 0.48 and 0.47). Relative error values were as high as 1,500% (3/1/2011 event), and CV
values were as high as 1.21. When the sum of event loads are compared the bias tends to average out and estimates
from FWC samplers are within 10.8 (FWC-A) and -5.8 (FWC-B) percent of the EPA load. The slope of regression lines
(1.12 and 1.18) indicate that concentrations estimated by the FWC samplers tend to be lower than concentrations
determined by EPA methods. It is not too surprising that suspended sediment data exhibits the greatest error and least
precision, since the within event concentration of suspended sediment varies much more than concentration of total
nitrogen or total phosphorus.

Table 5. Cost data for FWC sampling method.
EPA 2-Part Flow Weight Composite
Equipment ($) ($) Sampler 3,350 Sampler 3,350 Data Logger 1,500 Stage Sensor 1,670 Flume 1,000 Flume 1,000 Sampler Housing 5,000 Sampler Housing 200 Stage Sensor 1,000 Wing-wall 500 Radio 400 Antennae 100 Solar Panel 500 Battery 70 Wing-wall 500 Generator 500 Rain Gauge 300 Camera 200 Fuel Tank 200
Total Equipment 14,620 6,720 Installation Materials 500 Materials 500 Labor 5,000 Labor 2,000 Earthwork 1,000 Earthwork 1,000
Total Installation 6,500 3,500 Operation Pioneer Farm Technician 10,000 Pioneer Farm Technician 10,000 Real-time Remote Monitoring 4,000
Total Annual Operation 14,000 10,000 Maintenance Parts 1,000 Parts 200 Pioneer Farm Technician 3,000 Pioneer Farm Technician 500
Total Annual Maintenance 4,000 700
The table above compares cost for the EPA and 2-part FWC methods. The cost of equipment, installation,
operation, and maintenance are lower for the 2-part FWC method. In the long-run most cost savings will be realized by
eliminating the requirement for real-time remote monitoring of sites during events. Given the objective of having
multiple samples collected from all runoff events, large or small, the EPA method requires that technicians monitor all
events via remote connection and alter the time between sample collections to ensure adequate coverage of the
hydrograph. The 2-part FWC sampler eliminates this need because it can collect two sets of flow-weighted samples
simultaneously using to flow intervals. With this system multiple samples can be collected from large or small events.
Given the data above, the total cost per site for a three-year monitoring program would cost $75,120 for the EPA
method and $42,320 for the 2-part flow-weight composite sampler method.

SECTION 2. AQUAROD STAGE SENSOR-DATALOGGER AND SINGLE STAGE SIPHON SAMPLER
Table 6. Event discharge data for aquarod method.
Discharge Error Precision
Date EPA A B A B s.d. CV
(cf) (cf) (cf) (%) (%)
3/9/2010 40,800 44,800 -9.8
3/11/2010 5,800 7,710 -32.9
6/26/2010 2,190 2,250 2,260 -2.7 -3.2 7.1 0.00
7/7/2010 5,280 5,350 5,210 -1.3 1.3 99.0 0.02
7/23/2010 3,270 3,000 3,120 8.3 4.6 84.9 0.03
7/24/2010 33,400 30,100 33,300 9.9 0.3 2262.7 0.07
8/8/2010 16,300 12,800 16,000 21.5 1.8 2262.7 0.16
8/9/2010 7,380 5,920 7,200 19.8 2.4 905.1 0.14
12/30/2010 1,060 898 1,460 15.3 -37.7 397.4 0.34
2/20/2011 13,000 17,900 11,400 -37.7 12.3 4596.2 0.31
3/1/2011 3,720 3,910 3,160 -5.1 15.1 530.3 0.15
Total 132,200 134,638 -1.8
6/26 - 3/1 85,600 83,110 2.9
intercept 417 204
slope 0.95 1.01
r squared 0.96 1.00
Obs P 0.79 0.18
The table above includes discharge estimates for the EPA method and the two aquarods (A and B). Due to
limited inventory, we did not receive the second aquarod (B) until after the March 9th and 11th events.
Discharge estimated by the aquarod A and B were not significantly different from values produced by the EPA
method (observed p value = 0.79 and 0.18). However, the percent relative error for events was often rather large- the
average absolute percent relative error was 15% for aquarod A and 9% for aquarod B. The sum of event discharges for
EPA and aquarods varied by less than 3% because the error in discharge estimates was not systematic and tended to
balance over events. Discharge estimated by aquarods was imprecise when compared to other data- over half of the
events had a CV > 0.14.
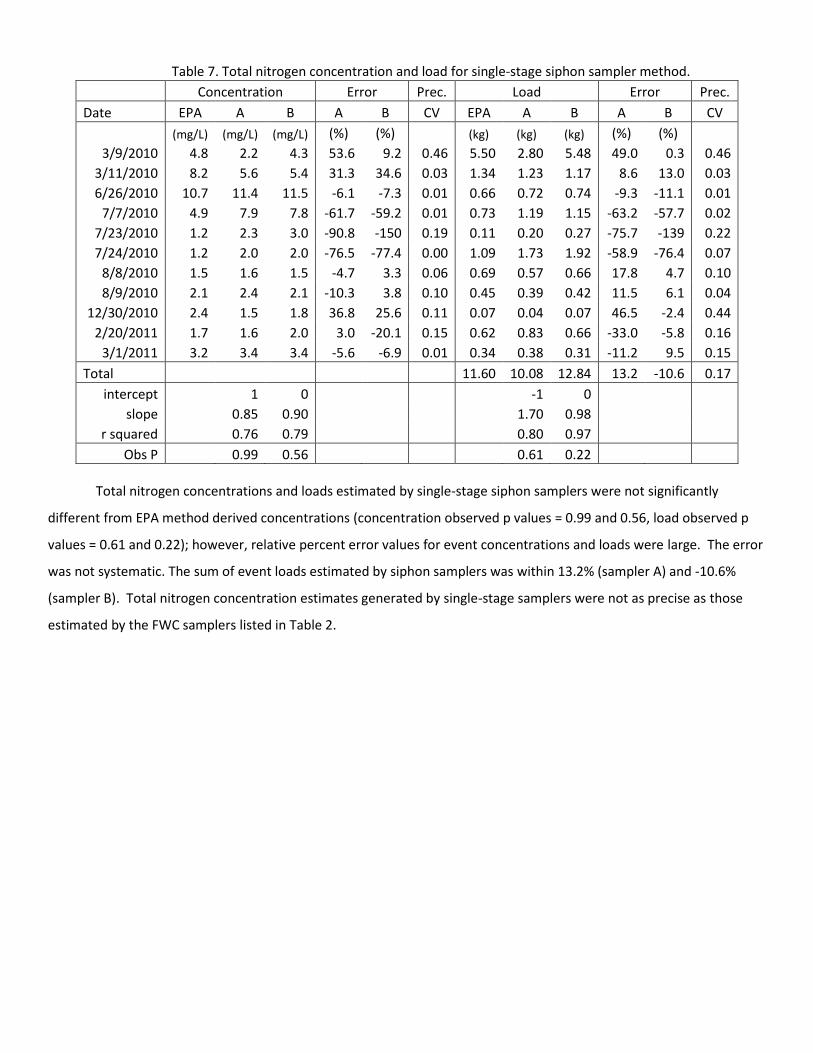
Table 7. Total nitrogen concentration and load for single-stage siphon sampler method.
Concentration Error Prec. Load Error Prec.
Date EPA A B A B CV EPA A B A B CV
(mg/L) (mg/L) (mg/L) (%) (%) (kg) (kg) (kg) (%) (%)
3/9/2010 4.8 2.2 4.3 53.6 9.2 0.46 5.50 2.80 5.48 49.0 0.3 0.46
3/11/2010 8.2 5.6 5.4 31.3 34.6 0.03 1.34 1.23 1.17 8.6 13.0 0.03
6/26/2010 10.7 11.4 11.5 -6.1 -7.3 0.01 0.66 0.72 0.74 -9.3 -11.1 0.01
7/7/2010 4.9 7.9 7.8 -61.7 -59.2 0.01 0.73 1.19 1.15 -63.2 -57.7 0.02
7/23/2010 1.2 2.3 3.0 -90.8 -150 0.19 0.11 0.20 0.27 -75.7 -139 0.22
7/24/2010 1.2 2.0 2.0 -76.5 -77.4 0.00 1.09 1.73 1.92 -58.9 -76.4 0.07
8/8/2010 1.5 1.6 1.5 -4.7 3.3 0.06 0.69 0.57 0.66 17.8 4.7 0.10
8/9/2010 2.1 2.4 2.1 -10.3 3.8 0.10 0.45 0.39 0.42 11.5 6.1 0.04
12/30/2010 2.4 1.5 1.8 36.8 25.6 0.11 0.07 0.04 0.07 46.5 -2.4 0.44
2/20/2011 1.7 1.6 2.0 3.0 -20.1 0.15 0.62 0.83 0.66 -33.0 -5.8 0.16
3/1/2011 3.2 3.4 3.4 -5.6 -6.9 0.01 0.34 0.38 0.31 -11.2 9.5 0.15
Total 11.60 10.08 12.84 13.2 -10.6 0.17
intercept 1 0 -1 0
slope 0.85 0.90 1.70 0.98
r squared 0.76 0.79 0.80 0.97
Obs P 0.99 0.56 0.61 0.22
Total nitrogen concentrations and loads estimated by single-stage siphon samplers were not significantly
different from EPA method derived concentrations (concentration observed p values = 0.99 and 0.56, load observed p
values = 0.61 and 0.22); however, relative percent error values for event concentrations and loads were large. The error
was not systematic. The sum of event loads estimated by siphon samplers was within 13.2% (sampler A) and -10.6%
(sampler B). Total nitrogen concentration estimates generated by single-stage samplers were not as precise as those
estimated by the FWC samplers listed in Table 2.

Table 8. Total phosphorus concentration and load for single stage siphon sampler method.
Concentration Error Prec. Load Error Prec.
Date EPA A B A B CV EPA A B A B CV
(mg/L) (mg/L) (mg/L) (%) (%) (kg) (kg) (kg) (%) (%)
3/9/2010 1.0 1.0 1.0 -2.2 0.8 0.02 1.15 1.29 1.26 -12.2 -9.6 0.02
3/11/2010 1.0 1.1 1.1 -14.0 -14.0 0.00 0.16 0.24 0.24 -51.9 -51.9 0.00
6/26/2010 5.0 5.0 5.2 -1.1 -5.3 0.03 0.31 0.32 0.34 -4.2 -9.1 0.03
7/7/2010 1.7 2.5 2.4 -46.0 -40.6 0.03 0.25 0.37 0.35 -47.4 -38.7 0.04
7/23/2010 0.7 1.0 1.1 -41.7 -57.3 0.07 0.07 0.09 0.10 -30.4 -49.7 0.10
7/24/2010 0.6 0.8 0.8 -39.9 -38.2 0.01 0.56 0.71 0.77 -26.3 -37.7 0.06
8/8/2010 0.8 0.7 0.7 16.9 13.0 0.03 0.36 0.24 0.31 34.7 14.2 0.19
8/9/2010 0.8 0.7 0.7 7.8 9.5 0.01 0.17 0.13 0.15 26.0 11.8 0.12
12/30/2010 1.0 0.8 0.8 20.0 18.6 0.01 0.03 0.02 0.03 32.5 -11.9 0.35
2/20/2011 0.4 0.3 0.3 8.7 8.7 0.00 0.14 0.17 0.11 -21.4 18.6 0.28
3/1/2011 0.9 0.7 0.8 16.9 13.1 0.03 0.09 0.08 0.07 15.4 26.2 0.10
Total 3.29 3.65 3.73 -10.9 -13.5 0.02
intercept 0 0 0 0
slope 0.93 0.91 0.85 0.86
r squared 0.96 0.97 0.96 0.97
Obs P 0.32 0.20 0.22 0.12
Single-stage siphon samplers produced total phosphorus concentrations and loads that were not significantly
different from EPA method estimates (observed p > 0.12), and were strongly correlated to EPA method values (r2 >
0.96). The relative percent errors for samplers A and B ranged from -57.3% to 20%; however, the magnitude of
concentrations were low (< 5.2 mg/L). Siphon sampler total phosphorus concentration estimates were precise- the
maximum CV was 0.07, and the sum of event loads for sampler A and B were within -10.9% and 13.5% of the EPA value.

Table 9. Suspended sediment concentration and load for single stage sampler method.
Concentration Error Prec. Load Error Prec.
Date EPA A B A B CV EPA A B A B CV
(mg/L) (mg/L) (mg/L) (%) (%) (kg) (kg) (kg) (%) (%)
3/9/2010 14.0 25.0 18.0 -78.6 -28.6 0.23 16.20 31.70 22.80 -95.7 -40.7 0.23
3/11/2010 57.0 12.0 12.0 78.9 78.9 0.00 9.36 2.62 2.62 72.0 72.0 0.00
6/26/2010 1230.0 1394.0 1453.0 -13.3 -18.1 0.03 76.10 88.90 93.20 -16.8 -22.5 0.03
7/7/2010 519.0 882.0 1046.0 -69.9 -
101.5 0.12 77.60 133.00 154.00 -71.4 -98.5 0.10
7/23/2010 92.0 404.0 318.0 -
339.1 -
245.7 0.17 8.51 34.40 28.10 -
304.2 -
230.2 0.14
7/24/2010 137.0 360.0 337.0 -
162.8 -
146.0 0.05 130.00 307.00 318.00 -
136.2 -
144.6 0.02
8/8/2010 115.0 120.0 147.0 -4.3 -27.8 0.14 53.00 43.40 66.80 18.1 -26.0 0.30
8/9/2010 168.0 156.0 152.0 7.1 9.5 0.02 35.10 26.10 31.00 25.6 11.7 0.12
12/30/2010 68.0 54.0 34.0 20.6 50.0 0.32 2.04 1.37 1.41 32.8 30.9 0.02
2/20/2011 23.0 30.0 31.0 -30.4 -34.8 0.02 8.49 15.20 10.00 -79.0 -17.8 0.29
3/1/2011 27.0 15.0 16.0 44.4 40.7 0.05 2.84 1.66 1.43 41.5 49.6 0.11
Total 419 685 729 -63.5 -74.0 0.04
intercept -21 -10 12 11
slope 0.78 0.72
0.43 0.41
r squared 0.91 0.90
0.87 0.91
Obs P 0.07 0.09 0.14 0.17
The single-stage sampler suspended
sediment concentrations differed
significantly from EPA methods at the 10%
significance level and relative error values
were large- up to 339%. Siphon samplers
often over predicted concentrations of
suspended sediment- slope of regression
lines were 0.78 (sampler A) and 0.72
(sampler B) (figure 5). However, the
concentrations estimated by the siphon
samplers correlated strongly with EPA
method concentrations (r2 > 0.90). This data
may indicate sampler bias, which could be
corrected.
Figure 5. Suspended sediment concentration for EPA and Siphon
Sampler methods.

Table 10. Cost data for the single stage siphon sampler method.
EPA Single-Stage Siphon
Equipment ($) ($) Sampler 3,350 Samplers 100 Data Logger 1,500 Stage Sensor 1,000 Flume 1,000 Flume 1,000 Sampler Housing 5,000 Wing-wall 500 Stage Sensor 1,000 Radio 400 Antennae 100 Solar Panel 500 Battery 70 Wing-wall 500 Generator 500 Rain Gauge 300 Camera 200 Fuel Tank 200
Total Equipment 14,620 2,600 Installation Materials 500 Materials 500 Labor 5,000 Labor 1,000 Earthwork 1,000 Earthwork 1,000
Total Installation 6,500 2,500 Operation Pioneer Farm Technician 10,000 Pioneer Farm Technician 10,000 Real–Time Remote Monitoring 4,000
Total Annual Operation 14,000 10,000 Maintenance Parts 1,000 Parts 200 Pioneer Farm Technician 3,000 Pioneer Farm Technician 500
Total Annual Maintenance 4,000 700
The table above compares cost for the EPA and single-stage siphon sampler methods. The cost of equipment,
installation, operation, and maintenance are lower for the single-stage sampler method. Due to the simplicity of the
equipment, initial investment and installation cost is low for the single-stage siphon method ($2,600 + $2,500) compared
to the EPA methods ($14,620 + $6,500). Additional cost savings can be realized by the elimination of remote real-time
monitoring and reduced maintenance costs. Given the data above, the total cost per site for a three-year monitoring
program would cost $75,120 for the EPA method and $37,200 for the single-stage siphon sampler method.

SECTION 3. SUGGESTIONS FOR FUTURE RESEARCH
1. As stated in the introduction, the events used for comparison purposes excluded missed events. It
would be of interest to compare the systems using technicians that had no previous experience with
any of the monitoring protocols. This would provide information regarding the learning curve
associated with each of the methods. Missed events could then be included in the data set and the
effect of missed events could be determined on annual yield and load estimates.
2. This experiment was conducted in one location for a relatively short period of time. A more reliable
comparison would include a larger geographic area and longer period of record.
3. It is assumed that the EPA method is determining the “actual” concentration and load. However,
there is variability in all measurement. Future studies should include multiple EPA protocols within
the same site so that precision of this system can be quantified.
4. Lab studies that simulate runoff events using water with known sediment concentrations should be
conducted and concentrations estimated with replicate EPA, 2-Part FWC, and Single-Stage Siphon
sampling methods. With this data, accuracy and precision of all methods could be determined.