Clean Energy Access: Gender Disparity, Health and Labor Supply
56
Clean Energy Access: Gender Disparity, Health and Labor Supply Anjali P. Verma a , Imelda b a UT Austin, b UC3M NCID, Universidad de Navarra, October 19 2020 1 / 51
Transcript of Clean Energy Access: Gender Disparity, Health and Labor Supply

Clean Energy Access:Gender Disparity, Health and Labor Supply
Anjali P. Vermaa, ImeldabaUT Austin, bUC3M
NCID, Universidad de Navarra, October 19 20201 / 51

Energy-Gender-Health-Labor Nexus
1. A key source of inequality between women and men stems fromthe way they are expected to spend their time (Duflo, 2012).
2. Women spend a considerably higher amount of time on unpaidhousework and care than men, hence less time in market work.
How access to energy can help filling this gap?1. Lower time-burden through modern appliances (Greenwood
et al., 2005).2. Reduces health-burden through clean technology: by making
women/children sick less often
"How does having access to clean energy reduce gender disparity inhealth? How does it influence labor outcomes?"
2 / 51
Cooking Technology
1. 40% of people globally is without access to modern and clean cooking
2. Indoor air pollution is associated with four million deaths annually(WHO). Health and time burden on women as the primary user.
3. Worldwide interest on policy to improve adoption on clean energy
3 / 51

Countries’ Clean Cooking Initiatives
4 / 51

Intervention in Indonesia as a Policy Experiment
5 / 51

Overview of This Paper
Provide new evidence on the impact of clean cooking onadults’ health and labor outcomes and potential mechanisms
Eligible
Ineligible
Eligible
Ineligible
Time frame
Program goal: Distribute to two-thirds of total population in 5 years
Exposed early
Exposed later
Identification: program timing is unrelated to individual orregional characteristicsFocus on the expansion period Imelda, 2020
6 / 51

Administrative data on the program between2007-2014
Districts by the implementation year (2007-2014).
7 / 51

Early vs Later Exposed
Kerosene Purchased at Baseline Year
8 / 51

Preview of Results
Health impact:Health improvements particularly among womenThose who spend more time at home, experience greaterhealth impact
Main channel: pollution
Labor impact:increase work hours among women who benefit from thehealth impact
Main channel: healthincrease in work hours among men in households where womenenjoyed the health impact
Channel: subtitution and complementarity
Take away: clean energy can reduce health disparity, and alsoimprove labor outcomes not only for women but also for men.
9 / 51

Contributions
First evidence that document the wide spillover effects of anenergy policy on health and labor outcomes within households.
The key mechanism is that the access to cleaner energyimproves labor outcomes by reducing the health-burden onwomen.
Using individual panel data over 14 years to provide causalestimates of the impact of clean energy intervention on adults(Pitt et al., 2006; Silwal and McKay, 2015; Cesur et al., 2016;Imelda, 2020).More broadly, “missing adult women” in developing countries(Sen, 1990; Klasen and Wink, 2002; Anderson and Ray, 2010).
10 / 51

Roadmap
1. Program details2. Data and empirical strategy3. Main results on health and plausible mechanism4. Main results on labor outcomes and plausible mechanism5. Robustness6. Conclusion and policy implication
11 / 51

1. Kerosene to LPG Fuel Conversion Program
Nationwide energy program, started in 2007, with ambitiousgoal to convert 50 million of households to use LPG withinfive years.The main purpose of the program was to reduce the cost insubsidizing kerosene.Eligible if the households have not used LPG before theprogram.Steps:1. distribution of a free starter kit (a stove and a cylinder)2. subsidy on the LPG refill.3. restriction on kerosene quantity.
12 / 51

Kerosene Vs. LPG
Fine particulates from burning LPG are about 46–76% lower thanparticulates from burning kerosene (Imelda, 2020).
13 / 51

Kerosene Vs. LPG
Fine particulates from burning LPG are about 46–76% lower thanparticulates from burning kerosene (Imelda, 2020).
14 / 51
Conceptual framework for labor supply
When women (and their children) are less likely to be sick, they haveoptions to increase their work hours and to participate in market work(Cai, 2010; Stabridis and van Gameren, 2018).
Many reasons why clean energy access may not increase labor supplyhealth impact is not large enough to influence labor supplyindividual preference on leisurelimited opportunities to participate in the market work
15 / 51

2. Data
Administrative data on the program between 2007-2014− Yearly data for LPG roll-out at district level− Early exposed districts—program roll-out in 2009, 2010− Later exposed districts—program roll-out beyond 2010.
Refined into several dummies (0-2, 3-4, 5-6 years of exposure)
16 / 51
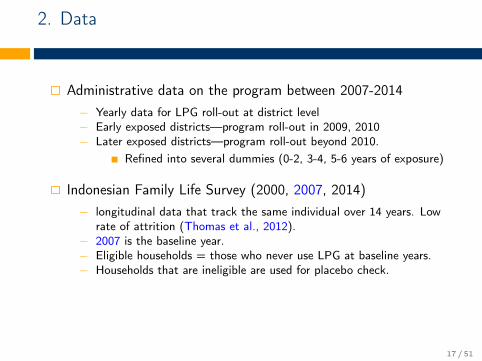
2. Data
Administrative data on the program between 2007-2014− Yearly data for LPG roll-out at district level− Early exposed districts—program roll-out in 2009, 2010− Later exposed districts—program roll-out beyond 2010.
Refined into several dummies (0-2, 3-4, 5-6 years of exposure)
Indonesian Family Life Survey (2000, 2007, 2014)− longitudinal data that track the same individual over 14 years. Low
rate of attrition (Thomas et al., 2012).− 2007 is the baseline year.− Eligible households = those who never use LPG at baseline years.− Households that are ineligible are used for placebo check.
17 / 51

Difference-in-differences event study style
Yidt =β1EarlyExposure× Post+ β2EarlyExposure× Pre+ γt + δd + θXidt + εidt
where i,r,t denote individual, region and year of surveyrespectively.Post (Pre) is the dummy variables for 2014 (2000), and 0 for2007—the baseline year.γt and δd are the time and district fixed effects; Xidt is a setof individual controls at year 2007; εirt cluster at district level.β1 captures the intent-to-treat effect due to longer exposure tothe program.
18 / 51
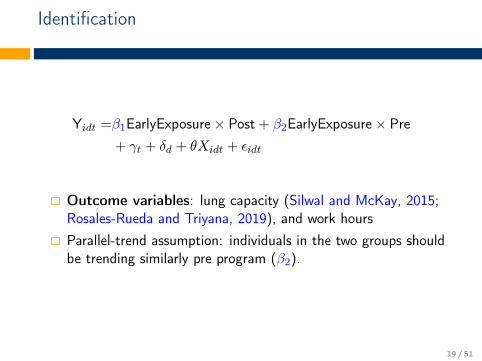
Identification
Yidt =β1EarlyExposure× Post+ β2EarlyExposure× Pre+ γt + δd + θXidt + εidt
Outcome variables: lung capacity (Silwal and McKay, 2015;Rosales-Rueda and Triyana, 2019), and work hoursParallel-trend assumption: individuals in the two groups shouldbe trending similarly pre program (β2).
19 / 51

Measuring lung capacity
Advantage of using lung capacity as proxy for health: (1) strong predictor for mortalityfor elderly; (2) reliable measure; (3) not easily influence by contemporaneous factors.
20 / 51

Summary Statistic at Baseline (2007)
(1) (2)Early Exposed Later Exposed
Mean Std. Dev. Mean Std. Dev.
DemographicAge(yrs) 43.03 15.20 41.64 15.40Ever Married (%) 0.83 0.38 0.79 0.41No school (%) 0.13 0.34 0.10 0.30Primary/Middle School (%) 0.47 0.50 0.41 0.49High School (%) 0.34 0.47 0.40 0.49Electricity (%) 0.95 0.21 0.94 0.23Refrigerator (%) 0.62 0.85 0.69 0.91Television (%) 0.77 0.42 0.72 0.45Per-capita Income (USD) 153.16 230.51 175.36 216.01
Cooking Fuel UsedGas (%) 0.10 0.30 0.09 0.29Kerosene (%) 0.34 0.47 0.45 0.50Firewood (%) 0.54 0.50 0.45 0.50
Health and Labor OutcomesLung capacity (Litres/Minute) 329.20 113.00 337.78 107.65Employed (%) 0.77 0.42 0.73 0.45No. of hours worked per month 189.66 101.39 198.15 102.03Participation in Agriculture (%) 0.45 0.50 0.44 0.50Help in Household Work (%) 0.59 0.49 0.58 0.49
N 3815 225521 / 51

Parallel Trend Test: Main Outcome Variables (β2)
Lung Capacity Hours Worked Per Month
(1) (2) (3) (4)
Women MenWomen
(Housekeeper)Men
(Housekeeper HH)
EarlyExposure × Pre 10.13 1.03 17.30 11.12(7.25) (9.10) (19.26) (14.41)
Control Mean 283.3 410.9 152.4 211.1Observations 7782 6049 879 1718
22 / 51

Parallel Trend Test: Other Health Measures (β2)
(1) (2) (3) (4) (5)Anemia Diabetes Self report Health Weight Cough
EarlyExposure × Pre 0.01 -0.00 0.03 0.46 0.00(0.00) (0.00) (0.03) (0.34) (0.03)
Control Mean 0.013 0.006 0.776 53.128 0.359Observations 18269 18269 18270 18244 17284
23 / 51

Parallel Trend Test: Other Characteristics (β2)
(1) (2) (3) (4) (5) (6) (7)Education Log PC Income Electricity Refrigerator TV Toilet Water in/out
EarlyExposure × Pre 0.00 0.04 -0.01 0.04 -0.02 0.03 0.05(0.01) (0.08) (0.03) (0.07) (0.04) (0.04) (0.04)
Control Mean 0.894 4.429 0.949 0.584 0.752 0.703 0.465Observations 18270 16552 18270 18270 18270 18270 18270
24 / 51

Take-ups
0
.2
.4
.6
.8D
en
sity o
f h
ou
se
ho
ld
Electricity LPG Kerosene Firewood
Primary Cooking Fuel
2007 2014
Primary cooking fuel based on Indonesian Family Life Survey 2007 and 2014.
25 / 51

Suggestive Evidence: Fuel Choice and Health
32
03
30
34
03
50
36
03
70
Avg L
ung C
apacity
2000
2007
2014
year
Kerosene−Kerosene−Kerosene
32
03
30
34
03
50
36
03
70
Avg
Lu
ng
Ca
pa
city
2000
2014
2007
Year
Kerosene−Kerosene−LPG
32
03
30
34
03
50
36
03
70
Avg
Lu
ng
Ca
pa
city
2000
2007
2014
year
Firewood−Kerosene−LPG
Figure 1: Average Lung Capacity Over Time
26 / 51

Is there any gender disparity in health?
Figure 2: Lung Capacity by Gender at Baseline
27 / 51

Fuel Switching by Duration of the ProgramFirst stage: Program Impacts on Fuel Choice
−.4
0
.4
.8
Tre
atm
ent E
ffect
0−2 3−4 5−6
Years of Exposure
LPG
−.8
−.4
0
.4
.8
Tre
atm
ent E
ffect
0−2 3−4 5−6
Years of Exposure
Kerosene
−.8
−.4
0
.4
.8
Tre
atm
ent E
ffect
0−2 3−4 5−6
Years of Exposure
Firewood
Years of exposure 0-2 years, 3-4 years, 5-6 years, are those individuals whoreceived LPG after 2014, 2013-2014, 2011-2012, 2009-2010, respectively.
28 / 51

4. Results: Program Impact on Health
Longer exposure to clean energy access leads to higher lungcapacity
Women Men
(1) (2) (3) (4) (5) (6) (7) (8)
EarlyExposure × Post 11.34** 11.34** 11.34** 11.34** 1.940 1.940 1.940 1.940(5.501) (5.502) (5.542) (5.500) (6.043) (6.044) (6.100) (6.042)
Control Mean 283 283 283 283 411 411 411 411Observations 7782 7782 7782 7782 6049 6049 6049 6049
Rural-Urban FE X X X XIndividual Controls X X X XDistrict FE X XIndividual FE X X
Magnitude: women who are exposed earlier experiencedimprovements in the lung capacity (4%) than those who areexposed later.
≈ if a regular smoker quits smoking for 10 years.29 / 51
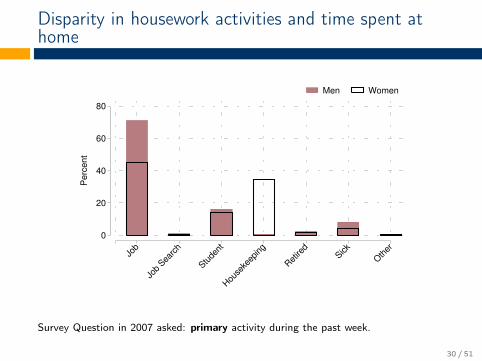
Disparity in housework activities and time spent athome
0
20
40
60
80
Pe
rce
nt
Jo
b
Job
Searc
h
Stude
nt
Hou
seke
eping
Ret
ired
Sick
Oth
er
Men Women
Survey Question in 2007 asked: primary activity during the past week.
30 / 51

Impact on lung capacity among women who mostlikely spent their time indoors
Women
(1) (2) (3) (4)
EarlyExposure × Post 6.91 6.91 6.91 6.91(5.42) (5.42) (5.46) (5.42)
EarlyExposure × Post × Housekeeper 11.89** 11.89** 11.89** 11.89**(5.67) (5.67) (5.71) (5.67)
Control Mean 283 283 283 283Observations 7782 7782 7782 7782
Rural-Urban FE X XIndividual Controls X XDistrict FE XIndividual FE X
31 / 51

4. Results: Program Impact on Health (β1)
Reduced gender disparity on health: increase in lung capacityamong women (4%) and no effects on menNo effects on other health measures (cough, weight,hypertension, self-reported health)Channels:1. Pollution (impact on lung, concentration on housekeepers,
driven by those who were exposed longer)2. Expenditure (reduce 2% or 2 USD monthly expenditure)3. Income, assets, education level (undetectable changes) table
4. Local economic growth (no impact on ineligible householdsliving in the same district) table
32 / 51

Program Impact on Other Outcomes
Other Health Outcomes Non-Health Outcomes(1) (2) (3) (4) (5) (6) (7)
Cough
SelfReportedHealth Weight Hypertension Education
PerCapitaIncome
Househas
electricity
EarlyExposure × Post -0.03 0.02 0.38 0.01 0.01 -13.51 -0.00(0.04) (0.02) (0.28) (0.01) (0.01) (30.01) (0.02)
Control Mean 0.35 0.82 53.90 0.02 0.92 206.88 0.96Observations 13505 13505 13505 13505 14169 12924 14169
33 / 51

Program Impact on Other Outcomes
Non-Health Outcomes Placebo Impact
(8) (9) (10) (11) (12) (13)
Own aRefrigerator
Own aTV
ToiletInsidehouse
Water SourceInsideHouse
Lung(All)
Lung(Housekeeper)
EarlyExposure × Post -0.02 -0.01 -0.00 -0.00(0.05) (0.03) (0.03) (0.06)
Placebo Sample -1.69 3.39(7.71) (14.91)
Control Mean 0.72 0.79 0.74 0.49 300.42 297.91Observations 14169 14169 14169 14169 872 294
34 / 51

Program Impact on Labor Outcomes
There are many factors that can influence labor outcomes.We hypothesize that (if any) labor outcome impact should beconcentrated among individuals who enjoyed the benefits fromthe program.We introduce two additional indicators for "if individuals aremore likely to be benefited from the program"1. Housekeeper at baseline (for women)2. Households where there is at least one women did
housekeeping at baseline (for men)
35 / 51

Heterogenous Impact on Work Hours (β1)
Subsample: individuals that are more likely to be benefited fromthe program
PANEL A : HOUSEKEEPER/ BELONG TO HOUSEKEEPER HOUSEHOLD
Women Men
(1) (2) (3) (4) (5) (6) (7) (8)
EarlyExposure × Post 31.69* 31.28* 31.61* 28.36 28.46*** 28.53*** 28.57*** 29.28***(17.35) (17.35) (18.43) (18.24) (10.61) (10.62) (10.88) (10.73)
Control Mean 152 152 152 152 211 211 211 211Observations 879 879 879 879 1718 1718 1718 1718
Rural-Urban FE X X X XIndividual Controls X X X XDistrict FE X XIndividual FE X X
36 / 51

Heterogenous Impact on Work Hours (β1)
The remaining sample (individuals that are less likely to bebenefited from the program)
PANEL B : NON-HOUSEKEEPER/ DOES NOT BELONG TO HOUSEKEEPER HOUSEHOLD
Women Men
(1) (2) (3) (4) (5) (6) (7) (8)
EarlyExposure × Post -4.206 -4.233 -3.920 -6.199 10.77 10.74 10.61 7.854(8.147) (8.147) (8.240) (8.302) (10.23) (10.21) (10.40) (10.28)
Control Mean 181 181 181 181 211 211 211 211Observations 3475 3475 3475 3475 3228 3228 3228 3228
Rural-Urban FE X X X XIndividual Controls X X X XDistrict FE X XIndividual FE X X
37 / 51

5. Results: Program Impact on Labor Outcomes
PANEL A : WOMEN
Hours Worked Per Month Work Status
(1) (2)
EarlyExposure × Post × Houskeeper 37.03** 0.173**(18.17) (0.0830)
Control Mean 175.62 0.25Observations 4352 2227
38 / 51

Program Impact on Health by Duration
−10
0
10
20
30
Tre
atm
en
t E
ffect
0−2 3−4 5−6
Years of Exposure
Women
−10
0
10
20
30
Tre
atm
en
t E
ffect
0−2 3−4 5−6
Years of Exposure
Men
Lung Capacity (L/Min)
39 / 51

Program Impact on Work Hours by Duration
−20
0
20
40
60
Tre
atm
en
t E
ffect
0−2 3−4 5−6
Years of Exposure
(Housework)
Women
−20
0
20
40
60
Tre
atm
en
t E
ffect
0−2 3−4 5−6
Years of Exposure
(Housework HH)
Men
Hours of Work per Month
40 / 51
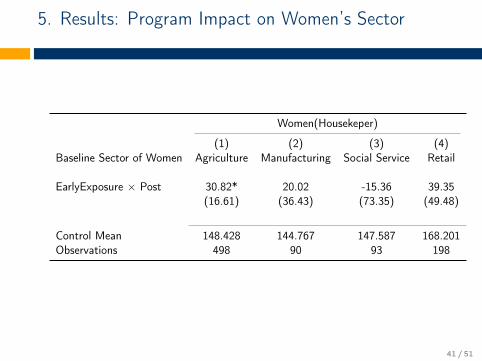
5. Results: Program Impact on Women’s Sector
Women(Housekeper)
(1) (2) (3) (4)Baseline Sector of Women Agriculture Manufacturing Social Service Retail
EarlyExposure × Post 30.82* 20.02 -15.36 39.35(16.61) (36.43) (73.35) (49.48)
Control Mean 148.428 144.767 147.587 168.201Observations 498 90 93 198
41 / 51
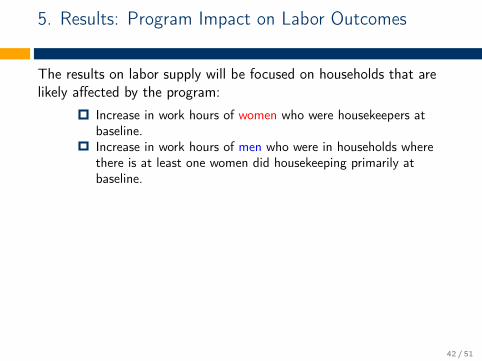
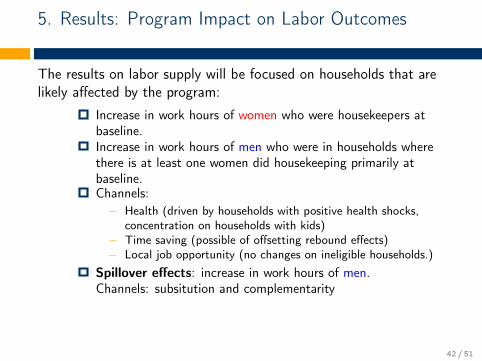
5. Results: Program Impact on Labor Outcomes
The results on labor supply will be focused on households that arelikely affected by the program:
Increase in work hours of women who were housekeepers atbaseline.Increase in work hours of men who were in households wherethere is at least one women did housekeeping primarily atbaseline.
Channels:− Health (driven by households with positive health shocks,
concentration on households with kids)− Time saving (possible of offsetting rebound effects)− Local job opportunity (no changes on ineligible households.)
Spillover effects: increase in work hours of men.Channels: subsitution and complementarity
42 / 51

5. Results: Program Impact on Labor Outcomes
The results on labor supply will be focused on households that arelikely affected by the program:
Increase in work hours of women who were housekeepers atbaseline.Increase in work hours of men who were in households wherethere is at least one women did housekeeping primarily atbaseline.Channels:
− Health (driven by households with positive health shocks,concentration on households with kids)
− Time saving (possible of offsetting rebound effects)− Local job opportunity (no changes on ineligible households.)
Spillover effects: increase in work hours of men.Channels: subsitution and complementarity
42 / 51

Substitution
Women can act as a substitute for men’s housekeeping efforts(columns 1-3). Subsequently, the program increases men’spropensity to have secondary job as men are likely to have somespare time from less unpaid housework activities (columns 4-6).
Help in Housework Secondary Job
(1) (2) (3) (4) (5) (6)
All menMen in
Houskpr HHMen in
Non-Houskpr HH All menMen in
Houskpr HHMen in
Non-Houskpr HH
EarlyExposure × Post -0.09* -0.16*** -0.05 0.08* 0.13** 0.06(0.05) (0.06) (0.06) (0.05) (0.05) (0.06)
Control Mean 0.246 0.228 0.256 0.353 0.325 0.368Observations 4106 1466 2640 5202 1810 3392
43 / 51

Complementarity
It is likely easier for women to pick up the slack or act as acomplement for men when there were both in the same sector atbaseline—proxy for similar skills.
Agriculture Area Cultivated Number of Crops (Variety)
(1) (2) (3) (4) (5) (6)
All HHBoth in
AgricultureBoth NOT inAgriculture All HH
Both inAgriculture
Both NOT inAgriculture
EarlyExposure × Post 0.25** 0.60* 0.11 0.36* 0.63 0.23(0.12) (0.31) (0.15) (0.21) (0.39) (0.21)
Control Mean 0.748 1.045 0.624 1.416 1.489 1.386Observations 1821 535 1286 1818 534 1284
44 / 51

Robustness
Coarsened Exact Matching CEM
− Direction as well as magnitude of the impact in consistent withearlier results
Poverty Alleviation Program PAP
− No systematic correlation of PAP with the timing and the eligibilityfor the clean cooking program
Sample Restrictions SR
− Impact is not highly sensitive to relaxing or restricting to varioussamples
45 / 51

Conclusion
Access to clean cooking improves women’s health and women’slabor outcomes.Although men accrued small or zero health benefits relative towomen, they also increased their working hours.Clean energy can benefited not only women but also men, ignoringthese spillover effects underestimates the benefit of clean energyaccess.Access to clean energy can not only support the 7th UN Sustainablegoal (SDG7) but also help to achieve gender equality (SDG5), goodhealth and well-being (SDG3).
46 / 51

Thank you!Comments? [email protected]
Draft (https://sites.google.com/a/hawaii.edu/imelda/research)
This Project has received funding from the European Research Council (ERC) under the EuropeanUnion’s Horizon 2020 research and innovation programme (grant agreement No 772331).

Expansion periods
02
46
Ke
rne
l d
en
sity
−.2 −.1 0 .1 .2Wealth index at baseline
2007−2008 2009−2011
2012−2014 >2014
Implementation year
Wealth Index
Focus on expansion periods, following Imelda (2020) Back
49 / 51

Labor impact concentrated on household withpositive health impact
PANEL A : WOMEN (Housekeeper)
Mean Change in HH Lung Capacity Placebo Impact
(1) (2) (3)Mean4 > 0 Mean4 ≤ 0 All
EarlyExposure × Post 44.81** 21.55 6.92(21.05) (27.32) (75.54)
Control Mean 153 155 158Observations 964 429 104
PANEL B : MEN
Mean Change in HH Lung Capacity Placebo Impact
(1) (2) (3)Mean4 > 0 Mean4 ≤ 0 All
EarlyExposure × Post 22.82*** -2.32 -8.79(8.79) (12.35) (16.36)
Control Mean 212 204 201Observations 3656 1547 515
Sample Eligible Ineligible
Back
50 / 51

The gap persists
Figure 3: Residuals of predicted lung capacity conditional on age andheight
51 / 51