Classification of Survey Respondents - Texas CMAA Region Survey Report.pdf · Club Position...
40
Classification of Survey Respondents Region (Question 87) 0.0 20.0 40.0 60.0 80.0 100.0 Frequency (%) Region Central North South West 100.00 0.00 0.00 0.00 Region Central North South West Totals Forms 21 100.0% 0 0.0% 0 0.0% 0 0.0% 21 100.0% 21 TLSC of CMAA 2014 Central Region Membership Survey Report Page 1
Transcript of Classification of Survey Respondents - Texas CMAA Region Survey Report.pdf · Club Position...
Classification of Survey Respondents
Region(Question 87)
0.0 20.0 40.0 60.0 80.0 100.0
Frequency (%)
Region
Central
North
South
West
100.00
0.00
0.00
0.00
RegionCentral
North
South
West
Totals
Forms
21100.0%
00.0%
00.0%
00.0%
21100.0%
21
TLSC of CMAA 2014 Central Region Membership Survey Report Page 1
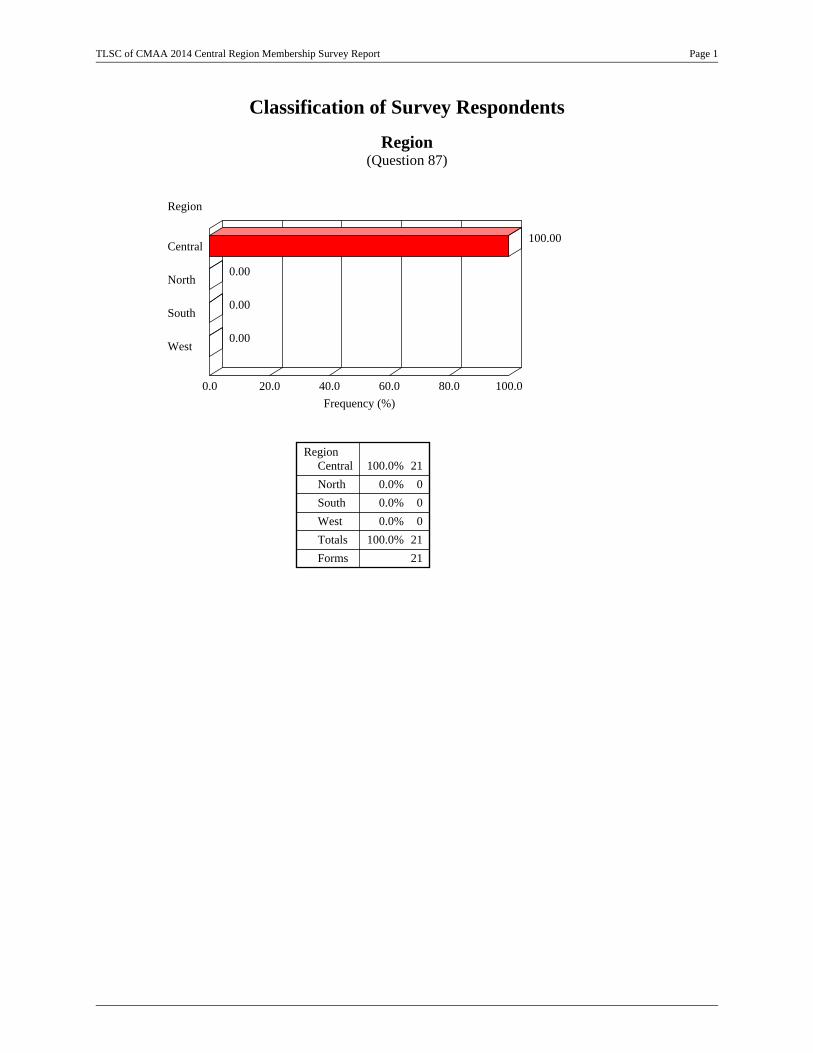
Length of TLSC Membership(Question 88)
0.0 20.0 40.0 60.0 80.0 100.0
Frequency (%)
Length of TLSC membership
Two years orless
3 to 5 years
6 to 10 years
11 to 15 years
Over 15 years
9.52
19.05
0.00
23.81
47.62
Length of TLSCmembership
Two years or less
3 to 5 years
6 to 10 years
11 to 15 years
Over 15 years
Totals
Forms
Median
29.5%
419.0%
00.0%
523.8%
1047.6%
21100.0%
21
4.40
Length of National CMAA Membership(Question 89)
0.0 20.0 40.0 60.0 80.0 100.0
Frequency (%)
Length of National CMAA membership
Two years orless
3 to 5 years
6 to 10 years
11 to 15 years
Over 15 years
0.00
0.00
0.00
14.29
85.71
Length of NationalCMAA membership
Two years or less
3 to 5 years
6 to 10 years
11 to 15 years
Over 15 years
Totals
Forms
Median
00.0%
00.0%
00.0%
314.3%
1885.7%
21100.0%
21
4.92
TLSC of CMAA 2014 Central Region Membership Survey Report Page 2

Age(Question 90)
0.0 20.0 40.0 60.0 80.0 100.0
Frequency (%)
Age
Under 30
30 to 39
40 to 49
50 to 59
60 to 69
70 andover
0.00
0.00
4.76
57.14
19.05
19.05
AgeUnder 30
30 to 39
40 to 49
50 to 59
60 to 69
70 and over
Totals
Forms
Median
00.0%
00.0%
14.8%
1257.1%
419.0%
419.0%
21100.0%
21
4.29
Gender(Question 91)
0.0 20.0 40.0 60.0 80.0 100.0
Frequency (%)
Gender
Male
Female
100.00
0.00
GenderMale
Totals
Forms
21100.0%
21100.0%
21
TLSC of CMAA 2014 Central Region Membership Survey Report Page 3
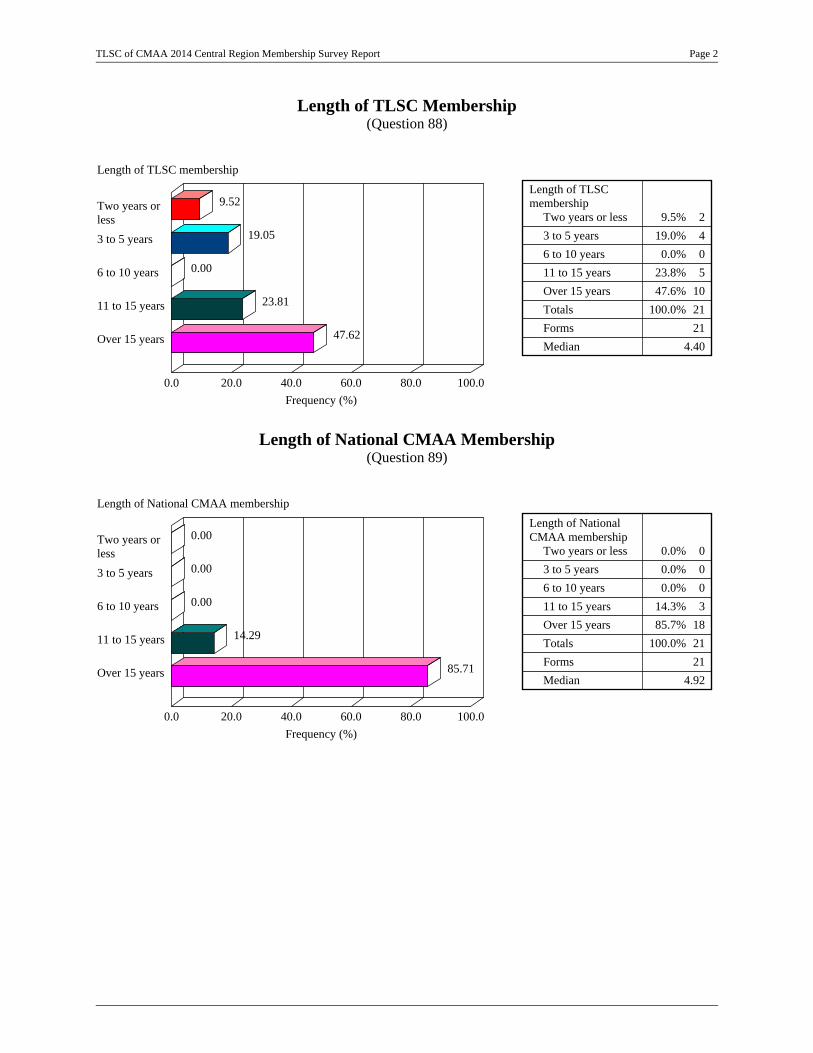
Club Position(Question 92)
0.0 20.0 40.0 60.0 80.0 100.0
Frequency (%)
Club Position
COO/GM/ClubManager
Departmenthead/director
Assistant Manager
94.74
5.26
0.00
Club PositionCOO/GM/ClubManager
Other
Totals
Forms
1894.7%
15.3%
19100.0%
21
CMAA Certification Status (CCM)(Question 93)
0.0 20.0 40.0 60.0 80.0 100.0
Frequency (%)
CMAA certification status (CCM)
CCM certifiedalready
Nearly certified
Pursuingcertification
Not seekingcertification
71.43
0.00
9.52
19.05
CMAA certificationstatus (CCM)
CCM certifiedalready
Nearly certified
Pursuingcertification
Not seekingcertification
Totals
Forms
1571.4%
00.0%
29.5%
419.0%
21100.0%
21
TLSC of CMAA 2014 Central Region Membership Survey Report Page 4
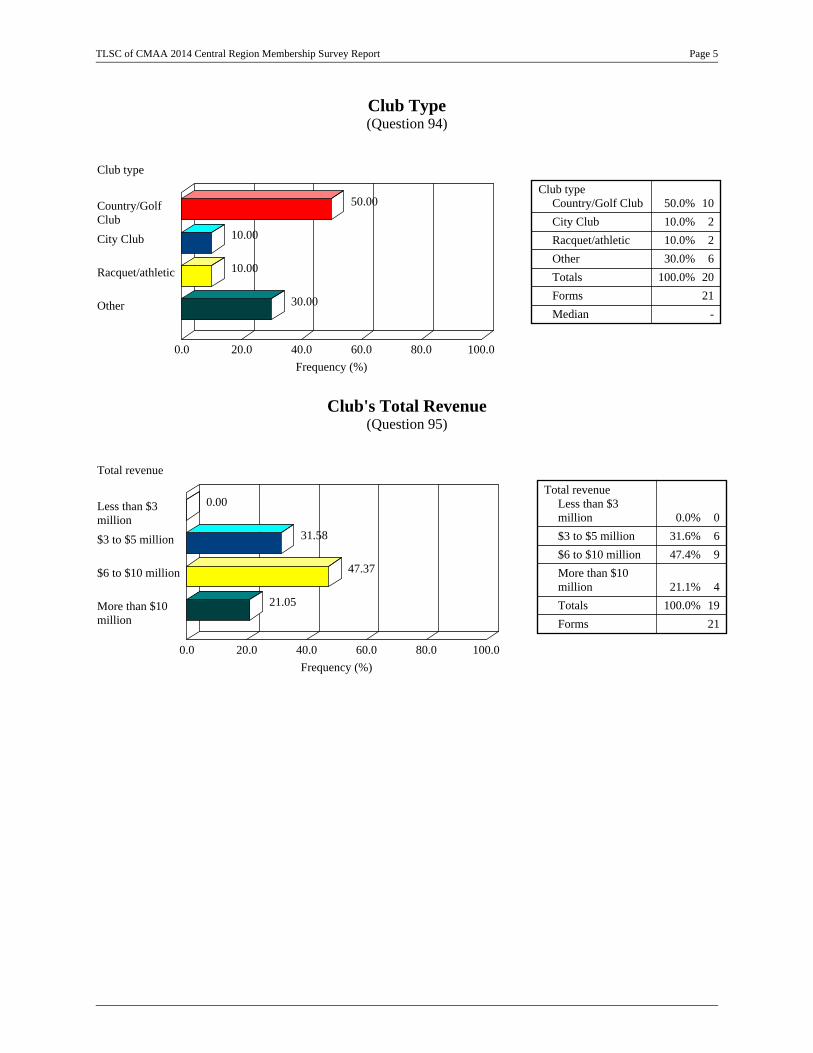
Club Type(Question 94)
0.0 20.0 40.0 60.0 80.0 100.0
Frequency (%)
Club type
Country/GolfClub
City Club
Racquet/athletic
Other
50.00
10.00
10.00
30.00
Club typeCountry/Golf Club
City Club
Racquet/athletic
Other
Totals
Forms
Median
1050.0%
210.0%
210.0%
630.0%
20100.0%
21
-
Club's Total Revenue(Question 95)
0.0 20.0 40.0 60.0 80.0 100.0
Frequency (%)
Total revenue
Less than $3million
$3 to $5 million
$6 to $10 million
More than $10million
0.00
31.58
47.37
21.05
Total revenueLess than $3million
$3 to $5 million
$6 to $10 million
More than $10million
Totals
Forms
00.0%
631.6%
947.4%
421.1%
19100.0%
21
TLSC of CMAA 2014 Central Region Membership Survey Report Page 5
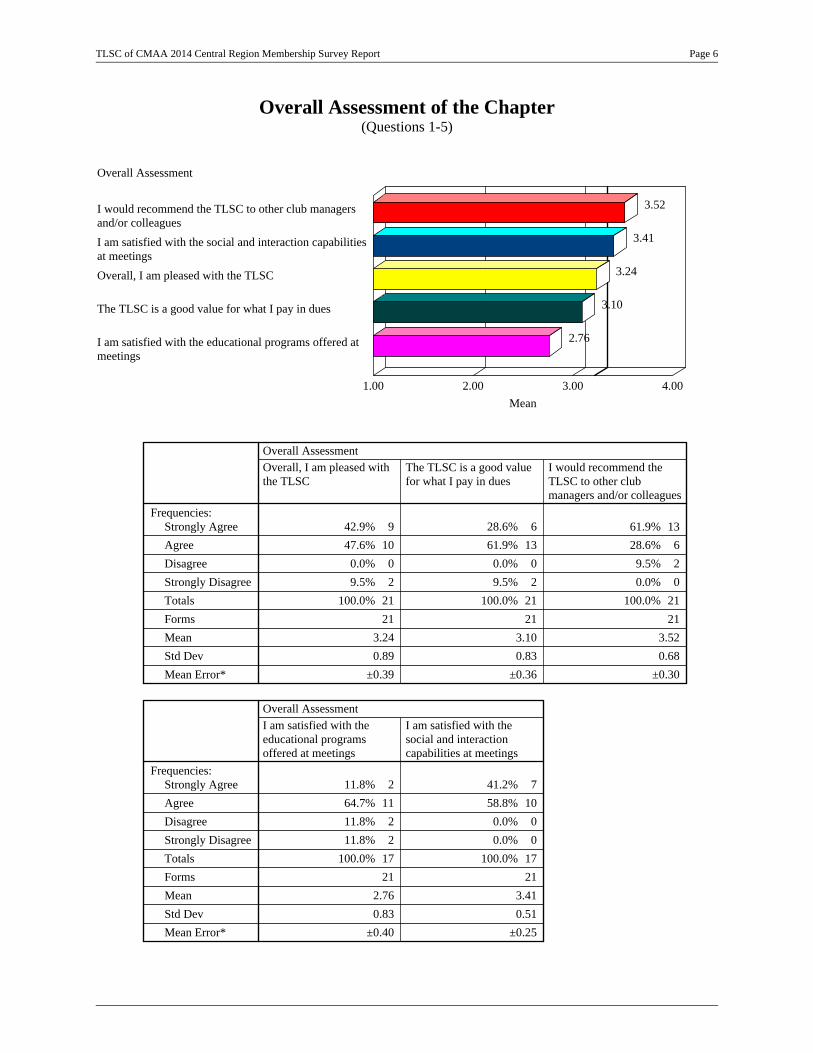
Overall Assessment of the Chapter(Questions 1-5)
1.00 2.00 3.00 4.00
Mean
Overall Assessment
I would recommend the TLSC to other club managersand/or colleagues
I am satisfied with the social and interaction capabilitiesat meetings
Overall, I am pleased with the TLSC
The TLSC is a good value for what I pay in dues
I am satisfied with the educational programs offered atmeetings
3.52
3.41
3.24
3.10
2.76
Frequencies:Strongly Agree
Agree
Disagree
Strongly Disagree
Totals
Forms
Mean
Std Dev
Mean Error*
Overall, I am pleased withthe TLSC
Overall Assessment
942.9%
1047.6%
00.0%
29.5%
21100.0%
21
3.24
0.89
±0.39
The TLSC is a good valuefor what I pay in dues
628.6%
1361.9%
00.0%
29.5%
21100.0%
21
3.10
0.83
±0.36
I would recommend theTLSC to other clubmanagers and/or colleagues
1361.9%
628.6%
29.5%
00.0%
21100.0%
21
3.52
0.68
±0.30
Frequencies:Strongly Agree
Agree
Disagree
Strongly Disagree
Totals
Forms
Mean
Std Dev
Mean Error*
I am satisfied with theeducational programsoffered at meetings
Overall Assessment
211.8%
1164.7%
211.8%
211.8%
17100.0%
21
2.76
0.83
±0.40
I am satisfied with thesocial and interactioncapabilities at meetings
741.2%
1058.8%
00.0%
00.0%
17100.0%
21
3.41
0.51
±0.25
TLSC of CMAA 2014 Central Region Membership Survey Report Page 6

* Note: Mean error covers 95% of distribution.
TLSC of CMAA 2014 Central Region Membership Survey Report Page 7

Importance of TLSC Areas(Questions 6-15)
1.00 2.00 3.00 4.00
Mean
Importance & Satisfaction Level--Importance Level
Communication-Importance Level
Networking-Importance Level
Education-Importance Level
Professional Development-Importance Level
Just lunch, just breakfast, just dinner events-ImportanceLevel
Job prospecting-Importance Level
Management resources-Importance Level
University student chapters and TLSC relationships-Importance Level
Social activities-Importance Level
Affiliation with national CMAA-Importance Level
3.90
3.81
3.68
3.68
3.43
3.29
3.29
3.14
3.11
3.05
Frequencies:Very Important
Somewhat Important
Little Importance
Not Needed
Totals
Forms
Mean
Std Dev
Mean Error*
ProfessionalDevelopment-Importance Level
Importance & Satisfaction Level--Importance Level
1368.4%
631.6%
00.0%
00.0%
19100.0%
21
3.68
0.48
±0.22
Education-Importance Level
1578.9%
210.5%
210.5%
00.0%
19100.0%
21
3.68
0.67
±0.31
Affiliation withnational CMAA-Importance Level
526.3%
1052.6%
421.1%
00.0%
19100.0%
21
3.05
0.71
±0.32
Networking-Importance Level
1990.5%
00.0%
29.5%
00.0%
21100.0%
21
3.81
0.60
±0.26
TLSC of CMAA 2014 Central Region Membership Survey Report Page 8

* Note: Mean error covers 95% of distribution.
Frequencies:Very Important
Somewhat Important
Little Importance
Not Needed
Totals
Forms
Mean
Std Dev
Mean Error*
Social activities-Importance Level
Importance & Satisfaction Level--Importance Level
842.1%
526.3%
631.6%
00.0%
19100.0%
21
3.11
0.88
±0.40
Job prospecting-Importance Level
838.1%
1152.4%
29.5%
00.0%
21100.0%
21
3.29
0.64
±0.28
Managementresources-Importance Level
838.1%
1152.4%
29.5%
00.0%
21100.0%
21
3.29
0.64
±0.28
Communication-Importance Level
1990.5%
29.5%
00.0%
00.0%
21100.0%
21
3.90
0.30
±0.13
Frequencies:Very Important
Somewhat Important
Little Importance
Not Needed
Totals
Forms
Mean
Std Dev
Mean Error*
University studentchapters and TLSCrelationships-Importance Level
Importance & Satisfaction Level--Importance Level
733.3%
1047.6%
419.0%
00.0%
21100.0%
21
3.14
0.73
±0.32
Just lunch, justbreakfast, justdinner events-Importance Level
1152.4%
838.1%
29.5%
00.0%
21100.0%
21
3.43
0.68
±0.30
TLSC of CMAA 2014 Central Region Membership Survey Report Page 9

Satisfaction with TLSC Areas(Questions 6-15)
1.00 2.00 3.00 4.00
Mean
Importance & Satisfaction Level--Satisfaction Level
Networking-Satisfaction Level
Social activities-Satisfaction Level
Communication-Satisfaction Level
Just lunch, just breakfast, just dinner events-SatisfactionLevel
Management resources-Satisfaction Level
Professional Development-Satisfaction Level
Education-Satisfaction Level
Job prospecting-Satisfaction Level
Affiliation with national CMAA-Satisfaction Level
University student chapters and TLSC relationships-Satisfaction Level
3.47
3.47
3.42
3.37
3.11
3.00
2.88
2.81
2.79
2.79
Frequencies:Very Satisfied
Satisfied
Dissatisfied
Very Dissatisfied
Totals
Forms
Mean
Std Dev
Mean Error*
ProfessionalDevelopment-Satisfaction Level
Importance & Satisfaction Level--Satisfaction Level
211.8%
1376.5%
211.8%
00.0%
17100.0%
21
3.00
0.50
±0.24
Education-Satisfaction Level
211.8%
1376.5%
00.0%
211.8%
17100.0%
21
2.88
0.78
±0.38
Affiliation withnational CMAA-Satisfaction Level
00.0%
1789.5%
00.0%
210.5%
19100.0%
21
2.79
0.63
±0.29
Networking-Satisfaction Level
1157.9%
631.6%
210.5%
00.0%
19100.0%
21
3.47
0.70
±0.32
TLSC of CMAA 2014 Central Region Membership Survey Report Page 10
* Note: Mean error covers 95% of distribution.
Frequencies:Very Satisfied
Satisfied
Dissatisfied
Very Dissatisfied
Totals
Forms
Mean
Std Dev
Mean Error*
Social activities-Satisfaction Level
Importance & Satisfaction Level--Satisfaction Level
847.1%
952.9%
00.0%
00.0%
17100.0%
21
3.47
0.51
±0.25
Job prospecting-Satisfaction Level
29.5%
1571.4%
29.5%
29.5%
21100.0%
21
2.81
0.75
±0.33
Managementresources-Satisfaction Level
631.6%
947.4%
421.1%
00.0%
19100.0%
21
3.11
0.74
±0.34
Communication-Satisfaction Level
842.1%
1157.9%
00.0%
00.0%
19100.0%
21
3.42
0.51
±0.23
Frequencies:Very Satisfied
Satisfied
Dissatisfied
Very Dissatisfied
Totals
Forms
Mean
Std Dev
Mean Error*
University studentchapters and TLSCrelationships-Satisfaction Level
Importance & Satisfaction Level--Satisfaction Level
00.0%
1578.9%
421.1%
00.0%
19100.0%
21
2.79
0.42
±0.19
Just lunch, justbreakfast, justdinner events-Satisfaction Level
736.8%
1263.2%
00.0%
00.0%
19100.0%
21
3.37
0.50
±0.23
TLSC of CMAA 2014 Central Region Membership Survey Report Page 11
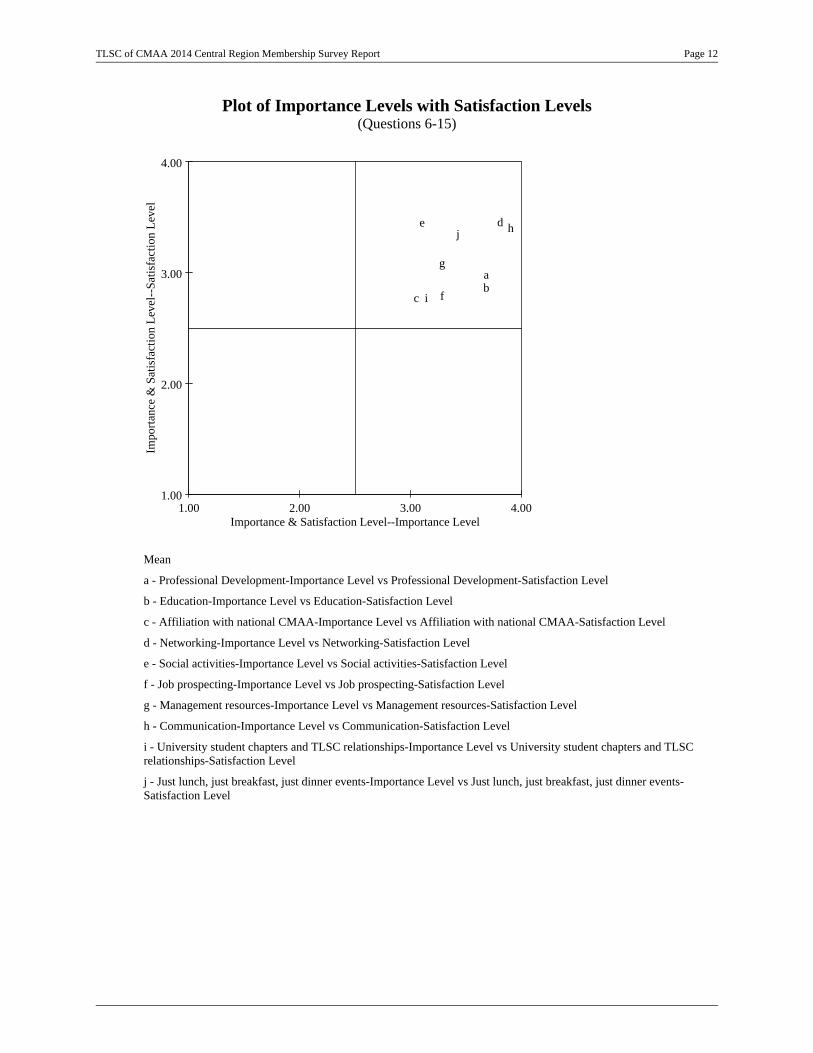
Plot of Importance Levels with Satisfaction Levels(Questions 6-15)
1.00 2.00 3.00 4.00Importance & Satisfaction Level--Importance Level
1.00
2.00
3.00
4.00Im
port
ance
& S
atis
fact
ion
Lev
el--
Sat
isfa
ctio
n L
evel
ab
c
de
f
g
h
i
j
Mean
a - Professional Development-Importance Level vs Professional Development-Satisfaction Level
b - Education-Importance Level vs Education-Satisfaction Level
c - Affiliation with national CMAA-Importance Level vs Affiliation with national CMAA-Satisfaction Level
d - Networking-Importance Level vs Networking-Satisfaction Level
e - Social activities-Importance Level vs Social activities-Satisfaction Level
f - Job prospecting-Importance Level vs Job prospecting-Satisfaction Level
g - Management resources-Importance Level vs Management resources-Satisfaction Level
h - Communication-Importance Level vs Communication-Satisfaction Level
i - University student chapters and TLSC relationships-Importance Level vs University student chapters and TLSCrelationships-Satisfaction Level
j - Just lunch, just breakfast, just dinner events-Importance Level vs Just lunch, just breakfast, just dinner events-Satisfaction Level
TLSC of CMAA 2014 Central Region Membership Survey Report Page 12
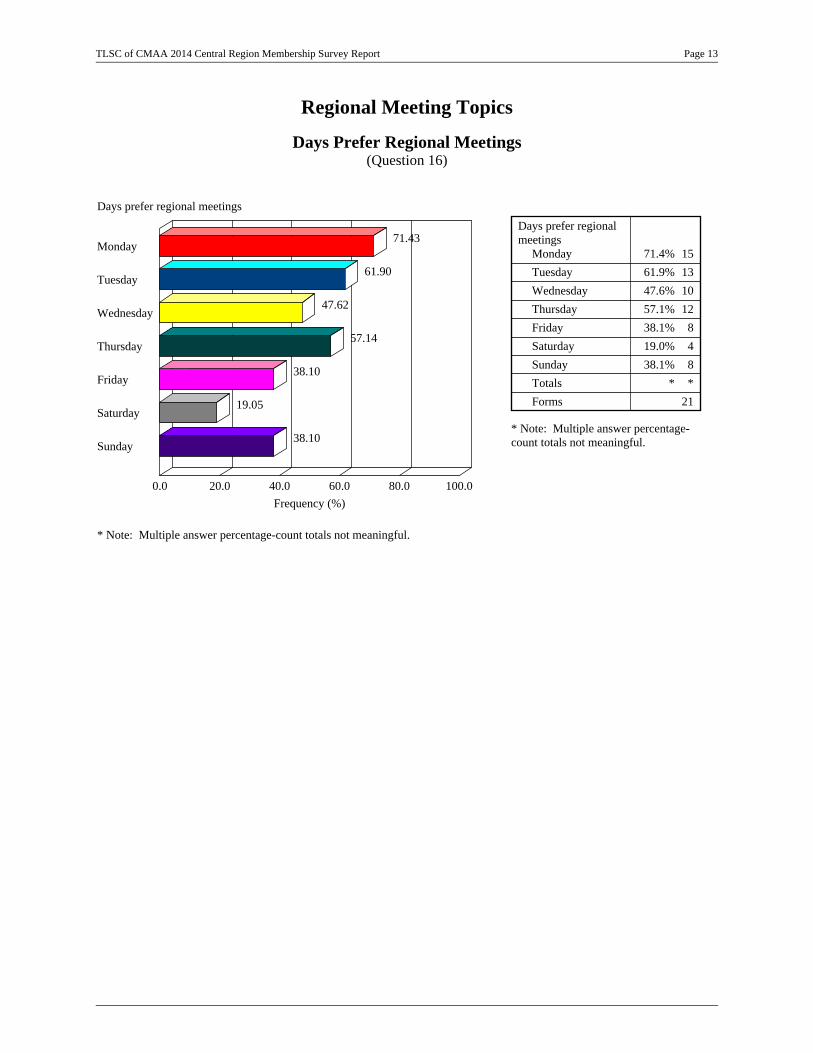
Regional Meeting Topics
Days Prefer Regional Meetings(Question 16)
* Note: Multiple answer percentage-count totals not meaningful.
0.0 20.0 40.0 60.0 80.0 100.0
Frequency (%)
Days prefer regional meetings
Monday
Tuesday
Wednesday
Thursday
Friday
Saturday
Sunday
71.43
61.90
47.62
57.14
38.10
19.05
38.10* Note: Multiple answer percentage-count totals not meaningful.
Days prefer regionalmeetings
Monday
Tuesday
Wednesday
Thursday
Friday
Saturday
Sunday
Totals
Forms
1571.4%
1361.9%
1047.6%
1257.1%
838.1%
419.0%
838.1%
**
21
TLSC of CMAA 2014 Central Region Membership Survey Report Page 13
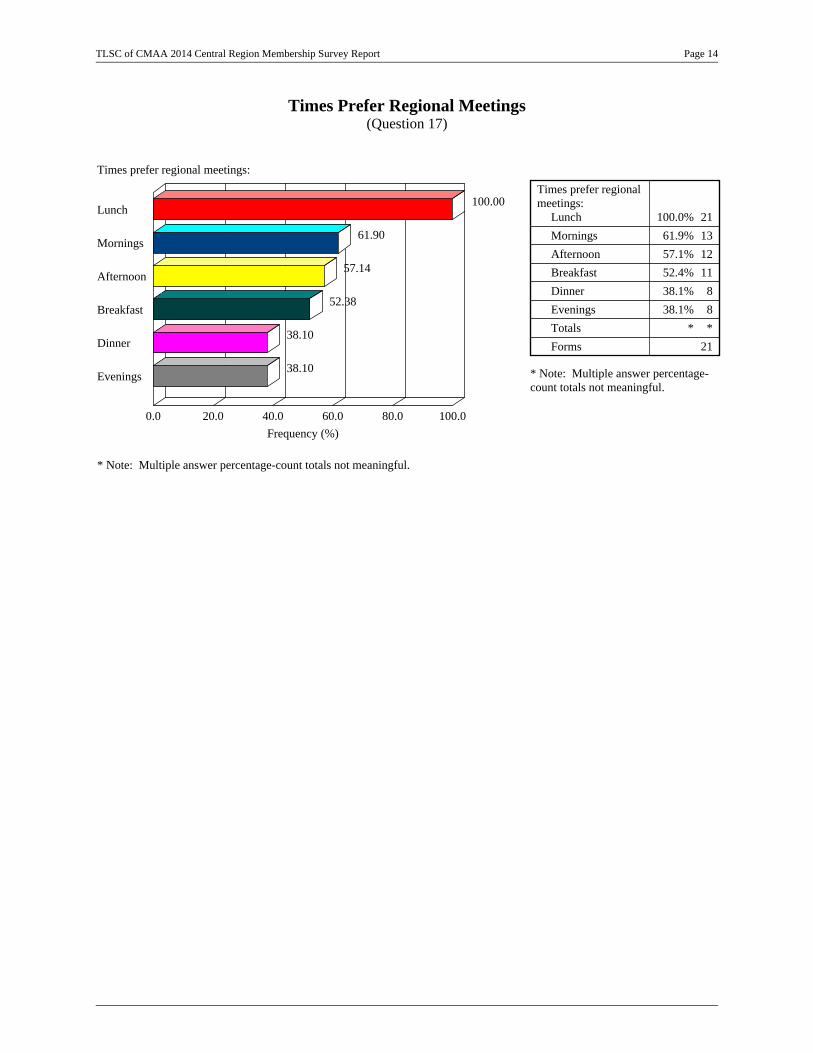
Times Prefer Regional Meetings(Question 17)
* Note: Multiple answer percentage-count totals not meaningful.
0.0 20.0 40.0 60.0 80.0 100.0
Frequency (%)
Times prefer regional meetings:
Lunch
Mornings
Afternoon
Breakfast
Dinner
Evenings
100.00
61.90
57.14
52.38
38.10
38.10 * Note: Multiple answer percentage-count totals not meaningful.
Times prefer regionalmeetings:
Lunch
Mornings
Afternoon
Breakfast
Dinner
Evenings
Totals
Forms
21100.0%
1361.9%
1257.1%
1152.4%
838.1%
838.1%
**
21
TLSC of CMAA 2014 Central Region Membership Survey Report Page 14

Number of Annual Regional Meetings Anticipating to Attend(Question 18)
0.0 20.0 40.0 60.0 80.0 100.0
Frequency (%)
Number of regional education meetings
1-3
4-6
7-9
10-12
57.14
42.86
0.00
0.00
Number of regionaleducation meetings
1-3
4-6
7-9
10-12
Totals
Forms
1257.1%
942.9%
00.0%
00.0%
21100.0%
21
TLSC of CMAA 2014 Central Region Membership Survey Report Page 15
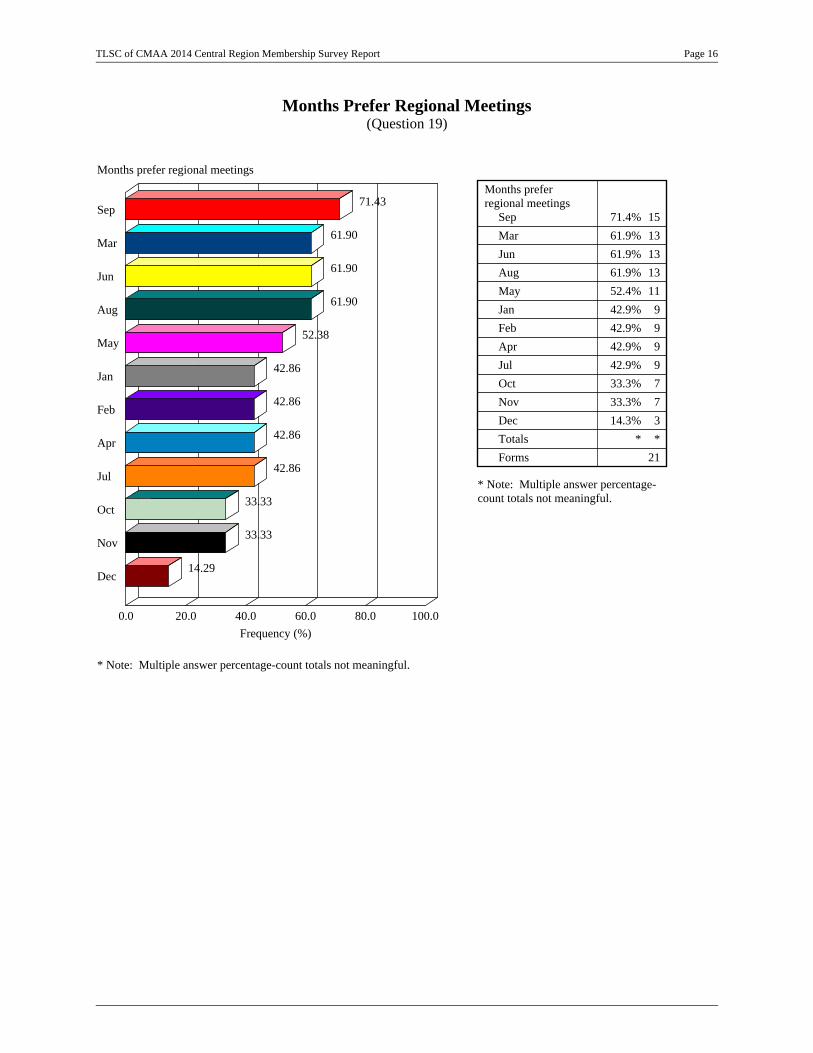
Months Prefer Regional Meetings(Question 19)
* Note: Multiple answer percentage-count totals not meaningful.
0.0 20.0 40.0 60.0 80.0 100.0
Frequency (%)
Months prefer regional meetings
Sep
Mar
Jun
Aug
May
Jan
Feb
Apr
Jul
Oct
Nov
Dec
71.43
61.90
61.90
61.90
52.38
42.86
42.86
42.86
42.86
33.33
33.33
14.29
* Note: Multiple answer percentage-count totals not meaningful.
Months preferregional meetings
Sep
Mar
Jun
Aug
May
Jan
Feb
Apr
Jul
Oct
Nov
Dec
Totals
Forms
1571.4%
1361.9%
1361.9%
1361.9%
1152.4%
942.9%
942.9%
942.9%
942.9%
733.3%
733.3%
314.3%
**
21
TLSC of CMAA 2014 Central Region Membership Survey Report Page 16

Preferred Length of Regional Meetings(Question 20)
0.0 20.0 40.0 60.0 80.0 100.0
Frequency (%)
Preferred length of regional meetings
1.5-2 hour session
Half-day session (3-4 hours)
6 hour CMI program
52.94
35.29
11.76
Preferred length ofregional meetings
1.5-2 hour session
Half-day session(3-4 hours)
6 hour CMIprogram
Totals
Forms
952.9%
635.3%
211.8%
17100.0%
21
TLSC of CMAA 2014 Central Region Membership Survey Report Page 17

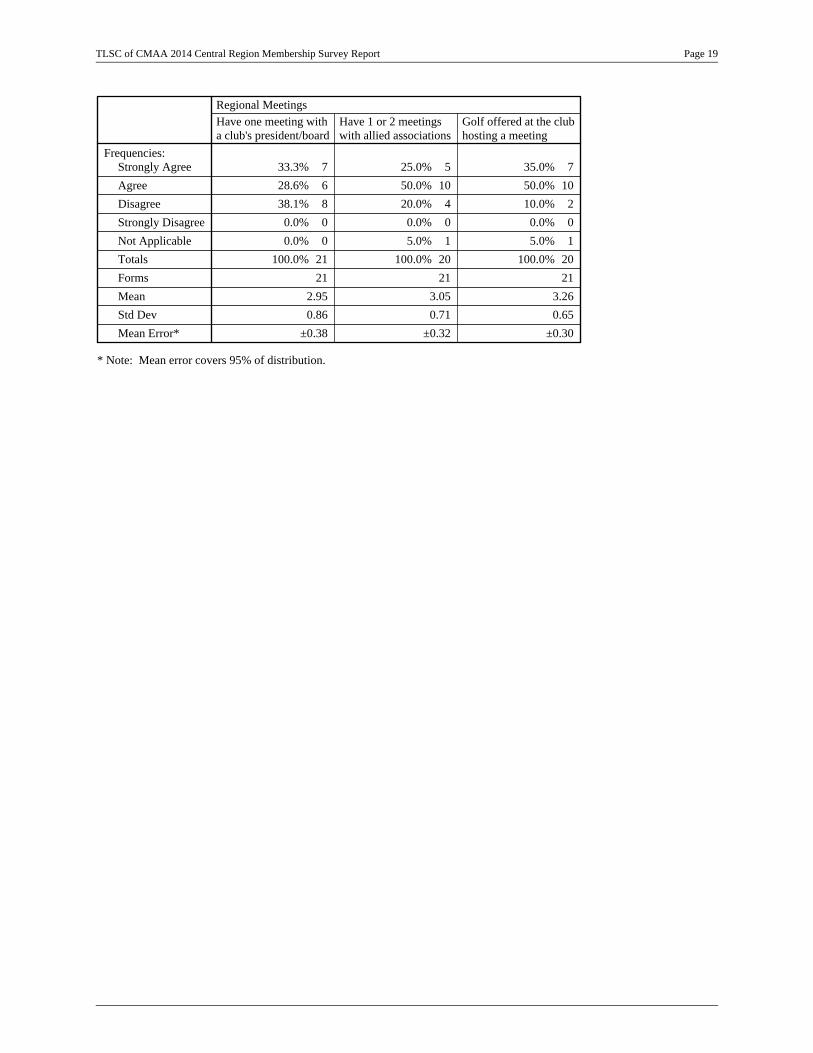
Regional Meeting Issues(Questions 21-27)
1.00 2.00 3.00 4.00
Mean
Regional Meetings
Have social activity & educational & business
Golf offered at the club hosting a meeting
Have 1 or 2 meetings with allied associations
Local regions should have holiday social
Have one meeting with a club's president/board
Regional meetings to be on the same day
Have educational & business sessions only
3.68
3.26
3.05
3.00
2.95
2.90
1.42
Frequencies:Strongly Agree
Agree
Disagree
Strongly Disagree
Not Applicable
Totals
Forms
Mean
Std Dev
Mean Error*
Regional meetings tobe on the same day
Regional Meetings
29.5%
1466.7%
419.0%
00.0%
14.8%
21100.0%
21
2.90
0.55
±0.25
Local regions shouldhave holiday social
210.5%
1263.2%
210.5%
00.0%
315.8%
19100.0%
21
3.00
0.52
±0.26
Have educational &business sessions only
00.0%
210.0%
420.0%
1365.0%
15.0%
20100.0%
21
1.42
0.69
±0.32
Have social activity &educational & business
1575.0%
210.0%
210.0%
00.0%
15.0%
20100.0%
21
3.68
0.67
±0.31
TLSC of CMAA 2014 Central Region Membership Survey Report Page 18
* Note: Mean error covers 95% of distribution.
Frequencies:Strongly Agree
Agree
Disagree
Strongly Disagree
Not Applicable
Totals
Forms
Mean
Std Dev
Mean Error*
Have one meeting witha club's president/board
Regional Meetings
733.3%
628.6%
838.1%
00.0%
00.0%
21100.0%
21
2.95
0.86
±0.38
Have 1 or 2 meetingswith allied associations
525.0%
1050.0%
420.0%
00.0%
15.0%
20100.0%
21
3.05
0.71
±0.32
Golf offered at the clubhosting a meeting
735.0%
1050.0%
210.0%
00.0%
15.0%
20100.0%
21
3.26
0.65
±0.30
TLSC of CMAA 2014 Central Region Membership Survey Report Page 19

Statewide Meeting Topics
Preferred Length of State Meetings(Question 29)
0.0 20.0 40.0 60.0 80.0 100.0
Frequency (%)
Preferred length of state meetings
1-day sessions
2-day sessions
3-day sessions
19.05
80.95
0.00
Preferred length ofstate meetings
1-day sessions
2-day sessions
3-day sessions
Totals
Forms
419.0%
1781.0%
00.0%
21100.0%
21
TLSC of CMAA 2014 Central Region Membership Survey Report Page 20

Days Prefer State Meetings(Question 30)
* Note: Multiple answer percentage-count totals not meaningful.
0.0 20.0 40.0 60.0 80.0 100.0
Frequency (%)
Days prefer state meetings
Monday
Tuesday
Wednesday
Thursday
Friday
Saturday
Sunday
90.48
61.90
9.52
9.52
9.52
19.05
66.67* Note: Multiple answer percentage-count totals not meaningful.
Days prefer statemeetings
Monday
Tuesday
Wednesday
Thursday
Friday
Saturday
Sunday
Totals
Forms
1990.5%
1361.9%
29.5%
29.5%
29.5%
419.0%
1466.7%
**
21
TLSC of CMAA 2014 Central Region Membership Survey Report Page 21
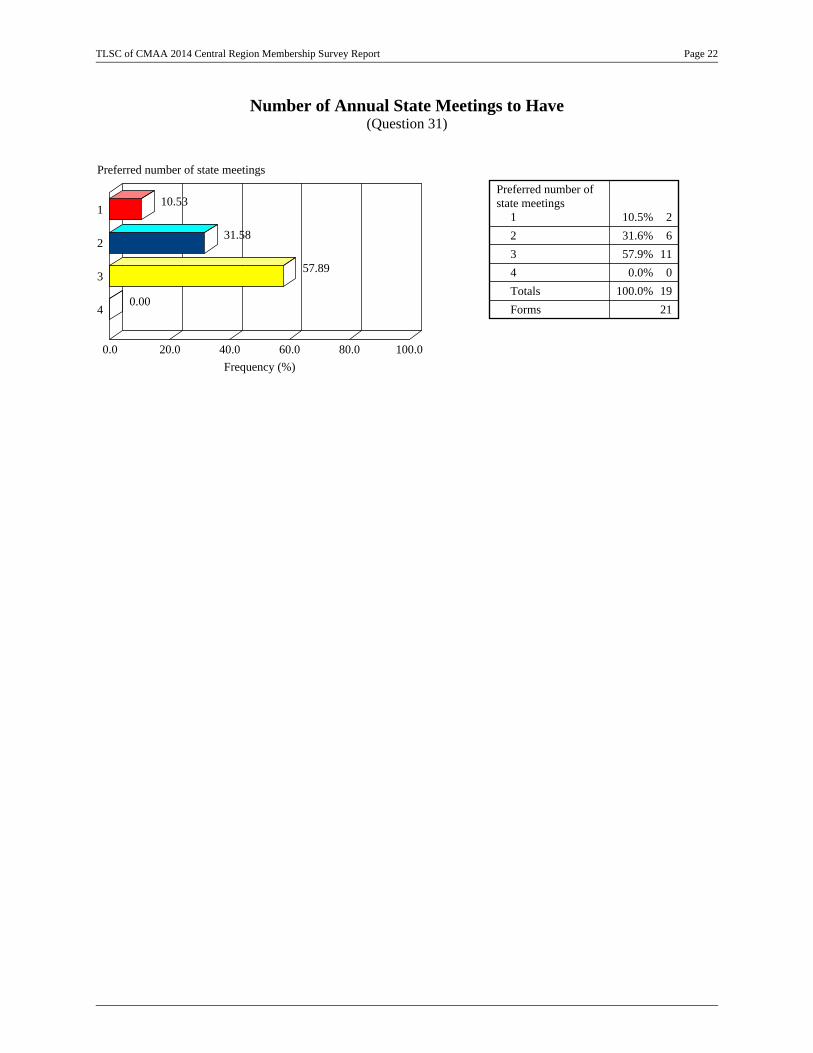
Number of Annual State Meetings to Have(Question 31)
0.0 20.0 40.0 60.0 80.0 100.0
Frequency (%)
Preferred number of state meetings
1
2
3
4
10.53
31.58
57.89
0.00
Preferred number ofstate meetings
1
2
3
4
Totals
Forms
210.5%
631.6%
1157.9%
00.0%
19100.0%
21
TLSC of CMAA 2014 Central Region Membership Survey Report Page 22

Months Prefer Statewide Meetings(Question 32)
* Note: Multiple answer percentage-count totals not meaningful.
0.0 20.0 40.0 60.0 80.0 100.0
Frequency (%)
Months prefer state meetings
Jul
Nov
Apr
Mar
May
Aug
Sep
Oct
Jan
Feb
Jun
Dec
80.95
57.14
42.86
38.10
28.57
28.57
28.57
23.81
19.05
9.52
9.52
0.00
* Note: Multiple answer percentage-count totals not meaningful.
Months prefer statemeetings
Jul
Nov
Apr
Mar
May
Aug
Sep
Oct
Jan
Feb
Jun
Dec
Totals
Forms
1781.0%
1257.1%
942.9%
838.1%
628.6%
628.6%
628.6%
523.8%
419.0%
29.5%
29.5%
00.0%
**
21
TLSC of CMAA 2014 Central Region Membership Survey Report Page 23

Preferred Cities for Statewide Meetings(Question 33)
* Note: Multiple answer percentage-count totals not meaningful.
0.0 20.0 40.0 60.0 80.0 100.0
Frequency (%)
Cities preferred for state meetings
Austin
Dallas/FW
Houston
San Antonio
Corpus Christi
El Paso
Padre Island
Other
85.00
85.00
75.00
75.00
70.00
40.00
30.00
30.00
* Note: Multiple answer percentage-count totals not meaningful.
Cities preferred forstate meetings
Austin
Dallas/FW
Houston
San Antonio
Corpus Christi
El Paso
Padre Island
Other
Totals
Forms
1785.0%
1785.0%
1575.0%
1575.0%
1470.0%
840.0%
630.0%
630.0%
**
21
TLSC of CMAA 2014 Central Region Membership Survey Report Page 24
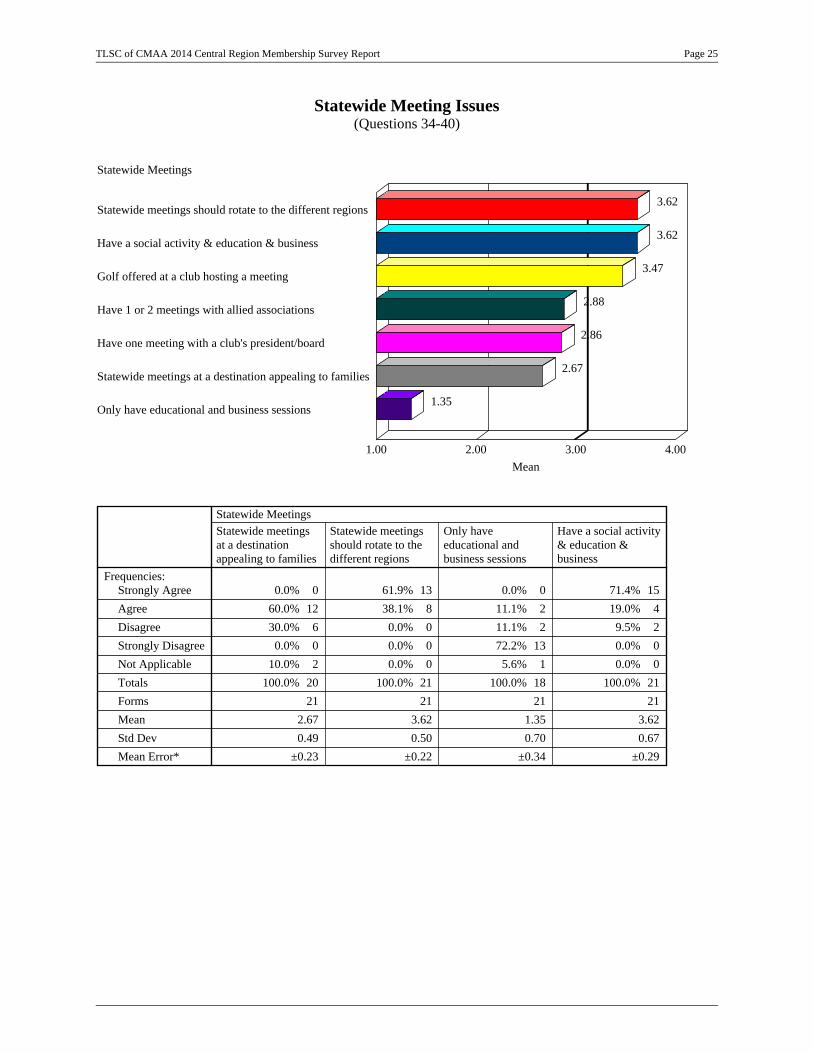
Statewide Meeting Issues(Questions 34-40)
1.00 2.00 3.00 4.00
Mean
Statewide Meetings
Statewide meetings should rotate to the different regions
Have a social activity & education & business
Golf offered at a club hosting a meeting
Have 1 or 2 meetings with allied associations
Have one meeting with a club's president/board
Statewide meetings at a destination appealing to families
Only have educational and business sessions
3.62
3.62
3.47
2.88
2.86
2.67
1.35
Frequencies:Strongly Agree
Agree
Disagree
Strongly Disagree
Not Applicable
Totals
Forms
Mean
Std Dev
Mean Error*
Statewide meetingsat a destinationappealing to families
Statewide Meetings
00.0%
1260.0%
630.0%
00.0%
210.0%
20100.0%
21
2.67
0.49
±0.23
Statewide meetingsshould rotate to thedifferent regions
1361.9%
838.1%
00.0%
00.0%
00.0%
21100.0%
21
3.62
0.50
±0.22
Only haveeducational andbusiness sessions
00.0%
211.1%
211.1%
1372.2%
15.6%
18100.0%
21
1.35
0.70
±0.34
Have a social activity& education &business
1571.4%
419.0%
29.5%
00.0%
00.0%
21100.0%
21
3.62
0.67
±0.29
TLSC of CMAA 2014 Central Region Membership Survey Report Page 25
* Note: Mean error covers 95% of distribution.
Frequencies:Strongly Agree
Agree
Disagree
Strongly Disagree
Not Applicable
Totals
Forms
Mean
Std Dev
Mean Error*
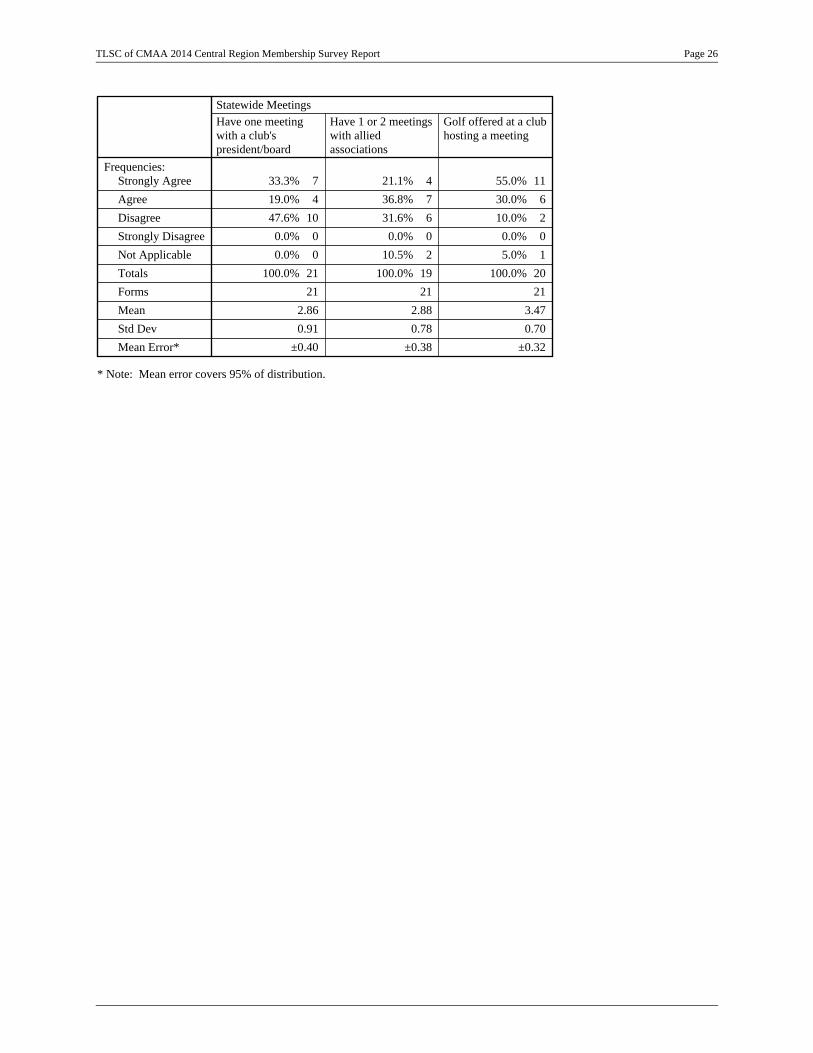
Have one meetingwith a club'spresident/board
Statewide Meetings
733.3%
419.0%
1047.6%
00.0%
00.0%
21100.0%
21
2.86
0.91
±0.40
Have 1 or 2 meetingswith alliedassociations
421.1%
736.8%
631.6%
00.0%
210.5%
19100.0%
21
2.88
0.78
±0.38
Golf offered at a clubhosting a meeting
1155.0%
630.0%
210.0%
00.0%
15.0%
20100.0%
21
3.47
0.70
±0.32
TLSC of CMAA 2014 Central Region Membership Survey Report Page 26

Types of Programs(Questions 42-51)
1.00 2.00 3.00 4.00
Mean
Types of Programs
Roundtable (one moderator, all managers participating)
Six credit CMI workshop
Online educational opportunities: statewide educationsession broadcasts
Single presenter/speaker
Online educational opportunities: webinars
Online educational opportunities: regional educationsession broadcasts
Exhibits (vendors and products)
Panel discussion (3 or 4 managers present with a questionperiod)
Demonstration (meat cutting, food preparation,experimental meal, etc.)
Sports lessons
3.19
3.05
2.93
2.89
2.82
2.80
2.57
2.57
2.43
2.29
Frequencies:Highly Preferred
Preferred
Less Preferred
Not Preferred
Not Applicable
Totals
Forms
Mean
Std Dev
Mean Error*
Single presenter/speaker
Types of Programs
210.5%
1368.4%
421.1%
00.0%
00.0%
19100.0%
21
2.89
0.57
±0.26
Panel discussion (3 or 4managers present with aquestion period)
628.6%
419.0%
733.3%
419.0%
00.0%
21100.0%
21
2.57
1.12
±0.49
Roundtable (one moderator,all managers participating)
1047.6%
733.3%
29.5%
29.5%
00.0%
21100.0%
21
3.19
0.98
±0.43
TLSC of CMAA 2014 Central Region Membership Survey Report Page 27

* Note: Mean error covers 95% of distribution.
Frequencies:Highly Preferred
Preferred
Less Preferred
Not Preferred
Not Applicable
Totals
Forms
Mean
Std Dev
Mean Error*
Exhibits (vendors andproducts)
Types of Programs
00.0%
1466.7%
523.8%
29.5%
00.0%
21100.0%
21
2.57
0.68
±0.30
Demonstration (meatcutting, food preparation,experimental meal, etc.)
29.5%
733.3%
1047.6%
29.5%
00.0%
21100.0%
21
2.43
0.81
±0.35
Sports lessons
00.0%
838.1%
1152.4%
29.5%
00.0%
21100.0%
21
2.29
0.64
±0.28
Frequencies:Highly Preferred
Preferred
Less Preferred
Not Preferred
Not Applicable
Totals
Forms
Mean
Std Dev
Mean Error*
Six credit CMI workshop
Types of Programs
420.0%
1260.0%
315.0%
00.0%
15.0%
20100.0%
21
3.05
0.62
±0.29
Online educationalopportunities: webinars
526.3%
631.6%
421.1%
210.5%
210.5%
19100.0%
21
2.82
1.01
±0.49
Online educationalopportunities: statewideeducation session broadcasts
15.6%
1266.7%
211.1%
00.0%
316.7%
18100.0%
21
2.93
0.46
±0.24
Frequencies:Highly Preferred
Preferred
Less Preferred
Not Preferred
Not Applicable
Totals
Forms
Mean
Std Dev
Mean Error*
Online educationalopportunities: regionaleducation session broadcasts
Types of Programs
15.6%
1055.6%
422.2%
00.0%
316.7%
18100.0%
21
2.80
0.56
±0.29
TLSC of CMAA 2014 Central Region Membership Survey Report Page 28

Website and Newsletter(Questions 53-55)
1.00 2.00 3.00 4.00
Mean
Website & Newsletter
I am satisfied with the newsletter (RoundUp)
I am satisfied with TLSC's website
Mail a printed copy of the newsletter
3.12
2.84
2.16
* Note: Mean error covers 95% of distribution.
Frequencies:Strongly Agree
Agree
Disagree
Strongly Disagree
Not Applicable
Totals
Forms
Mean
Std Dev
Mean Error*
I am satisfied withTLSC's website
Website & Newsletter
420.0%
1050.0%
315.0%
210.0%
15.0%
20100.0%
21
2.84
0.90
±0.41
I am satisfied with thenewsletter (RoundUp)
210.5%
1578.9%
00.0%
00.0%
210.5%
19100.0%
21
3.12
0.33
±0.16
Mail a printed copy ofthe newsletter
00.0%
840.0%
630.0%
525.0%
15.0%
20100.0%
21
2.16
0.83
±0.38
TLSC of CMAA 2014 Central Region Membership Survey Report Page 29

Preferred Methods of Communication (Question 56)
* Note: Multiple answer percentage-count totals not meaningful.
0.0 20.0 40.0 60.0 80.0 100.0
Frequency (%)
Methods of communication preferred
Website
Newsletter/bulletin
Phone calls
Letters/Flyers
Facebook and/or Twitter
Chat groups and web casts
100.00
80.95
42.86
38.10
19.05
19.05
9.52
* Note: Multiple answer percentage-count totals not meaningful.
Methods of communicationpreferred
Website
Newsletter/bulletin
Phone calls
Letters/Flyers
Facebook and/or Twitter
Chat groups and web casts
Totals
Forms
21100.0%
1781.0%
942.9%
838.1%
419.0%
419.0%
29.5%
**
21
TLSC of CMAA 2014 Central Region Membership Survey Report Page 30
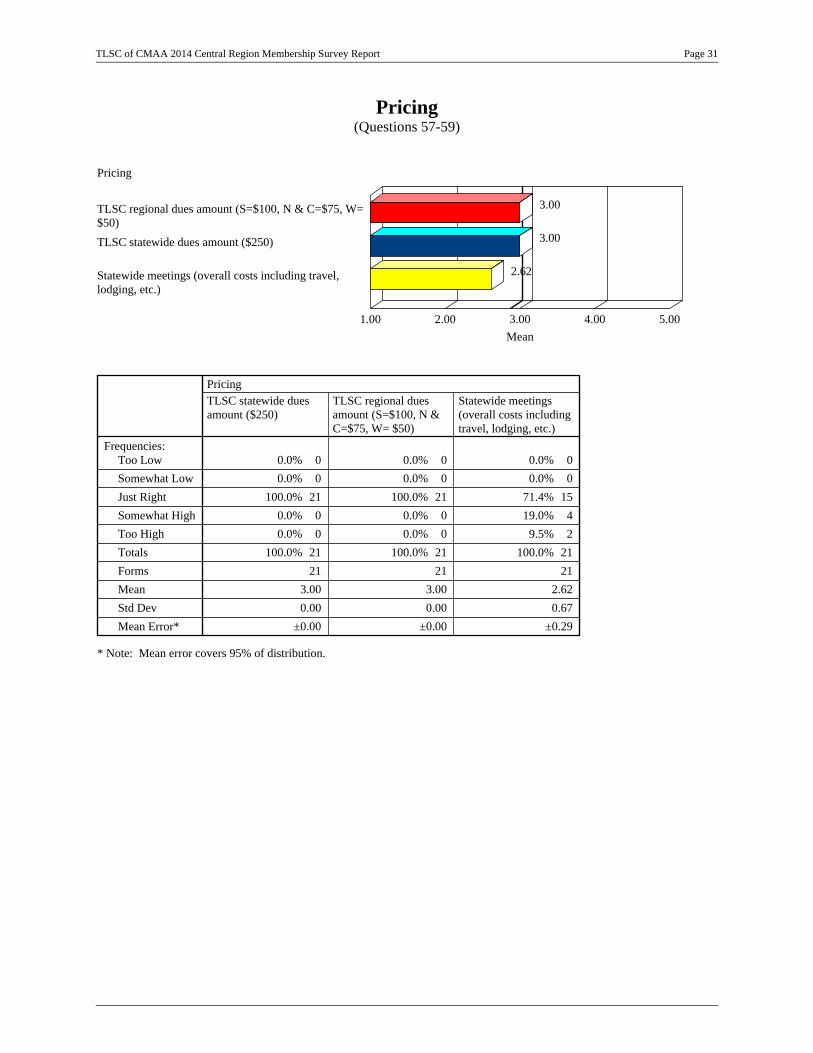
Pricing(Questions 57-59)
1.00 2.00 3.00 4.00 5.00
Mean
Pricing
TLSC regional dues amount (S=$100, N & C=$75, W=$50)
TLSC statewide dues amount ($250)
Statewide meetings (overall costs including travel,lodging, etc.)
3.00
3.00
2.62
* Note: Mean error covers 95% of distribution.
Frequencies:Too Low
Somewhat Low
Just Right
Somewhat High
Too High
Totals
Forms
Mean
Std Dev
Mean Error*
TLSC statewide duesamount ($250)
Pricing
00.0%
00.0%
21100.0%
00.0%
00.0%
21100.0%
21
3.00
0.00
±0.00
TLSC regional duesamount (S=$100, N &C=$75, W= $50)
00.0%
00.0%
21100.0%
00.0%
00.0%
21100.0%
21
3.00
0.00
±0.00
Statewide meetings(overall costs includingtravel, lodging, etc.)
00.0%
00.0%
1571.4%
419.0%
29.5%
21100.0%
21
2.62
0.67
±0.29
TLSC of CMAA 2014 Central Region Membership Survey Report Page 31
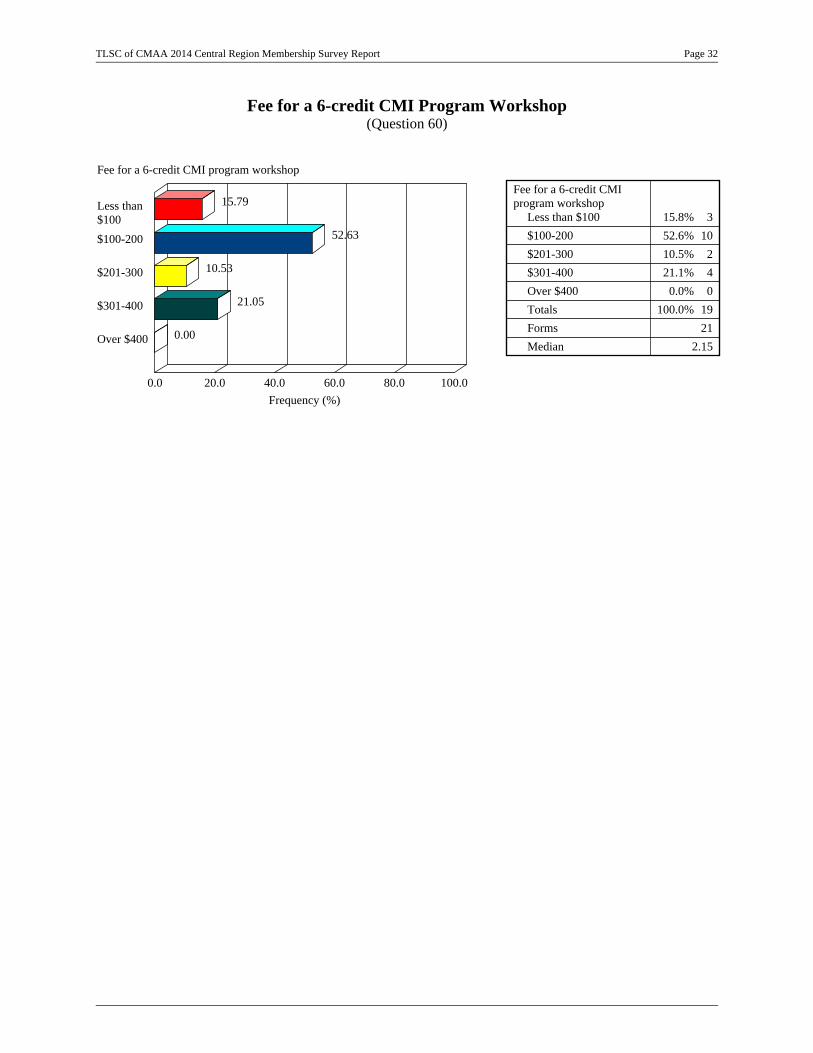
Fee for a 6-credit CMI Program Workshop(Question 60)
0.0 20.0 40.0 60.0 80.0 100.0
Frequency (%)
Fee for a 6-credit CMI program workshop
Less than$100
$100-200
$201-300
$301-400
Over $400
15.79
52.63
10.53
21.05
0.00
Fee for a 6-credit CMIprogram workshop
Less than $100
$100-200
$201-300
$301-400
Over $400
Totals
Forms
Median
315.8%
1052.6%
210.5%
421.1%
00.0%
19100.0%
21
2.15
TLSC of CMAA 2014 Central Region Membership Survey Report Page 32

Full Statewide Meeting Registration Fee(Question 61)
0.0 20.0 40.0 60.0 80.0 100.0
Frequency (%)
Full statewide meeting registration fee
Less than$100
$100-200
$201-300
$301-400
Over $400
0.00
0.00
36.84
63.16
0.00
Full statewide meetingregistration fee
Less than $100
$100-200
$201-300
$301-400
Over $400
Totals
Forms
Median
00.0%
00.0%
736.8%
1263.2%
00.0%
19100.0%
21
3.71
TLSC of CMAA 2014 Central Region Membership Survey Report Page 33
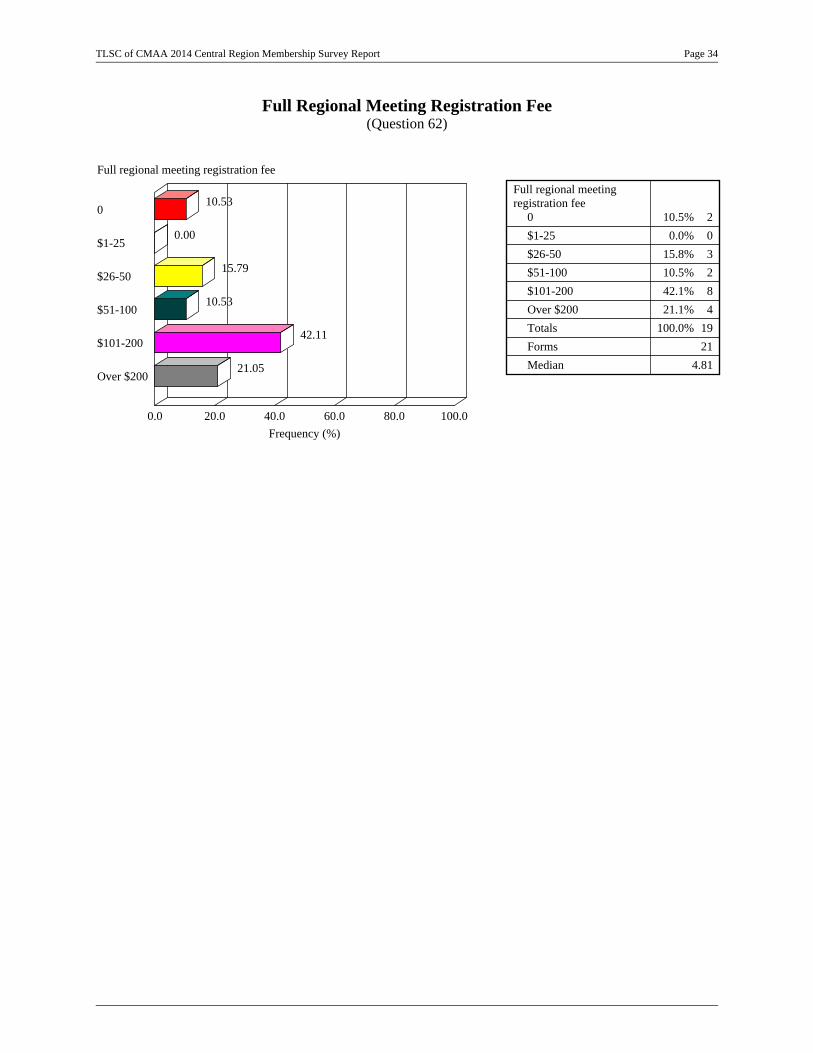
Full Regional Meeting Registration Fee(Question 62)
0.0 20.0 40.0 60.0 80.0 100.0
Frequency (%)
Full regional meeting registration fee
0
$1-25
$26-50
$51-100
$101-200
Over $200
10.53
0.00
15.79
10.53
42.11
21.05
Full regional meetingregistration fee
0
$1-25
$26-50
$51-100
$101-200
Over $200
Totals
Forms
Median
210.5%
00.0%
315.8%
210.5%
842.1%
421.1%
19100.0%
21
4.81
TLSC of CMAA 2014 Central Region Membership Survey Report Page 34
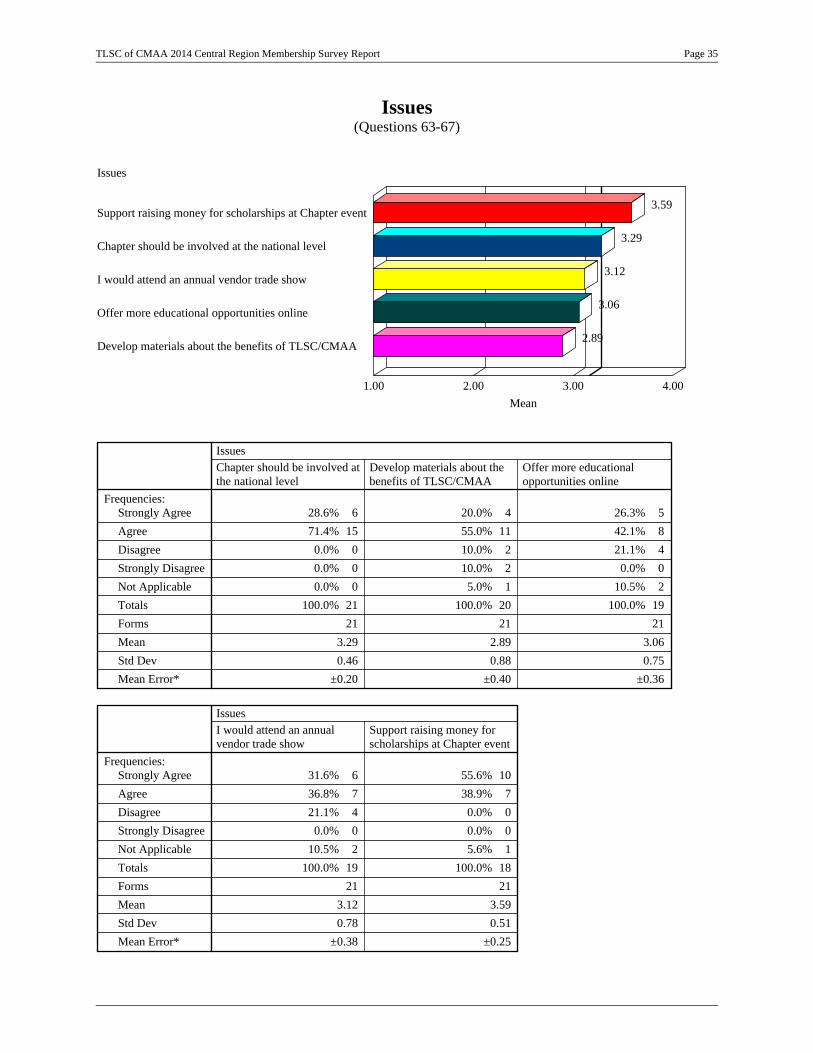
Issues(Questions 63-67)
1.00 2.00 3.00 4.00
Mean
Issues
Support raising money for scholarships at Chapter event
Chapter should be involved at the national level
I would attend an annual vendor trade show
Offer more educational opportunities online
Develop materials about the benefits of TLSC/CMAA
3.59
3.29
3.12
3.06
2.89
Frequencies:Strongly Agree
Agree
Disagree
Strongly Disagree
Not Applicable
Totals
Forms
Mean
Std Dev
Mean Error*
Chapter should be involved atthe national level
Issues
628.6%
1571.4%
00.0%
00.0%
00.0%
21100.0%
21
3.29
0.46
±0.20
Develop materials about thebenefits of TLSC/CMAA
420.0%
1155.0%
210.0%
210.0%
15.0%
20100.0%
21
2.89
0.88
±0.40
Offer more educationalopportunities online
526.3%
842.1%
421.1%
00.0%
210.5%
19100.0%
21
3.06
0.75
±0.36
Frequencies:Strongly Agree
Agree
Disagree
Strongly Disagree
Not Applicable
Totals
Forms
Mean
Std Dev
Mean Error*
I would attend an annualvendor trade show
Issues
631.6%
736.8%
421.1%
00.0%
210.5%
19100.0%
21
3.12
0.78
±0.38
Support raising money forscholarships at Chapter event
1055.6%
738.9%
00.0%
00.0%
15.6%
18100.0%
21
3.59
0.51
±0.25
TLSC of CMAA 2014 Central Region Membership Survey Report Page 35

* Note: Mean error covers 95% of distribution.
TLSC of CMAA 2014 Central Region Membership Survey Report Page 36
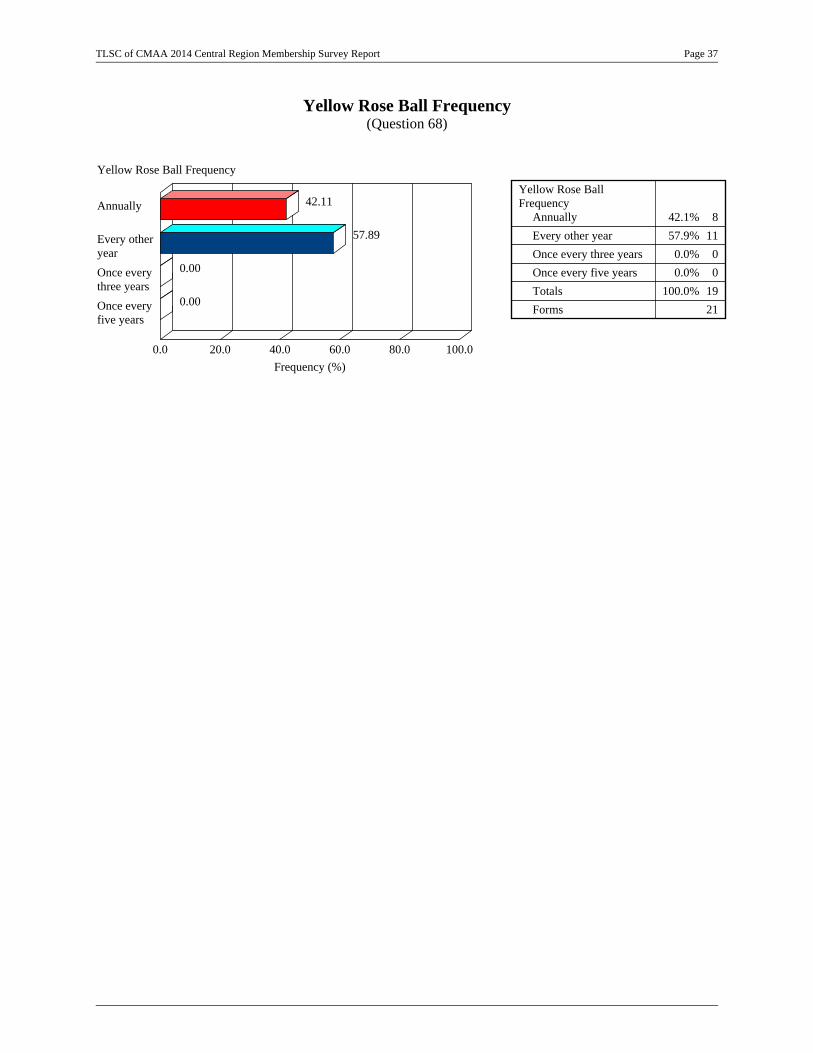
Yellow Rose Ball Frequency(Question 68)
0.0 20.0 40.0 60.0 80.0 100.0
Frequency (%)
Yellow Rose Ball Frequency
Annually
Every otheryear
Once everythree years
Once everyfive years
42.11
57.89
0.00
0.00
Yellow Rose BallFrequency
Annually
Every other year
Once every three years
Once every five years
Totals
Forms
842.1%
1157.9%
00.0%
00.0%
19100.0%
21
TLSC of CMAA 2014 Central Region Membership Survey Report Page 37
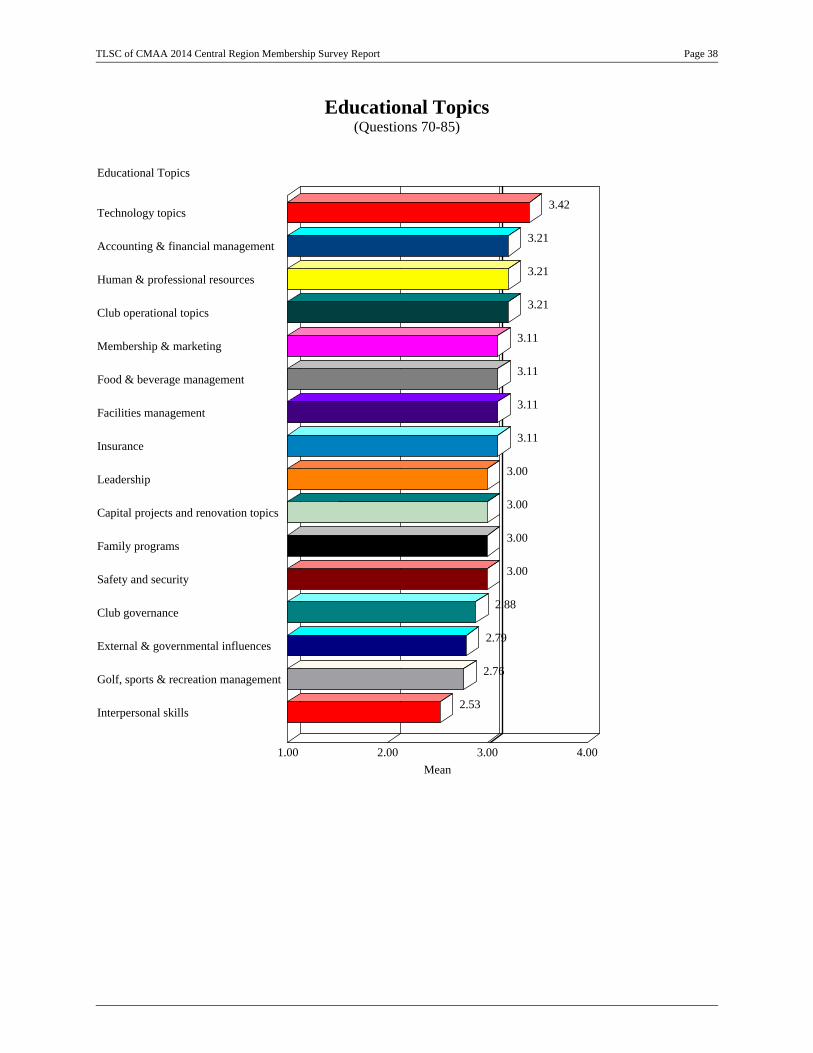
Educational Topics(Questions 70-85)
1.00 2.00 3.00 4.00
Mean
Educational Topics
Technology topics
Accounting & financial management
Human & professional resources
Club operational topics
Membership & marketing
Food & beverage management
Facilities management
Insurance
Leadership
Capital projects and renovation topics
Family programs
Safety and security
Club governance
External & governmental influences
Golf, sports & recreation management
Interpersonal skills
3.42
3.21
3.21
3.21
3.11
3.11
3.11
3.11
3.00
3.00
3.00
3.00
2.88
2.79
2.76
2.53
TLSC of CMAA 2014 Central Region Membership Survey Report Page 38

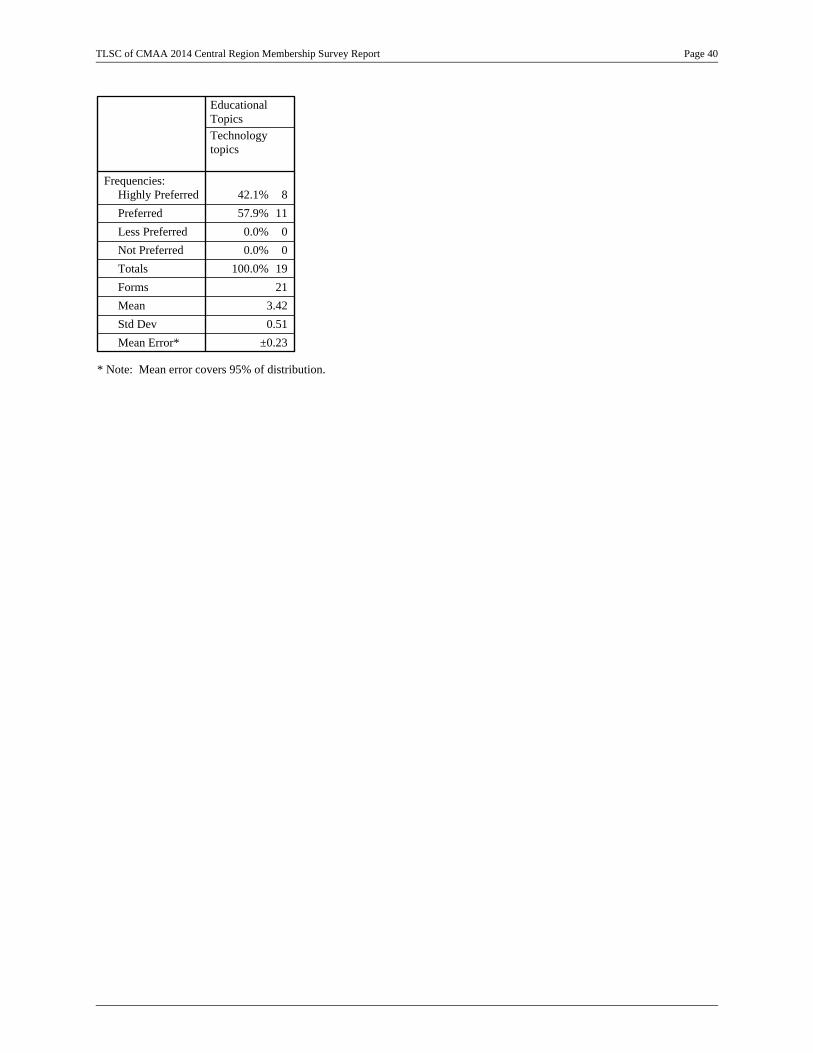
Frequencies:Highly Preferred
Preferred
Less Preferred
Not Preferred
Totals
Forms
Mean
Std Dev
Mean Error*
Clubgovernance
Educational Topics
211.8%
1164.7%
423.5%
00.0%
17100.0%
21
2.88
0.60
±0.29
Food &beveragemanagement
631.6%
947.4%
421.1%
00.0%
19100.0%
21
3.11
0.74
±0.34
Accounting &financialmanagement
631.6%
1157.9%
210.5%
00.0%
19100.0%
21
3.21
0.63
±0.29
Human &professionalresources
421.1%
1578.9%
00.0%
00.0%
19100.0%
21
3.21
0.42
±0.19
Leadership
631.6%
736.8%
631.6%
00.0%
19100.0%
21
3.00
0.82
±0.37
Frequencies:Highly Preferred
Preferred
Less Preferred
Not Preferred
Totals
Forms
Mean
Std Dev
Mean Error*
Membership &marketing
Educational Topics
421.1%
1368.4%
210.5%
00.0%
19100.0%
21
3.11
0.57
±0.26
Golf, sports &recreationmanagement
211.8%
952.9%
635.3%
00.0%
17100.0%
21
2.76
0.66
±0.32
External &governmentalinfluences
421.1%
736.8%
842.1%
00.0%
19100.0%
21
2.79
0.79
±0.36
Facilitiesmanagement
210.5%
1789.5%
00.0%
00.0%
19100.0%
21
3.11
0.32
±0.14
Interpersonalskills
210.5%
842.1%
736.8%
210.5%
19100.0%
21
2.53
0.84
±0.39
Frequencies:Highly Preferred
Preferred
Less Preferred
Not Preferred
Totals
Forms
Mean
Std Dev
Mean Error*
Capital projectsand renovationtopics
Educational Topics
423.5%
1164.7%
00.0%
211.8%
17100.0%
21
3.00
0.87
±0.42
Cluboperationaltopics
421.1%
1578.9%
00.0%
00.0%
19100.0%
21
3.21
0.42
±0.19
Familyprograms
631.6%
736.8%
631.6%
00.0%
19100.0%
21
3.00
0.82
±0.37
Insurance
421.1%
1368.4%
210.5%
00.0%
19100.0%
21
3.11
0.57
±0.26
Safety andsecurity
421.1%
1157.9%
421.1%
00.0%
19100.0%
21
3.00
0.67
±0.31
TLSC of CMAA 2014 Central Region Membership Survey Report Page 39
* Note: Mean error covers 95% of distribution.
Frequencies:Highly Preferred
Preferred
Less Preferred
Not Preferred
Totals
Forms
Mean
Std Dev
Mean Error*
Technologytopics
EducationalTopics
842.1%
1157.9%
00.0%
00.0%
19100.0%
21
3.42
0.51
±0.23
TLSC of CMAA 2014 Central Region Membership Survey Report Page 40