An Improved Wind Probability Program: A Joint Hurricane ... · An Improved Wind Probability...
21
An Improved Wind Probability Program: A Joint Hurricane Testbed Project Update Mark DeMaria and John Knaff, NOAA/NESDIS, Fort Collins, CO Stan Kidder, CIRA/CSU, Fort Collins, CO Patrick Harr, Naval Postgraduate School, Monterey, CA Chris Lauer, NCEP/TPC, Miami, FL Presented at the Interdepartmental Hurricane Conference March 5, 2008
Transcript of An Improved Wind Probability Program: A Joint Hurricane ... · An Improved Wind Probability...

An Improved Wind Probability Program:A Joint Hurricane Testbed Project Update
Mark DeMaria and John Knaff, NOAA/NESDIS, Fort Collins, COStan Kidder, CIRA/CSU, Fort Collins, CO
Patrick Harr, Naval Postgraduate School, Monterey, CAChris Lauer, NCEP/TPC, Miami, FL
Presented at the Interdepartmental Hurricane Conference
March 5, 2008

Monte Carlo Wind Probability Model• 1000 track realizations from random sampling NHC
track error distributions– Serial correlation and bias of errors accounted for
• Intensity of realizations from random sampling NHC intensity error distributions– Serial correlation and bias of errors accounted for– Special treatment near land
• Wind radii of realizations from radii CLIPER model and its radii error distributions– Serial correlation included
• Probability at a point from counting number of realizations passing within the wind radii of interest

1000 Track Realizations 64 kt 0-120 h Cumulative Probabilities
MC Probability ExampleHurricane Dean 17 Aug 2007 18 UTC
• Major Hurricane• Non-major Hurricane• Tropical Storm• Depression

Project Tasks1. Improved Monte Carlo wind probability
program by using situation-depending track error distributions
• Track error depends on Goerss Predicted Consensus Error (GPCE)
2. Improve timeliness by optimization of MC code 3. Update NHC wind speed probability table
product • Extend from 3 to 5 days• Update probability distributions (currently based on
1988-1997)
Code Optimization• Code profiling showed ~85% of CPU in distance
calculation routine• Automated procedure added to test for regular
grid• If yes, rectangular mask added at each time step
to reduce number of distance calculations• Speed up of ~600% for large grid
– 25 to 50% expected• Implemented before 2007 season

Code Optimization
Text Product Grid Graphical Product Grid

Wind Speed Probability Table

Wind Speed Probability Table• Developed by E. Rappaport and M. DeMaria as
part of original NHC graphical products• Limitations addressed by JHT project
– Based on 1988-1997 NHC error statistics– Extends only to 3 days
• Other limitations– Does not directly account for land interaction– Inconsistent with other probability products from MC
model • Rick Knabb and Dan Brown suggestion*:
– Use output from MC model as table input – Addresses all of the above limitations– Will automatically update when MC model updates
*via Dave Thomas

Wind Speed Probability Table Evaluation Procedure
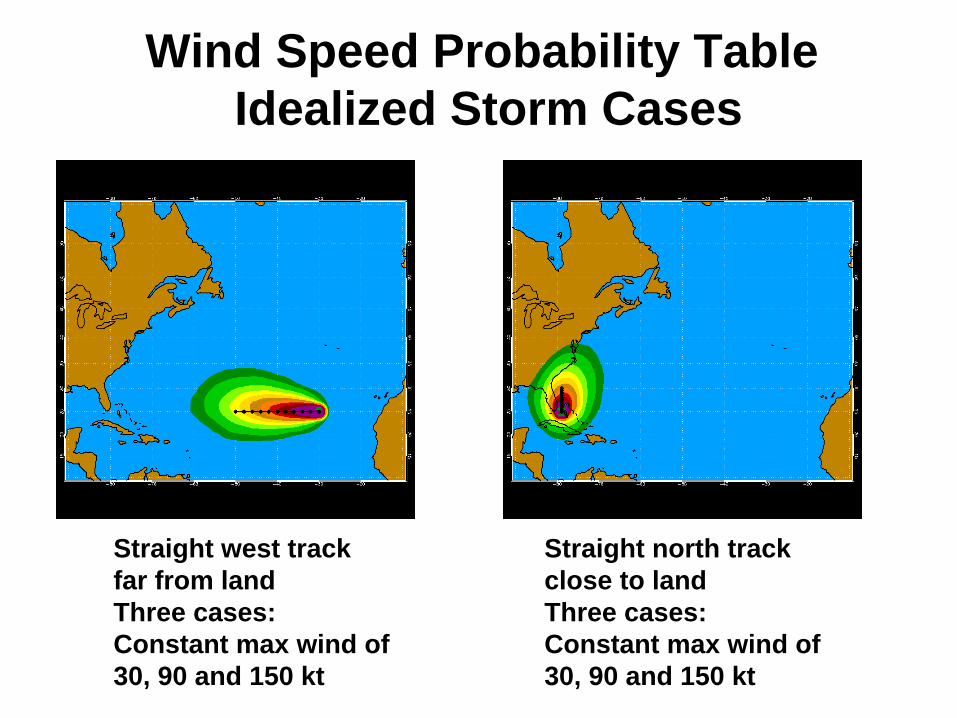
• Examine MC model intensity probability distributions for idealized storms
• Compare MC intensity probabilities with WSPT values for real forecasts – Frances 29 Aug 2004 12 UTC– Katrina 24 Aug 2005 18 UTC– Katrina 27 Aug 2005 18 UTC– Ernesto 29 Aug 2006 06 UTC– Ernesto 29 Aug 2006 18 UTC– Humberto 12 Sep 2007 12 UTC– Humberto 12 Sep 2007 18 UTC– Ingrid 13 Sep 2007 00 UTC
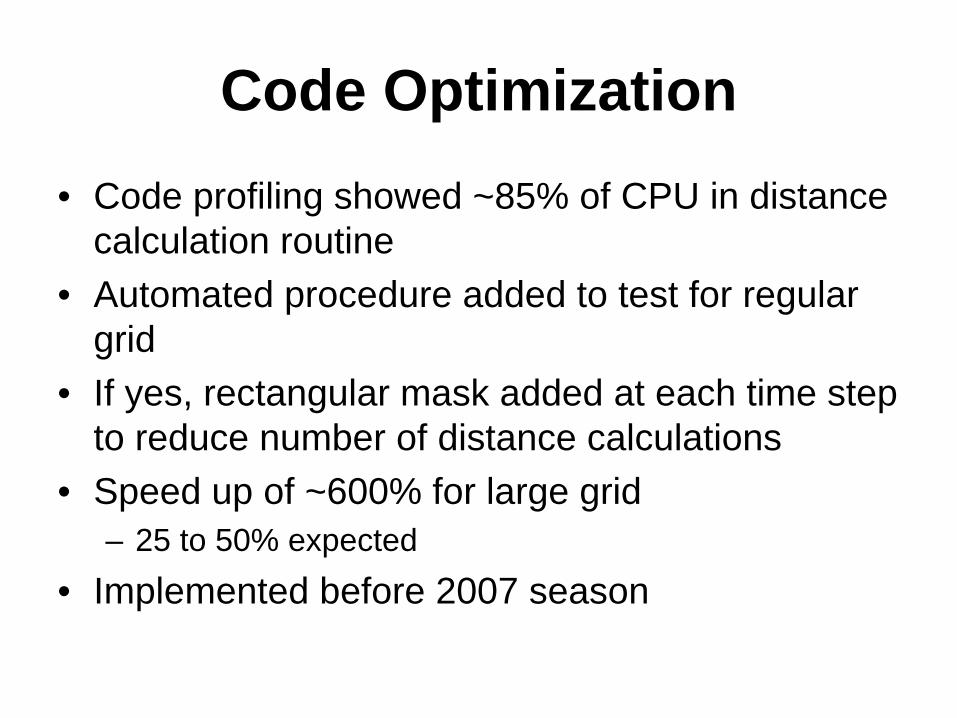
Straight west trackfar from landThree cases:Constant max wind of30, 90 and 150 kt
Wind Speed Probability Table Idealized Storm Cases
Straight north trackclose to landThree cases:Constant max wind of30, 90 and 150 kt
MC Intensity Distributions Far from Land
90 kt Away From Land
0
5
10
15
20
25
30
35
40
-50.
0 to
-40
.0-4
0.0
to -
30.0
-30.
0 to
-20
.0-2
0.0
to -
10.0
-10.
0 to
0
.00.
0 to
10
.010
.0 to
20
.020
.0 to
30
.030
.0 to
40
.040
.0 to
50
.050
.0 to
60
.060
.0 to
70
.070
.0 to
80
.080
.0 to
90
.090
.0 to
100
.010
0.0
to 1
10.0
110.
0 to
120
.012
0.0
to 1
30.0
130.
0 to
140
.014
0.0
to 1
50.0
150.
0 to
160
.016
0.0
to 1
70.0
170.
0 to
180
.018
0.0
to 1
90.0
190.
0 to
200
.020
0.0
to 2
10.0
210.
0 to
220
.022
0.0
to 2
30.0
230.
0 to
240
.024
0.0
to 2
50.0
24487296120
30 kt Away From Land
0
5
10
15
20
25
30
35
40
-50.
0 to
-40
.0-4
0.0
to -
30.0
-30.
0 to
-20
.0-2
0.0
to -
10.0
-10.
0 to
0
.00.
0 to
10
.010
.0 to
20
.020
.0 to
30
.030
.0 to
40
.040
.0 to
50
.050
.0 to
60
.060
.0 to
70
.070
.0 to
80
.080
.0 to
90
.090
.0 to
100
.010
0.0
to 1
10.0
110.
0 to
120
.012
0.0
to 1
30.0
130.
0 to
140
.014
0.0
to 1
50.0
150.
0 to
160
.016
0.0
to 1
70.0
170.
0 to
180
.018
0.0
to 1
90.0
190.
0 to
200
.020
0.0
to 2
10.0
210.
0 to
220
.022
0.0
to 2
30.0
230.
0 to
240
.024
0.0
to 2
50.0
24487296120
150 kt Away From Land
0
5
10
15
20
25
30
35
40
-50.
0 to
-40
.0-4
0.0
to -
30.0
-30.
0 to
-20
.0-2
0.0
to -
10.0
-10.
0 to
0
.00.
0 to
10
.010
.0 to
20
.020
.0 to
30
.030
.0 to
40
.040
.0 to
50
.050
.0 to
60
.060
.0 to
70
.070
.0 to
80
.080
.0 to
90
.090
.0 to
100
.010
0.0
to 1
10.0
110.
0 to
120
.012
0.0
to 1
30.0
130.
0 to
140
.014
0.0
to 1
50.0
150.
0 to
160
.016
0.0
to 1
70.0
170.
0 to
180
.018
0.0
to 1
90.0
190.
0 to
200
.020
0.0
to 2
10.0
210.
0 to
220
.022
0.0
to 2
30.0
230.
0 to
240
.024
0.0
to 2
50.0
24487296120
30 kt fcst 90 kt fcst 150 kt fcst

MC Intensity Distributions 150 kt fcst far from and near land
150 kt Away From Land
0
5
10
15
20
25
30
35
40
-50.
0 to
-40
.0-4
0.0
to -
30.0
-30.
0 to
-20
.0-2
0.0
to -
10.0
-10.
0 to
0
.00.
0 to
10
.010
.0 to
20
.020
.0 to
30
.030
.0 to
40
.040
.0 to
50
.050
.0 to
60
.060
.0 to
70
.070
.0 to
80
.080
.0 to
90
.090
.0 to
100
.010
0.0
to 1
10.0
110.
0 to
120
.012
0.0
to 1
30.0
130.
0 to
140
.014
0.0
to 1
50.0
150.
0 to
160
.016
0.0
to 1
70.0
170.
0 to
180
.018
0.0
to 1
90.0
190.
0 to
200
.020
0.0
to 2
10.0
210.
0 to
220
.022
0.0
to 2
30.0
230.
0 to
240
.024
0.0
to 2
50.0
24487296120
150 kt Near Land
0
5
10
15
20
25
30
35
40
-50.
0 to
-40
.0-4
0.0
to -
30.0
-30.
0 to
-20
.0-2
0.0
to -
10.0
-10.
0 to
0
.00.
0 to
10
.010
.0 to
20
.020
.0 to
30
.030
.0 to
40
.040
.0 to
50
.050
.0 to
60
.060
.0 to
70
.070
.0 to
80
.080
.0 to
90
.090
.0 to
100
.010
0.0
to 1
10.0
110.
0 to
120
.012
0.0
to 1
30.0
130.
0 to
140
.014
0.0
to 1
50.0
150.
0 to
160
.016
0.0
to 1
70.0
170.
0 to
180
.018
0.0
to 1
90.0
190.
0 to
200
.020
0.0
to 2
10.0
210.
0 to
220
.022
0.0
to 2
30.0
230.
0 to
240
.024
0.0
to 2
50.0
24487296120
Far from land Near land

MC and Wind Speed Table Probability Comparison
1224
3648
7296
120
C1 WTC1 M C
C2 WTC2 M C
C3 WTC3 M C
C4-5 WTC4-5 M C
010
20
30
40
50
60
70
80
Prob
abili
ty
Forecast Interval
Hurricane Frances 29 Aug 2004 12 UTC
C1 WTC1 MCC2 WTC2 MCC3 WTC3 MCC4-5 WTC4-5 MC
Distribution of M C and WSPT Table Diffe rences
0
10
20
30
40
50
60
70
80
0 to 5 6 to 10 11 to 15 16 to 20 21 to 25 26 to 30 31 to 35
Difference Range
Freq
uenc
y
Hurricane France Example Nine Forecast Totals
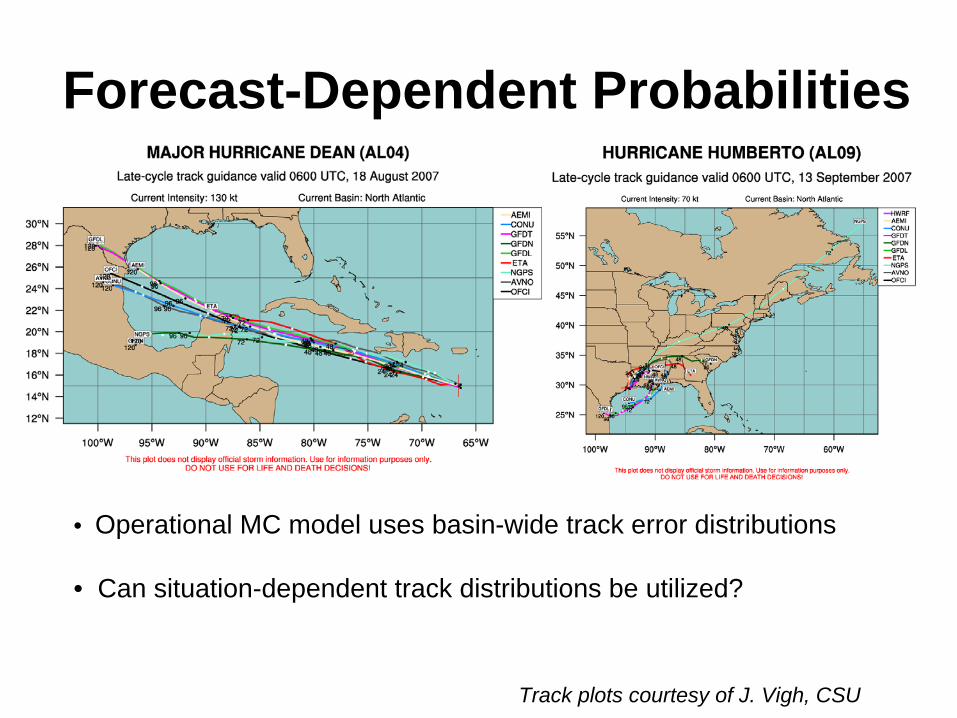
Forecast-Dependent Probabilities
Track plots courtesy of J. Vigh, CSU
• Operational MC model uses basin-wide track error distributions
• Can situation-dependent track distributions be utilized?

Goerss Predicted Consensus Error (GPCE)
• Predicts error of CONU track forecast– Consensus of GFDI, AVNI, NGPI, UKMI, GFNI
• GPCE Input– Spread of CONU member track forecasts– Initial latitude– Initial and forecasted intensity
• Explains 15-50% of CONU track error variance
• GPCE estimates radius that contains ~70% of CONU verifying positions at each time

Use of GPCE in the MC Model
• 2002-2006 database of GPCE values created by NRL*
• Are GPCE radii correlated with NHC and JTWC track errors?– GPCE designed to predict CONU error
• How can GPCE values be used in the MC model?– MC model uses along/cross track error
distributions
*Buck: Domestic or Imported?

72 hr Atlantic NHC Along Track Error Distributions Stratified by GPCE
(2002-2006)
0
5
10
15
20
25
30
35
40
-600 -400 -200 0 200 400 600 800
Along Track Error (nmi)
Freq
uenc
y (%
)
Lower GPCE TercileUpper GPCE Tercile

NHC Along and Cross Track Error Standard Deviations Stratified by GPCE
(2002-2006 Atlantic Sample)
NHC Cross Track Error Standard Deviation
0
100
200
300
400
24 48 72 96 120
Forecast Interval (hr)St
anda
rd D
evia
tion
(nm
i) Lower GPCE Tercile
Middle GPCE Tercile
Upper GPCE Tercile
NHC Along Track Error Standard Deviation
0
100
200
300
400
24 48 72 96 120
Forecast Interval (hr)
Stan
dard
Dev
iatio
n (n
mi) Lower GPCE Tercile
Middle GPCE Tercile
Upper GPCE Tercile

MC Model with Track Errors from Upper and Lower GPCE Terciles
Lower Tercile Distributions Upper Tercile Distributions
Hurricane Frances 2004 01 Sept 00 UTC Example120 hr Cumulative Probabilities for 64 kt

Remaining Questions
• How to include GPCE in MC model– Method 1: Sample from appropriate tercile– Method 2: Include GPCE input in serial
correlation correction • Behavior in other basins• Does GPCE correction improve probability
verification? • Real time tests beginning Aug 2008

Summary
• Code optimization is complete– Factor of 6 speed up
• Wind speed table product input from MC model is a reasonable approach– Implementation in 2008
• GPCE-dependent MC model is promising– Further evaluation needed– Real time parallel runs in Aug 2008?