Class Association Rules for Profiling Outlier...
18
Int. J. Advance Soft Compu. Appl, Vol. 9, No. 3, Nov 2017 ISSN 2074-8523 Class Association Rules for Profiling Outlier Stocks Keng-Hoong Ng 1 , Kok-Chin Khor 1 , and Gee-Kok Tong 1 1 Faculty of Computing and Informatics Multimedia University, Cyberjaya, Malaysia Email: [email protected], [email protected], [email protected] Abstract Finding a stock with superior financial performance demands not only abundance of time, but a lot of financial knowledge from retail investors. Consequently, they always end up with empty handed. This research aims to assist them to “recognize” this type of stock in a fast manner, despite they are not financially savvy. In this study, we started with identifying outliers in a pool of construction stocks. Then, these outliers were manually classified into two classes, i.e. outstanding or poor outliers. Class association rule mining was performed to these classes to generate sets of association rules, which were used to profile each outlier class. Investors may use the rules of the profiles to pick potential outstanding stocks or avoid poor performance stocks. Keywords: construction stocks, financial ratios, local outlier factor, data discretization, association rules mining. 1 Introduction The key objective of stock investments is to find outstanding stocks and then let the stocks generate handsome profits for an investor over a period of time. Yet, finding such stocks is almost unachievable because investors may lack of financial knowledge and time to conduct an in-depth analysis on a huge pool of stocks. As such, an investor with risk aversion may refrain himself from participating in the stock market because he considers that a high risk investment. Thus, making a lucrative return on stock investment is never easy. Finding a “ten- bagger” in a stock market is even more difficult. In Malaysia, there are over 900 common stocks (not including equity derivatives) listed on Bursa Malaysia currently [1]. Every stock is categorized into one of the 14 sectors. For instance, a stock with its core business in oil palm plantation is
Transcript of Class Association Rules for Profiling Outlier...
Int. J. Advance Soft Compu. Appl, Vol. 9, No. 3, Nov 2017
ISSN 2074-8523
Class Association Rules for Profiling
Outlier Stocks
Keng-Hoong Ng1, Kok-Chin Khor1, and Gee-Kok Tong1
1Faculty of Computing and Informatics
Multimedia University, Cyberjaya, Malaysia
Email: [email protected], [email protected], [email protected]
Abstract
Finding a stock with superior financial performance demands not only abundance of time, but a lot of financial knowledge from retail investors. Consequently, they always end up with empty handed. This research aims to assist them to “recognize” this type of stock in a fast manner, despite they are not financially savvy. In this study, we started with identifying outliers in a pool of construction stocks. Then, these outliers were manually classified into two classes, i.e. outstanding or poor outliers. Class association rule mining was performed to these classes to generate sets of association rules, which were used to profile each outlier class. Investors may use the rules of the profiles to pick potential outstanding stocks or avoid poor performance stocks.
Keywords: construction stocks, financial ratios, local outlier factor, data discretization, association rules mining.
1 Introduction
The key objective of stock investments is to find outstanding stocks and then let
the stocks generate handsome profits for an investor over a period of time. Yet,
finding such stocks is almost unachievable because investors may lack of
financial knowledge and time to conduct an in-depth analysis on a huge pool of
stocks. As such, an investor with risk aversion may refrain himself from
participating in the stock market because he considers that a high risk investment.
Thus, making a lucrative return on stock investment is never easy. Finding a “ten-
bagger” in a stock market is even more difficult.
In Malaysia, there are over 900 common stocks (not including equity derivatives)
listed on Bursa Malaysia currently [1]. Every stock is categorized into one of the
14 sectors. For instance, a stock with its core business in oil palm plantation is
115 Class Association Rules for Profiling Outlier Stocks
grouped under the plantation sector. A stock investor can employ a top-down or
bottom-up approach to select stocks and subsequently builds his stock portfolio.
In this study, we concentrated on the construction sector. For many years, this
sector plays a crucial role in Malaysia’s economic growth and development [2].
The Malaysian government allocated billions of dollars annually to finance mega
infrastructure projects. Thus, this justified our study in this sector, which is to
uncover the financial profile of outstanding construction stocks. Once the profile
of an outstanding construction stock is known, an investor can then choose other
construction stocks with the similar financial profile into his portfolio. On the
contrary, we are also aiming to identify the financial profile of construction stocks
with poor performance. Consequently, investors can avoid picking such
construction stocks.
Recent years, the research on the equity market has adopted data mining
techniques. The techniques are capable of capturing interesting patterns hidden in
the stock datasets. Such patterns offer beneficial information or knowledge to
assist stock investors. Association rules, classification, and clustering are some
common data mining techniques that have been employed in stock portfolio
management, stock market volatility, stock price prediction, intelligent stock
trading, etc.
The study by [3] applied association rule mining to recommend a basket of stocks
that could yield a high return. This technique had also been adopted by [4] for
stock prediction. Besides, classification techniques such as Neural Network [5]
and Support Vector Machine [6] have been used to forecast stock market
volatility. Clustering techniques such fuzzy clustering [7], time-series clustering
[8], and expectation-maximization clustering [9] have been widely applied in
forecasting stock price. Other than using a single classification technique, [10]
and [11] combined two or more data mining techniques (a hybrid model) to
predict stock markets. Both research combined the classification and clustering
methods to forecast stock price movement. Researchers in [12][13] proposed their
intelligent stock trading systems using Neural Network, and they claimed that the
systems could generate higher returns as compared with the others. The study by
[21] applied rough set theory to mine the profitable rules of Kuala Lumpur
Composite Index (KLCI) to discover data dependencies while eliminating the
superfluous factors in noisy stock market data.The experimental results of this
study are very encouraging and prove the usefulness of the rough set approach for
stock market analysis with respect to profitability. Nevertheless, one failure of the
predictive system developed in this research is its inability to detect numerous
minor trends displayed by volatile individual firms selected in this study, thus the
failure to produce the trading signals to generate profits for these firms.
In this study, we focused on the construction stocks listed on Bursa Malaysia. A
total of 5 years (year 2011 – 2015) financial ratios were generated for every
construction stock. The selected outlier detection algorithm was the Local Outlier
Factor (LOF); it was used to identify any “abnormal” construction stock from the
Keng-Hoong Ng et. al. 116
datasets. The outliers were then manually screened to determine its performance
(outstanding outlier or poor outlier class). Class association rules (CAR) mining
was conducted on both outlier classes. Eventually, we created a financial profile
for each class based on the generated association rules. The next section describes
the methodology of this research. The experimental results and discussion will
follow subsequently. The last section concludes the paper and suggests its future
directions.
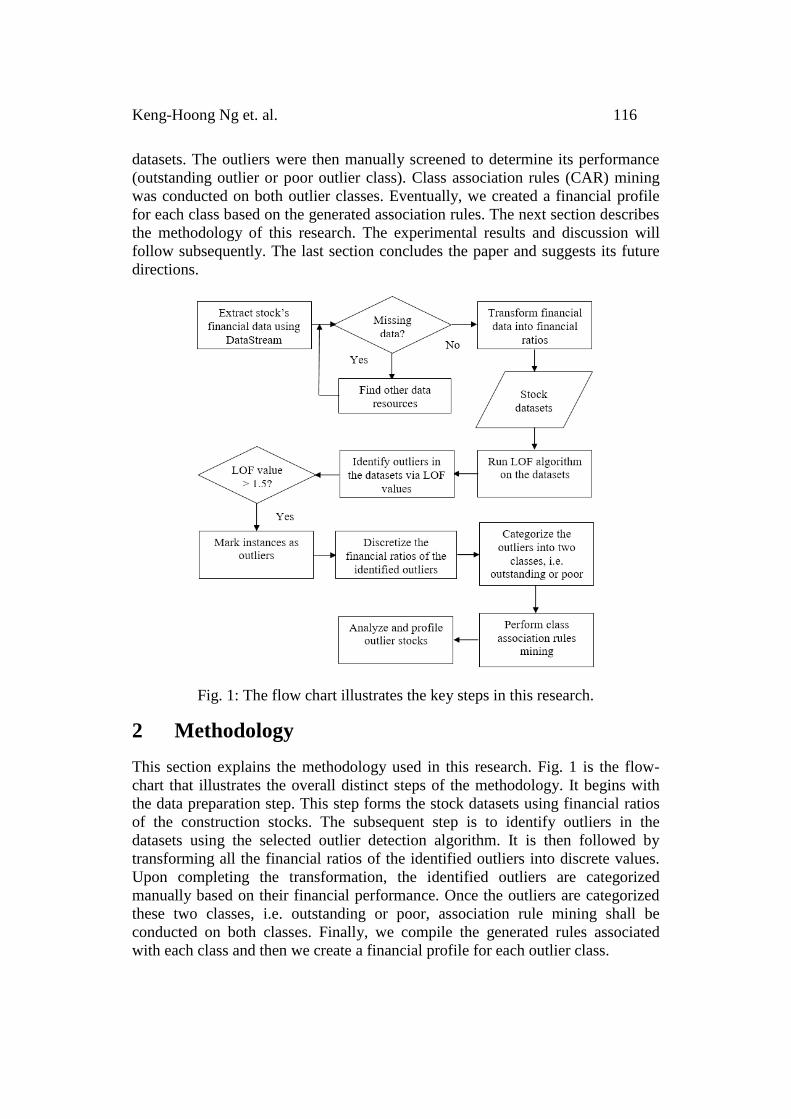
Fig. 1: The flow chart illustrates the key steps in this research.
2 Methodology
This section explains the methodology used in this research. Fig. 1 is the flow-
chart that illustrates the overall distinct steps of the methodology. It begins with
the data preparation step. This step forms the stock datasets using financial ratios
of the construction stocks. The subsequent step is to identify outliers in the
datasets using the selected outlier detection algorithm. It is then followed by
transforming all the financial ratios of the identified outliers into discrete values.
Upon completing the transformation, the identified outliers are categorized
manually based on their financial performance. Once the outliers are categorized
these two classes, i.e. outstanding or poor, association rule mining shall be
conducted on both classes. Finally, we compile the generated rules associated
with each class and then we create a financial profile for each outlier class.

117 Class Association Rules for Profiling Outlier Stocks
2.1 Data Preparation
As of February 2017, there are 44 listings in the construction sector of Bursa
Malaysia. The detail (code and name) of each construction stock is as shown in
Table 1. This research used the financial data of construction stocks over five
historical years (financial year 2011 – 2015) and five datasets were formed.
Financial data of year 2016 were not included because the companies have yet to
release their 2016 annual reports. All the raw financial data of the construction
stocks were retrieved using DataStream. DataStream is the database provided by
Thomson Reuters and it contains numerous global economic and financial time-
series data. Alternative databases, i.e. Bursa Malaysia, company website, and
Bloomberg finance were referred in case an intended stock data were missing.
Table 1: The construction stocks listed on Bursa Malaysia No Stock Code Stock Name No Stock Code Stock Name
1 7007 ARK 23 9628 LEBTECH
2 7078 ARZB 24 5129 MELATI
3 5190 BENALEC 25 5006 MERGE
4 5932 BPURI 26 9571 MITRA
5 8761 BREM 27 7595 MLGLOBAL
6 8591 CRESBLD 28 5924 MTDACPI
7 7528 DKLS 29 5085 MUDAJYA
8 5253 ECONBHD 30 5703 MUHIBAH
9 8877 EKOVEST 31 8311 PESONA
10 7047 FAJAR 32 6807 PUNCAK
11 9261 GADANG 33 5070 PRTASCO
12 5398 GAMUDA 34 9598 PTARAS
13 5226 GBGAQRS 35 5205 SENDAI
14 5169 HOHUP 36 5263 SUNCON
15 6238 HSL 37 9717 SYCAL
16 3336 IJM 38 5054 TRC
17 5268 IKHMAS 39 5622 TRIPLC
18 8834 IREKA 40 5042 TSRCAP
19 4723 JAKS 41 3565 WCEHB
20 9083 JETSON 42 9679 WCT
21 7161 KERJAYA 43 7028 ZECON
22 5171 KIMLUN 44 2283 ZELAN
Keng-Hoong Ng et. al. 118
The size of each generated dataset varied from one to another. We only collected
the financial data of 40 construction stocks for the financial year 2011. This is
because ECONBHD, GBGAQRS, IKHMAS, and SUNCON had yet listed on
Bursa Malaysia. The same number of stocks was gathered for the financial year
2012. During this financial year, a construction stock named GBGAQRS was
listed, but the financial data for ZECON was not accessible because the company
changed its financial year end quarter. The accessibility of the financial data for
ZECON was resumed in the following year. As a result, there were 41 stocks’
data collected for the year 2013. During the financial year 2014, the number of
stocks remained unchanged. The number of stocks increased to 44 in year 2015
dues to 3 new listings, i.e. ECONBHD, IKHMAS and SUNCON.
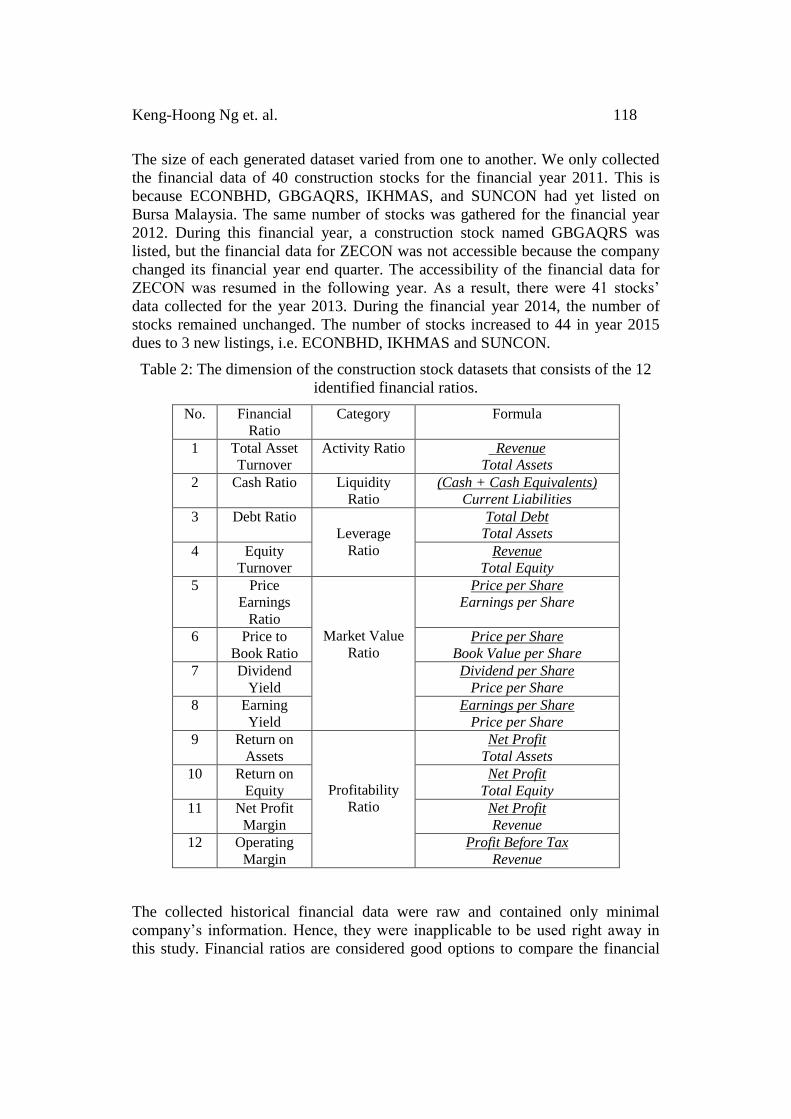
Table 2: The dimension of the construction stock datasets that consists of the 12
identified financial ratios.
No. Financial
Ratio
Category Formula
1 Total Asset
Turnover
Activity Ratio Revenue
Total Assets
2 Cash Ratio Liquidity
Ratio
(Cash + Cash Equivalents)
Current Liabilities
3 Debt Ratio
Leverage
Ratio
Total Debt
Total Assets
4 Equity
Turnover
Revenue
Total Equity
5 Price
Earnings
Ratio
Market Value
Ratio
Price per Share
Earnings per Share
6 Price to
Book Ratio
Price per Share
Book Value per Share
7 Dividend
Yield
Dividend per Share
Price per Share
8 Earning
Yield
Earnings per Share
Price per Share
9 Return on
Assets
Profitability
Ratio
Net Profit
Total Assets
10 Return on
Equity
Net Profit
Total Equity
11 Net Profit
Margin
Net Profit
Revenue
12 Operating
Margin
Profit Before Tax
Revenue
The collected historical financial data were raw and contained only minimal
company’s information. Hence, they were inapplicable to be used right away in
this study. Financial ratios are considered good options to compare the financial
119 Class Association Rules for Profiling Outlier Stocks
performance among the peers [14]. Therefore, we converted these raw financial
data into useful financial ratios. A total of 12 financial ratios was identified in this
study, and they were grouped into five main categories (refer to Table 2). We
explain the categories one by one in the next paragraph.
Activity ratio measures the operating performance of a company. Total asset
turnover is attached to this category and it shows us how much revenue can be
generated from a company’s asset. A high total asset turnover implies that the key
management of the company is very efficient in utilizing company’s assets to
maximize the income generation.
Cash ratio is attached to the liquidity ratio that shows the ability of the company
to repay its current debt. A company with a very low cash ratio may expose to a
high risk of default. A company may use loans to acquire assets or expanding its
business and the leverage ratios play the important role in this case. Two key
financial ratios attached to the leverage ratios are, namely, debt ratio and equity
turnover.
Price earnings ratio, price to book ratio, dividend yield, and earning yield are the
market value ratios. In general, these financial ratios may provide hints to
investors whether or not the current stock price is overvalued. Profitability ratios
such as return on assets, return on equity, net profit margin, and operating margin
show the amount (or the proportion) of profits that can be generated from a
company’s investment. High values in these financial ratios strongly suggest that
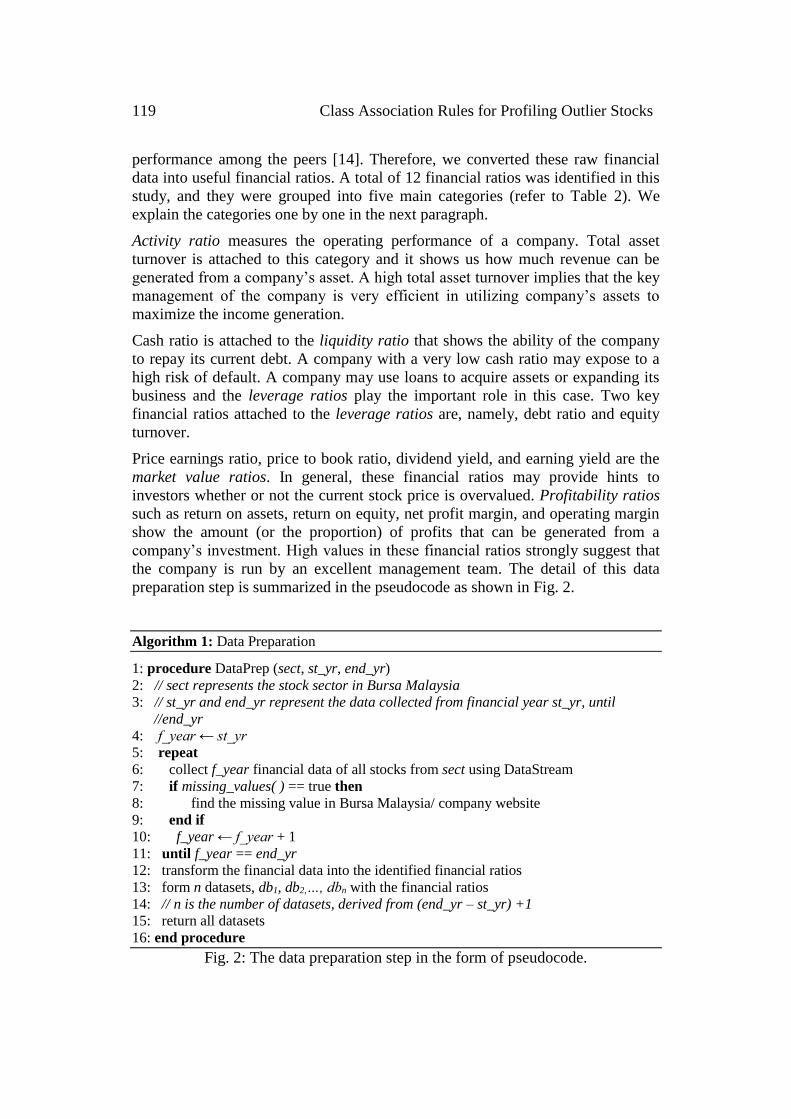
the company is run by an excellent management team. The detail of this data
preparation step is summarized in the pseudocode as shown in Fig. 2.
Algorithm 1: Data Preparation
1: procedure DataPrep (sect, st_yr, end_yr)
2: // sect represents the stock sector in Bursa Malaysia
3: // st_yr and end_yr represent the data collected from financial year st_yr, until
//end_yr
4: f_year ← st_yr
5: repeat
6: collect f_year financial data of all stocks from sect using DataStream
7: if missing_values( ) == true then
8: find the missing value in Bursa Malaysia/ company website
9: end if
10: f_year ← f_year + 1
11: until f_year == end_yr
12: transform the financial data into the identified financial ratios
13: form n datasets, db1, db2,…, dbn with the financial ratios
14: // n is the number of datasets, derived from (end_yr – st_yr) +1
15: return all datasets
16: end procedure
Fig. 2: The data preparation step in the form of pseudocode.
Keng-Hoong Ng et. al. 120
2.2 Outlier Detection Algorithm (ODA)
In this study, we adopted the Local Outlier Factor (LOF) algorithm to identify
outliers from the construction stocks datasets. An outlier refers to an instance that
is deviated too far away from other instances in a dataset [15]. In our study, a
construction stock is identified as an outlier if its financial performance is
exceptionally good or extremely poor as compared with its competitors. LOF was
selected in this study due to the following justifications: (1) it is capable of
detecting outliers in multidimensional datasets [16], and (2) it finds outliers based
on the local density. This ODA applies a score-based method where each instance
in the dataset is assigned to a LOF score. The score is calculated based on the
degree of outlier-ness of the instance in the dataset. Briefly, an instance with a
LOF value approximates to 1.0 is strongly treated as a non-outlier. On the other
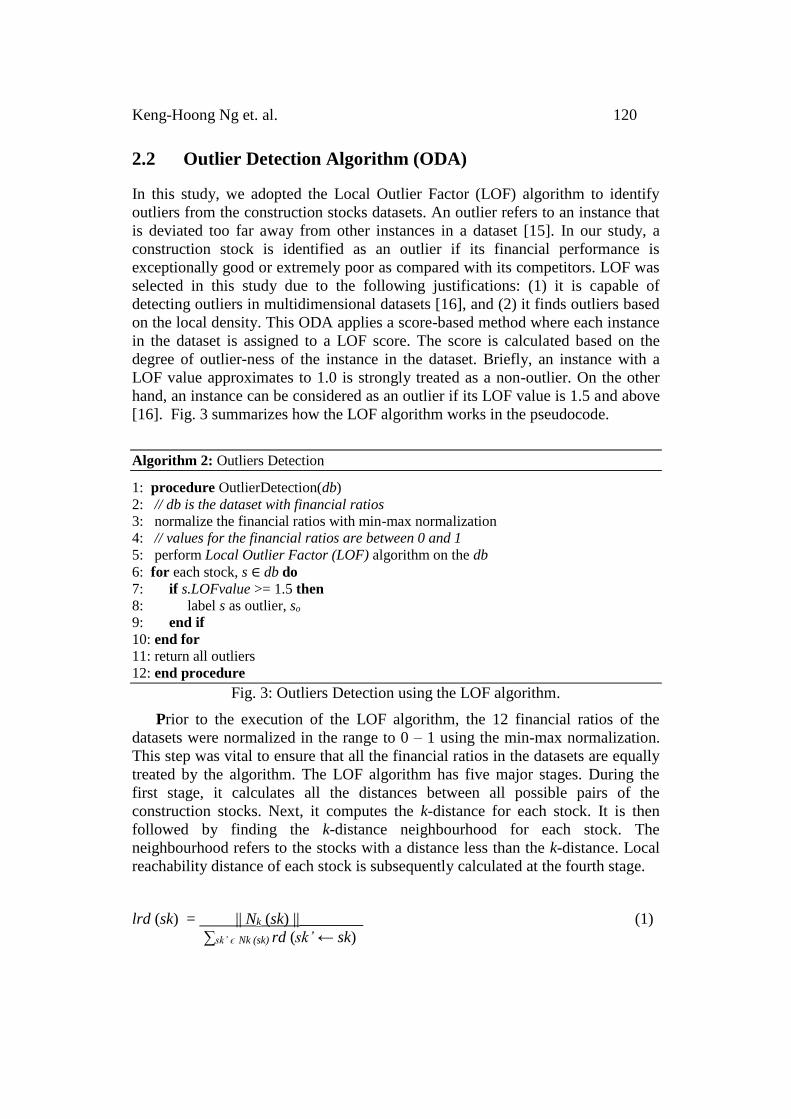
hand, an instance can be considered as an outlier if its LOF value is 1.5 and above
[16]. Fig. 3 summarizes how the LOF algorithm works in the pseudocode.
Algorithm 2: Outliers Detection
1: procedure OutlierDetection(db)
2: // db is the dataset with financial ratios
3: normalize the financial ratios with min-max normalization
4: // values for the financial ratios are between 0 and 1
5: perform Local Outlier Factor (LOF) algorithm on the db
6: for each stock, s ∈ db do
7: if s.LOFvalue >= 1.5 then
8: label s as outlier, so
9: end if
10: end for
11: return all outliers
12: end procedure
Fig. 3: Outliers Detection using the LOF algorithm.
Prior to the execution of the LOF algorithm, the 12 financial ratios of the
datasets were normalized in the range to 0 – 1 using the min-max normalization.
This step was vital to ensure that all the financial ratios in the datasets are equally
treated by the algorithm. The LOF algorithm has five major stages. During the
first stage, it calculates all the distances between all possible pairs of the
construction stocks. Next, it computes the k-distance for each stock. It is then
followed by finding the k-distance neighbourhood for each stock. The
neighbourhood refers to the stocks with a distance less than the k-distance. Local
reachability distance of each stock is subsequently calculated at the fourth stage.
lrd (sk) = || Nk (sk) ||________ (1)
∑sk’ ϵ Nk (sk) rd (sk’ ← sk)
121 Class Association Rules for Profiling Outlier Stocks
Equation 1 shows the formula to compute the local reachability distance (lrd) of a
stock, sk. || Nk (sk) || denotes the number of k-nearest neighbours to sk, and rd
(sk’← sk) is the reachability distance between sk and its k-nearest neighbour. At
the final stage, a LOF score is computed for each stock, sk. The formula to
compute the LOF score is as shown in equation 2. Using this formula, the
computed LOF (sk) is high when the local reachability densities of its k-nearest
neighbours are high and the local reachability density of sk is low. In this case, sk
can be identified as a local outlier.
LOF (sk) = ∑sk’ ϵ Nk (sk) lrd (sk’) / lrd (sk) (2)
|| Nk (sk) ||
2.3 Discretizing the Financial Ratios of the Outliers
The financial ratios of the outliers that contained numeric values need to be
converted to discrete values to suit the association rule algorithm. Binning method
[17] was selected to discretize the financial ratios of the outliers in this study. This
method discretized the financial ratios into three bin values, i.e. low, medium, and
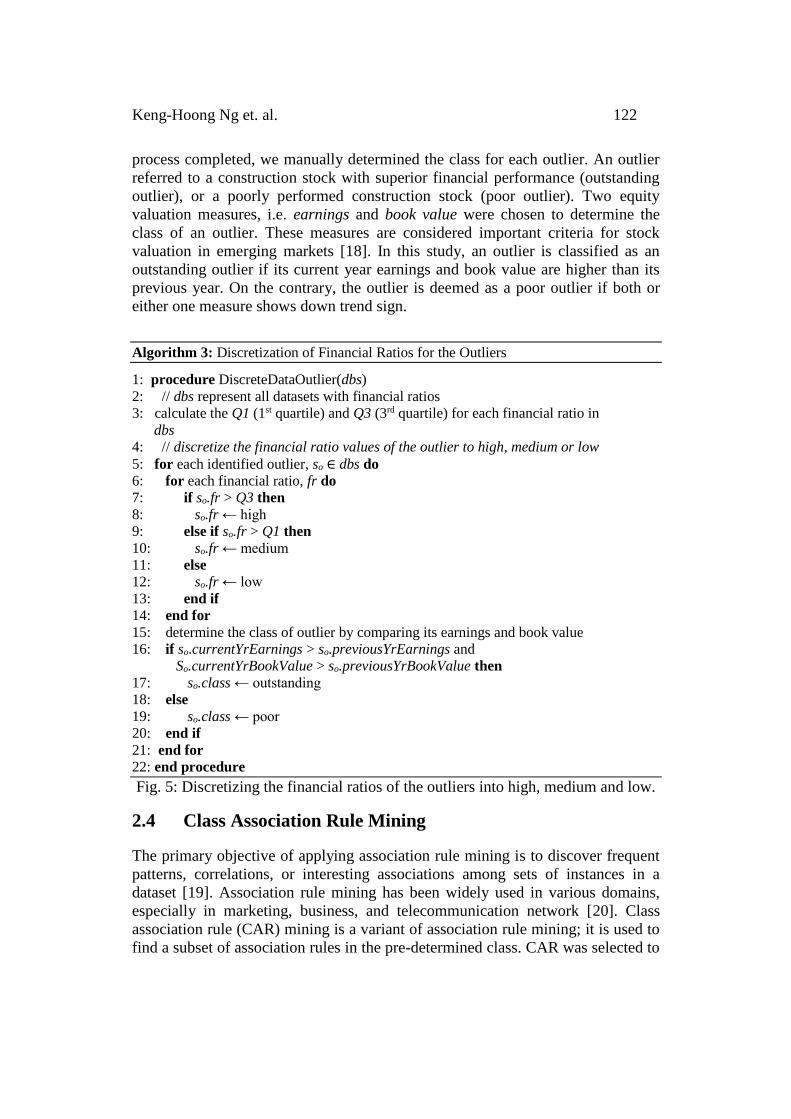
high. Fig. 4 shows the specified range for each bin. A financial ratio is categorized
as “low” if its numerical value lies between the minimum value and the quartile 1
(Q1) of the data. If the financial ratio value is within quartile 2 (Q2) and 3 (Q3),
then it is discretized as “medium”. For any financial ratio value above quartile 3
(Q3), it is considered as “high”. For example, the calculated Q1 and Q3 for the
Total Asset Turnover are 0.311 and 0.785, respectively. Hence, if the Total Asset
Turnover of a stock is 0.285, then it will be discretized as “low”. This is because
its value is less than Q1. Line 5 to 14 in the Algorithm 3 (Fig. 5) displays the
pseudocode for the discretization process.
Min Max
Q1 Q2 Q3
low medium high
Fig. 4: Financial ratio values of the outliers were discretized into three ordinal
values, i.e. low, medium and high using the binning method.
This study identified outliers from the five construction stock datasets (financial
year 2011 – 2015), and the calculation of the three quartiles (Q1, Q2 and Q3) of
each financial ratio was done on the 5-year basis. After the data discretization
Keng-Hoong Ng et. al. 122
process completed, we manually determined the class for each outlier. An outlier
referred to a construction stock with superior financial performance (outstanding
outlier), or a poorly performed construction stock (poor outlier). Two equity
valuation measures, i.e. earnings and book value were chosen to determine the
class of an outlier. These measures are considered important criteria for stock
valuation in emerging markets [18]. In this study, an outlier is classified as an
outstanding outlier if its current year earnings and book value are higher than its
previous year. On the contrary, the outlier is deemed as a poor outlier if both or
either one measure shows down trend sign.
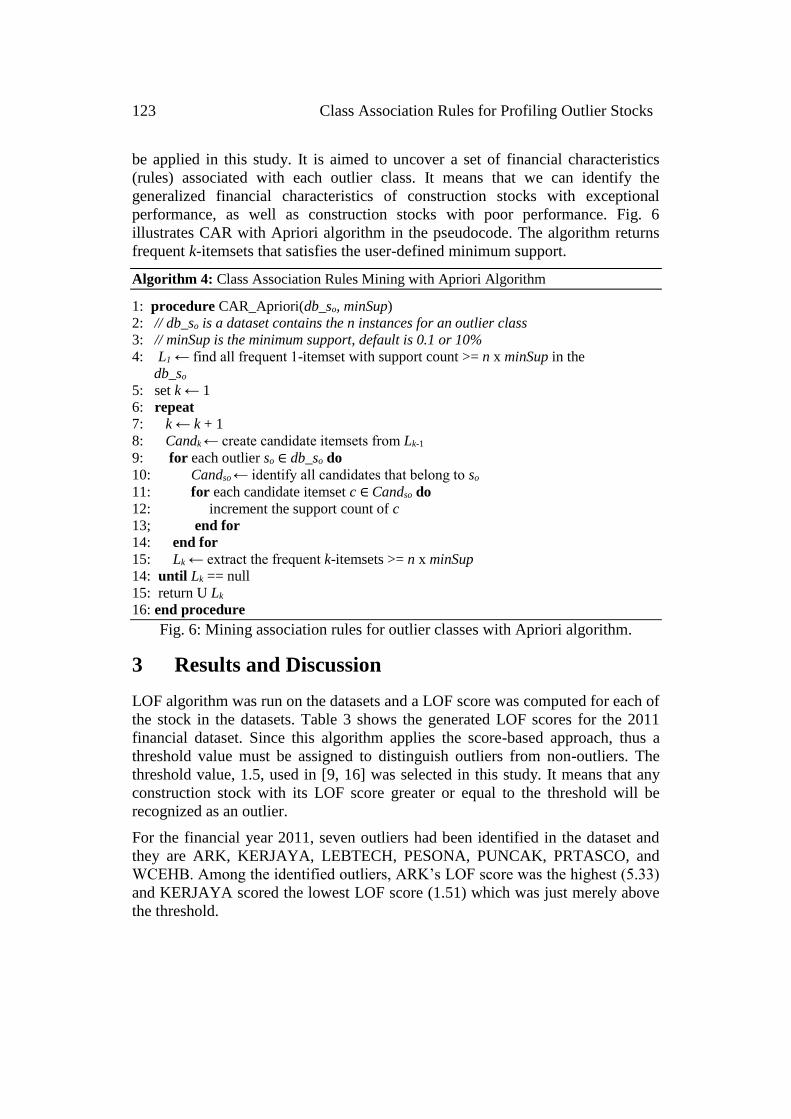
Algorithm 3: Discretization of Financial Ratios for the Outliers
1: procedure DiscreteDataOutlier(dbs)
2: // dbs represent all datasets with financial ratios
3: calculate the Q1 (1st quartile) and Q3 (3rd quartile) for each financial ratio in
dbs
4: // discretize the financial ratio values of the outlier to high, medium or low
5: for each identified outlier, so ∈ dbs do
6: for each financial ratio, fr do
7: if so.fr > Q3 then
8: so.fr ← high
9: else if so.fr > Q1 then
10: so.fr ← medium
11: else
12: so.fr ← low
13: end if
14: end for
15: determine the class of outlier by comparing its earnings and book value
16: if so.currentYrEarnings > so.previousYrEarnings and
So.currentYrBookValue > so.previousYrBookValue then
17: so.class ← outstanding
18: else
19: so.class ← poor
20: end if
21: end for
22: end procedure
Fig. 5: Discretizing the financial ratios of the outliers into high, medium and low.
2.4 Class Association Rule Mining
The primary objective of applying association rule mining is to discover frequent
patterns, correlations, or interesting associations among sets of instances in a
dataset [19]. Association rule mining has been widely used in various domains,
especially in marketing, business, and telecommunication network [20]. Class
association rule (CAR) mining is a variant of association rule mining; it is used to
find a subset of association rules in the pre-determined class. CAR was selected to
123 Class Association Rules for Profiling Outlier Stocks
be applied in this study. It is aimed to uncover a set of financial characteristics
(rules) associated with each outlier class. It means that we can identify the
generalized financial characteristics of construction stocks with exceptional
performance, as well as construction stocks with poor performance. Fig. 6
illustrates CAR with Apriori algorithm in the pseudocode. The algorithm returns
frequent k-itemsets that satisfies the user-defined minimum support.
Algorithm 4: Class Association Rules Mining with Apriori Algorithm
1: procedure CAR_Apriori(db_so, minSup)
2: // db_so is a dataset contains the n instances for an outlier class
3: // minSup is the minimum support, default is 0.1 or 10%
4: L1 ← find all frequent 1-itemset with support count >= n x minSup in the
db_so
5: set k ← 1
6: repeat
7: k ← k + 1
8: Candk ← create candidate itemsets from Lk-1
9: for each outlier so ∈ db_so do
10: Candso ← identify all candidates that belong to so
11: for each candidate itemset c ∈ Candso do
12: increment the support count of c
13; end for
14: end for
15: Lk ← extract the frequent k-itemsets >= n x minSup
14: until Lk == null
15: return U Lk
16: end procedure
Fig. 6: Mining association rules for outlier classes with Apriori algorithm.
3 Results and Discussion
LOF algorithm was run on the datasets and a LOF score was computed for each of
the stock in the datasets. Table 3 shows the generated LOF scores for the 2011
financial dataset. Since this algorithm applies the score-based approach, thus a
threshold value must be assigned to distinguish outliers from non-outliers. The
threshold value, 1.5, used in [9, 16] was selected in this study. It means that any
construction stock with its LOF score greater or equal to the threshold will be
recognized as an outlier.
For the financial year 2011, seven outliers had been identified in the dataset and
they are ARK, KERJAYA, LEBTECH, PESONA, PUNCAK, PRTASCO, and
WCEHB. Among the identified outliers, ARK’s LOF score was the highest (5.33)
and KERJAYA scored the lowest LOF score (1.51) which was just merely above
the threshold.
Keng-Hoong Ng et. al. 124
Table 3: The calculated LOF scores for the construction stocks year 2011.
Stock Name LOF Stock Name LOF
ARK 5.33 MELATI 1.01
ARZB 1.07 MERGE 1.00
BENALEC 1.00 MITRA 1.07
BPURI 1.36 MLGLOBAL 1.45
BREM 1.08 MTDACPI 1.03
CRESBLD 1.14 MUDAJYA 1.03
DKLS 1.00 MUHIBAH 1.01
EKOVEST 1.02 PESONA 2.25
FAJAR 1.23 PUNCAK 3.48
GADANG 1.00 PRTASCO 1.53
GAMUDA 1.01 PTARAS 1.24
HOHUP 1.39 SENDAI 1.01
HSL 1.02 SYCAL 1.00
IJM 1.02 TRC 1.06
IREKA 1.29 TRIPLC 1.07
JAKS 1.01 TSRCAP 1.00
JETSON 1.01 WCEHB 2.27
KERJAYA 1.51 WCT 1.01
KIMLUN 1.17 ZECON 1.20
LEBTECH 2.23 ZELAN 1.39
Five outliers, i.e. BPURI, HOHUP, JETSON, PUNCAK, and WCEHB had been
detected in the 2012 dataset (refer to Table 4). We observed that PUNCAK and
WCEHB had been identified as outliers in two consecutive financial years, while
the remaining three outliers were the first-timers. The construction stock with the
highest LOF score was WCEHB (1.95), and BPURI was the outlier with the
lowest LOF score (1.67). For the non-outliers, the majority of them exhibited LOF
scores close to 1.0. Nevertheless, there were several non-outliers with above
threshold scores (1.3 – 1.4), but they were still within the non-outlier LOF score
range.
Table 4: The calculated LOF scores for the construction stocks year 2012 Stock Name LOF Stock Name LOF
ARK 1.28 LEBTECH 1.00
ARZB 1.04 MELATI 1.00
BENALEC 1.24 MERGE 1.01
BPURI 1.67 MITRA 1.22
BREM 1.05 MLGLOBAL 1.36
CRESBLD 1.21 MTDACPI 1.43
DKLS 1.00 MUDAJYA 1.15
EKOVEST 1.05 MUHIBAH 1.42
FAJAR 1.40 PESONA 1.12
125 Class Association Rules for Profiling Outlier Stocks
GADANG 1.00 PUNCAK 1.77
GAMUDA 1.00 PRTASCO 1.29
GBGAQRS 1.01 PTARAS 1.19
HOHUP 1.70 SENDAI 1.01
HSL 1.10 SYCAL 1.00
IJM 1.00 TRC 1.00
IREKA 1.24 TRIPLC 1.35
JAKS 1.01 TSRCAP 1.00
JETSON 1.77 WCEHB 1.95
KERJAYA 1.44 WCT 1.09
KIMLUN 1.15 ZELAN 1.05
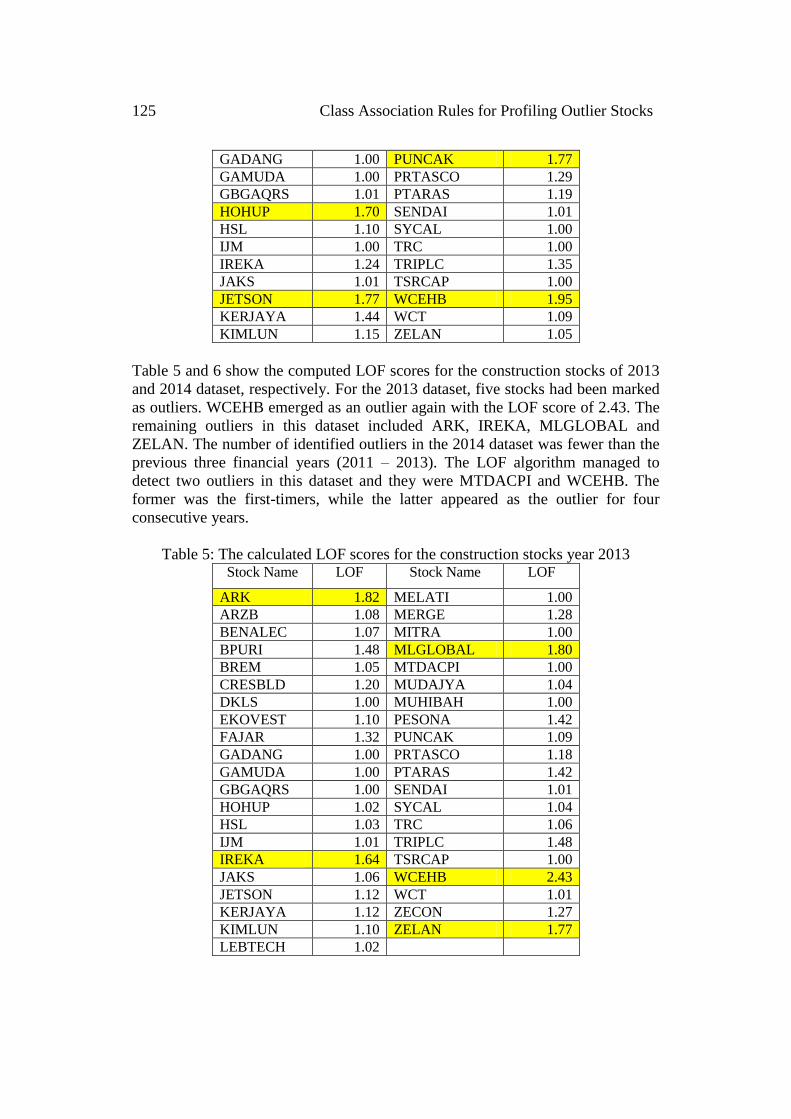
Table 5 and 6 show the computed LOF scores for the construction stocks of 2013
and 2014 dataset, respectively. For the 2013 dataset, five stocks had been marked
as outliers. WCEHB emerged as an outlier again with the LOF score of 2.43. The
remaining outliers in this dataset included ARK, IREKA, MLGLOBAL and
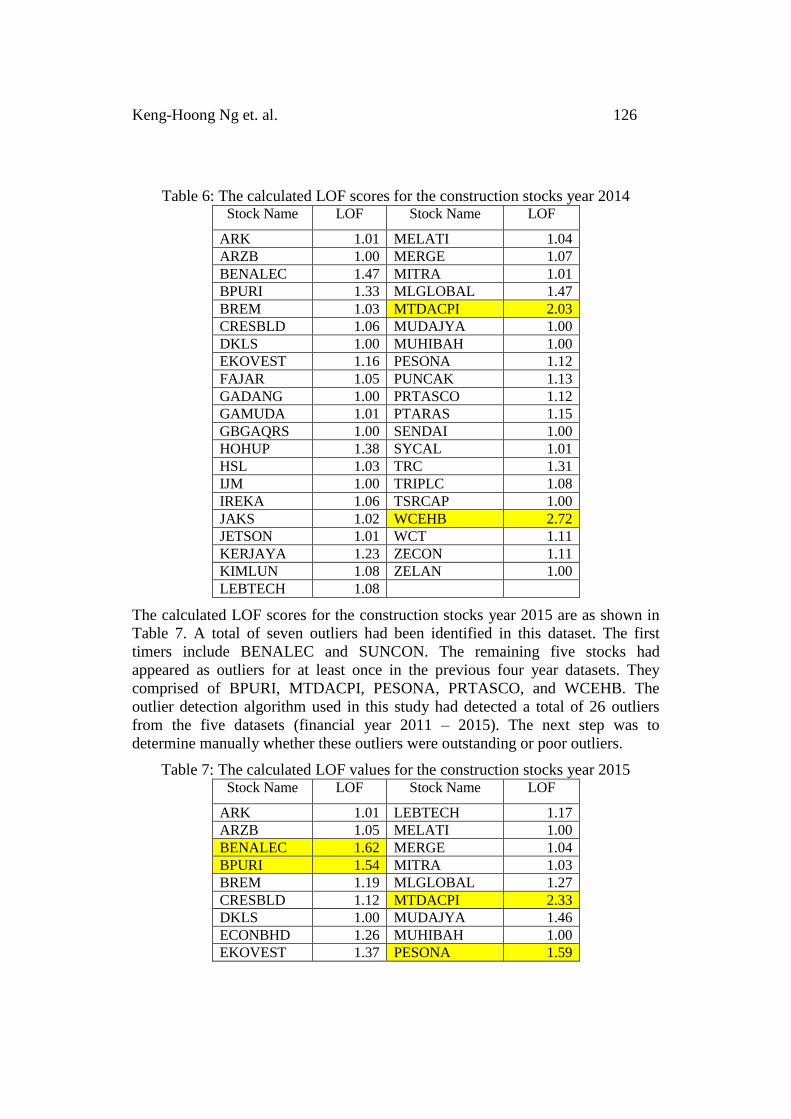
ZELAN. The number of identified outliers in the 2014 dataset was fewer than the
previous three financial years (2011 – 2013). The LOF algorithm managed to
detect two outliers in this dataset and they were MTDACPI and WCEHB. The
former was the first-timers, while the latter appeared as the outlier for four
consecutive years.
Table 5: The calculated LOF scores for the construction stocks year 2013 Stock Name LOF Stock Name LOF
ARK 1.82 MELATI 1.00
ARZB 1.08 MERGE 1.28
BENALEC 1.07 MITRA 1.00
BPURI 1.48 MLGLOBAL 1.80
BREM 1.05 MTDACPI 1.00
CRESBLD 1.20 MUDAJYA 1.04
DKLS 1.00 MUHIBAH 1.00
EKOVEST 1.10 PESONA 1.42
FAJAR 1.32 PUNCAK 1.09
GADANG 1.00 PRTASCO 1.18
GAMUDA 1.00 PTARAS 1.42
GBGAQRS 1.00 SENDAI 1.01
HOHUP 1.02 SYCAL 1.04
HSL 1.03 TRC 1.06
IJM 1.01 TRIPLC 1.48
IREKA 1.64 TSRCAP 1.00
JAKS 1.06 WCEHB 2.43
JETSON 1.12 WCT 1.01
KERJAYA 1.12 ZECON 1.27
KIMLUN 1.10 ZELAN 1.77
LEBTECH 1.02
Keng-Hoong Ng et. al. 126
Table 6: The calculated LOF scores for the construction stocks year 2014 Stock Name LOF Stock Name LOF
ARK 1.01 MELATI 1.04
ARZB 1.00 MERGE 1.07
BENALEC 1.47 MITRA 1.01
BPURI 1.33 MLGLOBAL 1.47
BREM 1.03 MTDACPI 2.03
CRESBLD 1.06 MUDAJYA 1.00
DKLS 1.00 MUHIBAH 1.00
EKOVEST 1.16 PESONA 1.12
FAJAR 1.05 PUNCAK 1.13
GADANG 1.00 PRTASCO 1.12
GAMUDA 1.01 PTARAS 1.15
GBGAQRS 1.00 SENDAI 1.00
HOHUP 1.38 SYCAL 1.01
HSL 1.03 TRC 1.31
IJM 1.00 TRIPLC 1.08
IREKA 1.06 TSRCAP 1.00
JAKS 1.02 WCEHB 2.72
JETSON 1.01 WCT 1.11
KERJAYA 1.23 ZECON 1.11
KIMLUN 1.08 ZELAN 1.00
LEBTECH 1.08
The calculated LOF scores for the construction stocks year 2015 are as shown in
Table 7. A total of seven outliers had been identified in this dataset. The first
timers include BENALEC and SUNCON. The remaining five stocks had
appeared as outliers for at least once in the previous four year datasets. They
comprised of BPURI, MTDACPI, PESONA, PRTASCO, and WCEHB. The
outlier detection algorithm used in this study had detected a total of 26 outliers
from the five datasets (financial year 2011 – 2015). The next step was to
determine manually whether these outliers were outstanding or poor outliers.
Table 7: The calculated LOF values for the construction stocks year 2015 Stock Name LOF Stock Name LOF
ARK 1.01 LEBTECH 1.17
ARZB 1.05 MELATI 1.00
BENALEC 1.62 MERGE 1.04
BPURI 1.54 MITRA 1.03
BREM 1.19 MLGLOBAL 1.27
CRESBLD 1.12 MTDACPI 2.33
DKLS 1.00 MUDAJYA 1.46
ECONBHD 1.26 MUHIBAH 1.00
EKOVEST 1.37 PESONA 1.59
127 Class Association Rules for Profiling Outlier Stocks
FAJAR 1.05 PUNCAK 1.45
GADANG 1.00 PRTASCO 1.51
GAMUDA 1.01 PTARAS 1.13
GBGAQRS 1.04 SENDAI 1.00
HOHUP 1.14 SUNCON 1.61
HSL 1.04 SYCAL 1.01
IJM 1.00 TRC 1.01
IKHMAS 1.01 TRIPLC 1.38
IREKA 1.01 TSRCAP 1.00
JAKS 1.01 WCEHB 2.00
JETSON 1.07 WCT 1.01
KERJAYA 1.04 ZECON 1.30
KIMLUN 1.05 ZELAN 1.00
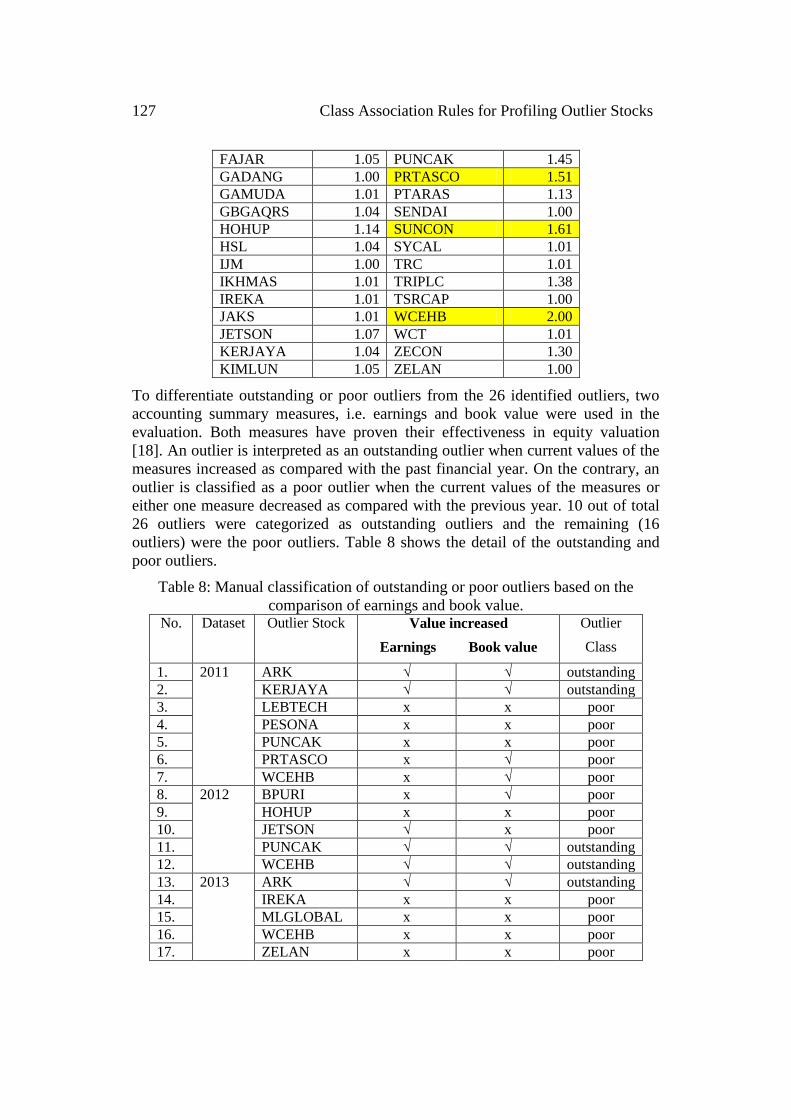
To differentiate outstanding or poor outliers from the 26 identified outliers, two
accounting summary measures, i.e. earnings and book value were used in the
evaluation. Both measures have proven their effectiveness in equity valuation
[18]. An outlier is interpreted as an outstanding outlier when current values of the
measures increased as compared with the past financial year. On the contrary, an
outlier is classified as a poor outlier when the current values of the measures or
either one measure decreased as compared with the previous year. 10 out of total
26 outliers were categorized as outstanding outliers and the remaining (16
outliers) were the poor outliers. Table 8 shows the detail of the outstanding and
poor outliers.
Table 8: Manual classification of outstanding or poor outliers based on the
comparison of earnings and book value. No. Dataset Outlier Stock Value increased
Earnings Book value
Outlier
Class
1. 2011 ARK √ √ outstanding
2. KERJAYA √ √ outstanding
3. LEBTECH x x poor
4. PESONA x x poor
5. PUNCAK x x poor
6. PRTASCO x √ poor
7. WCEHB x √ poor
8. 2012 BPURI x √ poor
9. HOHUP x x poor
10. JETSON √ x poor
11. PUNCAK √ √ outstanding
12. WCEHB √ √ outstanding
13. 2013 ARK √ √ outstanding
14. IREKA x x poor
15. MLGLOBAL x x poor
16. WCEHB x x poor
17. ZELAN x x poor
Keng-Hoong Ng et. al. 128
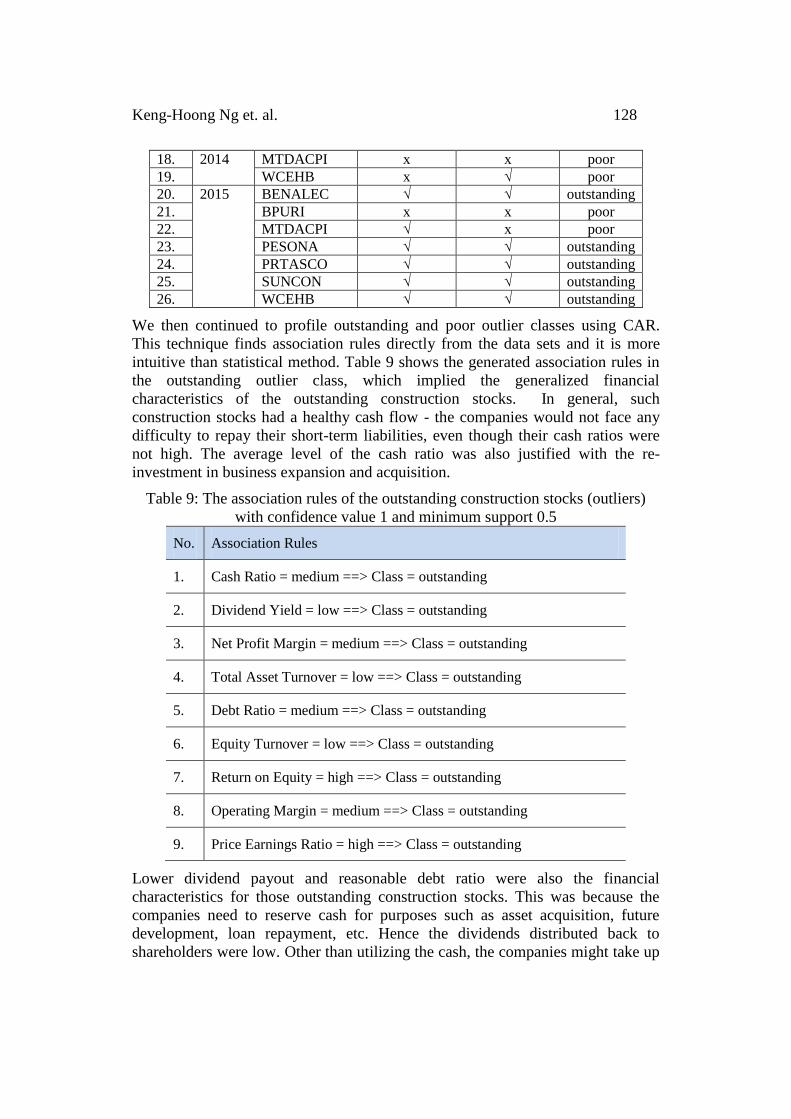
18. 2014 MTDACPI x x poor
19. WCEHB x √ poor
20. 2015 BENALEC √ √ outstanding
21. BPURI x x poor
22. MTDACPI √ x poor
23. PESONA √ √ outstanding
24. PRTASCO √ √ outstanding
25. SUNCON √ √ outstanding
26. WCEHB √ √ outstanding
We then continued to profile outstanding and poor outlier classes using CAR.
This technique finds association rules directly from the data sets and it is more
intuitive than statistical method. Table 9 shows the generated association rules in
the outstanding outlier class, which implied the generalized financial
characteristics of the outstanding construction stocks. In general, such
construction stocks had a healthy cash flow - the companies would not face any
difficulty to repay their short-term liabilities, even though their cash ratios were
not high. The average level of the cash ratio was also justified with the re-
investment in business expansion and acquisition.
Table 9: The association rules of the outstanding construction stocks (outliers)
with confidence value 1 and minimum support 0.5
No. Association Rules
1. Cash Ratio = medium ==> Class = outstanding
2. Dividend Yield = low ==> Class = outstanding
3. Net Profit Margin = medium ==> Class = outstanding
4. Total Asset Turnover = low ==> Class = outstanding
5. Debt Ratio = medium ==> Class = outstanding
6. Equity Turnover = low ==> Class = outstanding
7. Return on Equity = high ==> Class = outstanding
8. Operating Margin = medium ==> Class = outstanding
9. Price Earnings Ratio = high ==> Class = outstanding
Lower dividend payout and reasonable debt ratio were also the financial
characteristics for those outstanding construction stocks. This was because the
companies need to reserve cash for purposes such as asset acquisition, future
development, loan repayment, etc. Hence the dividends distributed back to
shareholders were low. Other than utilizing the cash, the companies might take up
129 Class Association Rules for Profiling Outlier Stocks
credit facilities to finance the same purpose. The net profit margin and operating
margin of the company were also at the satisfactory level, attributed to the
efficient company policy and management. The high return on equity was another
unique feature for those outstanding construction stocks as the companies were
well managed by the management. Hence, the companies’ assets were fully
utilized to generate high returns to shareholders. An outstanding performance
stock attracts investors, and they are willing to buy the stock with a high price.
Hence, the high price earnings ratio of the company was justified.
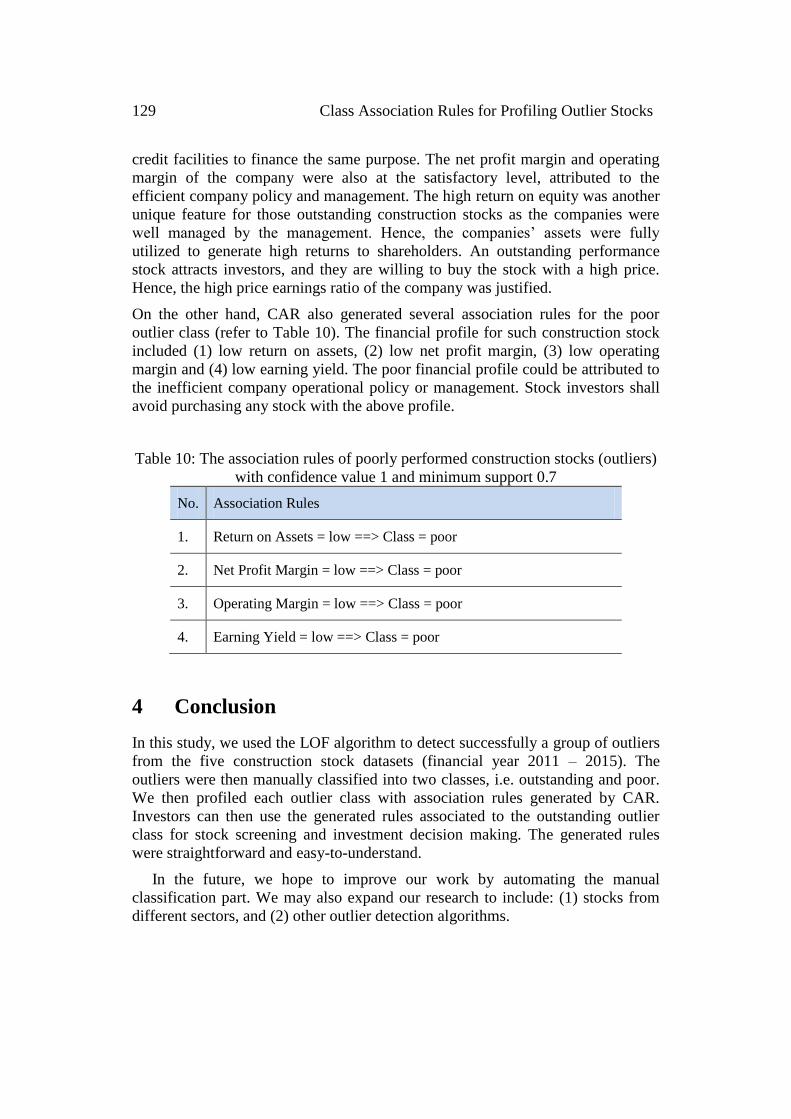
On the other hand, CAR also generated several association rules for the poor
outlier class (refer to Table 10). The financial profile for such construction stock
included (1) low return on assets, (2) low net profit margin, (3) low operating
margin and (4) low earning yield. The poor financial profile could be attributed to
the inefficient company operational policy or management. Stock investors shall
avoid purchasing any stock with the above profile.
Table 10: The association rules of poorly performed construction stocks (outliers)
with confidence value 1 and minimum support 0.7
No. Association Rules
1. Return on Assets = low ==> Class = poor
2. Net Profit Margin = low ==> Class = poor
3. Operating Margin = low ==> Class = poor
4. Earning Yield = low ==> Class = poor
4 Conclusion
In this study, we used the LOF algorithm to detect successfully a group of outliers
from the five construction stock datasets (financial year 2011 – 2015). The
outliers were then manually classified into two classes, i.e. outstanding and poor.
We then profiled each outlier class with association rules generated by CAR.
Investors can then use the generated rules associated to the outstanding outlier
class for stock screening and investment decision making. The generated rules
were straightforward and easy-to-understand.
In the future, we hope to improve our work by automating the manual
classification part. We may also expand our research to include: (1) stocks from
different sectors, and (2) other outlier detection algorithms.
Keng-Hoong Ng et. al. 130
References
[1] Ng, K.H. and Khor, K.C., 2016. Evaluation on rapid profiling with clustering
algorithms for plantation stocks on Bursa Malaysia. Journal of ICT, 15(2), 63
– 84.
[2] San, O.T. and Heng, T.B., 2011. Capital structure and corporate performance
of Malaysian construction sector. International Journal of Humanities and
Social Science, 1(2), 28 – 36.
[3] Paranjape-Voditel, P. and Deshpande, U., 2013. A stock market portfolio
recommender system based on association rule mining. Applied Soft
Computing, 13(2), 1055 – 1063.
[4] Prasanna, S. and Ezhilmaran, D., 2016. Association rule mining using
enhanced apriori with modified GA for stock prediction. International Journal
of Data Mining, Modelling and Management, 8(2), 195 – 207.
[5] Guresen, E., Kayakutlu, G. and Daim, T.U., 2011. Using artificial neural
network models in stock market index prediction. Expert Systems with
Applications, 38(8), 10389 – 10397.
[6] Wang, B., Huang, H. and Wang, X., 2013. A support vector machine based
MSM model for financial short-term volatility forecasting. Neural Computing
and Applications, 22(1), 21 – 28.
[7] Thong, P.H., 2015. A new approach to multi-variable fuzzy forecasting using
picture fuzzy clustering and picture fuzzy rule interpolation method. In
Knowledge and systems engineering (pp. 679 - 690). Springer International
Publishing.
[8] Aghabozorgi, S. and Teh, Y.W., 2014. Stock market co-movement assessment
using a three-phase clustering method. Expert Systems with Applications,
41(4), 1301 – 1314.
[9] Ng, K.H. and Khor, K.C., 2017. StockProF: a stock profiling framework using
data mining approaches. Information Systems and e-Business Management,
15(1), 139 – 158.
[10] Gupta, A. and Sharma, S.D., 2014. Clustering-Classification based prediction
of stock market future prediction. IJCSIT) International Journal of Computer
Science and Information Technologies, 5(3), 2806 – 2809.
[11] Choudhury, S., Ghosh, S., Bhattacharya, A., Fernandes, K.J. and Tiwari,
M.K., 2014. A real time clustering and SVM based price-volatility prediction
for optimal trading strategy. Neurocomputing, 131, 419 – 426.
[12] Taylor, B., Kim, M. and Choi, A., 2014. Automated stock trading algorithm
using neural networks. In Proceedings of the 2nd International Conference on
Intelligent Technologies and Engineering Systems (pp. 849-857). Springer.
131 Class Association Rules for Profiling Outlier Stocks
[13] Chiang, W.C., Enke, D., Wu, T. and Wang, R., 2016. An adaptive stock
index trading decision support system. Expert Systems with Applications, 59,
195 – 207.
[14] Sim, K., Liu, G., Gopalkrishnan, V. and Li, J., 2011. A case study on
financial ratios via cross-graph quasi-bicliques. Information Sciences, 181(1),
201 – 216.
[15] Aggarwal, C. and Yu, S., 2005. An effective and efficient algorithm for high-
dimensional outlier detection. The VLDB Journal—The International Journal
on Very Large Data Bases, 14(2), 211 – 221.
[16] Breunig, M.M., Kriegel, H.P., Ng, R.T. and Sander, J., 2000. LOF:
identifying density-based local outliers. In ACM sigmod record, 29(2), 93 –
104.
[17] Hsieh, N.C. and Hung, L.P., 2010. A data driven ensemble classifier for
credit scoring analysis. Expert systems with Applications, 37(1), 534 – 545.
[18] Bao, B.H. and Chow, L., 1999. The usefulness of earnings and book value
for equity valuation in emerging capital markets: evidence from listed
companies in the People's Republic of China. Journal of International
Financial Management & Accounting, 10(2), 85 – 104.
[19] Tan, P.N. and Kumar, V., 2005. Chapter 6. association analysis: Basic
concepts and algorithms. Introduction to Data Mining. Addison-Wesley.
[20] Kotsiantis, S. and Kanellopoulos, D., 2006. Association rules mining: A
recent overview. GESTS International Transactions on Computer Science and
Engineering, 32(1), 71 – 82.
[21] Saiful Hafizah Jaaman, Siti Mariyam Shamsuddin, Bariah Yusob and Munira
Ismail., 2009. Predictive Model Construction Applying Rough Set
Methodology for Malaysian Stock Market Returns, International Research
Journal of Finance and Economics, Issue (30), 211-218.
![Association Rules Dm[2]](https://static.fdocuments.in/doc/165x107/577d38671a28ab3a6b97c249/association-rules-dm2.jpg)