
C.J. Jepma Foundation JIN Meerkoetlaan 30a 9765 TD Paterswolde tel.: +31(0) 50 309 68 15 e-mail:...
23
C.J. Jepma Foundation JIN Meerkoetlaan 30a 9765 TD Paterswolde tel.: +31(0) 50 309 68 15 e-mail: [email protected] the Future of the Market for Natural Gas four storylines to 2040
-
Upload
brian-barber -
Category
Documents
-
view
219 -
download
0
Transcript of C.J. Jepma Foundation JIN Meerkoetlaan 30a 9765 TD Paterswolde tel.: +31(0) 50 309 68 15 e-mail:...
C.J. Jepma
Foundation JINMeerkoetlaan 30a9765 TD Paterswolde
tel.: +31(0) 50 309 68 15e-mail: [email protected]
the Future of the Market for Natural Gas
four storylines to 2040

Goal of the study
The ultimate goal of the study is to assess what strategic action may be required from international gas market players in order to optimally address the various developments foreseen in the structure, size, and position of the international gas market as a result of the present and possibly changing trend towards more sustainable energy production, use and implementation.

New challenges to the gas industry
Can natural gas play an important role as transition fuel towards a carbon free energy system, and how will this work out in the future role of gas on the energy market?
Will security of supply of energy issues increasingly dominate public concern, and how may this affect the gas market conditions?
New challenges to the gas industry
To what extent may climate change and other environmental and safety concerns affect the trends in fossil fuel and renewable fuel use, and how will this affect the gas market share?
Will internationalisation and liberalisation of the gas market lead to more flexible but less predictable gas flows, and to what extent can flexibility in demand be matched by flexibility of supply?
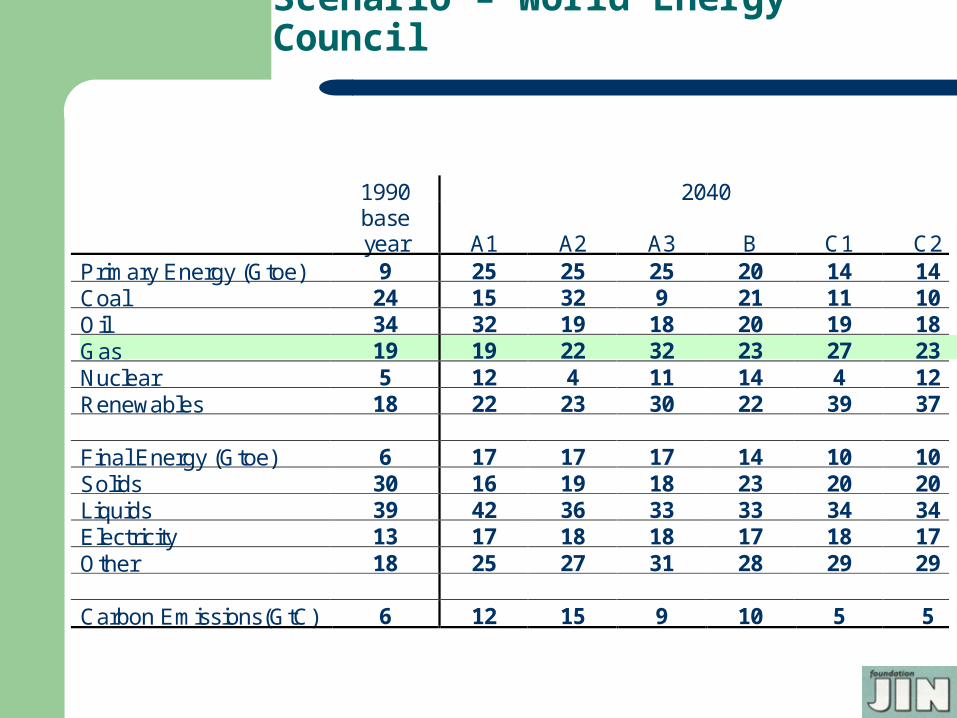
Scenario – World Energy Council
1990 2040
base year A1 A2 A3 B C1 C2
Primary Energy (Gtoe) 9 25 25 25 20 14 14 Coal 24 15 32 9 21 11 10 Oil 34 32 19 18 20 19 18 Gas 19 19 22 32 23 27 23 Nuclear 5 12 4 11 14 4 12 Renewables 18 22 23 30 22 39 37 Final Energy (Gtoe) 6 17 17 17 14 10 10 Solids 30 16 19 18 23 20 20 Liquids 39 42 36 33 33 34 34 Electricity 13 17 18 18 17 18 17 Other 18 25 27 31 28 29 29 Carbon Emissions(GtC) 6 12 15 9 10 5 5

Scenario – World Energy Council
Share of gas in primary energy is scheduled to increase from 19% in 1990 to levels ranging from 22-32% in 2040.

Scenario – IPCC/SRES
Envisage a number of possible developments: diffusion of existing technologies and knowledge
from the present industrialised countries to the rest of the world, slow technological development
industrialised countries strongly shift away from their traditional economic development path: emergence of ‘knowledge’ economies
world will follow a new Kondratieff wave leading to enhanced economic growth with new high-technology industries and with opportunities for developing to catch up their development
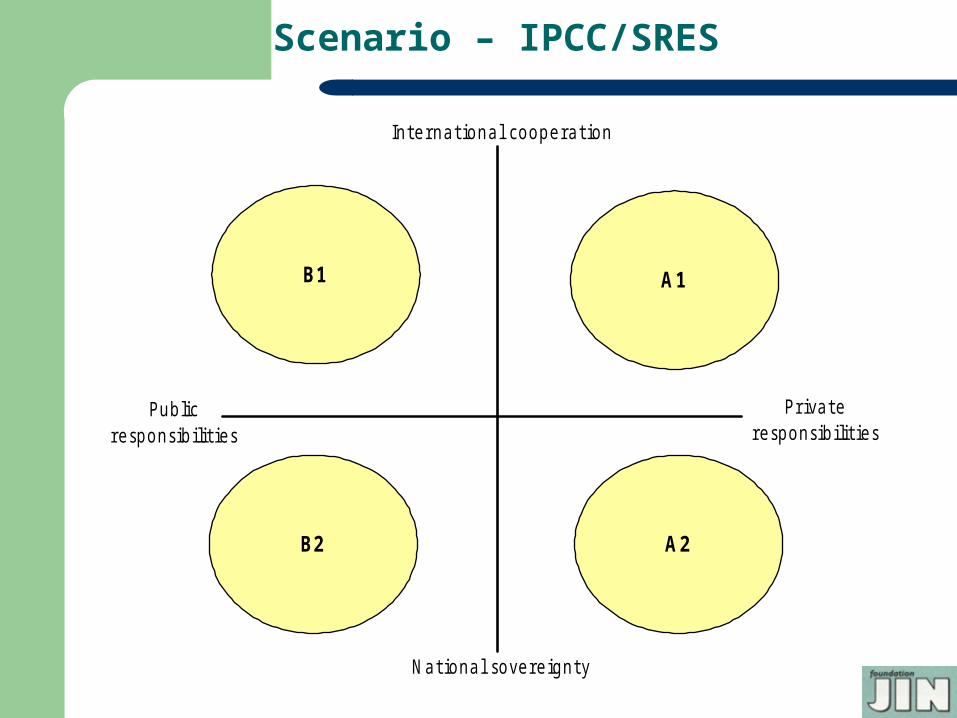
Scenario – IPCC/SRES
B1 A1
B2 A2
Nat ional sovereignty
Privateresponsibilit ies
Publicresponsibilit ies
Internat ional cooperat ion
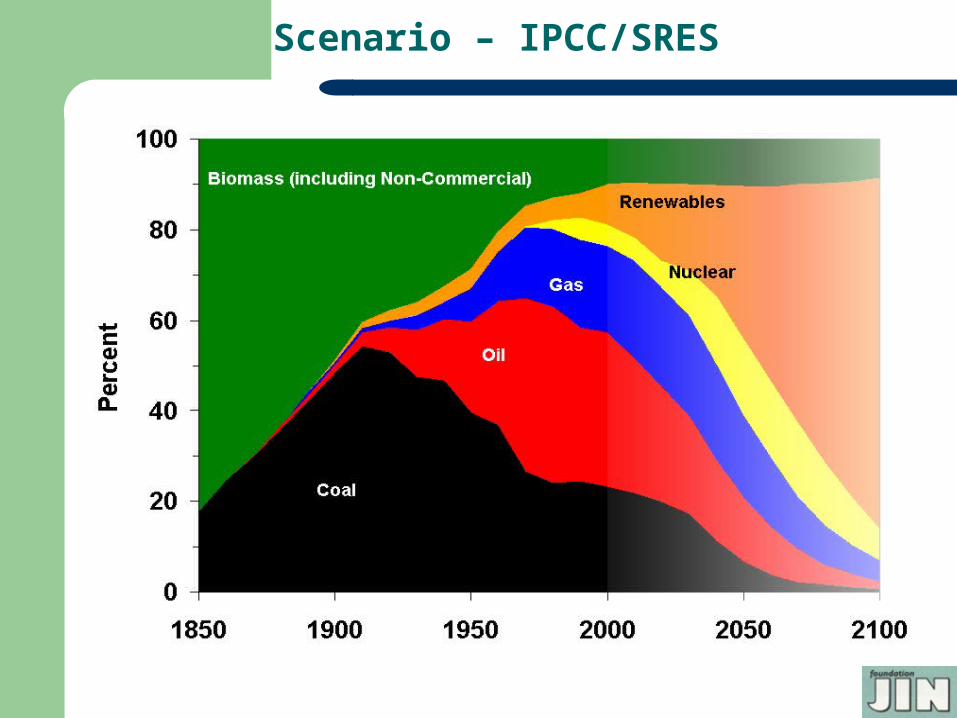
Scenario – IPCC/SRES
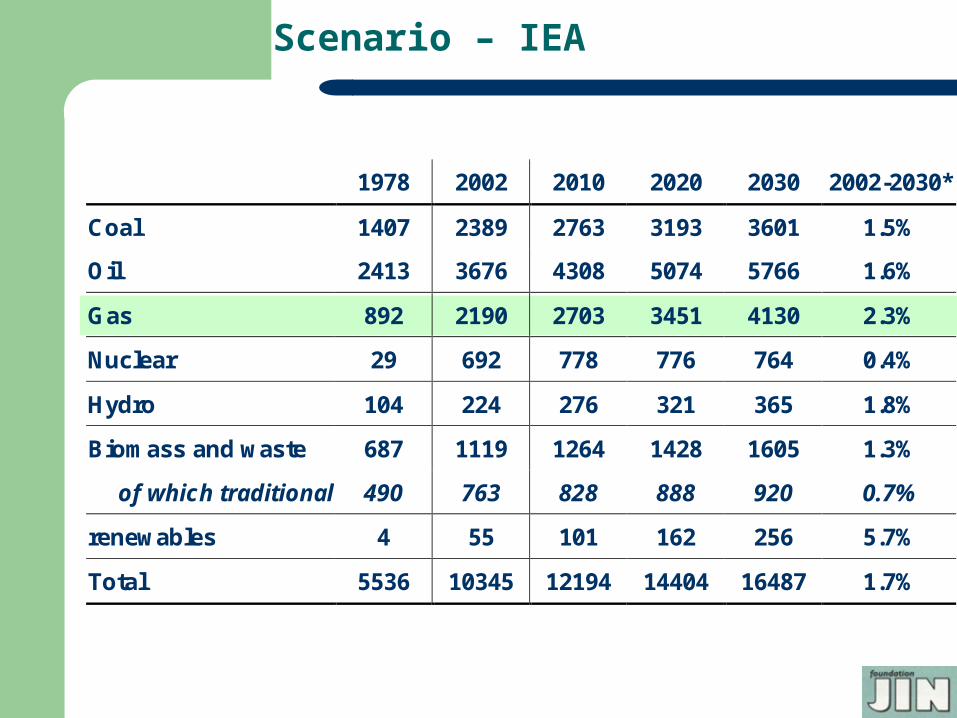
Scenario – IEA
1978 2002 2010 2020 2030 2002-2030*
Coal 1407 2389 2763 3193 3601 1.5%
Oil 2413 3676 4308 5074 5766 1.6%
Gas 892 2190 2703 3451 4130 2.3%
Nuclear 29 692 778 776 764 0.4%
Hydro 104 224 276 321 365 1.8%
Biomass and waste 687 1119 1264 1428 1605 1.3%
of which traditional 490 763 828 888 920 0.7%
renewables 4 55 101 162 256 5.7%
Total 5536 10345 12194 14404 16487 1.7%

Scenario – IEA
7000
6000
5000
4000
3000
2000
1000
01970 1980 1990 2000 2010 2020 2030
Coal Oil Gas Nuclear Hydro Other
World primary energy demand by fuel (in Mtoe)
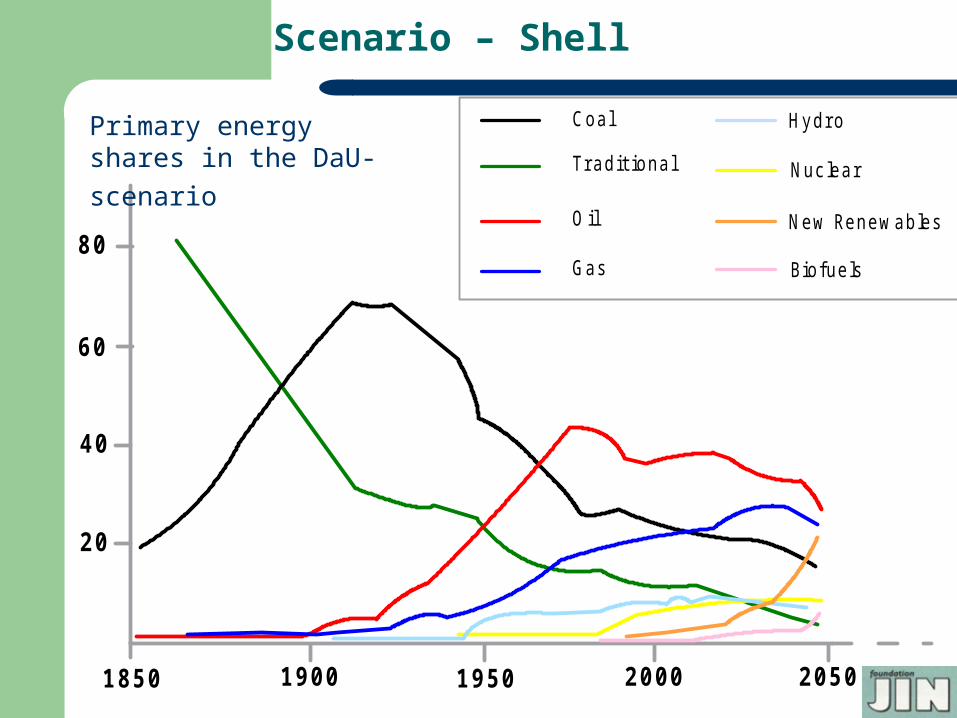
Scenario – Shell
80
60
40
20
2000 2050195019001850
Tr adit ional
Coal
O il
Gas
New Renewables
Biofuels
Hydr o
Nuc lear
Primary energy shares in the DaU-scenario

Scenario – Shell (DaU)
Dynamics as Usual 1975 2000 2025 2050 Oil 2740 3724 4918 5363 Coal 1639 2178 2998 2763 Coal CH4/H2 94 375 Gas 1101 2178 3911 4145 Nuclear 94 679 820 749 Hydro 398 703 960 913 Biofuels 117 1218 Other renewables 94 1171 4473 Total 5972 9555 14988 20000
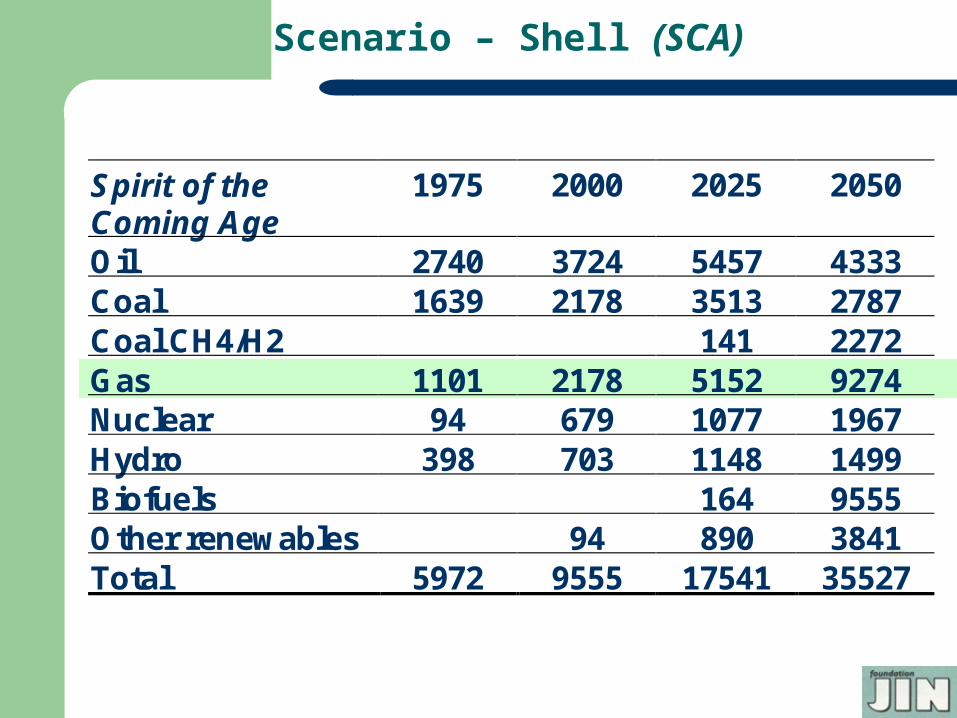
Scenario – Shell (SCA)
Spirit of the Coming Age
1975 2000 2025 2050
Oil 2740 3724 5457 4333 Coal 1639 2178 3513 2787 Coal CH4/H2 141 2272 Gas 1101 2178 5152 9274 Nuclear 94 679 1077 1967 Hydro 398 703 1148 1499 Biofuels 164 9555 Other renewables 94 890 3841 Total 5972 9555 17541 35527

Four non-traditional storylines
the role of gas as a transition fuel in a rapidly greening world
security of supply in a world with increasing gas supply - infrastructure constraints
other fuels, both traditional (incl. nuclear) and renewable ones, are increasingly successful in increasing their share in overall energy supply
the flexibility to generate sufficient swing to serve increasingly volatile demand patterns in a decentralising energy supply world.

Transition storyline
Assumptions increasing awareness of climate change risks fast and massive introduction of
commercially viable applications of renewable energy
the use of green gas (= biomass-based) is strongly promoted
decentralized energy systems based on micro CHP, small-scale renewables, and green gas become increasingly popular
large-scale biomass plantations are set up, especially in the tropics

Transition storyline
Rationale Russian Kyoto ratification, EU ETS starts‘05 potentially catastrophic unstable regime of
intermittent abrupt climate change negotiations on the post-Kyoto period regime trade policy measures are increasingly
accepted domestic power production based on coal is
already being phased out market share of CHP has already increased
fairly rapidly in industrialised countries

Security of Supply storyline
Assumptions growing concern about the availability of energy oil reserves are depleted the share of renewables remains low, nuclear
option under debate, coal is phased out for environmental reasons – gas is strategic option
Europe, NAFTA, Japan, China and India increasingly compete for the available gas resources
concerns about terrorist attacks regions increasingly try to become less
dependent on imports
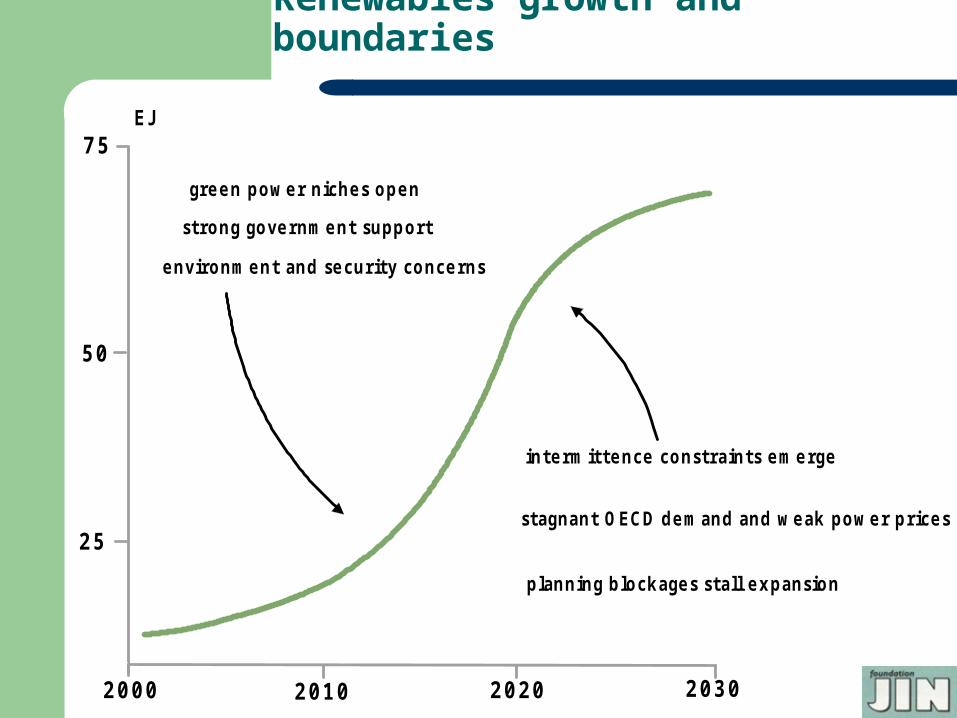
Renewables growth and boundaries
2020
75
50
25
2000 2010 2030
environment and security concerns
green pow er niches open
strong government support
intermittence constraints emerge
stagnant OECD demand and w eak power prices
planning blockages stall expansion
EJ

Gas Imports as a % of total energy consumption
20
15
10
5
2000 2010 20201970 1980 1990
J apan
Europe
North East Asia
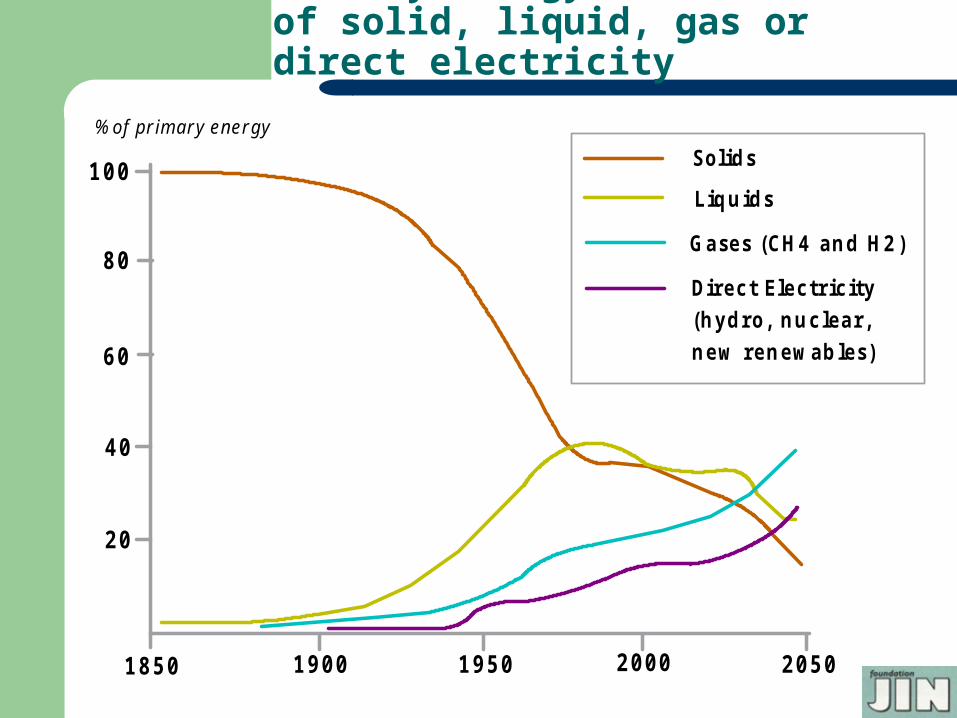
Primary energy demand in terms of solid, liquid, gas or direct electricity
80
% of pr imar y ener gy
100
60
40
20
2000 2050195019001850
Solids
Liquids
Gases (CH4 and H2)
Direct Electr ic ity(hydro, nuc lear ,new renewables)
Coal, oil and nuclear storyline
Assumptions: nuclear power becomes increasingly fashionable clean coal technologies will take a giant leap
forward considerable new supply of oil is generated carbon credits prices per tCO2 keep fluctuating in
the €10-40 range: no trigger for large-scale introduction of renewables
concerns about climate change grow less energy prices remain at a fairly modest level
(€20-50/barrel oeq.) natural gas is increasingly facing legislative and
regulatory difficulties

Flexibility storyline
Assumptions: flexibility by production is increasingly taken
over by flexibility in storage and import through LNG
politics and policy driven regulatory regimes lead to underinvestment or at least suboptimal investment in gasinfrastructure
gas is seen as providing the flexibility needed gas production flexibility is less and less
available international conflicts and interventions lead to
increasing tensions and regionalised international gas markets.


![-+,+ I`r =``og` I`r =``og` >jiq`mod]g`assets.cobaltnitra.com/teams/repository/export/488/e55c0...I`r =``og` >jiq`mod]g`Ê,1 H\gdI`r =``og` >jiq`mod]g`Ê,2 Q`mnpn](https://static.fdocuments.in/doc/165x107/5fa938d4f006652a014f30a5/-ir-og-ir-og-jiqmodg-ir-og-jiqmodg1-hgdir.jpg)


