Oil and gas decommissioning: opportunities for reuse and...
14
Founding partners Prof. Catrinus Jepma Final Conference for the MUSES project Brussels, 10 October 2018 Oil and gas decommissioning: opportunities for reuse and repurposing 1
Transcript of Oil and gas decommissioning: opportunities for reuse and...

Founding partners
Prof. Catrinus Jepma
Final Conference for the MUSES project
Brussels, 10 October 2018
Oil and gas decommissioning: opportunities for reuse and
repurposing
1

Offshore potential of energy conversion
2
Two key options (except from platform electrification and gas-to-wire)
1. Use platform for conversion of nearby wind energy
2. Use platform for offshore CCS
3
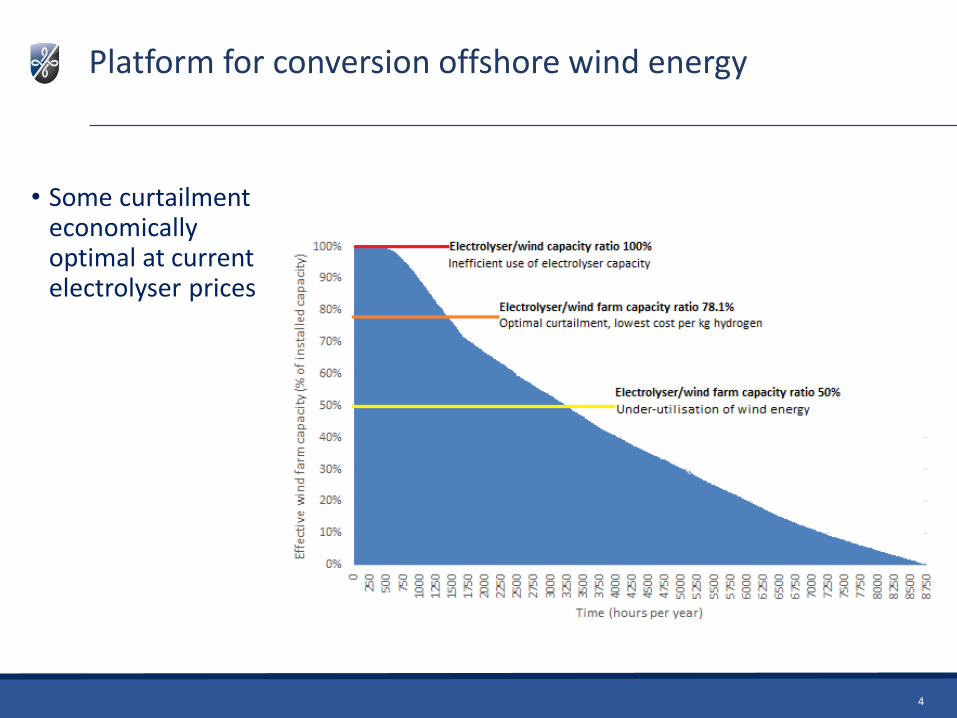
Platform for conversion offshore wind energy
• Some curtailmenteconomicallyoptimal at currentelectrolyser prices
4
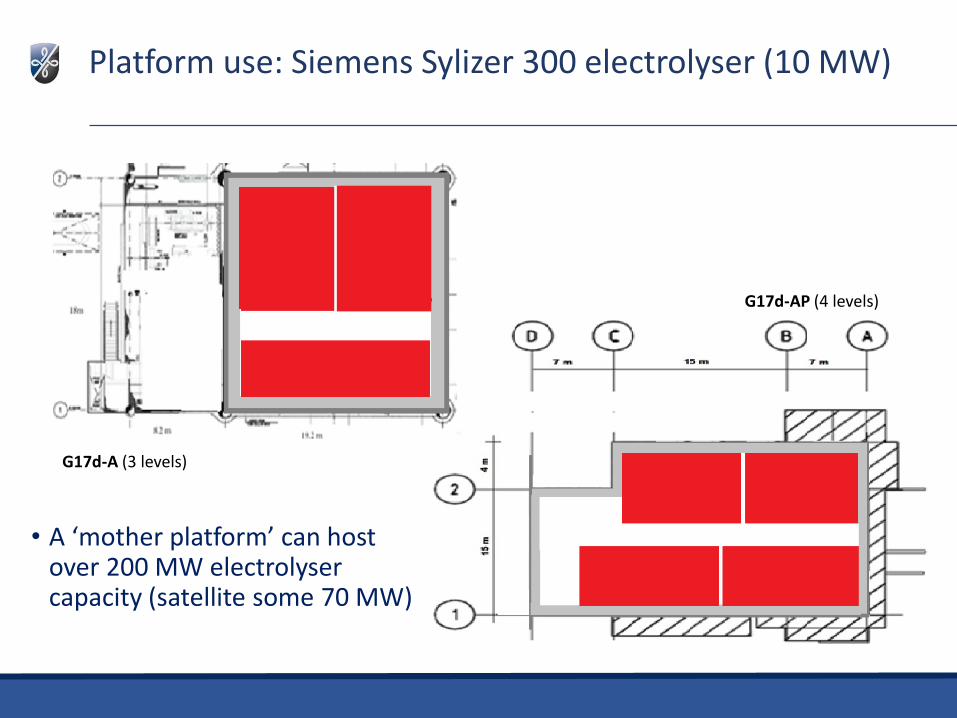
Platform use: Siemens Sylizer 300 electrolyser (10 MW)
G17d-AP (4 levels)
G17d-A (3 levels)
• A ‘mother platform’ can host over 200 MW electrolyser capacity (satellite some 70 MW)

Power-to-gas: current cost price data (NSE1 study)
• Cost price of ‘grey’ hydrogen: some €1 – 1.50/kg (but some 13 kg CO2footprint)
• Cost price of ‘blue’ hydrogen: ca €2.50/kg (informal information fromNorwegian project)
• Cost price of ‘green’ hydrogen: • Onshore electrolysis: ca €3 – 4/kg
• (by 2025 possibly €2 – 3/kg)
• Offshore electrolysis (including savings on e-grid): €2 – 3/kg • (by 2025 possibly €1.50 – 2/kg)
• Note that an EU ETS allowance price increase by €1, implies anincrease in the price of a kg of ‘grey’ hydrogen of about €0.01 only.
• So, a more effective allowance price development is probably notsufficient to in itself cover the price gap between ‘grey’ and‘blue’/’green’ hydrogen; additional PAMs may be needed to speed up
6

Power-to-gas: a case study
• Caveats:• Beginning learning curve
• Externalities difficult to quantify
• Rules, regulations and public acceptance issues unclear
• Positive aspects:• Potential game-changer / enabler
• Various output options
• Technologies well-known
• Demand for ‘green gas’ growing
7
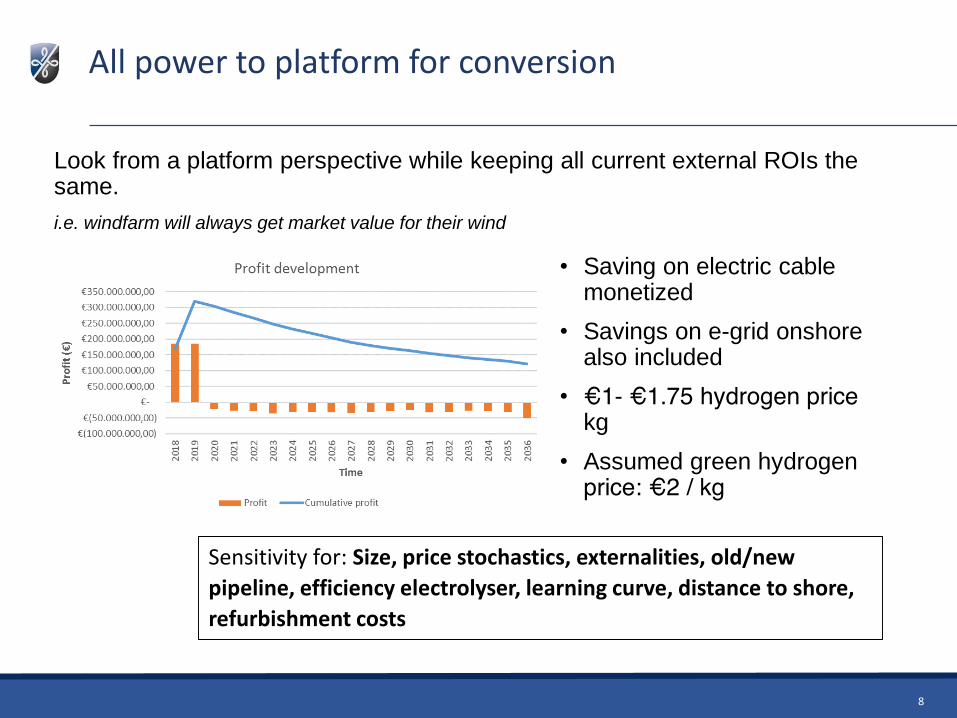
All power to platform for conversion
8
Look from a platform perspective while keeping all current external ROIs the same.
i.e. windfarm will always get market value for their wind
• Saving on electric cable monetized
• Savings on e-grid onshore also included
• €1- €1.75 hydrogen price kg
• Assumed green hydrogen price: €2 / kg
Sensitivity for: Size, price stochastics, externalities, old/new
pipeline, efficiency electrolyser, learning curve, distance to shore,
refurbishment costs

Steam Methane Reforming & CCS
9
• Location comparison of CCS + SMR:
1. SMR + CC onshore CS offshore
2. SMR + CCS offshore sell H2 onshore
• Pre-combustion capture of CO2
• Focus on CO2-value chain excl. H2

North Sea located well for CCS
10
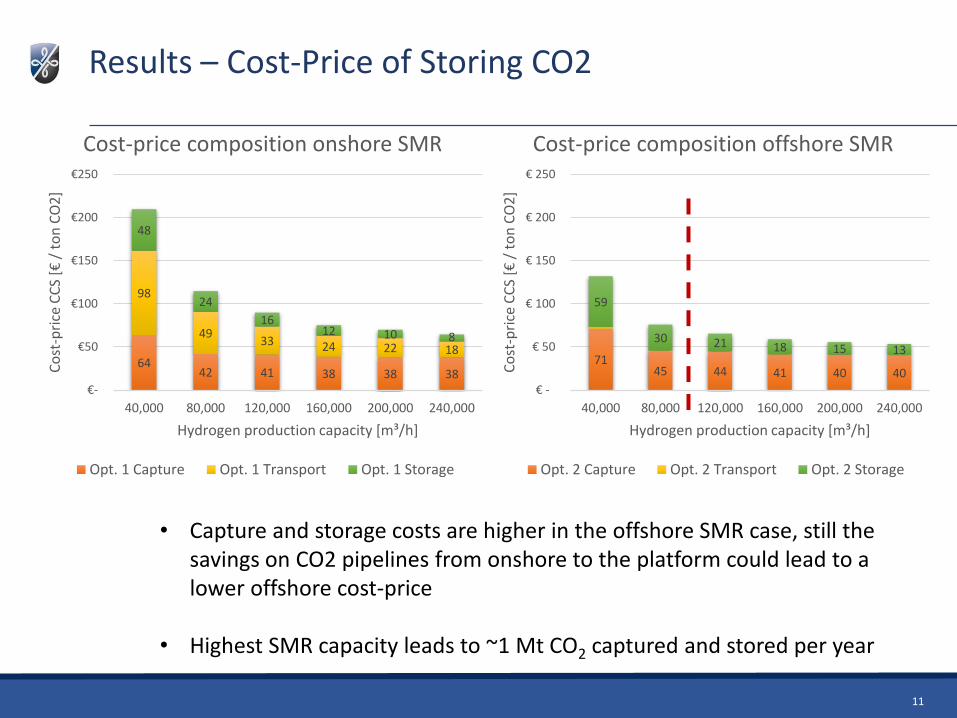
Results – Cost-Price of Storing CO2
11
6442 41 38 38 38
98
4933 24 22 18
48
24
1612 10 8
€-
€50
€100
€150
€200
€250
40,000 80,000 120,000 160,000 200,000 240,000
Co
st-p
rice
CC
S [€
/ t
on
CO
2]
Hydrogen production capacity [m³/h]
Cost-price composition onshore SMR
Opt. 1 Capture Opt. 1 Transport Opt. 1 Storage
7145 44 41 40 40
59
30 21 18 15 13
€ -
€ 50
€ 100
€ 150
€ 200
€ 250
40,000 80,000 120,000 160,000 200,000 240,000
Co
st-p
rice
CC
S [€
/ t
on
CO
2]
Hydrogen production capacity [m³/h]
Cost-price composition offshore SMR
Opt. 2 Capture Opt. 2 Transport Opt. 2 Storage
• Capture and storage costs are higher in the offshore SMR case, still the savings on CO2 pipelines from onshore to the platform could lead to a lower offshore cost-price
• Highest SMR capacity leads to ~1 Mt CO2 captured and stored per year
Thank you for your attention
Catrinus J. Jepma
University of Groningen / Energy Delta Institute
www.storeandgo.info
Jepma & Van Schot (2017): On the economics of offshore energy conversion: smart combinations (www.gasmeetswind.eu/wp-content/uploads/2017/05/EDI-North-Sea-smart-combinations-final-report-2017.pdf)
Jepma, et al. (2018): Towards sustainable energy production on the North Sea – Green hydrogen production and CO2 storage: onshore or offshore? (available on request)
12

Key assumptions
Assumptions regarding financing• inflation rate: 0% • tax rate: 20%• minimum required return on equity: 10% • interest long-term private depth: 4.0% • debt/equity ratio: 60/40 • opportunity cost of capital: 7,6% (WACC) • year of starting investments: 2025• year of starting operation: 2026 • operating period 10 years • oxygen is not valued
Assumptions regarding energy transport
• CAPEX E-grid 320 MW shore - wind farm (near G17): €147 million
• CAPEX E-grid 77 MW shore - wind farm (near D18): €38.5 million
• Capex new compressor: €2.802/kWh
• Annual maintenance fee compressor: 3% CAPEX
• CAPEX PSA extraction station: €1,000 per 1 Nm³/h
• OPEX PSA extraction station: 5% CAPEX
• CAPEX dedicated hydrogen pipeline: €450,000-625,000/km, depending on diameter
• OPEX dedicated hydrogen pipeline: 2% CAPEX• Transport costs hydrogen in existing network: €16.50/1000m³
Assumptions regarding prices• the average production costs of offshore wind energy:
€100/MWh• SDE+ subsidy: €70/MWh (only for non-curtailed wind-power• average APX price: € 30/MWh • effective power price: €34,60/MWh• green hydrogen price (chemical industry): €1.56/kg or
€25.20/MWh• green hydrogen price (mobility): €4.67/kg or €75.55/MWh • Current ETS-allowance price impact: €6cts/kg

Assumptions regarding G17 & D18• CAPEX platform preplacement: €10/kg • CAPEX new deck for the electrolyser: €40/kg • weight of gas-specific installations: 25% of total
Assumptions regarding platform G17• OPEX of manned platform G17: €8,800,000/y • weight G17: 3200 ton • max. electrolysis capacity: 250 MW• CAPEX rebuilding decks G17: €176,000,000 • decommissioning costs G17: €20,000,000
Assumptions regarding platform D18• OPEX of satellite platform D18: €4,000,000/y • weight D18: 1000 ton• max. electrolysis capacity: 60MW • CAPEX rebuilding decks D18: € 40,000,000 • decommissioning costs D18: €7,000,000
Assumptions related to CAPEX and OPEX
investments • CAPEX Sylizer 300 (projection): €600/kWh• CAPEX desalination unit: €61.200 for a 2000L/h
capacity unit • OPEX Sylizer 300 and desalination unit: 2,5% CAPEX• energy efficiency: 75%• depreciation period electrolyser: 10 years• residual value: €0