
Civic Participation & Geographic Affluence As Indicators of Quality Municipal Parks and Recreation...
33
Civic Participation & Geographic Affluence As Indicators of Quality Municipal Parks and Recreation Programs: An Analysis of San Gabriel Valley Cities
-
date post
20-Dec-2015 -
Category
Documents
-
view
216 -
download
0
Transcript of Civic Participation & Geographic Affluence As Indicators of Quality Municipal Parks and Recreation...

Civic Participation & Geographic AffluenceAs Indicators of Quality
Municipal Parks and Recreation Programs:An Analysis of San Gabriel Valley Cities

Aim of Study
Is there a parks and recreation dichotomy between rich and poor communities?
Are access and equity to municipal parks and recreation programs influenced
by civic participation?
Are race, educational attainment, home ownership other factors that influence
quality municipal parks and recreation programs?

Literature Review
Impact of Proposition 13-Chernick & Reschovsky-Sexton, Sheffrin and O’Sullivan-Chapman-Peter, May and Meltsner
Accessibility & Equity of Services-Smoyer-Tomic, Hewko and Hodgson-Koehler & Wrightson
Civic Participation-Putnam-Kwak, Shah and Holbert-Rice-Fukuyama

Cities Examined
AlhambraArcadiaAzusaBaldwin parkClaremontCovinaDiamond BarDuarte
San DimasSan GabrielSan MarinoSierra MadreSouth El MonteSouth PasadenaTemple CityWalnutWest Covina
El MonteGlendoraIrwindaleMonroviaMonterey ParkPasadenaPomonaRosemead

Measurement of Civic Participation
Source: http://www.lavote.net/GENERAL/Statement_Votes_Cast.cfm

Measurement of Geographic Affluence
Percent of Households With Public Assistance
Per Capita Income (1999)
Median Family Income (1999)
Census 2000 Data

Measurement of Other Demographic Variables
Percent of Homeowners
Racial Mix
Educational Attainment
Census 2000 Data

Measurement of Quality Municipal Parks and Recreation Programs
Park Acreage
Score
Methods of AccessIndex
Park MaintenanceEvaluation
Scores
Recreation Services
Score

Determination of Park Acreage Score
Population Per One Thousand
Obtained Using:Census 2000 Data
Self-Reported Park Acreage
Obtained Using:•City Websites/Fax/Phone/Email
Park Acres Per Thousand
5 Park Acres Per Thousand
(NRPA Standard)
Park Acreage
Score

Methods of Access Index
Methods of Access
Index
RegistrationBy
Phone
RegistrationByFax
Online Recreation Brochure
OnlineClass
Registration
RegistrationBy Walk-In
RegistrationBy

Park Maintenance Evaluation Score
RandomSample of Parks
in San Gabriel Valley1 – 30 acres in size
City & County ofSan Francisco
Park Maintenance Standard
All ParkEvaluationsConducted
on Weekends

Park EvaluationLandscape & Hardscape Areas
Pass = 1 Fail = 0

Park EvaluationLandscape & Hardscape Areas
Pass = 1 Fail = 0

Park EvaluationRecreation Areas
Pass = 1 Fail = 0

Park EvaluationRecreation Areas
Pass = 1 Fail = 0

Structures and AmenitiesEvaluation Criteria
Pass = 1 Fail = 0

Recap of Variables
Dependent Variable =Recreation Services Score
Independent Variables =Civic ParticipationIncome Per Capita
Median Family IncomeHome Ownership
Racial Mix
Educational Attainment

Percent of Vote Cast Election of
11.7.06
Percent of Vote Cast Election
of 11.2.04
Mean Pct Vote Cast for both
Elections
Recreation Services Score
Pearson Correlation
.302 .275 .304
Sig. (2-tailed)
.126 .165 .123
N
27 27 27
Correlation: Recreation Services Score & Civic Participation

Correlation: Recreation Services Score & Per Capita Income
Recreation Services
Score
Total population: Per capita income in
1999
Recreation Services Score
Pearson Correlation 1
.395(*)
Sig. (2-tailed)
.042
N
27 27

Recreation Services Score & Per Capita Income (1999)
Linear Regression
10000.00 20000.00 30000.00 40000.00 50000.00 60000.00
Total population: Per capita income in 1999
1.50
2.00
2.50
Rec
reat
ion
Ser
vice
s S
core
Alhambra ArcadiaAzusa
Baldwin Park
Claremont
Covina
Diamond Bar
Duarte
El Monte
Glendora
Irwindale
La Puente
La VerneMonrovia
Monterey Park PasadenaPomona
Rosemead
San Dimas
San GabrielSan Marino
Sierra Madre
South El Monte
South Pasadena
Temple City
Walnut
West Covina
Recreation Services Score = 1.60 + 0.00 * Percapitaincomein1999R-Square = 0.16

Correlation: Recreation Services Score & Percent of Households
with Public Assistance
Recreation Services
Score
Percent of Households with Public Assistance
Income
Recreation Services Score
Pearson Correlation 1 -.533
Sig. (2-tailed)
.004
N
27 27

Recreation Services Score & Households w/Public Assistance
Linear Regression
2.50 5.00 7.50 10.00 12.50
Percent of Households with Public Assistance Income
1.50
2.00
2.50
Rec
reat
ion
Ser
vice
s S
core
AlhambraArcadia
Azusa
Baldwin Park
Claremont
Covina
Diamond Bar
Duarte
El Monte
Glendora
Irwindale
La Puente
La VerneMonrovia
Monterey ParkPasadenaPomona
Rosemead
San Dimas
San GabrielSan Marino
Sierra Madre
South El Monte
South Pasadena
Temple City
Walnut
West Covina
Recreation Services Score = 2.21 + -0.06 * PctHouseholdswithPublicAssistanceIncomeR-Square = 0.28
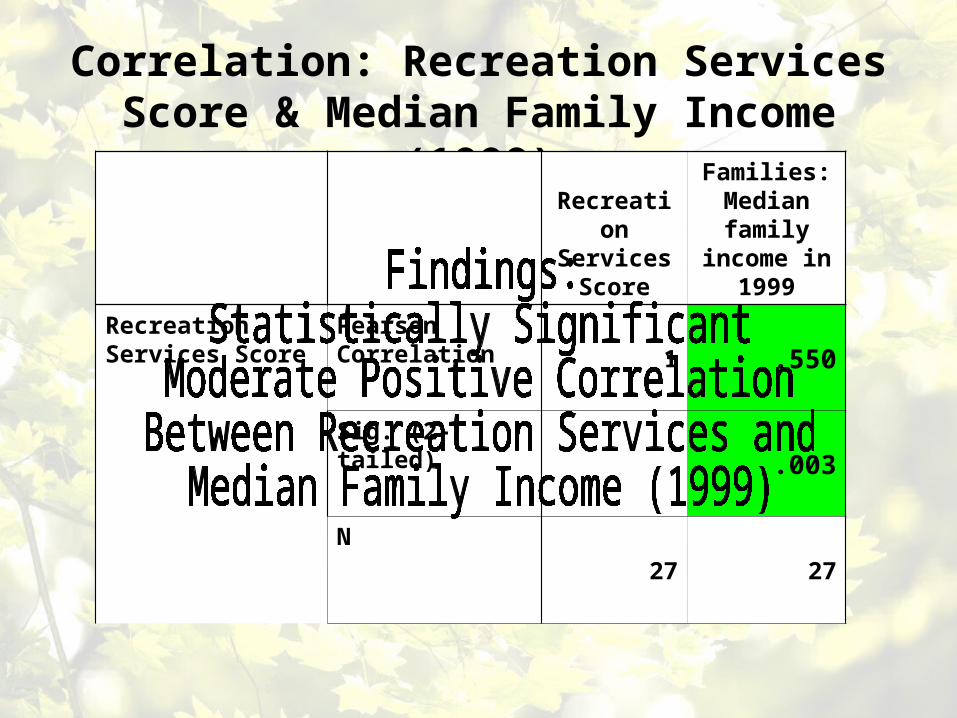
Correlation: Recreation Services Score & Median Family Income
(1999)
Recreation Services
Score
Families: Median family
income in 1999
Recreation Services Score
Pearson Correlation 1 .550
Sig. (2-tailed)
.003
N
27 27

Recreation Services Score & Median Family Income (1999)
Linear Regression
40000.00 60000.00 80000.00 100000.00 120000.00
Families: Median family income in 1999
1.50
2.00
2.50
Rec
reat
ion
Ser
vice
s S
core
AlhambraArcadia
Azusa
Baldwin Park
Claremont
Covina
Diamond Bar
Duarte
El Monte
Glendora
Irwindale
La Puente
La VerneMonrovia
Monterey ParkPasadena
Pomona
Rosemead
San Dimas
San Gabriel San Marino
Sierra Madre
South El Monte
South Pasadena
Temple City
Walnut
West Covina
Recreation Services Score = 1.32 + 0.00 * Medianfamilyincomein1999R-Square = 0.30

Correlation: Recreation Services Score & Owner Occupied Housing
Recreation Services
Score
Percent of Occupied Housing Units: Owner
Occupied
Recreation Services Score
Pearson Correlation
1 .608
Sig. (2-tailed) .001
N
27 27

Recreation Services Score & Percent of Owner Occupied
Housing
Linear Regression
40.00 50.00 60.00 70.00 80.00 90.00
Percent of Occupied Housing Units: Owner Occupied
1.50
2.00
2.50
Rec
reat
ion
Ser
vice
s S
core
Alhambra Arcadia
Azusa
Baldwin Park
Claremont
Covina
Diamond Bar
Duarte
El Monte
Glendora
Irwindale
La Puente
La VerneMonrovia
Monterey ParkPasadena
Pomona
Rosemead
San Dimas
San GabrielSan Marino
Sierra Madre
South El Monte
South Pasadena
Temple City
Walnut
West Covina
Recreation Services Score = 0.93 + 0.02 * PctofOccupiedHousingUnitsOwnerOccupiedR-Square = 0.37

Correlation: Recreation Services Score & Racial Mix
White alone
Black or
African Americ
an alone
American
Indian and
Alaska Native alone
Asian alone
Native Hawaiian and Other
Pacific Islander alone
Some other race alone
Two or more races
Recreation Services Score
Pearson Correlation
.364 .146 -.526(**) .026 -.175 -.473(*)-.099
Sig. (2-tailed) .062 .468 .005 .898 .384 .013
.622
N 27 27 27 27 27 27 27

Correlation: Recreation Services Score & Pct with Some College or Higher
Education
Percent of Population
25 years and over:
Some College or
Higher
Recreation Services Score
Pearson Correlation .575
Sig. (2-tailed).002
N 27

Recreation Services Score & Pct with Some College or Higher
Education
Linear Regression
20.00 40.00 60.00 80.00
Percent of Population 25 years and over: Some College or Higher
1.50
2.00
2.50
Rec
reat
ion
Ser
vice
s S
core
Alhambra ArcadiaAzusa
Baldwin Park
Claremont
Covina
Diamond Bar
Duarte
El Monte
Glendora
Irwindale
La Puente
La VerneMonrovia
Monterey ParkPasadena
Pomona
Rosemead
San Dimas
San Gabriel San Marino
Sierra Madre
South El Monte
South PasadenaTemple City
Walnut
West Covina
Recreation Services Score = 1.31 + 0.01 * Pct25yearsandoverSomeCollegeorHigherR-Square = 0.33

Multiple Regression
Model R R SquareAdjusted R
SquareStd. Error of the Estimate
1.586(a) .343 .258 .31801
Predictors:Percent of Households with Public Assistance Income,
Families: Median family income in 1999, Percent of Population 25 years and over: Some College or Higher

Findings:
There is a parks and recreation dichotomy between rich and poor communities.
Civic participation is not a factor of quality municipal parks and recreation programs.
Educational attainment strongest predictor of quality municipal parks and recreation programs

Conclusions:
Promote Civic Participation
Re-examine Distribution of State Funds
Bridge the Parks and Recreation Dichotomy
Re-visit Proposition 13
Promote Educational Attainment