Civic Federation Debt and Infrastructure Committee October 24, 2012 State of Illinois 0.
28
Civic Federation Debt and Infrastructure Committee October 24, 2012 State of Illinois 1
-
Upload
brittney-towner -
Category
Documents
-
view
215 -
download
0
Transcript of Civic Federation Debt and Infrastructure Committee October 24, 2012 State of Illinois 0.
Civic Federation Debt and Infrastructure CommitteeOctober 24, 2012
State of Illinois
1
2
Disclaimer
This Presentation does not constitute a recommendation or an offer or solicitation for the purchase or sale of any security or other financial instrument, including Bonds, or to adopt any investment strategy. Any offer or solicitation with respect to such Bonds will be made solely by means of a Final Official Statement, which describes the actual terms of any such Bonds. You should consult with your own advisors as to such matters and the consequences of the purchase and ownership of such Bonds. No assurance can be given that any transaction mentioned herein could in fact be executed. Past performance is not indicative of future returns, which will vary. Transactions involving such Bonds may not be suitable for all investors. You should consult with your own advisors as to the suitability of the Bonds for your particular circumstances. This Presentation contains forecasts, projections, and estimates that are based on current expectations but are not intended as representations of fact or guarantees of results. If and when included in this Investor Presentation, the words “expects,” “forecasts,” “projects,” “intends,” “anticipates,” “estimates,” and analogous expressions are intended to identify forward looking statements as defined in the Securities Act of 1933, as amended, and any such statements inherently are subject to a variety of risks and uncertainties, which could cause actual results to differ materially from those contemplated in such forward looking statements. These forward looking statements speak only as of the date of this Investor Presentation. The State disclaims any obligation or undertaking to release publicly any updates or revisions to any forward looking statement contained herein to reflect any change in the State’s expectations with regard thereto or any change in events, conditions, or circumstances on which any such statement is based.
3
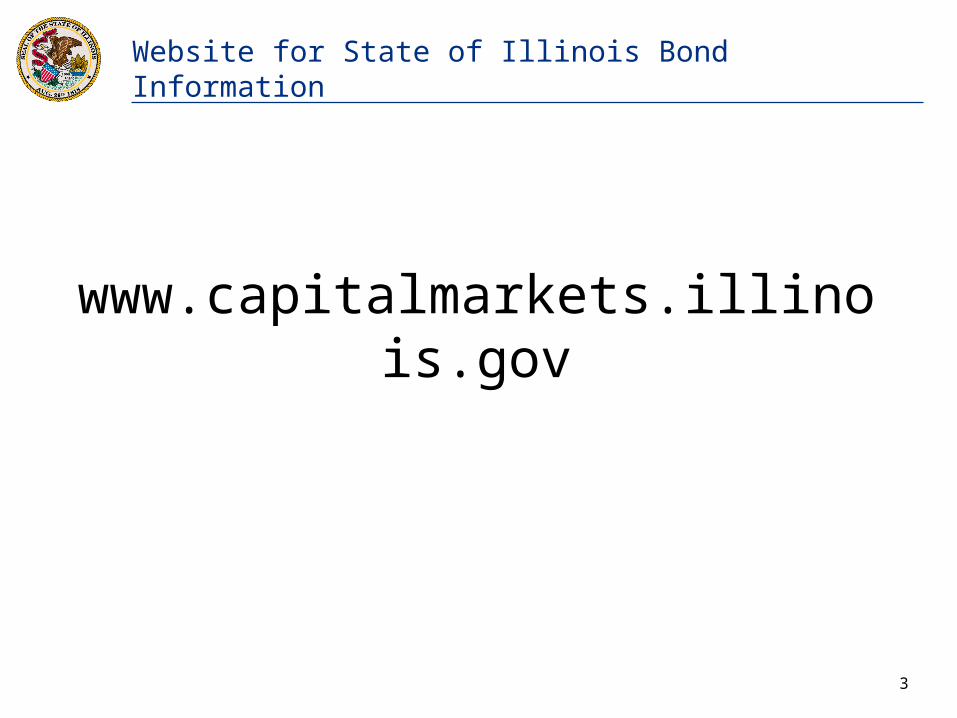
Website for State of Illinois Bond Information
www.capitalmarkets.illinois.gov

4
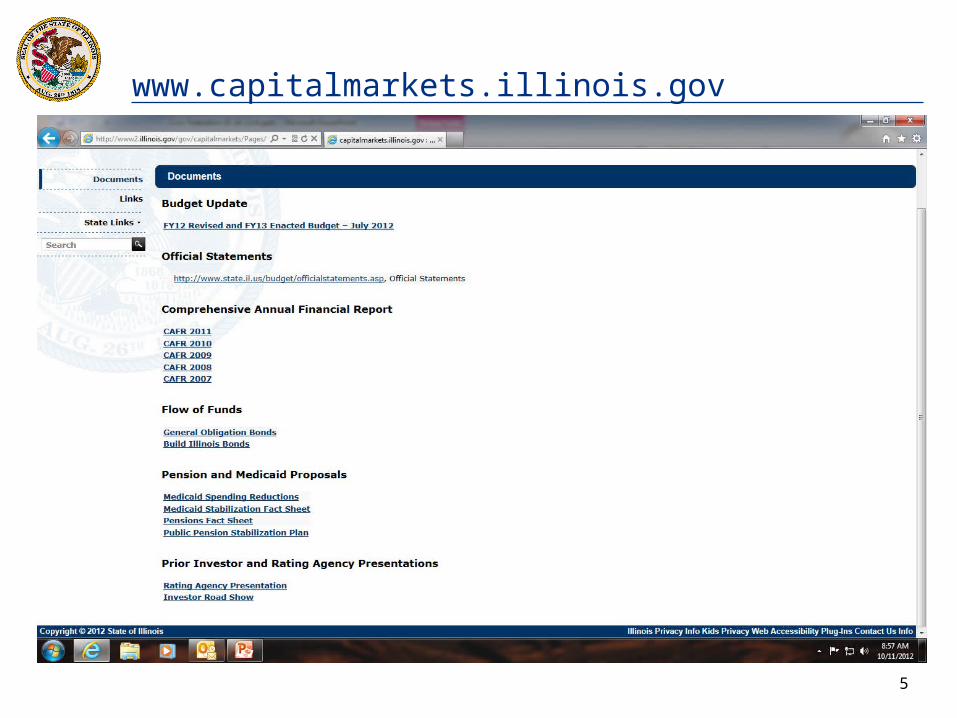
www.capitalmarkets.illinois.gov
5
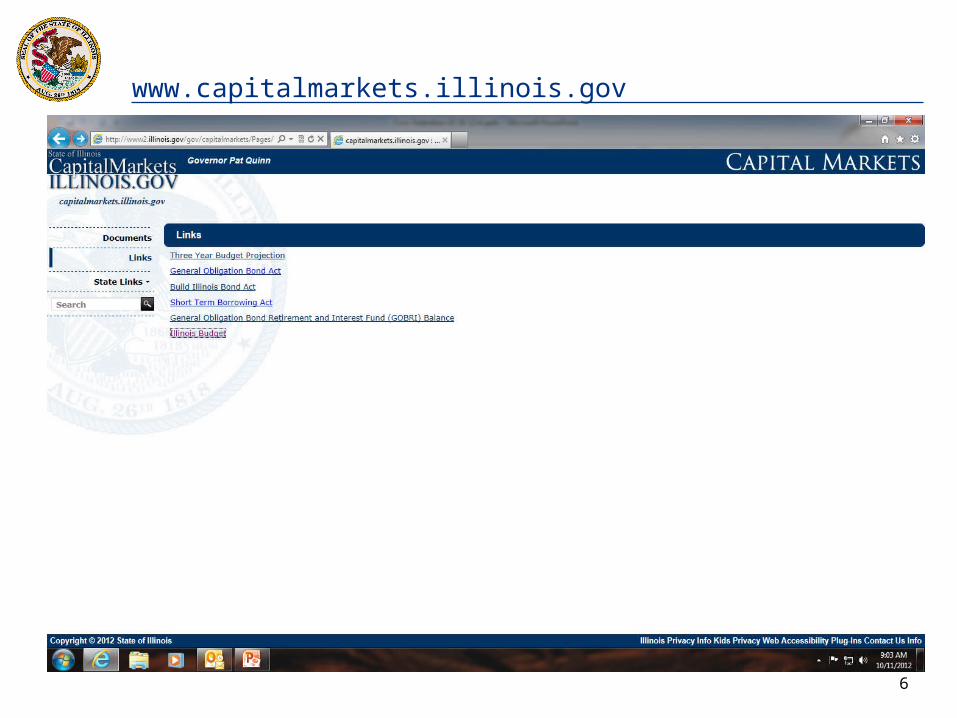
www.capitalmarkets.illinois.gov
6
www.capitalmarkets.illinois.gov

State of Illinois: Economic Overview
7
8
CA TX NY FL IL PA NJ OH
$1,958.9
$1,308.1 $1,158.0
$754.3 $670.7
$578.8 $487.0 $484.0
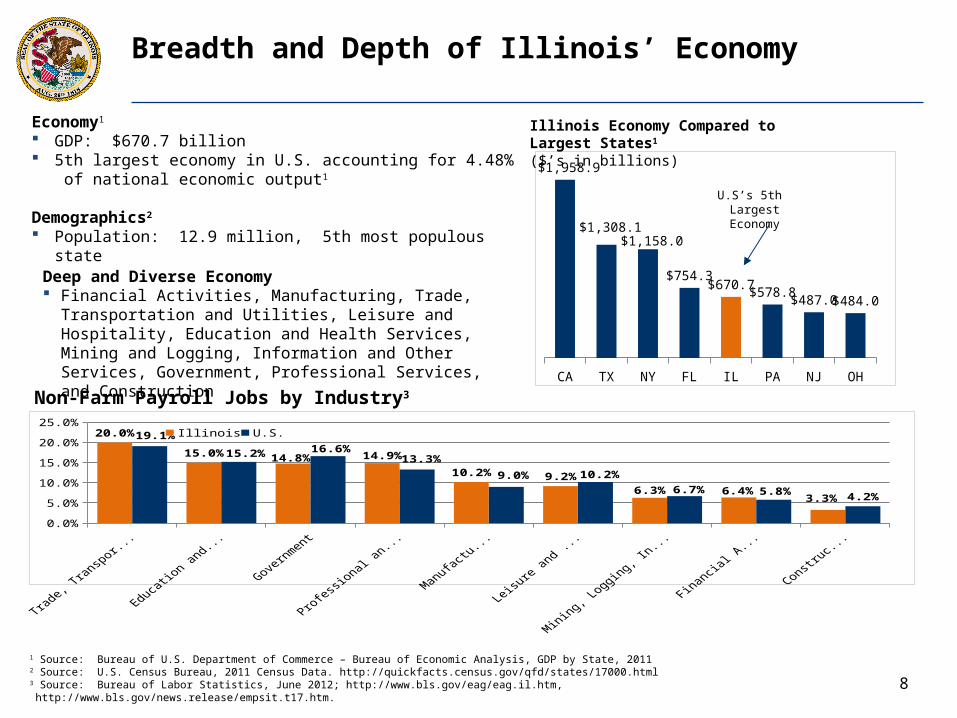
Breadth and Depth of Illinois’ Economy
Economy1
GDP: $670.7 billion 5th largest economy in U.S. accounting for 4.48% of national economic
output1
Demographics2
Population: 12.9 million, 5th most populous state
1 Source: Bureau of U.S. Department of Commerce – Bureau of Economic Analysis, GDP by State, 2011 2 Source: U.S. Census Bureau, 2011 Census Data. http://quickfacts.census.gov/qfd/states/17000.html3 Source: Bureau of Labor Statistics, June 2012; http://www.bls.gov/eag/eag.il.htm, http://www.bls.gov/news.release/empsit.t17.htm.
Illinois Economy Compared to Largest States1
($’s in billions)
U.S’s 5th Largest Economy
Deep and Diverse Economy Financial Activities, Manufacturing, Trade, Transportation and Utilities,
Leisure and Hospitality, Education and Health Services, Mining and Logging, Information and Other Services, Government, Professional Services, and Construction
Non-Farm Payroll Jobs by Industry3
0.0%
5.0%
10.0%
15.0%
20.0%
25.0%20.0%
15.0% 14.8% 14.9%
10.2% 9.2%6.3% 6.4%
3.3%
19.1%
15.2% 16.6%13.3%
9.0% 10.2%
6.7% 5.8% 4.2%
Illinois U.S.

9
National and International Economic Hub
1 Source: Illinois Department of Commerce and Economic Opportunity. http://www.ildceo.net/NR/rdonlyres/80F50180-8E4F-473B-9BB9-D122F7D6A749/0/Fortune500_2011.pdf ;2 Source: WISERTrade at HCC: State Exports by NAICS Database, 2011; https://www.wisertrade.org/naics/ftbegin.
9
City of Chicago is Economic Hub of the Midwest
Financial Center: Chicago Board of Trade, Chicago Board Options Exchange, Chicago Stock Exchange, Chicago Mercantile Exchange
Major transportation Hub: Only U.S. city where all 6 major U.S. and Canadian Class I railroads converge to interchange freight, home of two major airports including, O’Hare International Airport, 4th busiest airport in the world
Corporate headquarters to 31 Fortune 500 companies1
Access to International Markets
1,584 foreign firms with 5,729 locations in the State
International employers provide approximately 287,039 jobs
Direct exports account for 7.7% of State GDP in 2010
Center for global distribution, with the 3rd largest intermodal port in the world
Diverse exports include: Agricultural Products, Oil And Gas, Minerals And Ores, Forestry Products, Livestock And Livestock Products, Prepackaged Software, and Fish Products, among numerous other manufactured goods.
Annual Exports by Top Ranked U.S. States2
TX CA NY FL WA IL0
50
100
150
200
250
300
0%
10%
20%
30%
40%
50%
60%
70%
80%
90%
100%92.46%
86.43%
80.91%
82.97%
76.02%
92.15%
2011 Exports% Manufacturing
$’s
in B
illi
ons
Illinois home of many fortune 500 companies’ HQ

State of Illinois: Debt Profile and Bondholder Security
10
11
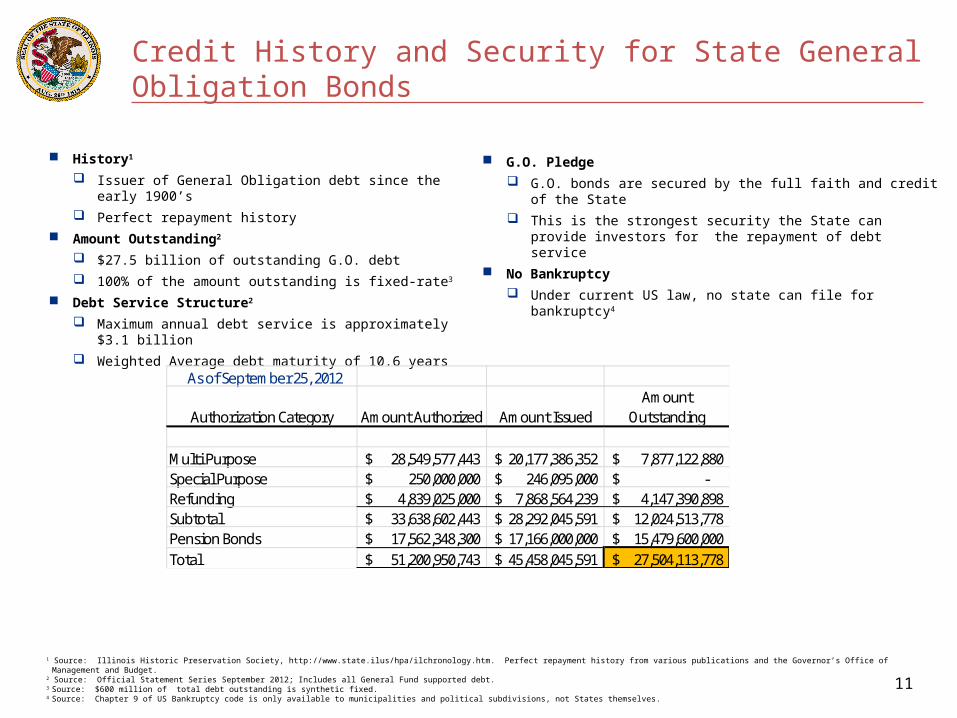
Credit History and Security for State General Obligation Bonds
1 Source: Illinois Historic Preservation Society, http://www.state.ilus/hpa/ilchronology.htm. Perfect repayment history from various publications and the Governor’s Office of Management and Budget.2 Source: Official Statement Series September 2012; Includes all General Fund supported debt.3 Source: $600 million of total debt outstanding is synthetic fixed.4 Source: Chapter 9 of US Bankruptcy code is only available to municipalities and political subdivisions, not States themselves.
History1
Issuer of General Obligation debt since the early 1900’s
Perfect repayment history
Amount Outstanding2
$27.5 billion of outstanding G.O. debt
100% of the amount outstanding is fixed-rate3
Debt Service Structure2
Maximum annual debt service is approximately $3.1 billion
Weighted Average debt maturity of 10.6 years
G.O. Pledge
G.O. bonds are secured by the full faith and credit of the State
This is the strongest security the State can provide investors for the repayment of debt service
No Bankruptcy
Under current US law, no state can file for bankruptcy4
Mt. Vernon
Quincy Springfield
Orland Park
As of September 25, 2012
Authorization Category Amount Authorized Amount IssuedAmount
Outstanding
Multi Purpose 28,549,577,443$ 20,177,386,352$ 7,877,122,880$ Special Purpose 250,000,000$ 246,095,000$ -$ Refunding 4,839,025,000$ 7,868,564,239$ 4,147,390,898$ Subtotal 33,638,602,443$ 28,292,045,591$ 12,024,513,778$ Pension Bonds 17,562,348,300$ 17,166,000,000$ 15,479,600,000$ Total 51,200,950,743$ 45,458,045,591$ 27,504,113,778$

12
General Obligation Bond Act
1 Source: State of Illinois Governor’s Office of Management and Budget.2 Source: State of Illinois Constitution.
Fiscal Year End Cash Balances1
($ in millions)
Advance set-aside of debt service funds
Dedicated account maintains significant balances in General Obligation Bond Retirement and Interest (GOBRI) Fund.
Debt service requirements are deposited on a monthly basis into GOBRI.
The obligation to pay is not limited to any particular source of funds and the State has unlimited taxing powers. The State can draw from all State funds in the State treasury if
needed to pay debt service on GO bonds. GOBRI Mechanics
Set aside includes 1/12th of the next 12 months of principal amortization and 1/6th of the next 6 months of interest.
Reserved over the course of the month and transferred on the last day of the month.
Protection under Illinois Constitution and State laws
State law explicitly provides bondholders the remedy to sue the State to compel payment and to satisfy the State’s bond obligations.
The Illinois Constitution contains a “non-impairment” clause that prohibits action by the General Assembly that would, under contract law, impair the obligations of a contract between the State and its bondholders.
Illinois' issuance of debt requires a supermajority vote (60%) of both houses of the legislature, except for constitutionally permitted short-term borrowings, refunding issues and revenue bonds.2
The General Obligation Bond Act provides an irrevocable and continuing appropriation to pay debt
service and an irrevocable and continuing authority for and direction to the Treasurer and Comptroller, as
directed by the Governor, to make the necessary pre-funding transfers into GOBRI from any revenue or fund
of the State.
2007 2008 2009 2010 2011 2012$0
$1,000
$2,000
$3,000
$4,000
$5,000
$6,000
$7,000
$8,000
$9,000
$10,000

13
No ability to do “scoop and toss”* financing
Article IX, Section 9, clause (e) of the Illinois Constitution:—“State debt may be incurred by law to refund outstanding State
debt if the refunding debt matures within the term of the outstanding State debt.”
Similar restrictions are contained in the General Obligation Bond Act (30-ILCS-330) which governs the issuance of general obligation debt by the State.
“Economic refundings” are allowed but “scoop and toss” refundings are prohibited.—Protects bondholders against the creation of refinancing risk in
outlying years.
*”Scoop and Toss” financing is the technique of repaying current maturities of debt throughthe issuance of new longer maturity bonds.

Budget and Budgetary/Accounting Process
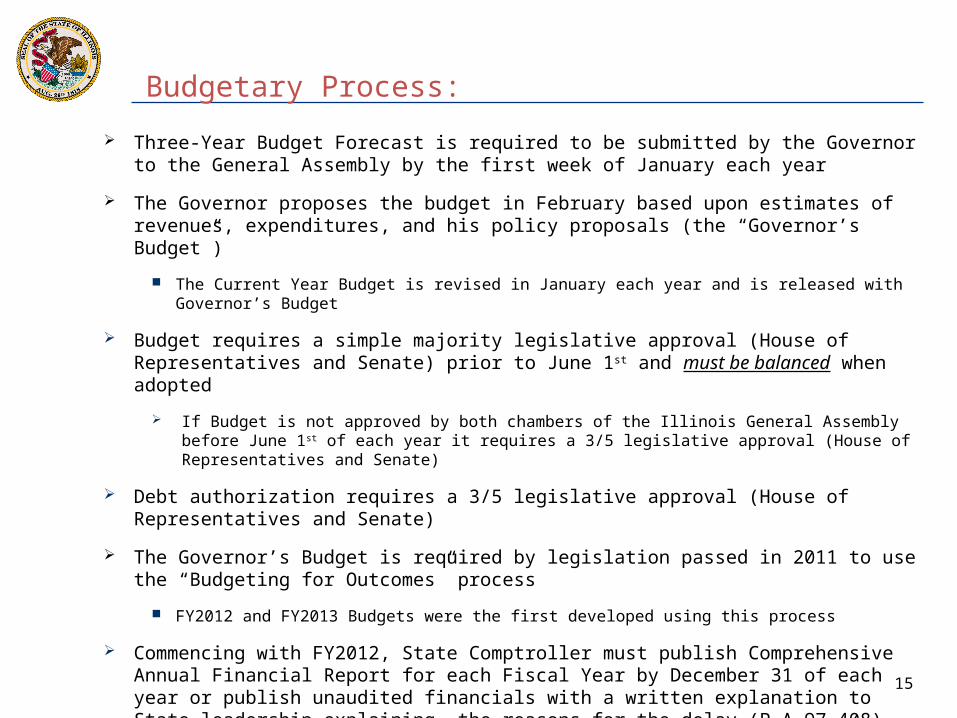
15
Three-Year Budget Forecast is required to be submitted by the Governor to the General Assembly by the first week of January each year
The Governor proposes the budget in February based upon estimates of revenues, expenditures, and his policy proposals (the “Governor’s Budget”)
The Current Year Budget is revised in January each year and is released with Governor’s Budget
Budget requires a simple majority legislative approval (House of Representatives and Senate) prior to June 1st and must be balanced when adopted
If Budget is not approved by both chambers of the Illinois General Assembly before June 1 st of each year it requires a 3/5 legislative approval (House of Representatives and Senate)
Debt authorization requires a 3/5 legislative approval (House of Representatives and Senate)
The Governor’s Budget is required by legislation passed in 2011 to use the “Budgeting for Outcomes” process
FY2012 and FY2013 Budgets were the first developed using this process
Commencing with FY2012, State Comptroller must publish Comprehensive Annual Financial Report for each Fiscal Year by December 31 of each year or publish unaudited financials with a written explanation to State leadership explaining the reasons for the delay (P.A.97-408)
Budgetary Process:

16
For the first time in its history of the State of Illinois, money will be budgeted based on how effectively programs provide results that citizens value, rather than being based on the money allocated in the previous fiscal year.
Budgeting for Outcomes:
Budgeting for Outcomes is a four-step process:
Establish goals Allocate resources Monitor performance
Evaluate outcomes
• Development of statewide prioritized goals for the fiscal year. • Implementation of online surveys to gather citizen input about the budget, the requirement for three-year fiscal
projections and the requirement to compare actual accomplishments with department objectives. • Establishing more effective control of government grants, contracts and leasing. • Development of the robust performance monitoring and performance evaluation capability.
17
FY2013-FY2015 Three Year Projections
Notes:
—Mandated by Statute—Released by first week of January each year—First glance at the budget “thoughts” for the upcoming
budget—Not updated after release
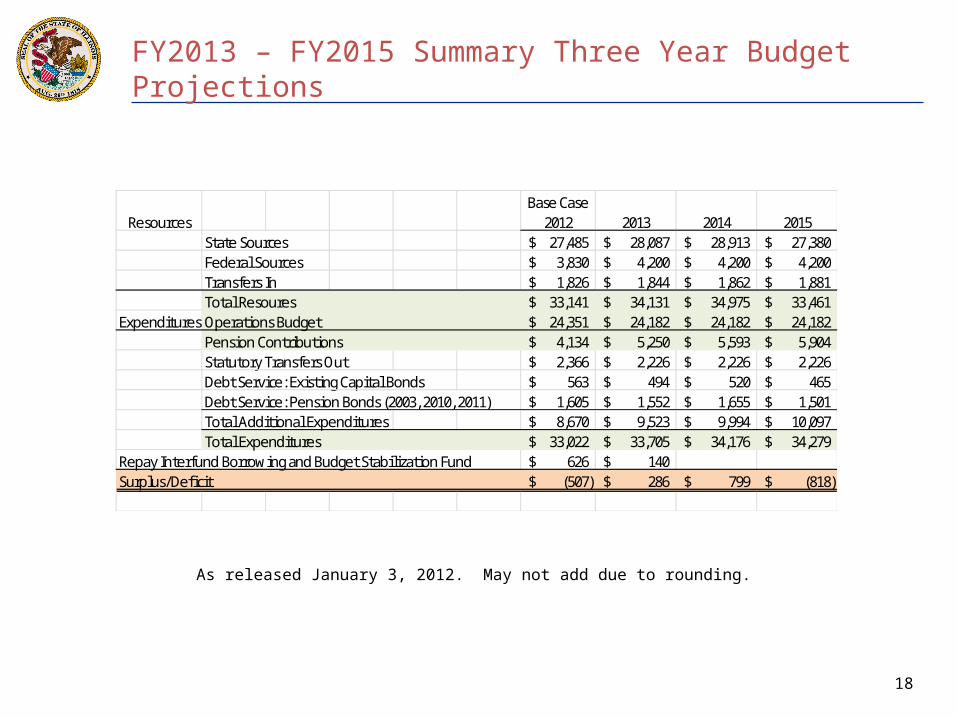
18
FY2013 – FY2015 Summary Three Year Budget Projections
ResourcesBase Case
2012 2013 2014 2015State Sources 27,485$ 28,087$ 28,913$ 27,380$ Federal Sources 3,830$ 4,200$ 4,200$ 4,200$ Transfers In 1,826$ 1,844$ 1,862$ 1,881$ Total Resoures 33,141$ 34,131$ 34,975$ 33,461$
Expenditures Operations Budget 24,351$ 24,182$ 24,182$ 24,182$ Pension Contributions 4,134$ 5,250$ 5,593$ 5,904$ Statutory Transfers Out 2,366$ 2,226$ 2,226$ 2,226$ Debt Service: Existing Capital Bonds 563$ 494$ 520$ 465$ Debt Service: Pension Bonds (2003, 2010, 2011) 1,605$ 1,552$ 1,655$ 1,501$ Total Additional Expenditures 8,670$ 9,523$ 9,994$ 10,097$ Total Expenditures 33,022$ 33,705$ 34,176$ 34,279$
Repay Interfund Borrowing and Budget Stabilization Fund 626$ 140$ Surplus/Deficit (507)$ 286$ 799$ (818)$
As released January 3, 2012. May not add due to rounding.

19
FY2013 Budget
Notes:—The following table is for discussion purposes only.—Please refer to the Official Statement for the $50,000,000
General Obligation Bonds Series of September 2012 for a complete set of footnotes and disclosures relating to the tables that follow.
—Actions anticipated by the General Assembly during the November and December sessions are expected to reduce the net surplus shown in the following tables. Please refer to the Official Statement for the $50,000,000 General Obligation Bonds Series of September 2012 narrative pages 19-22 for additional discussion and details.
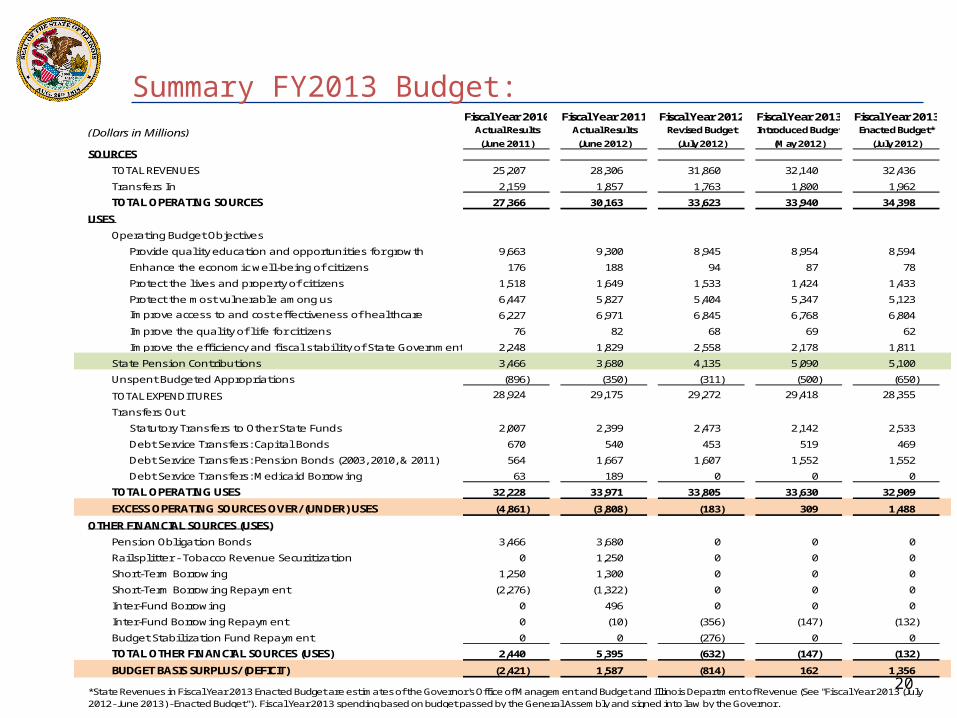
20
Summary FY2013 Budget:
TOTAL REVENUES 25,207 28,306 31,860 32,140 32,436
Transfers In 2,159 1,857 1,763 1,800 1,962
TOTAL OPERATING SOURCES 27,366 30,163 33,623 33,940 34,398
USES
Operating Budget Objectives
Provide qual i ty education and opportunities for growth 9,663 9,300 8,945 8,954 8,594
Enhance the economic wel l -being of citizens 176 188 94 87 78
Protect the l ives and property of citizens 1,518 1,649 1,533 1,424 1,433
Protect the most vulnerable among us 6,447 5,827 5,404 5,347 5,123
Improve access to and cost effectiveness of heal thcare 6,227 6,971 6,845 6,768 6,804
Improve the qual i ty of l i fe for citizens 76 82 68 69 62
Improve the effi ciency and fi sca l s tabi l i ty of State Government 2,248 1,829 2,558 2,178 1,811
State Pens ion Contributions 3,466 3,680 4,135 5,090 5,100
Unspent Budgeted Appropriations (896) (350) (311) (500) (650)
TOTAL EXPENDITURES 28,924 29,175 29,272 29,418 28,355
Transfers Out
Statutory Transfers to Other State Funds 2,007 2,399 2,473 2,142 2,533
Debt Service Transfers : Capita l Bonds 670 540 453 519 469
Debt Service Transfers : Pens ion Bonds (2003, 2010, & 2011) 564 1,667 1,607 1,552 1,552
Debt Service Transfers : Medica id Borrowing 63 189 0 0 0
TOTAL OPERATING USES 32,228 33,971 33,805 33,630 32,909
EXCESS OPERATING SOURCES OVER/(UNDER) USES (4,861) (3,808) (183) 309 1,488
OTHER FINANCIAL SOURCES (USES)
Pens ion Obl igation Bonds 3,466 3,680 0 0 0
Rai lspl itter - Tobacco Revenue Securitization 0 1,250 0 0 0
Short-Term Borrowing 1,250 1,300 0 0 0
Short-Term Borrowing Repayment (2,276) (1,322) 0 0 0
Inter-Fund Borrowing 0 496 0 0 0
Inter-Fund Borrowing Repayment 0 (10) (356) (147) (132)
Budget Stabi l i zation Fund Repayment 0 0 (276) 0 0
TOTAL OTHER FINANCIAL SOURCES (USES) 2,440 5,395 (632) (147) (132)
BUDGET BASIS SURPLUS/(DEFICIT) (2,421) 1,587 (814) 162 1,356
(July 2012)
Introduced BudgetRevised Budget
(July 2012)SOURCES
(June 2011) (June 2012) (May 2012)
*State Revenues in Fiscal Year 2013 Enacted Budget are estimates of the Governor's Office of Management and Budget and Illinois Department of Revenue (See "Fiscal Year 2013 (July 2012- June 2013) - Enacted Budget"). Fiscal Year 2013 spending based on budget passed by the General Assembly and signed into law by the Governor.
(Dollars in Millions)
Fiscal Year 2013Fiscal Year 2011Fiscal Year 2010 Fiscal Year 2013Fiscal Year 2012Enacted Budget*Actual Results Actual Results

21
Agency Expenditures vs Pension Contributions
2008 2009 2010 2011 2012 2013$0
$5
$10
$15
$20
$25
$30
$24.3
$26.2
$24.3
$24.6
$23.7$22.7
$1.7
$2.5$3.5
$3.7$4.1
$5.1
Net Agency Appropriations Pension Contributions
Note: Net Agency Expenditures does not include cost of Group Health and Transfers Out. $ in billions.
Source: State of Illinois Enacted Budget FY2013, A Review of the Operating Budget for the Current Fiscal Year, October 8, 2013, The Institute For Illinois’ Fiscal Stability at the Civic Federation
State of Illinois: The Will to Govern
22
23
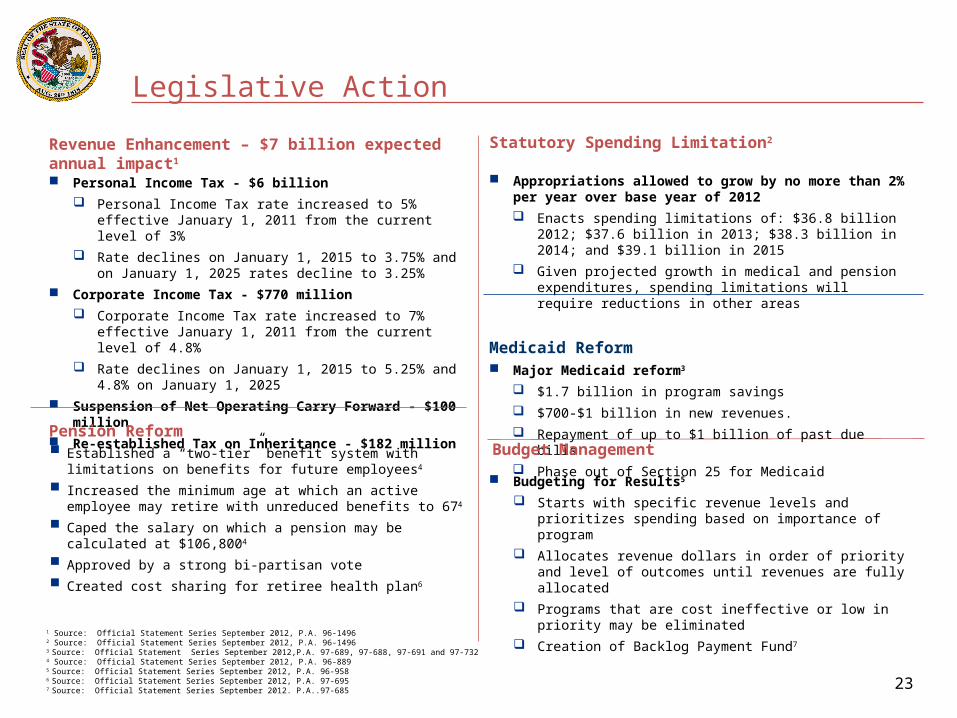
Legislative Action
Revenue Enhancement – $7 billion expected annual impact1
Personal Income Tax - $6 billion
Personal Income Tax rate increased to 5% effective January 1, 2011 from the current level of 3%
Rate declines on January 1, 2015 to 3.75% and on January 1, 2025 rates decline to 3.25%
Corporate Income Tax - $770 million
Corporate Income Tax rate increased to 7% effective January 1, 2011 from the current level of 4.8%
Rate declines on January 1, 2015 to 5.25% and 4.8% on January 1, 2025
Suspension of Net Operating Carry Forward - $100 million
Re-established Tax on Inheritance - $182 million
Statutory Spending Limitation2
Appropriations allowed to grow by no more than 2% per year over base year of 2012
Enacts spending limitations of: $36.8 billion 2012; $37.6 billion in 2013; $38.3 billion in 2014; and $39.1 billion in 2015
Given projected growth in medical and pension expenditures, spending limitations will require reductions in other areas
Medicaid Reform Major Medicaid reform3
$1.7 billion in program savings
$700-$1 billion in new revenues.
Repayment of up to $1 billion of past due bills
Phase out of Section 25 for Medicaid
Budget Management
Budgeting for Results5
Starts with specific revenue levels and prioritizes spending based on importance of program
Allocates revenue dollars in order of priority and level of outcomes until revenues are fully allocated
Programs that are cost ineffective or low in priority may be eliminated
Creation of Backlog Payment Fund7
Pension Reform
Established a “two-tier” benefit system with limitations on benefits for future employees4
Increased the minimum age at which an active employee may retire with unreduced benefits to 674
Caped the salary on which a pension may be calculated at $106,8004
Approved by a strong bi-partisan vote
Created cost sharing for retiree health plan6
1 Source: Official Statement Series September 2012, P.A. 96-14962 Source: Official Statement Series September 2012, P.A. 96-14963 Source: Official Statement Series September 2012,P.A. 97-689, 97-688, 97-691 and 97-7324 Source: Official Statement Series September 2012, P.A. 96-8895 Source: Official Statement Series September 2012, P.A. 96-9586 Source: Official Statement Series September 2012, P.A. 97-6957 Source: Official Statement Series September 2012. P.A..97-685
24
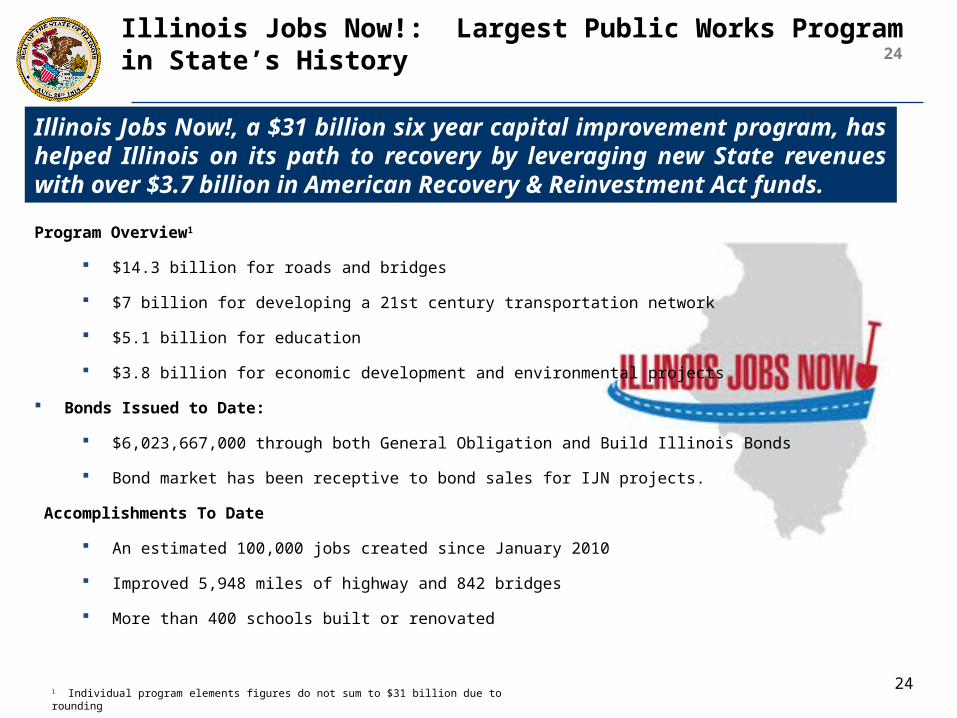
24Illinois Jobs Now!: Largest Public Works Program in State’s History
Program Overview1
$14.3 billion for roads and bridges
$7 billion for developing a 21st century transportation network
$5.1 billion for education
$3.8 billion for economic development and environmental projects
Bonds Issued to Date:
$6,023,667,000 through both General Obligation and Build Illinois Bonds
Bond market has been receptive to bond sales for IJN projects.
Accomplishments To Date
An estimated 100,000 jobs created since January 2010
Improved 5,948 miles of highway and 842 bridges
More than 400 schools built or renovated
1 Individual program elements figures do not sum to $31 billion due to rounding
Illinois Jobs Now!, a $31 billion six year capital improvement program, has helped Illinois on its path to recovery by leveraging new State revenues with over $3.7 billion in American Recovery & Reinvestment Act funds.

State of Illinois: Conclusion
25
26
Conclusion
Does the State of Illinois have the economic engine to support its bond issues?✔ YES!
Illinois has a strong economic base that mirrors the national economy Illinois is one of the world’s largest, most diverse economies Illinois is a sovereign state with unlimited taxing powers
Are these bonds supported by statute and structure?✔ YES!
The General Obligation bonds are the strongest security the State can issue Sources of repayment are not limited to any one revenue stream The State, by statute, can draw from any and all funds in the treasury to pay debt service Statutory set aside provisions ensure that general fund revenues are deposited on a monthly basis in a dedicated
fund for debt service
Does the State have the “Will to Govern” needed to address its challenges?✔ YES!
The active, ongoing dialogue between the Executive and Legislative branches of State government demonstrate that there is “will” to work through the political process
Passed the first Capital Bill in over a decade Passed pension system reforms Passed significant changes in the way the State will execute its budgets going forward Passed the first income tax increase in decades Passed major Medicaid reform expected to reduce GRF expenditures by $2.7 billion Put in place spending meaningful spending limitations
27
Questions?

Civic Federation Debt and Infrastructure CommitteeOctober 24, 2012
State of Illinois
28