The Civic Federation Telecommunications Tax Project
34
The Civic Federation Telecommunications Tax Project 1 Prepared by the Civic Federation September 2001 Introduction The purpose of the Telecommunications Tax Project is to provide an objective analysis of the Chicagoland governments in relation to the structure of telecommunications taxes in Illinois. Specifically, the study provides a systematic model of telecommunications taxes. The model can be subjected to hypothetical scenarios provide meaningful information to municipalities, the telecommunications industry, and legislators. The information generated by this project will help governments assess their own situation with respect to the taxation of telecommunications. The information provided by the study will also elevate the level of public debate concerning tax policy by providing information on the existing telecom tax structure and how it may be impacted in future years. The intent of this report is to spur discussions of the municipal telecom tax structure in Illinois. It is intended to be an objective report that helps municipalities and the telecommunications industry to assess the impacts of proposals to simplify and modernize the existing structure. Summary of Findings The state of Illinois possesses a telecommunications tax structure that includes several types of locally administered taxes. The rate structure is decentralized and is cumbersome to telecommunications retailers attempting to comply with the maintenance of all telecom tax rates. The revenue for municipal telecom taxes statewide is substantial. Municipalities rely on these revenue streams and telecom tax revenues are a significant percentage of the total tax revenues in their budgets. The compliance of administration of these taxes is significant and the costs associated are substantial for both telecommunications carriers and the municipalities that administer these taxes. More specifically: • Over $430 million in municipal telecom tax revenues are imposed by municipalities and collected annually by telecom carriers • Roughly 105,000 municipal telecom tax filings are prepared by telecom retailers and processed by municipalities on an annual basis • Approximately 15,000 telecom tax rates need to be maintained by telecom carriers on an annual basis
Transcript of The Civic Federation Telecommunications Tax Project

The Civic Federation Telecommunications Tax Project
1
Prepared by the Civic Federation September 2001 Introduction The purpose of the Telecommunications Tax Project is to provide an objective analysis of the Chicagoland governments in relation to the structure of telecommunications taxes in Illinois. Specifically, the study provides a systematic model of telecommunications taxes. The model can be subjected to hypothetical scenarios provide meaningful information to municipalities, the telecommunications industry, and legislators. The information generated by this project will help governments assess their own situation with respect to the taxation of telecommunications. The information provided by the study will also elevate the level of public debate concerning tax policy by providing information on the existing telecom tax structure and how it may be impacted in future years. The intent of this report is to spur discussions of the municipal telecom tax structure in Illinois. It is intended to be an objective report that helps municipalities and the telecommunications industry to assess the impacts of proposals to simplify and modernize the existing structure. Summary of Findings The state of Illinois possesses a telecommunications tax structure that includes several types of locally administered taxes. The rate structure is decentralized and is cumbersome to telecommunications retailers attempting to comply with the maintenance of all telecom tax rates. The revenue for municipal telecom taxes statewide is substantial. Municipalities rely on these revenue streams and telecom tax revenues are a significant percentage of the total tax revenues in their budgets. The compliance of administration of these taxes is significant and the costs associated are substantial for both telecommunications carriers and the municipalities that administer these taxes. More specifically:
• Over $430 million in municipal telecom tax revenues are imposed by municipalities and collected annually by telecom carriers
• Roughly 105,000 municipal telecom tax filings are prepared by telecom retailers
and processed by municipalities on an annual basis
• Approximately 15,000 telecom tax rates need to be maintained by telecom carriers on an annual basis

The Civic Federation Telecommunications Tax Project
2
• The ability of municipalities to increase telecom tax revenues through rate increases is severely limited without legislative action
• Over 9 million people in Illinois are subject to some type of telecom tax
• Roughly 625 municipalities in Illinois impose telecom taxes
• Residents in municipalities that impose a telecom excise tax pay an approximate
average of $45 annually
• Residents in municipalities that impose a municipal utility tax pay an approximate average of $29 annually
• Residents in municipalities that impose a municipal infrastructure maintenance
fee pay an approximate average of $12 annually

The Civic Federation Telecommunications Tax Project
3
The History of the Telecommunications Tax Structure in Illinois Telecommunications taxes in Illinois are imposed on businesses that provide telecommunications services or on the actual service itself. These services include telephone, telegraph, mobile radio and telephone, personal communications, private line, computer exchange, and paging services. Moreover, these taxes apply to the transmission of messages or information through various means. As technology in the telecommunications industry continues to progress rapidly, the nature of these services and the application of telecommunications taxes to these services continue to evolve. In addition to the Federal Excise Tax, the state of Illinois along with hundreds of municipalities impose several telecommunications taxes on telecommunications providers and their services. These taxes are generally part of the government’s General Operating Funds, however some of these revenues are raised for school funding or to pay for the costs of maintaining the rights of way. 1) State Telecommunications Message/Excise Tax The original state messages tax was enacted in 1945 and was replaced by the state telecommunications excise tax in 1985. The rates of tax in terms of percentage of gross receipts taxed from 1945 to current are as follows:
0%
1%
2%
3%
4%
5%
6%
7%
1945 1965 1966 1967 1985 1998
Rate of Tax
It is important to note that although the rate of tax remained the same when the state telecommunications excise tax was enacted in 1985, the tax base was expanded to include interstate telecommunications and other services. The rate was raised from 5% to 7% in 1998 due to budgetary requirements primarily with respect to school funding as the rate increase is earmarked for the Common School and School Infrastructure Funds. As a result of the enactment of the state telecommunications excise tax in 1985, a legal challenge to the state’s authority to tax interstate activity was filed. Illinois was one of

The Civic Federation Telecommunications Tax Project
4
the first states to attempt to apply an excise tax to a transaction that was within the scope of interstate commerce. The case of Goldberg vs. Sweet was decided in the United States Supreme Court in 1989. This was a landmark decision in that it set a standard for the taxation of interstate telecommunications for all states and met the requirements of the United States Constitution. The court found that a state could apply a transaction tax to interstate telecommunications as long as the activity originated or terminated within the state and was billed to a service address within the state. Following this standard afforded the authority to only one state to apply tax to any given transaction. 2) Municipal Utility Tax Any municipality has the authority to impose an occupation tax, otherwise known as a municipal utility tax or messages tax, on businesses providing intrastate message transmission services at a rate not to exceed 5% of gross receipts (Section 8-11-2, Ch. 65 ILCS). 3) Municipal Excise Tax Alternatively, a municipality may enact a telecommunications tax, otherwise known as a municipal excise tax, on intrastate and interstate telecommunications services provided by the carrier up to 5% of gross receipts (Section 8-11-17, Ch. 65 ILCS). Currently, over 400 municipalities in Illinois impose a telecommunications excise or utility tax. 4) State Infrastructure Maintenance Fee The State Infrastructure Maintenance Fee was created via passage of the Telecommunications Municipal Infrastructure Maintenance Fee Act (“MIMF Act”) in 1997 and became effective on January 1, 1998 ( 35 ILCS 635/15(a)). In conjunction with creation of this fee, the Act repealed the State Invested Capital Tax (35 ILCS 635/905) which levied a tax on telecommunications retailers of an amount equal to 0.8% of the annual apportionable Illinois invested capital. This fee is imposed in an amount equal to 0.5% of gross charges from telecommunications retailers to their customers. Gross charges include interstate as well as intrastate telecommunications services. 5) Municipal Infrastructure Maintenance Fee The MIMF Act also authorized the imposition of Municipal Infrastructure Maintenance Fees (35 ILCS 635/20) by municipalities throughout Illinois and became effective January 1, 1998. Municipalities are required to pass an ordinance to adopt a Municipal Infrastructure Maintenance Fee.

The Civic Federation Telecommunications Tax Project
5
This fee is based on gross charges that include intrastate and interstate activities. Cities in excess of 500,000 in population, i.e. Chicago, are authorized to impose a rate of up to 2% of gross charges. Chicago implemented a 2% MIMF in 1997 which became effective on January 1, 1998. All other municipalities are authorized to impose a rate of up to 1% of gross charges. There are over 450 municipalities that have adopted a MIMF as of the end of 2000. In addition, the Optional Municipal Infrastructure Maintenance Fee (35 ILCS 635/15) was created. This fee is imposed only in the event that a MIMF has not been adopted and the there is no preexisting franchise fee agreement between the municipality and the telecommunications retailer. The purpose of the fee is to incent municipalities to adopt the MIMF and help minimize situations whereby retailers and municipalities are having to negotiate new franchise fee agreements. In 1998, a legal challenge to the constitutionality of the MIMF was filed. The contest stated that the MIMF violated the uniformity clause of the Illinois Constitution with respect to wireless telecommunications providers and others that are similarly situated. The case, PrimeCo Personal Communications, et al. vs. The Illinois Commerce Commission, et al., was decided in March, 2001, by the Illinois Supreme Court. Although the court found that the MIMF was unconstitutional as applied to the plaintiffs in the case, the court also found that the statute was not invalid on its face. More specifically, the court found that the MIMF violates the uniformity clause of the Illinois constitution only to the extent that it applies to telecommunications retailers that do not own, operate or maintain any part of their infrastructure within the public rights-of-way. The resulting loss of revenue from the exclusion of the wireless telecommunications providers has prompted municipalities to analyze alternative sources of revenue. As of the issuance of this report, the City of Chicago has introduced an ordinance to levy a tax upon the activity of leasing cable capacity from network providers. 6) Municipal Franchise Fee Municipal franchise fees are imposed on telecommunications retailers as a result of agreements entered into by the municipality and the retailer. These fees are generally levied on an access line basis and are intended to reimburse the municipality for costs associated with managing the public rights-of way. Adoption of the MIMF along with a waiver regarding a preexisting franchise fee agreement eliminates the fee within that municipality. Prior to adoption of the MIMF, a case involving AT&T and the Village of Arlington Heights (American Telephone and Telegraph vs. Village of Arlington Heights, 156Ill. 2d 399,620 N.E. 2d 1040, 189Ill. Dec.723 (1993)) clarified the relationship between the municipality and a party attempting to utilize the public right-of-way. Arlington Heights refused to allow AT&T to install fiber optic cable under the village streets unless it

The Civic Federation Telecommunications Tax Project
6
agreed to enter into a franchise agreement. When AT&T refused to enter into such an agreement, the village refused to issue permits to AT&T. The Illinois Supreme Court held that “while municipalities have the authority to enact regulations relating to the use of the public streets and to charge reasonable regulatory fees for such use, they do not have the authority to hold the public streets hostage as a means of raising revenue”. This cornerstone case provided a great deal of impetus to bring municipalities and the industry together to create the MIMF. 7) Public Utility Commission Fee The public utility commission fee (220 ILCS 5/2-202), also known as the State Additional Charge, is levied upon the regulated telecommunications retailer and passed through to the consumer. The fee is 0.1% of the retailer’s intrastate gross charges and is intended to partially fund the budget for the Illinois Commerce Commission. The base of the public utility commission fee is limited to revenues subject to tariff regulation. A legal challenge was filed in 1996 with respect to the fee’s applicability to wireless revenues. In Chicago SMSA Limited Partnership, et al., vs. The Illinois Commerce Commission, the Illinois Appellate Court found that the definition of “gross revenue” subject to the fee was limited to revenue collected by a public utility subject to certain regulations under the Public Utility Tax Act, i.e., the requirement to file tariff schedules setting forth all rates, charges, and classifications of service. Wireless revenues are not subject to these regulations and were determined to be excluded from the definition of “gross revenue”. 8) Emergency 911 Surcharge The emergency telephone system act authorizes the imposition of an emergency 911 surcharge on network connections at a monthly flat rate as determined by the local emergency telephone system board. This purpose of this fee is to fund the operation of the emergency 911 systems throughout Illinois. Wireless carriers have recently begun collection of 911 surcharges throughout the state.

The Civic Federation Telecommunications Tax Project
7
METHODOLOGY FOR EVALUATING THE IMPACTS OF TELECOM TAX REVENUES 1) The Major Municipalities included in the Case Studies The eleven municipalities participating in the case studies are eleven of the top sixteen major municipalities of the Chicago metropolitan region with a population over 50,000. These cities and villages are located geographically in five of the six counties of Northeastern Illinois, a region that is home to approximately 64% of the population of the entire state. This area, together with neighboring counties in Indiana and Wisconsin, forms a coherent economic unit, closely linked by a good transportation and telecommunications network. Table 1 below ranks the municipalities in this study by population. They range in size from the nation’s third largest city, Chicago, to the village of Mount Prospect, with a population of roughly 54,000. Excluding Chicago because of its immense size, the average population of municipalities in this study is approximately 78,000. Table 1 The Major Municipalities of Northeastern Illinois Ranked by Population Municipality Estimated Population Incorporated County Chicago 2,799,050 1835 Cook, DuPage Aurora 129,371 1887 Kane Naperville 122,993 1857 DuPage Waukegan 76,425 1890 Lake Arlington Heights 76,242 1887 Cook, Lake Schaumburg 75,242 1956 Cook Evanston 71,679 1857 Cook Oak Lawn 58,002 1909 Cook Des Plaines 57,068 1869 Cook Wheaton 56,225 1890 DuPage Mount Prospect 53,613 1917 Cook Source: The Population Estimates Program, Population Division, U.S. Census Bureau as of 7/1/99. Most of the municipalities of Northeastern Illinois were incorporated in the decades after the Civil War and before the close of World War I, a period of tremendous growth in Illinois population and economic development. Only one, Schaumburg, was incorporated in the second half of the 20th century. All of the municipalities have home-rule status under the Illinois’ 1970 Constitution. This means that they “may exercise any power and perform any function” except as explicitly limited by the Illinois Constitution. This includes the right to impose any taxes not expressly forbidden, such as income taxes.

The Civic Federation Telecommunications Tax Project
8
While overwhelmingly 19th century in origin, the eleven municipalities in the study are a diverse group in terms of socioeconomic situation and demographics. Chicago is the economic engine and cultural center of the region. Two municipalities, Evanston and Oak Lawn, are landlocked “inner ring” suburbs bordering Chicago and unable to expand boundaries. Naperville, Arlington Heights, Schaumburg, Des Plaines, and Mount Prospect are all located in the relatively prosperous, fast-growing suburbs in the Northwest portion of Cook County. Schaumburg contains a major regional shopping center. Aurora is home to riverboat gaming casinos that generate millions of dollars for local treasuries. Most of the communities furnished copies of their current Comprehensive Annual Financial Reports. In addition to the completed survey information, most municipalities provided copies of the telecommunications utility or excise tax ordinance, along with copies of the municipal infrastructure maintenance fee ordinance.

The Civic Federation Telecommunications Tax Project
9
ILLINOIS MUNICIPAL TELECOMMUNICATIONS TAXES IN THE AGGREGATE Municipal telecommunications taxes in Illinois are locally administered with no reporting requirements to a centralized agency such as the Illinois Department of Revenue or the Illinois Commerce Commission. Some taxes, such as the municipal utility tax are levied upon the telecommunications carrier and are passed through directly on the end user customer’s bill as an additional charge. As such, the charge is a tariffed rate and is subject to the jurisdiction of the Illinois Commerce Commission. Still no centralized reporting mechanism exists to compile, let alone analyze, total municipal telecom tax revenues, whether or not these taxes are levied upon the telecom retailer and passed through, or directly levied upon the end user consumer and simply collected by the telecom retailer. Based upon the survey information provided by the participating municipalities, the Civic Federation has created a model that estimates the impacts of telecommunications tax revenues, among other information, on an aggregate basis. 1) Aggregate Model The aggregate model incorporates municipal tax information from the two largest incumbent local exchange carriers, Ameritech Illinois and Verizon North. These two carriers encompass over 93% of the total states’ access lines. Furthermore, taking into consideration the weight of revenues generated from these access lines versus the remainder of access lines in the state, it can be stated that the municipalities included in the model represent substantially all of the activity in the entire state. The model includes tax rate information with respect to the municipal excise tax rate, the municipal utility tax rate, the actual municipal additional charge to the end user customer including the accounting charge reimbursement, and the municipal infrastructure maintenance fee rate. Although emergency 911 surcharges are not a major focus of this study, the model does include all of the E911 rates for all municipalities as well as county rates for unincorporated areas. The model also includes the population of all Illinois municipalities that have imposed a MET, MUT, or MIMF. The source of all population figures is the Population Estimates Program, Population Division of the United States Census Bureau, as of July 1, 1999. The model includes the MET, MUT, and MIMF revenue amounts reported by the survey municipalities. Based on these survey revenues, actual revenues per resident are calculated on an individual basis for the survey communities. The weighted average revenues per resident are utilized to extrapolate revenues to all other municipalities that impose a MUT, MET, or MIMF based on population.

The Civic Federation Telecommunications Tax Project
10
With respect to tax compliance, information with respect to the estimated number of tax filings for the survey municipalities is incorporated into the model. Estimates of total tax filings with respect to all municipalities that impose a telecom tax are calculated. Finally, the model calculates aggregate computations in two ways, both including and excluding the information provided by the City of Chicago due to its immense size of population. There are other reasons to segregate Chicago data, i.e., Chicago has its own Department of Revenue with substantial resources and its own administration. Moreover, Chicago is often provided a separate tax status with legislation carving out municipalities with populations of over 500,000. 1) Tax Rates The model includes rates for 94 MET communities, 258 MUT communities (including both the statutory rates and the actual rates charged), and 399 MIMF communities. The model also includes 228 counties and local jurisdictions that impose a flat rate emergency 911 surcharge. Assuming a telecommunications retailer does business in all of these taxing jurisdictions, a total of 1,237 telecom tax rates need to be maintained on a monthly basis. This equates to nearly 15,000 municipal rates that need to be maintained on an annual basis. Of the 94 MET communities, 69 impose the maximum rate of 5%. 8 municipalities impose a rate of 4% or higher but below 5%. 12 municipalities impose a rate of 3% or higher but below 4%. 5 municipalities impose a rate of 2.75% and below. The weighted average rate by population is 4.76%. The specific breakdown is shown on the chart below.
0%1%2%3%4%5%
Tax Rate
69 1 7 1 1 1 9 1 1 1 1 1 94WgtAve
# of Municipalities
MET Rate Percentages
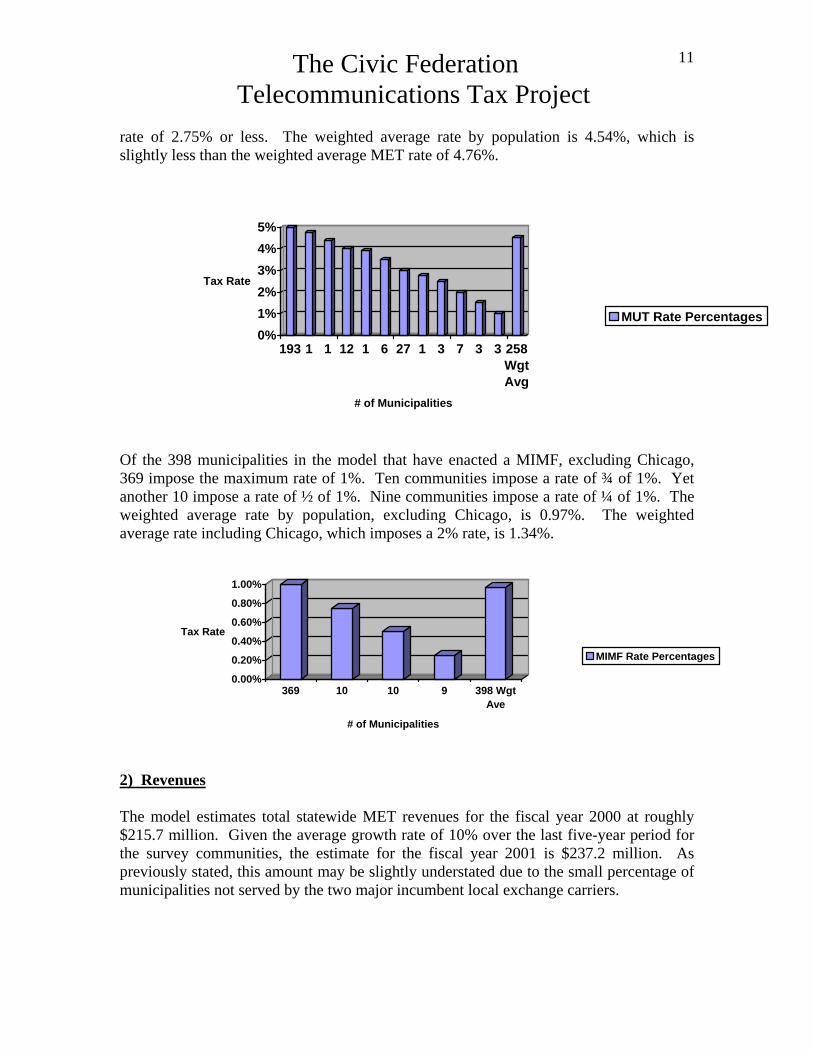
Of the 258 MUT communities in the model, 193 impose the maximum statutory rate of 5%. 13 municipalities impose a rate of 4% or higher, but less than 5%. Another 34 communities impose a rate of 3% or higher, but less than 4%. 17 communities impose a
The Civic Federation Telecommunications Tax Project
11
rate of 2.75% or less. The weighted average rate by population is 4.54%, which is slightly less than the weighted average MET rate of 4.76%.
0%1%2%3%4%5%
Tax Rate
193 1 1 12 1 6 27 1 3 7 3 3 258WgtAvg
# of Municipalities
MUT Rate Percentages
Of the 398 municipalities in the model that have enacted a MIMF, excluding Chicago, 369 impose the maximum rate of 1%. Ten communities impose a rate of ¾ of 1%. Yet another 10 impose a rate of ½ of 1%. Nine communities impose a rate of ¼ of 1%. The weighted average rate by population, excluding Chicago, is 0.97%. The weighted average rate including Chicago, which imposes a 2% rate, is 1.34%.
0.00%
0.20%
0.40%
0.60%
0.80%
1.00%
Tax Rate
369 10 10 9 398 WgtAve
# of Municipalities
MIMF Rate Percentages
2) Revenues The model estimates total statewide MET revenues for the fiscal year 2000 at roughly $215.7 million. Given the average growth rate of 10% over the last five-year period for the survey communities, the estimate for the fiscal year 2001 is $237.2 million. As previously stated, this amount may be slightly understated due to the small percentage of municipalities not served by the two major incumbent local exchange carriers.

The Civic Federation Telecommunications Tax Project
12
The model estimates total MUT revenues for the fiscal year 2000 at roughly $59.6 million. Given the growth rate described above, the estimate for the fiscal year 2001 is approximately $65.5 million. Finally, with respect to MIMF, the model estimates total statewide revenues of $116.4 million. The fiscal year 2001 estimate given the growth rate utilized is $128.0 million. The current fiscal estimates are included in the pie chart below. Total telecom revenues with respect to these three municipal taxes are estimated to be $430.7 million.
$237.2
$65.5
$128.0METMUTMIMF
The weighted average MET revenue per resident on an annual basis is roughly $50 for the survey municipalities assuming a tax rate of 5%. Applied throughout the state taking into consideration the various MET rates imposed, the average annual MET per resident in Illinois is approximately $45. The weighted average MUT revenue per resident on an annual basis is roughly $32 for the survey municipality of Naperville, the only survey community imposing a MUT. Naperville’s MUT rate is 5%. Given the various MUT rates throughout the state, the average annual MUT per resident in Illinois is approximately $29. The weighted average MIMF revenue per resident on an annual basis is roughly $12 for the survey municipalities that impose a 1% rate. The $12 average also includes actual amounts reported by the DuPage Mayors/Managers and the Northwest Municipal Conference for municipalities under their jurisdiction. Chicago was not included in the weighted average MIMF revenue per resident as it is the only community that imposes a rate of 2%. Chicago’s average annual MIMF revenue per resident is roughly $20.

The Civic Federation Telecommunications Tax Project
13
0
10
20
30
40
50
Average Annual Revenue per Resident
METMUTMIMF
3) Telecommunications Tax Compliance in Illinois The average number of annual MUT/MET returns per the survey communities is 959, excluding Chicago. The average number of annual MIMF returns per the survey communities is 806, once again excluding Chicago. The model extrapolates the average number of filings over all municipalities in Illinois that impose a MET, MUT, or MIMF based on the estimated revenue per municipality per the survey average revenue per resident. The estimated total of all MET/MUT return filings on an annual basis for all Illinois municipalities that impose either tax is roughly 52,000. The estimated total of all MIMF return filings on an annual basis for all Illinois municipalities that impose the fee is roughly 53,000. The total estimated telecom tax filings on an annual basis throughout the state is approximately 105,000. This figure does not include estimated remittances, as in the case of the Chicago, which requires annual returns for some carriers along with monthly remittances.
51,550
53,062
Estimated Annual MET/MUT filingsEstimated Annual MIMF filings

The Civic Federation Telecommunications Tax Project
14
THE CASE STUDIES The communities that participated in the case study survey are Arlington Heights, Aurora, Chicago, Des Plaines, Evanston, Mount Prospect, Naperville, Oak Lawn, Schaumburg, Waukegan, and Wheaton. The communities range in population from Mount Prospect at roughly 54,000 to Chicago with nearly 2.8 million people. The surveys requested information such as tax rates, specific revenues by tax type, telecom tax revenues as a percentage of total municipal revenues, number and frequency of return filings, and copies of pertinent ordinances, among other data. 1) Tax Rates The average rate for the eight communities that impose a municipal utility or excise tax is 4.36%. Moreover, the weighted average rate for these communities weighted by population is 4.90%. Five of the communities have imposed the maximum rate of 5% as allowed per statute. Those communities are Aurora, Chicago, Evanston, Naperville, and Waukegan. Three other communities, Mount Prospect, Schaumburg, and Wheaton have imposed rates of 3.3%, 3%, and 3.6%, respectively. Finally, the last three communities, Arlington Heights, Des Plaines, and Oak Lawn have not imposed any municipal telecommunications utility or excise tax. The chart below displays the rates for the eight survey communities that impose a municipal utility or excise tax.
0%1%2%3%4%5%
Aurora
Chicago
Evansto
n
Mount Prosp
ect
Naperv
ille
Schau
mburg
Wauke
gan
Wheaton
Averag
e
Wgt Avg
by Pop
Tax Rate
All eleven of the municipalities participating in the survey have enacted a municipal infrastructure maintenance fee. Furthermore, all eleven municipalities have imposed the maximum rate allowed by statute. Chicago imposes a two percent rate and all other survey municipalities impose a one percent rate. 2) Telecommunication Tax Revenues With respect to those communities that have imposed a municipal telecom utility or excise tax, the range of tax revenues in fiscal year 2000 begins with Mount Prospect at
The Civic Federation Telecommunications Tax Project
15
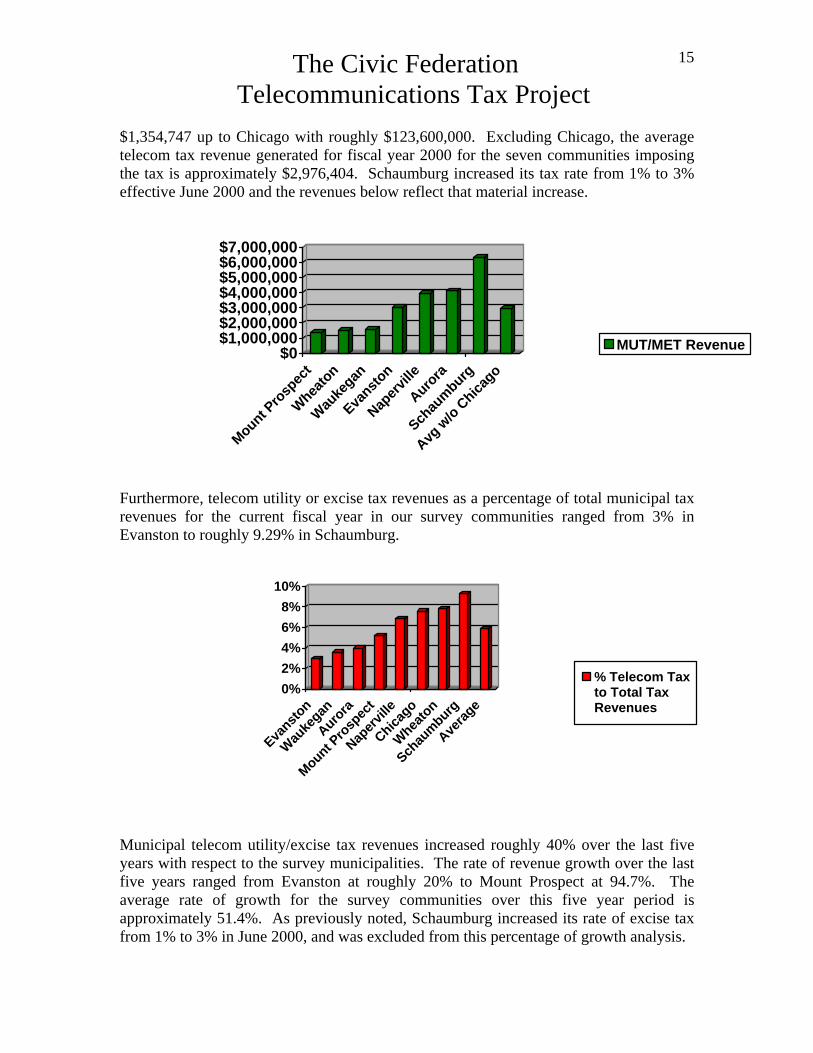
$1,354,747 up to Chicago with roughly $123,600,000. Excluding Chicago, the average telecom tax revenue generated for fiscal year 2000 for the seven communities imposing the tax is approximately $2,976,404. Schaumburg increased its tax rate from 1% to 3% effective June 2000 and the revenues below reflect that material increase.
$0$1,000,000$2,000,000$3,000,000$4,000,000$5,000,000$6,000,000$7,000,000
Mount Pro
spec
t
Wheaton
Wauke
gan
Evansto
n
Naperv
ille
Aurora
Schau
mburg
Avg w
/o Chica
go
MUT/MET Revenue
Furthermore, telecom utility or excise tax revenues as a percentage of total municipal tax revenues for the current fiscal year in our survey communities ranged from 3% in Evanston to roughly 9.29% in Schaumburg.
0%2%4%6%8%
10%
Evansto
n
Wauke
gan
Aurora
Mount Pro
spec
t
Naperv
ille
Chicago
Wheaton
Schau
mburg
Averag
e
% Telecom Taxto Total TaxRevenues
Municipal telecom utility/excise tax revenues increased roughly 40% over the last five years with respect to the survey municipalities. The rate of revenue growth over the last five years ranged from Evanston at roughly 20% to Mount Prospect at 94.7%. The average rate of growth for the survey communities over this five year period is approximately 51.4%. As previously noted, Schaumburg increased its rate of excise tax from 1% to 3% in June 2000, and was excluded from this percentage of growth analysis.

The Civic Federation Telecommunications Tax Project
16
0%10%20%30%40%50%60%70%80%90%
100%
Evansto
n
Wheaton
Chicago
Aurora
Naperv
ille
Wauke
gan
Mount Pro
spec
t
Averag
e
% MUT/MET RevenueGrowth from 1996 to 2000
The following chart displays the revenue growth in terms of actual revenue amounts over the last five years. The rapid revenue growth for Schaumburg is primarily due to the rate increase from 1% to 3% during the five year period. Chicago telecom excise tax revenues increased from $90.9 million in 1996 to roughly $123.6 million in 2000.
0
2,000,000
4,000,000
6,000,000
8,000,000
1996 1997 1998 1999 2000
Aurora Evanston Mount ProspectNaperville Schaumburg WaukeganWheaton
Municipal infrastructure maintenance fees for the survey municipalities for the fiscal year 1999/2000 range from Oak Lawn at $335,728 to Chicago at roughly $54 million. The survey average MIMF revenue is $5,697,693. Excluding Chicago, the survey average MIMF revenue is $787,462.

The Civic Federation Telecommunications Tax Project
17
$0$500,000
$1,000,000$1,500,000$2,000,000$2,500,000
Oak Law
n
Mount Pro
spec
t
Wheaton
Wauke
gan
Evansto
n
Des Plai
nes
Aurora
Arlington H
ts
Naperv
ille
Schau
mburg
Averag
e
MIMF Revenues
3) Tax Compliance The following municipalities provided the number of telecom utility or excise tax returns that are filed on an annual basis. Excluding Chicago, the fiscal year 2000 annual filings ranged from 648 in Schaumburg to 1,260 in Waukegan. The City of Chicago reported annual filings of 549, consistent with the Taxpayer Simplification ordinance passed in 1999 that converted a majority of monthly filings to annual filings with monthly remittances. The average number of annual filings in the survey, excluding Chicago, is 959.
0200400600800
1,0001,2001,400
Schau
mburg
Mount Pro
spec
t
Wheaton
Naperv
ille
Wauke
gan
Avg w
/o Chica
go
Number of annualMUT/MET filings
Municipal infrastructure maintenance fee annual return filings were provided by the following survey municipalities. The number of filings ranged from 150 in Arlington Heights to 1,300 in Waukegan. The number of filings reported by Chicago was 508, once again consistent with the conversion of monthly filings to annual filings as a result

The Civic Federation Telecommunications Tax Project
18
of the 1999 Tax Simplification ordinance. The average number of annual filings, excluding Chicago, is 806.
0200400600800
1,0001,2001,400
Arlington H
ts
Schau
mburg
Mount Pro
spec
t
Wheaton
Naperv
ille
Wauke
gan
Averag
e
Number of AnnualMIMF Filings
Some communities provided the number of annual filings for both the utility/excise tax and the municipal infrastructure maintenance fee. Total telecom tax filings for the current fiscal year with respect to the survey municipalities ranged from Schaumburg at 1,228 to Waukegan at 2,560. Chicago reported total annual filings of 1,057 reflecting the Tax Simplification ordinance revisions.
0500
1,0001,5002,0002,5003,000
Schau
mburg
Mount Pro
spec
t
Wheaton
Naperv
ille
Wauke
gan
Averag
e
Annual MIMF filingsAnnual MUT/MET Filings
Prepared by the Civic Federation September 2001

Page 1 of 16
Municipalities Imposing a Municipal Telecommunications Utility, Excise Tax or Infrastructure Maintenance Fee Prepared by the Civic Federation September 2001
MUT FY 1999/2000 FY 99/00 FY 99/00 FY 99/00 FY 1999/2000 FY 99/00 Population # MUT or MET # of MIMF # MUT or MET # of MIMFTAR MET MUT Rate MIMF Population MET MET Rev MUT MUT Rev MIMF MIMF Rev Surcharge Surcharge Returns Returns Returns ReturnsCode Municipality Rate (%) Rate (%) Charged Rate (%) Revenues / Resident Revenues / Resident Revenues / Resident Rate Purposes (Incl CHI) (Incl CHI) (W/O CHI) (W/O CHI)0467 Addison 1.00 34,259 $357,000.00 1 $10.42 0.50 34,259 115 360
Albany 5.00 5.15 1.00 808 $25,762.53 $31.88 $9,986.88 $12.36 808 3 3 10 8ALEX Alexander County 3.00
0468 Algonquin 4.00 4.12 1.00 21,716 $553,919.89 $25.51 $268,409.76 $12.36 21,716 78 73 271 228Allendale 1.00 461 $5,697.96 $12.36 461 2 5
0119 Alorton 5.00 5.15 2,773 $88,415.22 $31.88 2,773 10 35Alsey 2.00 260 $5,245.02 $20.17 260 1 3
0114 Alsip 1.00 19,586 $242,082.96 $12.36 0.50 19,586 66 206Altamont 1.00 2,330 $28,798.80 $12.36 2,330 8 24
0034 Alton 5.00 5.15 1.00 31,072 $990,709.55 $31.88 $384,049.92 $12.36 31,072 111 104 387 326Amboy 5.00 5.15 2,443 $77,893.39 $31.88 2,443 9 30
0023 Andalusia 5.00 5.15 1,058 $33,733.61 $31.88 1,058 4 130167 Antioch 1.00 8,212 $101,500.32 $12.36 8,212 28 86
Apple River 1.00 407 $5,030.52 $12.36 407 1 4Argenta 1.00 842 $10,407.12 $12.36 842 3 9Arlington 5.00 5.15 199 $6,344.98 $31.88 199 1 2
0047 Arlington Heights 1.00 76,242 N/A N/A N/A N/A $708,289.00 2 $9.29 0.75 76,242 N/A 150 N/A 150Armington 5.00 5.15 339 $10,808.78 $31.88 339 1 4Atlanta 5.00 5.15 1.00 1,706 $54,394.65 $31.88 $21,086.16 $12.36 1,706 6 6 21 18
0157 Aurora 5.00 1.00 129,371 $4,108,171.00 $31.75 N/A N/A $840,000.00 1 $6.49 129,371 N/P N/P N/P N/PAva 3.00 3.09 1.00 655 $12,530.54 $19.13 655 2 2 8 7
0172 Bannockburn 1.00 1,451 $14,635.63 $10.09 0.50 1,451 5 180173 Barrington 2.50 1.00 9,764 $246,213.38 $25.22 $184,906.00 2 $18.94 0.75 9,764 35 33 122 1030094 Barrington Hills 5.00 5.15 4,546 $144,946.11 $31.88 1.50 4,546 16 570174 Bartlett 1.00 35,335 $191,796.00 2 $5.43 0.50 35,335 119 3710175 Bartonville 1.00 6,432 $79,499.52 $12.36 6,432 22 680101 Batavia 3.00 3.09 1.00 23,413 $447,904.53 $19.13 $289,384.68 $12.36 23,413 84 79 292 2460164 Beach Park 5.00 10,200 $514,415.51 $50.43 10,200 36 1270177 Beardstown 3.50 3.61 5,128 $114,451.95 $22.32 5,128 18 640079 Bedford Park 1.00 539 $6,662.04 $12.36 0.75 539 2 60179 Beecher 5.00 5.15 1.00 2,277 $72,600.59 $31.88 $28,143.72 $12.36 2,277 8 8 28 240146 Belleville 4.00 4.12 40,429 $1,031,240.89 $25.51 40,429 145 5040181 Bellevue 1.00 1,513 $18,700.68 $12.36 1,513 5 16
Bellflower 1.00 382 $4,721.52 $12.36 382 1 4Belvidere 5.00 5.15 1.00 18,322 $584,184.49 $31.88 $226,459.92 $12.36 18,322 66 61 228 192
0032 Bellwood 5.00 5.15 1.00 19,877 $633,764.60 $31.88 $245,679.72 $12.36 0.95 19,877 71 67 248 2090182 Bensenville 5.00 1.00 18,342 $925,040.12 $50.43 $226,707.12 $12.36 0.50 18,342 66 62 229 193
Benton 5.00 5.15 0.75 7,111 $226,729.39 $31.88 $65,918.97 $9.27 7,111 25 24 89 750183 Berkeley 5.00 4,975 $250,903.64 $50.43 1.00 4,975 18 620043 Berwyn 5.00 5.15 42,894 $1,367,645.96 $31.88 0.96 42,894 153 5350184 Bethalto 1.00 9,994 $123,525.84 $12.36 9,994 34 105
for the Largest Incumbent LECs in Illinois

Page 2 of 16
Municipalities Imposing a Municipal Telecommunications Utility, Excise Tax or Infrastructure Maintenance Fee Prepared by the Civic Federation September 2001
MUT FY 1999/2000 FY 99/00 FY 99/00 FY 99/00 FY 1999/2000 FY 99/00 Population # MUT or MET # of MIMF # MUT or MET # of MIMFTAR MET MUT Rate MIMF Population MET MET Rev MUT MUT Rev MIMF MIMF Rev Surcharge Surcharge Returns Returns Returns ReturnsCode Municipality Rate (%) Rate (%) Charged Rate (%) Revenues / Resident Revenues / Resident Revenues / Resident Rate Purposes (Incl CHI) (Incl CHI) (W/O CHI) (W/O CHI)
for the Largest Incumbent LECs in Illinois
0185 Bloomingdale 0.50Bloomington 2.50 2.58 1.00 60,872 $970,431.12 $15.94 $752,377.92 $12.36 60,872 218 204 759 639
0186 Blue Island 5.00 5.15 20,547 $655,127.09 $31.88 0.75 20,547 73 256Bluffs 5.00 5.15 576 $18,365.37 $31.88 576 2 7
0139 Bolingbrook 3.50 3.61 1.00 56,156 $1,253,347.06 $22.32 $600,000.00 1 $10.68 0.87 56,156 201 188 700 590BOND Bond County 1.450189 Bonnie 1.00 423 $5,228.28 $12.36 423 1 4
BOON Boone County 0.600191 Braceville 3.00 3.09 653 $12,492.28 $19.13 653 2 80193 Braidwood 5.00 5.15 1.00 5,140 $163,885.40 $31.88 $63,530.40 $12.36 5,140 18 17 64 540195 Bridgeview 1.00 15,652 $193,458.72 $12.36 1.25 15,652 52 164
Brimfield 1.00 787 $9,727.32 $12.36 787 3 8Broadlands 1.00 334 $4,128.24 $12.36 334 1 4
0071 Broadview 5.00 1.00 8,119 $409,464.66 $50.43 $100,350.84 $12.36 1.30 8,119 29 27 101 850084 Brookfield 5.00 1.00 18,056 $910,616.31 $50.43 $223,172.16 $12.36 1.25 18,056 65 61 225 1900120 Brooklyn 3.94 4.06 1,057 $26,556.96 $25.12 1,057 4 13
Brownstown 1.00 766 $9,467.76 $12.36 766 3 8Buckley 3.00 3.09 555 $10,617.48 $19.13 555 2 7
0089 Buffalo 3.00 3.09 1.00 485 $9,278.34 $19.13 $5,994.60 $12.36 485 2 2 6 50200 Buffalo Grove 3.00 1.00 42,624 $1,289,790.98 $30.26 $367,129.00 2 $8.61 0.75 42,624 152 143 532 4470201 Bull Valley 5.00 5.15 692 $22,063.95 $31.88 692 2 90110 Burbank 3.00 1.00 27,834 $842,249.48 $30.26 $344,028.24 $12.36 0.85 27,834 100 93 347 292
BURU Bureau County 1.950202 Burlington 1.00 478 $5,908.08 $12.36 478 2 5
Burnham 0.950007 Burr Ridge 3.85 1.00 10,372 $402,779.27 $38.83 $178,000.00 1 $17.16 0.60 10,372 37 35 129 1090121 Cahokia 5.00 5.15 16,093 $513,114.34 $31.88 16,093 58 2010006 Cairo 5.00 5.15 4,128 $131,618.47 $31.88 4,128 15 510204 Calumet City 5.00 5.15 1.00 36,994 $1,179,528.48 $31.88 $457,245.84 $12.36 0.95 36,994 132 124 461 3880205 Calumet Park 5.00 8,383 $422,778.94 $50.43 0.95 8,383 30 105
Camargo 5.00 5.15 455 $14,507.36 $31.88 455 2 6Cambria 5.00 5.15 1,356 $43,235.14 $31.88 1,356 5 17
0209 Carbon Hill 5.00 5.15 433 $13,805.91 $31.88 433 2 5Carbondale 5.00 5.15 0.75 27,228 $868,146.23 $31.88 $252,403.56 $9.27 27,228 97 91 340 286Carmi 5.00 5.15 5,576 $177,786.96 $31.88 5,576 20 70
0011 Carol Stream 5.00 1.00 37,738 $1,903,236.51 $50.43 $295,000.00 1 $7.82 0.50 37,738 135 127 471 3960049 Carpentersville 5.00 5.15 1.00 28,411 $905,865.38 $31.88 $351,159.96 $12.36 0.65 28,411 102 95 354 298
Carrier Mills 0.50 1,989 $12,292.02 $6.18 1,989 7 21Carroll County 1.75Carrollton 0.50 2,096 $12,953.28 $6.18 2,096 7 22Carterville 5.00 5.15 4,466 $142,395.37 $31.88 4,466 16 56

Page 3 of 16
Municipalities Imposing a Municipal Telecommunications Utility, Excise Tax or Infrastructure Maintenance Fee Prepared by the Civic Federation September 2001
MUT FY 1999/2000 FY 99/00 FY 99/00 FY 99/00 FY 1999/2000 FY 99/00 Population # MUT or MET # of MIMF # MUT or MET # of MIMFTAR MET MUT Rate MIMF Population MET MET Rev MUT MUT Rev MIMF MIMF Rev Surcharge Surcharge Returns Returns Returns ReturnsCode Municipality Rate (%) Rate (%) Charged Rate (%) Revenues / Resident Revenues / Resident Revenues / Resident Rate Purposes (Incl CHI) (Incl CHI) (W/O CHI) (W/O CHI)
for the Largest Incumbent LECs in Illinois
0211 Cary 1.00 14,471 $178,861.56 $12.36 14,471 49 152Casey 3.00 3.09 3,252 $62,212.68 $19.13 3,252 12 41
0212 Caseyville 3.00 3.09 4,294 $82,146.76 $19.13 4,294 15 54CASS Cass County 2.000214 Central City 1.00 44 $543.84 $12.36 44 0 00215 Centralia 1.00 14,061 $173,793.96 $12.36 14,061 47 1480122 Centreville 5.00 5.15 7,033 $224,242.41 $31.88 7,033 25 88
Chadwick 5.00 5.15 599 $19,098.71 $31.88 599 2 70019 Champaign 2.75 65,226 $1,809,244.73 $27.74 65,226 233 813
CHPN Champaign County 1.50Chapin 5.00 5.15 634 $20,214.66 $31.88 634 2 8Chatham 1.00 7,570 $93,565.20 $12.36 7,570 25 79Cherry 5.00 5.15 502 $16,005.93 $31.88 502 2 6Chester 0.75 7,814 $72,435.78 $9.27 7,814 26 82
0002 Chicago 5.00 2.00 2,799,050 $120,600,000.00 $43.09 N/A N/A $54,800,000.00 3 $19.58 1.25 2,799,050 549 (2) 508 (2) 549 (2) 508 (2)0074 Chicago Heights 4.00 4.12 31,726 $809,249.51 $25.51 1.00 31,726 113 3960216 Chicago Ridge 1.00 13,941 $172,310.76 $12.36 0.75 13,941 47 146
Chillicothe 1.00 5,934 $73,344.24 $12.36 5,934 20 62Christopher 1.00 2,776 $34,311.36 $12.36 2,776 9 29
0217 Cicero 5.00 1.00 70,344 $3,547,651.42 $50.43 $869,451.84 $12.36 1.00 70,344 252 236 877 738Cisco 1.00 314 $3,881.04 $12.36 314 1 3
0129 Clarendon Hills 4.00 1.00 7,628 $307,761.69 $40.35 $61,000.00 1 $8.00 0.50 7,628 27 26 95 80Clark County 2.95
CLTN Clinton County 1.800219 Coal City 5.00 1.00 4,769 $240,514.47 $50.43 $58,944.84 $12.36 4,769 17 16 59 500220 Coal Valley 1.00 3,997 $49,402.92 $12.36 3,997 13 42
Cobden 5.00 5.15 1.00 1,139 $36,316.24 $31.88 $14,078.04 $12.36 1,139 4 4 14 12Coffeen 1.00 812 $10,036.32 $12.36 812 3 9Coles County 1.95Colfax 5.00 5.15 857 $27,324.86 $31.88 857 3 11
0222 Colona 5.00 5.15 1.00 5,367 $171,123.14 $31.88 $66,336.12 $12.36 5,367 19 18 67 56COOK Cook County 1.25
Cortland 5.00 5.15 1.00 2,133 $68,009.25 $31.88 $26,363.88 $12.36 2,133 8 7 27 22Coulterville 1.00 964 $11,915.04 $12.36 964 3 10
0224 Country Club Hills 5.00 1.00 16,521 $833,201.82 $50.43 $204,199.56 $12.36 0.80 16,521 59 55 206 1730225 Countryside 1.00 6,205 $76,693.80 $12.36 0.60 6,205 21 65
Crawford County 1.35Crestwood 0.90
0227 Crest Hill 1.00 13,070 $161,545.20 $12.36 13,070 44 1370230 Crystal Lake 1.00 34,661 $428,409.96 $12.36 34,661 116 364
Cumberland County 2.50

Page 4 of 16
Municipalities Imposing a Municipal Telecommunications Utility, Excise Tax or Infrastructure Maintenance Fee Prepared by the Civic Federation September 2001
MUT FY 1999/2000 FY 99/00 FY 99/00 FY 99/00 FY 1999/2000 FY 99/00 Population # MUT or MET # of MIMF # MUT or MET # of MIMFTAR MET MUT Rate MIMF Population MET MET Rev MUT MUT Rev MIMF MIMF Rev Surcharge Surcharge Returns Returns Returns ReturnsCode Municipality Rate (%) Rate (%) Charged Rate (%) Revenues / Resident Revenues / Resident Revenues / Resident Rate Purposes (Incl CHI) (Incl CHI) (W/O CHI) (W/O CHI)
for the Largest Incumbent LECs in Illinois
Cutler 5.00 5.15 526 $16,771.15 $31.88 526 2 7Dalton City 2.00 2.06 560 $7,142.09 $12.75 560 2 7
0231 Danville 1.00 32,938 $407,113.68 $12.36 32,938 110 3460095 Darien 1.50 1.55 1.00 23,958 $229,165.35 $9.57 $127,000.00 1 $5.30 0.50 23,958 86 80 299 2520058 Dawson 5.00 5.15 1.00 548 $17,472.61 $31.88 $6,773.28 $12.36 548 2 2 7 6
De Kalb 5.00 5.15 39,329 $1,253,978.37 $31.88 39,329 141 490De Soto 5.00 5.15 1,516 $48,336.63 $31.88 1,516 5 19
0083 Decatur 5.00 5.15 1.00 80,945 $2,580,876.17 $31.88 $1,000,480.20 $12.36 80,945 289 271 1009 8500232 Deerfield 1.00 18,893 $233,517.48 $12.36 0.50 18,893 63 198
Deer Creek 5.00 5.15 1.00 620 $19,768.28 $31.88 $7,663.20 $12.36 620 2 2 8 70038 Deer Park 5.00 5.15 3,174 $101,200.83 $31.88 3,174 11 40DKLB DeKalb County 0.840471 Des Plaines 1.00 57,068 N/A N/A N/A N/A $704,178.00 2 $12.34 1.00 57,068 N/A N/P N/A N/P
Dewitt County 1.250234 Diamond 5.00 5.15 1,166 $37,177.12 $31.88 1,166 4 15
Divernon 1.00 1,205 $14,893.80 $12.36 1,205 4 130081 Dixmoor 5.00 5.15 4,005 $127,696.70 $31.88 0.75 4,005 14 500236 Dolton 3.00 3.09 23,892 $457,068.08 $19.13 1.25 23,892 85 298
Douglas County 1.70Dowell 5.00 5.15 1.00 450 $14,347.94 $31.88 $5,562.00 $12.36 450 2 2 6 5Downs 1.00 601 $7,428.36 $12.36 601 2 6
0237 Downers Grove 2.30 1.00 51,856 $1,203,014.12 $23.20 $1,140,000.00 1 $21.98 0.50 51,856 185 174 647 544Dunlap 0.50 891 $5,506.38 $6.18 891 3 9
DUPG Dupage County 0.50Durand 3.50 3.61 1,278 $28,523.71 $22.32 1,278 5 16
0239 Dwight 3.00 3.09 4,561 $87,254.63 $19.13 4,561 16 57Earlville 1.00 1,556 $19,232.16 $12.36 1,556 5 16
0240 East Alton 1.00 6,748 $83,405.28 $12.36 6,748 23 71East Dubuque 5.00 5.15 1.00 1,822 $58,093.23 $31.88 $22,519.92 $12.36 1,822 7 6 23 19
0144 East Dundee 5.00 3,442 $173,590.02 $50.43 0.65 3,442 12 430156 East Hazel Crest 5.00 1.00 1,594 $80,390.03 $50.43 $19,701.84 $12.36 0.65 1,594 6 5 20 170004 East Moline 5.00 5.15 1.00 20,299 $647,219.78 $31.88 $250,895.64 $12.36 20,299 73 68 253 2130242 East Peoria 1.00 23,497 $290,422.92 $12.36 23,497 79 2470123 East St. Louis 4.40 4.53 36,656 $1,028,501.39 $28.06 36,656 131 457
Edgar County 2.00Edgewood 5.00 5.15 535 $17,058.11 $31.88 535 2 7Effingham 1.50 1.55 12,974 $124,100.14 $9.57 12,974 46 162
0245 Elburn 5.00 5.15 2,689 $85,736.93 $31.88 2,689 10 34Eldorado 3.00 3.06 1.00 4,695 $89,818.13 $19.13 $58,030.20 $12.36 4,695 17 16 59 49
0246 Elgin 1.00 89,408 $1,105,082.88 $12.36 0.65 89,408 300 9390073 Elk Grove Village 3.00 1.00 35,058 $1,060,845.82 $30.26 $619,463.00 2 $17.67 35,058 125 118 437 368

Page 5 of 16
Municipalities Imposing a Municipal Telecommunications Utility, Excise Tax or Infrastructure Maintenance Fee Prepared by the Civic Federation September 2001
MUT FY 1999/2000 FY 99/00 FY 99/00 FY 99/00 FY 1999/2000 FY 99/00 Population # MUT or MET # of MIMF # MUT or MET # of MIMFTAR MET MUT Rate MIMF Population MET MET Rev MUT MUT Rev MIMF MIMF Rev Surcharge Surcharge Returns Returns Returns ReturnsCode Municipality Rate (%) Rate (%) Charged Rate (%) Revenues / Resident Revenues / Resident Revenues / Resident Rate Purposes (Incl CHI) (Incl CHI) (W/O CHI) (W/O CHI)
for the Largest Incumbent LECs in Illinois
Elkhart 1.00 468 $5,784.48 $12.36 468 2 5Elkville 1.00 912 $11,272.32 $12.36 912 3 10Ellis Grove 0.75 430 $3,986.10 $9.27 430 1 5
0163 Elmhurst 4.94 1.00 44,153 $2,200,042.36 $49.83 $399,000.00 1 $9.04 0.50 44,153 158 148 551 4640145 Elmwood 5.00 5.15 1.00 1,882 $60,006.29 $31.88 $23,261.52 $12.36 1,882 7 6 23 200247 Elmwood Park 4.00 1.00 22,379 $902,910.17 $40.35 $276,604.44 $12.36 1.25 22,379 80 75 279 235
Energy 5.00 5.15 1,271 $40,524.97 $31.88 1,271 5 16Erie 3.50 3.61 1.00 1,480 $33,032.15 $22.32 $18,292.80 $12.36 1,480 5 5 18 16
0030 Evanston 5.00 1.00 71,679 $3,000,000.00 $41.85 N/A N/A $665,000.00 3 $9.28 1.50 71,679 N/P N/P N/P N/PEvansville 5.00 5.15 779 $24,837.88 $31.88 779 3 10
0249 Evergreen Park 3.00 1.00 20,348 $615,725.10 $30.26 $251,501.28 $12.36 1.00 20,348 73 68 254 214Fairbury 0.75 3,809 $35,309.43 $9.27 3,809 13 40Fairfield 5.00 5.15 4,899 $156,201.28 $31.88 4,899 18 61
0124 Fairmont City 5.00 5.15 1,963 $62,588.92 $31.88 1,963 7 24Farmer City 3.00 3.09 2,209 $42,259.48 $19.13 2,209 8 28Fayetteville 1.00 253 $3,127.08 $12.36 253 1 3Fisher 3.00 3.09 1,504 $28,772.41 $19.13 1,504 5 19
0253 Fithian 3.00 3.09 502 $9,603.56 $19.13 502 2 6Flora 1.00 4,636 $57,300.96 $12.36 4,636 16 49
0028 Flossmoor 5.00 1.00 9,464 $477,296.90 $50.43 $116,975.04 $12.36 1.00 9,464 34 32 118 99FORD Ford County 1.500010 Ford Heights 5.00 5.15 4,123 $131,459.05 $31.88 1.25 4,123 15 510254 Forest Park 5.00 14,184 $715,340.15 $50.43 1.00 14,184 51 1770027 Forest View 4.00 1.00 741 $29,896.62 $40.35 $9,158.76 $12.36 1.25 741 3 2 9 80255 Forrest 5.00 5.15 1,109 $35,359.71 $31.88 1,109 4 14
Forreston 5.00 5.15 1,426 $45,467.04 $31.88 1,426 5 180256 Forsyth 1.00 2,219 $27,426.84 $12.36 0.65 2,219 7 230161 Fox Lake 1.00 8,920 $110,251.20 $12.36 8,920 30 940118 Fox River Grove 5.00 5.15 1.00 4,475 $142,682.33 $31.88 $55,311.00 $12.36 4,475 16 15 56 470126 Fox River Valley Gardens 5.00 5.15 1.00 829 $26,432.10 $31.88 $10,246.44 $12.36 829 3 3 10 90257 Frankfort 5.00 10,681 $538,673.73 $50.43 10,681 38 1330258 Franklin Park 5.00 1.00 17,900 $902,748.78 $50.43 $221,244.00 $12.36 1.00 17,900 64 60 223 188
Freeman Spur 5.00 5.15 316 $10,075.44 $31.88 316 1 4Freeport 1.00 26,031 $321,743.16 $12.36 26,031 87 273Fulton 1.00 3,914 $48,377.04 $12.36 3,914 13 41
FLTN Fulton County 1.850057 Galena 5.00 5.15 3,325 $106,015.36 $31.88 3,325 12 410158 Geneva 5.00 5.15 1.00 18,854 $601,146.94 $31.88 $233,035.44 $12.36 18,854 67 63 235 198
Genoa 5.00 5.15 1.00 3,433 $109,458.87 $31.88 $42,431.88 $12.36 3,433 12 12 43 360262 Germantown 1.00 1,205 $14,893.80 $12.36 1,205 4 130263 Gibson City 3.00 3.09 3,366 $64,393.57 $19.13 3,366 12 42

Page 6 of 16
Municipalities Imposing a Municipal Telecommunications Utility, Excise Tax or Infrastructure Maintenance Fee Prepared by the Civic Federation September 2001
MUT FY 1999/2000 FY 99/00 FY 99/00 FY 99/00 FY 1999/2000 FY 99/00 Population # MUT or MET # of MIMF # MUT or MET # of MIMFTAR MET MUT Rate MIMF Population MET MET Rev MUT MUT Rev MIMF MIMF Rev Surcharge Surcharge Returns Returns Returns ReturnsCode Municipality Rate (%) Rate (%) Charged Rate (%) Revenues / Resident Revenues / Resident Revenues / Resident Rate Purposes (Incl CHI) (Incl CHI) (W/O CHI) (W/O CHI)
for the Largest Incumbent LECs in Illinois
0264 Gilberts 5.00 5.15 1.00 1,310 $41,768.46 $31.88 $16,191.60 $12.36 1,310 5 4 16 14Gillespie 5.00 5.00 1.00 2,882 $91,890.61 $31.88 $35,621.52 $12.36 2,882 10 10 36 30
0266 Glen Carbon 1.00 10,440 $129,038.40 $12.36 10,440 35 1100090 Glen Ellyn 5.00 1.00 26,789 $1,351,046.77 $50.43 $247,000.00 1 $9.22 0.50 26,789 96 90 334 2810078 Glenview 5.00 5.15 1.00 41,208 $1,313,889.00 $31.88 $509,330.88 $12.36 1.00 41,208 147 138 514 4330267 Glenwood 5.00 5.15 1.00 9,056 $288,744.39 $31.88 $111,932.16 $12.36 0.85 9,056 32 30 113 950068 Glencoe 5.00 1.00 8,350 $421,114.66 $50.43 $62,500.00 2 $7.49 1.50 8,350 30 28 104 880052 Glendale Heights 4.00 1.00 30,170 $1,217,248.30 $40.35 $372,901.20 $12.36 0.50 30,170 108 101 376 3170475 Godfrey 1.00 16,114 $199,169.04 $12.36 16,114 54 1690268 Godley 5.00 5.15 504 $16,069.70 $31.88 504 2 6
Golconda 1.00 861 $10,641.96 $12.36 861 3 90005 Golf 5.00 5.15 1.00 445 $14,188.52 $31.88 $5,500.20 $12.36 1.25 445 2 1 6 5
Goodfield 5.00 5.15 1.00 570 $18,174.06 $31.88 $7,045.20 $12.36 570 2 2 7 6Grand Tower 5.00 5.15 725 $23,116.13 $31.88 725 3 9
0269 Grandview 1.00 1,477 $18,255.72 $12.36 1,477 5 160155 Granite City 5.00 5.15 31,041 $989,721.13 $31.88 31,041 111 387
Granville 1.00 1,379 $17,044.44 $12.36 1,379 5 140271 Graylake 1.00 16,572 $125,699.00 2 $7.59 0.90 16,572 56 174
Greenfield 1.00 994 $12,285.84 $12.36 994 3 100273 Greenville 1.00 7,073 $87,422.28 $12.36 7,073 24 74
Griggsville 5.00 5.15 0.25 1,220 $38,898.87 $31.88 $3,769.80 $3.09 1,220 4 4 15 13GNDY Grundy County 1.800274 Gurnee 1.00 26,256 $324,524.16 $12.36 0.75 26,256 88 2760275 Hainesville 5.00 5.15 1.00 574 $18,301.60 $31.88 $7,094.64 $12.36 0.75 574 2 2 7 60276 Hampshire 3.00 3.09 1.00 2,340 $44,765.58 $19.13 $28,922.40 $12.36 2,340 8 8 29 250013 Hampton 5.00 5.15 1,691 $53,916.38 $31.88 1,691 6 210278 Hanover Park 1.00 36,099 $197,502.00 2 $5.47 0.50 36,099 121 379
Hardin 0.25 996 $3,077.64 $3.09 996 3 10Harrisburg 1.00 9,468 $117,024.48 $12.36 9,468 32 99
0280 Hartford 1.00 1,562 $19,306.32 $12.36 1,562 5 160281 Harvard 3.00 3.09 1.00 6,996 $133,837.62 $19.13 $86,470.56 $12.36 0.50 6,996 25 23 87 730070 Harvey 5.00 5.15 1.00 29,167 $929,969.92 $31.88 $360,504.12 $12.36 1.25 29,167 104 98 364 3060035 Harwood Heights 5.00 1.00 7,977 $402,303.19 $50.43 $98,595.72 $12.36 1.25 7,977 29 27 99 840282 Hawthorne Woods 1.00 5,916 $73,121.76 $12.36 5,916 20 620022 Hazel Crest 5.00 1.00 13,942 $703,135.39 $50.43 $172,323.12 $12.36 0.80 13,942 50 47 174 146
Hebron 4.75 4.89 1.00 917 $27,776.02 $30.29 $11,334.12 $12.36 917 3 3 11 10Hecker 5.00 5.15 621 $19,800.16 $31.88 621 2 8Henry 0.25 2,585 $7,987.65 $3.09 2,585 9 27
HNRY Henry County 0.950283 Herscher 1.00 1,440 $17,798.40 $12.36 1,440 5 15
Heyworth 2.00 2.06 2,158 $27,522.54 $12.75 2,158 8 27

Page 7 of 16
Municipalities Imposing a Municipal Telecommunications Utility, Excise Tax or Infrastructure Maintenance Fee Prepared by the Civic Federation September 2001
MUT FY 1999/2000 FY 99/00 FY 99/00 FY 99/00 FY 1999/2000 FY 99/00 Population # MUT or MET # of MIMF # MUT or MET # of MIMFTAR MET MUT Rate MIMF Population MET MET Rev MUT MUT Rev MIMF MIMF Rev Surcharge Surcharge Returns Returns Returns ReturnsCode Municipality Rate (%) Rate (%) Charged Rate (%) Revenues / Resident Revenues / Resident Revenues / Resident Rate Purposes (Incl CHI) (Incl CHI) (W/O CHI) (W/O CHI)
for the Largest Incumbent LECs in Illinois
0091 Hickory Hills 5.00 1.00 14,137 $712,969.81 $50.43 $174,733.32 $12.36 0.85 14,137 51 47 176 148Highland 0.75 8,420 $78,053.40 $9.27 8,420 28 88
0036 Highland Park 5.00 5.15 31,343 $999,350.20 $31.88 1.00 31,343 112 3910065 Highwood 5.00 5.15 1.00 5,196 $165,670.92 $31.88 $64,222.56 $12.36 1.00 5,196 19 17 65 550160 Hillside 5.00 7,501 $378,297.13 $50.43 0.85 7,501 27 94
Hinckley 5.00 5.15 2,106 $67,148.38 $31.88 2,106 8 260128 Hinsdale 3.00 3.09 1.00 16,793 $321,260.02 $19.13 $400,000.00 1 $23.82 0.50 16,793 60 56 209 1760284 Hodgkins 1.00 2,087 $25,795.32 $12.36 1.00 2,087 7 220107 Hoffman Estates 5.00 1.00 48,521 $2,447,054.40 $50.43 $307,393.00 2 $6.34 0.84 48,521 173 163 605 5090285 Holiday Hills 5.00 790 $39,841.99 $50.43 790 3 100286 Hometown 1.000287 Homewood 1.00 19,378 $239,512.08 $12.36 0.50 19,378 65 203
Hopedale 5.00 5.15 926 $29,524.88 $31.88 926 3 120097 Hopkins Park 5.00 5.15 791 $25,220.50 $31.88 791 3 100289 Huntley 1.00 3,986 $49,266.96 $12.36 3,986 13 420099 Indian Head Park 5.00 5.15 3,753 $119,661.85 $31.88 3.00 3,753 13 47IRQS Iroquois County 2.00
Irvington 1.00 834 $10,308.24 $12.36 834 3 90082 Island Lake 5.00 5.15 1.00 7,915 $252,364.38 $31.88 $97,829.40 $12.36 7,915 28 27 99 830295 Itasca 1.00 8,546 $262,000.00 1 $30.66 0.50 8,546 29 90
Jacksonville 1.50 1.55 18,059 $172,739.67 $9.57 18,059 65 225Jasper County 1.85Jefferson County 0.90Jerseyville 1.00 7,589 $93,800.04 $12.36 7,589 25 80Jersey County 0.90Jo Daviess County 1.75
0433 Johnsburg 1.00 5,059 $62,529.24 $12.36 5,059 17 53Johnston City 5.00 5.15 1.00 3,587 $114,369.05 $31.88 $44,335.32 $12.36 3,587 13 12 45 38
0298 Joliet 5.00 97,308 $4,907,523.94 $50.43 97,308 348 1214Joppa 2.50 2.58 541 $8,624.71 $15.94 541 2 7
0300 Justice 5.00 5.15 1.00 11,590 $369,539.25 $31.88 $143,252.40 $12.36 1.25 11,590 41 39 145 122KANE Kane County 0.500067 Kankakee 5.00 1.00 26,717 $1,347,415.60 $50.43 $330,222.12 $12.36 26,717 96 90 333 280
Kankakee County 1.00Keithsburg 5.00 5.15 1.00 768 $24,487.16 $31.88 $9,492.48 $12.36 768 3 3 10 8
KNDL Kendall County 0.750042 Kenilworth 5.00 5.15 2,275 $72,536.82 $31.88 1.00 2,275 8 28
Kewanee 1.00 12,686 $156,798.96 $12.36 12,686 43 133Keyesport 1.00 423 $5,228.28 $12.36 423 1 4
0302 Kildeer 1.00 3,341 $41,294.76 $12.36 3,341 11 35Kingston 1.00 666 $8,231.76 $12.36 666 2 7

Page 8 of 16
Municipalities Imposing a Municipal Telecommunications Utility, Excise Tax or Infrastructure Maintenance Fee Prepared by the Civic Federation September 2001
MUT FY 1999/2000 FY 99/00 FY 99/00 FY 99/00 FY 1999/2000 FY 99/00 Population # MUT or MET # of MIMF # MUT or MET # of MIMFTAR MET MUT Rate MIMF Population MET MET Rev MUT MUT Rev MIMF MIMF Rev Surcharge Surcharge Returns Returns Returns ReturnsCode Municipality Rate (%) Rate (%) Charged Rate (%) Revenues / Resident Revenues / Resident Revenues / Resident Rate Purposes (Incl CHI) (Incl CHI) (W/O CHI) (W/O CHI)
for the Largest Incumbent LECs in Illinois
Knox County 1.250137 La Grange 3.00 1.00 18,066 $546,672.39 $30.26 $223,295.76 $12.36 0.75 18,066 65 61 225 1900093 La Grange Park 5.00 1.00 9,265 $467,260.75 $50.43 $114,515.40 $12.36 1.00 9,265 33 31 116 970304 Lake Barrington 1.00 4,831 $10,081.00 2 $2.09 4,831 16 510077 Lake Bluff 5.00 5,662 $285,551.04 $50.43 0.85 5,662 20 71LAKE Lake County 0.750033 Lake Forest 5.00 1.00 19,751 $996,100.07 $50.43 $68,644.00 2 $3.48 0.65 19,751 71 66 246 2070305 Lake Villa 1.00 4,934 $60,984.24 $12.36 4,934 17 520104 Lake Zurich 1.00 17,769 $127,360.00 2 $7.17 17,769 60 1870003 Lake-in-the-Hills 5.00 5.15 1.00 21,228 $676,840.32 $31.88 $262,378.08 $12.36 21,228 76 71 265 2230135 Lakemoor 1.00 1,809 $22,359.24 $12.36 1,809 6 190306 Lakewood 5.00 1.00 2,268 $114,381.80 $50.43 $28,032.48 $12.36 2,268 8 8 28 240307 Lansing 3.00 3.09 1.00 28,612 $547,364.47 $19.13 $353,644.32 $12.36 0.50 28,612 102 96 357 3000159 LaSalle 5.00 5.15 9,358 $298,373.45 $31.88 0.65 9,358 33 117
Lawrenceville 1.00 4,103 $50,713.08 $12.36 4,103 14 430308 Lebanon 1.00 3,715 $45,917.40 $12.36 3,715 12 39
Lee 5.00 5.15 338 $10,776.90 $31.88 338 1 4LEEE Lee County 1.75
Leland 5.00 948 $47,810.38 $50.43 948 3 120309 Leland Grove 5.00 5.15 1,506 $48,017.78 $31.88 1,506 5 190310 Lemont 5.00 11,492 $579,574.81 $50.43 0.75 11,492 41 143
Lena 5.00 5.15 2,807 $89,499.28 $31.88 2,807 10 350311 Lenzburg 5.00 5.15 545 $17,376.95 $31.88 545 2 7
Leroy 5.00 5.15 1.00 3,184 $101,519.67 $31.88 $39,354.24 $12.36 3,184 11 11 40 330312 Lewistown 1.00 2,538 $31,369.68 $12.36 2,538 9 27
Lexington 1.00 1,785 $22,062.60 $12.36 1,785 6 190314 Libertyville 1.00 20,879 $213,418.00 2 $10.22 0.75 20,879 70 2190472 Lily Lake 1.00 728 $8,998.08 $12.36 728 2 8
Lincoln 1.00 15,297 $189,070.92 $12.36 15,297 51 1610012 Lincolnshire 5.00 5.15 1.00 6,223 $198,416.11 $31.88 $295,811.00 2 $47.54 1.50 6,223 22 21 78 650315 Lincolnwood 5.00 1.00 11,353 $572,564.63 $50.43 $94,744.00 2 $8.35 0.50 11,353 41 38 142 1190316 Lindenhurst 1.00 11,969 $147,936.84 $12.36 11,969 40 1260116 Lisle 5.00 5.15 1.00 21,099 $672,727.24 $31.88 $493,000.00 1 $23.37 0.50 21,099 75 71 263 222
Little York 5.00 5.15 328 $10,458.06 $31.88 328 1 4LVSN Livingston County 1.50
Loami 5.00 5.15 1.00 823 $26,240.79 $31.88 $10,172.28 $12.36 823 3 3 10 90319 Lockport 1.00 14,263 $176,290.68 $12.36 14,263 48 150
Loda 3.00 3.09 385 $7,365.28 $19.13 385 1 5LOGN Logan County 0.850320 Lombard 5.00 1.00 43,099 $2,173,607.25 $50.43 $565,000.00 1 $13.11 0.50 43,099 154 145 537 4520321 Long Grove 0.25 6,339 $19,587.51 $3.09 6,339 21 67

Page 9 of 16
Municipalities Imposing a Municipal Telecommunications Utility, Excise Tax or Infrastructure Maintenance Fee Prepared by the Civic Federation September 2001
MUT FY 1999/2000 FY 99/00 FY 99/00 FY 99/00 FY 1999/2000 FY 99/00 Population # MUT or MET # of MIMF # MUT or MET # of MIMFTAR MET MUT Rate MIMF Population MET MET Rev MUT MUT Rev MIMF MIMF Rev Surcharge Surcharge Returns Returns Returns ReturnsCode Municipality Rate (%) Rate (%) Charged Rate (%) Revenues / Resident Revenues / Resident Revenues / Resident Rate Purposes (Incl CHI) (Incl CHI) (W/O CHI) (W/O CHI)
for the Largest Incumbent LECs in Illinois
Long Point 1.00 213 $2,632.68 $12.36 213 1 20322 Loves Park 1.00 19,008 $234,938.88 $12.36 19,008 64 2000323 Lynwood 5.00 5.15 1.00 7,751 $247,135.35 $31.88 $95,802.36 $12.36 1.00 7,751 28 26 97 810029 Lyons 5.00 1.00 9,688 $488,593.87 $50.43 $119,743.68 $12.36 1.00 9,688 35 32 121 1020297 Machesney Park 1.00 19,777 $244,443.72 $12.36 19,777 66 208
Mackinaw 5.00 5.15 1.00 1,421 $45,307.62 $31.88 $17,563.56 $12.36 1,421 5 5 18 15Macomb 1.00 18,843 $232,899.48 $12.36 18,843 63 198Macon 1.00 1,240 $15,326.40 $12.36 1,240 4 13
MACN Macon County 0.90MCPN Macoupin County 2.000148 Madison 5.00 1.00 4,664 $235,219.01 $50.43 $57,647.04 $12.36 4,664 17 16 58 49
MDSN Madison County 0.65Makanda 0.75 318 $2,947.86 $9.27 318 1 3Malta 4.00 4.12 989 $25,226.87 $25.51 989 4 12
0324 Manhattan 0.50 3,177 $19,633.86 $6.18 3,177 11 33Mansfield 2.50 2.58 1,018 $16,229.12 $15.94 1,018 4 13
0325 Manteno 1.00 5,505 $68,041.80 $12.36 5,505 18 58Maple Park 5.00 5.15 1.00 699 $22,287.14 $31.88 $8,639.64 $12.36 699 2 2 9 7
0327 Marengo 5.00 5.15 5,534 $176,447.82 $31.88 5,534 20 69MARN Marion County 1.250329 Markham 1.00 12,823 $158,492.28 $12.36 0.86 12,823 43 135
Maroa 3.00 3.09 1.00 1,600 $30,608.95 $19.13 $19,776.00 $12.36 1,600 6 5 20 17Marshall 1.00 3,328 $41,134.08 $12.36 3,328 11 35
0040 Maryville 4.00 4.12 3,271 $83,434.88 $25.51 3,271 12 41Mascoutah 3.00 3.09 1.00 5,739 $109,790.46 $19.13 $70,934.04 $12.36 5,739 21 19 72 60
MASN Mason County 1.850330 Matteson 1.00 13,025 $160,989.00 $12.36 0.80 13,025 44 137
Maunie 2.00 2.06 153 $1,951.32 $12.75 153 1 20024 Maywood 5.00 5.15 25,743 $820,798.01 $31.88 0.85 25,743 92 3210332 McCook 1.00 283 $3,497.88 $12.36 0.85 283 1 30333 McCullom Lake 1.00 1,069 $13,212.84 $12.36 1,069 4 110334 McHenry 1.00 20,194 $249,597.84 $12.36 20,194 68 212
MCHY McHenry County 0.50MCLN McLean County 1.250336 Melrose Park 5.00 5.15 20,414 $650,886.48 $31.88 2.00 20,414 73 2550131 Merrionette 1.00 2,226 $27,513.36 $12.36 2,226 7 23
Metropolis 1.00 7,094 $87,681.84 $12.36 7,094 24 740338 Midlothian 5.00 1.00 14,873 $750,088.42 $50.43 $183,830.28 $12.36 1.25 14,873 53 50 185 156
Mill Shoals 1.00 240 $2,966.40 $12.36 240 1 3Milledgeville 5.00 5.15 0.25 1,025 $32,681.43 $31.88 $3,167.25 $3.09 1,025 4 3 13 11
0341 Millington 0.75

Page 10 of 16
Municipalities Imposing a Municipal Telecommunications Utility, Excise Tax or Infrastructure Maintenance Fee Prepared by the Civic Federation September 2001
MUT FY 1999/2000 FY 99/00 FY 99/00 FY 99/00 FY 1999/2000 FY 99/00 Population # MUT or MET # of MIMF # MUT or MET # of MIMFTAR MET MUT Rate MIMF Population MET MET Rev MUT MUT Rev MIMF MIMF Rev Surcharge Surcharge Returns Returns Returns ReturnsCode Municipality Rate (%) Rate (%) Charged Rate (%) Revenues / Resident Revenues / Resident Revenues / Resident Rate Purposes (Incl CHI) (Incl CHI) (W/O CHI) (W/O CHI)
for the Largest Incumbent LECs in Illinois
Minier 5.00 5.15 1.00 1,190 $37,942.34 $31.88 $14,708.40 $12.36 1,190 4 4 15 12Minonk 3.50 3.61 2,063 $46,044.14 $22.32 2,063 7 26
0342 Minooka 1.00 3,955 $48,883.80 $12.36 3,955 13 420343 Mokena 1.00 13,199 $163,139.64 $12.36 13,199 44 1390344 Moline 1.00 42,720 $528,019.20 $12.36 42,720 143 4480346 Monee 1.00 2,038 $25,189.68 $12.36 2,038 7 21
Monmouth 0.50 9,569 $59,136.42 $6.18 9,569 32 100Monroe County 1.00
0347 Montgomery 5.00 5.15 1.00 5,945 $189,552.27 $31.88 $73,480.20 $12.36 5,945 21 20 74 62Monticello 0.50 5,186 $32,049.48 $6.18 5,186 17 54Morrison 5.00 5.15 1.00 4,315 $137,580.83 $31.88 $53,333.40 $12.36 4,315 15 14 54 45
0076 Morton Grove 5.00 1.00 22,064 $1,112,751.35 $50.43 $96,084.00 2 $4.35 0.75 22,064 79 74 275 2320132 Mound City 5.00 5.15 726 $23,148.02 $31.88 726 3 90141 Mounds 5.00 5.15 1,290 $41,130.77 $31.88 1,290 5 16
Mount Carmel 5.00 5.15 0.75 7,818 $249,271.60 $31.88 $72,472.86 $9.27 7,818 28 26 97 82Mount Clare 0.25 313 $967.17 $3.09 313 1 3Mount Morris 1.00 2,946 $36,412.56 $12.36 2,946 10 31Mount Olive 5.00 5.15 2,293 $73,110.74 $31.88 2,293 8 29
0349 Mount Prospect 3.30 1.00 53,613 $1,371,240.00 $25.58 N/A N/A $169,158.00 2 $3.16 0.75 53,613 678 645 678 6450350 Mount Vernon 1.00 17,483 $216,089.88 $12.36 17,483 59 184
Mount Zion 3.00 3.09 0.25 4,566 $87,350.28 $19.13 $14,108.94 $3.09 4,566 16 15 57 480352 Mundelein 1.00 28,949 $357,809.64 $12.36 0.50 28,949 97 304
Murphysboro 1.00 8,925 $110,313.00 $12.36 8,925 30 940051 Naperville 5.00 5.15 1.00 122,993 N/A N/A $3,921,548.00 $31.88 $1,425,000.00 1 $11.59 0.50 122,993 1,128 1,164 1,128 1,1640354 Nashville 1.00 3,107 $38,402.52 $12.36 3,107 10 33
Nauvoo 1.00 1,241 $15,338.76 $12.36 1,241 4 130153 New Athens 2.75 2.83 1,955 $34,283.61 $17.54 1,955 7 24
New Berlin 1.00 912 $11,272.32 $12.36 912 3 10New Boston 1.00 659 $8,145.24 $12.36 659 2 7New Haven 5.00 5.15 442 $14,092.87 $31.88 442 2 6
0355 New Lenox 1.00 16,217 $200,442.12 $12.36 16,217 54 170New Millford 3.00 3.09 680 $13,008.80 $19.13 680 2 8New Minden 1.00 183 $2,261.88 $12.36 183 1 2
0053 Newark 5.00 5.15 949 $30,258.22 $31.88 949 3 12Newman 4.00 4.12 1.00 952 $24,283.10 $25.51 $11,766.72 $12.36 952 3 3 12 10
0025 Niles 3.00 1.00 30,004 $907,913.11 $30.26 $60,000.00 2 $2.00 1.00 30,004 107 101 374 315Nilwood 1.00 258 $3,188.88 $12.36 258 1 3Normal 5.00 5.15 1.00 45,623 $1,454,658.27 $31.88 $563,900.28 $12.36 45,623 163 153 569 479Norris City 5.00 5.15 1,294 $41,258.31 $31.88 1,294 5 16
0358 North Aurora 1.00 9,545 $117,976.20 $12.36 9,545 32 1000015 North Chicago 5.00 1.00 36,097 $1,820,476.14 $50.43 $446,158.92 $12.36 0.75 36,097 129 121 450 379

Page 11 of 16
Municipalities Imposing a Municipal Telecommunications Utility, Excise Tax or Infrastructure Maintenance Fee Prepared by the Civic Federation September 2001
MUT FY 1999/2000 FY 99/00 FY 99/00 FY 99/00 FY 1999/2000 FY 99/00 Population # MUT or MET # of MIMF # MUT or MET # of MIMFTAR MET MUT Rate MIMF Population MET MET Rev MUT MUT Rev MIMF MIMF Rev Surcharge Surcharge Returns Returns Returns ReturnsCode Municipality Rate (%) Rate (%) Charged Rate (%) Revenues / Resident Revenues / Resident Revenues / Resident Rate Purposes (Incl CHI) (Incl CHI) (W/O CHI) (W/O CHI)
for the Largest Incumbent LECs in Illinois
0360 North Riverside 5.00 5.15 6,094 $194,303.04 $31.88 1.25 6,094 22 760361 North Utica 5.00 5.15 1.00 833 $26,559.64 $31.88 $10,295.88 $12.36 833 3 3 10 90088 Northbrook 1.00 33,645 $668,866.00 2 $19.88 0.75 33,645 113 3530069 Northfield 5.00 5.15 1.00 5,621 $179,221.75 $31.88 $92,000.00 2 $16.37 2.00 5,621 20 19 70 590147 Northlake 5.00 5.15 1.00 11,674 $372,217.54 $31.88 $144,290.64 $12.36 1.25 11,674 42 39 146 1230370 O'Fallon 1.00 20,091 $248,324.76 $12.36 20,091 67 2110363 Oak Brook 3.00 3.09 1.00 9,779 $187,078.05 $19.13 $570,000.00 1 $58.29 0.50 9,779 35 33 122 1030152 Oak Brook Terrace 5.00 5.15 1.00 2,375 $75,725.26 $31.88 $100,000.00 1 $42.11 0.50 2,375 8 8 30 250365 Oak Forest 1.00 28,866 $356,783.76 $12.36 0.75 28,866 97 3030367 Oak Lawn 1.00 58,002 N/A N/A N/A N/A $335,728.00 3 $5.79 1.00 58,002 N/A N/P N/A N/P0031 Oak Park 5.00 1.00 53,787 $2,712,634.01 $50.43 $664,807.32 $12.36 1.00 53,787 192 180 671 5650369 Oakwood Hills 1.00 2,021 $24,979.56 $12.36 2,021 7 21
Odell 5.00 5.15 1,037 $33,064.04 $31.88 1,037 4 13OGLE Ogle County 1.250371 Oglesby 2.00 2.06 3,703 $47,227.05 $12.75 1.50 3,703 13 460143 Olmsted 5.00 5.15 337 $10,745.02 $31.88 337 1 40061 Olympia Fields 1.00 1.03 1.00 4,820 $30,736.48 $6.38 $59,575.20 $12.36 4,820 17 16 60 51
Oreana 1.00 867 $10,716.12 $12.36 867 3 9Oregon 1.00 4,006 $49,514.16 $12.36 4,006 13 42
0018 Orland Hills 5.00 5.15 1.00 6,673 $212,764.06 $31.88 $82,478.28 $12.36 1.00 6,673 24 22 83 700375 Orland Park 1.00 51,548 $637,133.28 $12.36 1.00 51,548 173 5410376 Oswego 1.00 11,885 $146,898.60 $12.36 11,885 40 125
Ottawa 0.580378 Palatine 1.00 53,768 $460,000.00 2 $8.56 0.75 53,768 180 5640108 Palos Heights 5.00 12,130 $611,750.99 $50.43 0.75 12,130 43 1510379 Palos Hills 4.00 1.00 18,774 $757,461.71 $40.35 $232,046.64 $12.36 0.75 18,774 67 63 234 1970106 Palos Park 5.00 5.15 4,822 $153,746.18 $31.88 0.75 4,822 17 60
Paris 5.00 5.15 1.00 9,095 $289,987.88 $31.88 $112,414.20 $12.36 9,095 33 31 113 95Park City 0.75
0103 Park Forest 5.00 24,443 $1,232,731.20 $50.43 0.75 24,443 87 3050037 Park Ridge 5.00 1.00 37,866 $1,909,691.92 $50.43 $371,640.00 2 $9.81 1.00 37,866 135 127 472 398
Pawnee 1.00 2,218 $27,414.48 $12.36 2,218 7 230381 Payson 1.00 1,170 $14,461.20 $12.36 1,170 4 12
Pecotonica 5.00 5.15 1.00 1,792 $57,136.70 $31.88 $22,149.12 $12.36 1,792 6 6 22 190064 Peoria 5.00 5.15 1.00 111,127 $3,543,208.68 $31.88 $1,373,529.72 $12.36 111,127 397 373 1386 1167
PEOR Peoria County 0.800382 Peoria Heights 1.00 6,376 $78,807.36 $12.36 6,376 21 670384 Peru 0.65
Pesotum 5.00 5.15 520 $16,579.85 $31.88 520 2 60383 Peotone 5.00 5.15 3,452 $110,064.67 $31.88 3,452 12 430055 Phoenix 5.00 5.15 1.00 2,306 $73,525.24 $31.88 $28,502.16 $12.36 1.25 2,306 8 8 29 24

Page 12 of 16
Municipalities Imposing a Municipal Telecommunications Utility, Excise Tax or Infrastructure Maintenance Fee Prepared by the Civic Federation September 2001
MUT FY 1999/2000 FY 99/00 FY 99/00 FY 99/00 FY 1999/2000 FY 99/00 Population # MUT or MET # of MIMF # MUT or MET # of MIMFTAR MET MUT Rate MIMF Population MET MET Rev MUT MUT Rev MIMF MIMF Rev Surcharge Surcharge Returns Returns Returns ReturnsCode Municipality Rate (%) Rate (%) Charged Rate (%) Revenues / Resident Revenues / Resident Revenues / Resident Rate Purposes (Incl CHI) (Incl CHI) (W/O CHI) (W/O CHI)
for the Largest Incumbent LECs in Illinois
Piatt County 1.95Pinckneyville 1.00 3,578 $44,224.08 $12.36 3,578 12 38
0386 Pingree Grove 1.00 92 $1,137.12 $12.36 92 0 1Piper City 2.00 2.06 1.00 753 $9,603.56 $12.75 $9,307.08 $12.36 753 3 3 9 8Pittsburg 5.00 5.15 637 $20,310.31 $31.88 637 2 8
0387 Plainfield 4.00 10,695 $431,503.83 $40.35 10,695 38 133Plano 0.50Pontiac 0.50 11,521 $71,199.78 $6.18 11,521 39 121
0125 Pontoon Beach 5.00 5.15 5,042 $160,760.73 $31.88 5,042 18 630390 Posen 5.00 5.15 4,410 $140,609.85 $31.88 0.75 4,410 16 550391 Prarie Grove 1.00 882 $10,901.52 $12.36 882 3 9
Princeton 5.00 5.00 1.00 7,531 $240,120.80 $31.88 $93,083.16 $12.36 7,531 27 25 94 79Prophetstown 1.00 1,919 $23,718.84 $12.36 1,919 6 20
0392 Prospect Heights 5.00 1.00 15,708 $792,199.88 $50.43 $194,150.88 $12.36 0.75 15,708 56 53 196 165Pulaski 5.00 5.15 349 $11,127.63 $31.88 349 1 4Pulaski County 3.00Raleigh 5.00 5.15 317 $10,107.33 $31.88 317 1 4
RAND Randolph County 0.98Rankin 5.00 5.15 582 $18,556.67 $31.88 582 2 7Rantoul 5.00 5.00 0.50 13,894 $443,000.72 $31.88 $85,864.92 $6.18 13,894 50 47 173 146Rapids City 5.00 5.15 1.00 994 $31,693.01 $31.88 $12,285.84 $12.36 994 4 3 12 10Richmond 0.25 1,096 $3,386.64 $3.09 1,096 4 12
0102 Richton Park 5.00 1.00 11,871 $598,688.87 $50.43 $146,725.56 $12.36 0.70 11,871 42 40 148 125Richview 1.00 340 $4,202.40 $12.36 340 1 4Ridgway 5.00 5.15 1,056 $33,669.84 $31.88 1,056 4 13
0115 River Forest 5.00 1.00 12,051 $607,766.79 $50.43 $148,950.36 $12.36 1.00 12,051 43 40 150 1270396 River Grove 5.00 1.00 9,635 $485,920.92 $50.43 $119,088.60 $12.36 1.00 9,635 34 32 120 1010395 Riverdale 5.00 5.15 1.00 13,014 $414,942.52 $31.88 $160,853.04 $12.36 1.25 13,014 47 44 162 1370105 Riverside 5.00 1.00 8,312 $419,198.21 $50.43 $102,736.32 $12.36 1.50 8,312 30 28 104 870397 Riverton 1.00 3,029 $37,438.44 $12.36 3,029 10 320398 Riverwoods 5.00 1.00 3,949 $199,159.49 $50.43 $48,809.64 $12.36 3,949 14 13 49 41
Roanoke 1.00 1,910 $23,607.60 $12.36 1,910 6 200014 Robbins 5.00 5.15 1.00 7,272 $231,862.77 $31.88 $89,881.92 $12.36 1.25 7,272 26 24 91 76
Robinson 0.50 6,338 $39,168.84 $6.18 6,338 21 67Rochelle 1.00 9,307 $115,034.52 $12.36 9,307 31 98
0080 Rochester 5.00 5.15 1.00 2,813 $89,690.59 $31.88 $34,768.68 $12.36 2,813 10 9 35 300399 Rock Falls 1.00 9,356 $115,640.16 $12.36 9,356 31 980162 Rock Island 5.00 5.15 1.00 38,389 $1,224,007.11 $31.88 $474,488.04 $12.36 38,389 137 129 479 403RKIS Rock Island County 0.650112 Rockdale 5.00 5.15 1,869 $59,591.79 $31.88 1,869 7 230400 Rockford 1.00 143,831 $1,777,751.16 $12.36 143,831 482 1510

Page 13 of 16
Municipalities Imposing a Municipal Telecommunications Utility, Excise Tax or Infrastructure Maintenance Fee Prepared by the Civic Federation September 2001
MUT FY 1999/2000 FY 99/00 FY 99/00 FY 99/00 FY 1999/2000 FY 99/00 Population # MUT or MET # of MIMF # MUT or MET # of MIMFTAR MET MUT Rate MIMF Population MET MET Rev MUT MUT Rev MIMF MIMF Rev Surcharge Surcharge Returns Returns Returns ReturnsCode Municipality Rate (%) Rate (%) Charged Rate (%) Revenues / Resident Revenues / Resident Revenues / Resident Rate Purposes (Incl CHI) (Incl CHI) (W/O CHI) (W/O CHI)
for the Largest Incumbent LECs in Illinois
Rockton 0.75 3,390 $31,425.30 $9.27 3,390 11 360401 Rolling Meadows 1.00 23,279 $400,000.00 2 $17.18 0.75 23,279 78 2440117 Romeoville 5.00 5.15 21,763 $693,898.43 $31.88 21,763 78 271
Roodhouse 5.00 5.15 1.00 2,465 $78,594.85 $31.88 $30,467.40 $12.36 2,465 9 8 31 26Roscoe 1.00 2,519 $31,134.84 $12.36 2,519 8 26
0154 Roselle 5.00 1.00 24,121 $1,216,491.81 $50.43 $225,551.00 2 $9.35 0.50 24,121 86 81 301 2530020 Rosemont 5.00 1.00 3,899 $196,637.85 $50.43 $48,191.64 $12.36 1.65 3,899 14 13 49 410402 Round Lake 5.00 5.15 5,304 $169,114.43 $31.88 0.75 5,304 19 660026 Round Lake Beach 4.00 4.12 1.00 23,655 $603,378.85 $25.51 $292,375.80 $12.36 0.75 23,655 85 79 295 2480130 Round Lake Heights 3.00 3.09 1,420 $27,165.44 $19.13 0.75 1,420 5 180403 Round Lake Park 5.00 5.15 1.00 4,926 $157,062.15 $31.88 $60,885.36 $12.36 0.75 4,926 18 17 61 520404 Roxana 1.00 1,558 $19,256.88 $12.36 1,558 5 16
Royalton 5.00 5.15 1,237 $39,440.90 $31.88 1,237 4 15Rutland 5.00 5.15 410 $13,072.57 $31.88 410 1 5Sadorus 4.00 4.12 435 $11,095.74 $25.51 435 2 5
0406 St. Charles 3.00 1.00 27,957 $845,971.43 $30.26 $215,153.00 2 $7.70 27,957 100 94 349 294St. Elmo 1.00 1.03 1,372 $8,749.06 $6.38 1,372 5 17
0409 Salem 1.00 7,644 $94,479.84 $12.36 7,644 26 80Sangamon County 0.75
0410 San Jose 1.00 686 $8,478.96 $12.36 686 2 7Sandoval 5.00 5.15 1,644 $52,417.82 $31.88 1,644 6 21Sandwich 4.00 4.12 1.00 6,146 $156,768.82 $25.51 $75,964.56 $12.36 6,146 22 21 77 65
0412 Sauk Village 5.00 5.15 11,031 $351,715.92 $31.88 1.00 11,031 39 138St. Charles 0.50
STCL St Clair County 0.650414 Schaumburg 3.00 1.00 75,242 $6,300,000.00 5 $83.73 N/A N/A $2,100,000.00 1 $27.91 75,242 648 580 648 5800127 Schiller Park 5.00 1.00 10,936 $551,534.12 $50.43 $135,168.96 $12.36 1.00 10,936 39 37 136 1150415 Seneca 5.00 5.15 0.75 2,508 $79,965.87 $31.88 $23,249.16 $9.27 2.00 2,508 9 8 31 26
Shabbona 5.00 5.15 1.00 1,029 $32,808.96 $31.88 $12,718.44 $12.36 1,029 4 3 13 11Shannon 2.00 2.06 936 $11,937.49 $12.75 936 3 12Shawneetown 5.00 5.15 1,505 $47,985.90 $31.88 1,505 5 19Sheffield 1.00 946 $11,692.56 $12.36 946 3 10Sheldon 1.00 1,083 $13,385.88 $12.36 1,083 4 11Sheridan 1.00 2,444 $30,207.84 $12.36 2,444 8 26
0416 Shiloh 1.00 5,762 $71,218.32 $12.36 5,762 19 600060 Shorewood 4.00 4.12 8,473 $216,124.67 $25.51 8,473 30 1060017 Silvis 5.00 5.15 6,934 $221,085.87 $31.88 6,934 25 860085 Skokie 2.00 2.06 1.00 58,573 $747,024.08 $12.75 $563,802.00 1 $9.63 58,573 209 196 730 6150050 Sleepy Hollow 5.00 5.15 1.00 3,673 $117,111.10 $31.88 $45,398.28 $12.36 0.65 3,673 13 12 46 390418 Smithton 5.00 5.15 1,976 $63,003.41 $31.88 1,976 7 25
Somonauk 5.00 5.15 1.00 1,388 $44,255.43 $31.88 $17,155.68 $12.36 1,388 5 5 17 15

Page 14 of 16
Municipalities Imposing a Municipal Telecommunications Utility, Excise Tax or Infrastructure Maintenance Fee Prepared by the Civic Federation September 2001
MUT FY 1999/2000 FY 99/00 FY 99/00 FY 99/00 FY 1999/2000 FY 99/00 Population # MUT or MET # of MIMF # MUT or MET # of MIMFTAR MET MUT Rate MIMF Population MET MET Rev MUT MUT Rev MIMF MIMF Rev Surcharge Surcharge Returns Returns Returns ReturnsCode Municipality Rate (%) Rate (%) Charged Rate (%) Revenues / Resident Revenues / Resident Revenues / Resident Rate Purposes (Incl CHI) (Incl CHI) (W/O CHI) (W/O CHI)
for the Largest Incumbent LECs in Illinois
Sorento 1.00 586 $7,242.96 $12.36 586 2 60419 South Barrington 1.00 4,426 $54,705.36 $12.36 2.00 4,426 15 460421 South Chicago Heights 4.00 4.12 1.00 3,793 $96,749.78 $25.51 $46,881.48 $12.36 1.25 3,793 14 13 47 400422 South Elgin 1.00 1.03 1.00 15,737 $100,352.70 $6.38 $194,509.32 $12.36 0.68 15,737 56 53 196 1650423 South Holland 3.00 3.09 1.00 21,862 $418,232.98 $19.13 $270,214.32 $12.36 0.95 21,862 78 73 273 230
South Jacksonville 1.00 3,358 $41,504.88 $12.36 3,358 11 350092 South Roxana 5.00 5.15 1.00 1,883 $60,038.17 $31.88 $23,273.88 $12.36 1,883 7 6 23 200009 Southern View 5.00 5.15 1.00 1,881 $59,974.40 $31.88 $23,249.16 $12.36 1,881 7 6 23 200425 Spaulding 1.00 479 $5,920.44 $12.36 479 2 5
Spring Grove 5.00 5.15 3,626 $115,612.54 $31.88 3,626 13 45Spring Valley 1.00 5,233 $64,679.88 $12.36 5,233 18 55
0427 Springfield 1.00 117,876 $1,456,947.36 $12.36 117,876 395 1238Stanford 5.00 5.15 1.00 639 $20,374.08 $31.88 $7,898.04 $12.36 639 2 2 8 7Steeleville 5.00 5.15 1.00 1,975 $62,971.53 $31.88 $24,411.00 $12.36 1,975 7 7 25 21
0428 Steger 1.00 10,210 $126,195.60 $12.36 0.76 10,210 34 1070429 Sterling 1.00 14,793 $182,841.48 $12.36 14,793 50 155
Stickney 1.25Stillman Valley 1.00 1,012 $12,508.32 $12.36 1,012 3 11Stockton 1.00 1,738 $21,481.68 $12.36 1,738 6 18
0072 Stone Park 5.00 5.15 1.00 4,335 $138,218.52 $31.88 $53,580.60 $12.36 1.25 4,335 16 15 54 460046 Streamwood 4.00 1.00 35,746 $1,442,219.35 $40.35 $142,959.00 2 $4.00 0.55 35,746 128 120 446 375
Streator 1.00 14,265 $176,315.40 $12.36 14,265 48 1500431 Sugar Grove 5.00 5.15 1.00 3,497 $111,499.46 $31.88 $43,222.92 $12.36 3,497 13 12 44 370432 Summit 5.00 5.15 1.00 9,594 $305,898.15 $31.88 $118,581.84 $12.36 1.00 9,594 34 32 120 1010434 Swansea 1.00 9,539 $117,902.04 $12.36 9,539 32 100
Tazewell County 0.800439 Third Lake 1.00 1,516 $18,737.76 $12.36 1,516 5 160111 Thornton 4.00 4.12 1.00 2,691 $68,640.56 $25.51 $33,260.76 $12.36 1.25 2,691 10 9 34 28
Tilden 0.25 914 $2,824.26 $3.09 914 3 100440 Tilton 3.50 3.61 2,653 $59,212.37 $22.32 2,653 9 330441 Tinley Park 1.00 47,929 $592,402.44 $12.36 0.75 47,929 161 503
Tiskilwa 1.00 825 $10,197.00 $12.36 825 3 9Towanda 5.00 5.00 1.00 526 $16,771.15 $31.88 $6,501.36 $12.36 526 2 2 7 6
0138 Union 5.00 5.15 1.00 531 $16,930.57 $31.88 $6,563.16 $12.36 531 2 2 7 6UNIN Union County 2.500096 University Park 5.00 5.15 1.00 6,741 $214,932.19 $31.88 $83,318.76 $12.36 6,741 24 23 84 710016 Urbana 5.00 36,744 $1,853,106.22 $50.43 36,744 131 458
Valier 5.00 5.15 1.00 684 $21,808.87 $31.88 $8,454.24 $12.36 684 2 2 9 70134 Venice 5.00 5.15 1.00 3,504 $111,722.65 $31.88 $43,309.44 $12.36 3,504 13 12 44 37
VRML Vermillion County 0.75Vermont 5.00 5.15 813 $25,921.95 $31.88 813 3 10

Page 15 of 16
Municipalities Imposing a Municipal Telecommunications Utility, Excise Tax or Infrastructure Maintenance Fee Prepared by the Civic Federation September 2001
MUT FY 1999/2000 FY 99/00 FY 99/00 FY 99/00 FY 1999/2000 FY 99/00 Population # MUT or MET # of MIMF # MUT or MET # of MIMFTAR MET MUT Rate MIMF Population MET MET Rev MUT MUT Rev MIMF MIMF Rev Surcharge Surcharge Returns Returns Returns ReturnsCode Municipality Rate (%) Rate (%) Charged Rate (%) Revenues / Resident Revenues / Resident Revenues / Resident Rate Purposes (Incl CHI) (Incl CHI) (W/O CHI) (W/O CHI)
for the Largest Incumbent LECs in Illinois
Vernon Hills 0.75Versailles 3.00 3.09 519 $9,928.78 $19.13 519 2 6Villa Grove 5.00 5.00 1.00 2,766 $88,192.03 $31.88 $34,187.76 $12.36 2,766 10 9 34 29
0054 Villa Park 5.00 1.00 21,870 $1,102,967.37 $50.43 $160,000.00 1 $7.32 0.50 21,870 78 73 273 2300489 Virgil 1.00 346 $4,276.56 $12.36 346 1 40448 Wadsworth 1.00 3,071 $37,957.56 $12.36 3,071 10 32
Wapella 5.00 5.15 1.00 692 $22,063.95 $31.88 $8,553.12 $12.36 692 2 2 9 7Warren 5.00 5.15 1.00 1,443 $46,009.07 $31.88 $17,835.48 $12.36 1,443 5 5 18 15
0451 Warrenville 1.00 13,614 $120,000.00 1 $8.81 0.50 13,614 46 143Washburn 1.00 1,011 $12,495.96 $12.36 1,011 3 11
0133 Washington Park 5.00 5.15 6,755 $215,378.57 $31.88 6,755 24 840453 Wauconda 5.00 9,122 $460,048.85 $50.43 9,122 33 1140151 Waukegan 5.00 1.00 76,425 $1,551,526.00 $20.30 N/A N/A $503,268.00 3 $6.59 76,425 1,260 1,300 1,260 1,300
Waverly 1.00 1,264 $15,623.04 $12.36 1,264 4 130454 Wayne 5.00 5.15 1,977 $63,035.30 $31.88 1,977 7 25
Wayne City 1.00 1,167 $14,424.12 $12.36 1,167 4 12Waynesville 1.00 550 $6,798.00 $12.36 550 2 6Wenona 5.00 5.15 960 $30,608.95 $31.88 960 3 12
0455 Westchester 5.00 1.00 17,606 $887,921.51 $50.43 $217,610.16 $12.36 17,606 63 59 220 185Westfield 5.00 5.15 717 $22,861.06 $31.88 717 3 9
0456 West Chicago 5.00 5.15 1.00 18,729 $597,161.40 $31.88 $111,260.00 1 $5.94 18,729 67 63 234 1970457 West Dundee 0.50 4,956 $30,628.08 $6.18 4,956 17 52
West Frankfort 1.00 8,160 $100,857.60 $12.36 8,160 27 860473 West Peoria 1.00 5,519 $68,214.84 $12.36 5,519 19 580136 Western Springs 5.00 1.00 12,482 $629,503.37 $50.43 $154,277.52 $12.36 12,482 45 42 156 1310063 Westmont 5.00 1.00 23,482 $1,184,265.19 $50.43 $249,000.00 1 $10.60 23,482 84 79 293 2470041 Wheaton 3.60 1.00 56,225 $1,527,487.00 $27.17 N/A N/A $424,000.00 1 $7.54 56,225 1,081 998 1,081 998
White City 1.00 239 $2,954.04 $12.36 239 1 3Whiteside County 0.75
0459 Wheeling 5.00 1.00 30,262 $1,526,200.21 $50.43 $527,355.00 2 $17.43 30,262 108 101 377 318WILL Will County 0.75
Willisville 5.00 5.15 575 $18,333.48 $31.88 575 2 70460 Willowbrook 3.00 1.00 9,629 $291,371.00 $30.26 $91,000.00 1 $9.45 9,629 34 32 120 1010109 Willow Springs 5.00 5.15 1.00 5,017 $159,963.63 $31.88 $62,010.12 $12.36 5,017 18 17 63 530039 Wilmette 5.00 1.00 26,345 $1,328,654.56 $50.43 $56,529.00 2 $2.15 26,345 94 88 329 2770461 Wilmington 5.00 5.15 1.00 5,512 $175,746.36 $31.88 $68,128.32 $12.36 5,512 20 18 69 580056 Winfield 5.00 1.00 8,674 $437,454.91 $50.43 $56,000.00 1 $6.46 0.50 8,674 31 29 108 91
Winnebago 1.00 2,651 $32,766.36 $12.36 2,651 9 28WINB Winnegago County 0.500462 Winnetka 5.00 1.00 11,662 $588,148.40 $50.43 $220,255.00 2 $18.89 11,662 42 39 145 1220021 Winthrop Harbor 5.00 5.15 7,282 $232,181.61 $31.88 1.00 7,282 26 91

Page 16 of 16
Municipalities Imposing a Municipal Telecommunications Utility, Excise Tax or Infrastructure Maintenance Fee Prepared by the Civic Federation September 2001
MUT FY 1999/2000 FY 99/00 FY 99/00 FY 99/00 FY 1999/2000 FY 99/00 Population # MUT or MET # of MIMF # MUT or MET # of MIMFTAR MET MUT Rate MIMF Population MET MET Rev MUT MUT Rev MIMF MIMF Rev Surcharge Surcharge Returns Returns Returns ReturnsCode Municipality Rate (%) Rate (%) Charged Rate (%) Revenues / Resident Revenues / Resident Revenues / Resident Rate Purposes (Incl CHI) (Incl CHI) (W/O CHI) (W/O CHI)
for the Largest Incumbent LECs in Illinois
Wonder Lake 1.00 1,293 $15,981.48 $12.36 1,293 4 140463 Wood Dale 5.00 1.00 13,859 $698,949.46 $50.43 $240,000.00 1 $17.32 0.50 13,859 50 46 173 145
WDFD Woodford County 1.000464 Wood River 1.00 10,894 $134,649.84 $12.36 10,894 37 1140059 Woodridge 5.00 1.00 29,836 $1,504,715.79 $50.43 $166,000.00 1 $5.56 0.50 29,836 107 100 372 3130465 Woodstock 5.00 1.00 18,289 $922,367.18 $50.43 $226,052.04 $12.36 18,289 65 61 228 1920466 Worth 1.00 11,157 $137,900.52 $12.36 0.75 11,157 37 1170062 Yorkville 5.00 5.15 6,226 $198,511.77 $31.88 6,226 22 78
Zeigler 5.00 5.15 1,636 $52,162.75 $31.88 1,636 6 200001 Zion 5.00 5.15 22,840 $728,237.84 $31.88 0.75 22,840 82 285
Averages 4.53 4.50 4.63 0.97 16,500 $2,294,557 $45.44 $230,847 $28.67 $292,373 $11.97 $1.01 XX 53 52 147 134
Wgtd Avg by Pop 4.76 4.40 4.54 1.34 XX XX XX XX XX XX XX $1.03 XX XX XX XX XX
Totals XX XX XX XX 9,157,551 $215,688,394 XX $59,558,415 XX $116,364,642 XX XX XX 18,592 20,589 51,550 53,062
Survey Totals XX XX XX XX 3,575,910 $138,458,424 XX $3,921,548 XX $62,674,621 XX XX XX 11,383 10,933 11,383 10,933
Survey Averages 4.27 6 5.00 5.15 1.09 325,083 $19,779,775 $39.07 $3,921,548 $31.88 $5,697,693 $10.87 XX XX 1,897 1,562 1,897 1,562
Survey Wgtd Avgs 4.90 5.00 5.15 1.78 XX XX $50.43 (1) $3,921,548 $31.88 XX XX XX XX 0.0035756 0.0033539 0.0035756 0.0033539
Surv Avg w/o CHI 4.15 5.00 5.15 1.00 77,686 $2,976,404 $38.40 $3,921,548 $31.88 $787,462 $12.36 4 XX XX 959 806 959 806
SuWgt Avg w/o CHI 4.31 5.00 5.15 1.00 XX XX $3,921,548 $31.88 XX XX XX XX 0.012471 0.010498 0.012471 0.010498
Population of municipalities not listed or not taxed 2,970,819
Total Illinois Population 12,128,370
Footnote 1: MIMF Revenues According to DuPage Mayors and ManagersFootnote 2: MIMF Revenues According to NWMC MembersFootnote 3: MIMF Revenues Accroding to Original Survey Reported AmountsFootnote 4: MIMF Average Per Resident Amount Includes Survey Reported Amounts, along with amounts reported by the DuPage Managers/Mayors and NWMC.Footnote 5: Schaumburg increased its rate from 1% to 3% effective June 2000 and the adjusted revenues are reflected for greater accuracyFootnote 6: Please note that the survey average for municipal utility and excise tax, when including Naperville, is 4.36%.