CITY OF VIRGINIA
163
— Fiscal Year Ended June 30, 2011 — C I T Y O F A L E X A N D R I A V I R G I N I A CITY OF VIRGINIA
Transcript of CITY OF VIRGINIA

— Fiscal Year Ended June 30, 2011 —
CIT
Y OF ALEXANDR
IA
V
I R G I N I A
CITY OF
VIRGINIA

WILLIAM B. HURD TRANSIT FACILITY
Alexandria Transit Company’s, William B. Hurd Transit Facility, a 160,000 square foot state-of-the-art building was completed and put into use during FY 2011. The new facility can house 90 buses with an expansion capability of 130 buses. The facility includes 10 maintenance bays, two service lanes, bus washer, operations and dispatch areas, and administrative offices. The construction was designed to achieve the U.S. Green Building Council’s Leadership in Energy and Environmental Design (LEED) Silver rating. The new facility was named after the late Mr. William B. Hurd, who was the former Chairman of the ATC board for 22 years. Mr. Hurd was instrumental in the start-up of the bus system in 1984.

CITY OF ALEXANDRIA, VIRGINIA
COMPREHENSIVE ANNUAL FINANCIAL REPORT FOR THE FISCAL YEAR
JULY 1, 2010 TO JUNE 30, 2011
Alexandria City Council William D. Euille, Mayor Kerry Donley Vice-Mayor
Redella S. Pepper Rob Krupicka
Paul C. Smedberg Frank H. Fannon IV
Alicia R. Hughes
Acting City Manager ............................................................................................................. Bruce Johnson Acting Chief Financial Officer .................................................................................. Laura B. Triggs, CPA Acting Director of Finance ...................................................................................................... Debbie Kidd Director of Real Estate Assessments ....................................................................... Thaddeus J. Jankowski City Attorney ........................................................................................................................ James L. Banks City Clerk and Clerk of Council ............................................................................... Jacqueline Henderson Independent Auditors ............................................................................................................... KPMG LLP
Prepared by the Department of Finance Raymond J. Welch, Jr. Comptroller
alexandriava.gov

CITY OF ALEXANDRIA, VIRGINIA Comprehensive Annual Financial Report
For Fiscal Year Ended June 30, 2011
The preparation of this report has been accomplished by the efficient and dedicated services of the staff of the Department of Finance – Accounting Division.
Raymond J. Welch, Jr. Comptroller
Berenice Harris CPA, Sikander Javed –Financial Reporting Supervisors
Carmen Fraser CPA, Paul Sood, Robert Snyder – Accountants II
The entire staff of the Accounting division
It is also appropriate to specially acknowledge the contribution of the following people who provided assistance in the publication of this document
- Matthew Pelkofski,
-General Services Division Mail Room staff
-Office of Communications Electronic Publishing Staff

1
CITY OF ALEXANDRIA, VIRGINIA Comprehensive Annual Financial Report for the Fiscal Year Ended June 30, 2011
TABLE OF CONTENTS
Description Page
Part I Introductory Section Principal Officials ..................................................................................................................................................... Title Page Organizational Chart ................................................................................................................................................. 4 Finance Department's Transmittal Letter .................................................................................................................. 5 Certificate of Achievement for Excellence in Financial Reporting .......................................................................... 13
Part II - Financial Section
Exhibits
Independent Auditors’ Report............................................................................................................................... 17
Management’s Discussion and Analysis ............................................................................................................... 21
Basic Financial Statements
Government-wide Financial Statements Exhibit I Statement of Net Assets .................................................................................................................................. 33 Exhibit II Statement of Activities .................................................................................................................................... 34 Fund Financial Statements Governmental Funds Financial Statements Exhibit III Balance Sheet ............................................................................................................................................ 35 Exhibit IV Statement of Revenues, Expenditures and Changes in Fund Balances ...................................................... 36 Proprietary Funds Financial Statements Exhibit V Statement of Net Assets ............................................................................................................................ 37 Exhibit VI Statement of Revenues, Expenses and Changes in Fund Net Assets ......................................................... 38 Exhibit VII Statement of Cash Flows ........................................................................................................................... 39 Fiduciary Fund Financial Statements Exhibit VIII Statement of Fiduciary Net Assets ............................................................................................................ 40 Exhibit IX Statement of Changes in Fiduciary Net Assets .......................................................................................... 41 Component Units Financial Statements Exhibit X Statement of Net Assets ............................................................................................................................ 42 Exhibit XI Statement of Activities .............................................................................................................................. 43 Exhibit XII Notes to Financial Statements Summary of Significant Accounting Policies ............................................................................................ 44 Financial Reporting Entity .................................................................................................................... 44 Government-wide and Fund Financial Statements ................................................................................ 46 Basis of Accounting .............................................................................................................................. 49 Budgets and Budgetary Accounting ...................................................................................................... 50 Equity in Pooled Cash and Investments ................................................................................................ 50 Allowance for Uncollectible Accounts .................................................................................................. 51 Inventory of Supplies and Prepaid and Other Assets ............................................................................. 51 Capital Assets ........................................................................................................................................ 52 Compensated Absences ......................................................................................................................... 52 Use of Estimates .................................................................................................................................... 53 Fund Balance ......................................................................................................................................... 53 Short Term Liabilities ........................................................................................................................... 56 Legal Compliance – Budgets ..................................................................................................................... 56 Deposits and Investments .......................................................................................................................... 56 Receivables ............................................................................................................................................... 60 Capital Assets ............................................................................................................................................ 63 Risk Management ...................................................................................................................................... 67 Operating Leases ....................................................................................................................................... 70 Commitments and Contingencies .............................................................................................................. 71 Long-Term Debt ........................................................................................................................................ 75 Interfund Balances and Component Unit Transactions ............................................................................. 86 Grants ........................................................................................................................................................ 87 Intergovernmental Revenues ..................................................................................................................... 87

2
Due From Other Governments .................................................................................................................. 88 Joint Ventures ............................................................................................................................................ 88 Related Party Transactions ........................................................................................................................ 89 Other Post Employment Benefits .............................................................................................................. 90 Employee Retirement Systems .................................................................................................................. 92 Termination Benefits ................................................................................................................................. 101 Accounting Changes.................................................................................................................................. 101 Subsequent Events ..................................................................................................................................... 101
Required Supplementary Information other than Management’s Discussion and Analysis Budgetary Comparison Schedules
Exhibit XIII General Fund ................................................................................................................................................... 104 Exhibit XIV Special Revenue Fund ..................................................................................................................................... 105 Exhibit XV Notes to Budgetary Comparison Schedules ..... ............................................................................................... 106 Exhibit XVI Public Employee Retirement Systems- Primary Government ...................................................................... 107 Other Supplementary Information Statements/Schedules Combining and Individual Fund Statements and Schedules Combining Statement of Changes in Assets and Liabilities – Agency Funds ...................................................... 113 Statement of Cash Flows – Component Unit – Alexandria Transit Company ..................................................... 114 Combining Balance Sheet- Special Revenue Fund .............................................................................................. 116 Combining Schedule of Revenues, Expenditures and Changes in Fund Balance - Special Revenue Fund ......... 117
Part III - Statistical Section Tables Table I Statement of Changes in Net Assets - Last Ten Fiscal Years ................................................................................... 122 Table II Changes in Fund Balances, Governmental Funds - Last Ten Fiscal Years ............................................................... 124 Table III Tax Revenues by Source-Last Ten Fiscal Years ....................................................................................................... 125 Table IV Real Estate Tax Levies and Collections-Last Ten Calendar Years ........................................................................... 126 Table V Personal Property Tax Levies and Collections-Last Ten Calendar Years ................................................................. 126 Table VI Real and Personal Property Assessments and Tax Rates –Last Ten Calendar Years ................................................ 127 Table VII Net Assets - Last Ten Fiscal Years ........................... ............................................................................................... 128 Table VIII Fund Balances, Governmental Funds - Last Ten Fiscal Years ................................................................................. 129 Table IX 2011 Tax Rates for Major Revenue Sources ............................................................................................................. 130 Table X Legal Debt Margin Information - Last Ten Fiscal Years .......................................................................................... 131 Table XI Ratio of Net General Debt to Assessed Value and Net Debt Per Capita-Last Ten Fiscal Years ............................... 132 Table XII Overlapping Debt and Debt History ......................................................................................................................... 133 Table XIII Ratio of Annual Debt Service Expenditures for Net General Debt to Total General Expenditures-Last
Ten Fiscal Years .................................................................................................................................................. 133 Table XIV Demographic Statistics ............................................................................................................................................. 134 Table XV Principal Taxpayers - Current Year and Nine Years Ago ........................................................................................ 135 Table XVI Alexandria City School Board Demographic Statistics-Last Ten Fiscal Years ........................................................ 137 Table XVII General Fund-City Departments’ Expenditures Detail by Function ......................................................................... 138 Table XVIII City Government Employees By Function - Last Ten Fiscal Years .......................................................................... 139 Table XIX Principal Employers - Current Year and Nine Years Ago ........................................................................................ 139 Table XX Operating and Capital Indicators - Last Ten Fiscal Years ........................................................................................ 140 Table XXI Miscellaneous Statistical Data .................................................................................................................................. 142 Table XXII Five Year Summary of General Fund Revenues and Expenditures .......................................................................... 144 Table XXIII Summary of Debt Service ......................................................................................................................................... 145
Part IV-Single Audit Section
Independent Auditors’ Report on Internal Control over Financial Reporting and on Compliance and Other Matters Based on an Audit of Financial Statements Performed in Accordance with Government Auditing Standards .............................................................................................................................................. 148
Independent Auditors’ Report on Compliance with Requirements Applicable to Each Major Program, Internal Control over Compliance and the Schedule of Expenditures of Federal Awards in Accordance with OMB Circular A-133 ................................................................................ 150
Schedule of Expenditures of Federal Awards ......................................................................................................... 152 Notes to Schedule of Expenditures of Federal Awards ........................................................................................... 155 Schedule of Findings and Questioned Costs ........................................................................................................... 156 Schedule of Prior Year Findings and Questioned Costs .......................................................................................... 158

3
INTRODUCTORY SECTION
4
4
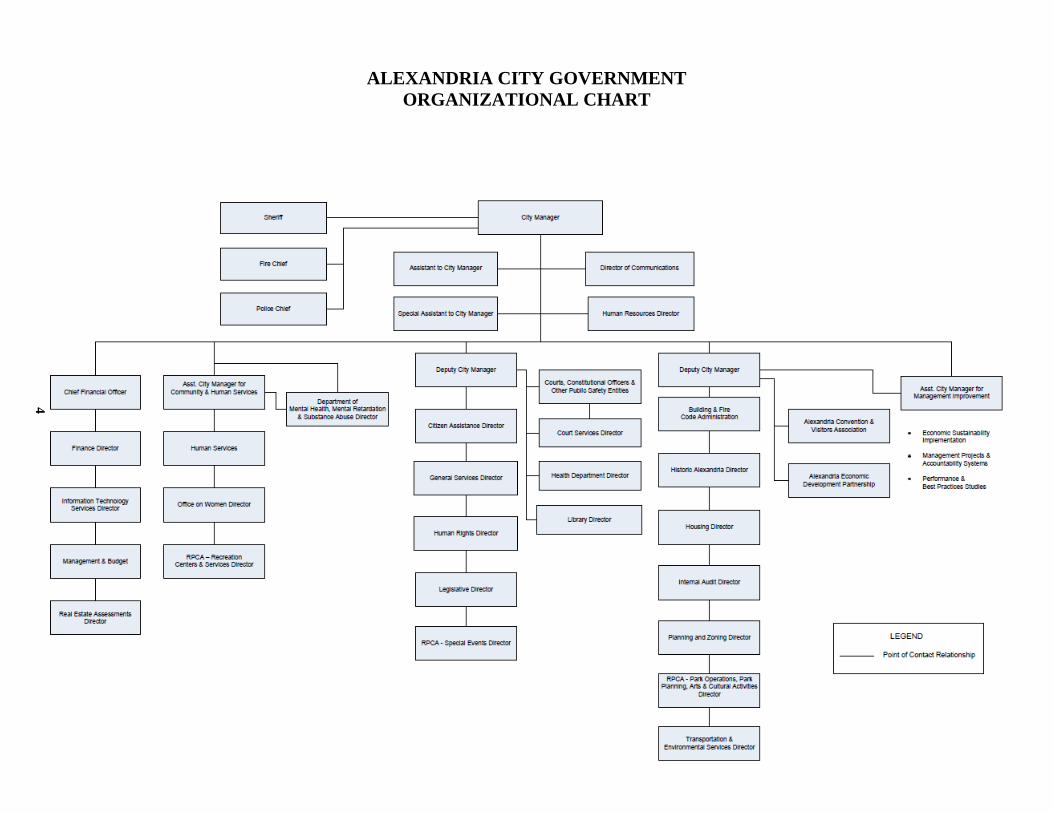
ALEXANDRIA CITY GOVERNMENT ORGANIZATIONAL CHART

5
November 23, 2011
To the Honorable Mayor and Members of City Council, the Residents and Businesses of the City of Alexandria:
We are pleased to present the City of Alexandria's (the City) Comprehensive Annual Financial Report (the CAFR) for the fiscal year ended June 30, 2011. The report is designed to present fairly the financial position of the governmental activities, the aggregate discretely presented component units, each major fund, and the aggregate remaining fund information of the City in all material respects and to demonstrate compliance with applicable finance-related legal and contractual provisions. The report adheres to the principle of full disclosure so that the reader may gain the maximum understanding of the City's financial affairs.
The Finance Department has prepared this report in accordance with the following standards:
● Accounting principles generally accepted in the United States, which are uniform minimum standards and guidelines for financial accounting and reporting in the United States;
● Governmental accounting and financial reporting statements, interpretations and technical
bulletins issued by the Governmental Accounting Standards Board (GASB); and
● Uniform financial reporting standards for counties, cities and towns issued by the Commonwealth of Virginia's Auditor of Public Accounts (APA).
The responsibility for the accuracy, completeness and fairness of the data presented in the report, including
all disclosures, rests with the City. THE CITY
Alexandria, Virginia, which is located on the west bank of the Potomac River across from Washington, D.C., is an integral part of the Washington metropolitan area, serving as a financial, commercial, and transportation center. Alexandria is also one of America's most historic cities. George Washington and George Mason served as two of the City’s first Trustees (the forerunner of the Alexandria City Council).
Alexandria is an independent full-service city with sole local government taxing power within its boundaries. The City is autonomous from any county, town or other political subdivision of the Commonwealth of Virginia. Alexandria, which was founded in 1749, derives its governing authority from a charter granted by the General Assembly of the Commonwealth of Virginia.
The City adopted the Council-Manager form of government in 1922. The governing body of the City is the City Council, which formulates policies for the administration of the City. The City Council is composed of a Mayor and six Council Members elected at-large for three-year terms. The Mayor is elected on a separate ballot. City Council appoints the City Manager who serves as the City's chief executive officer and is responsible for implementing the policies established by City Council. The City Charter was first granted in 1852. The City provides a comprehensive range of municipal services including education, health, welfare, housing and human services programs, public safety and administration of justice, community development, recreation, library, cultural and historic activities, transportation, environmental services, and planning.

6
FINANCIAL REPORTING ENTITY
This report includes the financial activities of the City of Alexandria government (the primary government), as well as the financial activities of the City's component units. Component units are legally separate entities for which the primary government is financially accountable. Discretely presented component units are reported in a separate column in the financial statements to emphasize that they are legally separate from the primary government and to differentiate their financial position, results of operations, and cash flows from those of the primary government. The School Board, the Library System, and the Alexandria Transit Company are reported as discretely presented component units. This report does not include the financial activities of the City’s Deferred Compensation Plan, Alexandria Industrial Development Authority, Alexandria Redevelopment and Housing Authority, Alexandria Economic Development Partnership, Inc., Alexandria Sanitation Authority, or Sheltered Homes of Alexandria because the City Council is not financially accountable for these entities, and therefore, these entities are not component units. LOCAL ECONOMY
The City’s economy, while it has not escaped unscathed from the recent recession, remains relatively strong compared to the national economy. In part, this is due to Alexandria’s geographical location as an inner suburb to Washington, DC. It is also due to the mix of jobs in the City of Alexandria. For example, of Alexandria’s total number of positions, almost half are in recession resistant fields, including 18 percent of City positions in professional and technical services fields, 16 percent in the public sector, while another seven percent are in Health Care and five percent are in education. These are all well-paying fields that have been relatively unaffected by the downturn in the economy. One of the City’s largest employers is the U.S. Patent and Trademark Office (PTO), which, when located in Alexandria in the middle of the decade, added more than 6,000 jobs to the City’s economy with plans to add 1,000 more. The PTO is fee supported, which means it is not dependent on federal appropriation. The number of positions in Public Administration and also in Health Care has actually increased since the recession began in 2007. On the other hand, the City’s construction and manufacturing sectors, which have not fared well, respectively employ only 3.3 percent and 1.4 percent of the total.
One measure of the local economy is how economically sensitive City revenues fared. During FY 2011, the City started to see the beginning of a recovery of these taxes. FY 2011 collections from the transient lodging tax increased by 4.0 percent compared to FY 2010 and the meals tax increased by 9.0 percent, and revenues from the sales tax increased by 5.0 percent. By Spring 2010, most revenue sources turned positive compared to one year earlier, as the City’s economy began to recover.
Real estate assessments, which generate over half of the City’s General Fund revenues, showed some signs of recovery. After four years of declines, the residential market increased by 1.2 percent and the FY 2011 total assessments increased by 2.6 percent of value compared to 2010, while locally assessed commercial assessments increased by 4.3 percent. The office vacancy rate of 13.0 percent in the 2nd quarter, 2011, while higher than one year earlier, appears to have peaked during the 1st quarter. The City’s unemployment rate of 4.8 percent in June 2011 was about the same as a year earlier, and a little over half the national unemployment rate.
MAJOR INITIATIVES
Strong fiscal management remains a hallmark of Alexandria's City government and has enabled the City to respond to revenue declines, address priority needs, including public safety, public education, and modernization of heavily used recreation and library facilities. Alexandria is among a select group of cities in the United States to hold the top AAA/Aaa bond ratings from two of Wall Street's major credit rating agencies (Standard & Poor’s and Moody’s Investors Service).
During the past fiscal year, the City made progress in a number of important areas, including adding to the investing in affordable housing projects and providing the Transit Authority with a new state of the art facility.

7
FINANCIAL CONDITION The City government continues to be in very sound financial condition as demonstrated by the financial
statements and schedules included in this report. Within the context of a fiscally prudent budget and careful management, the City has continued to provide a wide range of services, has achieved many of its program goals, and enhanced the quality of life in the City. The City's cash and investment position was strong throughout a very difficult fiscal year.
The national economic recession and declining local economy continued to exert pressure on maintaining services at existing levels. Keeping existing programs funded and salaries of public employees competitive, and addressing the expanding program needs of the community have required careful budgeting. The City Council has adopted a Strategic Plan to ensure that City resources remain focused on City priorities. The seven goals of the Strategic Plan are:
1. Alexandria has quality development and redevelopment support for local businesses and a strong,
diverse and growing local economy. 2. Alexandria respects, protects and enhances the health of its citizens and the quality of its natural
environment. 3. A multimodal transportation network that supports sustainable land use and provides internal
mobility and regional connectivity for Alexandrians. 4. Alexandria is a community that supports and enhances the well-being, success and achievement of
children, youth and families. 5. Alexandria is financially sustainable, efficient, community oriented and values its employees. 6. The City protects the safety and security of its residents, businesses, employees and visitors. 7. Alexandria is a caring and inclusive community that values its rich diversity, history and culture,
and promotes affordability. Capital investment and the resulting debt service costs are planned to increase in the Approved FY 2012-
2021 Capital Improvement Budget. The need for increased operating and capital support to fund the new Public Safety Center is the City’s major near term capital challenge. During fiscal year FY 2012, revenues are budgeted to grow by about 6.5 percent over FY 2011 with revenues budgeted reflecting a higher real estate tax base and an increase in the City real estate tax rate (from 97.8¢ to 99.8¢). While the City believes, in general, that the overall state of most of its infrastructure of streets, bridges, and many public facilities is good, it plans on an increased capital improvement program aimed at maintaining and improving the City's infrastructure. The type of development in the City will also influence future expenditure and revenue levels.
Over the last five years, the City has been able to maintain its fiscal strength as the result of the City
Council's adoption of, and subsequent adherence to, the series of financial policies listed on page 10. These policies are aimed at (1) limiting debt and annual debt service requirements and (2) maintaining an appropriate General Fund fund balance so as to retain the City’s AAA/Aaa bond ratings and to keep the City on firm financial footing. When City Council initially adopted the financial policies in 1987, the City's general obligation debt as a percentage of the real estate tax base was 1.4 percent. Because of the City use of "pay-as-you-go" financing for many capital projects, the City has maintained superior debt ratios since their implementation in 1987. At the end of FY 2011, the City’s debt to tax base ratio was just 1.27 percent with that projected to decrease to 1.47 percent in FY 2013 (excluding self-supported sewer project related debt). The City’s financial policies encourage the use of surplus General Fund revenues and resources derived from spending less than the full budget to fund capital projects.
Additional information on the City’s financial status can be found in the Management’s Discussion and
Analysis section of this report.
GENERAL GOVERNMENT FUNCTIONS The following table shows that the overall real property assessed value has increased by over $16 billion since 2002. This includes a 2.6 percent increase from calendar year 2010 to 2011. Real property taxes, which are based on assessments as of January 1 of each year, are due in two payments. The first half of the real estate tax is due on June 15 and the second half of the tax is due on November 15.

8
-$2.5-$2.0-$1.5-$1.0-$0.5$0.0$0.5$1.0$1.5$2.0$2.5$3.0$3.5$4.0$4.5$5.0$5.5$6.0
2002 2003 2004 2005 2006 2007 2008 2009 2010 2011 Average
Change in Total Tax Base Tax Year 2002-2011
Appreciation/Depreciation (All Properties) New Growth (All Properties)
CHANGE IN ASSESSED VALUE OF REAL PROPERTY (Amounts in thousands of dollars) Residential Residential Commercial1 Commercial Total Total % Assessed % Increase Assessed % Increase Assessed Increase Year Value (Decrease) Value (Decrease) Value (Decrease) 2002 $ 8,889,290 17.4 $ 7,243,699 2.6 $ 16,132,989 10.3 2003 11,191,850 25.9 8,034,076 10.9 19,225,926 19.2 2004 13,245,349 18.3 8,644,147 7.6 21,889,496 13.9 2005 16,272,324 22.9 11,087,327 28.3 27,359,651 25.0 2006 20,331,756 24.9 12,574,963 13.4 32,906,719 20.3 2007 20,205,364 (0.6) 14,037,667 11.6 34,243,031 4.1 2008 20,139,614 (0.3) 14,963,203 6.6 35,102,817 2.5 2009 19,152,518 (4.9) 14,811,680 (1.0) 33,964,198 (3.2) 2010 18,203,922 (5.0) 13,615,344 (8.1) 31,819,266 (6.3) 2011 18,430,732 1.2 14,201,220 4.3 32,631,952 2.6 _____________________________ 1. Includes apartment buildings. This chart displays the increases and decreases in assessed values for the last ten years as appreciation and depreciation of existing properties and new properties. (Each of the bars in the chart is comprised of single year snapshot and is not cumulative.) The Fund balance financial policies for the General Fund are one component of the City’s overall financial strength and stability. At the end of FY 2011, the City’s General Fund fund balance was $80.9 million and include a non-spendable fund balance of $5.5 million, a number of commitments totaling $16.1 million, and an assigned total of $30.0 million, including $19.1 million assigned for future capital funding, leaving a remaining unassigned fund balance of $29.2 million. At the end of FY 2011 the City’s ending General Fund fund balance condition was consistent with the City’s established financial policies.

9
$- $10 $20 $30 $40 $50 $60 $70 $80 $90
$100
City of Alexandria General Fund - Fund Balance (in millions)
Reserved(Nonspendable)
Designated(Committed/Assigned)
Undesignated(Unassigned)
CAPITAL FINANCING AND DEBT MANAGEMENT In conjunction with the annual operating budget preparation, the City Manager annually prepares a six-year
Capital Improvement Plan to provide for the financing of improvements to the City's public facilities. This has been changed to a ten-year Capital Improvement Plan. The first year of the program constitutes the capital budget for the current fiscal year; the remaining nine years serve as a planning guide. The City accounts for capital improvement expenditures in the Capital Projects Fund and finances the projects from the General Fund (including appropriations of Committed Fund Balance), general obligation debt, the sale of surplus property, and intergovernmental grant revenues. The City's Capital Improvement Plan for FY 2012 through FY 2021 represents $1.074 billion of City-funded public improvements to the City's schools, public buildings, parks, and transportation systems. In addition, state and federal grants and other committed sources, such as prior year City funds, will provide $21.8 million in additional planned capital funding for the FY 2012-FY 2021 time period.
To continue a strategy of improving and then maintaining the City's creditworthiness, the City Council
established the following key target and ceiling ratios as of June 30 of each year:
Ceiling 2002 2003 2004 2005 2006 2007 2008 2009 2010 2011 Target Debt as a Percentage of Fair Market Value
1.6%
0.95%
0.75%
0.90%
0.88%
0.90%
0.85%
0.73% 1.12%
1.15% 1.27%
1.1%
Debt Per Capita as a Percentage of Per Capita Income1
4.5%
2.2%
2.0%
2.7%
3.1%
3.4%
2.9% 2.6% 3.7%
3.4% 3.8%
3.2% Debt Service as a Percentage of General Governmental Expenditures2
10.0%
3.5%
3.6%
3.6%
4.2%
4.3%
4.5%
4.4%
4.4%
4.9%
5.3%
8.0% General Fund Balance as a Percentage of General Fund Revenue:
Unreserved
Assigned/Unassigned3
10% (floor)
17.6% 14.4% 14.6% 13.3% 13.2% 13.4% 12.0% 9.3% 11.1% - 10.9%
N/A
Undesignated
Unassigned3 4% (floor)
6.8% 7.3% 6.9% 5.9% 5.6% 5.2% 5.2% 4.7% 5.3% - 5.3%
5.5%
Net Assets as a Percentage of General Revenue
4% (floor)
32.2%
19.8%
18.4%
14.5%
17.7%
19.0%
12.6%
9.4%
11.8%
11.7%
5.5%
1 Per capita information from the U.S. Bureau of Economic Analysis, as revised 2 Data includes School Board and Library component units. 3 The City has updated these policies in FY 2011 to reflect new terminology per GASB 54.

10
The adopted financial policies include the following:
• The City will increase its reliance on current revenue to finance its capital improvements. • The City will consider a designation for pay-as-you-go capital a priority when additional General Fund
resources become available at the end of a fiscal year. • The City will not use General Fund equity to finance current operations for periods of longer than two
years. • The City will annually prepare a six-year Capital Improvement Plan. • The City will not issue tax or revenue anticipation notes to fund governmental operations. • The City will not issue bond anticipation notes for a term of longer than two years.
The City's General Obligation Bonds have the top available ratings which were reaffirmed in July 2011 as follows:
Moody's Investors Service Standard & Poor's
Aaa AAA BUDGETARY ACCOUNTING AND INTERNAL CONTROLS
The City Charter requires the City Manager to submit a balanced budget to City Council no later than the first regular meeting in April of each year. The School Board prepares the Schools' budget and transmits it to the City Manager. The City Manager then submits his recommendation to City Council for consideration. If Council does not adopt a budget before June 27, the budget submitted by the City Manager for the upcoming fiscal year has full force and effect as if Council had adopted it.
As a management tool, budgetary control is maintained in the General Fund at the character level (i.e., personnel, non-personnel, capital outlays) and by the encumbrance of estimated purchase amounts before the release of purchase orders to vendors. Management can transfer appropriations at the department appropriation level without approval from City Council. The City follows a similar procedure with the Special Revenue Fund, but the level of control is at the grant or program level. In the Capital Projects Fund, the level of control is at the project level. With the Schools' budget, the level of control is at the total appropriation level.
City management is responsible for establishing and maintaining internal controls designed to ensure that the assets of the City are protected from loss, theft or misuse. Internal controls are intended to provide reasonable, but not absolute, assurance that these objectives are met. In addition to the examination of controls implemented by members of the Finance Department, the City's Internal Audit staff continually reviews and assesses the soundness and adequacy of the City's financial systems.
REPORT FORMAT
The City's Finance Department has prepared this Comprehensive Annual Financial Report in an effort to
present all the information necessary to meet the needs of the many persons and groups that have an interest in the City's financial affairs. The objective of this report is to present financial information on a comparative basis with other governmental entities in Virginia and in accordance with established reporting standards. We believe the data is accurate in all material respects and is reported in a manner designed to present fairly the City's financial position and results of operations.
This Comprehensive Annual Financial Report is presented in four sections: introductory, financial, statistical, and single audit. The introductory section includes a list of principal officials, the City's organizational chart, and this transmittal letter. The financial section includes the management’s discussion and analysis (MDA), basic, fund, and component unit financial statements, notes to financial statements, budgetary comparison schedules, required supplementary information for public employee retirement systems, and other supplementary information, as well as the independent auditors' report. The statistical section includes selected financial and demographic information, generally presented on a multi-year basis. The single audit section contains information on the City and School programs that are financed by federal grants. This information is required by the Single Audit Act Amendments of 1996 and by the Auditor of Public Accounts of the Commonwealth of Virginia.

11
INDEPENDENT AUDIT
Section 5.18 of the City Charter requires an annual audit of the accounting and financial records of the City by independent certified public accountants. This section requires the auditors to examine the funds of the City in accordance with auditing standards generally accepted in the United States of America and the standards set forth in the Government Accountability Office's Government Auditing Standards. In addition, the auditors must conduct the compliance examinations required by the Single Audit Act Amendments of 1996, the related U.S. Office of Management and Budget's Circular A-133, and the Specifications for Audit of Counties, Cities and Towns issued by the Auditor of Public Accounts of the Commonwealth of Virginia.
The Alexandria City Council has selected the firm of KPMG LLP to perform these audit services. Their reports are presented in the Financial Section and the Single Audit Section of this report. CERTIFICATE OF ACHIEVEMENT FOR EXCELLENCE IN FINANCIAL REPORTING
The Government Finance Officers Association of the United States and Canada (GFOA) awarded the City of Alexandria a Certificate of Achievement for Excellence in Financial Reporting for the City's Comprehensive Annual Financial Report (CAFR) for the 33rd consecutive year in 2010. The GFOA awards a Certificate to governmental units that exemplify excellence in financial reporting and conform to stringent reporting requirements promulgated by that Association and various authoritative bodies.
To earn a Certificate of Achievement, a CAFR must tell its financial story clearly, thoroughly, and understandably. The report must be efficiently organized, employ certain standardized terminology and formatting conventions, minimize ambiguities and potentials for misleading inference, enhance understanding of current generally accepted accounting theory, and demonstrate a constructive "spirit of full disclosure."
A Certificate is valid for a period of one year only. The City believes our current report continues to conform to the Certificate of Achievement Program requirements and standards. We are submitting it to GFOA to determine its eligibility for another certificate for FY 2011.
REPORTING REQUIREMENTS
As required by the U.S. Securities and Exchange Commission Rule 15c2-12, the City has agreed for the benefit of the owners of City general obligation bonds and joint enterprise waste-to-energy-revenue bonds, to provide each nationally recognized municipal securities information repository and to any appropriate state information depositor, if any is hereafter created, certain financial information not later than 270 days after the end of each of its fiscal years, commencing with the fiscal year ended June 30, 1996. The City is currently in compliance with the new arrangement to file this information through the Electronic Municipal Market Access (EMMA) website which is the comprehensive source for official statements, continuing disclosure documents, advance refunding documents and real time trade price information on all municipal securities This CAFR provides the 15c2-12 general bond obligation bond information, which includes the “Debt Statement” found in Note 9 of Notes to the Financial Statements, a “Five Year Summary of General Fund Revenues and Expenditures” found in Table XXII, a summary of debt found in Table XXIII (Summary of Total General Obligation Bonds Debt Service), and “Tax Revenues by Source” found in Table III.

12
ACKNOWLEDGMENTS
We would like to express our appreciation to everyone in the City who assisted with and contributed to the preparation of this report. Special recognition is extended to the Accounting Division for their dedicated pursuit of excellence and leadership in financial reporting. Respectfully submitted,
Laura B. Triggs, CPA Raymond J. Welch, Jr. Acting Chief Financial Officer Comptroller

13

14

15
FINANCIAL SECTION

16

17
INDEPENDENT AUDITORS' REPORT

18

KPMG LLP 2001 M Street, NW Washington, DC 20036-3389
KPMG LLP is a Delaware limited liability partnership, the U.S. member firm of KPMG International Cooperative (“KPMG International”), a Swiss entity.
Independent Auditors’ Report
The Honorable Mayor and Members of the City Council City of Alexandria, Virginia: We have audited the accompanying financial statements of the governmental activities, the aggregate discretely presented component units, each major fund, and the aggregate remaining fund information of the City of Alexandria, Virginia (the City), as of and for the year ended June 30, 2011, which collectively comprise the City’s basic financial statements identified in Exhibits I through XI in the Financial Section of the accompanying table of contents. These financial statements are the responsibility of the City’s management. Our responsibility is to express opinions on these financial statements based on our audit.
We conducted our audit in accordance with auditing standards generally accepted in the United States of America; the standards applicable to financial audits contained in Government Auditing Standards, issued by the Comptroller General of the United States; and the Specification for Audits for Counties, Cities, and Towns, issued by the Auditor of Public Accounts of the Commonwealth of Virginia (Specifications). Those standards require that we plan and perform the audit to obtain reasonable assurance about whether the financial statements are free of material misstatement. An audit includes consideration of internal control over financial reporting as a basis for designing audit procedures that are appropriate in the circumstances, but not for the purpose of expressing an opinion on the effectiveness of the City ’s internal control over financial reporting. Accordingly, we express no such opinion. An audit also includes examining, on a test basis, evidence supporting the amounts and disclosures in the financial statements, assessing the accounting principles used and significant estimates made by management, as well as evaluating the overall financial statement presentation. We believe that our audit provides a reasonable basis for our opinions.
In our opinion, the financial statements referred to above present fairly, in all material respects, the respective financial position of the governmental activities, the aggregate discretely presented component units, each major fund, and the aggregate remaining fund information of the City of Alexandria, as of June 30, 2011, and the respective changes in financial position, and where applicable, cash flows thereof for the year then ended in conformity with U.S. generally accepted accounting principles.
As discussed in Note 19, the City adopted GASB Statement No. 54, Fund Balance Reporting and Governmental Fund Type Definitions, effective July 1, 2010.
In accordance with Government Auditing Standards, we have also issued our report dated November 23, 2011 on our consideration of the City's internal control over financial reporting

and on our tests of its compliance with certain provisions of laws, regulations, contracts, and grant agreements and other matters. The purpose of that report is to describe the scope of our testing of internal control over financial reporting and compliance and the results of that testing, and not to provide an opinion on the internal control over financial reporting or on compliance. That report is an integral part of an audit performed in accordance with Government Auditing Standards and should be considered in assessing the results of our audit.
The accompanying management’s discussion and analysis, the budgetary comparison schedules, and the schedules of funding progress and employer contributions on pages 21 through 30, 104 through 106, and 107 through 109, respectively, are not a required part of the basic financial statements but are supplementary information required by U.S. generally accepted accounting principles. We have applied certain limited procedures, which consisted principally of inquiries of management regarding the methods of measurement and presentation of the required supplementary information. However, we did not audit the information and express no opinion on it.
Our audit was conducted for the purpose of forming opinions on the financial statements that collectively comprise the City’s basic financial statements. The information identified as schedules 1, 2, 3, and 4 in the Financial Section of the accompanying table of contents, is presented for purposes of additional analysis and is not a required part of the basic financial statements. The accompanying schedule of expenditures of federal awards is presented for purposes of additional analysis as required by U.S. Office of Management and Budget Circular A-133, Audits of States, Local Governments, and Non-Profit Organizations, and is not a required part of the basic financial statements. The schedule of expenditures of federal awards has been subjected to the auditing procedures applied in the audit of the basic financial statements and, in our opinion, is fairly stated in all material respects in relation to the basic financial statements taken as a whole.
The information identified as the Introductory and Statistical Sections in the accompanying table of contents has not been subjected to the auditing procedures applied in the audit of the basic financial statements and, accordingly, we express no opinion on them.
November 23, 2011
21
MANAGEMENT’S DISCUSSION AND ANALYSIS

22

23
MANAGEMENT’S DISCUSSION AND ANALYSIS
The following discussion and analysis of the City of Alexandria’s financial performance provides an overview
of the City’s financial activities for the fiscal year ended June 30, 2011. Please read it in conjunction with the transmittal letter at the front of this report and the City’s financial statements, which follow this section. FINANCIAL HIGHLIGHTS FOR FY 2011
The General Fund, on a current financial resource basis, reported revenues and other financing sources in excess of expenditures and other financing uses by $17.7 million (Exhibit IV) after making a budgeted $5.5 million transfer to the capital projects fund and a $35.1 million transfer to the special revenue fund.
On a government-wide basis for governmental activities, the City’s general revenues of $505.2 million were
$16.8 million more than the $488.4 million of expenses net of program revenue (Exhibit II). The City’s total net assets, excluding component units, on the government-wide basis, totaled $394.4 million at
June 30, 2011. Of this amount, $59.1 million is unrestricted (Exhibit I).
USING THE FINANCIAL SECTION OF THIS COMPREHENSIVE ANNUAL FINANCIAL REPORT This Comprehensive Annual Financial Report consists of four sections: introductory, financial, statistical, and single audit. As the following chart shows, the financial section of this report has four components - management’s discussion and analysis (this section), the basic financial statements, the required supplementary information and the other supplementary information.
Components of the Financial Section
Component Unit Financial Statements
Fund Financial Statements
Government-Wide Financial
Statements
Independent
Auditor’s Report
Required Supplementary
Information
Basic Financial Statements
Management’s Discussion and
Analysis
Notes to the
Financial Statements
Other Supplementary
Information
Summary Detail

24
GOVERNMENT-WIDE STATEMENTS The government-wide statements report information about the City as a whole using accounting methods similar to those used by private-sector companies. The government-wide financial statements provide both long-term and short-term information about the City’s overall financial status. The Statement of Net Assets and the Statement of Activities, which are the government-wide statements, report information about the City as a whole and about its activities in a way that helps answer this question. These statements include all assets and liabilities using the accrual basis of accounting. All of the current year’s revenues and expenses are taken into account regardless of when cash is received or paid. These two statements report the City’s net assets and changes in those assets. The City’s net assets position - the difference between assets and liabilities - is one way to measure the City’s financial health, or financial position. Over time, increases or decreases in the City’s net assets are one indicator of whether its financial health is improving or deteriorating. Other nonfinancial factors need to be considered, however, such as changes in the City’s property tax base and the condition of the City’s infrastructure, to assess the overall health of the City. The Statement of Net Assets and the Statement of Activities include the following: Governmental activities - Most of the City’s basic services are reported here: Police, Fire, Transportation and
Environmental Services, Recreation, Parks and Cultural Activities Departments, and general administration. Property taxes, other local taxes, and state and federal grants finance most of these activities.
Component units - The City includes three separate legal entities in its report - the City of Alexandria School
Board, the Alexandria Library, and the Alexandria Transit Company. Although legally separate, these “component units” are important because the City is financially accountable for them, and provides operating and capital funding to them. The Alexandria Transit Company component unit is also a proprietary fund.
FUND FINANCIAL STATEMENTS The fund financial statements provide additional information about the City’s most significant funds - not the City as a whole. The fund financial statements focus on the individual parts of the City government. The City has three kinds of funds: Governmental funds - Most of the City’s basic services are included in governmental funds, which focus on (1)
how cash and other financial assets that can readily be converted to cash flow in and out and (2) the balances left at year end that are available for spending. Consequently, the governmental funds statements provide a detailed short-term view that helps the reader determine whether there are more or fewer financial resources that can be spent in the near future to finance the City’s programs. Because this information does not encompass the additional long-term focus of the government-wide statements, additional information is provided at the bottom of the governmental funds statements that explains the relationship (or differences) between them.
Proprietary funds - Services for which the City charges customers or City users a fee are generally reported in
proprietary funds. Proprietary funds, like the government-wide statements, provide both long- and short-term financial information.
The City uses an internal service fund (one kind of proprietary fund) to report activities that provide supplies
and services for the City’s other programs and activities. The Equipment Replacement Reserve Fund is the City’s only internal service fund. Its primary purpose is to provide for the accumulation of money to replace capital equipment used in City operations. The Transit Company component unit is considered an enterprise fund since fees are charged to fund the operations.
Fiduciary funds - The City is the trustee, or fiduciary, for its employees’ pension plans and employee benefit
trusts. It is also responsible for other assets (known as agency funds) that - because of a trust arrangement - can be used only for the trust beneficiaries. The City is responsible for ensuring that the assets reported in these funds are used for their intended purposes. All of the City’s fiduciary activities are reported in a separate statement of fiduciary net assets and a statement of changes in fiduciary net assets. Agency funds are City custodial funds used to provide accountability of client monies for which the City is custodian. The City excludes pension plans and agency funds from the City’s government-wide financial statements because the City cannot use these assets to finance its operations.

25
FINANCIAL ANALYSIS OF THE CITY AS A WHOLE Statement of Net Assets: The following table presents the condensed Statement of Net Assets:
Table 1
Summary of Net Assets As of June 30, 2011 and 2010
(In millions)
2011 2010 2011 2010
Current and other assets $ 452 $ 426 $ 66 $ 59
Capital assets 694 639 15 21
Total Assets $ 1,146 $ 1,065 $ 81 $ 80
Other Liabilities $ 269 $ 286 $ 34 $ 33
Long-term liabilities 483 401 11 11
Total Liabilities $ 752 $ 687 $ 45 $ 44
Net Assets:Invested in Capital assets, net of related debt $ 335 $ 320 $ 14 $ 21Unrestricted 59 57 22 15
$ 394 $ 377 $ 36 $ 36
Primary GovernmentGovernmental
ActivitiesComponent
Units
Amounts may not add due to rounding The City’s net assets, (which is the City’s bottom line) increased five percent, or $17 million, to $394 million. The increase is primarily attributable to a planned increase in General Fund balance to support future transportation needs. Component units net assets decreased by $0.1 million. The City’s capital assets increased $55 million mainly due to various Sanitary Sewer and School projects completed during the year and the DASH bus system parking lot transferred to the City from DASH. Long-term liabilities increased by $82 million with the issue of the new FY 2011 general obligation bond series.

26
Statement of Activities
The following chart shows the revenue and expenses of the governmental activities:
Table 2 Changes in Net Assets
For the Fiscal Years Ended June 30, 2011 and 2010 (In millions)
Total
2011 2010 2011 2010
RevenuesProgram revenues:Charges for services $ 51 $ 44 $ 7 $ 5 Operating grants and contributions 65 65 22 44 Capital grant/contributions 7 50
General revenues:Property taxes 353 337 Other taxes 118 114 Other 35 33 29 2 Payment to/from City - 178 182
$ 629 $ 643 $ 236 $ 233 Total Revenues
Expenses General Government $ 59 $ 61 $ $ Judicial Administration 20 19 Public Safety 122 118 Public Works 51 57 Library 6 6 6 7 Health and Welfare 93 91 Transit 16 13 14 13 Culture and Recreation 28 26 Community Development 25 21 Education 175 173 216 210 Interest on Long-term Debt 17 16
Total Expenses $ 612 $ 601 $ 236 $ 230 Change in Net assets $ 17 $ 42 $ - $ 3 Net Assets beginning of Year $ 377 $ 336 $ 36 $ 33 Net Assets end of Year $ 394 $ 377 $ 36 $ 36
Primary GovernmentGovernmental Component
Activities Units
Amounts may not add due to rounding
REVENUES For the fiscal year ended June 30, 2011 revenues from governmental activities totaled $629 million. Real estate tax revenues, the City’s largest revenue source, reflecting the recognition of the taxes associated with the last half of calendar year 2010 and the first half of calendar year 2011 real property tax billings, were $316 million. The increase in tax revenues is primarily attributable to an increase in the City’s assessed real property tax base in calendar year 2011 and a tax rate increase of 2.0¢ to support transportation.

27
In addition:
• Charges for services increased in the special revenue fund.
• The decrease in capital contributions reflects the addition of the Monroe Avenue bridge in FY 2010.
Component units’ nets assets remained the same as last year.
General Government
Judicial Administration
Public Safety
Public WorksLibrary
Health and WelfareTransit Culture and Recreation
Community Development
Education
Interest on Long-term Debt
Net Expenses for Governmental Activities
EXPENSES
For the fiscal year ended June 30, 2011, expenses for governmental activities totaled $612 million reflecting an increase of $11 million due to spending on the completion of the public safety center.
Education continues to be one of the City’s highest priorities. Capital funding included $2.2 million in addition
to the City’s operating subsidy to the Schools of $167.9 million. FINANCIAL ANALYSIS OF THE CITY’S FUNDS For the fiscal year ended June 30, 2011, the governmental funds reflect a combined fund balance of $171 million (Exhibit III). The Governmental fund balance increase of $19 million is primarily due to a planned surplus in the General Fund for transportation. In addition, these other changes in fund balance should be noted: • The General Fund contributed $5.5 million to pay-as-you-go financing of capital projects.
• The City contributed $167.9 million to the schools for operations.

28
• The sewer funds contributed $5.0 million to pay-as-you go capital projects.
• The City spent $93.8 million in the Capital Projects Fund primarily to fund the new Public Safety facility and school projects.
Except for non-spendable and restricted fund balances (Exhibit III), there are no significant limitations on fund balances that would affect the availability of fund resources for future uses. GENERAL FUND BUDGETARY HIGHLIGHTS
Table 3
Orginal Budget
Amended Budget Actual
Revenues, Transfers, and Other Financial SourcesTaxes 330$ 330$ 350$ Other Local Taxes 116 116 118 Transfers and Other 80 82 82 Total 526$ 527$ 550$
Expenditures, Transfers, and Other Financial UsesExpenditures 310$ 316$ 309$ Transfers and Other 222 224 223 Total 532$ 540$ 532$ Change in Fund Balance (6)$ (13)$ 18$
FY 2011
General Fund Budget(in millions)
Amounts may not add due to rounding
Expenditures and other financing uses exceeded revenue and other financing sources by $18 million in the General Fund for FY 2011.
Actual General Fund revenues and other financial sources were above the original budget by $14
million and the amended budget by $13 million during FY 2011. This is primarily due to an increase in the tax rate and tax base for real estate taxes to support school and transportation projects. As a result of supplemental appropriations actual General Fund expenditures and transfers were equal to the original budget, while General Fund expenditures were less than the amended budget by $8 million primarily as a result of fiscal restraint by all City departments.
During FY 2011, City Council amended the budget three times. These budget amendments, or supplemental appropriation ordinances, were primarily for the following purposes:
• To reappropriate monies to pay for commitments in the form of encumbrances established prior to June 30, 2010 but not paid by that date. Encumbrances for General Fund obligations for purchase orders authorized and issued, but for which goods and services were not received or paid by June 30, 2010, totaled $1.8 million.
• To reappropriate monies ($0.8 million) to pay for projects budgeted for FY 2010 but not completed before the end of the fiscal year.

29
• To reappropriate grant, donation and other revenues authorized in FY 2010 or earlier, but not expended or encumbered as of June 30, 2010.
• To appropriate grants, donations, and other revenues accepted or adjusted in FY 2011.
CAPITAL ASSETS At the end of FY 2011, the City’s governmental activities had invested cumulatively $694.1 million (see Note 5) in a variety of capital assets and infrastructure, as reflected in the following schedule, which represents a net increase of $54.8 million.
Balance Net Additions/ Balance 30-Jun-10 Deletions 30-Jun-11
Non-Depreciable Assets Land and Land Improvements 92.0$ 6.7$ 98.7$ Construction in Progress 90.2 28.0 118.2
Other Capital Assets Buildings 431.2 9.1 440.3 Infrastructure 186.4 20.2 206.6 Intangible Assets 11.3 - 11.3 Furniture and Other Equipment 57.1 11.5 68.6 Accumulated Depreciation on other Capital Assets (228.9) (20.7) (249.6)
Totals 639.3$ 54.8$ 694.1$
Table 4Governmental ActivitiesChange in Capital Assets
(In millions)
Amounts may not add due to rounding
The FY 2011 increase in buildings reflects the completion of renovation work on Minnie Howard school. The increase in infrastructure reflects the completion of various sanitary sewer projects around the City.
The FY 2012- FY 2021 Approved Capital Improvement Program (CIP), which was approved by City Council in May 2011, sets forth a ten-year program with $1.2 billion in new City funding and $22 million in other non- City sources for public improvements for the City and the Alexandria Public Schools.
For the purpose of comparison the first six years funding totals $795 million as compared with $438 million in
the FY 2011-FY 2016 CIP. This represents (in City funding) an increase of approximately $357 million above the FY 2011-2016 CIP. The CIP also provides an increased capital investment in quality of life initiatives, including open space acquisition, Potomac Yard Metrorail station, funding affordable housing initiatives and improvement in the storm water infrastructure, to enhance the quality of life in Alexandria.
LONG-TERM DEBT At the end of FY 2011, the City had $415.7 million in outstanding general obligation bonds, an increase of $51.2 million, or 14.1 percent, over last year. More detailed information about the City’s long-term liabilities is presented in Note 9 to the financial statements.
During 2011, Moody’s Investors Services, Inc. and Standard & Poor’s (S&P) credit rating agencies reaffirmed the City’s triple-A bond ratings. The City received its first triple-A rating from Moody’s in 1986 and from S&P in 1992. Standard and Poor’s Financial Management Assessment concluded that the City’s financial practices were “strong.”

30
The Commonwealth of Virginia limits the amount of general obligation debt the City can issue to ten percent of
the assessed value of real property within the City. The City’s outstanding debt is significantly below, or less than one-tenth of this state law limit - which would equate to $3.3 billion for the City.
On July 14, 2011 the City Council issued $69.95 million in General Obligation bonds. The bonds were issued with an original issue premium of $4.5 million and a true interest cost of 3.18 percent. The $69.95 million in bonds will be used to finance certain capital improvement projects including transportation improvements, sanitary sewers, public school facilities and other infrastructure costs. On July 28, 2011, Moody’s put the City and several surrounding jurisdictions Aaa on credit watch due to the City’s proximity to Washington, D.C.
The City did not issue any short-term debt or have any short-term debt outstanding during FY 2011. Other short
term liabilities represent unclaimed money and deposits. ECONOMIC FACTORS
The number of jobs in the City decreased in FY 2011; as of June 2011, the number of Alexandria jobs totalled 93,628 (the latest data available from the Virginia Employment Commission). Tourism improved, with lodging and restaurant food tax showing an increase of 4.0 and 9.0 percent respectively in FY 2011.
As of 2009 (the latest data available from the U.S. Bureau of Economic Analysis), the City's major per capita income of $70,846 remains one of the highest in the United States, and is the second highest of any major jurisdiction in Virginia. The City's office vacancy rate stood at 13.0 percent by the end of FY 2011, compared to the office vacancy rate in Northern Virginia (12.7 percent), as well as the Washington, DC metropolitan area (11.5 percent).
OTHER INFORMATION The following regulations came into force during FY 2011.
GASB Statement No. 54, Fund Balance Reporting and Governmental Fund Type Definitions. This statement enhances the usefulness of fund balance information by providing clearer fund balance classifications that can be more consistently applied and by clarifying the existing governmental fund type definitions. CONTACTING THE CITY’S FINANCIAL MANAGEMENT This financial report is designed to provide our citizens, taxpayers, customers, and investors and creditors with a general overview of the City’s finances and to demonstrate the City’s accountability for the money it receives. Questions concerning this report or requests for additional financial information should be directed to Laura Triggs, Acting Chief Financial Officer, City Hall, P.O. Box 178, Alexandria, VA 22313, [email protected], telephone (703) 746-3900, or visit the City’s web site at alexandriava.gov.

31
BASIC FINANCIAL STATEMENTS

32

CITY OF ALEXANDRIA, VIRGINIA Statement of Net Assets
As of June 30, 2011
33
Primary GovernmentGovernmental Component
Activities UnitsASSETSCash and Cash Equivalents 127,714,414$ 44,146,726$ Cash and Investments with Fiscal Agents 67,210,915 2,797,414 Receivables, Net 208,976,631 579,820 Due From Other Governments 40,807,904 9,995,156 Inventory of Supplies 1,909,288 737,827 Prepaid and Other Assets 5,696,735 8,608,755 Capital Assets Land and Construction in Progress 216,910,211 999,381 Other Capital Assets, Net 477,157,892 13,524,829 Capital Assets, Net 694,068,103 14,524,210 Total Assets 1,146,383,990$ 81,389,908$
LIABILITIESAccounts Payable 12,410,004$ 4,640,808$ Accrued Wages 12,581,271 29,046,337Accrued Liabilities 3,714,793 - Deferred Revenue 228,844,577 357,123Other Short-term Liabilit ies 8,956,300 419,255Deposits 1,832,011 - Long-term Liabilit ies Due Within One Year 29,405,962 1,255,919 Long-term Liabilit ies Due in More Than One Year 454,192,116 9,388,699 Total Liabilit ies 751,937,034$ 45,108,141$
NET ASSETSInvested in Capital Assets, Net of Related Debt 335,368,020$ 14,524,210$ Unrestricted Net Assets 59,078,936 21,757,557 TO TAL NET ASSETS 394,446,956$ 36,281,767$
See Accompanying Notes to Financial Statements
Exhibit I

CITY OF ALEXANDRIA, VIRGINIA Statement of Activities
For the Fiscal Year Ended June 30, 2011
Exhibit II
Net (Expense) Revenue andP ro g ra m R e v e nue s Changes in Net Assets
Ope ra t ing Primary GovernmentC ha rg e s fo r Gra nts a nd C a pita l Gra nts & Governmental Component
Functio ns /P ro grams Expe ns e s S e rv ic e s C o ntribut io ns C o ntribut io ns Activities Total UnitsP rim a ry Go v e rnm e nt:
Go vernmenta l Activities :
Genera l Go vernment 59,207,496$ 1,314,411$ 673,503$ 784,755$ (56,434,827)$ (56,434,827)$ -$ J udic ia l Adminis tra tio n 19,780,824 1,725,527 3,932,301 - (14,122,996) (14,122,996) - P ublic Safe ty 122,207,105 13,275,093 12,737,297 - (96,194,715) (96,194,715) - P ublic Wo rks 50,832,526 21,311,717 7,884,914 5,805,699 (15,830,196) (15,830,196) - Library 5,879,455 - - - (5,879,455) (5,879,455) - Health and Welfare 92,699,351 6,449,691 34,814,083 - (51,435,577) (51,435,577) - Trans it 16,273,035 - - - (16,273,035) (16,273,035) - Culture and Recrea tio n 28,359,110 3,140,541 324,164 190,576 (24,703,829) (24,703,829) - Co mmunity Develo pment 24,629,436 3,921,432 4,576,996 686,460 (15,444,548) (15,444,548) - Educatio n 174,792,461 - - - (174,792,461) (174,792,461) - Inte res t o n Lo ng-te rm Debt 17,277,344 - - - (17,277,344) (17,277,344) - To ta l P rim a ry Go v e rnm e nt 611,938,143$ 51,138,412$ 64,943,258$ 7,467,490$ (488,388,984)$ (488,388,984)$ -$
C o m po ne nt Units :
Library 6,494,117$ 258,829$ 188,491$ -$ -$ -$ (6,046,797)$ Trans it 13,628,280 4,053,016 7,434 - - - (9,567,830) Scho o l Bo ard 215,552,440 2,569,290 21,446,298 - - - (191,536,852)To ta l C o m po ne nt Units 235,674,837$ 6,881,135$ 21,642,223$ -$ -$ -$ (207,151,479)$
Ge ne ra l R e v e nue s :
Taxes :
Gene ra l P ro perty Taxes :
Rea l Es ta te 315,613,596$ 315,613,596$ -$ P ers o nal P ro perty 36,967,115 36,967,115 - Other Lo ca l Taxes :
Bus ines s Licens e Tax 30,444,798 30,444,798 Lo ca l Sa le s Tax 23,880,909 23,880,909 Mea ls Tax 16,214,900 16,214,900 Trans ient Lo dging Tax 11,245,201 11,245,201 - Utility Tax 10,812,989 10,812,989 Co mmunica tio ns Sa les Tax 12,099,382 12,099,382 Mo to r Vehic le Licens e , Reco rda tio n, and o ther lo ca l taxes 13,561,178 13,561,178
T ransfer P ayment fro m (To ) City o f Alexandria - - 181,944,218 Capita l Trans fers (To ) Fro m City (3,877,044) Grants and Co ntributio ns No t Res tric ted to Specific P ro grams 32,442,767 32,442,767 26,759,897 Inte res t and Inves tment Earnings 960,501 960,501 247,452 Mis ce llaneo us 987,727 987,727 2,103,268
To ta l Genera l Revenues 505,231,063$ 505,231,063$ 207,177,791$ Change in Net As s e ts 16,842,079$ 16,842,079$ 26,312$
Ne t As s e ts a t Beginning o f Year 377,604,877 377,604,877 36,255,455Net As s e ts a t End o f Year 394,446,956$ 394,446,956$ 36,281,767$
See Accompanying Notes to Financial Statements
34
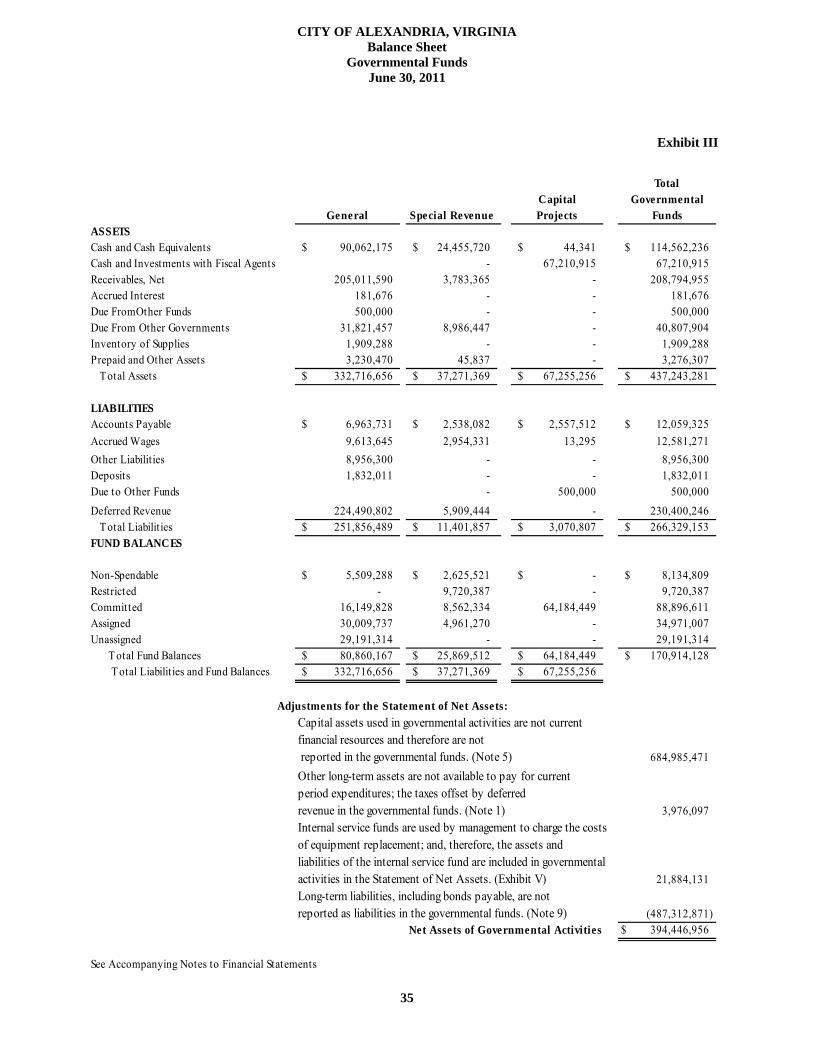
CITY OF ALEXANDRIA, VIRGINIA Balance Sheet
Governmental Funds June 30, 2011
35
TotalCapital Governmental
General Special Revenue Projects FundsASSETSCash and Cash Equivalents 90,062,175$ 24,455,720$ 44,341$ 114,562,236$ Cash and Investments with Fiscal Agents - 67,210,915 67,210,915 Receivables, Net 205,011,590 3,783,365 - 208,794,955 Accrued Interest 181,676 - - 181,676 Due FromOther Funds 500,000 - - 500,000 Due From Other Governments 31,821,457 8,986,447 - 40,807,904 Inventory of Supplies 1,909,288 - - 1,909,288Prepaid and Other Assets 3,230,470 45,837 - 3,276,307 Total Assets 332,716,656$ 37,271,369$ 67,255,256$ 437,243,281$
LIABILITIESAccounts Payable 6,963,731$ 2,538,082$ 2,557,512$ 12,059,325$ Accrued Wages 9,613,645 2,954,331 13,295 12,581,271Other Liabilities 8,956,300 - - 8,956,300Deposits 1,832,011 - - 1,832,011Due to Other Funds - 500,000 500,000yDeferred Revenue 224,490,802 5,909,444 - 230,400,246 Total Liabilities 251,856,489$ 11,401,857$ 3,070,807$ 266,329,153$ FUND BALANCES
Non-Spendable 5,509,288$ 2,625,521$ -$ 8,134,809$ Restricted - 9,720,387 - 9,720,387Committed 16,149,828 8,562,334 64,184,449 88,896,611Assigned 30,009,737 4,961,270 - 34,971,007Unassigned 29,191,314 - - 29,191,314 Total Fund Balances 80,860,167$ 25,869,512$ 64,184,449$ 170,914,128$ Total Liabilities and Fund Balances 332,716,656$ 37,271,369$ 67,255,256$
Adjustments for the Statement of Net Assets: Capital assets used in governmental activities are not currentfinancial resources and therefore are not reported in the governmental funds. (Note 5) 684,985,471Other long-term assets are not available to pay for currentperiod expenditures; the taxes offset by deferred revenue in the governmental funds. (Note 1) 3,976,097Internal service funds are used by management to charge the costsof equipment replacement; and, therefore, the assets andliabilities of the internal service fund are included in governmentalactivities in the Statement of Net Assets. (Exhibit V) 21,884,131Long-term liabilities, including bonds payable, are not reported as liabilities in the governmental funds. (Note 9) (487,312,871)
Net Assets of Governmental Activities 394,446,956$
See Accompanying Notes to Financial Statements
Exhibit III
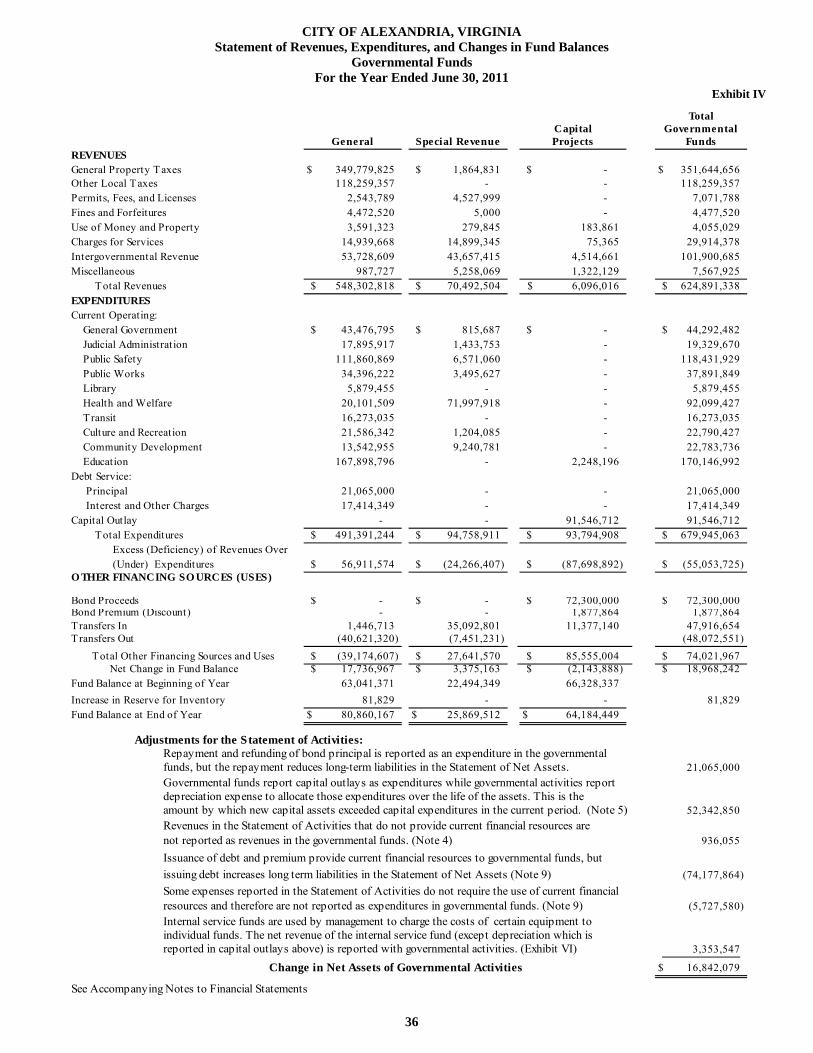
CITY OF ALEXANDRIA, VIRGINIA Statement of Revenues, Expenditures, and Changes in Fund Balances
Governmental Funds For the Year Ended June 30, 2011
36
TotalCapital Governmental
General Special Revenue Projects FundsREVENUESGeneral Property Taxes 349,779,825$ 1,864,831$ -$ 351,644,656$ Other Local Taxes 118,259,357 - - 118,259,357Permits, Fees, and Licenses 2,543,789 4,527,999 - 7,071,788Fines and Forfeitures 4,472,520 5,000 - 4,477,520Use of Money and Property 3,591,323 279,845 183,861 4,055,029Charges for Services 14,939,668 14,899,345 75,365 29,914,378Intergovernmental Revenue 53,728,609 43,657,415 4,514,661 101,900,685Miscellaneous 987,727 5,258,069 1,322,129 7,567,925 Total Revenues 548,302,818$ 70,492,504$ 6,096,016$ 624,891,338$ EXPENDITURESCurrent Operating: General Government 43,476,795$ 815,687$ -$ 44,292,482$ Judicial Administration 17,895,917 1,433,753 - 19,329,670 Public Safety 111,860,869 6,571,060 - 118,431,929 Public Works 34,396,222 3,495,627 - 37,891,849 Library 5,879,455 - - 5,879,455 Health and Welfare 20,101,509 71,997,918 - 92,099,427 Transit 16,273,035 - - 16,273,035 Culture and Recreation 21,586,342 1,204,085 - 22,790,427 Community Development 13,542,955 9,240,781 - 22,783,736 Education 167,898,796 - 2,248,196 170,146,992Debt Service: Principal 21,065,000 - - 21,065,000 Interest and Other Charges 17,414,349 - - 17,414,349Capital Outlay - - 91,546,712 91,546,712 Total Expenditures 491,391,244$ 94,758,911$ 93,794,908$ 679,945,063$ Excess (Deficiency) of Revenues Over (Under) Expenditures 56,911,574$ (24,266,407)$ (87,698,892)$ (55,053,725)$ O THER FINANCING SO URCES (USES)
Bond Proceeds -$ -$ 72,300,000$ 72,300,000$ Bond Premium (Discount) - - 1,877,864 1,877,864Transfers In 1,446,713 35,092,801 11,377,140 47,916,654Transfers Out (40,621,320) (7,451,231) (48,072,551) Total Other Financing Sources and Uses (39,174,607)$ 27,641,570$ 85,555,004$ 74,021,967$ Net Change in Fund Balance 17,736,967$ 3,375,163$ (2,143,888)$ 18,968,242$ Fund Balance at Beginning of Year 63,041,371 22,494,349 66,328,337Increase in Reserve for Inventory 81,829 - - 81,829Fund Balance at End of Year 80,860,167$ 25,869,512$ 64,184,449$
Adjustments for the Statement of Activities: Repayment and refunding of bond principal is reported as an expenditure in the governmentalfunds, but the repayment reduces long-term liabilities in the Statement of Net Assets. 21,065,000 Governmental funds report capital outlays as expenditures while governmental activities reportdepreciation expense to allocate those expenditures over the life of the assets. This is theamount by which new capital assets exceeded capital expenditures in the current period. (Note 5) 52,342,850 Revenues in the Statement of Activities that do not provide current financial resources arenot reported as revenues in the governmental funds. (Note 4) 936,055Issuance of debt and premium provide current financial resources to governmental funds, butissuing debt increases long term liabilities in the Statement of Net Assets (Note 9) (74,177,864)Some expenses reported in the Statement of Activities do not require the use of current financialresources and therefore are not reported as expenditures in governmental funds. (Note 9) (5,727,580)Internal service funds are used by management to charge the costs of certain equipment to individual funds. The net revenue of the internal service fund (except depreciation which isreported in capital outlays above) is reported with governmental activities. (Exhibit VI) 3,353,547
Change in Net Assets of Governmental Activities 16,842,079$
See Accompanying Notes to Financial Statements
Exhibit IV

CITY OF ALEXANDRIA, VIRGINIA Statement of Net Assets
Proprietary Funds – Internal Service Fund June 30, 2011
37
ASSETSCurrent Assets: Cash and Cash Equivalents 13,152,178$ Total Current Assets 13,152,178$ Capital Assets: Buildings and Equipment 34,962,006$ Less Accumulated Depreciation 25,879,374 Capital Assets, Net 9,082,632$ Total Assets 22,234,810$
LIABILITIESCurrent Liabilit ies: Accounts Payable 350,679$ Total Current Liabilit ies 350,679$ Total Liabilit ies 350,679$ NET ASSETSInvested in Capital Assets 9,082,632$ Unrestricted Net Assets 12,801,499 Total Net Assets 21,884,131$ Total Liabilit ies and Net Assets 22,234,810$
See Accompanying Notes to Financial Statements
Exhibit V

CITY OF ALEXANDRIA, VIRGINIA Statement of Revenues, Expenses, and Changes in Net Assets
Proprietary Funds – Internal Service Fund For the Year Ended June 30, 2011
38
Operating Revenues: Charges for Services $ 4,707,639 Total Operating Revenues $ 4,707,639Operating Expenses: Materials and Supplies $ 1,472,944 Depreciation 2,942,812 Total Operating Expenses $ 4,415,756 Operating Income $ 291,883Nonoperating Expenses: Loss on Disposal of Capital Assets $ (37,045) Total Nonoperating Expenses $ (37,045) Net Profit /Loss Before Operating Transfers 254,838Operating Transfers: T ransfers In $ 155,897Total Net T ransfers $ 155,897
Change in Net Assets $ 410,735Net Assets at Beginning of Year 21,473,396Net Assets at End of Year $ 21,884,131
See Accompanying Notes to Financial Statements
Exhibit VI

CITY OF ALEXANDRIA, VIRGINIA Statement of Cash Flows
Proprietary Funds For the Year Ended June 30, 2011
39
CASH FLO WS FRO M O PERATING ACTIVITIESReceipts From Customers 4,707,639$ Payments to Suppliers (1,464,322) Net Cash Provided by Operating Activities 3,243,317$
CASH FLO WS FRO M NO NCAPITAL FINANCING ACTIVITIESOperating Subsidies and Transfers from Other Funds 155,897$ CASH FLO WS FRO M CAPITAL AND RELATED FINANCING ACTIVITIESPurchases of Capital Assets (1,932,249)$ Net Cash Used By Capital and Related Financing Activit ies (1,776,352)$
Net Increase in Cash and Cash Equivalents 1,466,965$
Cash and Cash Equivalents at Beginning of Year 11,685,213
Cash and Cash Equivalents at End of Year 13,152,178$
Reconciliation of O perating Income to Net CashProvided by O perating ActivitiesOperating Income 291,883$ Adjustments to Reconcile Operating Income to Net Cash Provided by Operating Activities: Depreciation Expense 2,942,812Change in Assets and Liabilit ies: (Increase) Decrease in Accounts Payable 8,622 Net Cash Provided by Operating Activities 3,243,317$
Noncash investing, capital and financing activities:Capital assets with a net book value of $37,045 were retired in non-cash transactions during the year in the Internal Service Fund.
See Accompanying Notes to Financial Statements
Exhibit VII

CITY OF ALEXANDRIA, VIRGINIA Statement of Fiduciary Net Assets
At June 30, 2011
40
Employee O ther Post Private- Retirement Employment Purpose Agency
Plans Benefits Trusts FundsASSETSCash and Short-term Investments -$ -$ -$ 47,184$ Investments, at Fair Value: LGIP/CDARS/NOW 5,716 18,255 Mutual Funds 79,871,340 3,462,980 Stocks 193,317,196 11,696,900 Guaranteed Investment Accounts 41,522,059 Real Estate 14,122,953 T imber/Private Equity 12,002,260 461,190 Other Investments 2,239,867 190,647 Total Investments 343,075,675$ 15,811,717$ 5,716$ 18,255$ Total Assets 343,075,675$ 15,811,717$ 5,716$ 65,439$
LIABILITIESRefunds Payable and Other -$ -$ -$ 65,439$
-$ -$ -$ 65,439$
NET ASSETSHeld in T rust for: Pension Benefits 343,075,675$ -$ -$ Other Post Employment Benefits - 15,811,717 - Other Purposes - - 5,716TO TAL NET ASSETS 343,075,675$ 15,811,717$ 5,716$
See Accompanying Notes to Financial Statements
Exhibit VIII

CITY OF ALEXANDRIA, VIRGINIA Statement of Changes in Fiduciary Net Assets
For the Fiscal Year Ended June 30, 2011
41
Employee O ther Post Private- Retirement Employment Purpose
Plans Benefits TrustsADDITIO NSContributions: Employer 19,116,447$ 3,397,049$ -$ Plan Members 2,739,801 - - Total Contributions 21,856,248$ 3,397,049$ -$ Investment Earnings: Net Appreciation in Fair Value of Investments 53,850,260$ 2,017,818$ -$ Interest 5,874,597 377,983 - Net Investment Income 59,724,857$ 2,395,801$ 541$
Total Additions 81,581,105$ 5,792,850$ 541$
DEDUCTIO NSBenefits 16,944,002$ -$ 570$ Refunds of Contributions 2,524,487 - - Administrative Expenses 600,040 26,065 - Total Deductions 20,068,529$ 26,065$ 570$ Change in Net Assets 61,512,576$ 5,766,785$ (29)$ Net Assets at Beginning of Year 281,563,099 10,044,932 5,745Net Assets at End of Year 343,075,675$ 15,811,717$ 5,716$
See Accompanying Notes to Financial Statements
Exhibit IX

CITY OF ALEXANDRIA, VIRGINIA Statement of Net Assets
Component Units As of June 30, 2011
42
School Board Library Transit TotalASSETSCash and Cash Equivalents 43,670,021$ 165,507$ 311,198$ 44,146,726$ Cash and Investments with Fiscal Agents - 2,797,414 - 2,797,414 Receivables 576,829 - 2,991 579,820 Due from Other Governments 9,991,876 - 3,280 9,995,156 Inventory of Supplies 131,925 - 605,902 737,827 Prepaid and Other Assets 8,608,755 - - 8,608,755 Capital assets Land and Construction in Progress 999,381 - - 999,381 Other Capital Assets, Net 7,185,273 - 6,339,556 13,524,829 Capital Assets, Net 8,184,654$ -$ 6,339,556$ 14,524,210$
Total Assets 71,164,060$ 2,962,921$ 7,262,927$ 81,389,908$
LIABILITIESAccounts Payable 4,351,863$ 89,514$ 199,431$ 4,640,808$ Accrued Wages 28,470,409 274,814 301,114 29,046,337Deferrred Revenue 357,123 - - 357,123 p yOther Short-term Liabilit ies 419,255 419,255 Long-term Liabilities Due Within One Year 1,255,919 - - 1,255,919 Long-term Liabilities Due in More Than One Year 9,388,699 - - 9,388,699 Total Liabilit ies 43,824,013$ 364,328$ 919,800$ 45,108,141$
NET ASSETSInvested in Capital Assets 8,184,654$ -$ 6,339,556$ 14,524,210$ Unrestricted Net Assets 19,155,393 2,598,593 3,571 21,757,557TO TAL NET ASSETS 27,340,047$ 2,598,593$ 6,343,127$ 36,281,767$
See Accompanying Notes to Financial Statements
Exhibit X

CITY OF ALEXANDRIA, VIRGINIA Statement of Activities
Component Units For the Year Ended June 30, 2011
Net (Expense) RevenueO perating and Changes in Net Assets
Charges for Grants and School Expenses Services Contributions Board Library Transit Totals
School Board Instructional 215,552,440$ 2,569,290$ 21,446,298$ (191,536,852)$ -$ -$ (191,536,852)$
Total School Board 215,552,440$ 2,569,290$ 21,446,298$ (191,536,852)$ -$ -$ (191,536,852)$
Library 6,494,117$ 258,829$ 188,491$ -$ (6,046,797)$ -$ (6,046,797)$ Transit 13,628,280 4,053,016 7,434 - - (9,567,830) (9,567,830)
Total Component Units 235,674,837$ 6,881,135$ 21,642,223$ -$ (6,046,797)$ (9,567,830)$ (207,151,479)$
43
General Revenues:Payment From/(To) City 167,886,567$ 5,879,455$ 8,178,196$ 181,944,218$ Capital Payment From City ***** 2,248,196 - (6,125,240) (3,877,044) Grants not restricted to specific programs 26,759,897 - 26,759,897 Interest and Investment Earnings - 242,471 4,981 247,452 Miscellaneous 1,751,150 352,118 2,103,268 Total General Revenues 198,645,810$ 6,474,044$ 2,057,937$ 207,177,791$ Change in Net Assets 7,108,958$ 427,247$ (7,509,893)$ 26,312$ Net Assets Beginning of Year 20,231,089 2,171,346 13,853,020 36,255,455Net Assets End of Year 27,340,047$ 2,598,593$ 6,343,127$ 36,281,767$
See Accompanying Notes to Financial Statements***** Net Capital Assets with net book value of $6,274,644 were transferred to the City and $149,404 was spent by City on Bus Rehabilitation
Program Revenues
Exhibit XI

CITY OF ALEXANDRIA, VIRGINIA Notes to Financial Statements June 30, 2011 Exhibit XII NOTE 1. SUMMARY OF SIGNIFICANT ACCOUNTING POLICIES
44
Narrative Profile
The City of Alexandria, located in northern Virginia and bordered by the District of Columbia (Potomac River) and Arlington and Fairfax Counties, was founded in 1749 and incorporated in 1779. With a population of 141,287 and a land area of 15.75 square miles, Alexandria is the 7th largest city in the Commonwealth of Virginia and one of the most densely populated cities in the Commonwealth.
The City is governed under the City Manager-Council form of government. Alexandria engages in a
comprehensive range of municipal services, including general government administration, public safety and administration of justice, education, health, welfare, housing and human service programs, transportation and environmental services, planning, community development and recreation, cultural, library, and historic activities.
The financial statements of the City of Alexandria, Virginia have been prepared in conformity with the specifications promulgated by the Auditor of Public Accounts (APA) of the Commonwealth of Virginia, and U.S. generally accepted accounting principles (GAAP) as specified by the Governmental Accounting Standards Board (GASB). The more significant of the City’s accounting policies are described below. A. Financial Reporting Entity
The City follows GASB Statement No. 34, Basic Financial Statements – and Management’s Discussion and Analysis – for State and Local Governments. GASB Statement No. 34 requires the following financial statement components:
Management’s Discussion and Analysis – A narrative introduction and analytical overview of the government’s financial activities. This analysis is similar to analysis the private sector provides in their annual reports. Government-wide financial statements – These include financial statements prepared using full accrual accounting for all of the government’s activities. This approach includes not just current assets and liabilities (such as cash and accounts payable), but also capital assets (such as buildings and infrastructure, including bridges and roads) and long-term liabilities (such as general obligation debt and unfunded pension costs). Accrual accounting also reports all of the revenues and costs of providing services each year, not just those received or paid in the current year or soon thereafter. The government-wide statements include the Statement of Net Assets and the Statement of Activities. Statement of Net Assets – The Statement of Net Assets displays the financial position of the primary government (governmental and business-type activities) and its discretely presented component units. Governments report all capital assets, including infrastructure, in the government-wide Statement of Net Assets and report depreciation expense – the cost of “using up” capital assets – in the Statement of Activities. The net assets of a government are broken down into three categories – 1) invested in capital assets, net of related debt; 2) restricted; and 3) unrestricted. Statement of Activities – The Statement of Activities reports expenses and revenues in a format that focuses on the cost of each of the City’s functions. The expense of individual functions is compared to the revenues generated directly by the function (for instance, through user charges or intergovernmental grants).
CITY OF ALEXANDRIA, VIRGINIA Notes to Financial Statements June 30, 2011 Exhibit XII (Continued) NOTE 1. SUMMARY OF SIGNIFICANT ACCOUNTING POLICIES (Continued)
45
Fund Financial Statements – The fund financial statements display the financial transactions and accounts of the City based on funds. The operation of each fund is considered to be an independent accounting entity. The fund financial statements also include reconciliation to the government-wide statement, which briefly explains the differences between the fund and government-wide financial statements. Budgetary Comparison Schedules – Demonstrating compliance with the adopted budget is an important component of a government’s accountability to the public. Many citizens participate in the process of establishing the annual operating budgets of state and local governments, and have an interest in following the actual financial progress of their governments over the course of the year. The City Council approves revisions to its original budget over the course of the year for a variety of reasons. As required by GAAP, these financial statements present the primary government and its component
units, entities for which the City is considered to be financially accountable. Blended component units, although legally separate entities are, in substance, part of the government’s operations and so data from these units are combined with data of the primary government. The City has no component units that meet the requirements for blending. The discretely presented component units, on the other hand, are reported in a separate column in the government-wide statements to emphasize they are legally separate from the primary government. Each of the City’s discretely presented component units has a June 30 fiscal year-end.
Component Units:
City of Alexandria School Board
Since FY 1995, the Alexandria City School Board (School Board) has been elected. The School Board is substantially reliant upon the City because City Council approves the School Board’s total annual budget appropriation, levies taxes, and issues debt for school projects. The legal liability for the general obligation debt issued for school capital assets remains with the City. The City’s primary transaction with the School Board is the City’s annual General Fund revenue support, which totaled $168 million for operations and $2.2 million for capital equipment in FY 2011.
The APA establishes financial reporting requirements for all localities in the Commonwealth of Virginia. The APA has determined that all Virginia School Boards shall be reported as discretely presented component units of the locality. The APA has also specified additional reporting requirements with respect to School Boards.
City of Alexandria Library System
City Council appoints the Library Board (Library) and approves the Library budget. The City is
responsible for issuing debt, and acquiring and maintaining all capital items on behalf of the Library. The legal liability for the general obligation debt issued on behalf of the Library remains with the City. The City’s primary transaction with the Library is the City’s annual operating support, which was $5.9 million for FY 2011.
CITY OF ALEXANDRIA, VIRGINIA Notes to Financial Statements June 30, 2011 Exhibit XII (Continued) NOTE 1. SUMMARY OF SIGNIFICANT ACCOUNTING POLICIES (Continued)
46
Alexandria Transit Company
The City Council, acting as sole shareholder, elects members of the Alexandria Transit Company’s board of directors. City Council approves bus routes, fares, and budgets. The City funds deficits and may issue debt on behalf of the Alexandria Transit Company. The City’s primary transactions with the Alexandria Transit Company are the City’s annual subsidy, which was $8.2 million in FY 2011.
The Alexandria Transit Company does not issue separate financial statements and is included as an enterprise fund. Complete financial statements for the School Board and Library component units may be obtained at each entity’s administrative offices. City of Alexandria School Board City of Alexandria Library System 2000 North Beauregard Street 5005 Duke Street Alexandria, Virginia 22311 Alexandria, Virginia 22304-2903
Excluded from Reporting Entity:
City Council is not financially accountable for the Deferred Compensation Plan, Alexandria Economic Development Partnership, Alexandria Industrial Development Authority, Alexandria Redevelopment and Housing Authority, Alexandria Sanitation Authority, or Sheltered Homes of Alexandria, Inc. Accordingly, these entities are excluded from the City of Alexandria’s financial statements. B. Government-wide and Fund Financial Statements
The basic financial statements include both government-wide (based on the City as a whole) and fund financial statements. The reporting model focus is on both the City as a whole and the fund financial statements, including the major individual funds of the governmental and business-type categories, as well as the fiduciary funds, (by category) and the component units. Both the government-wide and fund financial statements (within the basic financial statements) categorize primary activities as either governmental or business type. In the government-wide Statement of Net Assets, the governmental activities column (a) is presented on a combined basis, and (b) is reflected on a full accrual, economic resource basis, which incorporates long-term assets and receivables as well as long-term debt and obligations. Both government-wide and fund financial statements presentations provide information that can be analyzed and compared (between years and between governments) to enhance the usefulness of the financial information. The City generally uses restricted assets first for expenses incurred for which both restricted and unrestricted assets are available. The City may defer the use of restricted assets based on a review of the specific transaction.
The government-wide Statement of Activities reflects both the gross and net cost per functional category
(public safety, public works, health and welfare, etc.) that are otherwise being supported by general government revenues (property, sales and use taxes, certain intergovernmental revenues, fines, permits and charges, etc.). The Statement of Activities reduces gross expenses (including depreciation) by related program revenues, operating and capital grants, and contributions. The program revenues must be directly associated with the function (public safety, public works, health and welfare, etc.). Program revenues include 1) charges to customers or applicants who purchase, use, or directly benefit from goods, services, or privileges provided by a given function and 2) grants and contributions that are restricted to meeting the operation or capital requirements of a particular function or segment. Taxes and other items not included among program revenues are reported as general revenues. The City does not allocate indirect expenses. The operating grants and contributions column includes operating-specific and discretionary (either operating or capital) grants, while the capital grants and contributions column reflects capital-specific grants.

CITY OF ALEXANDRIA, VIRGINIA Notes to Financial Statements June 30, 2011 Exhibit XII (Continued) NOTE 1. SUMMARY OF SIGNIFICANT ACCOUNTING POLICIES (Continued)
47
In the fund financial statements, financial transactions and accounts of the City are organized on the basis
of funds. The operation of each fund is considered an independent fiscal and separate accounting entity, with a self-balancing set of accounts recording cash and/or other financial resources together with related liabilities, fund balances and net assets, and changes therein, which are segregated for the purpose of carrying on specific activities or attaining certain objectives in accordance with special regulations, restrictions, or limitations. Governmental fund statements are presented on a current financial resource and modified accrual basis of accounting. This is the manner in which these funds are normally budgeted. Since governmental fund statements are presented on a different measurement focus and basis of accounting than the government-wide statements’ governmental activities column, a reconciliation is presented which briefly explains the adjustments necessary to reconcile the fund financial statements to the governmental activities column of the government-wide financial statements.
The City’s fiduciary funds are presented in the fund financial statements by type (pension, private purpose
trust and agency). Since by definition these assets are being held for the benefit of a third party (other local governments, private parties, pension participants, etc.) and cannot be used to address activities or obligations of the government, these funds are not incorporated into the government-wide financial statements.
The following is a brief description of the specific funds used by the City in FY 2011. 1. Governmental Funds
Governmental Funds are those through which most governmental functions typically are financed.
a. General Fund
The General Fund is the primary operating fund of the City. This fund is used to account for all
financial transactions and resources except those required to be accounted for in another fund. Revenues are derived primarily from property and other local taxes, state and federal distributions, licenses, permits, charges for service, and interest income. A significant part of the General Fund’s revenues is used to finance the operations of the City of Alexandria School Board.
b. Special Revenue Fund
Special revenue funds are used to account for and report the proceeds of specific revenue sources that
are restricted or committed to expenditure for specified purposes other than debt service or capital projects. A significant portion of the Special Revenue Fund is used for Health and Welfare programs.
The special revenue funds of the City as of the end of FY 2011 are comprised of the following: Housing – This fund accounts for the City’s housing programs. Sanitary Sewer – This fund accounts for the funding of sanitary sewer maintenance and construction. Stormwater Management Fund – This fund was established in FY 2011. It is funded by a dedicated real estate property tax rate of 0.5 cents per $100 of assessed value. Potomac Yard Special Tax District – This fund accounts for funding for improvements in Potomac Yards, including the development of a metro rail station.

CITY OF ALEXANDRIA, VIRGINIA Notes to Financial Statements June 30, 2011 Exhibit XII (Continued) NOTE 1. SUMMARY OF SIGNIFICANT ACCOUNTING POLICIES (Continued)
48
Other Special Revenue – This fund accounts for grants and donations.
c. Capital Projects Fund
The Capital Projects Fund (Capital Improvements) accounts for and reports financial resources that are restricted, committed, or assigned to expenditure for the acquisition or construction of major capital facilities.
2. Proprietary Funds
Proprietary Funds are used to account for activities that are similar to those often found in the private sector. All assets, liabilities, net assets, revenues, expenses, and payments relating to the government’s business activities are accounted for through proprietary funds. The measurement focus is on determination of net income, financial position, and cash flows. Operating revenues include charges for services. Operating expenses include costs of services as well as, materials, contracts, personnel, and depreciation. All revenues and expenses not meeting these definitions are reported as nonoperating revenues and expenses. In accordance with GASB Statement No. 20, the City has elected to follow GASB statements issued after November 30, 1989, rather than the Financial Accounting Standards Board, in accounting for enterprise funds to the extent these standards do not conflict with or contradict guidance of the GASB. The City has two proprietary funds – the Internal Service Fund and the component unit Alexandria Transit Company. The Internal Service Fund accounts for the financing of goods or services provided by one department to other departments or agencies of the City on a cost-reimbursement basis and is considered an enterprise fund. The City established the Equipment Replacement Reserve Account, the internal service fund, for the purpose of providing for the accumulation of funds to replace capital equipment items used in City operations. This internal service fund derives its funding from periodic equipment rental charges assessed to the user departments in the governmental funds. This funding is then used to replace capital equipment when the need arises. The internal service fund is included in governmental activities for government-wide reporting purposes and is not considered an enterprise fund. As a general rule, the effect of interfund activity has been eliminated from the government-wide financial statements. The excess revenues or expenses for the fund are allocated to the appropriate functional activity. The component unit, Alexandria Transit Company, is considered an enterprise fund and derives its funding from fare box fees and some support from the City.
3. Fiduciary Funds
Fiduciary Funds are used to account for assets held by the City in a trustee capacity or as an agent for
individuals, private organizations, and other governments. The Fiduciary Funds of the City are the John D. Collins Private Purpose Trust Fund, Employee Retirement Funds, the Human Services Special Welfare Account, the Human Services Dedicated Account, the Industrial Development Authority Agency Funds, the Potomac Yard Affordable Housing, and the Potomac Yard Open Space Agency Funds. For accounting measurement purposes, the Private Purpose Trust Fund, the Employee Retirement Funds, and other post employment benefits are accounted for in essentially the same manner as proprietary funds. Private Purpose Trust Funds account for assets of which the principal may not be spent. The Employee Retirement Funds account for the assets of the City’s pension plans and the OPEB fund. Agency Funds are custodial in nature (assets equal liabilities) and do not involve measurement of results of operations. Fiduciary funds are not included in the government-wide financial statements.

CITY OF ALEXANDRIA, VIRGINIA Notes to Financial Statements June 30, 2011 Exhibit XII (Continued) NOTE 1. SUMMARY OF SIGNIFICANT ACCOUNTING POLICIES (Continued)
49
The agency funds held by the City as of end of FY 2011 comprise the following: Human Services Special Welfare Account – This fund accounts for the current payments of supplemental security income for foster children. Human Services Dedicated Account – This fund accounts for back payments of supplemental security income for foster children. Industrial Development Authority Agency Fund – This fund accounts for Industrial Development Authority bond issuance fees and expenses, for which the City acts in a custodial capacity. Potomac Yard Affordable Housing – This fund accounts for affordable housing donations received from Potomac Yard Development LLC for the purpose of constructing affordable housing. C. Basis of Accounting
The accounting and financial reporting treatment applied to a fund is determined by its measurement focus. All governmental funds are accounted for using the current financial resources measurement focus. With this measurement focus, only current assets and current liabilities generally are included on the balance sheet in the funds statements. Long-term assets and long-term liabilities are included in the government-wide statements. Operating statements of the governmental funds present increases (i.e., revenues and other financing sources) and decreases (i.e., expenditures and other financing uses) in net current assets.
The government-wide Statement of Net Assets and Statement of Activities, all proprietary funds, and private purpose trust funds and pension trust funds are accounted for on a flow of economic resources measurement focus. With this measurement focus, all assets and all liabilities associated with the operation of these activities are either included on the statement of net assets or on the statement of fiduciary net assets. These operating statements present increases (e.g., revenues or additions) and decreases (e.g., expenses or deductions) in total net assets.
The Statement of Net Assets, Statement of Activities, and the financial statements of the Proprietary Fund
and Fiduciary Funds are presented on the accrual basis of accounting. Under this method of accounting, revenues are recognized when earned and expenses are recorded when liabilities are incurred without regard to receipt or disbursement of cash.
The fund financial statements of the General, Special Revenue, and Capital Projects funds are maintained and reported on the modified accrual basis of accounting using the current financial resources measurement focus. Under this method of accounting, revenues are recognized in the period in which they become measurable and available. With respect to real and personal property tax revenue and other local taxes, the term “available” is limited to collection within forty-five days of the fiscal year-end. Levies made prior to the fiscal year-end but which are not available are deferred. Interest income is recorded as earned. Federal and State reimbursement-type grants revenues are considered to be measurable and available as revenue when reimbursements for related eligible expenditures are collected within a year of the date the expenditure was incurred. Expenditures, other than accrued interest on long-term debt, are recorded when the fund liability is incurred.

CITY OF ALEXANDRIA, VIRGINIA Notes to Financial Statements June 30, 2011 Exhibit XII (Continued) NOTE 1. SUMMARY OF SIGNIFICANT ACCOUNTING POLICIES (Continued)
50
D. Budgets and Budgetary Accounting
The City Council annually adopts budgets for the General Fund and Special Revenue Fund of the primary government. All appropriations are legally controlled at the departmental level for the General Fund and Special Revenue Fund. The School Board appropriation is determined by the City Council and controlled in total by the primary government. On June 12, 2010, the City Council formally approved the original adopted budget (which had been initially approved on May 3, 2010) and on June 25, 2011 approved the revised budget reflected in the required supplemental information. Budgets are prepared for the Capital Projects Fund on a project basis, which covers the life of the project. A Capital Projects Fund appropriation does not lapse until an appropriation reduction is approved by City Council.
Encumbrances
Encumbrance accounting, the recording of purchase orders, contracts, and other monetary commitments in
order to reserve an applicable portion of an appropriation, is used as an extension of formal budgetary control in the General, Special Revenue, and Capital Projects Funds. Encumbrances outstanding at year-end are classified as committed or assigned in the General Fund, or as restricted fund balance in the non-General Funds. These encumbrances are subject to reappropriation by Council ordinance in the succeeding fiscal year. E. Equity in Pooled Cash and Investments
Cash resources of the individual funds, including imprest cash of $37,865 and excluding cash held with fiscal agents in the General Fund, Special Revenue Fund, Capital Projects Fund, Proprietary Funds, Fiduciary Funds, and discretely presented component units (School Board, Library, and Alexandria Transit Company), are combined to form a pool of cash and investments to maximize interest earnings. Investments in the pool consist of the State Treasurer’s Local Government Investment Pool (LGIP) and are recorded at fair value. Income from pooled investments is allocated only when contractually or legally required. All investment earnings not legally or contractually required to be credited to individual accounts or funds are credited to the General Fund.
The Library maintains separate cash and investment accounts consisting of cash and obligations of the federal government and corporate bonds and stocks recorded at fair value. All cash and investments held with fiscal agents for the primary government and its discretely presented component units are recorded at fair value.
For purposes of the statement of cash flows, the Proprietary Funds consider all highly liquid investments with a maturity of three months or less when purchased to be cash equivalents.
The fair value of investments is based on quoted market prices. All investments in external investment pools are reported at fair value.

CITY OF ALEXANDRIA, VIRGINIA Notes to Financial Statements June 30, 2011 Exhibit XII (Continued) NOTE 1. SUMMARY OF SIGNIFICANT ACCOUNTING POLICIES (Continued)
51
F. Allowance for Uncollectible Accounts
The City calculates its allowance for uncollectible accounts using historical collection data and, in certain cases, specific account analysis. The allowance at June 30, 2011, is comprised of the following:
GENERAL FUND: Taxes Receivable: Real Property $ 676,289 Personal 14,314,979 Penalties and Interest 1,656,471 Total taxes $ 16,647,739 Accounts Receivable 10,186 Notes Receivable 9,000 $ 16,666,925
SPECIAL REVENUE FUND: Housing Fund Notes Receivable $ 35,163,186
CAPITAL PROJECTS FUND: Capital Projects Fund Notes Receivable $ 1,475,000
The component units’ accounts receivable are considered fully collectible and therefore an allowance for
uncollectible accounts is not applicable to those receivables. G. Inventory of Supplies and Prepaid and Other Assets
Primary Government
Inventories of consumable supplies are recorded at cost (determined on a first in, first out basis). Inventory in the General Fund consists of expendable supplies held for consumption. The costs are recorded as expenditures under the purchase method. Reported inventories in the General Fund are equally offset by a reservation of fund balance. Purchases of non-inventory items are recorded as expenses or expenditures under the purchase method. Prepaid expenditures in reimbursable grants are offset by unearned revenues until expenses or expenditures are recognized.
Component Units
Inventory for the School Board is comprised of food and commodities on hand pertaining to the Child
Nutrition Cluster of programs. Inventories of consumable supplies are recorded at cost using the weighted average method. Inventories received from the U.S. Department of Agriculture are recorded at fair market value when received and the amounts consumed are recorded as revenue. The amounts of unused food commodities are reported as inventory and deferred revenue.
Inventory for the Alexandria Transit Company is comprised of parts and operating materials held for consumption. These inventories are costed by methods that approximate average cost or market value, whichever is lower.
CITY OF ALEXANDRIA, VIRGINIA Notes to Financial Statements June 30, 2011 Exhibit XII (Continued) NOTE 1. SUMMARY OF SIGNIFICANT ACCOUNTING POLICIES (Continued)
52
Other assets in the government-wide statements also include taxes receivable discussed in Note 4 and deferred interest on refunding bonds discussed in Note 9. The total adjustment to these assets was comprised of the following:
Taxes receivable $ 1,555,669 Deferred interest 2,420,428 Total adjustment $ 3,976,097
H. Capital Assets
Capital outlays are recorded as expenditures of the General, Special Revenue, and Capital Projects Funds
and as assets in the government-wide financial statements to the extent the City’s capitalization threshold of $5,000 is met. Depreciation is recorded on capital assets on a government-wide basis using the straight-line method and the following estimated useful lives:
Buildings .................................................. 40 years Infrastructure ........................................... 25 years Furniture and Other Equipment ............... 3-20 years
To the extent the City’s capitalization threshold of $5,000 is met, capital outlays of the Internal Service
Fund are recorded as capital assets and depreciated over their estimated useful lives on a straight-line basis on both the funds and the government-wide financial statements using the straight-line method and the following estimated useful lives:
Leasehold Improvements ......................... 3-40 years Equipment ................................................ 3-20 years
All capital assets are valued at historical cost or estimated historical cost if actual cost was not available. Donated assets are valued at their estimated fair market value on the date donated. The City does not capitalize historical treasures or works of art. The City maintains many items and buildings of historical significance. The City uses the proceeds from the sale of historical treasures or works of art to acquire other items for the collection.
Maintenance, repairs, and minor equipment are charged to operations when incurred. Expenses that materially change capacities or extend useful lives are capitalized. Upon sale or retirement of land, buildings, and equipment, the cost and related accumulated depreciation, if applicable, are eliminated from the respective accounts and any resulting gain or loss is included in the results of operations.
I. Compensated Absences
The City accrues compensated absences (annual and sick leave benefits) when vested. The current portions of the governmental funds’ matured compensated absences liabilities are recorded as other liabilities in the General and Special Revenue Funds. The current and noncurrent portions are recorded in the government-wide financial statements. This includes the discretely presented component unit Library, since the City funds all Library personnel costs.

CITY OF ALEXANDRIA, VIRGINIA Notes to Financial Statements June 30, 2011 Exhibit XII (Continued) NOTE 1. SUMMARY OF SIGNIFICANT ACCOUNTING POLICIES (Continued)
53
The component unit School Board accrues matured compensated absences (annual, personal, and sick leave
benefits) when vested. The current and noncurrent portions of compensated absences are recorded in the School Board component unit government-wide financial statements.
The component unit Transit accrues annual and sick leave benefits in the period in which they are earned.
J. Use of Estimates
The preparation of financial statements in conformity with GAAP requires management to make estimates and assumptions that affect the amounts reported in the financial statements and related notes. Actual results could differ from those estimates.
K. Fund Balance
The City considers restricted fund balance to be spent when an expenditure is incurred for purposes for which restricted and unrestricted fund balances are available unless prohibited by legal constraints or contracts. When an expenditure is incurred for purposes for which committed, assigned or unassigned amounts are available; the City considers committed fund balance to be spent first, then assigned fund balance, and lastly unassigned fund balance. Fund Balances are reported according to the following categories. Non-spendable Fund Balance - amounts that cannot be spent because they are either (a) not in spendable form or (b) legally or contractually required to remain intact. E.g. Notes Receivable, Inventory of Supplies, Prepaid Amounts, and Assets held for Sale. Restricted Fund Balance - amounts constrained by external parties, constitutional provision, or enabling legislation. Effectively, restrictions may only be changed or lifted with the consent of the resource provider. Committed fund balance - amounts formally constrained by a government using its highest level of decision-making authority (i.e. City Council). The commitment of these funds can only be changed by the government taking the same formal action that imposed the constraint originally. Assigned fund balance - amounts that are constrained by the City’s expressed intent to use resources for specific purposes but do not meet the criteria to be classified as assigned or committed. Intent can be expressed by the governing body or by an official or body to which the governing body has delegated the authority (i.e. City Manager). With the exception of the General Fund, this is the residual fund balance of the classification of all governmental funds with positive balances. Unassigned fund balance - residual amounts that are otherwise not constrained at all will be reported in the general fund. These are technically available for any purpose. Only the General Fund can report a positive “unassigned fund balance”.
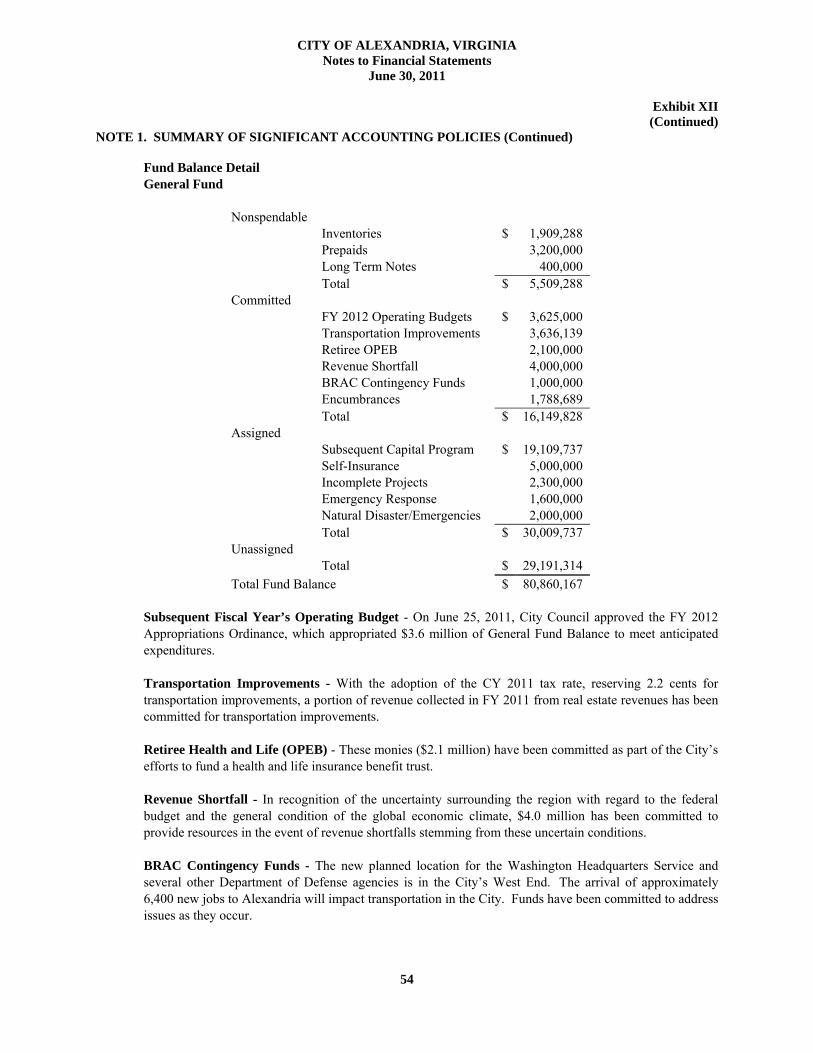
CITY OF ALEXANDRIA, VIRGINIA Notes to Financial Statements June 30, 2011 Exhibit XII (Continued) NOTE 1. SUMMARY OF SIGNIFICANT ACCOUNTING POLICIES (Continued)
54
Fund Balance Detail General Fund
Nonspendable Inventories $ 1,909,288 Prepaids 3,200,000 Long Term Notes 400,000 Total $ 5,509,288
Committed FY 2012 Operating Budgets $ 3,625,000 Transportation Improvements 3,636,139 Retiree OPEB 2,100,000 Revenue Shortfall 4,000,000 BRAC Contingency Funds 1,000,000 Encumbrances 1,788,689 Total $ 16,149,828
Assigned Subsequent Capital Program $ 19,109,737 Self-Insurance 5,000,000 Incomplete Projects 2,300,000 Emergency Response 1,600,000 Natural Disaster/Emergencies 2,000,000 Total $ 30,009,737
Unassigned Total $ 29,191,314
Total Fund Balance $ 80,860,167
Subsequent Fiscal Year’s Operating Budget - On June 25, 2011, City Council approved the FY 2012 Appropriations Ordinance, which appropriated $3.6 million of General Fund Balance to meet anticipated expenditures. Transportation Improvements - With the adoption of the CY 2011 tax rate, reserving 2.2 cents for transportation improvements, a portion of revenue collected in FY 2011 from real estate revenues has been committed for transportation improvements. Retiree Health and Life (OPEB) - These monies ($2.1 million) have been committed as part of the City’s efforts to fund a health and life insurance benefit trust. Revenue Shortfall - In recognition of the uncertainty surrounding the region with regard to the federal budget and the general condition of the global economic climate, $4.0 million has been committed to provide resources in the event of revenue shortfalls stemming from these uncertain conditions. BRAC Contingency Funds - The new planned location for the Washington Headquarters Service and several other Department of Defense agencies is in the City’s West End. The arrival of approximately 6,400 new jobs to Alexandria will impact transportation in the City. Funds have been committed to address issues as they occur.

CITY OF ALEXANDRIA, VIRGINIA Notes to Financial Statements June 30, 2011 Exhibit XII (Continued) NOTE 1. SUMMARY OF SIGNIFICANT ACCOUNTING POLICIES (Continued)
55
Subsequent Fiscal Years’ Capital Program - These monies ($19.1 million) have been assigned in the Approved FY 2012 – 2021 Capital Improvement Program Funding Plans to fund a portion of the capital improvement program in FY 2012 and beyond. Self-Insurance - These monies ($5.0 million) have been assigned for reserves for the City’s self-insurance program. Incomplete Projects - These monies ($2.3 million) have been assigned for projects for which funding was available in the FY 2011budget, but not completed as of the end of the fiscal year. Emergency Response - These funds have been assigned for improved emergency response capabilities. Natural Disaster/Emergency - The funds have been assigned to cover damages and operational costs associated with responding to extraordinary emergencies. Special Revenue
Nonspendable Long Term Notes $ 2,625,521 Total $ 2,625,521
Restricted Grants $ 3,469,436 Donations 2,919,845 Housing Programs 3,331,106 Total $ 9,720,387 Committed
Other Programs $ 239,158 Sanitary Sewer 7,398,185 Stormwater 147,487 Potomac Yard 777,504 Total $ 8,562,334
Assigned Other Programs $ 4,961,270 Total $ 4,961,270
Total Fund Balance $ 25,869,512
Significant encumbrances in excess of $1.0 million as of June 30 were:
Fund Vendor Amount Capital Projects Avon Corporation $ 4,953,871 Capital Projects The Whiting-Turner Contracting $ 4,173,275 Special Revenue Gillig LLC $ 3,263,775 Capital Projects Motorola Solutions Inc $ 1,993,008 Capital Projects Verizon Select Services Inc $ 1,675,115 Capital Projects CH2M Hill, Inc $ 1,119,576
CITY OF ALEXANDRIA, VIRGINIA Notes to Financial Statements June 30, 2011 Exhibit XII (Continued) NOTE 1. SUMMARY OF SIGNIFICANT ACCOUNTING POLICIES (Continued)
56
L. Short Term Liabilities Short Term Liabilities include unclaimed funds. The City did not have any short term debt during FY 2011. NOTE 2. LEGAL COMPLIANCE – BUDGETS After a public hearing and several work sessions, the City Council adopts an annual budget no later than June 27 for the succeeding fiscal year to commence July 1. Transfers of appropriations among departments or projects are made throughout the fiscal year by the City Council. The City Council may also approve supplemental appropriations. In FY 2011, the Council approved a reappropriation of prior fiscal year encumbrances as well as various other supplemental appropriations. The City Manager has authority to transfer appropriations within each department. In FY 2011, a number of intradepartmental transfers were made.
NOTE 3. DEPOSITS AND INVESTMENTS The City maintains a pool of cash and investments in which each fund participates on a dollar equivalent and daily transaction basis. Interest is distributed monthly based on the funds’ average monthly balances. A “zero balance account” mechanism provides for daily sweeps of deposits made to City checking accounts, resulting in an instantaneous transfer to the investment account. Thus, the majority of funds in the City’s general account are invested at all times. Exceptions to this are funds in the Library System’s checking account, the School Student Activity Fund account, and some bank accounts administered by the Human Services Department. The City’s pooled portfolio also excludes pension plans.
A. Deposits
Primary Government
At June 30, 2011, the carrying value of the City’s deposits was negative $5,466,708 and the bank balance
was $1,664,987. The carrying value of the City’s deposits represents checks outstanding. This amount will fluctuate depending on the difference between checks issued and checks paid. The funds for these checks remain invested until the checks are presented for payment at the bank. The entire bank balance was covered by federal depository insurance or collateralized in accordance with the Virginia Security for Public Deposits Act (The Act). The Act provides for the pooling of collateral pledged with the Treasurer of Virginia to secure public deposits as a class. No specific collateral can be identified as security for one public depositor and public depositors are prohibited from holding collateral in their name as security for deposits. The State Treasury Board is responsible for monitoring compliance with the collateralization and reporting requirements of the Act and for notifying local governments of compliance by banks and savings and loan associations. A multiple financial institution collateral pool that provides for additional assessments is similar to depository insurance. If any member financial institution fails, the entire collateral pool becomes available to satisfy the claims of governmental entities. If the value of the

CITY OF ALEXANDRIA, VIRGINIA Notes to Financial Statements June 30, 2011 Exhibit XII (Continued) NOTE 3. DEPOSITS AND INVESTMENTS (Continued)
57
pool’s collateral were inadequate to cover the loss, additional amounts would be assessed on a pro rata basis to the members of the pool. Funds deposited in accordance with the requirements of the Act are considered fully secured.
Component Units
At June 30, 2011, the carrying value of deposits for the School Board was negative $2,191,707 and the bank balance was $0. The entire bank balance was covered by federal depository insurance or collateralized in accordance with the Virginia Security for Public Deposits Act as defined above.
At June 30, 2011, the carrying value of deposits and bank balance for the Library was $305,233. Of this
amount, $305,233 was collateralized at 102 percent with U.S. government agency securities as part of a repurchase agreement with Burke and Herbert Bank and Trust Company.
Transit deposits are included in the City’s pooled cash and investments.
B. Investments State Statutes authorize the City to invest in obligations of the United States or agencies thereof,
obligations of the Commonwealth of Virginia or political subdivisions thereof, commercial paper rated A-1 by Standard and Poor’s Corporation or P-1 by Moody’s Commercial Paper Record, banker’s acceptances, repurchase agreements, and the State Treasurer’s Local Government Investment Pool (LGIP). The City’s current investment policy limits investments to obligations of the United States and agencies thereof, commercial paper, LGIP and repurchase agreements fully collateralized in obligations of the United States and agencies thereof, CDARS and NOW accounts.
During fiscal year 2011 most of the City investments were placed in the State Treasurer’s Local
Government Investment Pool (LGIP). The LGIP is under the supervision of the Virginia Treasury Board and audited by the Auditor of Public Accounts. However, some investments were made in CDARS and NOW accounts where deposits are eligible for FDIC insurance.
The City and its discretely presented component units maintain nine pension plans. The plan provisions
allow the assets of the pension plans to be invested by the pension carriers in accordance with provisions of the Code of the Commonwealth of Virginia. The Plans’ investments are exposed to various risks such as interest rate, market and credit risks. Such risks, and the resulting investment security values, may be influenced by changes in economic conditions and market perceptions and expectations. Accordingly, it is at least reasonably possible that changes in the values of investment securities will occur in the near term and that such changes could materially affect the amounts reported in the statement of net assets available for benefits.
The City and its discretely presented component units’ investments are subject to interest rate, credit and
custodial risk as described below: Interest Rate Risk – As a means of limiting its exposure to fair value losses arising from rising interest
rates, the City’s investment policy limits at least half of the City’s investment portfolio to maturities of less than one year.
Credit Risk – State Statutes authorize the City to invest in obligations of the United States or agencies
thereof, obligations of the Commonwealth of Virginia or political subdivision thereof, commercial paper rated A-1 by Standard and Poor’s Corporation or P-1 by Moody’s Commercial Paper Record, banker’s acceptances, repurchase agreements, and Virginia Local Government Investment Pool. The City’s current investment policy

CITY OF ALEXANDRIA, VIRGINIA Notes to Financial Statements June 30, 2011 Exhibit XII (Continued) NOTE 3. DEPOSITS AND INVESTMENTS (Continued)
58
limits investments to obligations of the United States and agencies thereof, commercial paper, and repurchase agreements fully collateralized in the Obligations of the United States and agencies thereof and the State Treasurer’s Local Government Investment Pool (LGIP), CDARS (the Certificate of Deposit Account Registry Service, is a service that allows FDIC insured institutions to provide their customers with access to full FDIC insurance on CD investments up to $50 million) and NOW accounts (Negotiable Order of Withdrawal, an interest bearing bank account with which the customer is permitted to write drafts against money held on deposit). During the fiscal year, the City held its investments in (LGIP), CDARS and NOW accounts. The investments for six of the City’s seven pension plans are handled by Prudential, a company with an A (Excellent) rating, one of the top three, by A.M. Best rating agency. The investments for the two defined contribution plans are directed by employees and are invested in mutual funds and guaranteed investment accounts. The City has directed Prudential to invest funds for the other four defined benefit pension plans in guaranteed investment accounts, mutual funds and stocks. The Commonwealth of Virginia manages the investments of the Virginia Retirement System (VRS). Prudential also handles investments for OPEB trust fund for the City.
Custodial Risk – For an investment, custodial risk is the risk that in the event of the failure of the counter
party the City will not be able to recover the value of its investments or collateral securities that are in the possession of an outside party. Currently all City investments are held in LGIP, CDARS and NOW accounts. In the event the City has to invest in a local bank, the City requires a designated portfolio manager and that at the time funds are invested, collateral for repurchase agreements be held in the City’s name by a custodial agent for the term of the agreement and investments in obligations of the United States or its agencies be held by the Federal Reserve in a custodial account.
As of June 30, 2011, the City had the following cash, investments and maturities:
Primary Government
Investment Maturities (in years) Fair Value Less than 1 year 1-5 years s Long term State Treasurer’s Local Government Investment Pool (LGIP) $ 76,091,779 $ 76,091,779 $ --- $ --- CDARS 56,756,115 56,756,115 --- --- NOW Accounts 357,199 357,199 --- --- Total Investments Controlled by City $ 133,205,093 $ 133,205,093 $ --- $ --- OPEB Trust Investments 15,811,717 --- --- 15,811,717Pension Plan Investments (Exhibit VIII) $ 343,075,675 $ --- $ --- $ 343,075,675Total $ 492,092,485 $ 133,205,093 $ --- $ 358,887,392 Reconciliation to Total Cash and Investments:
Add: Cash on Hand and in Banks (5,466,708) Cash With Fiscal Agent 67,258,099 Total Deposits and Investments $ 553,883,876
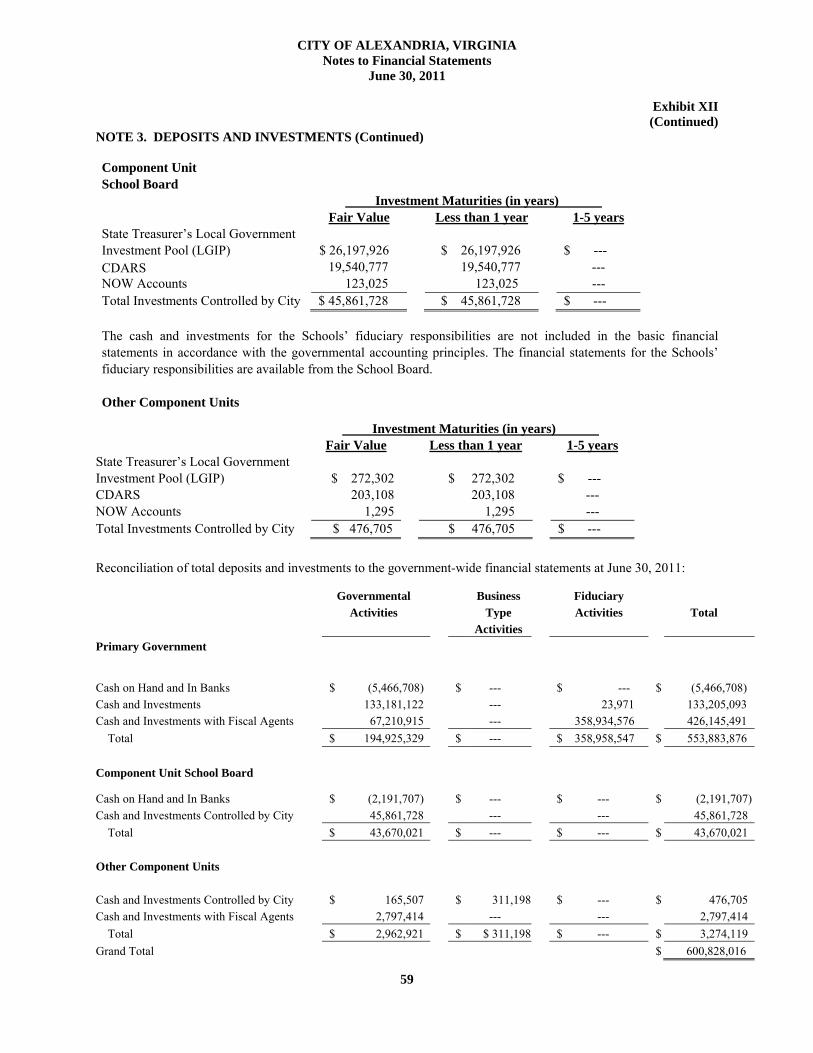
CITY OF ALEXANDRIA, VIRGINIA Notes to Financial Statements June 30, 2011 Exhibit XII (Continued) NOTE 3. DEPOSITS AND INVESTMENTS (Continued)
59
Component Unit School Board
Investment Maturities (in years) ) Fair Value Less than 1 year 1-5 years
State Treasurer’s Local Government Investment Pool (LGIP) $ 26,197,926
$ 26,197,926 $ ---
CDARS 19,540,777 19,540,777 --- NOW Accounts 123,025 123,025 --- Total Investments Controlled by City $ 45,861,728 $ 45,861,728 $ ---
The cash and investments for the Schools’ fiduciary responsibilities are not included in the basic financial statements in accordance with the governmental accounting principles. The financial statements for the Schools’ fiduciary responsibilities are available from the School Board. Other Component Units
Reconciliation of total deposits and investments to the government-wide financial statements at June 30, 2011:
Investment Maturities (in years) ) Fair Value Less than 1 year 1-5 years
State Treasurer’s Local Government Investment Pool (LGIP) $ 272,302
$ 272,302 $ ---
CDARS 203,108 203,108 --- NOW Accounts 1,295 1,295 --- Total Investments Controlled by City $ 476,705 $ 476,705 $ ---
Governmental Activities
Business Type
Activities
Fiduciary Activities
Total
Primary Government
Cash on Hand and In Banks $ (5,466,708) $ --- $ --- $ (5,466,708) Cash and Investments 133,181,122 --- 23,971 133,205,093 Cash and Investments with Fiscal Agents 67,210,915 --- 358,934,576 426,145,491 Total $ 194,925,329 $ --- $ 358,958,547 $ 553,883,876 Component Unit School Board
Cash on Hand and In Banks $ (2,191,707) $ --- $ --- $ (2,191,707)Cash and Investments Controlled by City 45,861,728 --- --- 45,861,728 Total $ 43,670,021 $ --- $ --- $ 43,670,021 Other Component Units
Cash and Investments Controlled by City $ 165,507 $ 311,198 $ --- $ 476,705 Cash and Investments with Fiscal Agents 2,797,414 --- --- 2,797,414 Total $ 2,962,921 $ $ 311,198 $ --- $ 3,274,119 Grand Total $ 600,828,016

CITY OF ALEXANDRIA, VIRGINIA Notes to Financial Statements June 30, 2011 Exhibit XII (Continued) NOTE 4. RECEIVABLES
60
Receivables at June 30, 2011 consist of the following: Primary Government
General
Special Revenue
Capital Project
Total
Taxes Real Property $
164,652,769
$ --- $ --- $
164,652,769
Personal Property 43,531,911 --- --- 43,531,911 Penalties and Interest 3,255,908 --- --- 3,255,908 Other 2,953,806 --- --- 2,953,806 Total Taxes $ 214,394,394 $ --- $ --- $ 214,394,394 Accounts $ 6,875,120 $ 1,157,844 $ --- $ 8,032,964 Interest 181,676 --- --- 181,676 Intergovernmental 31,821,457 8,986,447 --- 40,807,904 Notes 409,000 37,788,707 1,475,000 39,672,707 Gross Receivables $ 253,681,647 $ 47,932,998 $ 1,475,000 $ 303,089,645Less: Allowance for Uncollectibles
16,666,924
35,163,186
1,475,000
53,305,110
Net Receivables $ 237,014,723 $ 12,769,812 $ --- $ 249,784,535 Taxes receivable represents the current and past four years of uncollected tax levies for personal property
taxes and the current and past nineteen years for uncollected tax levies on real property. The allowance for estimated uncollectible taxes receivable is 7.87 percent of the total taxes receivable at June 30, 2011 and is based on historical collection rates. Almost all of the uncollectible taxes derive from personal property taxes. Almost all of the real property tax receivables as of June 30, 2011 represent the second-half payment due for real estate taxes on November 15, 2011.
Receivables on a government-wide basis include taxes receivable of $1.5 million that are not available to
pay for current period expenditures and, therefore, are offset by the unearned revenue for the governmental funds. Tax revenues and the corresponding unearned revenue reported on a government-wide basis do not include approximately $0.9 million of taxes that are considered current financial resources, and therefore, are reported in the governmental funds. This comprises:
Real Estate tax receivables $ (52,407) Personal Property tax receivables 988,462 Total $ 936,055

CITY OF ALEXANDRIA, VIRGINIA Notes to Financial Statements June 30, 2011 Exhibit XII (Continued) NOTE 4. RECEIVABLES (Continued)
61
Governmental funds report unearned revenue in connection with receivables for revenues that are not considered to be available to liquidate liabilities of the current period. Governmental funds also include unearned revenue related to resources that have been received but not yet earned. At the end of FY 2011 unearned revenue in the governmental funds consisted of the following:
Unavailable Unearned Total Property taxes, net of related allowances
$
219,253,563
$
4,380,588
$
223,634,151
Grant proceeds received prior to completion of eligibility requirements
---
6,766,095
6,766,095
Total unearned revenue for governmental funds
$
219,253,563
$
11,146,683
$
230,400,246
Component Units Receivables at June 30, 2011 consist of following:
School Board
Transit
Total Accounts $ 576,829 $ 2,991 $ 579,820 Intergovernmental 9,991,876 3,280 9,995,156 Total Receivables $ 10,568,705 $ 6,271 $ 10,574,976
All of the component units' receivables are considered to be collectible.
All deferred revenue in the component units is unearned.
A. Property Taxes
The City levies real estate taxes on all real property on a calendar year basis, at a rate enacted by the City Council on the assessed value of property (except public utility property) as determined by the Director of Real Estate Assessments of the City. The Commonwealth assesses public utility property. Neither the City nor the Commonwealth imposes a limitation on the tax rate. All property is assessed at 100 percent of fair market value and reassessed each year as of January 1. The Director of Real Estate Assessments, by authority of City ordinance, prorates billings for property incomplete as of January 1, but completed during the year.
Real estate taxes are billed in equal semi-annual installments due June 15 and November 15. The taxes receivable balance at June 30, 2011 includes amounts not yet received from the January 1, 2011 levy (due June 15 and November 15, 2011), less an allowance for uncollectibles. The installment due on November 15, 2011 is included as unavailable revenue since these taxes are restricted for use until FY 2012. Liens are placed on the property on the date real estate taxes become delinquent and must be satisfied prior to the sale or transfer of the property. In addition, any uncollected amounts from previous years' levies are incorporated in the taxes receivable balance. The tax rate was 99.8¢ and 97.8¢ per $100 of assessed value during calendar years 2011 and 2010, respectively.

CITY OF ALEXANDRIA, VIRGINIA Notes to Financial Statements June 30, 2011 Exhibit XII (Continued) NOTE 4. RECEIVABLES (Continued)
62
Personal property tax assessments on tangible business property and all motor vehicles are based on 100 percent of fair market value of the property as of January 1 of each year. For a vehicle, the tax may be prorated for the length of time the vehicle has situs in the City. Personal property taxes for the calendar year are due on October 5. Personal property taxes do not create a lien on property; however, City vehicle decals, which are required by law for all vehicles garaged in the City, may not be issued to any individual having outstanding personal property taxes. The taxes receivable balance at June 30, 2011 includes amounts not yet billed or received from the January 1, 2011 levy (due October 5, 2011). These taxes are included as unearned revenue since these taxes are restricted for use until FY 2012. The tax rates during calendar years 2011 and 2010 were $4.75 for motor vehicles and tangible property and $4.50 for machinery and tools per $100 of assessed value. In addition, any uncollected amounts from prior year levies are incorporated in the taxes receivable balance. Under the provisions of the Personal Property Tax Relief Act of 1998 (PPTRA), the City billed and collected from the State 69 percent of most taxpayers’ payments in FY 2011 for the January 1, 2010 levy for the Commonwealth’s share of the local personal property tax payment with the remainder collected by the Commonwealth from taxpayers. Unavailable revenues include the state share of the January 1, 2011 levy.
B. Notes Receivable
The gross amount of notes receivable is primarily for the City’s housing programs and consisted of the following at June 30, 2011:
Governmental Activities General Fund $ 409,000 Special Revenue Fund 37,788,707 Capital Projects Fund 1,475,000 Less Allowance for Uncollectible Accounts (36,647,186) Net $ 3,025,521 Amounts due within one year $ 97,981 Amounts due in more than one year $ 2,927,540

CITY OF ALEXANDRIA, VIRGINIA Notes to Financial Statements June 30, 2011 Exhibit XII (Continued)
63
NOTE 5. CAPITAL ASSETS The following is a summary of the changes in capital assets for the fiscal year ended June 30, 2011: Governmental Activities Balance
June 30, 2010
Increases
Decreases
Balance June 30,
2011 Capital Assets Not Being Depreciated: Land and Land Improvements $ 92,019,388 $ 6,648,015 $ --- $ 98,667,403 Construction in Progress 90,237,123 71,941,402 43,935,717 118,242,808 Total Capital Assets Not Being Depreciated
$
182,256,511
$
78,589,417
$
43,935,717
$
216,910,211
Depreciable Capital Assets: Buildings $ 431,313,275 $ 10,263,486 $ 1,271,663 $ 440,305,098 Infrastructure 186,435,818 20,178,060 --- 206,613,878 Intangible Assets 11,218,896 89,324 --- 11,308,220 Furniture and Other Equipment 57,038,151 13,785,921 2,192,256 68,631,816 Total Depreciable Capital Assets $ 686,006,140 $ 44,316,791 $ 3,463,919 $ 726 ,859,012 Less Accumulated Depreciation for: Buildings $ 99,132,330 $ 10,666,926 $ 36,169 $ 109,763,087 Infrastructure 79,726,842 7,229,778 --- 86,956,620 Intangible Assets 10,541,805 332,344 --- 10,874,149 Furniture and Other Equipment 39,520,871 4,665,535 2,079,142 42,107,264 Total Accumulated Depreciation $ 228,921,848 $ 22,894,583 $ 2,115,311 $ 249,701,120 Depreciable Capital Assets, Net
$
457,084,292
$
21,422,208
$
1,348,608
$
477,157,892
TOTALS $ 639,340,803 $ 100,011,625 $ 45,284,325 $ 694,068,103
The City acquires and maintains all capital assets for the Library. Accordingly, Library capital assets are included in the governmental activities totals.

CITY OF ALEXANDRIA, VIRGINIA Notes to Financial Statements June 30, 2011 Exhibit XII (Continued) NOTE 5. CAPITAL ASSETS (Continued)
64
Governmental activities capital assets, net of accumulated depreciation at June 30, 2011, are comprised of the following: General Capital Assets, Net $ 684,985,471 Internal Service Fund Capital Assets, Net 9,082,632 TOTAL $ 694,068,103 Depreciation was charged to governmental functions as follows:
General Government $ 1,138,481 Judicial Administration 783,498 Public Safety 2,955,087 Public Works 10,712,772 Health and Welfare 599,924 Culture and Recreation 2,306,259 Education 4,192,164 Community Development 206,398 Total $ 22,894,583 Capital outlays are reported as expenditures in the governmental funds; however, in the Statement of Activities, the cost of capital assets is allocated over their estimated useful lives as depreciation expense. The adjustment from governmental funds to the government-wide statements is summarized as follows: Primary Government City Capital Outlay $ 91,546,712 Donated Assets 2,952,829 Depreciation Expense (22,894,583) Capital Outlay not Capitalized (19,262,108) Total Adjustment $ 52,342,850 Donated assets are comprised of infrastructure donated by developers.
Net assets invested in capital assets, net of related debt is computed as follows:
Capital Assets (net) $ 694,068,103 Outstanding bonds (including premium) $ (425,910,998) Unspent bond proceeds at SNAP 67,210,915 (358,700,083) Invested in Capital Assets Net of Debt $ 335,368,020

CITY OF ALEXANDRIA, VIRGINIA Notes to Financial Statements June 30, 2011 Exhibit XII (Continued) NOTE 5. CAPITAL ASSETS (Continued)
65
Component Unit - School Board
The following is a summary of the changes in capital assets for the fiscal year ended June 30, 2011: Balance
June 30, 2010
Increases
Decreases
Balance June 30,
2011 Capital Assets Not Being Depreciated: Land and Land Improvements $ 999,381 $ --- $ --- $ 999,381 Total Capital Assets Not Being Depreciated
$
999,381
$
---
$
---
$
999,381
Depreciable Capital Assets: Buildings $ 36,855,522 $ 1,682,617 $ --- $ 38,538,139 Furniture and Other Equipment 11,612,372 807,192 352,918 12,066,646 Total Depreciable Capital Assets $ 48,467,894 $ 2,489,809 $ 352,918 $ 50,604,785 Less Accumulated Depreciation 42,382,121 1,390,309 352,918 43,419,512 Depreciable Capital Assets, Net $ 6,085,773 $ 1,099,500 $ --- $ 7,185,273 TOTALS $ 7,085,154 $ 1,099,500 $ --- $ 8,184,654 In FY 2002, the Virginia Assembly passed a general law to respond to GASB Statement No. 34 that establishes the local option of creating, for financial reporting purposes, a tenancy in common with the local school board when a city or county issues bonds for acquisition, construction or improvement of public school property. The sole purpose of the law is to allow cities and counties the ability to record together school assets and related debt liabilities. As a result, certain assets purchased with the City’s general obligation bonds are now recorded as part of the primary government. According to the law, the tenancy in common ends when the associated obligation is repaid; therefore, the assets will revert to the Alexandria School Board when the bonds are repaid. Nothing in the law alters the authority or responsibility of the local school board or control of the assets. All depreciation was charged to education.

CITY OF ALEXANDRIA, VIRGINIA Notes to Financial Statements June 30, 2011 Exhibit XII (Continued) NOTE 5. CAPITAL ASSETS (Continued)
66
Component Unit – Alexandria Transit Company
Balance Balance June 30, 2010 Increases Decreases June 30, 2011 Capital Assets Not Being Depreciated: Land and Land Improvements $ 6,504,807 $ --- $ 6,504,807 $ --- Depreciable Capital Assets: Equipment $ 20,673,128 $ 430,904 $ 122,208 $ 20,981,823 Less Accumulated Depreciation 13,549,986 1,444,654 352,372 14,642,267 Total Depreciable Capital Assets, Net $ 7,123,142 $(1,013,750) $ (230,164) $ 6,339,556 TOTALS $ 13,627,949 $(1,013,750) $ 6,274,643 $ 6,339,556 All depreciation was charged to transit.
Primary Government
Construction in progress is composed of the following at June 30, 2011: Expended Project Through Authorization June 30, 2011 Committed
School Capital Projects $ 25,422,486 $ 22,363,100 $ --- Infrastructure 6,713,164 1,045,452 317,957 Public Safety Buildings 112,784,591 91,265,102 13,340,047 Information Technology 3,484,327 3,244,086 1,991 Information Technology Hardware 531,157 325,068 8,678 TOTALS $ 148,935,725 $ 118,242,808 $ 13,668,673
Component Units
There was no construction in progress authorizations for the component units.

CITY OF ALEXANDRIA, VIRGINIA Notes to Financial Statements June 30, 2011 Exhibit XII (Continued) NOTE 6. RISK MANAGEMENT
67
The City is exposed to various losses related to torts: theft of, damage to, and destruction of assets; errors and omissions; injuries to employees; and natural disasters. It is the policy of the City to retain risks of losses in those areas where it believes it is more economical to manage its risks internally and account for any claims settlement in the General Fund. Exceptions to the self-insurance program are made when insurance coverage is available and when premiums are cost effective. The City is covered by property/casualty insurance policies on real and personal property (except vehicles) and the following liability insurance policies as of June 30, 2011: public entity and public officials excess liability, medical malpractice liability, voting booths, special events, vacant buildings, volunteer liability, and commercial crime. In addition, the City maintains excess workers’ compensation insurance. The City maintains a blanket surety bond on all City workers who handle funds and excess amounts on key officials. There were no material reductions in insurance coverage from coverage in the prior fiscal year, nor did settlements exceed coverage for any of the past three fiscal years.
The City is self insured for workers’ compensation claims up to $1 million and for public officers, public entity, physical damage to vehicles, and vehicle general liability under $2 million and over $10 million.
The following Constitutional Officers and City employees are covered by surety bonds issued in the
amounts shown below by Aetna Casualty and Surety as of June 30, 2011:
Director of Finance..................................................................................... $ 1,000,000 Treasury Director ....................................................................................... $ 500,000 Revenue Director ....................................................................................... $ 150,000 Clerk of the Circuit Court ........................................................................... $ 103,000* Sheriff ......................................................................................................... $ 30,000* All other City employees ............................................................................ $ 100,000 Alexandria Historic Restoration and Preservation Commissioners ........... $ 10,000
* Bond provided by the Commonwealth of Virginia Self-Insurance
The non-current portion of unpaid workers' compensation claims amounted to approximately $13.5 million as of June 30, 2011 and is reflected in the government-wide statements. The current portion is recorded as an accrued liability in the General Fund and the government-wide financial statements. In FY 2009 the City became self-insured for one of the two health insurance plans offered to employees. At June 30, 2011 the current portion of employees’ health insurance was $1.1 million which represents an estimate of health insurance claims that have been incurred but not reported and are reported in accrued liabilities. The amount of expenditures did not exceed funds that are available to pay the claims. Therefore a long-term liability has not been recorded as of June 30, 2011. Liabilities are reported when it is probable that losses have occurred and the amounts of the losses can be reasonably estimated. Liabilities include an amount for claims that have been incurred but not reported to date. Liabilities are determined using a combination of actual claims experience and actuarially determined amounts and include incremental claim adjustment expenses and estimated recoveries. An independent contractor processes claims and the City records a provision and liability in the government-wide statements and General Fund (current portion only) for an estimate of incurred but not reported claims.

CITY OF ALEXANDRIA, VIRGINIA Notes to Financial Statements June 30, 2011 Exhibit XII (Continued) NOTE 6. RISK MANAGEMENT (Continued)
68
Changes in the estimated claims payable for workers’ compensation and health insurance during the fiscal years ended June 30, 2011 and 2010 were as follows:
Insurance Designation
In addition, the City has established a General Fund fund balance self-insurance designation of $5 million as of June 30, 2011. Risk Pools
On March 15, 1986, the City joined the Commonwealth of Virginia's Law Enforcement Liability plan, called VA Risk, on behalf of the Office of the Sheriff. The Division of Risk Management of the Commonwealth’s Department of General Services operates VA Risk. It was created in accordance with Sec. 2.1-526.8:1 of the Code of Virginia, which says that the State shall have the right and duty to defend any suit seeking damages or compensation against the City's officials and employees on account of wrongful acts, even if any of the allegations of the suit are groundless, false, or fraudulent, and may make investigation and settlement of any claims or suit as deemed expedient. The limits of VA Risk coverage are $1 million per claim. The City retains the risk for all claims in excess of $1 million.
Component Units
The School Board carries insurance for all risks of loss, including property insurance, theft, auto liability, physical damage, and general liability insurance through the Virginia Municipal League. The School Board is self-insured for workers compensation. School management has estimated their workers compensation liability to be $0.7 million as of June 30, 2010. Settled claims resulting from these risks have not exceeded commercial insurance coverage. There were no material reductions in insurance coverage from coverage in the prior fiscal year nor did settlements exceed coverage for any of the past three fiscal years. The Library carries commercial insurance with the Virginia Municipal League for all risks of loss including property insurance, theft, auto liability, physical damage, and general liability insurances. There were no material reductions in insurance coverage from coverage in the prior fiscal year, nor did settlements exceed coverage for any of the past three fiscal years. On October 1, 1987, the Alexandria Transit Company joined the Virginia Transit Liability Pool. Commercial companies service the Virginia Transit Liability Pool.
Worker’s Compensation
Health Insurance
July 1, 2009 Liability Balances $ 9,104,829 $ 1,188,887 Claims and changes in estimates 2,947,465 13,327,587 Claim Payments (1,779,843) (13,633,541) June 30, 2010 Liability Balances $ 10,272,451 $ 882,933 Claims and changes in estimates 6,058,371 15,101,359 Claim Payments (2,802,940) (14,914,192) June 30, 2011 Liability Balances $ 13,527,882 $ 1,070,100

CITY OF ALEXANDRIA, VIRGINIA Notes to Financial Statements June 30, 2011 Exhibit XII (Continued) NOTE 6. RISK MANAGEMENT (Continued)
69
The coverage and limits of the pool's liability to the City are as follows:
Commercial General Liability ................................................. $10 million Automobile Liability ............................................................... $10 million Uninsured Motorist .................................................................. $50,000 Automobile Physical Damage ................................................. (Actual Value)
Under the provisions of the Virginia Workers' Compensation Act, the Alexandria Transit Company has
secured the payment of Virginia compensation benefits and employers' liability coverage with the Virginia Municipal Group Self-Insurance Association (VMGSIA). VMGSIA is a public entity risk pool providing a comprehensive workers' compensation insurance program to Virginia municipalities and other local government entities. In addition to insurance coverage, the program provides risk management services with emphasis on loss control and claims administration. The Alexandria Transit Company pays an annual premium to VMGSIA for workers' compensation coverage. VMGSIA is self-sustaining through member premiums and will reinsure for claims in excess of $5 million. Each member's premium is determined through an actuarial analysis based upon the individual member's past experience and number of employees. In FY 2011, the Alexandria Transit Company paid an annual premium of $0.39 million for participation in this pool.

CITY OF ALEXANDRIA, VIRGINIA Notes to Financial Statements June 30, 2011 Exhibit XII (Continued)
70
NOTE 7. OPERATING LEASES Rental Costs
The City and the School Board lease office space and equipment under various long-term operating lease agreements expiring at various dates through FY 2026. Certain leases contain provisions for possible future increased rentals based upon changes in the Consumer Price Index.
Scheduled minimum rental payments for succeeding fiscal years ending June 30 are as follows:
Primary School Board Fiscal Year Government Component Unit
2012 $ 5,323,508 $ 1,065,854 2013 4,842,093 1,071,305 2014 4,823,508 852,123 2015 3,988,817 873,426 2016 2,476,797 --- 2017-2021 4,042,151 --- 2022-2026 5,338,675 ---
Total rental costs during FY 2011 for operating leases were $6.7 million for the Primary Government and
$3.0 million for the School Board. Rental Revenues
The City also leases various City-owned properties and buildings under non-cancellable long-term lease agreements through FY 2021. The net book value of leased assets of $3.8 million (cost of $5.7 million less accumulated deprecation of $1.9 million) is included in capital assets in the government-wide financial statements. Certain leases contain provisions for future increased revenues based upon changes in the Consumer Price Index.
Scheduled minimum revenues for succeeding fiscal years ending June 30 are as follows:
Fiscal Year Total Revenues 2012 $ 571,503 2013 220,192 2014 203,452 2015 203,452 2016 203,452 2017-2021 1,017,260
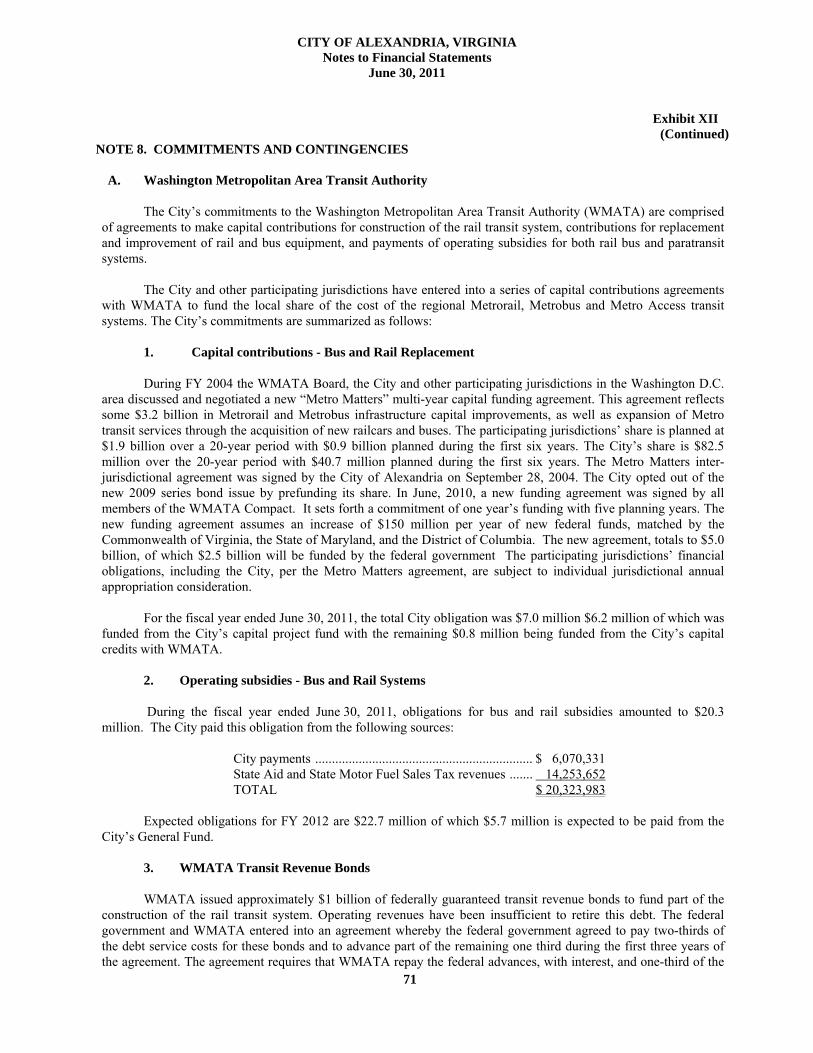
CITY OF ALEXANDRIA, VIRGINIA Notes to Financial Statements June 30, 2011 Exhibit XII
(Continued) NOTE 8. COMMITMENTS AND CONTINGENCIES
71
A. Washington Metropolitan Area Transit Authority
The City’s commitments to the Washington Metropolitan Area Transit Authority (WMATA) are comprised of agreements to make capital contributions for construction of the rail transit system, contributions for replacement and improvement of rail and bus equipment, and payments of operating subsidies for both rail bus and paratransit systems.
The City and other participating jurisdictions have entered into a series of capital contributions agreements
with WMATA to fund the local share of the cost of the regional Metrorail, Metrobus and Metro Access transit systems. The City’s commitments are summarized as follows:
1. Capital contributions - Bus and Rail Replacement
During FY 2004 the WMATA Board, the City and other participating jurisdictions in the Washington D.C.
area discussed and negotiated a new “Metro Matters” multi-year capital funding agreement. This agreement reflects some $3.2 billion in Metrorail and Metrobus infrastructure capital improvements, as well as expansion of Metro transit services through the acquisition of new railcars and buses. The participating jurisdictions’ share is planned at $1.9 billion over a 20-year period with $0.9 billion planned during the first six years. The City’s share is $82.5 million over the 20-year period with $40.7 million planned during the first six years. The Metro Matters inter-jurisdictional agreement was signed by the City of Alexandria on September 28, 2004. The City opted out of the new 2009 series bond issue by prefunding its share. In June, 2010, a new funding agreement was signed by all members of the WMATA Compact. It sets forth a commitment of one year’s funding with five planning years. The new funding agreement assumes an increase of $150 million per year of new federal funds, matched by the Commonwealth of Virginia, the State of Maryland, and the District of Columbia. The new agreement, totals to $5.0 billion, of which $2.5 billion will be funded by the federal government The participating jurisdictions’ financial obligations, including the City, per the Metro Matters agreement, are subject to individual jurisdictional annual appropriation consideration.
For the fiscal year ended June 30, 2011, the total City obligation was $7.0 million $6.2 million of which was
funded from the City’s capital project fund with the remaining $0.8 million being funded from the City’s capital credits with WMATA.
2. Operating subsidies - Bus and Rail Systems
During the fiscal year ended June 30, 2011, obligations for bus and rail subsidies amounted to $20.3
million. The City paid this obligation from the following sources:
City payments ................................................................. $ 6,070,331 State Aid and State Motor Fuel Sales Tax revenues ....... 14,253,652 TOTAL $ 20,323,983
Expected obligations for FY 2012 are $22.7 million of which $5.7 million is expected to be paid from the
City’s General Fund. 3. WMATA Transit Revenue Bonds
WMATA issued approximately $1 billion of federally guaranteed transit revenue bonds to fund part of the
construction of the rail transit system. Operating revenues have been insufficient to retire this debt. The federal government and WMATA entered into an agreement whereby the federal government agreed to pay two-thirds of the debt service costs for these bonds and to advance part of the remaining one third during the first three years of the agreement. The agreement requires that WMATA repay the federal advances, with interest, and one-third of the

CITY OF ALEXANDRIA, VIRGINIA Notes to Financial Statements June 30, 2011 Exhibit XII
(Continued) NOTE 8. COMMITMENTS AND CONTINGENCIES (Continued)
72
debt service on the bonds. WMATA allocated the cost of the advances and the one-third of the debt service costs among the participating jurisdictions. The City has not agreed to any payments for the one-third allocation of debt service, but the Northern Virginia Transportation Commission (NVTC) has paid, from state aid, all such costs allocated to Northern Virginia jurisdictions, of which $1,418,200 was the City’s allocation during the fiscal year ended June 30, 2010. However, NVTC has not paid any of the allocations for federal advances. In July of 1985, the Alexandria City Council authorized NVTC to pay $4.2 million to WMATA, including accrued interest, from state aid on deposit to the credit of the City. This was the total amount allocated to the City by WMATA for advances by the federal government, including accrued interest. The City has thus, with such authorization, satisfied all claims due WMATA for transit revenue bonds.
4. City’s long term development initiative for a new Metro station At the current time, as a major long-term economic development initiative, the City on June 12, 2010
approved a major rezoning of 69 acres of prime real estate into a high density mixed-use development of over 7.5 million square feet. An integral part of this proposal, which will add approximately 10 percent to the City’s tax base and generate over $1 billion in new tax revenue over a 30 year period, would entail the construction of a new Metrorail station on the existing heavy rail Metrorail line that runs to the east of this 69 acres. The cost of this Metrorail station is estimated (in 2015 dollars) at between $190 million and $270 million, depending on the location of the station and other cost variables. The City is currently considering issuing general obligation bonds to finance this Metrorail station construction project and plans to repay these bonds with new tax revenues, two special tax districts, and developer contributions. Other bond financing mechanisms are also being studied. Planning, further studies, station design and refinement of costs are scheduled to occur between 2010 and 2013. A final decision by City Council to proceed with the Metrorail station financing will be made in 2013 at the earliest.
If the City does decide to proceed with the financing of the Metrorail station, it will require a material upward revision to its current debt policy guideline targets and limits, in that the amount of debt that may be issued would exceed the City’s current debt targets and ceilings.
B. Litigation
The City is contingently liable with respect to lawsuits and other claims that arise in the ordinary course of its operations. It is the opinion of City management and the City Attorney that any losses not covered by insurance that may ultimately be incurred as a result of the suits and claims will not be material.
C. Waste-To-Energy Facility
The City has guaranteed annual tonnage of acceptable waste commitment to the Waste-to-Energy Facility, which is owned and operated by a private corporation. The commitment, which is joint with Arlington County, is based on a percent of solid waste the City and Arlington County expects to collect together. The facility charges fees on each ton based on defined costs, as well as has two multi-year contracts for large haulers where a fee discount applies. It is expected that the City and Arlington County will be able to continue to meet their minimum requirement for annual tonnage of 225,000 tons per year. For FY 2011 and for every year the facility has been open, the City and Arlington County exceeded the minimum annual tonnage requirement. If the City would be required to augment this requirement, the financial effect on the City would be immaterial.
On December 1, 1984, an inter-local joint enterprise agreement was entered into between the Alexandria
Sanitation Authority and the Arlington Solid Waste Authority (the “Authorities”). The Joint Enterprise, referred to as the Alexandria/Arlington Resource Recovery Corporation, was formed to design, construct, equip, test, then operate a solid waste disposal facility having an installed capacity of 975 tons per day of mixed municipal solid waste. The facility is located at 5301 Eisenhower Avenue, Alexandria, Virginia. The Alexandria Industrial Development Authority issued revenue bonds and proceeds were lent to the Authorities to construct the facility.

CITY OF ALEXANDRIA, VIRGINIA Notes to Financial Statements June 30, 2011 Exhibit XII
(Continued) NOTE 8. COMMITMENTS AND CONTINGENCIES (Continued)
73
On October 22, 1985, the Authorities sold the Facility to a private company (“the Corporation”) pursuant to a Conditional Sale and Security Agreement (the Agreement). The sale involved the transfer of construction-in-progress together with marketable securities and other assets. The Corporation assumed the obligation to provide funds adequate to pay the current liabilities and the outstanding revenue bonds payable as of October 22, 1985. This Agreement requires the Authorities to transfer full title to the Facility only when principal and interest on the outstanding revenue bonds or any subsequent refinancing revenue bonds have been paid in full. The Agreement also entitles the Authorities to repossess the Facility if revenue bond debt service payments are not made.
In connection with this transaction, the Corporation entered into a Facility Agreement dated as of October 1,
1986, obligating it to construct the Facility and to provide waste disposal services to the City of Alexandria, Arlington County, and the Authorities for 20 years. Under the Facility Agreement, the City has a guaranteed annual tonnage of acceptable waste commitment to the Facility. The commitment was based on a percent of solid waste the City expects to collect. The Facility charges a fee on each ton based on defined costs, and the City has met its requirement for annual tonnage each year.
Federal law changes in the Clean Air Act and subsequent regulations required the City and Arlington
County to invest in a retrofit for new equipment at the Waste-To-Energy Facility. In July 1998, the Authorities advance refunded $55 million of the outstanding revenue bonds (Series 1998 A bonds) for the Facility to take advantage of lower interest rates. The Series A bonds were fully repaid in FY 2008. In November 1998, the Arlington Industrial Development Authority issued $48.6 million in new retrofit revenue bonds (Series 1998 B bonds) to cover the cost of new pollution abatement equipment at the Facility required by federal law. The proceeds of the Series 1998 B bonds were lent to Authorities to construct the equipment.
The retrofitting of the Facility’s boiler units with certain air pollution control equipment was made necessary
by the U. S. Environmental Protection Agency regulations adopted pursuant to the 1990 Clean Air Act Amendments, which imposed more stringent emission limitations on waste-to energy facilities. The Corporation has agreed to design, construct, start-up, and test the equipment so that it passes the Acceptance tests.
Since Acceptance testing on each unit was completed in November 2000, the Operating Lease agreement
between the Authorities and the Corporation took effect in January 2001. Since in essence the lease is a capital lease, the capital assets completed and covered by the lease and the promissory note are removed from the City records and are now considered a part of the plant. In FY 2008 they were recorded in the same manner, as is the rest of the plant.
The Alexandria/Arlington Waste Disposal Trust Fund (“the Trust”) is a private purpose trust fund of
Arlington County, Virginia and, accordingly, the financial position and results of operations of the Trust are reflected in the comprehensive annual financial report of Arlington County, Virginia. The City of Alexandria, Virginia and Arlington County, Virginia each have a 50% ownership interest in the Trust; however, because Arlington County performs the administrative functions for the Trust, it is reflected in the Arlington County reporting entity. As part of the Conditional Sale and Security Agreement, the Corporation made a payment of $1 million to the Trust, which was to be used as a reserve for future expenditures.
The Trust Fund derives its revenue from the following sources: a portion of the annual property tax
assessment by the City of Alexandria, interest on invested funds and a portion of special revenues generated on contract waste and was $0.6 million for FY 2011.
Expenditures such as capital costs of repairs, replacement/changes to the facility, and waste recycling
programs/activities which benefit the two jurisdictions are eligible for reimbursement though the Trust. In addition, in FY 2011 the Trust has been used to pay consulting fees to an engineering firm for operations and maintenance audits of the facility, for oversight of the new construction and for legal consulting fees paid for services related to the issuance of retrofit financing.

CITY OF ALEXANDRIA, VIRGINIA Notes to Financial Statements June 30, 2011 Exhibit XII
(Continued) NOTE 8. COMMITMENTS AND CONTINGENCIES (Continued)
74
The Trust also has been used to subsidize the difference between the contractual tipping fee paid by haulers under special contracts and the standard tipping fee and to cover deficiencies arising in the “income-available-for-debt-service” calculations mandated by the Facility Agreement between the Corporation, the jurisdictions, and the Authorities. In June 2001, the City of Alexandria, with the concurrence of Arlington County, took responsibility for the investment of Trust fund monies.
Operating costs of the facility are paid for primarily through tipping fees. The City paid $1.7 million in
tipping fees in FY 2011. In the event of a revenue shortfall at the facility, the City is not responsible for the repayment of the bonds. The Alexandria Sanitation Authority and the Arlington Solid Waste Authority have certain bond repayment obligations.
D. Northern Virginia Transportation District Bonds
In November 1999, the City signed an agreement with the Commonwealth Transportation Board to provide $256,070 annually, subject to appropriation, to finance certain Northern Virginia Transportation District Bond projects benefiting the City and other jurisdictions in Northern Virginia. The FY 2011 payment of $256,070 was made from the proceeds from the City’s telecommunications tax received by the General Fund. The City is not liable for repayment of the 20-year bonds.

CITY OF ALEXANDRIA, VIRGINIA Notes to Financial Statements June 30, 2011 Exhibit XII
(Continued)
75
NOTE 9. LONG-TERM DEBT General Obligation Bonds - The City issues general obligation bonds to provide funds for the acquisition and construction of major capital facilities. General obligation bonds are direct obligations and pledge the full faith and credit of the City. These bonds are subject to the provisions of the Internal Revenue Code of 1986 related to arbitrage and interest income tax regulations under those provisions. The City currently has no outstanding arbitrage obligation. General obligation bonds outstanding as of June 30, 2011 are composed of the following individual issues:
$17.0 million Public Improvement (tax-exempt) Bonds of 2010, installments ranging from $1.0 million to $3.7 million through 2016, bearing interest at rates ranging from 4.0 percent to 5.0 percent. The bonds are not subject to redemption prior to maturity ................................................................................................ $ 17,000,000$55.3 million Public Improvement (taxable Build America) Bonds of 2010, installments ranging from $3.7 million to $4.4 million through 2030, bearing interest at rates ranging from 3.6 percent to 5.0 percent for which the federal government provides a 35 percent interest rate subsidy. The Bonds maturing on or after July 1, 2021 are subject to optional redemption, in whole or part, at the direction of the City. The bonds are subject to redemption prior to July 2020, at the option of the City, upon the occurrence of an Extraordinary Event. ............................................................................................................. 55,300,000$35.2 million Public Improvement (tax-exempt) Bonds of 2009 installments ranging from $1.1 million to $4.1 million through 2019, bearing interest at rates ranging from 1.75 percent to 4.0 percent. The Bonds are not subject to redemption prior to maturity ................................................................................................ 34,100,000$44.5 million Public Improvement (taxable-Build America) Bonds of 2009 installments ranging from $4.1 million to $4.8 million through 2029, bearing interest at rates ranging from 4.85 percent to 5.7 percent for which the Federal government provides a 35 percent interest rate subsidy. The Bonds maturing on or after July 1, 2019, are subject to optional redemption before maturity on or after July 1, 2019, at the direction of the City, in whole or in part installments of $5,000 at any time or from time to time at par plus the interest accrued on the principal amount to be redeemed to the date fixed for redemption ....................................................................................................................................................... 44,500,000$58.0 million Public Improvement (tax-exempt) Bonds of 2008 installments ranging from $0.9 million to $3.1 million through 2028, bearing interest at rates ranging from 3.375 percent to 5.0 percent. The Bonds maturing on or after July 15, 2019, are subject to optional redemption before maturity on or after July 15, 2018, at the direction of the City, in whole or in part installments of $5,000 at any time or from time to time at par plus the interest accrued on the principal amount to be redeemed to the date fixed for redemption ....................................................................................................................................................... 55,200,000$5.0 million Public Improvement (taxable) Bonds of 2008 installments ranging from $0.25 million to $1.25 million through 2028, bearing interest at rates ranging from 4.5 percent to 5.6 percent. The Bonds maturing on or after July 15, 2019, are subject to optional redemption before maturity on or after July 15, 2018, at the direction of the City, in whole or in part installments of $5,000 at any time or from time to time at par plus the interest accrued on the principal amount to be redeemed to the date fixed for redemption .......................................................................................................................................................
4,500,000$22.8 million Public Improvement (tax-exempt) Refunding Bonds of 2007 installments ranging from $2.8 million to $2.9 million through 2021, bearing interest at rates ranging from 4.0 percent to 5.0 percent. The bonds are not subject to redemption prior to their maturity .....................................................
22,815,000

CITY OF ALEXANDRIA, VIRGINIA Notes to Financial Statements June 30, 2011 Exhibit XII
(Continued) NOTE 9. LONG-TERM DEBT (Continued)
76
$56 million Public Improvement (tax-exempt) Bonds of 2006 installments of $2.9 million through 2026, bearing interest at rates ranging from 4.00 percent to 5.0 percent. The bonds maturing on or after June 15, 2017, are subject to optional redemption before maturity on or after June 15, 2016, at the direction of the City, in whole or in part installments of $5,000 at any time or from time to time at par plus the interest accrued on the principal amount to be redeemed to the date fixed for redemption ............................ $ 43,740,000$15 million Public Improvement (taxable) Bonds of 2006 installments of $0.75 million through 2026, bearing interest at rates ranging from 5.5 percent to 5.95 percent. The bonds maturing before December 15, 2016 are not subject to redemption before maturity. The bonds maturing on or after June 15, 2017, are subject to optional redemption before maturity on or after June 15, 2016, at the direction of the City, in whole or in part installments of $5,000, at any time or from time to time at par plus accrued interest on the principal amount to be redeemed to the date fixed for redemption ............................................................
11,250,000$54.8 million Public Improvement Bonds of 2004 installments of $2.74 million through 2024, bearing interest at rates ranging from 3.0 percent to 5.0 percent. The bonds maturing before December 15, 2015 are not subject to redemption before maturity. Beginning December 15, 2014, bonds maturing on or after June 15, 2015 are subject to redemption at the direction of the City, in whole or in part in installments of $5,000, at certain redemption prices that include a redemption premium plus accrued interest .....................
38,360,000
$32.5 million Refunding Bonds of 2004 installments ranging from $0.2 million to $3.205 million through 2020, bearing interest at rates ranging from 3.5 percent to 5.0 percent. The bonds maturing before June 15, 2015 are not subject to redemption before maturity. Beginning June 15, 2015, bonds maturing on or after June 15, 2015 are subject to redemption at the direction of the City, in whole or in part in installments of $5,000, at certain redemption prices that include a redemption premium plus accrued interest ............................................................................................................................................................
27,565,000$64.7 million Public Improvement Bonds of 2004 installments ranging from $3.3 million to $3.8 million through 2023, bearing interest at rates ranging from 4.0 percent to 5.0 percent. The bonds maturing before June 15, 2015 are not subject to redemption before maturity. Beginning June 15, 2014, bonds maturing on or after June 15, 2015 are subject to redemption at the direction of the City, in whole or in part in installments of $5,000, at certain redemption prices that include a redemption premium plus accrued interest ................................................................................................................................................
39,600,000$54.5 million Public Improvement Bonds of 2001 due in installments of $2.9 million through 2013, bearing interest at rates ranging from 4.25 percent to 4.5 percent. The bonds are not subject to redemption prior to maturity. ($23.2 million refunded in May 2007). . ...........................................................
5,790,000$40 million Public Improvement Bonds of 1999 due in annual installments of $2 million through 2019, bearing interest at rates ranging from 4.25 percent to 5.0 percent. The bonds are not subject to redemption prior to maturity ...........................................................................................................................
16,000,000Total $ 415,720,000

CITY OF ALEXANDRIA, VIRGINIA Notes to Financial Statements June 30, 2011 Exhibit XII
(Continued) NOTE 9. LONG-TERM DEBT (Continued)
77
Public Improvement Bonds of 2010 (Tax-Exempt)
CUSIP Issue Rate Maturity Date
July 1,
015302G55 $ 1,000,000 5.00% 2011 015302G63 2,000,000 5.00% 2012 015302G71 2,900,000 4.00% 2013 015302G89 3,700,000 4.00% 2014 015302G97 3,700,000 5.00% 2015 015302H21 3,700,000 4.00% 2016 Total $ 17,000,000
Public Improvement Bonds of 2010 (Taxable)
CUSIP Issue Rate Maturity Date
July 1,
015302H39 $ 3,700,000 3.60% 2017 015302H47 3,700,000 3.95% 2018 015302H54 3,700,000 4.15% 2019 015302H62 3,700,000 4.05% 2020 015302H70 3,700,000 4.40% 2021 015302H88 3,700,000 4.40% 2022 015302H96 3,700,000 4.50% 2023 015302J29 3,700,000 4.60% 2024 015302J37 3,700,000 4.80% 2025 015302J45 4,400,000 4.95% 2026 015302J52 4,400,000 5.00% 2027 015302J60 4,400,000 5.00% 2028 015302J60 4,400,000 5.00% 2029 015302J60 4,400,000 5.00% 2030 Total $ 55,300,000

CITY OF ALEXANDRIA, VIRGINIA Notes to Financial Statements June 30, 2011 Exhibit XII
(Continued) NOTE 9. LONG-TERM DEBT (Continued)
78
Public Improvement Bonds of 2009 (Tax-Exempt)
CUSIP Issue Rate Maturity Date
July 1,
015302E24 $ 2,200,000 3.00% 2011 015302E32 3,200,000 4.00% 2012 015302E40 4,100,000 1.75% 2013 015302E57 4,100,000 2.13% 2014 015302E65 4,100,000 3.00% 2015 015302E73 4,100,000 3.00% 2016 015302E81 4,100,000 4.00% 2017 015302E99 4,100,000 4.00% 2018 015302F23 4,100,000 4.00% 2019 Total $ 34,100,000
Public Improvement Bonds of 2009 (Taxable-Build America Bonds)
CUSIP Issue Rate Maturity Date
July 1,
015302F31 $ 4,100,000 4.85% 2020 015302F49 4,100,000 5.00% 2021 015302F56 4,100,000 5.10% 2022 015302F64 4,100,000 5.20% 2023 015302F72 4,100,000 5.30% 2024 015302F80 4,800,000 5.40% 2025 015302F98 4,800,000 5.50% 2026 015302G22 4,800,000 5.60% 2027 015302G30 4,800,000 5.65% 2028 015302G48 4,800,000 5.70% 2029 Total $ 44,500,000
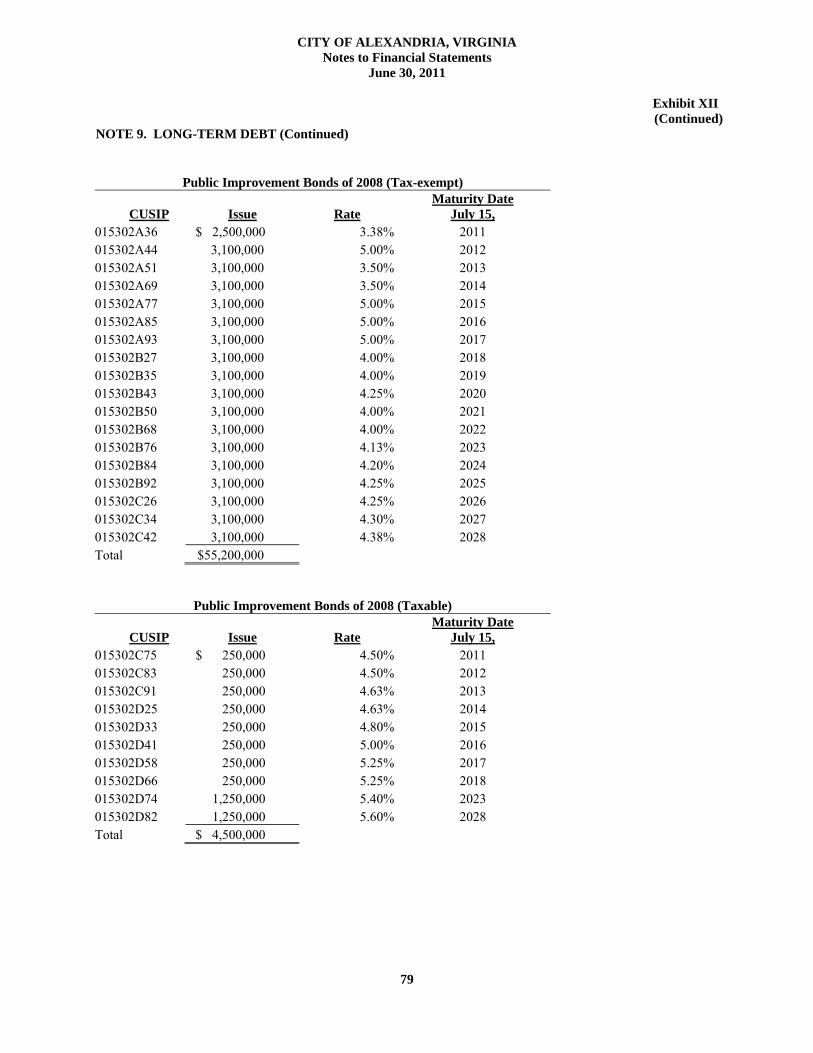
CITY OF ALEXANDRIA, VIRGINIA Notes to Financial Statements June 30, 2011 Exhibit XII
(Continued) NOTE 9. LONG-TERM DEBT (Continued)
79
Public Improvement Bonds of 2008 (Tax-exempt)
CUSIP Issue Rate Maturity Date
July 15,
015302A36 $ 2,500,000 3.38% 2011 015302A44 3,100,000 5.00% 2012 015302A51 3,100,000 3.50% 2013 015302A69 3,100,000 3.50% 2014 015302A77 3,100,000 5.00% 2015 015302A85 3,100,000 5.00% 2016 015302A93 3,100,000 5.00% 2017 015302B27 3,100,000 4.00% 2018 015302B35 3,100,000 4.00% 2019 015302B43 3,100,000 4.25% 2020 015302B50 3,100,000 4.00% 2021 015302B68 3,100,000 4.00% 2022 015302B76 3,100,000 4.13% 2023 015302B84 3,100,000 4.20% 2024 015302B92 3,100,000 4.25% 2025 015302C26 3,100,000 4.25% 2026 015302C34 3,100,000 4.30% 2027 015302C42 3,100,000 4.38% 2028 Total $55,200,000
Public Improvement Bonds of 2008 (Taxable)
CUSIP Issue Rate Maturity Date
July 15,
015302C75 $ 250,000 4.50% 2011 015302C83 250,000 4.50% 2012 015302C91 250,000 4.63% 2013 015302D25 250,000 4.63% 2014 015302D33 250,000 4.80% 2015 015302D41 250,000 5.00% 2016 015302D58 250,000 5.25% 2017 015302D66 250,000 5.25% 2018 015302D74 1,250,000 5.40% 2023 015302D82 1,250,000 5.60% 2028 Total $ 4,500,000
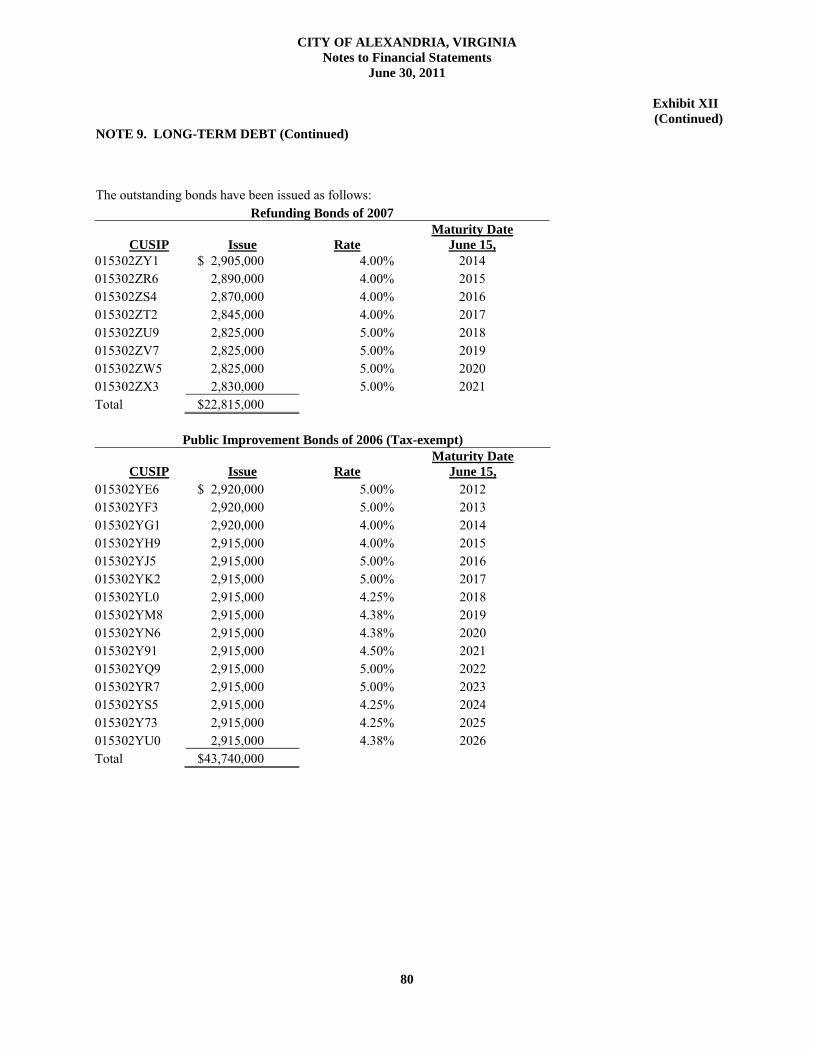
CITY OF ALEXANDRIA, VIRGINIA Notes to Financial Statements June 30, 2011 Exhibit XII
(Continued) NOTE 9. LONG-TERM DEBT (Continued)
80
The outstanding bonds have been issued as follows:
Refunding Bonds of 2007
CUSIP Issue Rate Maturity Date
June 15, 015302ZY1 $ 2,905,000 4.00% 2014 015302ZR6 2,890,000 4.00% 2015 015302ZS4 2,870,000 4.00% 2016 015302ZT2 2,845,000 4.00% 2017 015302ZU9 2,825,000 5.00% 2018 015302ZV7 2,825,000 5.00% 2019 015302ZW5 2,825,000 5.00% 2020 015302ZX3 2,830,000 5.00% 2021 Total $22,815,000
Public Improvement Bonds of 2006 (Tax-exempt)
CUSIP Issue Rate Maturity Date
June 15,
015302YE6 $ 2,920,000 5.00% 2012 015302YF3 2,920,000 5.00% 2013 015302YG1 2,920,000 4.00% 2014 015302YH9 2,915,000 4.00% 2015 015302YJ5 2,915,000 5.00% 2016 015302YK2 2,915,000 5.00% 2017 015302YL0 2,915,000 4.25% 2018 015302YM8 2,915,000 4.38% 2019 015302YN6 2,915,000 4.38% 2020 015302Y91 2,915,000 4.50% 2021 015302YQ9 2,915,000 5.00% 2022 015302YR7 2,915,000 5.00% 2023 015302YS5 2,915,000 4.25% 2024 015302Y73 2,915,000 4.25% 2025 015302YU0 2,915,000 4.38% 2026 Total $43,740,000

CITY OF ALEXANDRIA, VIRGINIA Notes to Financial Statements June 30, 2011 Exhibit XII
(Continued) NOTE 9. LONG-TERM DEBT (Continued)
81
Public Improvement Bonds of 2006 (Taxable)
CUSIP Issue Rate Maturity Date
June 15, 015302ZA3 $ 750,000 5.50% 2012 015302ZB1 750,000 5.50% 2013 015302ZC9 750,000 5.50% 2014 015302ZD7 750,000 5.55% 2015 015302ZE5 750,000 5.55% 2016 015302ZF2 750,000 5.65% 2017 015302ZG0 750,000 5.70% 2018 015302ZH8 750,000 5.75% 2019 015302ZJ4 750,000 5.80% 2020 015302ZK1 750,000 5.85% 2021 015302ZL9 750,000 5.90% 2022 015302ZM7 750,000 5.95% 2023 015302ZN5 750,000 5.95% 2024 015302ZP0 750,000 5.95% 2025 015302ZQ8 750,000 5.95% 2026 Total $11,250,000
Public Improvement Bonds of 2004 (Tax-Exempt) Refunding Bonds of 2004 (Tax-Exempt)
CUSIP Issue Rate Maturity DateDecember 15,
CUSIP Issue Rate
Maturity Date June 15,
015302XK3 $ 2,740,000 5.00 2011 015302WU2 $ 3,170,000 3.500 2012 015302XL1 2,740,000 3.00 2012 015302WV0 3,130,000 5.000 2013 015302XM9 2,740,000 3.50 2013 015302WW8 3,130,000 4.000 2014 015302XN7 2,740,000 5.00 2014 015302WX6 3,085,000 4.250 2015 015302XP2 2,740,000 4.50 2015 015302WY4 3,060,000 5.000 2016 015302XQ0 2,740,000 4.50 2016 015302WZ1 3,050,000 4.250 2017 015302XR8 2,740,000 4.00 2017 015302XA5 3,015,000 4.250 2018 015302XS6 2,740,000 4.00 2018 015302XB3 2,980,000 4.250 2019 015302XT4 2,740,000 4.00 2019 015302XC1 2,945,000 4.375 2020 015302XU1 2,740,000 4.00 2020 Total $27,565,000 015302XV9 2,740,000 4.00 2021 015302XW7 2,740,000 4.00 2022 015302XX5 2,740,000 4.25 2023 015302XY3 2,740,000 4.50 2024 Total $38,360,000
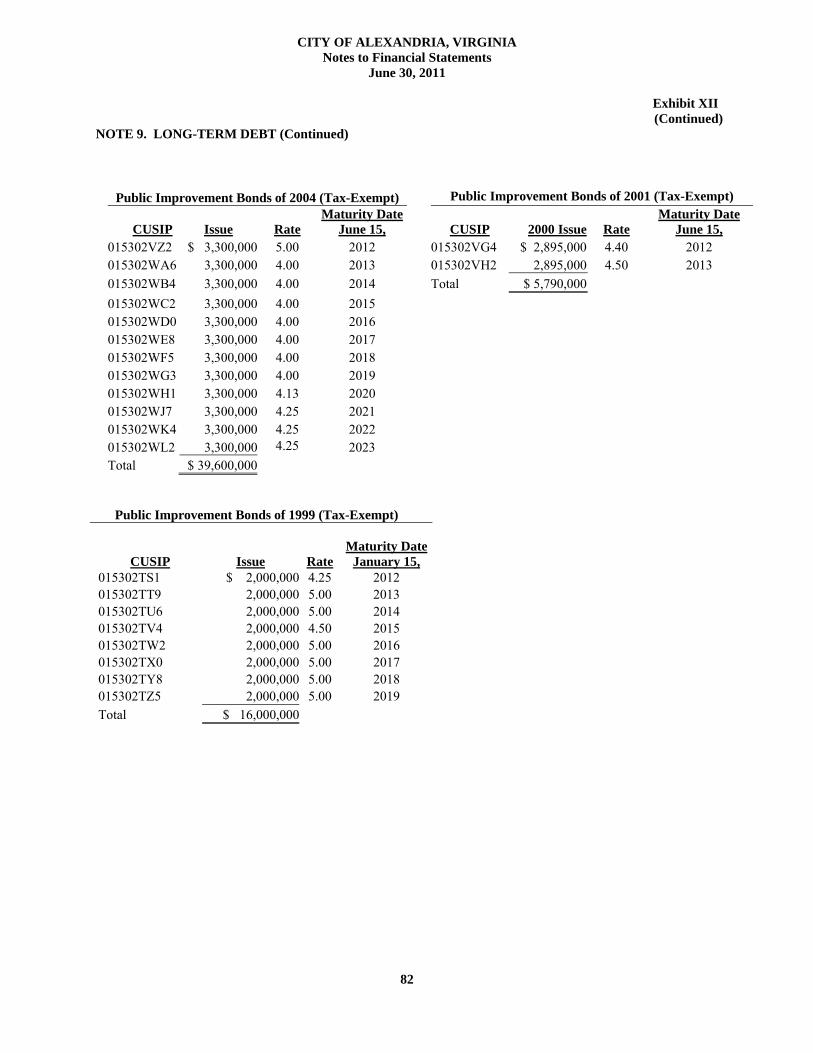
CITY OF ALEXANDRIA, VIRGINIA Notes to Financial Statements June 30, 2011 Exhibit XII
(Continued) NOTE 9. LONG-TERM DEBT (Continued)
82
Public Improvement Bonds of 2004 (Tax-Exempt) Public Improvement Bonds of 2001 (Tax-Exempt)
CUSIP Issue Rate Maturity Date
June 15,
CUSIP 2000 Issue Rate Maturity Date
June 15, 015302VZ2 $ 3,300,000 5.00 2012 015302VG4 $ 2,895,000 4.40 2012 015302WA6 3,300,000 4.00 2013 015302VH2 2,895,000 4.50 2013 015302WB4 3,300,000 4.00 2014 Total $ 5,790,000 015302WC2 3,300,000 4.00 2015 015302WD0 3,300,000 4.00 2016 015302WE8 3,300,000 4.00 2017 015302WF5 3,300,000 4.00 2018 015302WG3 3,300,000 4.00 2019 015302WH1 3,300,000 4.13 2020 015302WJ7 3,300,000 4.25 2021 015302WK4 3,300,000 4.25 2022 015302WL2 3,300,000 4.25 2023 Total $ 39,600,000
Public Improvement Bonds of 1999 (Tax-Exempt)
CUSIP Issue Rate
Maturity Date
January 15, 015302TS1 $ 2,000,000 4.25 2012 015302TT9 2,000,000 5.00 2013 015302TU6 2,000,000 5.00 2014 015302TV4 2,000,000 4.50 2015 015302TW2 2,000,000 5.00 2016 015302TX0 2,000,000 5.00 2017 015302TY8 2,000,000 5.00 2018 015302TZ5 2,000,000 5.00 2019
Total $ 16,000,000
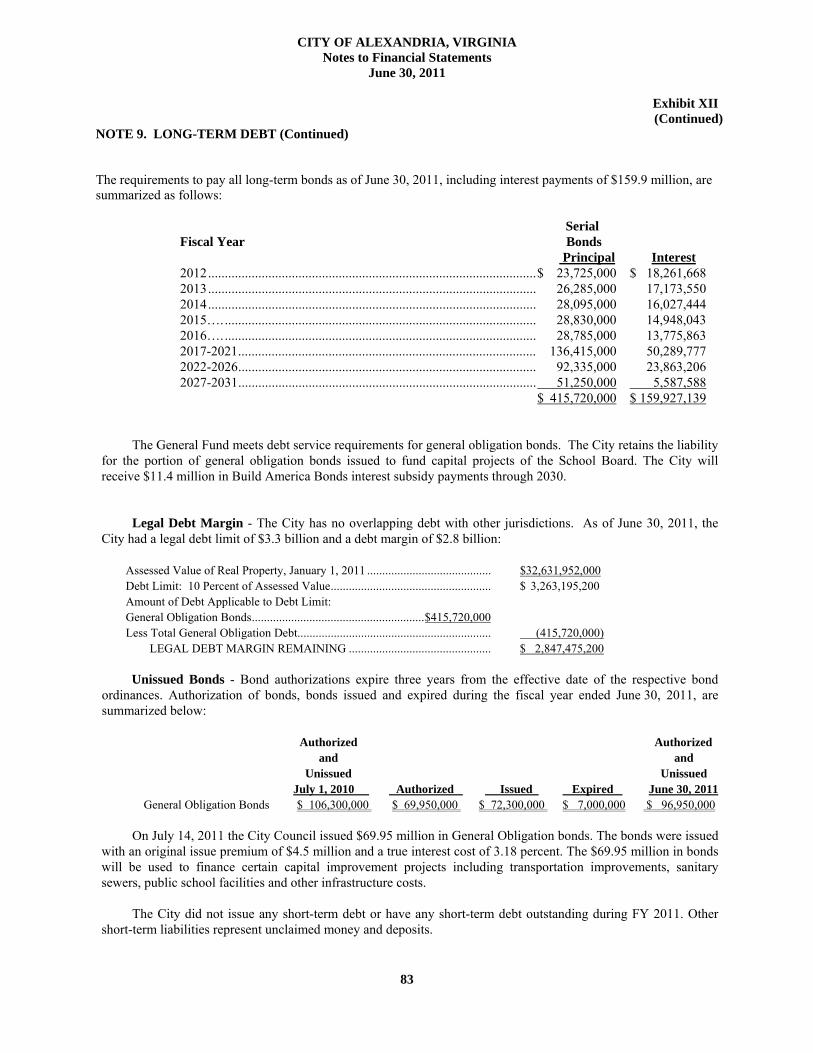
CITY OF ALEXANDRIA, VIRGINIA Notes to Financial Statements June 30, 2011 Exhibit XII
(Continued) NOTE 9. LONG-TERM DEBT (Continued)
83
The requirements to pay all long-term bonds as of June 30, 2011, including interest payments of $159.9 million, are summarized as follows:
Serial Fiscal Year Bonds
Principal Interest 2012 .................................................................................................. $ 23,725,000 $ 18,261,668 2013 .................................................................................................. 26,285,000 17,173,550 2014 .................................................................................................. 28,095,000 16,027,444 2015…. ............................................................................................. 28,830,000 14,948,043 2016…. ............................................................................................. 28,785,000 13,775,863 2017-2021 ......................................................................................... 136,415,000 50,289,777 2022-2026 ......................................................................................... 92,335,000 23,863,206 2027-2031 ......................................................................................... 51,250,000 5,587,588
$ 415,720,000 $ 159,927,139
The General Fund meets debt service requirements for general obligation bonds. The City retains the liability
for the portion of general obligation bonds issued to fund capital projects of the School Board. The City will receive $11.4 million in Build America Bonds interest subsidy payments through 2030.
Legal Debt Margin - The City has no overlapping debt with other jurisdictions. As of June 30, 2011, the
City had a legal debt limit of $3.3 billion and a debt margin of $2.8 billion: Assessed Value of Real Property, January 1, 2011 ......................................... $32,631,952,000 Debt Limit: 10 Percent of Assessed Value ..................................................... $ 3,263,195,200 Amount of Debt Applicable to Debt Limit: General Obligation Bonds ......................................................... $415,720,000 Less Total General Obligation Debt................................................................ (415,720,000) LEGAL DEBT MARGIN REMAINING ............................................... $ 2,847,475,200
Unissued Bonds - Bond authorizations expire three years from the effective date of the respective bond ordinances. Authorization of bonds, bonds issued and expired during the fiscal year ended June 30, 2011, are summarized below:
Authorized Authorized and and Unissued Unissued
July 1, 2010 Authorized Issued Expired June 30, 2011 General Obligation Bonds $ 106,300,000 $ 69,950,000 $ 72,300,000 $ 7,000,000 $ 96,950,000
On July 14, 2011 the City Council issued $69.95 million in General Obligation bonds. The bonds were issued with an original issue premium of $4.5 million and a true interest cost of 3.18 percent. The $69.95 million in bonds will be used to finance certain capital improvement projects including transportation improvements, sanitary sewers, public school facilities and other infrastructure costs.
The City did not issue any short-term debt or have any short-term debt outstanding during FY 2011. Other
short-term liabilities represent unclaimed money and deposits.

CITY OF ALEXANDRIA, VIRGINIA Notes to Financial Statements June 30, 2011 Exhibit XII
(Continued) NOTE 9. LONG-TERM DEBT (Continued)
84
Changes in Long-Term Liabilities - Changes in the total long-term liabilities during the fiscal year ended June 30, 2011 are summarized below. The Net Pension Obligation results from contributions to the City Supplemental Retirement Plan, the Pension for Fire and Police Plan, and the Firefighters’ and Police Pension Plan that were less than the required amount. In general the City uses the General Fund to liquidate long-term liabilities.
Primary Government – Governmental Activities
Balance
July 1, 2010
Additions
Reductions
Balance
June 30, 2011
Amounts Due Within One
Year General Obligation Bonds $ 364,485,000 $ 72,300,000 $21,065,000 $ 415,720,000 $ 23,725,000 Bond Premium 8,873,623 1,877,864 560,489 10,190,998 654,382 Workers’ Compensation Claims 10,272,451 6,058,371 2,802,940 13,527,882 3,350,227 Accrued Compensated Absences 20,935,381 13,220,919 12,840,310 21,315,990 1,676,353 Net Pension Obligation 14,982,209 2,116,342 305,625 16,792,926 --- Net OPEB Obligation 6,842,615 --- 792,333 6,050,282 --- Total $ 426,391,279 $ 95,573,496 $38,366,697 $ 483,598,078 $ 29,405,962
Long-term liabilities applicable to the City’s governmental activities are not due and payable in the current period and accordingly are not reported as fund liabilities in the governmental funds. Interest on long-term debt is not accrued in governmental funds, but rather is recognized as an expenditure when due. All liabilities – both current and long-term – are reported in the statement of net assets. The adjustment from modified accrual to full accrual is as follows: Balances at June 30, 2011: Long-term liabilities (detail above) $ 483,598,078 Accrued interest payable 3,714,793 Adjustment $ 487,312,871 Under the modified accrual basis of accounting used in the fund financial statements for the governmental funds, expenditures are not recognized for transactions that are not normally paid with expendable available financial resources. In the government-wide statement of activities, however, which is presented on the accrual basis, expenses are reported regardless of when financial resources are available. In addition, interest on long-term debt is recognized under the modified accrual basis of accounting when due, rather than as it accrues. This adjustment from modified accrual to full accrual is composed of the following items: Compensated absences $ 380,609 Workers compensation 3,255,431 Change in net pension obligation and net OPEB obligation 1,018,384 Amortization of bond premium, Discount and interest 936,151 Accrued interest on bonds 137,005 Adjustment $ 5,727,580

CITY OF ALEXANDRIA, VIRGINIA Notes to Financial Statements June 30, 2011 Exhibit XII
(Continued) NOTE 9. LONG-TERM DEBT (Continued)
85
Component Unit – School Board
Balance July 1, 2010
Additions
Reductions
Balance
June 30, 2011
Amounts Due Within One
Year Accrued Compensated Absences $ 7,382,979 $ 7,431,920 $ 7,465,384 7,349,515 $ 741,101 Capital Leases 1,132,990 --- 1,132,990 --- --- Workers’ Compensation Claims 358,986 688,230 311,762 735,454 514,818 Net OPEB Obligation 4,296,791 1,369,662 3,106,804 2,559,649 --- Total $ 13,171,746 $ 9,489,812 $ 12,016,940 10,644,618 $ 1,255,919

CITY OF ALEXANDRIA, VIRGINIA Notes to Financial Statements June 30, 2011 Exhibit XII
(Continued)
86
NOTE 10. INTERFUND BALANCES AND COMPONENT UNIT TRANSACTIONS Primary Government Interfund receivable/payable consisted of the following at June 20, 2011: Receivable Fund Payable Fund Amount Primary Government – General Fund Primary Government – Capital Projects $500,000 These balances represent timing difference related to routine advances from the City for bond reimbursable capital transactions.
There were no interfund receivables/payables at June 30, 2011. Interfund transfers and transactions for the year ended June 30, 2011 consisted of the following:
Transfer In/Out: General Special
Revenue Capital
Projects Total
Primary Government Transactions
General Fund $ --- $ 1,446,713 $ --- $ 1,446,713 Special Revenue 35,076,320 16,481 --- 35,092,801 Capital Projects 5,545,000 5,832,140 --- 11,377,140 Internal Service --- 155,897 --- 155,897 Total $ 40,621,320 $ 7,451,231 $ --- $ 48,072,551 Component Unit Transactions
School Board $ 167,886,567 $ --- $ 2,248,196 $ 170,134,763 Library 5,879,455 --- --- 5,879,455 Alexandria Transit 8,178,196 --- --- 8,178,196 Total $ 181,944,218 $ --- $ 2,248,196 $ 184,192,414
Primary government transfer activities include:
Transfers from the General Fund to the Special Revenue Fund represent City funds required to match grant
programs resources and taxes collected for affordable housing project Special Revenue funds are transferred to other funds for capital and equipment purchases as determined by
the terms of the grant agreements. Transfers from the General Fund to the Capital Projects fund represent the City’s budgeted pay-as-you go
funding of capital projects. Transfers from Special Revenue funds to Capital Projects represent grants received for capital related
expenditures. Transactions with the component units represent budgeted subsidies for the school operations and capital
projects, library operations and transit operations. In addition, there were no capital assets transferred to Alexandria Transit.

CITY OF ALEXANDRIA, VIRGINIA
Notes to Financial Statements June 30, 2011 Exhibit XII
(Continued)
87
NOTE 11. GRANTS
The City receives financial assistance from numerous federal, state and local governmental agencies in the form of grants. The disbursement of funds received under these programs generally requires compliance with terms and conditions specified in the grant agreements and is subject to audit by the grantor agencies. Any unallowed disbursements resulting from such audits could become a liability of the City. In the opinion of City management, no material refunds will be required as a result of unallowed disbursements (if any), by the grantor agencies.
NOTE 12. INTERGOVERNMENTAL REVENUES
Intergovernmental revenues for the City and its component units totaled $150.3 million in FY 2011. Sources of these revenues were as follows:
GOVERNMENTAL FUNDS
Federal Government $ 35,227,326 Commonwealth of Virginia 66,673,359
Total Primary Government $ 101,900,685
COMPONENT UNITS Federal Government:
School Board $ 19,732,840 Alexandria Transit Company 3,588
Total Component Units Federal Government $ 19,736,428 Commonwealth of Virginia:
School Board $ 28,473,281 Library 188,491 Alexandria Transit Company 3,846
Total Component Units Commonwealth of Virginia $ 28,665,618
Total Component Units $ 48,402,046
TOTAL CITY AND COMPONENT UNITS Total Federal Government $ 54,963,754 Total Commonwealth of Virginia 95,338,977
Total Intergovernmental Revenue $ 150,302,731

CITY OF ALEXANDRIA, VIRGINIA Notes to Financial Statements June 30, 2011 Exhibit XII
(Continued) NOTE 13. DUE FROM OTHER GOVERNMENTS
88
Due from other governments represents accrued revenue at June 30, 2011, consisting of the following:
Primary Government State
General Fund $ 30,673,793 Special Revenue Fund 3,323,106 Total State $ 33,996,899
Federal
General Fund $ 1,147,664 Special Revenue Fund 5,663,341 Total Federal $ 6,811,005
Total Primary Government $ 40,807,904
Component Units State
School Board $ 631,766 Total State $ 631,766
Federal
School Board $ 9,360,110 Alexandria Transit Company 3,280 Total Federal $ 9,363,390
Total $ 50,803,060
NOTE 14. JOINT VENTURES
A. Northern Virginia Criminal Justice Academy The City participates in a joint venture with the Counties of Arlington and Loudoun and the Cities of Fairfax, Falls Church, Manassas, and Manassas Park to provide training for sworn law enforcement and correctional officers to satisfy requirements mandated by the Commonwealth of Virginia. The Industrial Development Authority of Loudoun County, Virginia issued $6,585,000 Northern Virginia Criminal Justice Academy Lease Revenue Bonds, Series 1993, to finance the acquisition, renovation, and equipment of the Academy Training Center. The City and the Counties of Arlington and Loudoun have entered into a capital lease with the Industrial Development Authority of Loudoun County. The City maintains an equity interest only in the land and building of the Academy, which is reflected in the City's Statement of Net Assets. The City does not maintain an equity interest in the Academy's operations. This lease was paid in full in FY 2007. New debt of $18.7 was issued in FY 2007. The City does not have an equity interest associated with this debt. In addition, the City pays the Northern Virginia Criminal Justice Academy for operating costs based on the pro-rata share of officers trained. In FY 2011, the City paid $0.6 million for operating costs.
Financial statements for the Academy may be obtained at Northern Virginia Criminal Justice Academy, 45299 Research Place, Ashburn, Virginia 22011-2600.

CITY OF ALEXANDRIA, VIRGINIA Notes to Financial Statements June 30, 2011 Exhibit XII
(Continued) NOTE 14. JOINT VENTURES (Continued)
89
B. Northern Virginia Juvenile Detention Home
The City participates in a joint venture with Arlington County and the City of Falls Church to operate a regional juvenile detention home. In July 1993, the City agreed to fund 55.3 percent of the construction costs of a new facility. The final construction payments were made in FY 1995. In addition, the City pays part of the Northern Virginia Juvenile Detention Home's operating costs based on the number of beds utilized by Alexandria residents. These payments totaled $1.6 million in FY 2011. The City does not maintain an equity interest in the detention home. Complete separate financial statements for this operation may be obtained from Northern Virginia Juvenile Detention Home, 200 South Whiting Street, Alexandria, Virginia 22304. C. Peumansend Creek Regional Jail Authority In 1992, the City entered into an agreement with the Counties of Caroline, Arlington, Prince William, and Loudoun to form an authority to construct and operate a regional jail in Caroline County. The regional jail, which commenced operations in September 1999, is used primarily to hold prisoners from each member jurisdiction. The Regional Jail Authority is composed of two representatives, the Chief Administrative Officer and the Sheriff, from each participating jurisdiction. The City of Richmond, which was not party to the original agreement, is now a part of the project. The regional jail has the capacity for 336 prisoners. The City is guaranteed a minimum of 50 beds. The total project cost of $27 million, with 50 percent of the eligible construction cost ($23.8 million) is expected to be reimbursed by the Commonwealth. The Regional Jail Authority issued $10.2 million in revenue bonds and $12 million of grant anticipation notes in March 1997. The City’s total share is $18.2 million, including approximately $3.2 million in capital and debt service costs and $15 million in operating costs over the 20-year period of debt service payments (1997-2016). For FY 2011, the City paid $0.5 million for operating costs and $0.1 million for debt service payments. The City does not maintain an equity interest in the jail and is not responsible for repayment of the debt.
Complete financial statements can be obtained by writing to the Regional Jail Authority at Post Office Box 1460, Bowling Green, Virginia 22427. D. Washington Metropolitan Area Transit Authority
As discussed in Note 8, the City participates in a joint venture with other local jurisdictions to share in the cost of a regional transportation system. The City does not maintain an equity interest in WMATA. Complete financial statements of WMATA may be obtained from WMATA, 600 5th Street, N.W., Washington, DC 20001.
NOTE 15. RELATED PARTY TRANSACTIONS Sheltered Homes of Alexandria is a not-for-profit corporation formed to obtain and maintain group homes for mentally and physically disabled or impaired adults. The corporation's trustees also serve on the Alexandria Community Services Board, whose board members are appointed by the City and whose financial activities are therefore included as part of the primary government. During FY 2011, the City made rental payments to Sheltered Homes of Alexandria totaling $24,000.

CITY OF ALEXANDRIA, VIRGINIA
Notes to Financial Statements June 30, 2011 Exhibit XII (Continued) NOTE 16. OTHER POST EMPLOYMENT BENEFITS (OPEB)
90
In 1989 City Council voted to establish three classes of post employment health care benefits to supplement the increasing health care costs for City retirees. The three classes are as follows: (a) Full Time City employees who are eligible to retire under the Virginia Retirement System and City Supplemental Pension plan; (b) Fire and police employees who are eligible to retire under the current defined benefit pension plan; and (c) Fire and police employees who retired and were eligible for normal retirement with 20 years of service under the old defined contribution retirement income plan and the retirees under the old defined benefit pension. In addition, spouses of deceased retirees are also eligible to receive benefits under this provision. This plan is a reimbursement program that is based on the actual cost of the retiree’s monthly premium up to a maximum amount determined by the City Council. Effective July 1, 2005, the maximum monthly amount an eligible retiree or a surviving spouse may receive is $260. The City Council has authority to establish or amend the provisions. As of June 30, 2011, 895 retirees were both eligible and received benefits from all three classes of this plan. Eligibility is contingent upon retiree providing proof of participation and payment to a health insurance plan. The City contributed on a "pay-as-you-go" basis at the rate of up to $260 per month for each retiree, for a total annual contribution of $2.2 million for FY 2011. Employees hired after September 30, 2007 will have their retirees health benefits prorated based on the length of service. In addition to the healthcare benefits, the City pays for basic life insurance two times the amount of salary at the time of retirement to regular full time employees with applicable reductions if over 65 at no cost to the employees. On January 1, following the 65th birthday the basic life insurance amount is reduced by 25% and then by 10% each year till the 70th birthday. The ultimate insurance amount is 25% of the salary. This benefit is only available to those hired prior to July 1, 2008. The City implemented Statement No. 45 of the Governmental Accounting Standards Boards (GASB), (Accounting and Financial Reporting by Employers for Post Employment Benefits Other than Pensions) for the year ended June 30, 2008. The City established a Single Employer OPEB Trust and plans to fund on a phased in basis the obligation through this trust. There are no legal or contractual requirements for contributing to the OPEB Trust Fund. The City does not issue a stand alone financial report for OPEB trust fund. The financial statements and required supplementary information are included in City’s Comprehensive Annual Financial Report. MEMBERSHIP At January 1, 2011, membership consisted of: Retirees and Beneficiaries Currently Receiving Benefits 774 Terminated Employees Entitled to Benefits But not yet receiving them --- Active Employees 2,225 TOTAL 2,999

CITY OF ALEXANDRIA, VIRGINIA Notes to Financial Statements June 30, 2011 Exhibit XII (Continued) NOTE 16. OTHER POST EMPLOYMENT BENEFITS (OPEB)
91
ANNUAL OPEB COSTS AND NET OPEB OBLIGATIONS The annual required contribution (ARC) decreased from $10,306,577 for fiscal year 2010 to $7,415,385 for the current fiscal year. As a percentage of payroll, the ARC decreased from 7.01% to 5.04% this fiscal year. As of June 30, 2011, the Net OPEB Obligation (NOO) decreased to $6,050,282 compared to $6,842,615 for fiscal year 2010. As of December 31, 2010 the unfunded Actuarial Accrued Liability (UAAL) decreased by $13,578,741 to $68,900,563. This decrease was due to certain valuation assumption changes; a decrease in per person cost trends: Pre-Medicare graded down from 12.00% to 5.10% and Medicare-Eligibility graded down from 8.00% to 5.10% over 15 years. The savings from plan changes to prorate the health subsidy payments for retirees hired after September 30, 2007 based on years of service and to eliminate life insurance for those hired after July 1, 2008 will be recognized over time. The net OPEB Obligation as of June 30, 2011 is as follows: Annual Required Contribution $ 7,415,385 Interest on Net OPEB Obligation 513,196 Adjustment to Annual Required Contribution (556,333) _________ Annual OPEB Cost $ 7,372,248 Contributions Made ( 8,164,581) Increase (Decrease) in Net OPEB Obligation $ (792,333) Net OPEB Obligation, Beginning of Year 6,842,615 Net OPEB Obligation, End Of Year $ 6,050,282 FUNDED STATUS AND FUNDING PROGRESS The funded status of the plan as of December 31, 2010 was as follows:
(1) (2) (3) (4) (5) (6) Actuarial Valuation
Date
Actuarial Value of Assets
Actuarial Accrued Liability (AAL)
Unfunded AAL
(UAAL) (2)-(1)
Funded Ratio
(1/2)
Covered Payroll
UAAL as a Percentage of
Covered Payroll ((2-1)/5)
12/31/2010 $ 11,668,519 $ 80,569,082 $68,900,563 14.48% $146,101,440 47.16%
The Statement of Net Assets for the City’s OPEB plan is included in footnote 17. Actuarial valuations of the plan involve estimates of the value of reported amounts and assumptions about the probability of events far into the future. Examples include assumptions about the future employment, mortality and the healthcare cost trend. The actuarially determined amounts are subject to continual revision as actual results are compared with past expectations and new estimates are made about the future. The schedule of funding progress, presented as required supplementary information following notes to the financial statements, presents results as of December 31, 2010. The schedule will eventually provide multi-year trend information about whether the actuarial values of plan net assets are increasing or decreasing over time relative to actuarial accrued liabilities for benefits.

CITY OF ALEXANDRIA, VIRGINIA Notes to Financial Statements June 30, 2011 Exhibit XII (Continued) NOTE 16. OTHER POST EMPLOYMENT BENEFITS (OPEB)
92
ACTUARIAL METHODS AND ASSUMPTIONS Projections of benefits for financial reporting purposes are based on the substantive plan and include the types of benefits provided at the time of each valuation and historical pattern of sharing benefit costs between the employer and plan members to that point. The actuarial methods and assumptions used include techniques that are designed to reduce short-term volatility in actuarial accrued liabilities and the actuarial value of assets, consistent with the long-term perspective of calculations. In the December 31, 2010 actuarial valuation, the entry-age actuarial cost method was used. The actuarial assumptions included 7.50% investment rate and an initial annual medical cost trend rate of 12.00% graded down to 5.10% over 15 years and salary scale ranging from 3.75% to 7.50% for Fire and Police and 3.75% to 5.60% for City employees depending on service with 3.75% attributable to inflation. The plan’s unfunded actuarial accrued liability is being amortized as a level dollar of projected payroll on a closed basis. Asset valuation method used was market value and the remaining amortization period as of December 31, 2010 was 27 years. Schedule of Employer Contributions
Fiscal Year Ended
Annual Required Contributions
Employer Contributions
Percentage Contributed
06/30/2008 $ 10,900,053 $ 3,922,024 36.0 %
06/30/2009 10,800,769 10,222,864 94.6% 06/30/2010 10,306,577 10,947,807 106.2% 06/30/2011 7,415,385 8,164,581 110.1% Only four years’ information was available. This will be expanded when information becomes available. Three Year Trend Information Fiscal Year
Ended Annual OPEB
Cost Percentage Contributed
Net OPEB Obligation
06/30/2009 $ 10,769,137 94.9% $ 7,524,302 06/30/2010 10,266,120 106.6% 6,842,615 06/30/2011 7,372,248 110.1% 6,050,282 NOTE 17. EMPLOYEE RETIREMENT SYSTEMS Primary Government The City participates in seven public employee retirement systems (PERS). One of these systems is handled by Virginia Retirement System (VRS), an agent multi-employer public retirement system that acts as a common investment and administrative agent for political subdivisions in the Commonwealth of Virginia, and is, therefore, not reflected as a City pension trust fund. Of the remaining six, four are single-employer defined benefit systems (City Supplemental, Pension for Fire and Police, Firefighters and Police Officers Pension Plan-defined benefit component, and Firefighters and Police Officers Pension Plan-disability component), where a stated methodology for determining benefits is provided, and two are defined contribution plans (Firefighters and Police Officers Pension Plan-defined contribution component and Retirement Income for Sheriff and Emergency Rescue Technicians (ERT)), where contribution requirements are not actuarially determined. All of these systems are included as part of the City’s reporting entity and as such are reflected as Pension Trust Funds.

CITY OF ALEXANDRIA, VIRGINIA
Notes to Financial Statements June 30, 2011
Exhibit XII (Continued)
NOTE 17. EMPLOYEE RETIREMENT SYSTEMS (Continued)
Post RetirementBenefit Trust
RetirementCity Pension for Defined Defined Income O ther Post
Supplemental Fire Contribution Benefit Disability for Sheriff EmploymentRetirement and Police Component Component Component and ERT Benefits Total
ASSETS
Investments, at Fair Value
Mutual Funds 25,561,266$ -$ 10,431,183$ 33,632,155$ 2,212,696$ 8,034,040$ 3,462,980$ 83,334,320$ Stocks 68,231,752 - - 115,163,908 9,921,536 - 11,696,900 205,014,096 Guaranteed Investment Accounts - 25,873,205 7,614,812 - - 8,034,042 - 41,522,059 Real Estate 5,376,637 - - 8,046,611 699,705 - - 14,122,953 T imber/Private Equity 3,686,544 - - 7,654,812 660,904 - 461,190 12,463,450 Other Investments 790,479 - - 1,346,898 102,490 - 190,647 2,430,514 Total Investments 103,646,678$ 25,873,205$ 18,045,995$ 165,844,384$ 13,597,331$ 16,068,082$ 15,811,717$ 358,887,392$ Total Assets 103,646,678$ 25,873,205$ 18,045,995$ 165,844,384$ 13,597,331$ 16,068,082$ 15,811,717$ 358,887,392$
NET ASSETS
Held in Trust for Pension Benefits 103,646,678$ 25,873,205$ 18,045,995$ 165,844,384$ 13,597,331$ 16,068,082$ 15,811,717$ 358,887,392$
Combining Schedule of Fiduciary Net Assets
Firefighters and Police O fficers Pension PlanEmployee Retirement Plans
93

CITY OF ALEXANDRIA, VIRGINIA
Notes to Financial Statements June 30, 2011
Exhibit XII (Continued)
NOTE 17. EMPLOYEE RETIREMENT SYSTEMS (Continued)
Post RetirementEmployee Retirement Plans Benefit Trust
RetirementCity Pension for Defined Defined Income O ther Post
Supplemental Fire Contribution Benefit Disability for Sheriff EmploymentRetirement and Police Component Component Component and ERT Benefits Total
ADDITIO NSContributions: Employer 8,544,859$ 1,700,000$ -$ 7,651,601$ 1,210,062$ 9,925$ 3,397,049$ 22,513,496$ Plan Members 205,858 - - 2,280,664 253,279 - - 2,739,801 Total Contributions 8,750,717$ 1,700,000$ -$ 9,932,265$ 1,463,341$ 9,925$ 3,397,049$ 25,253,297$ Investment Income: Net Appreciation (Depreciation) in Fair Value of Investments 17,635,428$ -$ 2,509,765$ 29,674,662$ 2,539,691$ 1,490,714$ 2,017,818$ 55,868,078$ Interest 1,492,054 1,518,191 219,356 2,227,550 149,696 267,750 377,983 6,252,580 Net Investment Income 19,127,482$ 1,518,191$ 2,729,121$ 31,902,212$ 2,689,387$ 1,758,464$ 2,395,801$ 62,120,658$
Total Additions 27,878,199$ 3,218,191$ 2,729,121$ 41,834,477$ 4,152,728$ 1,768,389$ 5,792,850$ 87,373,955$ DEDUCTIO NSBenefits 5,384,052$ 4,208,688$ -$ 5,211,692$ 2,139,570$ -$ -$ 16,944,002$ Refunds of Contributions - - 1,711,120 - - 813,367 - 2,524,487 Administrative Expenses 199,356 23,154 - 236,774 140,756 - 26,065 626,105 Total Deductions 5,583,408$ 4,231,842$ 1,711,120$ 5,448,466$ 2,280,326$ 813,367$ 26,065$ 20,094,594$ Net Increase (Decrease) 22,294,791$ (1,013,651)$ 1,018,001$ 36,386,011$ 1,872,402$ 955,022$ 5,766,785$ 67,279,361$ Net Assets at Beginning of Year 81,351,887 26,886,856 17,027,994 129,458,373 11,724,929 15,113,060 10,044,932 291,608,031 Net Assets at End of Year 103,646,678$ 25,873,205$ 18,045,995$ 165,844,384$ 13,597,331$ 16,068,082$ 15,811,717$ 358,887,392$
Combining Schedule of Changes in Fiduciary Net Assets
Firefighters and Police O fficers Pension Plan
94
CITY OF ALEXANDRIA, VIRGINIA
Notes to Financial Statements June 30, 2011
Exhibit XII (Continued)
NOTE 17. EMPLOYEE RETIREMENT SYSTEMS (Continued)
95
The actuarial valuations for all the defined benefit pension plans are performed annually with the exception of VRS, which is performed biennially; however, an actuarial update is performed in the interim year. In the fiscal year 2009 valuation report, VRS changed the asset valuation method. The method used for prior valuation was a five year smoothed market value of assets but not less than 80% or more than 120% of the market value. VRS elected to suspend this corridor for the current valuation. The elimination of this corridor reduced the employer contribution rate from 9.82% to 7.78% with approximately $2.5 million in savings for fiscal years 2011 and 2012. The City experienced an increase in the contribution rate in the June 30, 2010 valuation report from the rate calculated in June 30, 2009 actuarial valuation. This increase is generally due to the reduction in the annual interest rate to 7.0% and a rate of return on the actuarial value of assets below the expected return of 7.50% for the year ending June 30, 2010. The current valuation also reflects increased rates of withdrawals for general employees, changed rates of service retirement and decreased rates of disability retirement for general employees. The number of active members shown includes those who have worked for the City at one time, but who are now active in another jurisdiction. Also the number of retirees includes those who retired from the City, as well as those who retired from another jurisdiction with service attributable to the City. The liability for the City’s share of the benefits for those employees has been reflected in the pension liabilities and employer contribution rates. Financial statements and required supplementary information are presented in the VRS comprehensive annual financial report, which can be obtained by writing to the Virginia Retirement System, Post Office Box 2500, Richmond, Virginia 23218.
The City had assumed the responsibility of paying 2% of the employee share of contributions for City
Supplemental pension plan. The employees commencing their participation in this plan after July 1, 2009, will make two percent of the employee contributions. The City will continue to make the two percent contribution for employees who were participants prior to July 1. 2009. However, these contributions will be characterized as employer contributions.
The recommended contribution rate increased from 23.80% as of July 1, 2009 to 25.06% as of July 1,
2010 for the Firefighters and Police defined benefit pension plan (Basic plan) and from 4.42% as of July 1, 2009 to 4.92% as of July 1, 2010 for the Disability plan. During the year ending June 30, 2010, the basic plan’s assets returned 12.65% and the Disability plan’s assets returned 11.35% on a market value basis. However, due to plans’ asset smoothing method which recognizes only a portion of the gains and losses, the returns on the actuarial assets values were 0.89% and 2.34% respectively. These returns were below the assumed rate of return of 7.50% and resulted in an actuarial loss of investments of $9.3 million for the basic plan and $0.7 million for the Disability plan. As of July 1, 2010 actuarial valuation, the basic plan’s unfunded actuarial liability was $64.2 million which is an increase from last year’s $56.2 million and the Disability plan’s unfunded actuarial liability was $4.9 million which is a decrease from last year’s $5.6 million. The assumed rate of salary increase between the date of disability and normal retirement age was changed from 2.7% for current actives and 7.5% for current disabled to 3% for all members. The rate of payroll increase used in the amortization of the unfunded actuarial liability for determining the GASB Annual Required Contribution was changed from 4.0% to 3.75%. All other aspects of the asset valuation method remained same.
There were no changes in actuarial assumptions, benefit provisions, or funding method for the pension plan
for Police and Fire. The major provisions of all the defined benefit pension plans are listed in this disclosure.

CITY OF ALEXANDRIA, VIRGINIA
Notes to Financial Statements June 30, 2011 Exhibit XII (Continued) NOTE 17. EMPLOYEE RETIREMENT SYSTEMS (Continued)
96
(1) (2) (3) (4) (5) (6) (7)VRS
City Pension Retirement Firefighters Fire Retirement Supplemental for Fire Income for and Police and Police Income for
City Retirement and Police Fire and Police Pension Disability Sheriff and ERT
Administrator State ofVirginia Prudential Prudential Prudential Prudential Prudential Prudential
Employees Covered General body General body Public Safety Public Safety Public Safety Public Safety Sheriff/ERT
Sheriff/ERTAuthority forPlan Provisionsand Contributions State Statute City Ordinance City Ordinance City Ordinance City Ordinance City Ordinance City Ordinance
Plan Type Agent Multi- Single- Single- Single- Single- Single- Single-Employer Employer Employer Employer Employer Employer Employer
Defined Defined Defined Defined Defined Defined DefinedBenefit Benefit Benefit Contribution Benefit Benefit Contribution
Stand Alone Financial Report Yes No No No No No No
Actuarial Valuation Date 6/30/2010 7/1/2010 7/1/2010 6/30/2011 7/1/2010 7/1/2010 6/30/2011
MEMBERSHIP AND PLAN PROVISIONS
Active Participants 1966 2033 0 102 462 462 230
Retirees & Beneficiaries 792 297 142 0 158 59 0
Terminated Vested & Non-vested 510 748 0 34 20 N/A 22
Normal Retirement Benefits:Age 65 65 60 60 55 55 60
50 (30Yrs) 50 (30Yrs)/ 50 (20Yrs) Any Age (25Yrs)50(25 Yrs)
Benefits Vested 5 5 10 5 5 5 5
Disability & Disability Disability Disability N/A Disability Disability N/ADeath Benefits Death Death Death Death Death N/A Death
The following schedules present a description of the plan provisions and membership information, actuarial assumptions, accounting and funding policies, and contribution requirements. Six-year schedules of funding progress and trend information for defined benefit pension plans are provided in Exhibit XVI.
PLAN DESCRIPTION

CITY OF ALEXANDRIA, VIRGINIA
Notes to Financial Statements June 30, 2011 Exhibit XII (Continued) NOTE 17. EMPLOYEE RETIREMENT SYSTEMS (Continued)
97
As of: 6/30/10 7/01/10 7/01/10 6/30/11 7/01/10 7/01/10 6/30/11
(1) (2) (3) (4) (5) (6) (7)VRS
City Pension Retirement Firefighters Fire and RetirementSupplemental For Fire Income for and Police Police Income for
City Retirement and Police Fire and Police Pension Disability Sheriff and ERT
SIGNIFICANT ACTUARIAL ASSUMPTIONS
Investment Earnings 7.0% 7.5% 5.5% N/A 7.5% 7.5% N/A
Projected Salary IncreasesAttributable to:Inflation 2.5% 3.0% N/A N/A 3.0% 3.0% N/A
Seniority/Merit 1.25% - 3.10% Up to 4% N/A N/A Up to 4.5% Up to 4.5% N/A
Projected PostretirementIncreases 2.5% None 3.0% N/A 2.7% 2.7% N/A
Actuarial Cost Method Entry Age Entry Age Projected Unit N/A Entry Age Entry Age N/ANormal Normal Credit With Zero Normal Normal
Cost Cost Normal Cost Cost Cost
Amortization Method Level Percentage Level dollar Level dollar N/A Level Percentage Level Percentage N/AOpen/Closed Open N/A Closed Closed Closed
Remaining Amortization Period 20 20 15 N/A 19 19 N/A
Asset Valuation Method 5-year Market Value Book Value N/A 4-year 4-year N/ASmoothed Smoothed Smoothed
Market Value Market MarketFunded Status
Actuarial Value of assets 343,465,187 81,356,870 26,886,856 N/A 144,096,425 13,534,949 N/AActuarial Accrued Liability 440,562,710 132,010,864 41,265,691 N/A 208,265,626 18,477,276 N/AUnfunded Actuarial Accrued Liability (UAAL) 97,097,523 50,653,994 14,378,835 N/A 64,169,201 4,942,327 N/AFunded Ratio 78.0% 61.6% 65.16% N/A 69.2% 73.3% N/AAnnual Covered Payroll 112,083,557 124,936,457 N/A N/A 32,638,214 32,638,214 N/AUAAL as Percentage of Covered Payroll 86.6% 40.5% N/A N/A 196.6% 15.1% N/A
The multi-year funding progress is presented in RSI.The Pension Plan for Fire and Police is a closed plan with no active participant.
MEMBERSHIP AND PLAN PROVISIONS
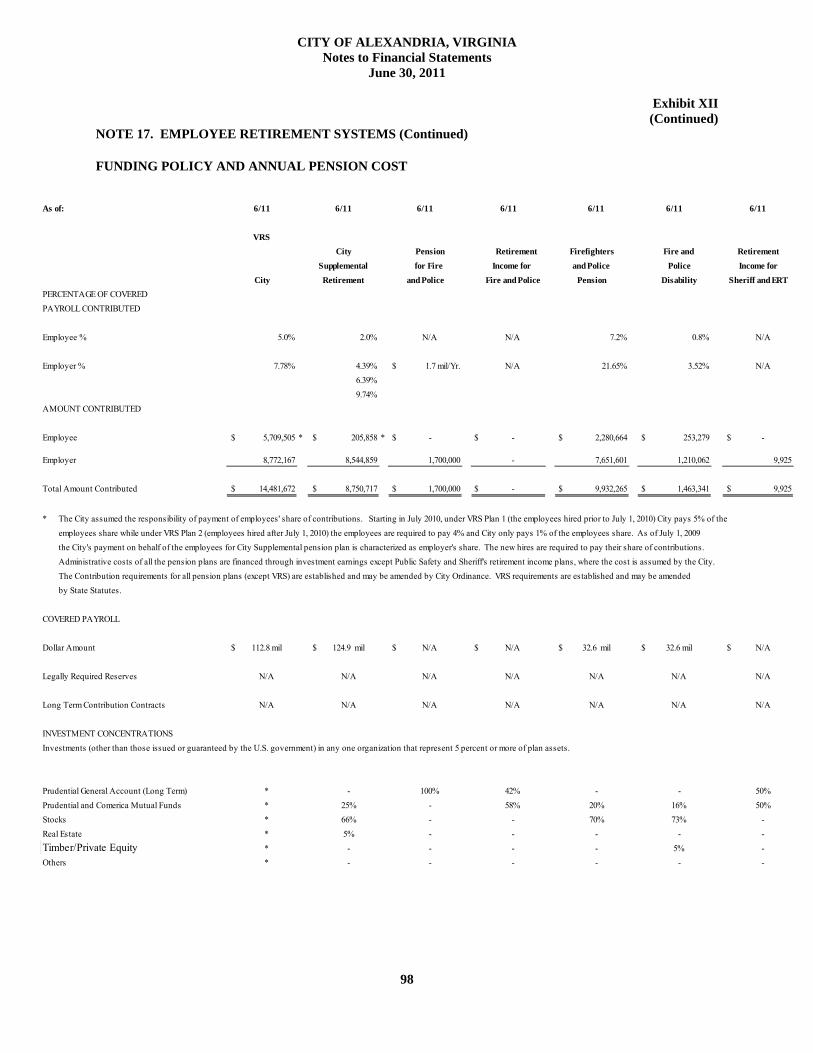
CITY OF ALEXANDRIA, VIRGINIA
Notes to Financial Statements June 30, 2011 Exhibit XII (Continued) NOTE 17. EMPLOYEE RETIREMENT SYSTEMS (Continued)
98
As of: 6/11 6/11 6/11 6/11 6/11 6/11 6/11
VRSCity Pension Retirement Firefighters Fire and Retirement
Supplemental for Fire Income for and Police Police Income forCity Retirement and Police Fire and Police Pension Disability Sheriff and ERT
PERCENTAGE OF COVEREDPAYROLL CONTRIBUTED
Employee % 5.0% 2.0% N/A N/A 7.2% 0.8% N/A
Employer % 7.78% 4.39% $ 1.7 mil/Yr. N/A 21.65% 3.52% N/A6.39%9.74%
AMOUNT CONTRIBUTED
Employee $ 5,709,505 * $ 205,858 * $ - $ - $ 2,280,664 $ 253,279 $ -
Employer 8,772,167 8,544,859 1,700,000 - 7,651,601 1,210,062 9,925
Total Amount Contributed $ 14,481,672 $ 8,750,717 $ 1,700,000 $ - $ 9,932,265 $ 1,463,341 $ 9,925
* The City assumed the responsibility of payment of employees' share of contributions. Starting in July 2010, under VRS Plan 1 (the employees hired prior to July 1, 2010) City pays 5% of the employees share while under VRS Plan 2 (employees hired after July 1, 2010) the employees are required to pay 4% and City only pays 1% of the employees share. As of July 1, 2009 the City's payment on behalf of the employees for City Supplemental pension plan is characterized as employer's share. The new hires are required to pay their share of contributions.Administrative costs of all the pension plans are financed through investment earnings except Public Safety and Sheriff's retirement income plans, where the cost is assumed by the City. The Contribution requirements for all pension plans (except VRS) are established and may be amended by City Ordinance. VRS requirements are established and may be amendedby State Statutes.
COVERED PAYROLL
Dollar Amount $ 112.8 mil $ 124.9 mil $ N/A $ N/A $ 32.6 mil $ 32.6 mil $ N/A
Legally Required Reserves N/A N/A N/A N/A N/A N/A N/A
Long Term Contribution Contracts N/A N/A N/A N/A N/A N/A N/A
INVESTMENT CONCENTRATIONSInvestments (other than those issued or guaranteed by the U.S. government) in any one organization that represent 5 percent or more of plan assets.
Prudential General Account (Long Term) * - 100% 42% - - 50%Prudential and Comerica Mutual Funds * 25% - 58% 20% 16% 50%Stocks * 66% - - 70% 73% -Real Estate * 5% - - - - -Timber/Private Equity * - - - - 5% -Others * - - - - - -
FUNDING POLICY AND ANNUAL PENSION COST

CITY OF ALEXANDRIA, VIRGINIA
Notes to Financial Statements June 30, 2011 Exhibit XII (Continued) NOTE 17. EMPLOYEE RETIREMENT SYSTEMS (Continued)
99
City Pension Firefighters Fire and Supplemental for Fire and Police Police
Retirement and Police Pension Disability
ARC $ 9,882,928 $ 1,443,056 $ 8,268,658 $ 1,611,887
Interest on NPO 829,743 59,997 171,789 40,320
ARC Adjustment (1,085,216) (108,678) (159,750) (37,495)
Annual Pension Cost $ 9,627,455 $ 1,394,375 $ 8,280,697 $ 1,614,712
Actual Deposit (8,544,859) (1,700,000) (7,651,601) (1,210,062)
Change in NPO $ 1,082,596 $ (305,625) $ 629,096 $ 404,650
NPO Beginning of year 11,063,239 1,090,851 2,290,518 537,601NPO End of Year (6/30/11) $ 12,145,835 $ 785,226 $ 2,919,614 $ 942,251
Actuarial Annual Pension Percentage of Net PensionDate Cost (APC) APC Contributed Obligation
City Supplemental Retirement 06/30/2009 $ 6,213,350 82.24% $ 8,388,87406/30/2010 10,090,940 73.50% 11,063,23906/30/2011 9,627,455 88.76% 12,145,835
Pension for Fire and Police 06/30/2009 $ 1,632,059 104.64% 1,194,98606/30/2010 1,574,996 106.61% 1,090,85106/30/2011 1,394,375 121.90% 785,226
Firefighter and Police Pension * 06/30/2009 $ 7,197,471 98.47% $ 1,424,98406/30/2010 7,927,652 89.08% 2,290,51806/30/2011 8,280,697 92.40% 2,919,614
Fire and Police Disability * 06/30/2009 $ 1,253,251 115.30% $ 647,21306/30/2010 1,474,702 107.43% 537,60106/30/2011 1,614,712 74.94% 942,251
Virginia Retirement System 06/30/2009 $ 8,149,979 100.00% $ -06/30/2010 7,977,375 100.00% -06/30/2011 8,772,167 100.00% -
Firefighters and Police Pension plan commenced on January 1, 2004 and Fire and Police Disability plan converted from defined contribution to defined benefit pension plan on the same date.
Calculation of Net Pension Obligation (Asset)
THREE-YEAR TREND INFORMATION

CITY OF ALEXANDRIA, VIRGINIA
Notes to Financial Statements June 30, 2011 Exhibit XII (Continued) NOTE 17. EMPLOYEE RETIREMENT SYSTEMS (Continued)
100
DESCRIPTION OF BENEFITS:
VRS – City - Employees with credit for services rendered prior to July 1, 2010 are covered under plan 1, while members hired or rehired on or after July 1, 2010 are covered under plan 2. Employees are eligible for an unreduced retirement at age 65 with 5 years of service and at age 50 with 30 years of service under plan 1, and at normal Social Security retirement age with at least five years of service or when age and service are equal to 90 under plan 2. An optional reduced retirement benefit is available as early as age 55 with five years of service or age 50 with 10 years of service under plan 1 and age 60 with at least five years of service under plan 2. The retirees are entitled to an annual retirement benefit payable monthly for life in an amount equal to 1.7 percent of their average final salary (AFS) for each year of credited service. AFS under plan 1 is 36 highest consecutive months while it is 60 highest consecutive months under plan 2. In addition, retirees qualify for annual cost-of-living (COLA) increases on July 1 of the second calendar year after retirement. These benefit provisions and all other requirements are established and may be amended by State statutes.
City Supplemental Retirement Plan- Regular City employees who retire at or after age 65 or after age 50
with 30 years of credited service are entitled to an annual retirement benefit, payable monthly for life in an amount equal to the sum of (1) and (2), increased by 50 percent, plus (3):
(1) 1.625 percent of the participant’s past service compensation up to $100, plus 0.25 percent of the
participant’s past service compensation in excess of $100, multiplied by number of years of credited service earned after July 31, 1960, but prior to August 1, 1970.
(2) 1.625 percent of the participant’s average earnings up to $100, plus 0.25 percent of the participant’s average earnings in excess of $100, multiplied by the number of years of credited service earned after July 31, 1970, but prior to January 1, 1988.
(3) 0.80 percent of average earnings multiplied by credited service earned after December 31, 1987.
The Sheriff’s Deputies, ERT and Fire Marshals who retire at age 65 or after age 50 with 25 years of service are entitled to the sum of (1), (2) and (3):
(1) 0.6 percent of average earnings multiplied by first five years of credited service, (2) 0.9 percent of average earnings multiplied by next ten years of credited service, and (3) 1.0 percent of average earnings multiplied by all years of credited service in excess of fifteen years.
Benefit provisions are established and may be amended by City Ordinance. Pension Plan for Fire Fighters and Police Officers (closed plan) - Employees who retired on or after age
60 are entitled to an annual retirement defined benefit, payable monthly for life, in an amount equal to 2.5 percent of final average earnings multiplied by years of credited service, up to a maximum of 30 years. The plan also provided early retirement on or after age 50 with 20 years of credited service or on or after age 56 with 10 years of credited service. This plan further provided early retirement on or after age 50 with 10 years of service with an actuarially reduced benefit. Benefit provisions are established and may be amended by City Ordinance. This plan was closed to new participants in FY 1979.
Firefighters and Police Officers Pension Plan - defined contribution component (closed plan) - The
employees are entitled to contributions made on their behalf after 100 percent vesting. Benefit provisions are established and may be amended by City Ordinance. This plan was closed to new members in FY 2004 and converted to a defined benefit plan. Employees in the plan at date of conversion could leave their contributions in the defined contribution component or purchase prior service with the assets associated with their contributions.
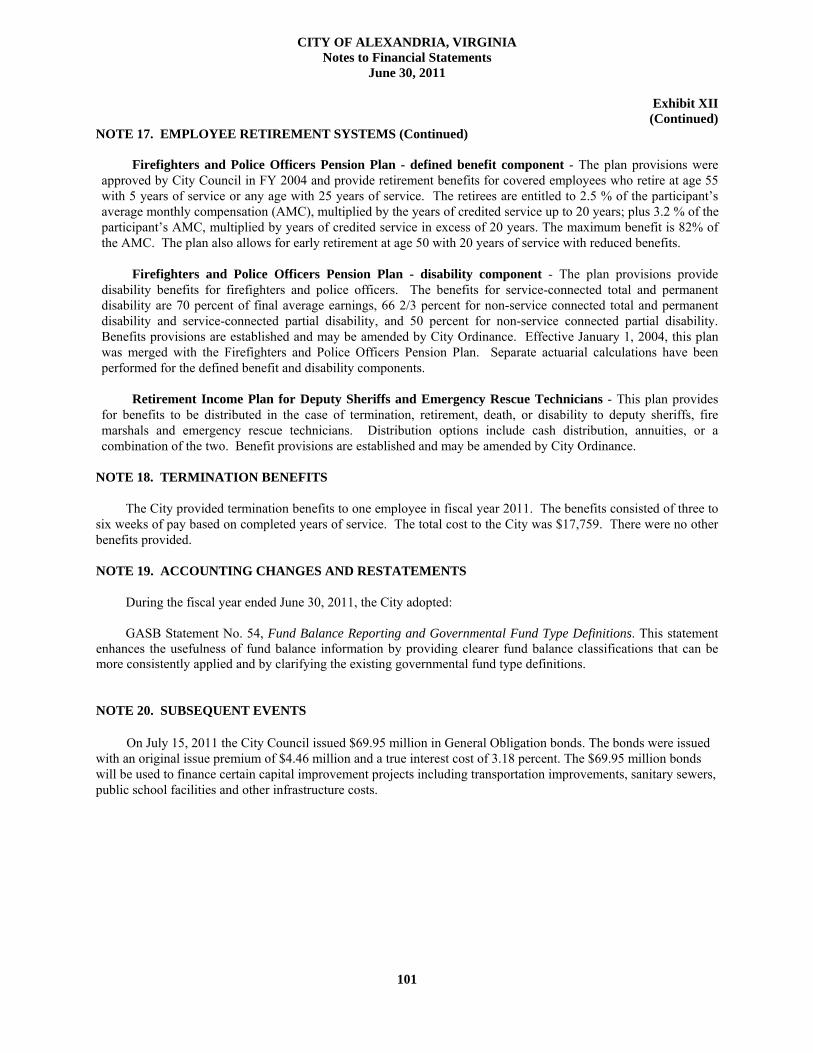
CITY OF ALEXANDRIA, VIRGINIA
Notes to Financial Statements June 30, 2011 Exhibit XII (Continued) NOTE 17. EMPLOYEE RETIREMENT SYSTEMS (Continued)
101
Firefighters and Police Officers Pension Plan - defined benefit component - The plan provisions were approved by City Council in FY 2004 and provide retirement benefits for covered employees who retire at age 55 with 5 years of service or any age with 25 years of service. The retirees are entitled to 2.5 % of the participant’s average monthly compensation (AMC), multiplied by the years of credited service up to 20 years; plus 3.2 % of the participant’s AMC, multiplied by years of credited service in excess of 20 years. The maximum benefit is 82% of the AMC. The plan also allows for early retirement at age 50 with 20 years of service with reduced benefits.
Firefighters and Police Officers Pension Plan - disability component - The plan provisions provide
disability benefits for firefighters and police officers. The benefits for service-connected total and permanent disability are 70 percent of final average earnings, 66 2/3 percent for non-service connected total and permanent disability and service-connected partial disability, and 50 percent for non-service connected partial disability. Benefits provisions are established and may be amended by City Ordinance. Effective January 1, 2004, this plan was merged with the Firefighters and Police Officers Pension Plan. Separate actuarial calculations have been performed for the defined benefit and disability components.
Retirement Income Plan for Deputy Sheriffs and Emergency Rescue Technicians - This plan provides
for benefits to be distributed in the case of termination, retirement, death, or disability to deputy sheriffs, fire marshals and emergency rescue technicians. Distribution options include cash distribution, annuities, or a combination of the two. Benefit provisions are established and may be amended by City Ordinance.
NOTE 18. TERMINATION BENEFITS
The City provided termination benefits to one employee in fiscal year 2011. The benefits consisted of three to
six weeks of pay based on completed years of service. The total cost to the City was $17,759. There were no other benefits provided.
NOTE 19. ACCOUNTING CHANGES AND RESTATEMENTS During the fiscal year ended June 30, 2011, the City adopted: GASB Statement No. 54, Fund Balance Reporting and Governmental Fund Type Definitions. This statement
enhances the usefulness of fund balance information by providing clearer fund balance classifications that can be more consistently applied and by clarifying the existing governmental fund type definitions.
NOTE 20. SUBSEQUENT EVENTS
On July 15, 2011 the City Council issued $69.95 million in General Obligation bonds. The bonds were issued with an original issue premium of $4.46 million and a true interest cost of 3.18 percent. The $69.95 million bonds will be used to finance certain capital improvement projects including transportation improvements, sanitary sewers, public school facilities and other infrastructure costs.

102

103
REQUIRED
SUPPLEMENTARY
INFORMATION
(Unaudited)
In accordance with the Governmental Accounting Standards Board Statements No. 25, No. 27, No. 34, No. 43 and
No.45 the following information is a required part of the basic financial statements.

104
Va ria nc e fro mA m e nde d
O riginal Budget as B udg e t - P o s it iv eBudget Amended Actual (N e g a t iv e )
Revenues:General Property Taxes....…………………….……..........…...….. 330,407,904$ 330,407,904$ 349,779,825$ 19,371,921$ Other Local Taxes.......................…………………................... 116,430,000 116,430,000 118,259,357 1,829,357 Permits, Fees, and Licenses.......…………………...................... 1,802,010 1,802,010 2,543,789 741,779 Fines and Forfeitures..................…………………..................... 4,646,020 4,646,020 4,472,520 (173,500) Use of Money and Property........………………….................... 4,010,000 4,010,000 3,591,323 (418,677) Charges for Services................…………………........................ 14,902,302 14,902,302 14,939,668 37,366 Intergovernmental Revenues.......………………….................... 51,683,599 52,174,300 53,728,609 1,554,309 Miscellaneous..........................…………………........................ 783,700 783,700 987,727 204,027
Total Revenues ..............………………….............................. 524,665,535$ 525,156,236$ 548,302,818$ 23,146,582$
Expenditures:City Council........................................................................... 528,151$ 528,151$ 499,346$ 28,805$ City Manager.......................................................................... 1,703,268 1,573,634 1,555,714 17,920Office on Women................................................................... 1,404,218 1,423,330 1,403,706 19,624Citizens Assistance.....………………........................................ 553,778 554,576 521,970 32,606Office of Management and Budget.......................................... 1,185,929 1,185,929 1,063,491 122,43818th Circuit Court.......………………………….......................... 1,387,077 1,393,846 1,391,612 2,23418th General District Court…………………............................. 59,585 59,585 52,880 6,705Juvenile And Domestic Relations Court.................................. 34,512 35,313 18,814 16,499Commonwealth's Attorney..................................................... 2,619,874 2,624,292 2,405,039 219,253Sheriff.................................................................................... 26,710,533 26,700,793 26,679,514 21,279Clerk of Courts....................................................................... 1,518,691 1,523,126 1,490,067 33,059Other Correctional Activities................................................. 5,098,020 5,100,520 5,070,105 30,415Court Services......................................................................... 1,295,283 1,285,283 1,285,154 129Human Rights......................................................................... 610,858 614,633 590,629 24,004Internal Audit......................................................................... 228,920 242,319 235,591 6,728Information Technology Services........................................... 6,945,173 7,260,881 7,181,221 79,660Office of Communications.……………..………………………… 1,232,320 1,307,584 1,261,245 46,339City Clerk and Clerk of Council.............................................. 411,365 414,852 411,837 3,015Finance................................................................................... 9,528,280 10,026,111 9,010,871 1,015,240Real Estate Assessments......................................................... 1,665,223 1,690,229 1,470,112 220,117Human Resources.................................................................... 2,660,065 2,867,881 2,820,166 47,715Planning and Zoning............................................................... 8,923,755 9,387,948 9,054,788 333,160City Attorney......................................................................... 2,998,772 2,803,772 2,325,670 478,102Registrar of Voters.................................................................. 1,128,653 1,131,051 1,007,110 123,941General Services...................................................................... 11,734,468 11,773,511 11,681,427 92,084Procurement…………………..…………………………………….. 946,306 946,306 861,763 84,543Transportation and Environmental Services........................... 27,516,768 28,207,149 27,532,364 674,785Transit Subsidies..................................................................... 8,231,633 8,245,933 8,094,839 151,094Fire......................................................................................... 35,858,311 36,761,397 36,736,241 25,156Police..................................................................................... 52,259,991 51,502,018 51,013,585 488,433Emergency Communication.................................................... 192,273 1,844,592 1,842,911 1,681Mental Health/Mental Retardation and Substance Abuse......... 509,972 686,662 683,995 2,667Health.................................................................................... 8,080,471 8,102,191 7,854,474 247,717Human Services...................................................................... 10,501,742 10,917,504 9,820,623 1,096,881Human Services Contributions................................................ 2,033,259 2,033,259 2,012,623 20,636Office of Historic Alexandria.................................................. 2,501,575 2,578,806 2,560,919 17,887Recreation and Cultural Activities........................................... 19,010,498 19,152,089 19,025,423 126,666Other Educational Activities................................................... 12,229 12,229 12,229 - Non Departmental (including debt service)............................. 49,692,906 51,183,008 50,906,958 276,050
Total Expenditures..................................................... 309,514,705$ 315,682,293$ 309,447,026$ 6,235,267$ O ther Financing Sources (Uses): Operating Transfers In.......…...…………………...................…… 1,446,713$ 1,446,713$ 1,446,713$ -$ Operating Transfers Out.......……………………....................... (40,154,129) (41,727,864) (40,621,320) 1,106,544 T ransfers Out - Component Units…………………................... (181,942,705) (181,965,115) (181,944,218) 20,897
Total O ther Financing Sources (Uses)....................... (220,650,121)$ (222,246,266)$ (221,118,825)$ 1,127,441$
Net Change in Fund Balance. (5,499,291)$ (12,772,323)$ 17,736,967$ 30,509,290$ Fund Balances at Beginning of Year.............……….....……….. 63,041,371 63,041,371 63,041,371 - Increase/(Decrease) in Reserve for Inventory........……… - - 81,829 81,829
FUND BALANCES AT END O F YEAR..........……….....…… 57,542,080$ 50,269,048$ 80,860,167$ 30,591,119$
(See Accompanying Independent Auditors' Report and Notes to Schedules)
CITY OF ALEXANDRIA, VIRGINIA Budgetary Comparison Schedule
General Fund For the Fiscal Year Ended June 30, 2011
EXHIBIT XIII

105
O riginal Positive Budget (Negative)
Revenues:General Property Taxes....................................................... $ 2,315,715 $ 2,315,715 $ 1,864,831 $ (450,884)Permits, Fees and Licenses………………………………………… 4,316,872 4,316,872 4,527,999 211,127 Fines and Forfeitures…….....……………………………………. - - 5,000 5,000 Use of Money and Property................................................. 6,000 468,569 279,845 (188,724)Charges for Services............................................................. 15,089,325 15,366,891 14,899,345 (467,546)Intergovernmental Revenues................................................ 41,550,296 50,176,816 43,657,415 (6,519,401)Miscellaneous....................................................................... 840,325 10,791,209 5,258,069 (5,533,140)
Total Revenues........................................................... $ 64,118,533 $ 83,436,072 $ 70,492,504 $ (12,943,568)
Other Financing Sources:Operating Transfers In......................................................... $ 35,859,129 $ 41,376,217 $ 35,092,801 $ (6,283,416)
Total Other Financing Sources....................................... $ 35,859,129 $ 41,376,217 $ 35,092,801 $ (6,283,416)Total Revenues and O ther Financing Sources. $ 99,977,662 $ 124,812,289 $ 105,585,305 $ (19,226,984)
Expenditures:Office of Women................................................................. $ 490,848 $ 514,031 $ 471,641 $ 42,390 Citizens Assistance............................................................... 5,498 12,048 10,540 1,508 Commonwealth's Attorney.................................................. 219,867 263,020 252,438 10,582 Sheriff.................................................................................. 1,014,943 1,038,629 995,807 42,822 Clerk of Courts..........................................……….....………. - 121,474 54,949 66,525 Law Library......................................................................... 166,582 167,582 167,538 44 Other Correctional and Judicial Activities............................ 184,177 214,177 212,296 1,881 Court Services....……...............................................................… 250,076 587,070 585,680 1,390 Human Rights...................................................................... 35,108 55,108 51,218 3,890 Personnel............................................................................. 6,000 106,000 96,392 9,608 Finance…….………….……...…………………………………. 239,519 262,476 233,299 29,177 Planning.....……….....……….....……….....……….....………... - 200,000 170,196 29,804 General Services………………………………………………… 164,846 302,769 298,783 3,986 Transportation and Environmental Services........................ 2,918,203 4,514,890 3,975,801 539,089 Fire...................................................................................... 5,067,887 6,162,711 4,801,985 1,360,726 Police.................................................................................. 30,000 879,191 870,661 8,530 Office of Housing................................................................. 3,660,306 17,002,288 7,292,294 9,709,994 Mental Health/Mental Retardation and Substance Abuse....... 31,745,367 31,973,092 30,836,950 1,136,142 Health.................................................................................. - 11,726 9,605 2,121 Human Services.................................................................... 43,974,302 44,627,014 41,228,632 3,398,382 Office of Historic Alexandria............................................... 509,013 574,709 443,050 131,659 Recreation and Cultural Activit ies........................................ 720,166 847,330 751,929 95,401 Non Departmental………………….……………………………… 1,000,000 1,800,000 947,227 852,773
Total Expenditures..................................................... $ 92,402,708 $ 112,237,335 $ 94,758,911 $ 17,478,424 Other Financing Uses:Operating Transfers Out...................................................... $ 7,574,954 $ 12,574,954 $ 7,451,231 $ 5,123,723
Total O ther Financing Uses...................................... $ 7,574,954 $ 12,574,954 $ 7,451,231 $ 5,123,723 Total Expenditures and O ther Financing Uses....... $ 99,977,662 $ 124,812,289 $ 102,210,142 $ 22,602,147
Revenues and O ther Financing Sources O ver/(Under) Expenditures and O ther Financing Uses......... $ - $ - $ 3,375,163 $ 3,375,163 Fund Balances at Beginning of Year..................................... $ - $ - $ 22,494,349 $ 22,494,349 FUND BALANCES AT END O F YEAR............................. $ - $ - $ 25,869,512 $ 25,869,512
Amended BudgetVariance From
(See Accompanying Independent Auditors' Report and Notes to Schedules)
ActualAmendedBudget as
CITY OF ALEXANDRIA, VIRGINIA Budgetary Comparison Schedule
Special Revenue Fund For the Fiscal Year Ended June 30, 2011
Exhibit XIV

106
CITY OF ALEXANDRIA, VIRGINIA Notes to Budgetary Comparison Schedules
June 30, 2011 Exhibit XV
(1) SUMMARY OF SIGNIFICANT BUDGET POLICIES
The City Council annually adopts budgets for the General Fund and Special Revenue Fund of the primary government. All appropriations are legally controlled at the departmental level for the General Fund and Special Revenue Fund. On June 12, 2010, the City Council approved the original adopted budget and on June 25, 2011 approved the revised budget reflected in the required supplementary information.
The budgets are integrated into the accounting system, and the budgetary data, as presented in the required
supplementary information for all funds with annual budgets, compare the revenues and expenditures with the amended budgets. All budgets are presented on the modified accrual basis of accounting. Accordingly, the accompanying Budgetary Comparison Schedules for the General and Special Revenue Funds present actual expenditures in accordance with U.S. generally accepted accounting principles on a basis consistent with the legally adopted budgets, as amended. See Table XVII for the schedule of departments’ expenditure detail by function. A reconciliation of the perspective difference for reporting Expenditures and Other Financing Uses in the General Fund relates to how transfers to component units are recorded in each statement and includes the following:
General Fund
Budget Statement Title
Budgetary Statement
Amount
Adjustment for Transfer to
Component Unit (Footnote 10) Exhibit IV Exhibit IV Title
Other Educational Activities $ 12,229 $ 167,886,567 $ 167,898,796 Education Transit Subsidies 8,094,839 8,178,196 16,273,035 Transit Library Transfer - 5,879,455 5,879,455 Library Other Expenditures (not listed separately)
301,339,958
-
301,339,958
Other Expenditures (not listed separately)
Total Expenditures $ 309,447,026 $ 181,944,218 $ 491,391,244 Total Expenditures
Transfers Out – Component Units $ 181,944,218 $ (181,944,218) $ - None Operating Transfers Out 40,621,320 - 40,621,320 Operating Transfers Out
Other Financing (1,446,713) - (1,446,713) Other Expenditures (not listed separately)
Total Financing (Sources) Uses $ 221,118,825 $ (181,944,218) $ 39,174,607 Total Financing Uses
Unexpended appropriations on annual budgets lapse at the end of each fiscal year.
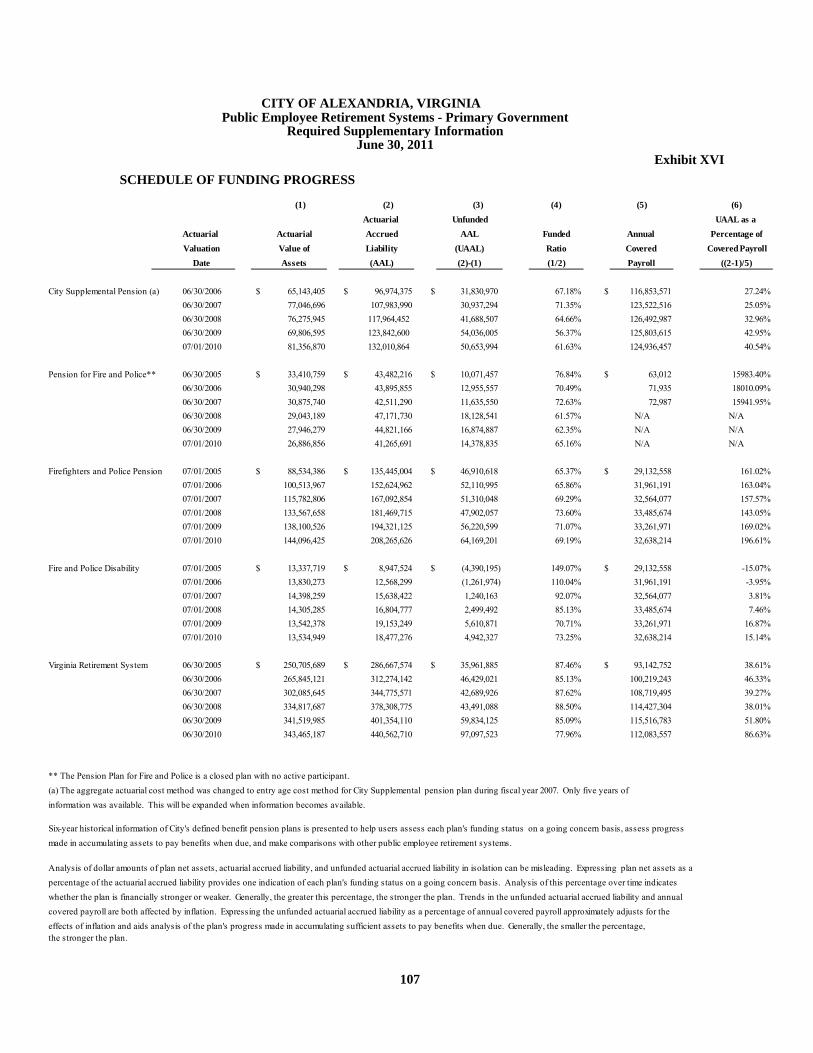
107
(1) (2) (3) (4) (5) (6)Actuarial Unfunded UAAL as a
Actuarial Actuarial Accrued AAL Funded Annual Percentage ofValuation Value of Liability (UAAL) Ratio Covered Covered Payroll
Date Assets (AAL) (2)-(1) (1/2) Payroll ((2-1)/5)
City Supplemental Pension (a) 06/30/2006 $ 65,143,405 $ 96,974,375 $ 31,830,970 67.18% $ 116,853,571 27.24%06/30/2007 77,046,696 107,983,990 30,937,294 71.35% 123,522,516 25.05%06/30/2008 76,275,945 117,964,452 41,688,507 64.66% 126,492,987 32.96%06/30/2009 69,806,595 123,842,600 54,036,005 56.37% 125,803,615 42.95%07/01/2010 81,356,870 132,010,864 50,653,994 61.63% 124,936,457 40.54%
Pension for Fire and Police** 06/30/2005 $ 33,410,759 $ 43,482,216 $ 10,071,457 76.84% $ 63,012 15983.40%06/30/2006 30,940,298 43,895,855 12,955,557 70.49% 71,935 18010.09%06/30/2007 30,875,740 42,511,290 11,635,550 72.63% 72,987 15941.95%06/30/2008 29,043,189 47,171,730 18,128,541 61.57% N/A N/A06/30/2009 27,946,279 44,821,166 16,874,887 62.35% N/A N/A07/01/2010 26,886,856 41,265,691 14,378,835 65.16% N/A N/A
Firefighters and Police Pension 07/01/2005 $ 88,534,386 $ 135,445,004 $ 46,910,618 65.37% $ 29,132,558 161.02%07/01/2006 100,513,967 152,624,962 52,110,995 65.86% 31,961,191 163.04%07/01/2007 115,782,806 167,092,854 51,310,048 69.29% 32,564,077 157.57%07/01/2008 133,567,658 181,469,715 47,902,057 73.60% 33,485,674 143.05%07/01/2009 138,100,526 194,321,125 56,220,599 71.07% 33,261,971 169.02%07/01/2010 144,096,425 208,265,626 64,169,201 69.19% 32,638,214 196.61%
Fire and Police Disability 07/01/2005 $ 13,337,719 $ 8,947,524 $ (4,390,195) 149.07% $ 29,132,558 -15.07%07/01/2006 13,830,273 12,568,299 (1,261,974) 110.04% 31,961,191 -3.95%07/01/2007 14,398,259 15,638,422 1,240,163 92.07% 32,564,077 3.81%07/01/2008 14,305,285 16,804,777 2,499,492 85.13% 33,485,674 7.46%07/01/2009 13,542,378 19,153,249 5,610,871 70.71% 33,261,971 16.87%07/01/2010 13,534,949 18,477,276 4,942,327 73.25% 32,638,214 15.14%
Virginia Retirement System 06/30/2005 $ 250,705,689 $ 286,667,574 $ 35,961,885 87.46% $ 93,142,752 38.61%06/30/2006 265,845,121 312,274,142 46,429,021 85.13% 100,219,243 46.33%06/30/2007 302,085,645 344,775,571 42,689,926 87.62% 108,719,495 39.27%06/30/2008 334,817,687 378,308,775 43,491,088 88.50% 114,427,304 38.01%06/30/2009 341,519,985 401,354,110 59,834,125 85.09% 115,516,783 51.80%06/30/2010 343,465,187 440,562,710 97,097,523 77.96% 112,083,557 86.63%
** The Pension Plan for Fire and Police is a closed plan with no active participant. (a) The aggregate actuarial cost method was changed to entry age cost method for City Supplemental pension plan during fiscal year 2007. Only five years of information was available. This will be expanded when information becomes available.
Six-year historical information of City's defined benefit pension plans is presented to help users assess each plan's funding status on a going concern basis, assess progress made in accumulating assets to pay benefits when due, and make comparisons with other public employee retirement systems.
Analysis of dollar amounts of plan net assets, actuarial accrued liability, and unfunded actuarial accrued liability in isolation can be misleading. Expressing plan net assets as apercentage of the actuarial accrued liability provides one indication of each plan's funding status on a going concern basis. Analysis of this percentage over time indicates whether the plan is financially stronger or weaker. Generally, the greater this percentage, the stronger the plan. Trends in the unfunded actuarial accrued liability and annualcovered payroll are both affected by inflation. Expressing the unfunded actuarial accrued liability as a percentage of annual covered payroll approximately adjusts for the effects of inflation and aids analysis of the plan's progress made in accumulating sufficient assets to pay benefits when due. Generally, the smaller the percentage, the stronger the plan.
CITY OF ALEXANDRIA, VIRGINIA Public Employee Retirement Systems - Primary Government
Required Supplementary Information June 30, 2011
Exhibit XVI SCHEDULE OF FUNDING PROGRESS

108
For Defined Benefit Pension Plans
City Supplemental Retirement Pension Plan for Fire and Police Annual Annual
Actuarial Required Percentage Actuarial Required Percentage Date Contribution Contributed Date Contribution Contributed
06/30/2006 $ 4,271,649 100.90% 06/30/2006 $ 932,554 113.50%06/30/2007 4,811,560 98.61% 06/30/2007 1,187,836 126.30%06/30/2008 5,419,262 99.81% 06/30/2008 1,209,549 70.27%06/30/2009 6,381,581 80.07% 06/30/2009 1,679,131 101.71%06/30/2010 10,284,656 72.11% 06/30/2010 1,623,492 103.40%06/30/2011 9,882,928 86.46% 06/30/2011 1,443,056 117.81%
Firefighters and Police Pension Virginia Retirement System06/30/2006 $ 5,938,572 97.90% 06/30/2006 $ 1,470,239 100.00%06/30/2007 6,985,282 91.25% 06/30/2007 7,077,570 100.00%06/30/2008 7,116,057 101.49% 06/30/2008 7,490,208 100.00%06/30/2009 7,184,309 98.65% 06/30/2009 8,149,979 100.00%06/30/2010 7,916,599 89.20% 06/30/2010 7,977,375 100.00%06/30/2011 8,268,658 92.54% 06/30/2011 8,772,167 100.00%
Fire and Police Disability06/30/2006 $ 414,340 165.80%06/30/2007 1,455,223 51.71%06/30/2008 1,610,278 47.88%06/30/2009 1,244,853 116.07%06/30/2010 1,469,682 107.80%06/30/2011 1,611,887 75.07%
See Accompanying Independent Auditors’ Report
CITY OF ALEXANDRIA, VIRGINIA Public Employee Retirement Systems - Primary Government
Required Supplementary Information June 30, 2011
Exhibit XVI (Continued)
SCHEDULES OF EMPLOYER CONTRIBUTIONS

109
(1) (2) (3) (4) (5) (6)Actuarial Unfunded UAAL as a
Actuarial Actuarial Accrued AAL Funded Annual Percentage ofValuation Value of Liability (UAAL) Ratio Covered Covered Payroll
Date Assets (AAL) (2)-(1) (1/2) Payroll ((2-1)/5)
12/31/2007 -$ 84,545,602$ 84,545,602$ 0.00% 142,475,212$ 59.34%12/31/2008 4,316,727 89,900,789 85,584,062 4.80% 146,884,002 58.27%12/31/2009 8,201,742 90,681,046 82,479,304 9.04% 147,006,590 56.11%12/31/2010 11,668,519 80,569,082 68,900,563 14.48% 146,101,440 47.16%
CITY OF ALEXANDRIA, VIRGINIA Other Post Employment Benefits (OPEB)
Required Supplementary Information June 30, 2011
Exhibit XVI (Continued)
SCHEDULE OF FUNDING PROCESS Only four years’ information was available. This will be expanded when information becomes available. See Accompanying Independent Auditors’ Report

110

111
CITY OF ALEXANDRIA, VIRGINIA Public Employee Retirement Systems - Component Unit - School Board
Required Supplementary Information (See Accompanying Independent Auditors’ Report)
Exhibit
OTHER SUPPLEMENTARY INFORMATION

112
Agency Funds
Agency Funds are City custodial funds used to provide accountability of client monies for which the City is custodian.
Human Services Special Welfare Account – This fund accounts for the current payments of supplemental security income for foster children. Human Services Dedicated Account – This fund accounts for back payments of supplemental security income for foster children. Industrial Development Authority Agency Fund – This fund accounts for Industrial Development Authority bond issuance fees and expenses, for which the City acts in a custodial capacity. Potomac Yard Affordable Housing – This fund accounts for affordable housing donations received from Potomac Yard Development LLC for the purpose of constructing affordable housing.

113
$ 23,851 $ 22,928 $ 41,330 $ 5,449
$ 23,851 $ 22,928 $ 41,330 $ 5,449
Total Liabilities.................................................................... $ 23,851 $ 22,928 $ 41,330 $ 5,449
$ 36,227 $ 10,469 $ 4,961 $ 41,735
$ 36,227 $ 10,469 $ 4,961 $ 41,735
Total Liabilities.................................................................... $ 36,227 $ 10,469 $ 4,961 $ 41,735
$ 513,826 $ 60,427 $ 556,826 $ 17,427
$ 513,826 $ 60,427 $ 556,826 $ 17,427
Total Liabilities.................................................................... $ 513,826 $ 60,427 $ 556,826 $ 17,427
$ 17,179 $ 11,076 $ 27,427 $ 828
$ 17,179 $ 11,076 $ 27,427 $ 828 Total Liabilities.................................................................... $ 17,179 $ 11,076 $ 27,427 $ 828
$ 60,078 $ 33,397 $ 46,291 $ 47,184 531,005 71,503 584,253 18,255
Total Assets........................................................................ $ 591,083 $ 104,900 $ 630,544 $ 65,439
$ 591,083 $ 104,900 $ 630,544 $ 65,439 Total Liabilities.................................................................... $ 591,083 $ 104,900 $ 630,544 $ 65,439
Balance BalanceJuly 1, 2010 Additions Deductions June 30, 2011
HUMAN SERVICES SPECIAL WELFARE ACCOUNTAssets
Other Liabilities.....................................................................
HUMAN SERVICES DEDICATED ACCOUNTAssets
Cash and Investments with Fiscal Agent..................................
Liabilities:Other Liabilities.........................................................................
INDUSTRIAL DEVELOPMENT AUTHORITYAssets
Equity in Pooled Cash and Investments...................................
Cash and Investments with Fiscal Agent..................................
Liabilities:Other Liabilities.........................................................................
Liabilities:Other Liabilities.........................................................................
TOTAL ALL AGENCY FUNDS
POTOMAC YARD AFFORDABLE HOUSING -ASLLCAssets
Equity in Pooled Cash and Investments...................................
Liabilities:
Liabilities:Other Liabilities.........................................................................
Assets
Equity in Pooled Cash and Investments...................................Cash and Investments with Fiscal Agent..................................
CITY OF ALEXANDRIA, VIRGINIA Combining Statement of Changes in Assets and Liabilities – Agency Funds
For the Fiscal Year Ended June 30, 2011

114
Cash Flows from Operating Activities:Cash Received From Customers....................................................................... 4,156,781$ Cash Payments to Suppliers for Goods and Services................................... (3,829,297) Cash Payments to Employees for Services..................................................... (8,526,579)
Net Cash Used for Operating Activities................................................... (8,199,095)$ Cash Flows from Noncapital Financing Activities:
Payment from Primary Government.................................................................. 8,178,196$ Cash Received from Nonoperating Grant........................................................ 3,440 Cash Received from Other Nonoperating Revenue....................................... 7,433
Net Cash Provided by Noncapital and Related Financing Activities.. 8,189,069$ Cash Flows from Capital and Related Financing Activities:
Acquisition of Capital Assets........................................................................... (281,500)$ Net Cash Used for Capital and Related Financing Activities................ (281,500)$
Net Increase in Cash and Cash Equivalents................................................................. (291,526)$ Cash and Cash Equivalents at Beginning of Year........................................................ 602,724 Cash and Cash Equivalents at End of Year................................................................... 311,198$
Reconciliation of Operating Loss to Cash Used for Operating Activities:
Operating Loss................................................................................................... (9,573,723)$ Adjustments to Reconcile Operating Loss to Net Cash
Used for Operating Activities:Depreciation Expense.................................................................................. 1,444,655$ Changes in Assets and Liabilities:
Decrease in Accounts Receivable........................................ 102,224 Increase in Inventory of Supplies........................................ (103,937) Decrease in Prepaid Expenses...........................................…(Decrease) in Accounts Payable.......................................... (119,891) Increase in Accrued Liabilities.............................................. 116,505 Increase in Other Liabilities................................................... (64,928)
Total Adjustments............................................. 1,374,628$ Net Cash Used for Operating Activities....................................................................... (8,199,095)$
Noncash Capital and Related Financing Activities:In Fiscal Year 2011 Net Capital Assets with net book value of $6,274,644 were transferred to the City
CITY OF ALEXANDRIA, VIRGINIA Statement of Cash Flows
Component Unit Alexandria Transit Company
As of June 30, 2011

115
Special Revenue Funds
Housing – This fund accounts for the City’s housing programs. Sanitary Sewer – This fund accounts for the funding of sanitary sewer maintenance and construction. Stormwater Management Fund – This fund was established in FY 2011. It is funded by a dedicated real estate property tax rate of 0.5 cents per $100 of assessed value. Potomac Yard Special Tax District – This fund accounts for funding for improvements in Potomac Yards, including the development of a metro rail station. Other Special Revenue – This fund accounts for grants and donations.
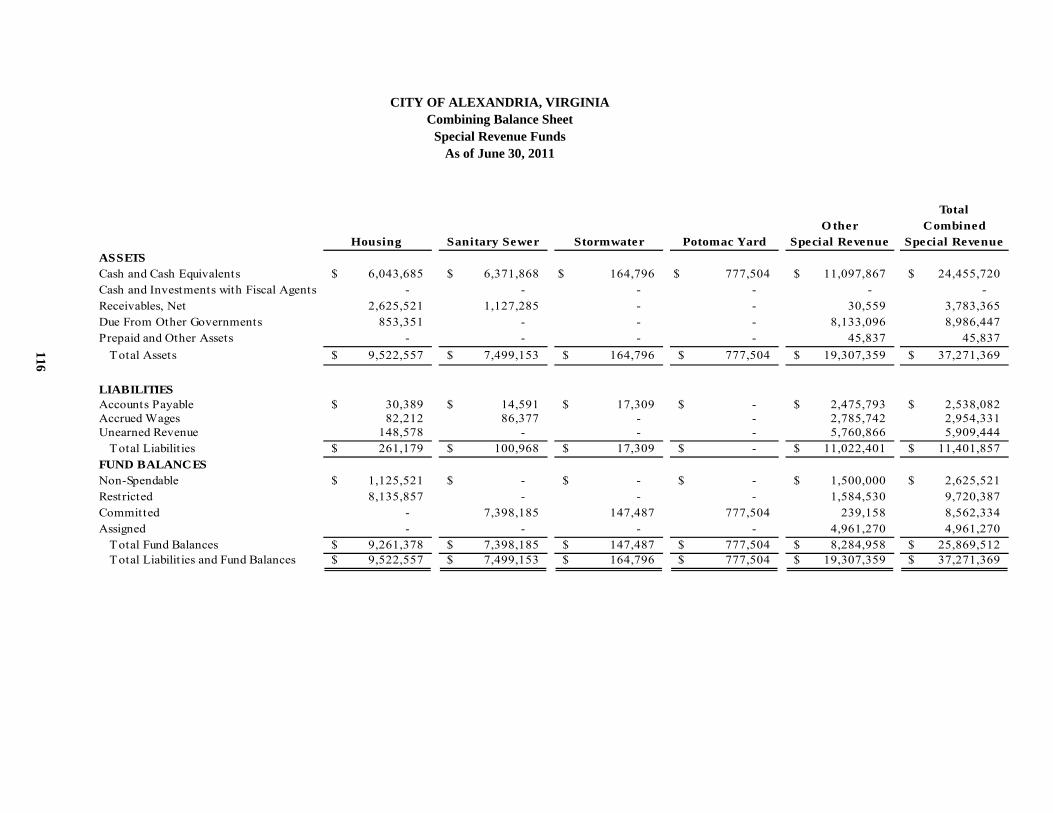
116
TotalO ther Combined
Housing Sanitary Sewer Stormwater Potomac Yard Special Revenue Special RevenueASSETSCash and Cash Equivalents 6,043,685$ 6,371,868$ 164,796$ 777,504$ 11,097,867$ 24,455,720$ Cash and Investments with Fiscal Agents - - - - - - Receivables, Net 2,625,521 1,127,285 - - 30,559 3,783,365 Due From Other Governments 853,351 - - - 8,133,096 8,986,447 Prepaid and Other Assets - - - - 45,837 45,837 Total Assets 9,522,557$ 7,499,153$ 164,796$ 777,504$ 19,307,359$ 37,271,369$
LIABILITIESAccounts Payable 30,389$ 14,591$ 17,309$ -$ 2,475,793$ 2,538,082$ Accrued Wages 82,212 86,377 - - 2,785,742 2,954,331 Unearned Revenue 148,578 - - - 5,760,866 5,909,444 Total Liabilit ies 261,179$ 100,968$ 17,309$ -$ 11,022,401$ 11,401,857$ FUND BALANCESNon-Spendable 1,125,521$ -$ -$ -$ 1,500,000$ 2,625,521$ Restricted 8,135,857 - - - 1,584,530 9,720,387 Committed - 7,398,185 147,487 777,504 239,158 8,562,334 Assigned - - - - 4,961,270 4,961,270 Total Fund Balances 9,261,378$ 7,398,185$ 147,487$ 777,504$ 8,284,958$ 25,869,512$ Total Liabilit ies and Fund Balances 9,522,557$ 7,499,153$ 164,796$ 777,504$ 19,307,359$ 37,271,369$
CITY OF ALEXANDRIA, VIRGINIA Combining Balance Sheet
Special Revenue Funds As of June 30, 2011
116

117
TotalO ther Combined
Housing Sewer Stormwater Potomac Yard Special Revenue Special RevenueREVENUESGeneral Property Taxes -$ -$ 1,587,327$ 277,504$ -$ 1,864,831$ Permits, Fees, and Licenses - - - - 4,527,999 4,527,999 Fines and Forfeitures - - - - 5,000 5,000 Use of Money and Property 24,979 - - - 254,866 279,845 Charges for Services - 7,320,304 - - 7,579,041 14,899,345 Intergovernmental Revenue 2,588,672 - - - 41,068,743 43,657,415 Miscellaneous 3,417,006 - - 500,000 1,341,063 5,258,069 Total Revenues 6,030,657$ 7,320,304$ 1,587,327$ 777,504$ 54,776,712$ 70,492,504$ EXPENDITURESCurrent Operating: General Government -$ -$ -$ -$ 815,687$ 815,687$ Judicial Administration - - - - 1,433,753 1,433,753 Public Safety - - - - 6,571,060 6,571,060 Public Works - 1,863,074 173,500 - 1,459,053 3,495,627 Health and Welfare - - - - 71,997,918 71,997,918 Culture and Recreation - - - - 1,204,085 1,204,085 Community Development 7,292,294 - - - 1,948,487 9,240,781 Total Expenditures 7,292,294$ 1,863,074$ 173,500$ -$ 85,430,043$ 94,758,911$ Excess (Deficiency) of Revenues Over (Under) Expenditures (1,261,637)$ 5,457,230$ 1,413,827$ 777,504$ (30,653,331)$ (24,266,407)$ O THER FINANCING SO URCES (USES)Transfers In 2,051,917$ -$ 783,660$ -$ 32,257,224$ 35,092,801$ Transfers O ut - (4,371,713) (2,050,000) - (1,029,518) (7,451,231) Total O ther Financing Sources and Uses 2,051,917$ (4,371,713)$ (1,266,340)$ -$ 31,227,706$ 27,641,570$
Total other financing sources (uses) 2,051,917 (4,371,713) (1,266,340) - 31,227,706 27,641,570 Net Change in Fund Balance 790,280$ 1,085,517$ 147,487$ 777,504$ 574,375$ 3,375,163$ Fund Balance at Beginning of Year 8,471,098 6,312,668 - - 7,710,583 22,494,349 Fund Balance at End of Year 9,261,378$ 7,398,185$ 147,487$ 777,504$ 8,284,958$ 25,869,512$
CITY OF ALEXANDRIA, VIRGINIA Combining Schedule of Revenues, Expenditures and Changes in Fund Balance
Special Revenue Funds As of June 30, 2011
117

118

119
STATISTICAL SECTION
120
The statistical section includes detail information to assist in understanding how the financial statements
relate to the City’s overall financial well-being and includes the following categories:
Financial trends: These tables assist users in understanding how the City’s financial position has
changed over time and include the following tables:
Table I - Schedule of Changes in Net Assets
Table II - Changes in Fund Balances Governmental Funds
Table VII - Net assets
Table VIII - Fund Balances Governmental Funds
Table XXII - Five-Year Summary of General Fund Revenues and Expenditure
Revenue Capacity: These tables assist in understanding and assessing the City’s own source revenues
and include the following tables:
Table III - Tax Revenues by Source
Tables IV and V - Tax Levies and Collections
Table VI - Real and Personal Property Tax Assessments and Rates
Table IX - 2011 Tax Rates for Major Revenue Sources
Table XV and XVI - Principal Taxpayers
Debt Capacity: These tables present information to assist in assessing the affordability of the City’s
current levels of debt and the City’s ability to issue additional debt in the future and include:
Table X - Legal Debt Margin Information
Table XI - Ratio of Net General Debt to Assessed Value and Net Debt Per Capita
Table XXII - Overlapping Debt and Debt History
Table XIII - Ratio of Annual Debt Service Expenditures for Net General Debt to Total General
Expenditures
Table XXIII - Summary of Total General Obligation Bonds Debt Service
121
Demographic and Economic Information: These tables include demographic and economic
information to assist in understanding the external factors that affect the City’s financial activities and
include:
Table XIV - Population and Per Capita Income
Table XVII - Alexandria City School Board Demographic Statistics
Table XVIII - Government Employees By Function
Table XIX - Principal Employers
Table XXI - Miscellaneous Statistical Data
Operating information: These tables include service and capital data to assist in understanding how
financial information relates to the programs and activities the City performs and includes:
Table XX – Operating and Capital Indicators

122
2002 2003 2004 2005 2006 2007 2008 2009 2010 2011Expenses
Governmental Activities: General Government 45.1$ 47.4$ 56.5$ 47.7$ 47.5$ 63.6$ 64.6$ 79.5$ 61.1$ 59.2$ Judicial Administration 12.5 13.0 14.0 14.6 15.6 17.7 19.3 19.3 19.3 19.8 Public Safety 83.2 88.4 94.9 96.5 106.9 112.3 114.5 120.5 118.3 122.2 Public Works 33.5 36.9 44.1 40.0 41.1 44.3 48.8 48.5 57.0 51.0 Library 4.8 5.1 5.5 6.0 6.4 6.8 6.9 6.8 6.1 5.9 Health and Welfare 66.8 71.9 73.9 79.4 84.3 89.4 96.2 97.3 90.8 92.7 T ransit 6.8 11.9 9.1 10.5 12.5 14.1 14.1 12.5 13.1 16.3 Culture and Recreation 17.2 20.8 21.3 26.1 25.3 26.9 30.4 28.1 25.9 28.3 Community Development 11.9 13.5 16.2 16.1 24.4 35.0 40.6 30.4 21.0 24.6 Education 110.7 123.4 128.6 142.2 139.9 153.7 168.5 173.8 173.3 174.8 Interest on Long-term Debt 7.6 7.1 8.0 9.5 10.4 13.5 12.5 10.9 16.4 17.3
Total Governmental Activities 400.1$ 439.3$ 472.0$ 488.6$ 514.4$ 577.3$ 616.4$ 627.6$ 602.3$ 612.1$
Subtotal Governmental Activities Expenses 400.1$ 439.3$ 472.0$ 488.6$ 514.4$ 577.3$ 616.4$ 627.6$ 602.3$ 612.1$
Business-type Activities:Recycling 0.5$ -$ -$ -$ -$ -$ -$ -$ -$ -$
Subtotal Business-type Activities: 0.5$ -$ -$ -$ -$ -$ -$ -$ -$ -$
Total Primary Government Expenses 400.6$ 439.3$ 472.0$ 488.6$ 514.4$ 577.3$ 616.4$ 627.6$ 602.3$ 612.1$
Program RevenuesGovernmental Activities:Charges for Services:
General Government -$ -$ -$ -$ -$ 6.3$ 5.6$ 1.4$ 2.0$ 1.3$ Judicial Administration 1.3 1.7 1.9 2.0 2.0 2.0 1.9 1.6 1.5 1.7 Public Safety 8.2 6.5 7.6 8.4 10.6 11.5 10.7 15.5 11.1 13.3 Public Works 8.2 9.6 10.4 13.2 16.9 16.1 17.4 18.1 18.0 21.3 Library - - - - - - - - - - Health and Welfare 4.9 5.2 5.2 5.1 5.4 6.4 6.7 6.6 6.7 6.4 T ransit - - - - - - - - - - Culture and Recreation 2.0 1.7 1.6 1.7 2.3 2.5 3.0 2.9 3.1 3.1 Community Development 0.1 0.3 0.3 0.3 3.1 4.9 6.0 8.2 1.6 3.9
Operating Grants and Contributions 52.9 60.0 62.5 59.6 60.3 61.0 61.3 63.2 65.2 65.0 Capital Grants and Contributions 12.4 20.0 15.0 5.1 9.9 18.2 7.6 20.5 50.2 7.4 Subtotal Governmental Activities 90.0$ 105.0$ 104.5$ 95.4$ 110.5$ 128.9$ 120.2$ 138.0$ 159.4$ 123.4$
Business-type Activities:Recycling 0.1 - - - - - - - - -
Subtotal Business-type Activities: 0.1$ -$ -$ -$ -$ -$ -$ -$ -$ -$ Total Primary Government Revenues 90.1$ 105.0$ 104.5$ 95.4$ 110.5$ 128.9$ 120.2$ 138.0$ 159.4$ 123.4$
Amounts may not add due to rounding
122
CITY OF ALEXANDRIA, VIRGINIA Schedule of Changes in Net Assets
Last Ten Fiscal Years (In millions)
TABLE I

123
2002 2003 2004 2005 2006 2007 2008 2009 2010 2011Net (Expense) (Revenue)
General Government (45.1)$ (47.4)$ (56.5)$ (47.7)$ (47.5)$ (57.3)$ (57.7)$ (77.6)$ (58.5)$ (56.4)$ Judicial Administration (11.2) (11.3) (12.1) (12.6) (13.6) (15.7) (13.1) (13.7) (14.2) (14.1) Public Safety (75.0) (81.9) (87.3) (88.1) (96.3) (100.8) (89.6) (91.8) (93.5) (96.2) Public Works (25.3) (27.3) (33.7) (26.8) (24.2) (28.2) (20.7) (4.8) 19.3 (15.8) Library (4.8) (5.1) (5.5) (6.0) (6.4) (6.8) (6.9) (6.8) (6.1) (5.9) Health and Welfare (61.9) (66.7) (68.7) (74.3) (78.9) (83.0) (57.2) (54.7) (49.1) (51.4) Transit (6.8) (11.9) (9.1) (10.5) (12.5) (14.1) (14.1) (12.6) (13.1) (16.3) Culture and Recreation (15.2) (19.1) (19.7) (24.4) (23.0) (24.4) (27.2) (25.0) (22.3) (24.7) Community Development (11.8) (13.2) (15.9) (15.8) (21.3) (30.1) (28.9) (26.0) (15.2) (15.4) Education (110.7) (123.4) (128.6) (142.2) (139.9) (153.7) (168.5) (165.7) (173.3) (174.8) Interest on Long-term Debt (7.6) (7.1) (8.0) (9.5) (10.4) (13.5) (12.4) (10.9) (16.3) (17.3)
Subtotal Governmental Activities (375.4)$ (414.3)$ (445.0)$ (457.9)$ (474.1)$ (527.6)$ (496.3)$ (489.6)$ (442.3)$ (488.3)$
Business-type Activities:Recycling (0.3)$ -$ -$ -$ -$ -$ -$ -$ -$ -$
Subtotal Business-type Activities: (0.3) - - - - - - - - -
Total Primary Government (375.8)$ (414.3)$ (445.0)$ (457.9)$ (474.1)$ (527.6)$ (496.3)$ (489.6)$ (442.3)$ (488.3)$
General Revenues and O ther Changes in Net AssetsGovernmental Activities:
TaxesReal Estate 163.5$ 189.4$ 211.1$ 234.3$ 255.4$ 275.4$ 289.3$ 296.4$ 304.3$ 315.6$ Personal Property 38.5 31.1 31.3 32.0 33.1 35.3 38.6 37.9 32.9 37.0 Other 85.8 88.4 94.2 101.5 109.4 111.0 112.2 112.3 114.3 118.2 T ransfer - 1.0 - - - - - - - -
Grants and Contributions not restricted to other programs 28.9 29.2 30.4 29.5 31.0 32.4 31.8 32.4 31.5 32.4 Interest and Investment Earnings 7.3 3.6 1.7 4.9 9.1 6.9 6.0 1.7 0.4 1.0 Miscellaneous 0.5 0.6 0.3 0.5 0.8 0.6 0.6 1.1 0.8 1.0
Subtotal Governmental Activities 324.5$ 343.3$ 369.1$ 402.7$ 438.9$ 461.6$ 478.5$ 481.8$ 484.2$ 505.2$ Business-type Activities:
Payment for City -$ (1.0)$ -$ -$ -$ -$ -$ -$ -$ -$ Subtotal Business-type Activities: -$ (1.0)$ -$ -$ -$ -$ -$ -$ -$ -$ Total Primary Government 324.5$ 342.3$ 369.1$ 402.7$ 438.9$ 461.6$ 478.5$ 481.8$ 484.2$ 505.2$
Change in Net AssetsGovernmental Activities: (50.9)$ (71.0)$ (75.9)$ (55.2)$ (35.2)$ (66.0)$ (17.8)$ (7.8)$ 41.9$ 16.8$ Business-type Activities: (0.3) (1.0) - - - -
(51.3)$ (72.0)$ (75.9)$ (55.2)$ (35.2)$ (66.0)$ (17.8)$ (7.8)$ 41.9$ 16.8$
123
CITY OF ALEXANDRIA, VIRGINIA Schedule of Changes in Net Assets
Last Ten Fiscal Years (In millions)
TABLE I (continued)

2002 2003 2004 2005 2006 2007 2008 2009 2010 2011General Property Taxes 205.1$ 218.9$ 243.5$ 265.3$ 290.1$ 310.8$ 324.1$ 333.5$ 337.2$ 351.6$ Other Local Taxes 84.0 88.1 94.0 101.5 109.5 111.0 112.3 112.3 114.4 118.3 Permits Fees and License 4.2 4.5 4.0 4.5 6.5 7.2 5.8 5.7 4.8 7.1 Fines and Forfeitures 3.9 3.9 4.2 4.0 3.5 3.6 3.9 4.1 3.9 4.5 Use of Money and Property 9.9 6.3 4.6 7.9 12.1 15.8 12.0 6.2 3.8 4.1 Charges for Services 14.2 15.6 16.1 19.2 23.9 23.2 25.8 25.3 27.0 29.9 Intergovernmental Revenue 79.1 92.9 95.4 90.1 92.1 111.5 100.7 116.0 110.1 101.9 Sale of Surplus Property - - 2.8 - 0.5 - - - - - Miscellaneous and
Non Revenue Receipts 4.9 4.8 7.6 4.2 5.1 7.3 10.2 15.8 5.5 7.5 Total Governmental Revenues 405.3$ 435.1$ 472.1$ 496.7$ 543.3$ 590.4$ 594.8$ 618.9$ 606.7$ 624.9$
ExpendituresGeneral Government 30.2 31.9 36.1 37.7 39.6 45.5 43.0 46.7 45.2 44.3 Judicial Administration 12.0 12.5 13.5 14.1 15.0 17.1 18.7 18.9 18.8 19.3 Public Safety 78.2 86.6 89.6 93.8 104.5 109.6 112.2 116.8 115.0 118.4 Public Works 27.5 29.8 30.0 30.1 32.6 35.5 36.7 36.9 42.3 37.9 Library 4.8 5.1 5.5 6.0 6.4 6.8 6.9 6.8 6.1 5.9 Health and Welfare 66.4 71.5 73.5 78.9 83.9 88.9 95.7 96.8 90.2 92.1 T ransit and Transit T ransfer 6.8 8.5 9.1 10.5 12.5 14.1 14.1 12.5 13.1 16.3 Culture and Recreation 15.0 17.4 18.5 20.1 21.8 23.6 24.5 23.2 21.8 22.8 Community Development 9.5 12.1 13.3 15.1 23.3 31.3 34.4 28.5 19.3 22.8 Education 110.1 122.9 128.0 141.7 139.4 150.7 164.2 168.0 167.5 170.1 Capital Outlay 46.9 49.4 53.4 51.5 79.1 93.5 75.8 100.7 93.4 91.5 Debt Service - Principal 8.6 10.4 10.9 13.2 16.5 17.7 18.2 19.1 19.5 21.1
- Interest 7.6 7.2 7.9 9.6 10.5 13.3 12.3 12.8 15.1 17.4
Total Governmental Expenditures 423.5$ 465.2$ 489.1$ 522.3$ 585.1$ 647.6$ 656.7$ 687.7$ 667.3$ 679.9$
Excess of Revenues (18.2)$ (30.1)$ (17.0)$ (25.6)$ (41.8)$ (57.2)$ (61.9)$ (68.8)$ (60.6)$ (55.0)$ over (under ) expenditures
O ther Financing Sources/(Uses)
Issuance of Debt 54.5 - 67.9 55.8 72.7 0.1 - 145.7 - 74.2 T ransfers in 40.5 48.0 45.0 54.7 59.0 49.1 67.8 58.9 48.6 47.9 T ransfers out (40.6) (47.6) (46.5) (54.7) (59.5) (50.0) (67.8) (58.2) (48.9) (48.1)
54.4$ 0.4$ 66.3$ 55.8$ 72.2$ (0.8)$ -$ 146.4$ (0.3)$ 74.0$
Net change in Fund Balance 36.2$ (29.7)$ 49.3$ 30.2$ 30.4$ (58.0)$ (61.9)$ 77.6$ (60.9)$ 19.0$
4.30% 4.23% 4.31% 4.84% 5.34% 5.59% 5.25% 5.43% 6.03% 6.54%
Total O ther Financing Sources (Uses)
124
Debt Service as percentage of noncapital expenditures
Amounts may not add due to rounding
CITY OF ALEXANDRIA, VIRGINIA Changes in Fund Balances Governmental Funds
Last Ten Fiscal Years (In millions)
TABLE II

F is c a l Ye a r 2 0 0 2 2 0 0 3 2 0 0 4 2 0 0 5 2 0 0 6 2 0 0 7 2 0 0 8 2 0 0 9 2 0 10 2 0 11
R e a l Es t a t e 16 4 ,9 59 ,4 0 9$ 18 6 ,4 3 1,8 15$ 2 10 ,9 2 2 ,789$ 2 3 2 ,52 8 ,4 57$ 2 55,14 1,0 6 3$ 2 74 ,4 77,589$ 2 87,34 4 ,2 99$ 2 9 5,518 ,8 93$ 30 2 ,6 66 ,19 2$ 314 ,50 6 ,52 6$
P e rs o n a l 3 8 ,3 31,4 53 3 0 ,74 5,9 62 30 ,9 4 4 ,0 59 3 1,2 43 ,56 0 3 3 ,16 3 ,12 6 3 4 ,48 7,106 34 ,8 8 3 ,0 3 7 36 ,0 2 3 ,9 4 5 3 2 ,9 2 3 ,178 34 ,8 9 1,9 4 4
P e n a l t i e s a n d In t e r e s t 1,8 54 ,8 3 5 1,76 1,58 5 1,6 57,9 26 1,514 ,78 3 1,751,50 3 1,8 56 ,9 2 7 1,8 8 5,6 83 1,9 3 9 ,2 2 5 1,6 3 1,54 8 2 ,2 4 6 ,18 6
Lo c a l S a l e s 2 0 ,3 16 ,3 4 5$ 2 1,2 16 ,124$ 2 2 ,54 1,8 86$ 23 ,8 12 ,2 77$ 2 5,2 6 4 ,6 8 9$ 25,44 0 ,6 38$ 24 ,2 56 ,8 03$ 2 1,6 79 ,6 3 5$ 2 2 ,74 4 ,4 8 3$ 2 3 ,8 8 0 ,9 0 9$
U t i l i t y 17,76 1,93 1 17,79 3 ,919 18 ,570 ,2 90 18 ,520 ,6 6 7 17,58 7,8 65 13 ,8 36 ,170 10 ,0 19 ,8 54 10 ,40 9 ,2 48 10 ,4 6 2 ,2 3 3 10 ,8 12 ,9 8 9
B u s i n e s s Li c e n s e 2 2 ,2 33 ,3 3 0 23 ,6 79 ,8 89 2 5,6 0 1,3 66 2 7,0 9 8 ,03 2 2 8 ,3 8 1,58 3 3 0 ,94 7,4 12 32 ,0 2 6 ,526 3 0 ,52 7,9 56 3 0 ,29 5,6 2 4 3 0 ,44 4 ,79 8
C a b l e TV Fr a n c h i s e Li c 1,0 2 5,4 74 9 78 ,574 1,0 8 9 ,3 8 1 1,154 ,576 1,2 4 0 ,8 4 1 72 0 ,9 26 - - - -
Mo t o r Ve h i c l e Li c e n s e 2 ,28 5,72 2 2 ,3 13 ,0 54 2 ,4 2 7,6 56 2 ,4 6 0 ,98 0 2 ,4 6 1,0 2 3 2 ,4 2 9 ,0 78 3 ,197,576 3 ,0 8 5,2 88 3 ,172 ,254 3 ,32 4 ,9 37
B a n k Fra n c h i s e 1,2 9 4 ,3 76 1,9 2 2 ,0 9 5 1,111,6 9 1 1,3 64 ,2 70 1,78 4 ,56 5 1,54 0 ,550 1,26 3 ,6 89 1,8 55,4 96 2 ,4 32 ,3 12 2 ,6 70 ,2 75
To b a c c o 1,597,14 0 2 ,0 83 ,13 5 2 ,43 0 ,0 92 2 ,2 77,36 6 2 ,8 4 0 ,48 6 2 ,93 2 ,3 86 2 ,6 8 1,573 2 ,719 ,0 84 2 ,9 10 ,3 8 2 2 ,777,0 52
R e c o rd a t i o n 2 ,4 9 4 ,4 2 5 3 ,2 6 2 ,783 4 ,0 4 6 ,517 7,2 4 4 ,02 2 7,8 18 ,6 76 6 ,56 1,3 30 4 ,9 4 7,2 08 3 ,2 0 6 ,70 5 3 ,313 ,54 7 3 ,6 6 8 ,6 6 3
Tra n s i e n t Lo d g i n g 5,2 0 6 ,418 5,2 4 1,018 6 ,32 3 ,9 06 7,183 ,0 6 7 7,8 11,88 4 7,4 15,0 60 8 ,50 6 ,762 10 ,59 2 ,8 06 10 ,8 24 ,4 10 11,2 4 5,2 0 1
R e s t a u r a n t Fo o d 8 ,562 ,8 4 0 8 ,79 2 ,704 9 ,0 51,520 9 ,598 ,76 3 10 ,0 94 ,2 67 10 ,6 57,8 39 10 ,9 72 ,0 48 14 ,912 ,796 14 ,9 0 8 ,9 9 9 16 ,2 14 ,9 0 0
Te l e c o m m u n i c a t i o n 1,139 ,2 6 6 79 2 ,0 2 5 72 7,3 84 72 6 ,112 725,68 4 6 9 1,0 23 8 57,3 54 8 2 9 ,2 9 1 819 ,3 13 8 3 9 ,8 4 8
A d m i s s i o n s - - - - 1,14 9 ,537 1,0 58 ,2 26 1,0 9 0 ,0 6 7 1,10 3 ,782 1,12 5,172 1,08 2 ,6 85
C e l l P h o n e - - - - 2 ,3 0 5,525 1,3 9 7,4 52 - - - -
C o m m u n i c a t i o n s S a l e s - - - - - 5,3 18 ,2 53 12 ,4 0 2 ,2 56 11,2 6 8 ,560 11,3 15,54 1 11,2 59 ,53 4
Ot h e r 4 2 ,50 7 4 4 ,528 3 9 ,26 6 2 8 ,42 8 2 8 ,9 3 1 3 3 ,0 24 4 2 ,2 2 5 8 0 ,723 4 7,0 8 1 3 7,56 6
To t a l 2 89 ,10 5,4 71$ 3 0 7,0 59 ,210$ 3 3 7,4 8 5,729$ 3 6 6 ,755,36 0$ 39 9 ,551,24 8$ 4 2 1,80 0 ,9 89$ 4 36 ,3 76 ,9 60$ 44 5,753 ,4 33$ 4 51,59 2 ,2 6 9$ 4 69 ,9 0 4 ,0 13$
125
Ge n e ra l P r o p e r t y
Ta x e s
Ot h e r Lo c a l Ta x e s
City of Alexandria, Virginia Tax Revenues by Source
Last Ten Fiscal Years TABLE III

126
Table IV
Calendar Year Ended December 31,
Taxes Levied for the Calendar
Year* Amount Percentage of
LevyCollections in
Subsequent Years AmountPercentage of
Levy2001 159,186 156,748 98.47% 2,433 159,181 100.00%2002 174,827 172,296 98.55% 2,520 174,816 99.99%2003 199,799 196,181 98.19% 3,604 199,785 99.99%2004 225,156 223,047 99.06% 2,094 225,141 99.99%2005 250,180 247,166 98.80% 2,999 250,165 99.99%2006 267,015 264,951 99.23% 1,861 266,812 99.92%2007 282,563 279,948 99.07% 2,528 282,476 99.97%2008 296,204 292,996 98.92% 2,801 295,797 99.86%2009 308,330 305,691 99.14% 301 305,992 99.24%2010 308,848 305,548 98.93% - 305,548 98.93%
* Levy adjusted for changes since original levyTable V
Calendar Year Ended December 31, Total
Commonwealth Reimbursement # Amount
Percentage of Levy
Collections in Subsequent
Years AmountPercentage
of Levy2001 60,131 * 20,842 48,136 80.05% 11,176 59,312 98.64%2002 58,478 21,122 49,216 84.16% 3,880 53,096 90.80%2003 60,472 22,915 50,576 83.64% 3,711 54,287 89.77%2004 56,059 21,936 48,535 86.58% 3,860 52,395 93.46%2005 58,942 22,558 50,422 85.55% 4,807 55,229 93.70%2006 62,213 24,193 55,284 88.86% 2,745 58,029 93.27%2007 61,974 23,849 55,247 89.15% 2,936 58,183 93.88%2008 62,740 23,768 56,201 89.58% 3,114 59,315 94.54%2009 60,820 24,635 54,784 90.08% 1,719 56,503 92.90%2010 60,301 24,057 55,611 92.22% - 55,611 92.22%
* Assessment adjusted for large sale of public service commission property to private corporation.# Commonwealth reimbursement included in taxes levied and collections.
Total Collections to dateCollected within the Fiscal Year of
the Levy
(Amounts in thousands)Real Property
Taxes Levied for the Calendar YearCollected within the Fiscal Year of
Personal Property(Amounts in thousands)
the Levy Total Collections to date
CITY OF ALEXANDRIA, VIRGINIA Tax Levies and Collections Last Ten Calendar Years
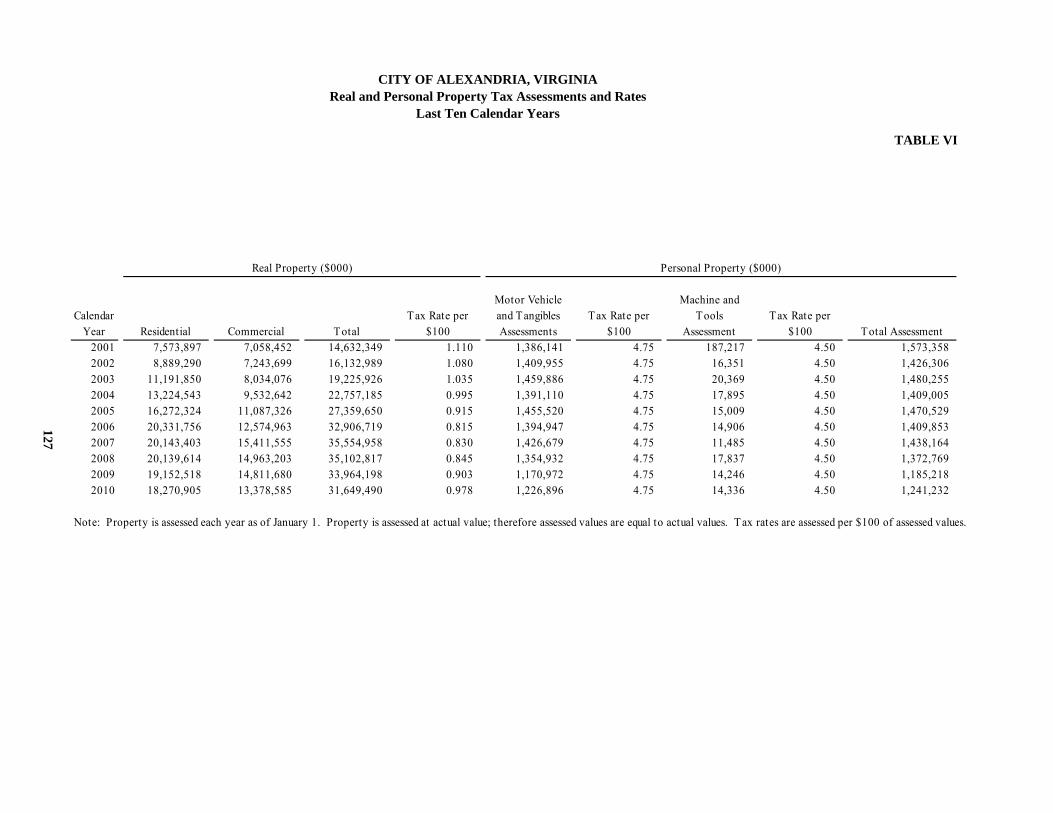
Calendar Year Residential Commercial Total
Tax Rate per $100
Motor Vehicle and Tangibles Assessments
Tax Rate per $100
Machine and Tools
AssessmentTax Rate per
$100 Total Assessment2001 7,573,897 7,058,452 14,632,349 1.110 1,386,141 4.75 187,217 4.50 1,573,358 2002 8,889,290 7,243,699 16,132,989 1.080 1,409,955 4.75 16,351 4.50 1,426,306 2003 11,191,850 8,034,076 19,225,926 1.035 1,459,886 4.75 20,369 4.50 1,480,255 2004 13,224,543 9,532,642 22,757,185 0.995 1,391,110 4.75 17,895 4.50 1,409,005 2005 16,272,324 11,087,326 27,359,650 0.915 1,455,520 4.75 15,009 4.50 1,470,529 2006 20,331,756 12,574,963 32,906,719 0.815 1,394,947 4.75 14,906 4.50 1,409,853 2007 20,143,403 15,411,555 35,554,958 0.830 1,426,679 4.75 11,485 4.50 1,438,164 2008 20,139,614 14,963,203 35,102,817 0.845 1,354,932 4.75 17,837 4.50 1,372,769 2009 19,152,518 14,811,680 33,964,198 0.903 1,170,972 4.75 14,246 4.50 1,185,218 2010 18,270,905 13,378,585 31,649,490 0.978 1,226,896 4.75 14,336 4.50 1,241,232
Note: Property is assessed each year as of January 1. Property is assessed at actual value; therefore assessed values are equal to actual values. Tax rates are assessed per $100 of assessed values.
Real Property ($000) Personal Property ($000)
CITY OF ALEXANDRIA, VIRGINIA
Real and Personal Property Tax Assessments and Rates Last Ten Calendar Years
TABLE VI
127

Governmental Activit ies 2002 2003 a 2004 2005 2006 2007 2008 2009 2010 2011Invested in Capital Assets, Net of Related Debt 118.5$ 160.6$ 119.5$ 100.2$ 105.6$ 170.0$ 231.0$ 153.3$ 248.0$ 335.4$ Restricted for: Affordable Housing - - - - 3.0 0.3 - - - - Capital Projects 70.1 72.8 115.7 148.3 157.2 101.6 51.5 134.7 72.3 - Unrestricted Net Assets 103.8 67.9 67.7 63.9 81.6 88.7 60.3 47.0 57.3 59.0
Subtotal Governmental Activit ies Net Assets 292.4$ 301.3$ 302.9$ 312.4$ 347.4$ 360.6$ 342.8$ 335.0$ 377.6$ 394.4$
Business-type Activities Net AssetsInvested in Capital Assets, Net of Related Debt 0.1 - - - - - - - - -
128 Unrestricted Net Assets 0.9 - - - - - - - - - Subtotal Business-type Activities Net Assets 1.0$ -$ -$ -$ -$ -$ -$ -$ -$ -$
Primary GovernmentInvested in Capital Assets, Net of Related Debt 118.6 160.6 119.5 100.2 105.6 170.0 231.0 153.3 248.0 335.4Restricted for: Affordable Housing - - - - 3.0 0.3 - - - - Capital Projects 70.1 72.8 115.7 148.3 157.2 101.6 51.5 134.7 72.3 - Unrestricted Net Assets 104.6 67.9 67.7 63.9 81.6 88.7 60.3 47.0 57.3 59.0
Total Primary Government Net Assets 293.4$ 301.3$ 302.9$ 312.4$ 347.4$ 360.6$ 342.8$ 335.0$ 377.6$ 394.4$
a Recycling fund transferred to the General Fund in FY 2003Amounts may not add due to rounding
Note: Accounting Standards require that net assets be reported in three components in the financial statements: invested in capital assets, net of related debt; restricted; and unrestricted.
CITY OF ALEXANDRIA, VIRGINIA Net Assets
Last Ten Fiscal Years (in millions)
TABLE VII

2002 2003 2004 2005 2006 2007 2008 2009 2010 2011General FundReserved for:
Encumbrances 3,117,566$ 2,386,468$ 1,525,942$ 2,087,658$ 1,845,820$ 2,345,051$ 1,579,168$ 1,967,201$ 2,007,557$ -$ Inventories 1,480,168 1,537,404 1,681,593 1,970,689 2,189,185 2,347,911 1,588,472 1,891,281 1,827,459 - Notes Receivable - - - - - - - 400,000 400,000 -
Unreserved 63,630,925 54,193,856 59,589,075 58,216,836 63,343,040 67,560,766 62,320,401 49,048,509 58,806,355 - Non-Spendable 5,509,288 Committed 16,149,828 Assigned 30,009,737 Unassigned 29,191,314 Subtotal General Fund 68,228,659$ 58,117,728$ 62,796,610$ 62,275,183$ 67,378,045$ 72,253,728$ 65,488,041$ 53,306,991$ 63,041,371$ 80,860,167$
All Other Governmental FundsReserved For
Capital Projects 61,806,602$ 63,968,631$ 105,611,068$ 126,848,380$ 141,395,119$ 83,700,361$ 2,691,739$ 101,741,783$ 39,286,809$ -$ Notes Receivable 1,558,984 1,922,984 4,227,041 4,147,198 2,015,393 1,236,283 1,204,885 2,673,806 2,650,025 - Encumbrances 8,321,719 8,788,237 10,042,480 21,501,270 18,055,741 19,475,849 50,019,226 34,830,199 30,913,373 - Unreserved Special Revenue 12,263,486 11,761,929 11,359,179 9,831,441 26,366,419 20,909,225 15,523,030 20,280,831 15,972,479 -
129 Unreserved Capital Projects 22,031,197 - - - - - - - - - Non-Spendable (Special Revenue Fund 2,625,521 Restricted (Special Revenue Fund) 9,720,387 Committed (Special Revenue Fund) 8,562,334 Committed (Capital Projects) 64,184,449 Assigned (Special Revenue Fund) 4,961,270 Total All Other Governmental Funds 105,981,988$ 86,441,781$ 131,239,768$ 162,328,289$ 187,832,672$ 125,321,718$ 69,438,880$ 159,526,619$ 88,822,686$ 90,053,961$
With the implementaion of GASB Statement No. 54 in Fiscal Year 2011, the fund balance terminology was changed.
CITY OF ALEXANDRIA, VIRGINIA Fund Balances Governmental Funds
Last Ten Fiscal Years
TABLE VIII

130
CITY OF ALEXANDRIA, VIRGINIA 2011 Tax Rates for Major Revenue Sources
TABLE IX Real Estate Tax 99.8¢ per $100 assessed value Personal Property Tax $4.50 per $100 assessed value (machinery and tools)
$4.75 per $100 assessed value (tangible personal property) $3.55 per $100 assessed value (handicap vehicles) Utility Tax (for residential users) 15% of water service charge
$1.12 plus $0.012075 of each kwh ($2.40 maximum) $1.28 plus $0.124444 of each CCF gas delivered ($2.40 maximum) $1.28 plus $0.050909 of each CCF gas delivered-group meter consumers) ($2.40
maximum per dwelling unit) $1.28 plus 0.023267 of each CCF gas delivered-group meter interruptible
consumers ($2.40 maximum per dwelling unit) Utility Tax (for commercial users) 15% of first $150 of water service charge
$0.97 plus $0.004610 of each kwh delivered-commercial consumer $0.97 plus $0.003755 of each kwh delivered-industrial consumer $1.42 plus $0.050213 each CCF gas delivered-commercial/industrial consumer $4.50 plus $0.003670 of each CCF gas delivered-non-residential interruptible gas consumers
Business and Professional Licenses Alcoholic Beverages $5 - $1,500 First year of operation: Gross receipts less than $100,000 No tax due Gross receipts of greater than $100,000 and less than $2,000,000 $50 Gross receipts of $2,000,000 or more Same as renewal for greater than $100,000 below Renewal business Gross receipts of greater than $10,000 and less than $100,000: Any business $50 Gross receipts of $100,000 or more Amusement and Entertainment $0.36 per $100 gross receipts Professional $0.58 per $100 gross receipts Renting of Residential Property $0.50 per $100 gross receipts Renting of Commercial Property $0.35 per $100 gross receipts Financial Services $0.35 per $100 gross receipts Personal, Business and Repair Service $0.35 per $100 gross receipts Retail Merchants $0.20 per $100 gross receipts Restaurants $0.20 per $100 gross receipts Contractors $0.16 per $100 gross receipts Wholesale Merchants $0.05 per $100 total purchases Public Utilities Telephone $0.50 per $100 gross receipts Telegraph $2.00 per $100 gross receipts Communication Tax 2.6% of statewide communication tax Water, heat, electric and gas companies $0.50 per $100 gross receipts Admissions Tax 10% of admissions up to $0.50 per person Public Rights-of-Way Use Fee $0.83 per line per month Local Sales Tax 1% added to the rate of the state retail tax imposed Daily Rental Tax 1% on the gross proceeds excluding heavy equipment 1.5% on the gross proceeds for heavy equipment Cigarette Tax $0.80 on each package of twenty cigarettes Transient Lodging Tax 6.5% of total amount paid for room rental plus $1 per night lodging fee Restaurant Meal Tax 4% on all food and drink Recordation Tax $0.083 per $100 of sales price – City (State is $0.25 per $100) Grantor Deed Tax $0.50 per $500 of sales price SOURCE: Department of Finance, Revenue Administration
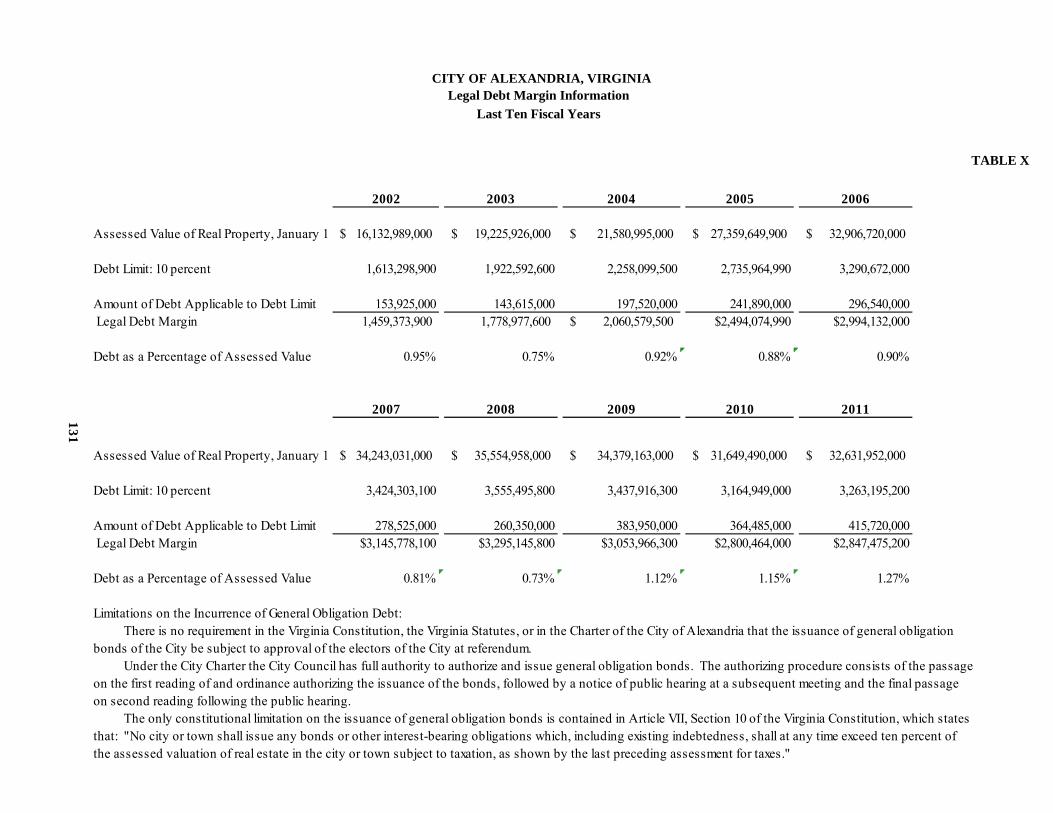
2002 2003 2004 2005 2006
Assessed Value of Real Property, January 1 16,132,989,000$ 19,225,926,000$ 21,580,995,000$ 27,359,649,900$ 32,906,720,000$
Debt Limit: 10 percent 1,613,298,900 1,922,592,600 2,258,099,500 2,735,964,990 3,290,672,000
Amount of Debt Applicable to Debt Limit 153,925,000 143,615,000 197,520,000 241,890,000 296,540,000 Legal Debt Margin 1,459,373,900 1,778,977,600 2,060,579,500$ $2,494,074,990 $2,994,132,000
Debt as a Percentage of Assessed Value 0.95% 0.75% 0.92% 0.88% 0.90%
2007 2008 2009 2010 2011131
Assessed Value of Real Property, January 1 34,243,031,000$ 35,554,958,000$ 34,379,163,000$ 31,649,490,000$ 32,631,952,000$
Debt Limit: 10 percent 3,424,303,100 3,555,495,800 3,437,916,300 3,164,949,000 3,263,195,200
Amount of Debt Applicable to Debt Limit 278,525,000 260,350,000 383,950,000 364,485,000 415,720,000 Legal Debt Margin $3,145,778,100 $3,295,145,800 $3,053,966,300 $2,800,464,000 $2,847,475,200
Debt as a Percentage of Assessed Value 0.81% 0.73% 1.12% 1.15% 1.27%
Limitations on the Incurrence of General Obligation Debt: There is no requirement in the Virginia Constitution, the Virginia Statutes, or in the Charter of the City of Alexandria that the issuance of general obligation bonds of the City be subject to approval of the electors of the City at referendum. Under the City Charter the City Council has full authority to authorize and issue general obligation bonds. The authorizing procedure consists of the passage on the first reading of and ordinance authorizing the issuance of the bonds, followed by a notice of public hearing at a subsequent meeting and the final passage on second reading following the public hearing. The only constitutional limitation on the issuance of general obligation bonds is contained in Article VII, Section 10 of the Virginia Constitution, which states that: "No city or town shall issue any bonds or other interest-bearing obligations which, including existing indebtedness, shall at any time exceed ten percent of the assessed valuation of real estate in the city or town subject to taxation, as shown by the last preceding assessment for taxes."
CITY OF ALEXANDRIA, VIRGINIA Legal Debt Margin Information
Last Ten Fiscal Years
TABLE X

Debt Per Capita As A Percentage
Year Population(3)Real
PropertyPersonal Property Total
O utstanding Debt
Real Property
Total Property
Personal Income ($100)
Debt Per Capita
of Per Capita Income(4)
2002 129,938 16,132,989$ 1,426,306$ 17,559,295$ 153,925,000$ 0.95 0.88 7,009,871$ 1,185$ 2.22003 135,000 19,225,926 1,459,886 20,685,812 143,615,000 0.75 0.69 7,165,859 1,064 2.02004 134,000 22,757,185 1,309,443 24,066,628 197,520,000 0.87 0.82 7,435,257 1,474 2.72005 135,000 27,359,650 1,359,782 28,719,432 241,890,000 0.88 0.84 7,776,966 1,792 3.12006 138,000 32,906,270 1,409,852 34,316,122 296,540,000 0.90 0.86 8,835,057 2,148 3.42007 139,000 35,554,958 1,411,599 36,966,557 278,525,000 0.78 0.75 9,507,531 2,004 2.92008 140,879 35,102,817 1,426,679 36,529,496 260,350,000 0.74 0.71 10,204,006 1,848 2.62009 144,100 33,964,198 1,354,932 35,319,130 383,950,000 1.13 1.09 10,178,071 2,664 3.72010 139,966 31,649,490 1,170,972 32,820,462 364,485,000 1.15 1.11 10,441,443 2,604 3.42011 141,287 32,631,952 1,226,896 33,858,848 415,720,000 1.27 1.23 10,627,334 2,942 3.8
132
(1) Net General Debt includes general obligation bonds and term notes.(2) Includes real and personal property as adjusted for changes to levy. (3) SOURCE: Alexandria Department of Planning and Zoning and the United States Bureau of Economic Analysis
Assessed Value ($000) (2)O utstanding Debt As
Percentage of Assessed
(4) Personal Income and per capita income represents data from the United States Bureau of Economic Analysis, as revised, that is generally two years old. The two most recent years are estimated based on City estimates of per capita trends.
CITY OF ALEXANDRIA, VIRGINIA Ratio of Net General Debt (1) to Assessed Value
and Net Debt Per Capita Last Ten Fiscal Years
TABLE XI

133
CITY OF ALEXANDRIA, VIRGINIA Overlapping Debt and Debt History
June 30, 2011
TABLE XII
The City of Alexandria is autonomous from any county, town, or other political subdivisions of the Commonwealth of Virginia. There is no overlapping general obligation debt or taxing powers. The water system and the sewage treatment plant within the City are operated by a private company and an independent authority, respectively, for which the City has no debt obligations.
The City has never defaulted in the payment of any part of either principal or interest on any debt.
Credit Ratings Moody's Investors Service ................................. Aaa Standard & Poor's Corporation .......................... AAA
Paying Agents
The City's coupon bonds and interest coupons are payable at the Chase Manhattan Bank, N.A., New York, New York, or SunTrust Bank in Richmond, Virginia. Registered bonds and interest are payable at the principal corporate trust office of the Chase Manhattan Bank, N.A., New York, New York, or Depository Trust Company, New York, New York, which are the Registrars for bonds of the City of Alexandria.
CITY OF ALEXANDRIA, VIRGINIA
Ratio of Annual Debt Service Expenditures for Net General Debt (1) to Total General Expenditures
Last Ten Fiscal Years
TABLE XIII
Ratio of Debt Service to General
Governmental Expenditures
Interest and Total Debt General
Year Principal Other Costs Service Expenditures (2)
2002 $ 8,450,000 $ 7,565,996 $ 16,015,996 $ 452,671,072 3.54 2003 10,310,000 7,173,024 17,483,024 488,044,085 3.59 2004 10,795,000 7,887,768 18,682,768 516,275,303 3.62 2005 13,115,000 9,567,247 22,682,247 545,688,442 4.16 2006 16,350,000 10,502,282 26,852,282 623,774,871 4.30 2007 17,670,000 13,306,096 30,976,096 689,280,260 4.49 2008 18,175,000 12,344,320 30,519,320 688,844,141 4.43 2009 19,100,000 12,800,634 31,900,634 720,924,777 4.42 2010 19,465,000 15,123,463 34,588,463 705,338,251 4.90 2011 21,065,000 17,414,349 38,479,349 722,966,982 5.32
(1) Net General Debt includes general obligation bonds (2) Includes expenditures for School Board and Library component units
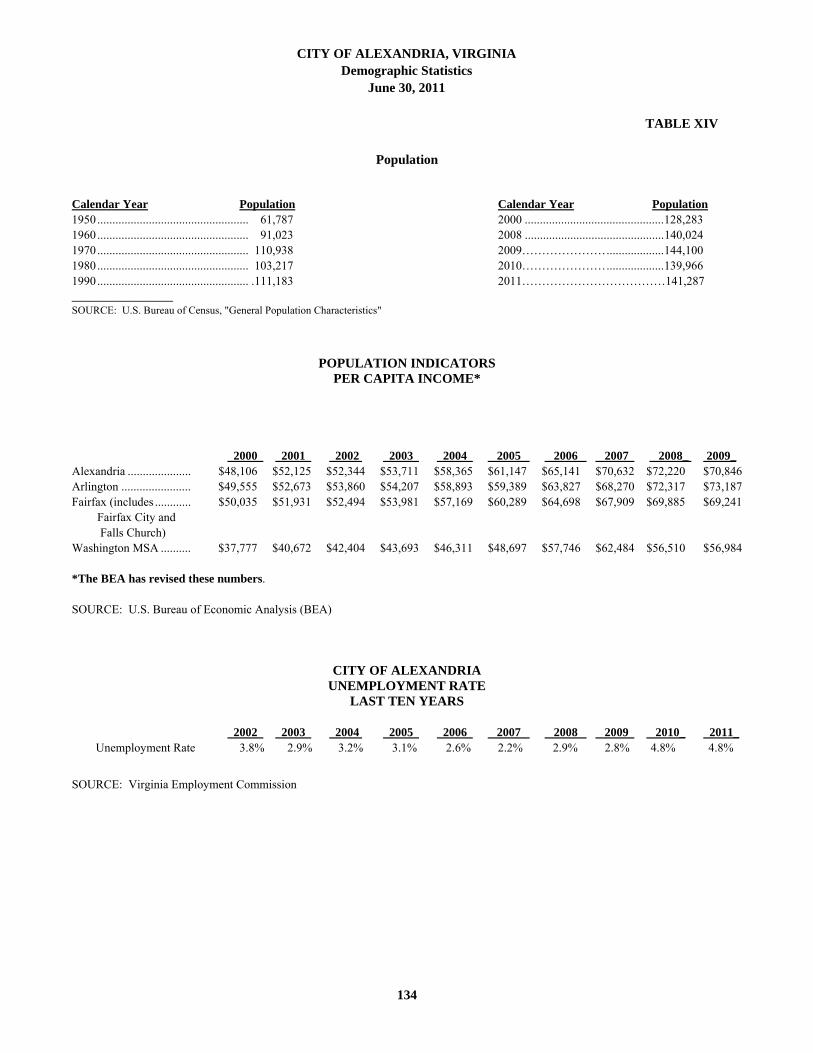
134
CITY OF ALEXANDRIA, VIRGINIA
Demographic Statistics June 30, 2011
TABLE XIV
Population
Calendar Year Population Calendar Year Population 1950 .................................................. 61,787 2000 .............................................. 128,283
1960 .................................................. 91,023 2008 .............................................. 140,024 1970 .................................................. 110,938 2009………………… ................... 144,100 1980 .................................................. 103,217 2010………………… ................... 139,966 1990 .................................................. . 111,183 2011………………………………141,287 ___________________ SOURCE: U.S. Bureau of Census, "General Population Characteristics"
POPULATION INDICATORS
PER CAPITA INCOME*
2000 2001 2002 2003 2004 2005 2006 2007 2008_ 2009_ Alexandria ..................... $48,106 $52,125 $52,344 $53,711 $58,365 $61,147 $65,141 $70,632 $72,220 $70,846 Arlington ....................... $49,555 $52,673 $53,860 $54,207 $58,893 $59,389 $63,827 $68,270 $72,317 $73,187 Fairfax (includes ............ $50,035 $51,931 $52,494 $53,981 $57,169 $60,289 $64,698 $67,909 $69,885 $69,241 Fairfax City and Falls Church) Washington MSA .......... $37,777 $40,672 $42,404 $43,693 $46,311 $48,697 $57,746 $62,484 $56,510 $56,984
*The BEA has revised these numbers. SOURCE: U.S. Bureau of Economic Analysis (BEA)
CITY OF ALEXANDRIA UNEMPLOYMENT RATE
LAST TEN YEARS
2002 2003 2004 2005 2006 2007 2008 2009 2010_ 2011_ Unemployment Rate 3.8% 2.9% 3.2% 3.1% 2.6% 2.2% 2.9% 2.8% 4.8% 4.8%
SOURCE: Virginia Employment Commission

135
Owner's Name Property
2011 Assessed Value (In millions)
Percentage of Total
Assessed Valuation
1. LCOR Alexandria, L.L.C. Office Buildings 982.3$ 3.01%2. AIMCO Foxchase L.P. Foxchase Apartments 283.8 0.873. Washington Real Estate Investment Trust Portfolio 251.4 0.774. Southern Towers L.L.C. Southern Towers Apartments 219.9 0.675. Lafayette Buildings LLC Mark Center Office Buildings 213.9 0.666. Hoffman Buildings LP Hoffman Office Buildings 182.9 0.567. Tishman Speyer Archstone Smith Newport Newport Village Apartments 165.8 0.518. T C Duke Street L.L.C. Office Buildings 163.6 0.509. Alexandria Apartments L.L.C. EOS 21 Apartments 161.1 0.49
10. CPYR Inc. Potomac Yard Retail 155.7 0.48
SOURCE: City of Alexandria, Department of Real Estate Assessments
Owner's Name Property
2002 Assessed Value (In millions)
Percentage of Total
Assessed Valuation
1. AIMCO Foxchase L.P. Foxchase Apartments 140.0$ 0.86%2. Southern Towers L.P. Southern Towers Apartments 119.4 0.733. SAP II-III/Stellar Housing Partnership Oakwood Apartments 116.4 0.724. Potomac Yard Retail, Inc. Potomac Yard Retail Center 106.4 0.655. Hoffman Buildings LP Hoffman Office Buildings 103.3 0.636. Canal Center Props Office Building 103.3 0.637. LCOR Alexandria LLC Vacant Land/Office Building 90.6 0.568. Hoffman Family LLC Vacant Land/Office Building 81.6 0.509. Millbrook Apts Assoc Millbrook Apartments 78.1 0.4810 Carlyle Development Corporation Vacant Land/Office Building 77.0 0.47
SOURCE: City of Alexandria, Department of Real Estate Assessments
CITY OF ALEXANDRIA, VIRGINIA
Principal Taxpayers Current Year and Nine Years Ago
TABLE XV Private Property

136
Owner's Name
2011 Assessed Value (In millions)
Percentage of Total
Assessed Valuation
1. Mirant Potomac River, LLC 252.8$ 0.8%2. Virginia Electric & Power Company 169.6 0.524. Norfolk Southern Railway Company 72.6 0.226. Richmond, Fredericksburg &Potomac Railway Co 68.2 0.215. Verizon Virginia Inc. 63.6 0.193. Covanta Alexandria/Arlington, Inc. 56.6 0.177. Virginia-American Water Co. 48.8 0.159. Washington Gas Light Company 32.2 0.108. Potomac Electric Power Company 31.8 0.10
10. T-Mobile Communications 6.2 0.02
SOURCE: Virginia State Corporation Commission
Owner's Name
2002 Assessed Value (In millions)
Percentage of Total
Assessed Valuation
1. Mirant Potomac River, LLC 181.50$ 1.12%2. Virginia Electric Power Company 109.50 0.943. Verizon Virginia, Inc 103.10 0.894. Covanta Alexandria, Arlington, Inc 60.40 0.375. Richmond, Fredericksburg &Potomac Railway Co 45.70 0.286. Norfolk Southern Railway Company 41.10 0.257. Virginia American Water Company 30.10 0.188. Potomac Electric Power Company 27.40 0.179. Washington Gas Light Company 27.00 0.17
10. Jones Telecommunications of Virginia, Inc. 19.40 0.12
CITY OF ALEXANDRIA, VIRGINIA Principal Taxpayers
Current Year and Nine Years Ago TABLE XV (Continued)
Public Service Companies

137
Fiscal Year
Total Enrollment(1)
Number Receiving
Free or Reduced
Meals
Number in English as
Second Language
Number Receiving
Special Education
Number in Elementary
School Gifted and Talented
Programs
Number in Middle (6-8)
School Gifted and Talented
Programs2002 11,274 5,593 1,809 1,958 547 4612003 10,979 5,243 2,090 1,949 644 4552004 11,104 5,525 2,412 1,999 543 4702005 10,667 5,449 2,628 1,979 493 4532006 10,284 5,169 2,379 1,900 436 4422007 10,057 4,961 2,223 1,802 436 4422008 10,557 5,012 2,083 1,786 451 4352009 11,225 5,866 2,909 1,830 333 3952010 11,623 6,264 2,572 1,747 451 3302011 11,999 6,665 2,698 1,701 462 293
SOURCE: City of Alexandria Public School System
CITY OF ALEXANDRIA, VIRGINIA
Alexandria City School Board Demographic Statistics Last Ten Fiscal Years
TABLE XVI

CITY OF ALEXANDRIA, VIRGINIA General Fund
City Departments' Expenditures Detail by Function For the Fiscal Year Ended June 30, 2011
TABLE XVII
Total Expenditures:
City Council.................................................. 499,346 $ - $ - $ - $ - $ - $ - $ - $ - $ - $ 499,346 City Manager................................................. 1,555,714 - - - - - - - - - 1,555,714 Office On Women….................................…… 1,403,706 - - - - - - - - - 1,403,706 Citizens Assistance........................................ 302,827 - 219,143 - - - - - - 521,970 Office of Management and Budget................. 1,063,491 - - - - - - - - - 1,063,491 18th Circuit Court......................................... - 1,391,612 - - . - - - - - - 1,391,612 18th General District Court........................... - 52,880 - - - - - - - - 52,880 Juvenile and Domestic Relations Courts......... - 18,814 - - - - - - - - 18,814 Commonwealth's Attorney............................. - 2,405,039 - - - - - - - - 2,405,039 Sheriff........................................................... - 7,255,965 19,423,549 - - - - - - - 26,679,514 Clerk of Courts.............................................. - 1,490,067 - - - - - - - 1,490,067 Other Correctional Activities...................…… - 3,996,386 1,073,719 - - - - - - - 5,070,105 Court Services............................................... - 1,285,154 - - - - - - - - 1,285,154 Human Rights………………………………… 590,629 - - - - - - - - - 590,629 Internal Audit………………………………… 235,591 - - - - - - - - - 235,591 Information Technology Services................... 7,181,221 - - - - - - - - - 7,181,221 Office of Communications....................... - - - - - - 1,261,245 - - - 1,261,245 City Clerk and Clerk of Council..................... 411,837 - - - - - - - - - 411,837 Finance....................………………………… 9,010,871 - - - - - - - - - 9,010,871 Real Estate Assessments....................……… 1,470,112 - - - - - - - - - 1,470,112 Human Resources.......................................... 2,820,166 - - - - - - - - - 2,820,166
Planning and Zoning...................................... - - - - - - 9,054,788 - - - 9,054,788
City Attorney................................................. 2,325,670 - - - - - - - - - 2,325,670
Registrar....................................................... 1,007,110 - - - - - - - - - 1,007,110
General Services............................................ 2,671,579 - - 9,009,848 - - - - - - 11,681,427 Procurement................................................. 861,763 - - - - - - - - - 861,763 Transportation and Environmental - - -
Services...................................................... - - - 24,800,184 - - 2,732,180 - - - 27,532,364 Transit Subsidies........................................... \ - - - - - - - 8,094,839 - 8,094,839 Fire................................................................ - - 36,736,241 - - - - - - - 36,736,241 Police............................................................ - - 51,013,585 - - - - - - - 51,013,585 Emergency Communications.......................... - - 1,842,911 - - - - - - 1,842,911 Mental Health/Mental Retardation and -
Substance Abuse......................................... - - - - 683,995 - - - - - 683,995 Health........................................................... - - - - 7,584,268 - 270,206 - - - 7,854,474 Human Services............................................. - - - - 9,820,623 - - - - - 9,820,623 Human Services Contributions....................... - - - - 2,012,623 - - - - - 2,012,623 Office of Historic Alexandria......................... - - - - - 2,560,919 - - - - 2,560,919 Recreation and Cultural Activities.................. - - - - - 19,025,423 - - - - 19,025,423 Other Educational Activities.......................... - - - - - ` - 12,229 - - 12,229 Miscellaneous................................................ 10,065,162 - 1,551,721 586,190 - 224,536 - 38,479,349 50,906,958 Total Expenditures................................... $ 43,476,795 $ 17,895,917 $ 111,860,869 $ 34,396,222 $ 20,101,509 $ 21,586,342 $ 13,542,955 $ 12,229 $ 8,094,839 $ 38,479,349 $ 309,447,026
$
EducationGovernment Administration
138
Service
Health and Debt
Development
Community Transit
Subsidies
General Recreation
Welfare & Culture
Judicial Public
Safety Works
Public

139
Current Year Employees(1)
Percentage of Total City
Employment(2) Nine Years Ago Employees(1)
Percentage of Total City
Employment(2)
LARGEST PUBLIC EMPLOYERS LARGEST PUBLIC EMPLOYERSU.S. Department of Commerce 1,000 & over 3.20% U.S. Department of Defense 1,000 & over 3.20%U.S. Department of Defense 1,000 & over 3.20% City of Alexandria 2,173 2.32%City of Alexandria 2,341 2.50% Alexandria Public Schools 2,008 2.14%Alexandria Public Schools 2,115 2.26% WMATA (Metro) 1,000 & over 3.20%WMATA 1000 & over 3.20% U.S. Postal Services 500-999 0.80%Northern Virginia Community College 500-999 0.80% U.S. Department of Agrculture 500-999 0.80%U.S. Army Non-Appropriated Funds 500-999 0.80% Northern Virginia Community College 500-999 0.80%
15.97% 13.28%
LARGEST PRIVATE EMPLOYERS LARGEST PRIVATE EMPLOYERSINOVA Alexandria Hospital 1000 & over 3.29% Alexandria Hospital 1,000 & over 3.29%American Building Maintenane Co 500-999 0.82% NOVA Care Employee Services 500-999 0.82%Institute of Defense Analysis 500-999 0.82% Institute for Defense Analysis 500-999 0.82%Gali Services Corporation 500-999 0.82% The Home Depot 500-999 0.82%CNA Corporation 500-999 0.82% United Parcel Service, Inc 500-999 0.82%Grant Thornton LLP 500-999 0.82% CNA Corporation 500-999 0.82%Oblon Spivak McClelland 250-499 0.41% Boat America Corporation 500-999 0.82%
7.81% 8.22%
SOURCE: Virginia Employment Commission(1) Employment ranges are given to ensure confindentiality.(2) Percentages are based on the midpoint of the employment range.
CITY OF ALEXANDRIA Government Employees By Function
Last Ten Fiscal Years TABLE XVIII
Principal Employers Current Year (as of July 1, 2011 and Nine Years Ago)
TABLE XIX
2002 2003 2004 2005 2006 2007 2008 2009 2010 2011 General Government 300 303 305 304 300 300 297 273 269 259 Judicial Administration 118 119 117 120 121 120 120 120 123 123 Public Safety 887 900 910 926 929 933 936 937 930 934 Public Works 224 227 229 231 232 225 228 231 232 240 Library 52 52 54 55 55 55 55 56 55 54 Health and Welfare 492 497 511 502 509 514 515 511 510 530 Culture and Recreation 145 145 150 155 154 157 158 155 152 144 Community Development 66 67 57 57 57 55 55 59 57 57 Education 2,098 2,079 2,082 2,120 2,125 2,119 2,058 2,015 2,098 2,115
TOTAL 4,382 4,389 4,415 4,470 4,482 4,478 4,422 4,357 4,426 4,456

2002 2003 2004 2005 2006 2007 2008 2009 2010 2011
Judicial AdministrationCivil and criminal cases processed by Clerk of Courts 49,998 4,785 5,346 5,780 5,255 5,657 5,730 5,700 5,666 6,700 Real estate documents processed 43,105 43,805 50,522 43,900 44,844 31,009 29,396 29,000 26,340 25,000
Public Safety Fire calls requiring emergency response 5,939 5,586 6,256 5,666 6,001 5,956 5,990 6,050 6,080 5,900 Police calls for emergency service 3,192 2,401 2,379 2,148 2,100 2,458 2,500 2,500 2,500 **EMS incidents responded to * * * * * * * 11,583 12,500 15,000
Public WorksSq yds of concrete sidewalks replaced 7,515 10,575 7,846 7,448 7,012 10,099 8,000 8,000 3,450 5,635 Cubic yards of leaves collected 26,750 26,750 21,075 22,650 31,000 33,600 33,000 33,000 32,001 33,500
LibraryCirculation 987,450 1,044,868 1,032,147 972,494 1,002,881 1,145,490 1,234,726 1,302,633 1,215,000 1,105,000 Patron visits 755,281 833,835 893,427 813,704 823,496 ** ** ** ** **Number of reference questions answered * * * * 376,532 591,864 592,345 592,855 567,500 332,050
Health and WelfareAdolescent patient visits 3,380 3,049 3,211 2,961 3,005 ** ** ** ** **Average monthly food stamp cases 1,100 1,206 1,530 1,658 1,637 1,675 1,675 3,294 4,098 4,586 Number of home based services * * * * 7,117 7,025 6,800 ** ** **Adult clients served * * * * 3,631 3,631 3,230 3,230 2,456 2,477
Transit Annual Ridership 2,739,719 2,986,631 3,131,284 3,323,021 3,556,486 3,743,499 3,800,000 4,006,825 3,880,000 3,741,499 Operating cost per mile 4.51$ 4.80$ 5.13$ 5.72$ ** ** ** ** ** **Miles of service * * * * 1,396,590 1,462,464 1,505,000 1,534,900 1,500,000 1,410,656
Culture and RecreationNumber of staff directed programs at City Recreation Centers and Playgrounds 17,365 20,437 19,128 19,154 20,500 ** ** ** ** **Average cost per park facility maintained * * * * * 25,246$ 23,018$ 24,512$ 22,671$ 23,078$
Community DevelopmentAverage Home rehabilitation loan 54,272$ 68,529$ 59,757$ 73,036$ 74,693 ** ** ** ** **Average Home rehabilitation loan cost * * * * * 68,479$ 69,484$ 32,379$ 61,154$ 63,350$
EducationCost per pupil 10,862$ 11,914$ 12,918$ 13,670$ 15,871$ 18,232$ 19,341$ 19,078$ 18,003$ 18,169$ Enrollment 11,104 10,979 10,752 10,677 10,284 10,332 10,557 11,225 11,623 11,999 * - New indicator - Additional information will be provided as it becomes available. In FY 2007, the City reviewed and changed many operating indicators. ** - Indicator no longer maintained
140
CITY OF ALEXANDRIA Operating Indicators By Function
Last Ten Fiscal Years TABLE XX

2002 2003 2004 2005 2006 2007 2008 2009 2010 2011
Judicial AdministrationNumber of beds at Sheltercare 14 14 14 14 14 ** ** ** ** **Number of foster care homes * * * * 125 123 135 91 60 60
Public SafetyRescue apparatus * * 98 98 108 ** ** ** ** **Fire vehicles * * * * * 132 136 130 137 139
Public WorksPaved streets 511 513 514 514 514 514 521 514 514 514Sidewalks 320 321 321 321 321 321 321 321 321 321
LibraryFull service branches and central library 4 4 4 4 4 4 4 4 4 4
Health and WelfarePreventative health care sites * 4 3 3 3 3 3 3 3 3
Transit DASH transit buses 49 49 49 57 57 57 57 62 63 63
Culture and RecreationPlaygrounds 45 45 45 45 45 45 46 46 46 45Athletic fields available for games * * * * 48 48 50 50 56 48Acreage of park and open space 964 964 964 949 964 964 964 964 964 965Total number of faciliteis mainiatained * * * * 217 217 206 235 237 237
Community DevelopmentPublic housing and public housing replacement units 1,150 1,150 1,150 1,150 1,150 1,150 1,150 1,150 1,150 1,150
EducationPublic schools 17 17 17 17 17 17 17 17 17 17
* - New indicator - Additional information will be provided as it becomes available. In FY 2007, the City reviewed and changed many operating indicators. ** - Indicator no longer maintained
SOURCE: City of Alexandria Approved Budget
141
CITY OF ALEXANDRIA Capital Indicators By Function
Last Ten Fiscal Years TABLE XX (cont)

142
CITY OF ALEXANDRIA, VIRGINIA Miscellaneous Statistical Data
As of June 30, 2011 TABLE XXI
Date of Incorporation ...................................................................... 1779 Date of City Charter ........................................................................ 1922 Form of Government .................................................. Council-Manager Number of Full-Time City Positions (Other than Schools) ...................................................................... 2,341 Number of Full-Time Equivalent School Positions ....................... 2,115 Land Area 15.75 Square Miles Elevation 0 to 287 Feet Above Sea Level
Location 38.8210 N 77.0861 W Climate Average January Temperature 34.9° Average July Temperature 79.2° Transportation Major Highways: Capital Beltway (I-95) I-395 (Shirley Highway) U.S. Route 1 George Washington Memorial Parkway Rail: The City is served by the north-south routes of Amtrak. The Virginia Railway Express provides commuter service between Alexandria, Washington, D.C., Fredericksburg, and Manassas, Virginia. Freight lines entering the City are Conrail, CSX Transportation, and Norfolk Southern Company.
Washington Metropolitan Area Transit Authority (WMATA) provides light transit to the Washington Metro area. Four of the systems stations are located in Alexandria.
Air:
Ronald Reagan Washington National Airport is only minutes away from any location within the City.
Dulles International Airport provides international and longer domestic travel.
Ground:
The City is served by local bus service provided by the Alexandria Transit Company.
The City is served by the local and express buses of the Washington Metropolitan Area Transit Authority (METRO) and the Fairfax Connector.
Individualized service is available through privately owned taxicab fleets.
Port Facilities:
The port of Alexandria has two docks for ocean-going freighters and two major public docks. The 24-foot deep Potomac River channel runs the length of the Alexandria waterfront.
Population 2011 Resident Population ................................................. 141,287 Number of Households – 2010 Census ............................... 68,082 Household Size (2010 U.S. Census) ............ 2.03 Persons Per Unit 2010 Population by Race (2010 U.S. Census Bureau): White ................................................................................... 60.9% Black .................................................................................... 21.8% Native American .................................................................... 0.4% Asian and Pacific Islanders .................................................... 6.0% Multi-Racial ........................................................................... 3.7% Other Races Alone ................................................................. 7.2% Hispanic (All Races) ............................................................ 16.1%
2010 Population by Age (U.S. Census Bureau Estimate): (1-17) ................................................................................... 17.1% (18-24) ................................................................................... 7.2% (25-64) ................................................................................. 66.5% (65 +) ..................................................................................... 9.1% Registered Voters June 2011 ............................................................................ 82,461 Temporary Assistance to Needy Families (Cases) - Monthly Average, 2011 ............................................ 540 Food Stamps (Cases) - Monthly Average, 2011 ................... 4,586 Medicaid (Cases) - Monthly Average, 2011 ......................... 8,021
Economy Employed Residents, June 2011 ......................................... 93,771 Unemployed Residents, June 2011 ....................................... 4,679 Unemployed Rate, June 2011 ................................................ 4.8% Washington PMSA Inflation Rate, based on Consumer Price Index, for FY 2011 ................................. 3.9%
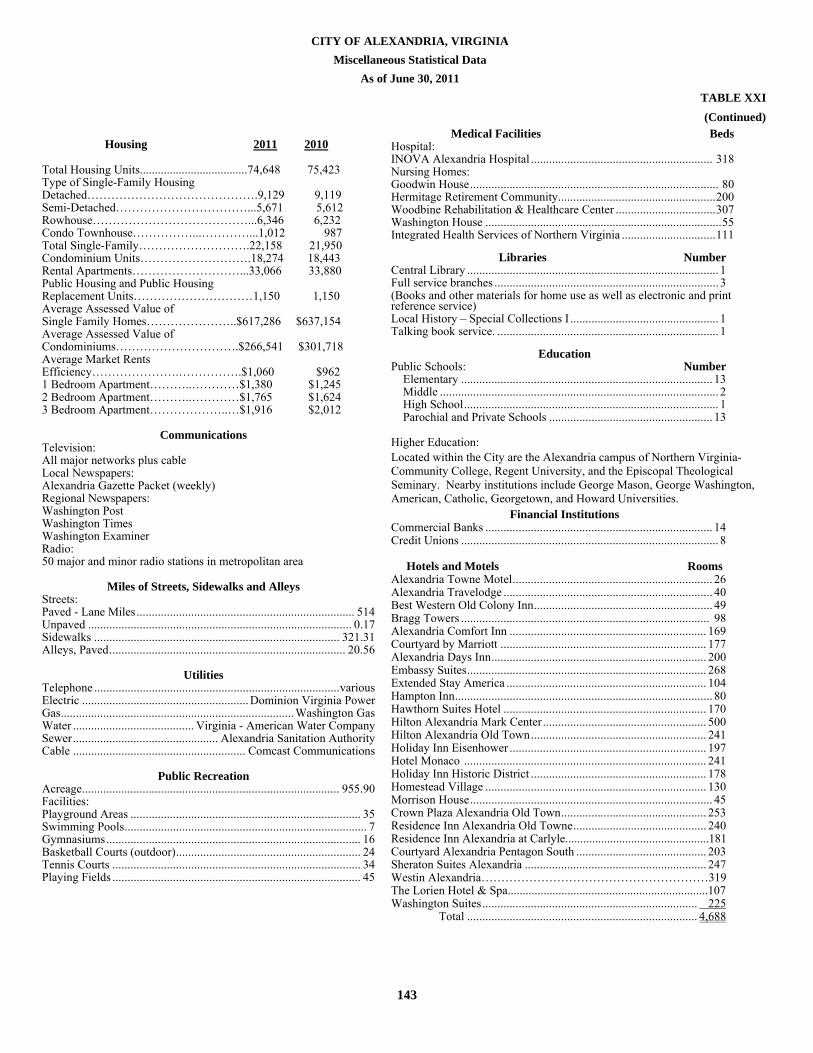
143
CITY OF ALEXANDRIA, VIRGINIA Miscellaneous Statistical Data
As of June 30, 2011 TABLE XXI (Continued)
Housing 2011 2010 Total Housing Units....................................74,648 75,423 Type of Single-Family Housing Detached…………………………………….9,129 9,119 Semi-Detached……………………………...5,671 5,612 Rowhouse…………………………………...6,346 6,232 Condo Townhouse……………...…………...1,012 987 Total Single-Family……………………….22,158 21,950 Condominium Units……………………….18,274 18,443 Rental Apartments………………………...33,066 33,880 Public Housing and Public Housing Replacement Units…………………………1,150 1,150 Average Assessed Value of Single Family Homes…………………..$617,286 $637,154 Average Assessed Value of Condominiums………………………….$266,541 $301,718 Average Market Rents Efficiency………………….…………….$1,060 $962 1 Bedroom Apartment………..…………$1,380 $1,245 2 Bedroom Apartment………..…………$1,765 $1,624 3 Bedroom Apartment………………..…$1,916 $2,012 Communications Television: All major networks plus cable Local Newspapers: Alexandria Gazette Packet (weekly) Regional Newspapers: Washington Post Washington Times Washington Examiner Radio: 50 major and minor radio stations in metropolitan area Miles of Streets, Sidewalks and Alleys Streets: Paved - Lane Miles ........................................................................ 514 Unpaved ....................................................................................... 0.17 Sidewalks ................................................................................. 321.31 Alleys, Paved .............................................................................. 20.56 Utilities Telephone ................................................................................. various Electric ....................................................... Dominion Virginia Power Gas ............................................................................. Washington Gas Water ........................................ Virginia - American Water Company Sewer ................................................ Alexandria Sanitation Authority Cable ......................................................... Comcast Communications Public Recreation Acreage ..................................................................................... 955.90 Facilities: Playground Areas ............................................................................ 35 Swimming Pools ................................................................................ 7 Gymnasiums .................................................................................... 16 Basketball Courts (outdoor) ............................................................. 24 Tennis Courts .................................................................................. 34 Playing Fields .................................................................................. 45
Medical Facilities BedsHospital: INOVA Alexandria Hospital ............................................................ 318 Nursing Homes: Goodwin House .................................................................................. 80 Hermitage Retirement Community .................................................... 200 Woodbine Rehabilitation & Healthcare Center ................................. 307 Washington House .............................................................................. 55 Integrated Health Services of Northern Virginia ............................... 111
Libraries Number Central Library ................................................................................... 1 Full service branches .......................................................................... 3 (Books and other materials for home use as well as electronic and print reference service) Local History – Special Collections I ................................................. 1 Talking book service. ......................................................................... 1
Education Public Schools: Number
Elementary ................................................................................... 13 Middle ............................................................................................ 2 High School .................................................................................... 1 Parochial and Private Schools ...................................................... 13
Higher Education: Located within the City are the Alexandria campus of Northern Virginia-Community College, Regent University, and the Episcopal Theological Seminary. Nearby institutions include George Mason, George Washington, American, Catholic, Georgetown, and Howard Universities.
Financial Institutions Commercial Banks ........................................................................... 14 Credit Unions ..................................................................................... 8
Hotels and Motels Rooms
Alexandria Towne Motel .................................................................. 26 Alexandria Travelodge ..................................................................... 40 Best Western Old Colony Inn ........................................................... 49 Bragg Towers .................................................................................. 98 Alexandria Comfort Inn ................................................................. 169 Courtyard by Marriott .................................................................... 177 Alexandria Days Inn ....................................................................... 200 Embassy Suites ............................................................................... 268 Extended Stay America .................................................................. 104 Hampton Inn ..................................................................................... 80 Hawthorn Suites Hotel ................................................................... 170 Hilton Alexandria Mark Center ...................................................... 500 Hilton Alexandria Old Town .......................................................... 241 Holiday Inn Eisenhower ................................................................. 197 Hotel Monaco ................................................................................ 241 Holiday Inn Historic District .......................................................... 178 Homestead Village ......................................................................... 130 Morrison House ................................................................................ 45 Crown Plaza Alexandria Old Town ................................................ 253 Residence Inn Alexandria Old Towne ............................................ 240 Residence Inn Alexandria at Carlyle................................................181 Courtyard Alexandria Pentagon South ........................................... 203 Sheraton Suites Alexandria ............................................................ 247 Westin Alexandria…………………………………………………319 The Lorien Hotel & Spa...................................................................107 Washington Suites ....................................................................... 225
Total ............................................................................ 4,688

144
2007 2008 2009 2010 2011Revenues:
General Property Taxes 310,821,622$ 324,113,019$ 333,482,063$ 337,220,918$ 349,779,825$ Other Local Taxes 110,979,367 112,263,941 112,271,370 114,371,351 118,259,357 Permits, Fees, and Licenses 5,944,363 4,764,924 4,827,422 4,811,588 2,543,789 Fines and Forfeitures 3,628,938 3,903,807 4,116,453 3,941,372 4,472,520 Use of Money and Property 9,712,862 9,044,947 4,433,015 3,033,638 3,591,323 Charges for Services 10,286,955 11,302,195 12,404,166 13,803,578 14,939,668 Intergovernmental Revenues 53,608,403 54,447,311 53,095,127 52,465,911 53,728,609 Miscellaneous 590,351 618,907 1,065,130 787,960 987,727
Total Revenues 505,572,861$ 520,459,051$ 525,694,746$ 530,436,316$ 548,302,818$
Other Financing Sources:Operating Transfers In 1,063,895$ 1,311,109$ 2,223,910$ 1,301,560$ 1,446,713$ Refunding Bonds 22,815,000 - - - - Premium 1,448,072 - - - -
Total Other Financing Sources 25,326,967$ 1,311,109$ 2,223,910$ 1,301,560$ 1,446,713$ Total Revenues and O ther Financing
Sources 530,899,828$ 521,770,160$ 527,918,656$ 531,737,876$ 549,749,531$
Expenditures:Current:
General Government 44,983,189$ 42,536,812$ 46,137,096$ 44,487,379$ 43,476,795$ Judicial Administration 16,024,123 17,028,954 17,958,782 17,743,109 17,895,917 Public Safety 105,381,228 108,941,895 113,896,868 111,666,800 111,860,869 Public Works 33,072,866 34,206,948 34,755,649 33,298,427 26,218,026 Health and Welfare 20,889,031 21,058,544 20,723,663 19,152,519 20,101,509 Culture and Recreation 22,855,258 23,822,427 23,109,869 20,748,594 21,586,342 Community Development 9,219,603 13,009,454 13,840,168 12,594,376 13,542,955 Education 12,548 12,399 12,004 12,304 12,229 T ransit 6,755,289 6,644,738 4,595,401 5,168,369 16,273,035
Debt Services:Principal Retired 17,729,329 18,175,000 19,100,000 19,465,000 21,065,000 Interest and Fiscal Charges 13,307,530 12,344,320 12,800,635 15,123,463 17,414,349
Total Expenditures 290,229,994$ 297,781,491$ 306,930,135$ 299,460,340$ 309,447,026$ Other Financing Uses:
Payment to Refunded BondsEscrow Agent 24,104,018$ -$ -$ -$ -$ Operating Transfers Out 47,816,337 55,343,575 50,769,720 42,940,615 40,621,320 T ransfers Out- Component Units 164,032,522 174,651,343 182,702,659 179,538,720 181,944,218
Total Other Financing Uses 235,952,877$ 229,994,918$ 233,472,379$ 222,479,335$ 222,565,538$ Total Expenditures and O ther
Financing Uses 526,182,871$ 527,776,409$ 540,402,514$ 521,939,675$ 532,012,564$
Revenues and Other Financing Sources Over/(Under) Expendiures and Other Financing Uses 4,716,957$ (6,006,249)$ (12,483,858)$ 9,798,201$ 17,736,967$ Fund Balances at Beginning of Year 67,378,045 72,253,728 65,488,041 53,306,991 63,041,371 Increase (Decrease) in Reserve for Inventory 158,726 (759,438) 302,808 (63,821) 81,829
FUND BALANCES AT END O F YEAR 72,253,728$ 65,488,041$ 53,306,991$ 63,041,371$ 80,860,167$
CITY OF ALEXANDRIA, VIRGINIA
Five-Year Summary of General Fund Revenues and Expenditures
Table XXII

145
Fiscal Year Total Principle Total Interest Total2012 23,725,000 $18,261,668 41,986,6682013 26,285,000 $17,173,550 43,458,5502014 28,095,000 $16,027,444 44,122,4442015 28,830,000 $14,948,043 43,778,0432016 28,785,000 $13,775,863 42,560,8632017 28,750,000 $12,508,638 41,258,6382018 28,695,000 $11,276,726 39,971,7262019 28,660,000 $10,042,801 38,702,8012020 26,625,000 $8,811,481 35,436,4812021 23,685,000 $7,650,131 31,335,1312022 20,855,000 $6,586,881 27,441,8812023 20,855,000 $5,642,456 26,497,4562024 17,555,000 $4,683,569 22,238,5692025 17,555,000 $3,868,794 21,423,7942026 15,515,000 $3,081,506 18,596,5062027 12,550,000 $2,304,300 14,854,3002028 12,550,000 $1,672,475 14,222,4752029 12,550,000 $1,034,013 13,584,0132030 9,200,000 $466,800 9,666,8002031 4,400,000 $110,000 4,510,000Total $415,720,000 $159,927,139 575,647,139
Table XXIII
CITY OF ALEXANDRIA, VIRGINIA
Summary of Total General Obligation Bonds
Debt Service As of June 30, 2011

146
147
SINGLE
AUDIT

KPMG LLP 2001 M Street, NW Washington, DC 20036-3389
KPMG LLP is a Delaware limited liability partnership, the U.S. member firm of KPMG International Cooperative (“KPMG International”), a Swiss entity.
Independent Auditors’ Report on Internal Control Over Financial Reporting and on Compliance and Other Matters Based on an Audit of Financial
Statements Performed in Accordance With Government Auditing Standards
The Honorable Mayor and Members of the City Council City of Alexandria, Virginia: We have audited the accompanying financial statements of the governmental activities, discretely presented component units, each major fund, and the aggregate remaining fund information of the City of Alexandria, Virginia (the City) as of and for the year ended June 30, 2011, which collectively comprise the City’s basic financial statements and have issued our report thereon dated November 23, 2011. Our report referred to the adoption of GASB Statement No. 54, Fund Balance Reporting and Governmental Fund Type Definitions, effective July 1, 2010. We conducted our audit in accordance with auditing standards generally accepted in the United States of America and the standards applicable to financial audits contained in Government Auditing Standards, issued by the Comptroller General of the United States and the Specifications for Audits of Counties, Cities, and Towns (the Specifications), issued by the Auditor of Public Accounts for the Commonwealth of Virginia.
Internal Control over Financial Reporting
Management of the City is responsible for establishing and maintaining effective internal control over financial reporting. In planning and performing our audit, we considered the City’s internal control over financial reporting as a basis for designing our auditing procedures for the purpose of expressing our opinion on the financial statements, but not for the purpose of expressing an opinion on the effectiveness of the City’s internal control over financial reporting. Accordingly, we do not express an opinion on the effectiveness of the City’s internal control over financial reporting.
A deficiency in internal control over financial reporting exists when the design or operation of a control does not allow management or employees, in the normal course of performing their assigned functions, to prevent, or detect and correct misstatements on a timely basis. A material weakness is a deficiency, or combination of deficiencies, in internal control over financial reporting, such that there is a reasonable possibility that a material misstatement of the entity’s financial statements will not be prevented, or detected and corrected on a timely basis.
Our consideration of internal control over financial reporting was for the limited purpose described in the first paragraph of this section and was not designed to identify all deficiencies in internal control over financial reporting that might be deficiencies, significant deficiencies, or material weaknesses. We did not identify any deficiencies in internal control over financial reporting that we consider to be material weaknesses, as defined above.
Compliance and Other Matters
As part of obtaining reasonable assurance about whether the City’s financial statements are free of material misstatement, we performed tests of its compliance with certain provisions of laws, regulations, contracts, and grant agreements, noncompliance with which could have a direct and material effect on the determination of financial statement amounts. Also, the Auditor of Public Accounts of the Commonwealth of Virginia requires us to test the City’s compliance with certain matters specified in the Code of Virginia, including budget and appropriation laws; cash and investments; conflict of interest; debt provisions, procurement; local retirement system; unclaimed property; the Personal Property Tax Relief Act, intergovernmental revenue and agreements; state agency requirements of education; Comprehensive Services Act funds; and social services. However, providing an opinion on compliance with those provisions was not an objective of our audit, and accordingly, we do not express such an opinion. The results of our tests disclosed no instances of noncompliance or other matters that are required to be reported under Government Auditing Standards.
We noted certain matters that we reported to management of the City in a separate letter dated November 23, 2011.
This report is intended solely for the information and use of management, the City Council, others within the entity, federal and state regulatory entities and is not intended to be and should not be used by anyone other than these specified parties.
November 23, 2011

KPMG LLP 2001 M Street, NW Washington, DC 20036-3389
KPMG LLP is a Delaware limited liability partnership, the U.S. member firm of KPMG International Cooperative (“KPMG International”), a Swiss entity.
Independent Auditors’ Report on Compliance With Requirements Applicable to Each Major Program and on Internal Control Over
Compliance in Accordance with OMB Circular A-133
The Honorable Mayor and Members of the City Council City of Alexandria, Virginia: Compliance
We have audited the compliance of the City of Alexandria, Virginia (the City) with the types of compliance requirements described in the U.S. Office of Management and Budget (OMB) Circular A-133 Compliance Supplement (Compliance Supplement) that are applicable to each of its major federal programs for the year ended June 30, 2011. The City’s major federal programs are identified in the summary of auditor’s results section of the accompanying schedule of findings and questioned costs. Compliance with the requirements of laws, regulations, contracts, and grants applicable to each of its major federal programs is the responsibility of the City’s management. Our responsibility is to express an opinion on the City’s compliance based on our audit.
We conducted our audit of compliance in accordance with auditing standards generally accepted in the United States of America; the standards applicable to financial audits contained in Government Auditing Standards, issued by the Comptroller General of the United States; and OMB Circular A-133, Audits of States, Local Governments, and Non-Profit Organizations. Those standards and OMB Circular A-133 require that we plan and perform the audit to obtain reasonable assurance about whether noncompliance with the types of compliance requirements referred to above that could have a direct and material effect on a major federal program occurred. An audit includes examining, on a test basis, evidence about the City’s compliance with those requirements and performing such other procedures as we considered necessary in the circumstances. We believe that our audit provides a reasonable basis for our opinion. Our audit does not provide a legal determination of the City’s compliance with those requirements.
In our opinion, the City complied, in all material respects, with the requirements referred to above that are applicable to each of its major federal programs for the year ended June 30, 2011.
Internal Control Over Compliance
The management of the City is responsible for establishing and maintaining effective internal control over compliance with the requirements of laws, regulations, contracts, and grants applicable to federal programs. In planning and performing our audit, we considered the City’s internal control over compliance with the requirements that could have a direct and material effect on a major federal program in order to determine our auditing procedures for the purpose of expressing our opinion on compliance, but not for the purpose of expressing an opinion on the effectiveness of internal control over compliance. Accordingly, we do not express an opinion on the effectiveness of the City’s internal control over compliance.
A control deficiency in an entity’s internal control over compliance exists when the design or operation of a control does not allow management or employees, in the normal course of performing their assigned functions, to prevent or detect noncompliance with a type of compliance requirement of a federal program on a timely basis. A significant deficiency is a control deficiency, or combination of control deficiencies, that adversely affects the entity’s ability to administer a federal program such that there is more than a remote likelihood that noncompliance with a type of compliance requirement of a federal program that is more than inconsequential will not be prevented or detected by the entity’s internal control.
A material weakness is a significant deficiency, or combination of significant deficiencies, that results in more than a remote likelihood that material noncompliance with a type of compliance requirement of a federal program will not be prevented or detected by the entity’s internal control.
Our consideration of internal control over compliance was for the limited purpose described in the first paragraph of this section and would not necessarily identify all deficiencies in the entity’s internal control that might be significant deficiencies or material weaknesses. We did not identify any deficiencies in internal control over compliance that we consider to be material weaknesses, as defined above.
Schedule of Expenditures of Federal Awards
We have audited the financial statements of the governmental activities, the aggregate discretely presented component units, each major fund, and the aggregate remaining fund information of the City as of and for the year ended June 30, 2011, and have issued our report thereon dated November 23, 2011. Our audit was performed for the purpose of forming opinions on the financial statements that collectively comprise the City’s basic financial statements. The accompanying schedule of expenditures of federal awards is presented for purposes of additional analysis as required by OMB Circular A-133 and is not a required part of the basic financial statements. Such information has been subjected to the auditing procedures applied in the audit of the basic financial statements and, in our opinion, is fairly stated, in all material respects, in relation to the basic financial statements taken as a whole.
This report is intended solely for the information and use of City management, City Council, others within the entity, the Auditor of Public Accounts of the Commonwealth of Virginia, and federal awarding agencies and pass-through entities and is not intended to be and should not be used by anyone other than these specified parties.
November 23, 2011

152 Continued
Federal Catalog
Federal Grantor/Recipient State Agency/Program Title Number Expenditures
U.S. DEPARTMENT OF AGRICULTUREPass Through Payments:
Department of Agriculture and Consumer Services (301 535-06):National School Lunch Program 10.555 298,786 $ - Commodity Food Distribution 10.555 142,932 441,718State Administrative Matching for Supplemental Nutrition Assistance Program 10.561 1,876,474
Department of Education (197 457-07)School Breakfast Program 10.553 873,605School Lunch Program 10.555 2,895,731Child and Adult Care Food Program 10.558 124,062Summer Food Service Program for Children 10.559 112,581
TOTAL U.S. DEPARTMENT OF AGRICULTURE $ 6,324,171
U.S. DEPARTMENT OF HEALTH AND HUMAN SERVICESDirect Payments:
Administration for Children, Youth and FamiliesSpecial Programs for the Aging _Title VII, Chapter 3 93.041 $ 1,593Alzheimer's Disease Demonstration Grants to States 93.051 43,900
Total Direct Payments $ 45,493Pass Through Payments:
Department of Health:Preventive Health and Health Services Block Grant 93.991 $ 168,079Centers for Disease Control and Prevention_ Investigations and Technical Assistance 93.283 2,293Injury Prevention and Control Research and State and Community Based 93.136 303
Department of Mental Health and Mental RetardationBlock Grant for Community Mental Health Services 93.958 519,393Projects for Assistance in Transition from Homelessness 93.150 61,338Substance Abuse and Mental Health Services _Projects of Regional and National Significance 93.243 4,000Child Care and Development Block Grant 93.575 1,090,310
Block Grant for Prevention and Treatment of Substance Abuse 93.959 1,085,948Drug Free Communities Support Program Grants 93.276 122,836
Department for the Aging:Special Programs for the Aging_Title III Part B Supportive Svces and Senior Centers 93.044 142,319Special Programs for the Aging_Title III Part D_Disease Prevention and Health Promotion Services 93.043 3,020Special Programs for the Aging Title IIIC - Nutritional Services 93.045 156,192
Department of Social Services:Promoting Safe and Stable Families 93.556 59,891Temporary Assistance for Needy Families 93.558 1,120,754Head Start 2011 93.600 1,843,613Social Services Block Grant 93.667 1,759,808ARRA -Social Services Block Grant 93.667 204,433 1,964,242Child Welfare Services State Grant 93.645 6,184Refugee and Entrant Assistance _ State Administered Programs 93.566 231,932Community Services Block Grant 93.569 152,462Low Income Home Energy Assistance 93.568 58,337Child Care Mandatory and Matching Funds of the Childcare and Development Fund 93.596 1,519,268Chafee Education and Training Vouchers Program 93.599 21,603Foster Care Title IV - E 93.658 1,630,799ARRA-Foster Care Title IV - E 93.658 42,652 1,673,451Adoption Assistance 93.659 830,299ARRA-Adoption Assistance 93.659 75,087 905,386Chafee Foster Care Independence Program 93.674 39,318ARRA - Head Start 93.708 229,900ARRA Aging Home-Delivered Nutrition Services for States 93.705 3,041ARRA - Community Services Block Grant 93.710 37,707ARRA Aging Congregate Nutrition Services for States 93.707 93.707 12,523Children's Health Insurance Program 93.767 41,702Medical Assistance Program 93.778 1,127,662
Total Pass Through Payments $ 14,405,009TOTAL U.S. DEPARTMENT OF HEALTH AND HUMAN
SERVICES $ 14,450,502
CITY OF ALEXANDRIA, VIRGINIA Schedule of Expenditures of Federal Awards
Year Ended June 30, 2011

153 Continued
U.S. DEPARTMENT OF HOUSING AND URBAN DEVELOPMENTDirect Payments:
Community Development Block Grant Program, Entitlement Grants 14.218 $ 2,003,678Total Direct Payments $ 2,003,678Pass Through Payments:
Supportive Housing Program 14.235 $ 348,407 Emergency Shelter Grants Program 14.231 68,634 Home Investment Partnerships Program 14.239 345,950 ARRACommunity Development Block Grant ARRA Entitlement 14.253 2009 330,503 ARRAHomeless Prevention and Rapid Re-Housing Program Technical Assistance 14.257 2010 209,241
Total Pass Through Payments $ 1,302,735
TOTAL U.S. DEPARTMENT OF HOUSING AND URBAN DEVELOPMENT $ 3,306,413
DEPARTMENT OF HOMELAND SECURITYPass Through Payments
Non-Profit Security Program 97.008 2009 $ 24,537State Homeland Security Program 97.073 2009 95,000Emergency Management Performance Grants 97.042 2009 66,149Assistance to Firefighters Grant 97.044 2010 65,925Disaster Grants - Public Assistance (Presidentially Declared Disasters) 97.036 2009 476,764Homeland Security Grant Program 97.067 2010 1,042,667Rail and Transit Security Grant Program 97.075 2009 3,588
Total Pass Through Payments $ 1,774,630
TOTAL DEPARTMENT OF HOMELAND SECURITY $ 1,774,630
U.S. DEPARTMENT OF JUSTICEPass Through Payments:
Department of Criminal Justice Services (140-390-01)Asset Forfeiture Report 16.000 $ 106,304State Criminal Alien Assistance Program 16.606 155,604Juvenile Accountability Block Grants 16.523 21,699Youth Gang Prevention 16.544 151,794Part E - Developing, Testing and Demonstrating Promising New Programs 16.541 233,774Crime Victim Assistance 16.575 130,252Edward Byrne Memorial Formula Grant 16.579 1,727Violence Against Women Formula Grants 16.588 91,288
ARRA V Stop Recovery Act - Violence Against Women Formular Grants 16.588 21,709 112,997Public Safety Partnership and Community Policing Grants 16.710 145,754Edward Byrne Memorial JAG grant 16.738 132,630
ARRA - Edward Byrne Memorial Justice Assistance Grant (JAG) Program / Grants To Units Of Local Government 16.804 81,454Total Pass Through Payments $ 1,273,989
TOTAL U.S. DEPARTMENT OF JUSTICE $ 1,273,989
U.S. DEPARTMENT OF LABOR Pass Through Payments: j
ARRA Employee Benefits Security Administration (EBSA) 17.151 $ 6,116WIA Pilots, Demonstrations, and Research Projects 17.261 222,114WIA Adult Program 17.258 80,485ARRAWIA Adult Program 17.258 11,104 91,589WIA Youth Activities 17.259 66,255ARRAWIA Youth Activities 17.259 20,918 87,173WIA Dislocated Workers 17.260 249,131ARRAWIA Dislocated Workers 17.260 35,841 284,972
$ 691,964
TOTAL U.S. DEPARTMENT OF LABOR $ 691,964
Save America's Treasures -Gabsby's 15.929 $ 156,398
TOTAL U.S. DEPARTMENT OF THE INTERIOR NATIONAL PARK SERVICE $ 156,398
CITY OF ALEXANDRIA, VIRGINIA Schedule of Expenditures of Federal Awards
Year Ended June 30, 2011

154
U.S. ENVIRONMENTAL PROTECTION AGENCYDirect Payments:
Congressionally Mandated Projects 66.202 $ 61,773
TOTAL U.S. ENVIRONMENTAL PROTECTION AGENCY $ 61,773
U.S. DEPARTMENT OF TRANSPORTATION Pass Through Payments:
Department of Transportation Metropolitan Transportation Planning 20.505 $ 42,025Highway Planning and Construction 20.205 548,777ARRA_ Highway Planning and Construction 20.205 745,299 1,294,076Alcohol Open Container Requirements 20.607 29,750Highway Research and Development Program 20.200 66,155Total Pass through payments $ 1,432,006
TOTAL U.S. DEPARTMENT OF TRANSPORTATION $ 1,432,006
U.S. EQUAL EMPLOYMENT OPPORTUNITY COMMISSIONDirect Payments:
Employment Discrimination_State and Local Fair Employment Practices Agency Contracts 30.002 $ 49,739
TOTAL U.S EQUAL EMPLOYMENT OPPORTUNITY COMMISSION $ 49,739
U.S. DEPARTMENT OF EDUCATIONPass Through Payments:
Department of Education:Title 1 Grants to Local Educational Agencies 84.010 $ 4,225,088Title I State Agency Program for Neglected and Delinquent Children 84.013 91,344Special Education Grants to States 84.027 2,581,660Career and Technical Education-- Basic Grants to States 84.048 228,788Special Education Preschool Grants 84.173 82,910Special Education Grants for Infants and Families with Disabilities (720-445-07) 84.181 155,681Safe and Drug-Free Schools and Communities_State Grants 84.186 16,833Education Technology State Grants 84.318 37,161English Language Acquisition Grants 84.365 508,540Improving Teacher Quality State Grants 84.367 1,044,926School Improvement Grants 84.377 285,624Readiness and Emergency Mgmt 84.184E 190,800ARRA McKinney-Vento 84.387A 10,447Title I Grants to Local Educational Agencies 84.389A 1,456,718ARRA School Improvement Grant 1003g 84.388 1,518,154ARRA Education Jobs Fund 84.394A 172,422ARRA Educational Technology Grant 84.386 23,087ARRA Educational Technology Competitive Grant 84.386A 542,450ARRA SFSF-Basic Aid FY2011 84.394A 1,043,535ARRA IDEA Part B School Grant 84.391 1,068,200NCLB: Title II Part D - Competitive Grant 84.318X 215,636ARRA Special Education - Grants for Infants and Families 84.393 66,056Total Pass through payments $ 15,566,060
TOTAL U.S. DEPARTMENT OF EDUCATION $ 15,566,060
U.S. DEPARTMENT OF ENERGYPass Through Payments:
Department of Energy:ARRAEnergy Efficiency and Conservation Block Grant Program (EECBG 81.128 $ 394,970
TOTAL U.S. DEPARTMENT OF ENERGY $ 394,970
DEPARTMENT OF DEFENSECommunity Economic Adjustment Assistance for Establishment, Expansion, Realignment, or Closure of a Military Installation 12.607 $ 193,098
TOTAL DEPARTMENT OF DEFENSE $ 193,098
OTHER FEDERAL AIDHigh Intensity Drug Trafficking Area 95.001 $ 15,903.64 High Intensity Drug Trafficking Assessment/Evaluation 99.997 69,654.00 High Intensity Drug Trafficking Area 98.473 56,629.63
TOTAL OTHER FEDERAL $ 142,187
TOTAL FEDERAL ASSISTANCE $ 45,817,900
CITY OF ALEXANDRIA, VIRGINIA Schedule of Expenditures of Federal Awards
Year Ended June 30, 2011

155
CITY OF ALEXANDRIA, VIRGINIA Notes to Schedule of Expenditures of Federal Awards
June 30, 2011
SUMMARY OF SIGNIFICANT ACCOUNTING POLICIES
The accompanying Schedule of Expenditures of Federal Awards includes all federal grant activity of the City of Alexandria, Virginia and its component units during FY 2011. The City’s reporting entity is defined in Note 1 of the City’s Basic Financial Statements. Federal awards are received directly, as well as passed through other governmental agencies. This schedule has been prepared on the modified accrual basis of accounting. Expenditures are recorded when the liability is incurred.
RECONCILIATION OF NOTES TO FINANCIAL STATEMENTS TO THE SCHEDULE OF EXPENDITURES OF FEDERAL AWARDS
The City receives and expends federal revenues that are non-grant related and therefore not reportable under the Schedule of Expenditures of Federal Awards. A reconciliation of the Schedule of Expenditures of Federal Awards to Note 12 in the Notes to the Financial Statements, Intergovernmental Revenues, is provided below.
Total Federal Expenditures per Schedule $ 45,817,900 Non-Reportable Federal Revenue 9,288,787 Commodities Distribution (142,932)
Total Federal Revenue per Note 12 $ 54,963,754
FEDERAL COGNIZANT AGENCY
The Federal Cognizant Agency for the City of Alexandria, Virginia is the United States Department of Housing and Urban Development.
SUBGRANTEES The City provided the following amounts to subrecipients during FY 2011: Program Title CFDA Amount Headstart 93.600 $ 1,843,613 ARRA – Headstart 93.708 229,900 ARRA – Community Block Grant ARRA Entitlement 14.253 330,503

156
CITY OF ALEXANDRIA, VIRGINIA
Schedule of Findings and Questioned Costs For the Year Ended June 30, 2011
Summary of Auditors’ Results: Financial Statements The type of report issued on the financial statements: Unqualified Internal control over financial reporting
Material weaknesses identified: None Significant Deficiencies identified that are not considered to be material weaknesses: None reported
Noncompliance material to the financial statements noted: None Federal Awards Internal control over major programs
Material weaknesses identified: None Significant Deficiencies identified that are not considered to be material weaknesses: None reported
The type of report issued on compliance for major programs: Unqualified Any audit findings disclosed that are required to be reported in accordance with Section 510(a) of OMB Circular A-133: No Major programs: • Block Grants for Community Mental Health Services (93.958) • Child Care and Development Fund (93.575 & 93.596) • Community Services Block Grant (93.569 & 93.710) • Foster Care (Title IV-E) (93.658) • Homeless Prevention and Rapid Re-Housing Program Technical Assistance (14.262) • School Improvement Grants (84.377 & 84.388) • Social Services Block Grant (93.667) • Special Education (IDEA) (84.027, 84.173, & 84.391) • State Fiscal Stabilization Fund (SFSF) (84.394) • Supplemental Nutrition Assistance Program (SNAP) (10.561) • Title I (Part A) (84.010 & 84.389)
Dollar threshold used to distinguish between Type A and Type B programs: $1,370,418 Auditee qualified as a low-risk auditee under section 530 of OMB Circular A-133: Yes

157
CITY OF ALEXANDRIA, VIRGINIA Schedule of Findings and Questioned Costs (Continued) For the Year Ended June 30, 2011 Findings relating to the Financial Statement Reported in Accordance with Government Auditing Standards: None Findings and Questioned Costs relating to Federal Awards: None

158
CITY OF ALEXANDRIA, VIRGINIA Summary Schedule of Prior Year Findings and Questioned Costs For the Year Ended June 30, 2010
Findings and Questioned Costs Relating to Federal Awards Finding 10-1 Adoption Assistance Condition - We identified that 3 of 80 selected participants in the Adoption Assistance program were receiving unallowed benefit / maintenance subsidy payments. After further investigation, we observed the three participants had State Adoption Assistance Agreements and were not eligible to receive IV-E Adoption Assistance benefits, and should not have been paid with IV-E reimbursable funds. The 3 participants were paid benefits totaling $3,695, and our sample of 80 program participant benefits totaled $76,184. The total benefit / maintenance subsidy payments for FY 2010 were $2,025,720. Criteria - “The Adoption Assistance program provides funds to title IV-E agencies and federally recognized Indian tribes, Indian tribal organizations and tribal consortia with approved title IV-E plans for adoption assistance agreements with parents who adopt eligible children with special needs. Federal matching funds are provided to IV-E agencies that provide adoption assistance subsidy payments to parents who adopt certain children with special needs. (42 USC 679c(c)(1)(C)(ii)(II)” “An adoption assistance agreement is a written agreement between the adoptive parents, the IV-E agency, and other relevant agencies (such as a private adoption agency) specifying the nature and amount of assistance to be given on a monthly basis to parents who adopt eligible special needs children. A child with special needs is defined as a child who the IV-E agency has determined cannot or should not be returned home; has a specific factor or condition, as defined by the State or tribe, because of which it is reasonable to conclude that the child cannot be adopted without financial or medical assistance; and for whom a reasonable effort has been made to place the child without providing financial or medical assistance (42 USC 673(a)(2)).” Cause – There was an insufficient review of the recipients of monthly Adoption Assistance benefit / subsidy payments made and the IV-E eligibility of those recipients by program management prior to disbursement. Effect – There were benefits payments made to ineligible participants during FY 2010. Recommendation - We recommend that the City reemphasized its established policies and/or procedures to review appropriately the monthly benefit / maintenance subsidy payments and the eligibility case files to ensure that the participants receiving IV-E Adoption Assistance subsidy payments are eligible. Questioned Costs - $3,695 Management’s response- The Department has already clarified in the new payments system the two distinct adoption maintenance codes. Fiscal staff will make the accounting adjustment to reflect the appropriate funding source. OASIS (state case management system) data will be reconciled to the adoption categories in the payment system on a monthly basis. Alexandria’s Local Department of Social Services has requested VDSS’s (Virginia Department of Social Services) adoption specialist to assist in a review of these cases

City of Alexandria, VirginiaFinance Department
P.O. Box 178Alexandria, Virginia 22313alexandriava.gov/finance