City of Swift Current BRE Economic Systems Analysis
63
Economic Systems Analysis October 2014 Version =
-
Upload
city-of-swift-current-saskatchewan -
Category
Government & Nonprofit
-
view
115 -
download
1
Transcript of City of Swift Current BRE Economic Systems Analysis

Economic Systems Analysis
October 2014 Version
=

Economic Systems Analysis
Category: 1: Key Economic Growth Indicators
Indicator Ranking
Number of Business Establishments FairPopulation Growth GoodGDP per Capita Very GoodEmployment Growth GoodUnemployment Rate Very GoodAverage Personal Incomes GoodGrowth in Personal Incomes Fair
Swift Current Economic Systems Analysis October 2014 Page 1.1

Economic Systems Analysis
Category: 1: Key Economic Growth Indicators
Indicator: Number of Business Establishments
Ranking for Swift Current: Fair
Source: Statistics Canada Business Patterns
Updated:
Number of Business Establishments by Estimated Size
December 2008 December 2013Establish- Large Establish- Large
ments Employers Employers ments Employers EmployersRegina 13,147 6,532 399 16,250 7,654 489Yorkton 1,469 689 41 1,640 751 41Moose Jaw 2,192 1,052 40 2,569 1,186 51Swift Current 1,975 855 33 2,137 927 42Saskatoon 17,555 8,350 422 22,315 9,619 503North Battleford 1,619 799 36 1,348 701 34Prince Albert 2,287 1,225 56 2,846 1,421 66Estevan 1,195 608 36 1,672 756 43
Rural andsmaller urban 48,742 16,678 344 58,303 19,126 397
Saskatchewan 90,181 36,788 1,407 109,080 42,141 1,666
Semi-Annually
4.5%
3.2%
3.0%
2.9%
2.4%
1.7%
1.6%
‐2.6%
2.8%
2.8%
‐4% ‐3% ‐2% ‐1% 0% 1% 2% 3% 4% 5%
Estevan
Regina
Prince Albert
Saskatoon
Moose Jaw
Yorkton
Swift Current
North Battleford
Rural and smaller urban
Saskatchewan
Average Annual Increase in Number of Employers, 2008 to 2013
Swift Current Economic Systems Analysis October 2014 Page 1.2
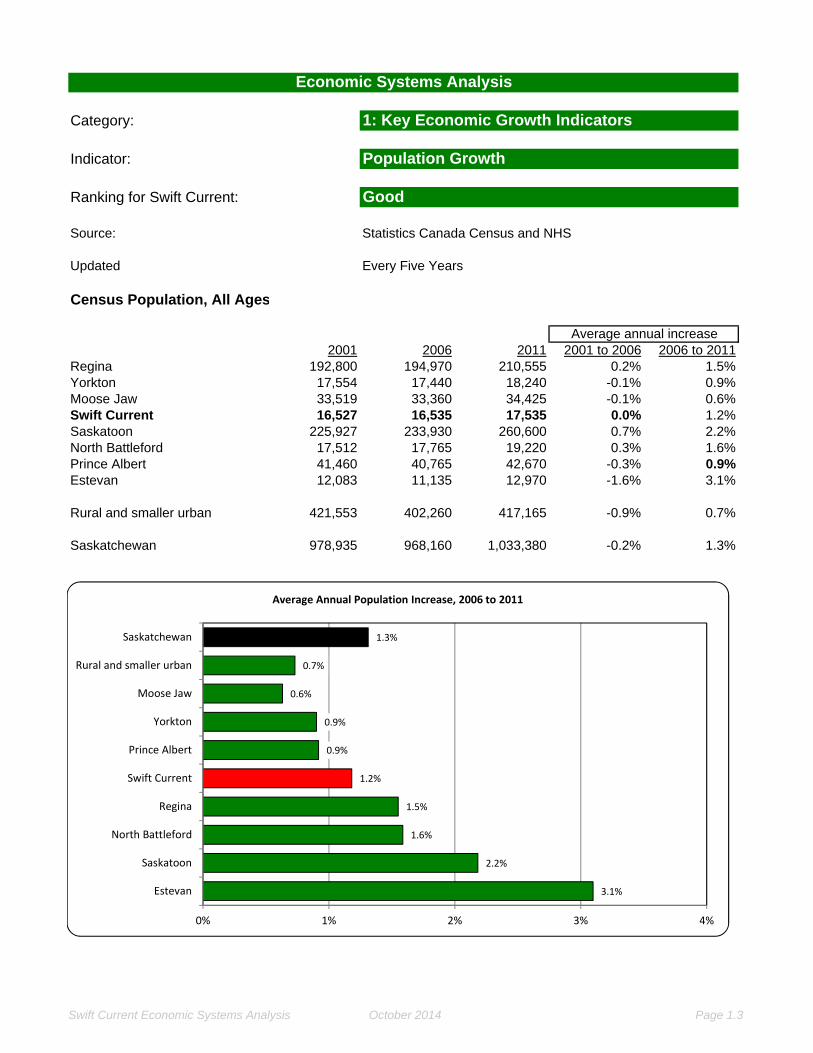
Economic Systems Analysis
Category: 1: Key Economic Growth Indicators
Indicator: Population Growth
Ranking for Swift Current: Good
Source: Statistics Canada Census and NHS
Updated
Census Population, All Ages
Average annual increase2001 2006 2011 2001 to 2006 2006 to 2011
Regina 192,800 194,970 210,555 0.2% 1.5%Yorkton 17,554 17,440 18,240 -0.1% 0.9%Moose Jaw 33,519 33,360 34,425 -0.1% 0.6%Swift Current 16,527 16,535 17,535 0.0% 1.2%Saskatoon 225,927 233,930 260,600 0.7% 2.2%North Battleford 17,512 17,765 19,220 0.3% 1.6%Prince Albert 41,460 40,765 42,670 -0.3% 0.9%Estevan 12,083 11,135 12,970 -1.6% 3.1%
Rural and smaller urban 421,553 402,260 417,165 -0.9% 0.7%
Saskatchewan 978,935 968,160 1,033,380 -0.2% 1.3%
Every Five Years
3.1%
2.2%
1.6%
1.5%
1.2%
0.9%
0.9%
0.6%
0.7%
1.3%
0% 1% 2% 3% 4%
Estevan
Saskatoon
North Battleford
Regina
Swift Current
Prince Albert
Yorkton
Moose Jaw
Rural and smaller urban
Saskatchewan
Average Annual Population Increase, 2006 to 2011
Swift Current Economic Systems Analysis October 2014 Page 1.3

Economic Systems Analysis
Category: 1: Key Economic Growth Indicators
Indicator: GDP per Capita
Ranking for Swift Current: Very Good
Source: Estimate by McNair Business Systems
Updated:
Gross Domestic Product at Market Prices, 2011
GDP ($ millions) GDP per capitaRegina $13,268 $68,711Yorkton $823 $52,524Moose Jaw $2,249 $67,590Swift Current $1,266 $81,662Saskatoon $16,841 $75,796North Battleford $659 $47,451Prince Albert $2,286 $65,074Estevan $2,054 $185,815
Rural and smaller urban $31,492 $63,804
Saskatchewan $70,938 $68,647
Annually by Request
$185,815
$81,662
$75,796
$68,711
$67,590
$65,074
$52,524
$47,451
$63,804
$68,647
$0 $25,000 $50,000 $75,000 $100,000 $125,000 $150,000 $175,000 $200,000
Estevan
Swift Current
Saskatoon
Regina
Moose Jaw
Prince Albert
Yorkton
North Battleford
Rural and smaller urban
Saskatchewan
Gross Domestic Product per Capita, 2011 Market Prices
Swift Current Economic Systems Analysis October 2014 Page 1.4

Economic Systems Analysis
Category: 1: Key Economic Growth Indicators
Indicator: Employment Growth
Ranking for Swift Current: Good
Source: Statistics Canada Census and NHS
Updated
Number of Persons Employed
Average annual increase2001 2006 2011 2001 to 2006 2006 to 2011
Regina 100,470 106,420 117,525 1.2% 2.0%Yorkton 8,155 8,630 9,205 1.1% 1.3%Moose Jaw 15,195 15,955 17,185 1.0% 1.5%Swift Current 8,490 8,860 9,585 0.9% 1.6%Saskatoon 114,615 125,530 143,315 1.8% 2.7%North Battleford 8,090 8,545 9,690 1.1% 2.5%Prince Albert 18,600 19,025 20,115 0.5% 1.1%Estevan 6,440 6,850 7,425 1.2% 1.6%
Rural and smaller urban 199,685 195,510 195,050 -0.4% 0.0%
Saskatchewan 479,740 494,900 529,095 0.6% 1.3%
Every Five Years
2.7%
2.5%
2.0%
1.6%
1.6%
1.5%
1.3%
1.1%
‐0.0%
1.3%
‐0.5% 0.0% 0.5% 1.0% 1.5% 2.0% 2.5% 3.0%
Saskatoon
North Battleford
Regina
Estevan
Swift Current
Moose Jaw
Yorkton
Prince Albert
Rural and smaller urban
Saskatchewan
Average Annual Increase in Employment, 2006 to 2011
Swift Current Economic Systems Analysis October 2014 Page 1.5

Economic Systems Analysis
Category: 1: Key Economic Growth Indicators
Indicator: Unemployment Rate
Ranking for Swift Current: Very Good
Source: Statistics Canada Census and NHS
Updated
Unemployment Rate, All Ages
Change in percentage points2001 2006 2011 2001 to 2006 2006 to 2011
Regina 6.0% 4.8% 4.8% -1.2% 0.0%Yorkton 5.2% 5.6% 5.0% 0.4% -0.6%Moose Jaw 6.7% 5.6% 5.5% -1.1% -0.1%Swift Current 4.1% 4.5% 4.1% 0.4% -0.4%Saskatoon 6.7% 5.2% 5.5% -1.5% 0.3%North Battleford 6.1% 5.6% 6.2% -0.5% 0.6%Prince Albert 8.8% 8.4% 9.7% -0.4% 1.3%Estevan 2.2% 3.0% 5.2% 0.8% 2.2%
Rural and smaller urban 6.3% 6.1% 6.6% -0.2% 0.5%
Saskatchewan 6.3% 5.6% 5.9% -0.7% 0.3%
Every Five Years
9.7%
6.2%
5.5%
5.5%
5.2%
5.0%
4.8%
4.1%
6.6%
5.9%
2% 3% 4% 5% 6% 7% 8% 9% 10% 11%
Prince Albert
North Battleford
Moose Jaw
Saskatoon
Estevan
Yorkton
Regina
Swift Current
Rural and smaller urban
Saskatchewan
Unemployment Rate, 2011
Swift Current Economic Systems Analysis October 2014 Page 1.6

Economic Systems Analysis
Category: 1: Key Economic Growth Indicators
Indicator: Average Personal Incomes
Ranking for Swift Current: Good
Source: Statistics Canada Census and NHS
Updated
Average Annual Gross Incomes (adjusted for inflation)
Individual Incomes ($2010) Household Incomes ($2010)2000 2005 2010 2000 2005 2010
Regina $35,677 $38,674 $44,665 $71,181 $75,811 $88,396Yorkton $29,210 $30,551 $35,987 $56,156 $57,288 $68,221Moose Jaw $30,874 $33,114 $36,608 $58,232 $61,648 $67,480Swift Current $32,006 $35,412 $39,274 $61,358 $65,768 $73,822Saskatoon $33,414 $37,271 $42,177 $66,674 $73,345 $84,811North Battleford $30,089 $31,258 $36,112 $57,160 $58,648 $68,219Prince Albert $31,916 $32,942 $36,293 $64,078 $65,584 $72,475Estevan $38,369 $45,672 $54,642 $75,190 $87,508 $107,169
Rural andsmaller urban $26,682 $28,278 $34,076 $54,480 $57,024 $67,983
Saskatchewan $30,749 $33,395 $38,975 $61,699 $66,013 $77,317
Every Five Years
$107,169
$88,396
$84,811
$73,822
$72,475
$68,221
$68,219
$67,480
$67,983
$77,317
$40,000 $50,000 $60,000 $70,000 $80,000 $90,000 $100,000 $110,000 $120,000
Estevan
Regina
Saskatoon
Swift Current
Prince Albert
Yorkton
North Battleford
Moose Jaw
Rural and smaller urban
Saskatchewan
Average Household Income, 2010
Swift Current Economic Systems Analysis October 2014 Page 1.7

Economic Systems Analysis
Category: 1: Key Economic Growth Indicators
Indicator: Growth in Personal Incomes
Ranking for Swift Current: Fair
Source: Statistics Canada Census and NHS
Updated
Average Annual Increase in Personal Incomes, Adjusted for Inflation
Average Annual Increase in Average Annual Increase inIndividual Incomes Household Incomes
2000 to 2005 to 2000 to 2005 to 2005 2010 2005 2010
Regina 1.6% 2.9% 1.3% 3.1%Yorkton 0.9% 3.3% 0.4% 3.6%Moose Jaw 1.4% 2.0% 1.1% 1.8%Swift Current 2.0% 2.1% 1.4% 2.3%Saskatoon 2.2% 2.5% 1.9% 2.9%North Battleford 0.8% 2.9% 0.5% 3.1%Prince Albert 0.6% 2.0% 0.5% 2.0%Estevan 3.5% 3.7% 3.1% 4.1%
Rural and smaller urban 1.2% 3.8% 0.9% 3.6%
Saskatchewan 1.7% 3.1% 1.4% 3.2%
Every Five Years
4.1%
3.6%
3.1%
3.1%
2.9%
2.3%
2.0%
1.8%
3.6%
3.2%
0.0% 0.5% 1.0% 1.5% 2.0% 2.5% 3.0% 3.5% 4.0% 4.5%
Estevan
Yorkton
Regina
North Battleford
Saskatoon
Swift Current
Prince Albert
Moose Jaw
Rural and smaller urban
Saskatchewan
average annual increase, adjusted for inflation
Average Annual Increase in Household Income, 2005 to 2010
Swift Current Economic Systems Analysis October 2014 Page 1.8
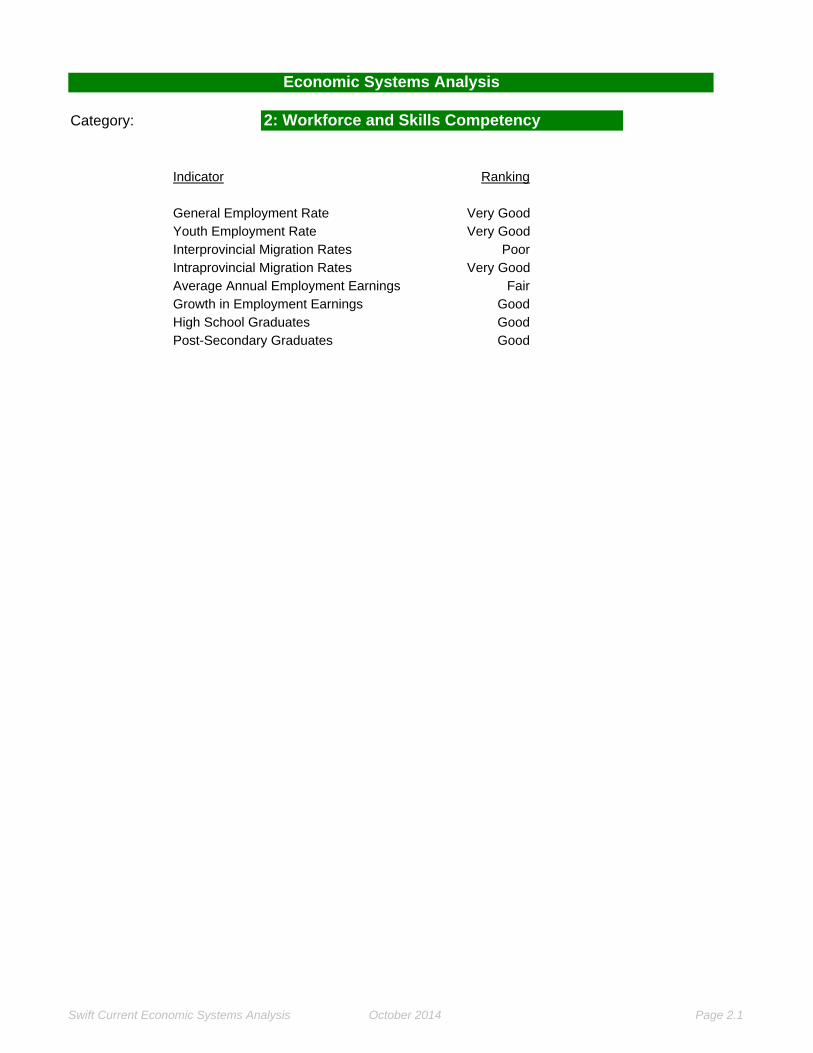
Economic Systems Analysis
Category: 2: Workforce and Skills Competency
Indicator Ranking
General Employment Rate Very GoodYouth Employment Rate Very GoodInterprovincial Migration Rates PoorIntraprovincial Migration Rates Very GoodAverage Annual Employment Earnings FairGrowth in Employment Earnings GoodHigh School Graduates GoodPost-Secondary Graduates Good
Swift Current Economic Systems Analysis October 2014 Page 2.1

Economic Systems Analysis
Category: 2: Workforce and Skills Competency
Indicator: General Employment Rate
Ranking for Swift Current: Very Good
Source: Statistics Canada Census and NHS
Updated:
Employment Rates, Population 25 to 64 Years of Age(percentage of the population who are employed)
Employment, 25 to 64 Years Employment Rates2001 2006 2011 2001 2006 2011
Regina 79,670 84,185 94,570 80.2% 81.4% 82.2%Yorkton 6,535 6,730 7,525 78.7% 79.4% 81.5%Moose Jaw 12,075 12,690 13,545 76.7% 78.5% 77.7%Swift Current 6,560 6,770 7,335 81.9% 83.3% 83.2%Saskatoon 90,185 97,625 114,225 78.8% 80.3% 81.4%North Battleford 6,330 6,700 7,615 77.5% 78.7% 79.0%Prince Albert 14,935 14,965 15,835 76.6% 75.7% 77.1%Estevan 5,070 4,870 5,900 84.9% 86.4% 86.3%
Rural andsmaller urban 153,825 151,950 154,335 78.3% 78.4% 76.5%
Saskatchewan 375,185 386,480 420,885 78.8% 79.6% 79.5%
Every five years
86.3%
83.2%
82.2%
81.5%
81.4%
79.0%
77.7%
77.1%
76.5%
79.5%
70% 72% 74% 76% 78% 80% 82% 84% 86% 88%
Estevan
Swift Current
Regina
Yorkton
Saskatoon
North Battleford
Moose Jaw
Prince Albert
Rural and smaller urban
Saskatchewan
Employment Rate, 25 to 64 Years of Age, 2011
Swift Current Economic Systems Analysis October 2014 Page 2.2

Economic Systems Analysis
Category: 2: Workforce and Skills Competency
Indicator: Youth Employment Rate
Ranking for Swift Current: Very Good
Source: Statistics Canada Census and NHS
Updated
Employment Rate for Population 15 to 24 Years of Age(percentage of the population who are employed)
Change in percentage points2001 2006 2011 2001 to 2006 2006 to 2011
Regina 62.2% 64.0% 64.1% 1.7% 0.1%Yorkton 59.2% 68.8% 60.6% 9.5% -8.2%Moose Jaw 57.8% 61.1% 64.3% 3.3% 3.1%Swift Current 67.0% 73.8% 72.1% 6.8% -1.7%Saskatoon 60.1% 62.9% 60.0% 2.9% -2.9%North Battleford 59.0% 60.3% 70.0% 1.4% 9.7%Prince Albert 53.5% 55.6% 52.9% 2.1% -2.7%Estevan 69.9% 77.5% 71.0% 7.6% -6.5%
Rural and smaller urban 52.4% 51.9% 46.3% -0.5% -5.5%
Saskatchewan 57.3% 59.0% 56.2% 1.7% -2.8%
Every Five Years
72%
71%
70%
64%
64%
61%
60%
53%
46%
56%
20% 30% 40% 50% 60% 70% 80%
Swift Current
Estevan
North Battleford
Moose Jaw
Regina
Yorkton
Saskatoon
Prince Albert
Rural and smaller urban
Saskatchewan
Employment Rate, 15 to 24 years, 2011
Swift Current Economic Systems Analysis October 2014 Page 2.3

Economic Systems Analysis
Category: 2: Workforce and Skills Competency
Indicator: Interprovincial Migration Rates
Ranking for Swift Current: Poor
Source: Statistics Canada Census and NHS
Updated
Interprovincial Migration Flows, 2006 to 2011, 20 to 54 Years of Age in 2011
Net Interprovincial Migration2011 Pop Count Rate
Regina 106,825 1,190 1.1%Yorkton 7,965 410 5.1%Moose Jaw 15,595 455 2.9%Swift Current 7,960 -175 -2.2%Saskatoon 135,680 2,480 1.8%North Battleford 8,560 255 3.0%Prince Albert 19,830 -5 0.0%Estevan 6,710 580 8.6%
Rural and smaller urban 173,935 5,710 3.3%
Saskatchewan 483,060 10,900 2.3%
Every Five Years
‐4% ‐2% 0% 2% 4% 6% 8% 10%
Estevan
Yorkton
North Battleford
Moose Jaw
Saskatoon
Regina
Prince Albert
Swift Current
Rural and smaller urban
Saskatchewan
Net Interprovincial Migration, 2006 to 2011, Population 20 to 54 Years of Age as % of Population
Swift Current Economic Systems Analysis October 2014 Page 2.4

Economic Systems Analysis
Category: 2: Workforce and Skills Competency
Indicator: Intraprovincial Migration Rates
Ranking for Swift Current: Very Good
Source: Statistics Canada Census and NHS
Updated
Intraprovincial Migration Flows, 2006 to 2011, 20 to 54 Years of Age in 2011
Net Intraprovincial Migration2011 Pop Number Rate
Regina 106,825 1,575 1.5%Yorkton 7,965 -115 -1.4%Moose Jaw 15,595 -190 -1.2%Swift Current 7,960 120 1.5%Saskatoon 135,680 615 0.5%North Battleford 8,560 -175 -2.0%Prince Albert 19,830 -315 -1.6%Estevan 6,710 10 0.1%
Rural and smaller urban 173,935 -1,525 -0.9%
Saskatchewan 483,060 0 0.0%
Every Five Years
‐2.5% ‐2.0% ‐1.5% ‐1.0% ‐0.5% 0.0% 0.5% 1.0% 1.5% 2.0%
Swift Current
Regina
Saskatoon
Estevan
Moose Jaw
Yorkton
Prince Albert
North Battleford
Rural and smaller urban
Net Intraprovincial Migration, 2006 to 2011, Population 20 to 54 Years of Age as % of Population
Swift Current Economic Systems Analysis October 2014 Page 2.5

Economic Systems Analysis
Category: 2: Workforce and Skills Competency
Indicator: Average Annual Employment Earnings
Ranking for Swift Current: Fair
Source: Statistics Canada Census and NHS
Updated:
Gross Annual Earnings from EmploymentPersons Working Throughout the Year on a Full-Time Basis
2000 2005 2010Regina $41,097 $47,960 $61,133Yorkton $32,966 $37,402 $51,409Moose Jaw $35,722 $42,700 $51,916Swift Current $34,293 $42,690 $51,301Saskatoon $39,315 $48,871 $60,070North Battleford $34,585 $38,731 $47,690Prince Albert $37,615 $42,979 $49,905Estevan $43,583 $56,801 $75,384
Rural and smaller urban $29,102 $34,024 $47,387
Saskatchewan $35,252 $42,298 $54,828
Every Five Years
$75,384
$61,133
$60,070
$51,916
$51,409
$51,301
$49,905
$47,690
$47,387
$54,828
$20,000 $30,000 $40,000 $50,000 $60,000 $70,000 $80,000
Estevan
Regina
Saskatoon
Moose Jaw
Yorkton
Swift Current
Prince Albert
North Battleford
Rural and smaller urban
Saskatchewan
Gross Employment Earnings, Full‐Time Full‐Year Workers, 2010
Swift Current Economic Systems Analysis October 2014 Page 2.6

Economic Systems Analysis
Category: 2: Workforce and Skills Competency
Indicator: Growth in Employment Earnings
Ranking for Swift Current: Good
Source: Statistics Canada Census and NHS
Updated:
Gross Annual Earnings from EmploymentPersons Working Throughout the Year on a Full-Time Basis
Average Annual Increases2000 to 2005 2005 to 2010 2000 to 2010
Regina 3.1% 5.0% 4.1%Yorkton 2.6% 6.6% 4.5%Moose Jaw 3.6% 4.0% 3.8%Swift Current 4.5% 3.7% 4.1%Saskatoon 4.4% 4.2% 4.3%North Battleford 2.3% 4.2% 3.3%Prince Albert 2.7% 3.0% 2.9%Estevan 5.4% 5.8% 5.6%
Rural and smaller urban 3.2% 6.9% 5.0%
Saskatchewan 3.7% 5.3% 4.5%
Every Five Years
5.6%
4.5%
4.3%
4.1%
4.1%
3.8%
3.3%
2.9%
5.0%
4.5%
0% 1% 2% 3% 4% 5% 6%
Estevan
Yorkton
Saskatoon
Swift Current
Regina
Moose Jaw
North Battleford
Prince Albert
Rural and smaller urban
Saskatchewan
Growth in Annual Gross Employment Earnings, Full‐Time Full‐Year Workers, 2000 to 2010
Swift Current Economic Systems Analysis October 2014 Page 2.7
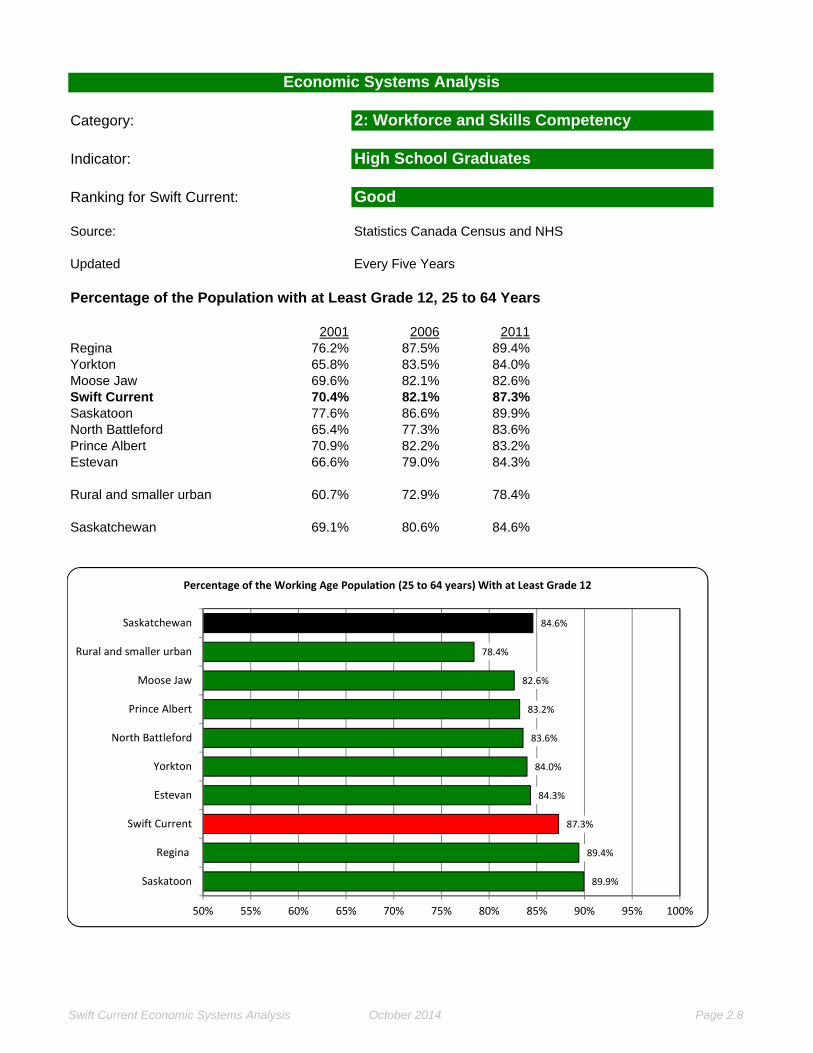
Economic Systems Analysis
Category: 2: Workforce and Skills Competency
Indicator: High School Graduates
Ranking for Swift Current: Good
Source: Statistics Canada Census and NHS
Updated
Percentage of the Population with at Least Grade 12, 25 to 64 Years
2001 2006 2011Regina 76.2% 87.5% 89.4%Yorkton 65.8% 83.5% 84.0%Moose Jaw 69.6% 82.1% 82.6%Swift Current 70.4% 82.1% 87.3%Saskatoon 77.6% 86.6% 89.9%North Battleford 65.4% 77.3% 83.6%Prince Albert 70.9% 82.2% 83.2%Estevan 66.6% 79.0% 84.3%
Rural and smaller urban 60.7% 72.9% 78.4%
Saskatchewan 69.1% 80.6% 84.6%
Every Five Years
89.9%
89.4%
87.3%
84.3%
84.0%
83.6%
83.2%
82.6%
78.4%
84.6%
50% 55% 60% 65% 70% 75% 80% 85% 90% 95% 100%
Saskatoon
Regina
Swift Current
Estevan
Yorkton
North Battleford
Prince Albert
Moose Jaw
Rural and smaller urban
Saskatchewan
Percentage of the Working Age Population (25 to 64 years) With at Least Grade 12
Swift Current Economic Systems Analysis October 2014 Page 2.8
Economic Systems Analysis
Category: 2: Workforce and Skills Competency
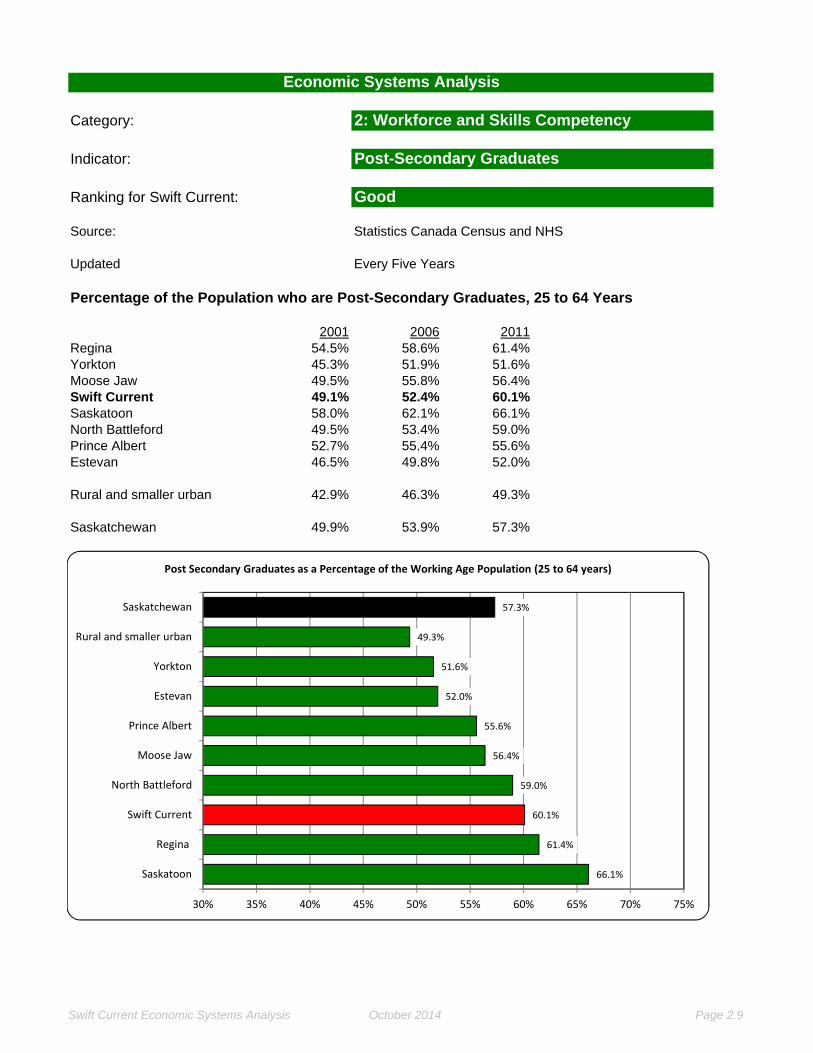
Indicator: Post-Secondary Graduates
Ranking for Swift Current: Good
Source: Statistics Canada Census and NHS
Updated
Percentage of the Population who are Post-Secondary Graduates, 25 to 64 Years
2001 2006 2011Regina 54.5% 58.6% 61.4%Yorkton 45.3% 51.9% 51.6%Moose Jaw 49.5% 55.8% 56.4%Swift Current 49.1% 52.4% 60.1%Saskatoon 58.0% 62.1% 66.1%North Battleford 49.5% 53.4% 59.0%Prince Albert 52.7% 55.4% 55.6%Estevan 46.5% 49.8% 52.0%
Rural and smaller urban 42.9% 46.3% 49.3%
Saskatchewan 49.9% 53.9% 57.3%
Every Five Years
66.1%
61.4%
60.1%
59.0%
56.4%
55.6%
52.0%
51.6%
49.3%
57.3%
30% 35% 40% 45% 50% 55% 60% 65% 70% 75%
Saskatoon
Regina
Swift Current
North Battleford
Moose Jaw
Prince Albert
Estevan
Yorkton
Rural and smaller urban
Saskatchewan
Post Secondary Graduates as a Percentage of the Working Age Population (25 to 64 years)
Swift Current Economic Systems Analysis October 2014 Page 2.9

Economic Systems Analysis
Category: 3: Research and Development
Indicator Ranking
University Degrees GoodUniversity Degree in Technology Disciplines PoorEmployment in Technology Sectors Very GoodPositions Requiring a University Degree Good
Swift Current Economic Systems Analysis October 2014 Page 3.1

Economic Systems Analysis
Category: 3: Research and Development
Indicator: University Degrees
Ranking for Swift Current: Good
Source: Statistics Canada Census and NHS
Updated
University Degrees as Percentage of the Population in the Labour Force AgeGroup, 25 to 64 Years
2001 2006* 2011Regina 20.4% 23.9% 26.8%Yorkton 10.2% 12.7% 13.1%Moose Jaw 11.7% 13.2% 13.4%Swift Current 13.1% 14.5% 17.0%Saskatoon 22.6% 24.6% 28.5%North Battleford 13.1% 13.9% 19.5%Prince Albert 15.0% 16.2% 16.5%Estevan 10.3% 8.4% 10.5%
Rural and smaller urban 8.7% 9.8% 11.0%
Saskatchewan 15.0% 17.1% 19.6%
* includes those with a university certificate below the Bachelor's level
Every Five Years
28.5%
26.8%
19.5%
17.0%
16.5%
13.4%
13.1%
10.5%
11.0%
19.6%
0% 5% 10% 15% 20% 25% 30%
Saskatoon
Regina
North Battleford
Swift Current
Prince Albert
Moose Jaw
Yorkton
Estevan
Rural and smaller urban
Saskatchewan
University Degrees as a Percentage of the Population in the Labour Force Age Group, 25 to 64 Years
Swift Current Economic Systems Analysis October 2014 Page 3.2

Economic Systems Analysis
Category: 3: Research and Development
Indicator: University Degree in Technology Disciplines
Ranking for Swift Current: Poor
Source: Statistics Canada Census and NHS
Updated
Percentage of the Population with a University Degree in Mathematics, Engineering, Science,Technology, or Computer Science, 25 to 64 Years
2001 2006 2011Regina 4.7% 5.4% 5.4%Yorkton 1.0% 1.2% 1.1%Moose Jaw 1.5% 2.0% 2.1%Swift Current 1.9% 2.0% 1.1%Saskatoon 5.3% 5.6% 6.5%North Battleford 0.6% 1.0% 1.2%Prince Albert 1.5% 1.7% 0.8%Estevan 1.7% 2.0% 1.8%
Rural and smaller urban 0.7% 1.2% 0.9%
Saskatchewan 2.8% 3.3% 3.4%
Every Five Years
6.5%
5.4%
2.1%
1.8%
1.2%
1.1%
1.1%
0.8%
0.9%
3.4%
0.0% 0.5% 1.0% 1.5% 2.0% 2.5% 3.0% 3.5% 4.0% 4.5% 5.0% 5.5% 6.0% 6.5% 7.0%
Saskatoon
Regina
Moose Jaw
Estevan
North Battleford
Yorkton
Swift Current
Prince Albert
Rural and smaller urban
Saskatchewan
Percentage of the Labour Market Age Group (25 to 64) with a University Degree in Mathematics, Engineering, Science, Technology, or Computer Science
Swift Current Economic Systems Analysis October 2014 Page 3.3

Economic Systems Analysis
Category: 3: Research and Development
Indicator: Employment in Technology Sectors
Ranking for Swift Current: Very Good
Source: Statistics Canada Census and NHS
Updated
Employment in Technology Sectors as Percent of Total, 2011
Total Technology PercentRegina 117,525 14,270 12.1%Yorkton 9,205 620 6.7%Moose Jaw 17,185 1,580 9.2%Swift Current 9,585 1,240 12.9%Saskatoon 143,315 18,630 13.0%North Battleford 9,690 655 6.8%Prince Albert 20,115 1,185 5.9%Estevan 7,425 1,615 21.8%
Rural and smaller urban 195,055 18,570 9.5%
Saskatchewan 529,100 58,365 11.0%
Every Five Years
21.8%
13.0%
12.9%
12.1%
9.2%
6.8%
6.7%
5.9%
9.5%
11.0%
0% 5% 10% 15% 20% 25%
Estevan
Saskatoon
Swift Current
Regina
Moose Jaw
North Battleford
Yorkton
Prince Albert
Rural and smaller urban
Saskatchewan
Employment in Technology Sectors as Percent of Total Employment, 2011
Swift Current Economic Systems Analysis October 2014 Page 3.4

Economic Systems Analysis
Category: 3: Research and Development
Indicator: Positions Requiring a University Degree
Ranking for Swift Current: Good
Source: Statistics Canada Census and NHS
Updated
Employment in Positions Requiring a University Degree as Percent of Total Employment, 2011
Total Positions PercentRegina 112,545 21,855 19.4%Yorkton 8,940 1,105 12.4%Moose Jaw 16,790 2,085 12.4%Swift Current 9,230 1,185 12.8%Saskatoon 135,760 25,555 18.8%North Battleford 9,150 1,580 17.3%Prince Albert 19,660 2,940 15.0%Estevan 7,125 565 7.9%
Rural and smaller urban 192,110 18,705 9.7%
Saskatchewan 511,310 75,575 14.8%
Every Five Years
19.4%
18.8%
17.3%
15.0%
12.8%
12.4%
12.4%
7.9%
9.7%
14.8%
0% 5% 10% 15% 20% 25%
Regina
Saskatoon
North Battleford
Prince Albert
Swift Current
Moose Jaw
Yorkton
Estevan
Rural and smaller urban
Saskatchewan
Employment in Positions Requiring a University Degree as Percent of Total Employment, 2011
Swift Current Economic Systems Analysis October 2014 Page 3.5
Economic Systems Analysis
Category: 4: Capital Accessibility
Indicator Ranking
Gross Personal Income from Investments Very GoodHigh Income Individuals GoodRRSP Contributions GoodHome Ownership Very Good
Swift Current Economic Systems Analysis October 2014 Page 4.1
Economic Systems Analysis
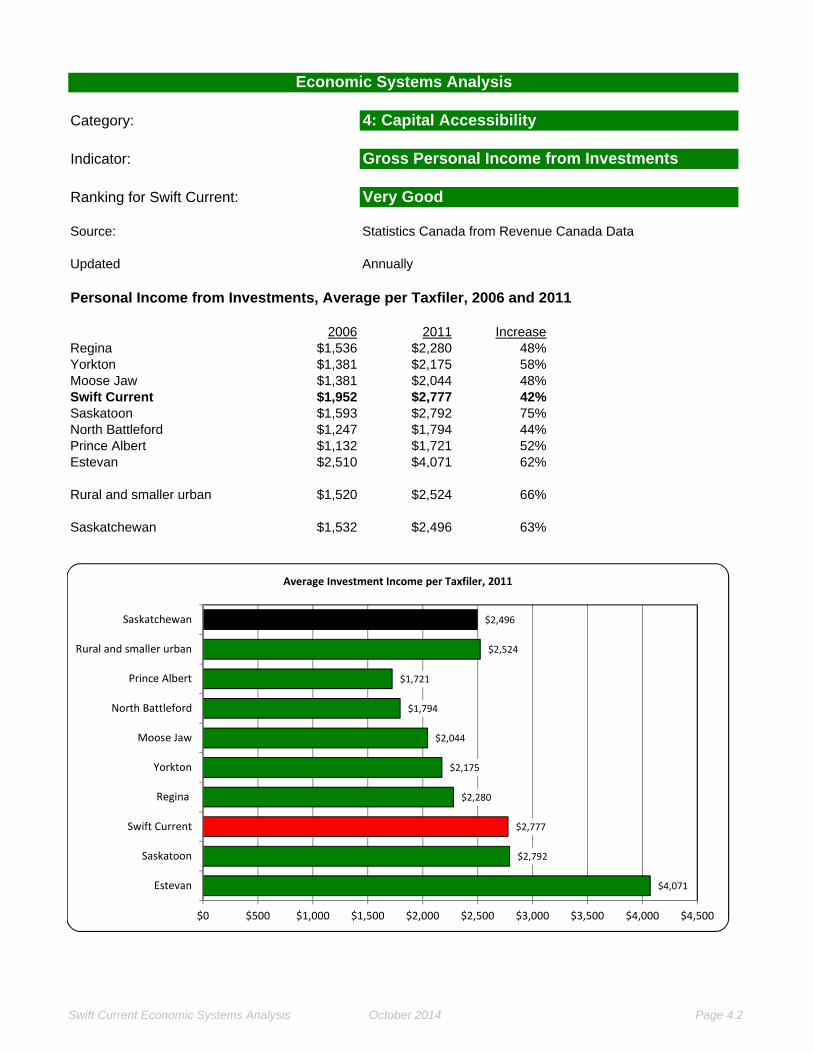
Category: 4: Capital Accessibility
Indicator: Gross Personal Income from Investments
Ranking for Swift Current: Very Good
Source: Statistics Canada from Revenue Canada Data
Updated
Personal Income from Investments, Average per Taxfiler, 2006 and 2011
2006 2011 IncreaseRegina $1,536 $2,280 48%Yorkton $1,381 $2,175 58%Moose Jaw $1,381 $2,044 48%Swift Current $1,952 $2,777 42%Saskatoon $1,593 $2,792 75%North Battleford $1,247 $1,794 44%Prince Albert $1,132 $1,721 52%Estevan $2,510 $4,071 62%
Rural and smaller urban $1,520 $2,524 66%
Saskatchewan $1,532 $2,496 63%
Annually
$4,071
$2,792
$2,777
$2,280
$2,175
$2,044
$1,794
$1,721
$2,524
$2,496
$0 $500 $1,000 $1,500 $2,000 $2,500 $3,000 $3,500 $4,000 $4,500
Estevan
Saskatoon
Swift Current
Regina
Yorkton
Moose Jaw
North Battleford
Prince Albert
Rural and smaller urban
Saskatchewan
Average Investment Income per Taxfiler, 2011
Swift Current Economic Systems Analysis October 2014 Page 4.2

Economic Systems Analysis
Category: 4: Capital Accessibility
Indicator: High Income Individuals
Ranking for Swift Current: Good
Source: Statistics Canada Census
Updated:
Proportion of Individuals with Annual Gross Personal Incomes Greater than $100,000, 2010
Total High Income PercentRegina 170,070 11,570 6.8%Yorkton 14,700 580 3.9%Moose Jaw 27,915 1,225 4.4%Swift Current 14,025 825 5.9%Saskatoon 209,700 13,505 6.4%North Battleford 14,775 630 4.3%Prince Albert 31,925 1,365 4.3%Estevan 10,135 1,325 13.1%
Rural and smaller urban 319,255 13,745 4.3%
Saskatchewan 812,500 44,770 5.5%
Every Five Years
13.1%
6.8%
6.4%
5.9%
4.4%
4.3%
4.3%
3.9%
4.3%
5.5%
0% 2% 4% 6% 8% 10% 12% 14%
Estevan
Regina
Saskatoon
Swift Current
Moose Jaw
Prince Albert
North Battleford
Yorkton
Rural and smaller urban
Saskatchewan
Proportion of Adults with Gross Personal Income Above $100,000 in 2010
Swift Current Economic Systems Analysis October 2014 Page 4.3
Economic Systems Analysis
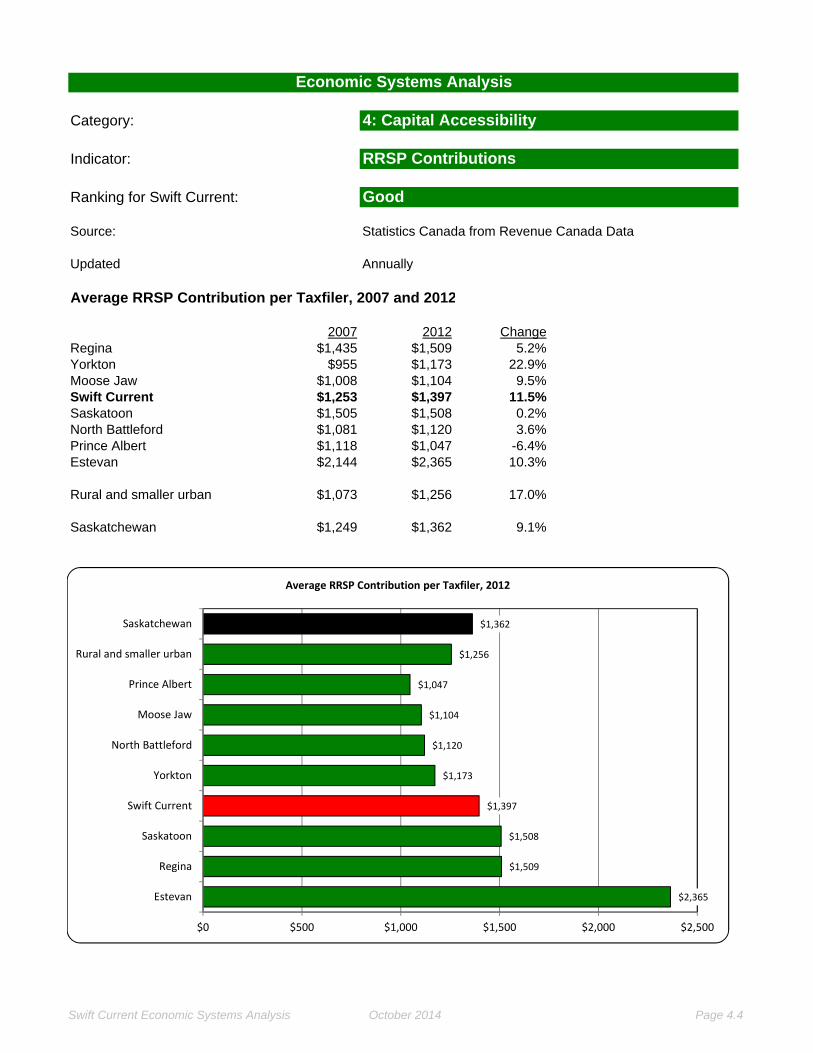
Category: 4: Capital Accessibility
Indicator: RRSP Contributions
Ranking for Swift Current: Good
Source: Statistics Canada from Revenue Canada Data
Updated
Average RRSP Contribution per Taxfiler, 2007 and 2012
2007 2012 ChangeRegina $1,435 $1,509 5.2%Yorkton $955 $1,173 22.9%Moose Jaw $1,008 $1,104 9.5%Swift Current $1,253 $1,397 11.5%Saskatoon $1,505 $1,508 0.2%North Battleford $1,081 $1,120 3.6%Prince Albert $1,118 $1,047 -6.4%Estevan $2,144 $2,365 10.3%
Rural and smaller urban $1,073 $1,256 17.0%
Saskatchewan $1,249 $1,362 9.1%
Annually
$2,365
$1,509
$1,508
$1,397
$1,173
$1,120
$1,104
$1,047
$1,256
$1,362
$0 $500 $1,000 $1,500 $2,000 $2,500
Estevan
Regina
Saskatoon
Swift Current
Yorkton
North Battleford
Moose Jaw
Prince Albert
Rural and smaller urban
Saskatchewan
Average RRSP Contribution per Taxfiler, 2012
Swift Current Economic Systems Analysis October 2014 Page 4.4

Economic Systems Analysis
Category: 4: Capital Accessibility
Indicator: Home Ownership
Ranking for Swift Current: Very Good
Source: Statistics Canada Census and NHS
Updated
Percentage of Private Dwellings that are Owned by the Occupant, 2011
PercentageTotal Owned Owned
Regina 85,935 61,155 71%Yorkton 7,755 5,545 72%Moose Jaw 15,140 10,215 67%Swift Current 7,460 5,445 73%Saskatoon 104,290 72,110 69%North Battleford 7,820 5,575 71%Prince Albert 15,990 10,610 66%Estevan 5,170 3,945 76%
Rural and smaller urban 160,015 133,820 84%
Saskatchewan 409,575 308,580 75%
Every five years
76%
73%
72%
71%
71%
69%
67%
66%
84%
75%
40% 45% 50% 55% 60% 65% 70% 75% 80% 85% 90%
Estevan
Swift Current
Yorkton
North Battleford
Regina
Saskatoon
Moose Jaw
Prince Albert
Rural and smaller urban
Saskatchewan
Percentage of Private Dwellings that are Owned, 2011
Swift Current Economic Systems Analysis October 2014 Page 4.5

Economic Systems Analysis
Category: 5: Community Services and Infrastructure
Indicator Ranking
Municipal Spending on Parks and Recreation Very GoodAccess to Health Care GoodMunicipal Spending on Transportation Fair to GoodInstitutional Building Permits Very Good
Swift Current Economic Systems Analysis October 2014 Page 5.1

Economic Systems Analysis
Category: 5: Community Services and Infrastructure
Indicator: Municipal Spending on Parks and Recreation
Ranking for Swift Current: Very Good
Source: City Annual Reports
Updated
Expenditures on Parks, Recreation, and/or Community Services ($000)Five-year avg
2008 2009 2010 2011 2012 Per capita*Regina $79,305 $94,582 $62,339 $61,593 $61,196 $341Yorkton $5,039 $5,489 $7,415 $7,371 $7,690 $362Moose Jaw $7,860 $7,641 $8,015 $9,487 $13,277 $269Swift Current $7,255 $6,983 $7,154 $7,565 $8,383 $426Saskatoon $81,196 $95,074 $86,198 $83,536 $88,452 $333Prince Albert … $9,945 $11,786 $9,879 $9,916 $540North Battleford $4,889 $4,615 $4,927 $4,956 $7,072 $124Estevan $3,689 $3,876 $4,611 $6,226 $7,574 $401
* using 2011 populations for the metropolitan areas
Annual
$540
$426
$401
$362
$341
$333
$269
$124
$0 $100 $200 $300 $400 $500 $600
Prince Albert
Swift Current
Estevan
Yorkton
Regina
Saskatoon
Moose Jaw
North Battleford
Per Capita Spending on Parks, Recreation, Community Services, Five‐Year Average
Swift Current Economic Systems Analysis October 2014 Page 5.2

Economic Systems Analysis
Category: 5: Community Services and Infrastructure
Indicator: Access to Health Care
Ranking for Swift Current: Good
Source: Statistics Canada: Canadian Community Health Survey
Updated
Population Twelve Years of Age and Older with a Regular Doctor
2007 2012Percent of Percent of
Number Population Number PopulationSun Country RHA (Estevan) 36,289 86.3% 30,076 72.6%Five Hills RHA (Moose Jaw) 40,040 88.1% 38,984 85.0%Cypress RHA (Swift Current) 29,081 84.6% 30,199 81.8%Regina Qu'Appelle RHA 170,161 85.2% 188,486 86.4%Sunrise RHA (Yorkton) 35,852 77.4% 35,919 80.5%Saskatoon RHA 207,556 85.8% 231,381 83.6%Heartland RHA (Rosetown) 31,354 87.1% 25,155 78.2%Kelsey Trail RHA (Melfort) 26,212 86.6% 28,661 82.2%Prince Albert Parkland RHA 46,684 85.3% 41,023 77.3%Prairie North RHA (North Battleford) 37,390 80.9% 38,288 75.1%Northern RHAs 6,459 59.0% 5,467 60.5%Saskatchewan 667,078 84.7% 693,638 82.2%
Annual
86.4%
85.0%
83.6%
82.2%
81.8%
80.5%
78.2%
77.3%
75.1%
72.6%
60.5%
82.2%
45% 50% 55% 60% 65% 70% 75% 80% 85% 90% 95%
Regina Qu'Appelle RHA
Five Hills RHA (Moose Jaw)
Saskatoon RHA
Kelsey Trail RHA (Melfort)
Cypress RHA (Swift Current)
Sunrise RHA (Yorkton)
Heartland RHA (Rosetown)
Prince Albert Parkland RHA
Prairie North RHA (North Battleford)
Sun Country RHA (Estevan)
Northern RHAs
Saskatchewan
Percentage of Adult Population with a Regular Doctor, 2012
Swift Current Economic Systems Analysis October 2014 Page 5.3

Economic Systems Analysis
Category: 5: Community Services and Infrastructure
Indicator: Municipal Spending on Transportation
Ranking for Swift Current: Fair to Good
Source: Annual City Reports
Updated
Municipal Government Spending on Transportation (including public transit), $0005-year average
2008 2009 2010 2011 2012 per capita*Regina $73,548 $70,214 $76,873 $82,891 $79,015 $363Yorkton $3,524 $3,597 $6,755 $6,520 $7,003 $300Moose Jaw $5,080 $5,142 $5,801 $6,109 $6,018 $164Swift Current $3,044 $3,592 $3,534 $4,637 $4,996 $226Saskatoon $85,605 $93,530 $103,449 $103,488 $126,176 $393Prince Albert … $6,933 $6,936 $6,601 $6,406 $350North Battleford $5,135 $4,172 $4,867 $4,956 $4,894 $113Estevan $3,883 $4,908 $5,012 $5,472 $5,485 $382
* using 2011 populations for the metropolitan areas
Annual
$393
$382
$363
$350
$300
$226
$164
$113
$0 $50 $100 $150 $200 $250 $300 $350 $400 $450
Saskatoon
Estevan
Regina
Prince Albert
Yorkton
Swift Current
Moose Jaw
North Battleford
Spending on Transportation and Transit, per Capita, Five‐Year Average
Swift Current Economic Systems Analysis October 2014 Page 5.4

Economic Systems Analysis
Category: 5: Community Services and Infrastructure
Indicator: Institutional Building Permits
Ranking for Swift Current: Very Good
Source: Special Requests from Cities
Updated
Value of Institutional Building Permits5-year average
2008 2009 2010 2011 2012 per capita*Regina $40,092 $46,276 $76,338 $74,133 $119,279 $338Yorkton $1,960 $2,063 $1,210 $873 $2,514 $95Moose Jaw n/a n/a n/a n/a n/aSwift Current $10,949 $1,749 $11,338 $55,335 $5,471 $968Saskatoon $188,274 $84,902 $113,815 $163,095 $132,353 $524Prince Albert n/a n/a n/a n/a n/aNorth Battleford $2,701 $10,044 $52,956 $1,860 $1,478 $324Estevan $21,712 $934 $934 $1,644 $1,254 $408
* using 2011 populations for the metropolitan areas
Annual
$968
$524
$408
$338
$324
$95
n/a
n/a
$0 $200 $400 $600 $800 $1,000 $1,200
Swift Current
Saskatoon
Estevan
Regina
North Battleford
Yorkton
Moose Jaw
Prince Albert
Value of Institutional Building Permits, Per Capita, Five‐Year Average
Swift Current Economic Systems Analysis October 2014 Page 5.5

Economic Systems Analysis
Category: 6: Quality of Life
Indicator Ranking
Crime Rates Very GoodClimate Very GoodCommuting Times Very Good
Swift Current Economic Systems Analysis October 2014 Page 6.1

Economic Systems Analysis
Category: 6: Quality of Life
Indicator: Crime Rates
Ranking for Swift Current: Very Good
Source: Canadian Centre for Justice Statistics
Updated Annual
Crime Severity Index Five-Year2008 2009 2010 2011 2012 Average
Regina 173 151 139 129 120 142Yorkton 194 178 201 192 166 186Moose Jaw 136 127 111 111 105 118Swift Current 111 134 134 127 122 125Saskatoon 155 149 143 124 117 138Prince Albert 207 218 218 217 203 212North Battleford 289 316 356 356 352 334Estevan 128 118 132 167 142 137Saskatchewan 153 150 149 145 139 147
334
212
186
142
138
137
125
118
147
0 50 100 150 200 250 300 350 400
North Battleford
Prince Albert
Yorkton
Regina
Saskatoon
Estevan
Swift Current
Moose Jaw
Saskatchewan
Crime Severity Index, Five Year Average, 2008 to 2012
Swift Current Economic Systems Analysis October 2014 Page 6.2

Economic Systems Analysis
Category: 6: Quality of Life
Indicator: Climate
Ranking for Swift Current: Very Good
Source: Environment Canada
Updated:
Weather Normals, 1981 to 2010 Average
Average Average Days with TemperatureTemperature Precip (mm) Below -20oC Above 30oC
Regina 3.1 390 43 16Yorkton 1.9 449 52 8Moose Jaw 4.2 365 37 22Swift Current 4.3 357 28 15Saskatoon 2.6 354 47 13Prince Albert 1.4 428 58 7North Battleford 2.1 374 47 9Estevan 3.7 427 40 20
Periodically
58
52
47
47
43
40
37
28
7
8
13
9
16
20
22
15
Prince Albert
Yorkton
Saskatoon
North Battleford
Regina
Estevan
Moose Jaw
Swift Current
Annual Days with Extreme Temperatures
Below ‐20C Above 30C
Swift Current Economic Systems Analysis October 2014 Page 6.3

Economic Systems Analysis
Category: 6: Quality of Life
Indicator: Commuting Times
Ranking for Swift Current: Very Good
Source: Statistics Canada Census and NHS
Updated
Average One-Way Commuting Time to Work, 2011
Percent of Commuters Average commuteDrive alone Other vehicle Walk/bicycle time (minutes)
Regina 71.9% 16.6% 5.9% 17.3Yorkton 75.8% 13.8% 7.9% 15.1Moose Jaw 74.4% 14.8% 8.8% 15.5Swift Current 80.1% 13.6% 4.6% 12.8Saskatoon 72.7% 13.8% 7.1% 19.9Prince Albert 76.1% 16.0% 5.7% 14.4North Battleford 76.9% 13.3% 5.6% 16.8Estevan 78.5% 14.1% 4.3% 14.9
Rural and smaller urban 71.5% 14.8% 10.9% 19.6
Saskatchewan 72.7% 14.9% 7.9% 18.5
Every five years
19.9
17.3
16.8
15.5
15.1
14.9
14.4
12.8
19.6
18.5
$0 $5 $10 $15 $20 $25
Saskatoon
Regina
North Battleford
Moose Jaw
Yorkton
Estevan
Prince Albert
Swift Current
Rural and smaller urban
Saskatchewan
Average One‐Way Commute Time, 2011
Swift Current Economic Systems Analysis October 2014 Page 6.4

Economic Systems Analysis
Category: 7: Government Performance
Indicator Ranking
Dependence on Property Taxes Very LowMunicipal Government Debt HighCommercial/Industrial Mill Rates MediumCommercial/Industrial Taxation Rates LowMunicipal Government Annual Surplus Very Low
Swift Current Economic Systems Analysis October 2014 Page 7.1

Economic Systems Analysis
Category: 7: Government Performance
Indicator: Dependence on Property Taxes
Ranking for Swift Current: Very Low
Source: City Annual Reports
Updated
City Gross Revenues and Property Taxes, 2012
$ thousandsGross Property Taxes as %
Revenues Taxes of RevenuesRegina $528,645 $174,843 33%Yorkton $37,668 $14,942 40%Moose Jaw $74,969 $22,610 30%Swift Current $46,657 $8,436 18%Saskatoon $759,702 $166,000 19%North Battleford $33,430 $17,290 26%Prince Albert $80,662 $37,523 47%Estevan $28,409 $12,675 45%
Annually
47%
45%
40%
33%
30%
26%
19%
18%
0% 5% 10% 15% 20% 25% 30% 35% 40% 45% 50%
Prince Albert
Estevan
Yorkton
Regina
Moose Jaw
North Battleford
Saskatoon
Swift Current
Property Taxes as a Percentage of Gross Revenues, 2013
Swift Current Economic Systems Analysis October 2014 Page 7.2

Economic Systems Analysis
Category: 7: Government Performance
Indicator: Municipal Government Debt
Ranking for Swift Current: High
Source: City Annual Reports
Updated
City Debt as of December 31, 2012
$ thousandsGross Long Debt as %
Revenues Term Debt of RevenuesRegina $528,645 $81,550 15%Yorkton $37,668 $28,506 76%Moose Jaw $74,969 $38,484 51%Swift Current $46,657 $58,080 124%Saskatoon $759,702 $197,125 26%North Battleford $33,430 $42,413 127%Prince Albert $80,662 $15,992 20%Estevan $28,409 $23,774 84%
Annually
127%
124%
84%
76%
51%
26%
20%
15%
0% 20% 40% 60% 80% 100% 120% 140%
North Battleford
Swift Current
Estevan
Yorkton
Moose Jaw
Saskatoon
Prince Albert
Regina
Long Term Debt as a Percentage of Municipal Government Revenues, 2012
Swift Current Economic Systems Analysis October 2014 Page 7.3

Economic Systems Analysis
Category: 7: Government Performance
Indicator: Commercial/Industrial Mill Rates
Ranking for Swift Current: Medium
Source: Ministry of Government Relations
Updated Annual
Factored Municipal Mill Rates, Saskatchewan Cities
2009 2012Commercial/ Commercial/
Residential Industrial Residential IndustrialRegina 12.07 16.53 13.60 18.57Yorkton 4.70 4.70 5.70 29.95Moose Jaw 11.39 16.82 13.36 19.72Swift Current 3.19 15.37 7.94 19.48North Battleford 9.55 31.05 10.49 33.97Saskatoon 9.95 12.56 11.34 14.23Prince Albert 15.93 26.20 17.35 28.94Estevan 9.71 15.46 11.47 18.01
34.0
29.9
28.9
19.7
19.5
18.6
18.0
14.2
0 5 10 15 20 25 30 35 40
North Battleford
Yorkton
Prince Albert
Moose Jaw
Swift Current
Regina
Estevan
Saskatoon
Commercial/Industrial Mill Rates, 2012
Swift Current Economic Systems Analysis October 2014 Page 7.4

Economic Systems Analysis
Category: 7: Government Performance
Indicator: Commercial/Industrial Taxation Rates
Ranking for Swift Current: Low
Source: City Reports
Updated Annual
2013 Taxation on Residential and Commercial/Industrial Property with Fair Market Value = $100,000
Commercial/Residential Industrial
Regina $926 $2,069Yorkton $1,386 $2,928Moose Jaw $987 $2,348Swift Current $1,094 $2,138North Battleford $1,372 $2,720Saskatoon $847 $1,712Prince Albert $1,300 $4,258Estevan $848 $2,252
$4,258
$2,928
$2,720
$2,348
$2,252
$2,138
$2,069
$1,712
$0 $500 $1,000 $1,500 $2,000 $2,500 $3,000 $3,500 $4,000 $4,500
Prince Albert
Yorkton
North Battleford
Moose Jaw
Estevan
Swift Current
Regina
Saskatoon
Commercial/Industrial Taxation Rates, 2012
Swift Current Economic Systems Analysis October 2014 Page 7.5

Economic Systems Analysis
Category: 7: Government Performance
Indicator: Municipal Government Annual Surplus
Ranking for Swift Current: Very Low
Source: City Annual Reports
Updated
Municipal Government Revenues Less Expenditures ($000)5-year avg
2008 2009 2010 2011 2012 Per capita*Regina -$39,504 $42,330 $101,507 $104,147 $71,931 $266Yorkton $9,257 $16,517 $8,802 $6,608 $6,721 $525Moose Jaw $8,295 $20,238 $29,999 $20,381 $13,382 $536Swift Current $1,324 $9,293 $1,852 $2,490 $982 $182Saskatoon $130,761 $145,377 $201,802 $253,066 $312,746 $801Prince Albert $3,508 $8,787 $13,591 $18,056 $10,064 $562North Battleford n/a $8,837 $18,797 $13,945 $8,601 $294Estevan $776 $5,821 $9,097 $195 $1,035 $261
Annually
$801
$562
$536
$525
$294
$266
$261
$182
0 100 200 300 400 500 600 700 800 900
Saskatoon
Prince Albert
Moose Jaw
Yorkton
North Battleford
Regina
Estevan
Swift Current
Per Capita Municipal Government Revenues less Expenditures, Five‐Year Average
Swift Current Economic Systems Analysis October 2014 Page 7.6
Economic Systems Analysis
Category: 8: Investment Attraction and Marketing
Indicator Ranking
International Immigration GoodValue of Non-Residential Building Permits FairChange in the Non-Residential Building Permits Very GoodTourism Businesses/Events Good
Swift Current Economic Systems Analysis October 2014 Page 8.1
Economic Systems Analysis
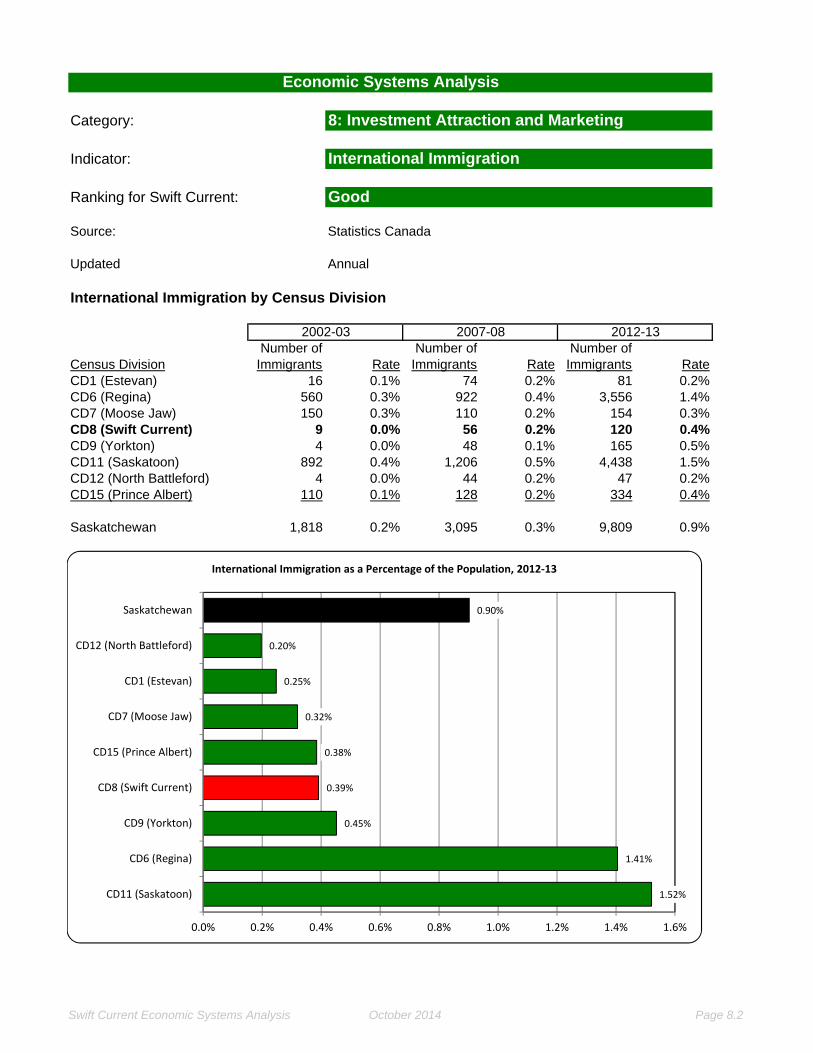
Category: 8: Investment Attraction and Marketing
Indicator: International Immigration
Ranking for Swift Current: Good
Source: Statistics Canada
Updated
International Immigration by Census Division
2002-03 2007-08 2012-13Number of Number of Number of
Census Division Immigrants Rate Immigrants Rate Immigrants RateCD1 (Estevan) 16 0.1% 74 0.2% 81 0.2%CD6 (Regina) 560 0.3% 922 0.4% 3,556 1.4%CD7 (Moose Jaw) 150 0.3% 110 0.2% 154 0.3%CD8 (Swift Current) 9 0.0% 56 0.2% 120 0.4%CD9 (Yorkton) 4 0.0% 48 0.1% 165 0.5%CD11 (Saskatoon) 892 0.4% 1,206 0.5% 4,438 1.5%CD12 (North Battleford) 4 0.0% 44 0.2% 47 0.2%CD15 (Prince Albert) 110 0.1% 128 0.2% 334 0.4%
Saskatchewan 1,818 0.2% 3,095 0.3% 9,809 0.9%
Annual
1.52%
1.41%
0.45%
0.39%
0.38%
0.32%
0.25%
0.20%
0.90%
0.0% 0.2% 0.4% 0.6% 0.8% 1.0% 1.2% 1.4% 1.6%
CD11 (Saskatoon)
CD6 (Regina)
CD9 (Yorkton)
CD8 (Swift Current)
CD15 (Prince Albert)
CD7 (Moose Jaw)
CD1 (Estevan)
CD12 (North Battleford)
Saskatchewan
International Immigration as a Percentage of the Population, 2012‐13
Swift Current Economic Systems Analysis October 2014 Page 8.2

Economic Systems Analysis
Category: 8: Investment Attraction and Marketing
Indicator: Value of Non-Residential Building Permits
Ranking for Swift Current: Fair
Source: Special Requests from Cities
Updated:
Value of Industrial, Commercial, and Institutional Building Permits ($K)5-year avg
2009 2010 2011 2012 2013 per capita**Regina $345,703 $271,382 $300,210 $382,554 $320,235 $1,539Yorkton $33,265 $9,198 $13,924 $51,627 $19,686 $1,400Moose Jaw* … $27,663 $28,673 $31,175 $72,818 $1,164Swift Current $13,929 $6,123 $28,415 $59,845 $12,768 $1,381Saskatoon $382,589 $368,375 $444,625 $461,127 $592,200 $1,726North Battleford $10,796 $26,218 $14,589 $16,527 $14,902 $864Prince Albert $36,801 $58,044 $107,056 $72,660 $41,178 $1,480Estevan $35,082 $19,567 $18,491 $7,370 $29,295 $1,693
Saskatchewan $1,086,817 $931,788 $1,182,569 $1,290,887 $1,376,939 $1,136
* 4-year average, 2009 not available** based on 2011 metropolitan area populations
Annual
$1,726
$1,693
$1,539
$1,480
$1,400
$1,381
$1,164
$864
$1,136
$0 $200 $400 $600 $800 $1,000 $1,200 $1,400 $1,600 $1,800 $2,000
Saskatoon
Estevan
Regina
Prince Albert
Yorkton
Swift Current
Moose Jaw*
North Battleford
Saskatchewan
Value of Non‐Residential Building Permits per Capita, Five‐Year Average, 2009 to 2013
Swift Current Economic Systems Analysis October 2014 Page 8.3

Economic Systems Analysis
Category: 8: Investment Attraction and Marketing
Indicator: Change in the Non-Residential Building Permits
Ranking for Swift Current: Very Good
Source: Special Requests from Cities
Updated:
Annual Increase in the Value of Non-Residenital Building Permits, Trend from 2009 to 2013
2009 to 2013Regina 1.9%Yorkton 6.0%Moose Jaw* 34.4%Swift Current 21.2%Saskatoon 11.4%North Battleford -0.9%Prince Albert 3.7%Estevan -10.8%
Saskatchewan 8.0%
* 4-year average, 2009 not available
Annual
34%
21%
11%
6%
4%
2%
‐1%
‐11%
8%
‐15% ‐10% ‐5% 0% 5% 10% 15% 20% 25% 30% 35% 40%
Moose Jaw*
Swift Current
Saskatoon
Yorkton
Prince Albert
Regina
North Battleford
Estevan
Saskatchewan
Value of Non‐Residential Building Permits per Capita, Annual Growth Rate Trend, 2009 to 2013
Swift Current Economic Systems Analysis October 2014 Page 8.4

Economic Systems Analysis
Category: 8: Investment Attraction and Marketing
Indicator: Tourism Businesses/Events
Ranking for Swift Current: Good
Source: Tourism Saskatchewan
Updated:
Number of Tourism-Related Businesses and Events, 2012
Number of: Per 10,000 population*Businesses Events Businesses Events
Regina 278 99 13.2 4.7Yorkton 86 22 47.1 12.1Moose Jaw 94 24 27.3 7.0Swift Current 73 9 41.6 5.1Saskatoon 239 103 9.2 4.0North Battleford 79 18 41.1 9.4Prince Albert 58 17 13.6 4.0Estevan 45 11 34.7 8.5
Saskatchewan 2,830 635 27.4 6.1
* based on 2011 metropolitan area population
Annual
12.1
9.4
8.5
7.0
5.1
4.7
4.0
4.0
6.1
0 2 4 6 8 10 12 14
Yorkton
North Battleford
Estevan
Moose Jaw
Swift Current
Regina
Prince Albert
Saskatoon
Saskatchewan
Number of Tourism Events per 10,000 population, 2012
Swift Current Economic Systems Analysis October 2014 Page 8.5

Economic Systems Analysis
Category: 9: Residential Property Availability
Indicator Ranking
Apartment Vacancy Rates Very GoodAverage Rent Very GoodProperty Tax Base GoodAverage Housing Prices GoodNew Housing Starts GoodHousing Affordability Very GoodHousing Condition GoodValue of Residential Building Permits Fair
Swift Current Economic Systems Analysis October 2014 Page 9.1

Economic Systems Analysis
Category: 9: Residential Property Availability
Indicator: Apartment Vacancy Rates
Ranking for Swift Current: Very Good
Source: CMHC
Updated
Vacancy Rate for Privately Initiated Apartments with at Least Six Units
2002 2007 2012Regina 1.9% 1.7% 0.9%Yorkton 5.0% 2.3% 3.0%Moose Jaw 4.0% 1.6% 2.0%Swift Current 17.9% 1.0% 6.8%Saskatoon 3.7% 0.6% 2.6%Prince Albert 7.0% 2.1% 6.1%North Battleford 4.4% 0.7% 4.2%Estevan 20.4% 0.7% 0.4%
Annual
6.8%
6.1%
4.2%
3.0%
2.6%
2.0%
0.9%
0.4%
0% 1% 2% 3% 4% 5% 6% 7% 8%
Swift Current
Prince Albert
North Battleford
Yorkton
Saskatoon
Moose Jaw
Regina
Estevan
Apartment Vacancy Rate, 2012
Swift Current Economic Systems Analysis October 2014 Page 9.2
Economic Systems Analysis
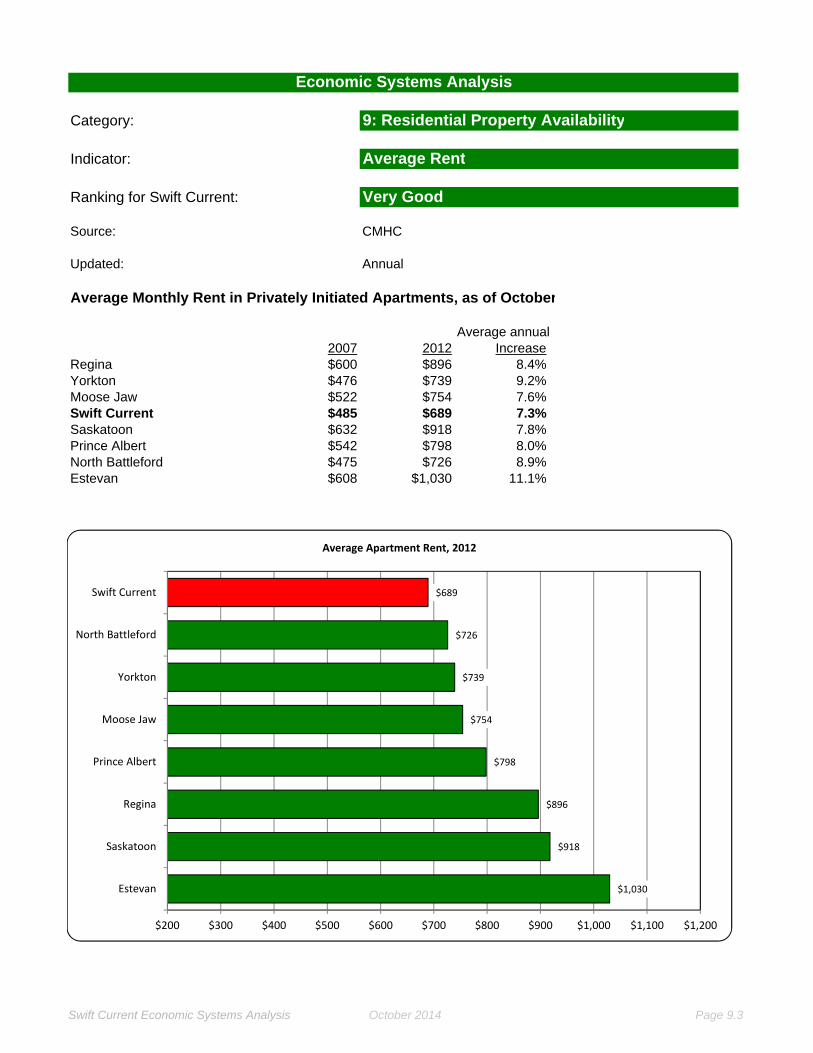
Category: 9: Residential Property Availability
Indicator: Average Rent
Ranking for Swift Current: Very Good
Source: CMHC
Updated:
Average Monthly Rent in Privately Initiated Apartments, as of October
Average annual2007 2012 Increase
Regina $600 $896 8.4%Yorkton $476 $739 9.2%Moose Jaw $522 $754 7.6%Swift Current $485 $689 7.3%Saskatoon $632 $918 7.8%Prince Albert $542 $798 8.0%North Battleford $475 $726 8.9%Estevan $608 $1,030 11.1%
Annual
$1,030
$918
$896
$798
$754
$739
$726
$689
$200 $300 $400 $500 $600 $700 $800 $900 $1,000 $1,100 $1,200
Estevan
Saskatoon
Regina
Prince Albert
Moose Jaw
Yorkton
North Battleford
Swift Current
Average Apartment Rent, 2012
Swift Current Economic Systems Analysis October 2014 Page 9.3

Economic Systems Analysis
Category: 9: Residential Property Availability
Indicator: Property Tax Base
Ranking for Swift Current: Good
Source: Sask Assessment Management Agency
Updated
Assessed Value of City Property in 2012Value
Value ($M) per Capita*Regina $12,364 $64,029Yorkton $829 $52,873Moose Jaw $1,611 $48,419Swift Current $940 $60,664Saskatoon $15,765 $70,951North Battleford $562 $40,446Prince Albert $1,659 $47,227Estevan $726 $65,680
Rural and smaller urban $37,646 $72,677
Saskatchewan $72,102 $68,162
Annually
$70,951
$65,680
$64,029
$60,664
$52,873
$48,419
$47,227
$40,446
$72,677
$68,162
$20,000 $30,000 $40,000 $50,000 $60,000 $70,000 $80,000
Saskatoon
Estevan
Regina
Swift Current
Yorkton
Moose Jaw
Prince Albert
North Battleford
Rural and smaller urban
Saskatchewan
Per Capita Value of Assessed Property, 2012
Swift Current Economic Systems Analysis October 2014 Page 9.4

Economic Systems Analysis
Category: 9: Residential Property Availability
Indicator: Average Housing Prices
Ranking for Swift Current: Good
Source: Statistics Canada Census and NHS
Updated
Estimated Market Value of Owner-Occupied, Non-Reserve, Non-Farm Dwellings, 2011
Dwellings AverageRegina 60,680 $328,100Yorkton 5,380 $230,400Moose Jaw 10,115 $227,200Swift Current 5,300 $252,800Saskatoon 71,470 $345,600North Battleford 5,385 $213,400Prince Albert 10,265 $252,900Estevan 3,870 $288,900
Rural and smaller urban 100,880 $184,700
Saskatchewan 273,345 $267,000
Every five years
$345,600
$328,100
$288,900
$252,900
$252,800
$230,400
$227,200
$213,400
$184,700
$267,000
$0 $50,000 $100,000 $150,000 $200,000 $250,000 $300,000 $350,000 $400,000
Saskatoon
Regina
Estevan
Prince Albert
Swift Current
Yorkton
Moose Jaw
North Battleford
Rural and smaller urban
Saskatchewan
Estimated Market Value of Owner Occupied Non‐Reserve, Non‐Farm Dwellings, 2011
Swift Current Economic Systems Analysis October 2014 Page 9.5
Economic Systems Analysis
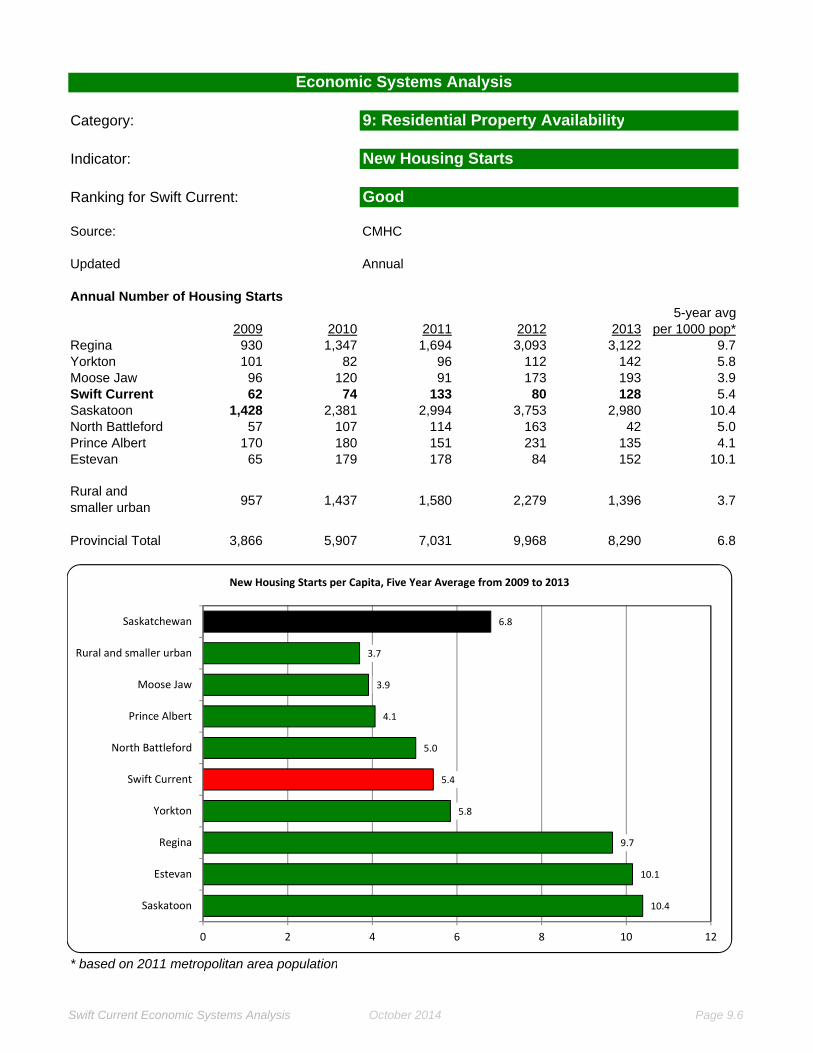
Category: 9: Residential Property Availability
Indicator: New Housing Starts
Ranking for Swift Current: Good
Source: CMHC
Updated
Annual Number of Housing Starts5-year avg
2009 2010 2011 2012 2013 per 1000 pop*Regina 930 1,347 1,694 3,093 3,122 9.7Yorkton 101 82 96 112 142 5.8Moose Jaw 96 120 91 173 193 3.9Swift Current 62 74 133 80 128 5.4Saskatoon 1,428 2,381 2,994 3,753 2,980 10.4North Battleford 57 107 114 163 42 5.0Prince Albert 170 180 151 231 135 4.1Estevan 65 179 178 84 152 10.1
Rural and smaller urban 957 1,437 1,580 2,279 1,396 3.7
Provincial Total 3,866 5,907 7,031 9,968 8,290 6.8
* based on 2011 metropolitan area population
Annual
10.4
10.1
9.7
5.8
5.4
5.0
4.1
3.9
3.7
6.8
0 2 4 6 8 10 12
Saskatoon
Estevan
Regina
Yorkton
Swift Current
North Battleford
Prince Albert
Moose Jaw
Rural and smaller urban
Saskatchewan
New Housing Starts per Capita, Five Year Average from 2009 to 2013
Swift Current Economic Systems Analysis October 2014 Page 9.6

Economic Systems Analysis
Category: 9: Residential Property Availability
Indicator: Housing Affordability
Ranking for Swift Current: Very Good
Source: Statistics Canada Census and NHS
Updated
Percentage of Dwellings Where Major Payments Exceed 30% of Gross Household Income
2006 2011Regina 20% 28%Yorkton 22% 31%Moose Jaw 21% 31%Swift Current 20% 22%Saskatoon 25% 33%Prince Albert 25% 31%North Battleford 22% 26%Estevan 18% 19%
Rural and smaller urban 16% 17%
Saskatchewan 20% 26%
Every Five Years
33%
31%
31%
31%
28%
26%
22%
19%
17%
26%
0% 5% 10% 15% 20% 25% 30% 35%
Saskatoon
Prince Albert
Moose Jaw
Yorkton
Regina
North Battleford
Swift Current
Estevan
Rural and smaller urban
Saskatchewan
Percentage of Dwellings that are Not Affordable, 2011
Swift Current Economic Systems Analysis October 2014 Page 9.7

Economic Systems Analysis
Indicator: Housing Condition
Ranking for Swift Current: Good
Source: Statistics Canada Census and NHS
Updated
Percentage of Private Dwellings that are Classified as Needing Major Repairs, 2011
Need % NeedTotal Major Repairs Major Repairs
Regina 85,930 7,825 9.1%Yorkton 7,755 580 7.5%Moose Jaw 15,140 1,525 10.1%Swift Current 7,460 575 7.7%Saskatoon 104,285 6,370 6.1%North Battleford 7,815 680 8.7%Prince Albert 15,990 1,575 9.8%Estevan 5,165 525 10.2%
Rural and smaller urban 160,030 24,115 15.1%
Saskatchewan 409,570 43,770 10.7%
Every Five Years
10.2%
10.1%
9.8%
9.1%
8.7%
7.7%
7.5%
6.1%
15.1%
10.7%
0% 2% 4% 6% 8% 10% 12% 14% 16%
Estevan
Moose Jaw
Prince Albert
Regina
North Battleford
Swift Current
Yorkton
Saskatoon
Rural and smaller urban
Saskatchewan
Percentage of Private Dwellings That Need Major Repairs, 2011
Swift Current Economic Systems Analysis October 2014 Page 9.8

Economic Systems Analysis
Category: 9: Residential Property Availability
Indicator: Value of Residential Building Permits
Ranking for Swift Current: Fair
Source: Special Requests from Cities
Updated:
Value of Residential Building Permits ($K)5-year avg
2009 2010 2011 2012 2013 per capita**Regina $554,922 $523,722 $646,542 $917,667 $863,560 $3,331Yorkton $15,106 $17,700 $20,583 $26,192 $21,030 $1,103Moose Jaw* … $20,081 $25,383 $37,433 $22,459 $765Swift Current $26,993 $14,117 $14,303 $23,350 $25,950 $1,194Saskatoon $659,620 $859,517 $1,144,413 $1,290,934 $1,386,462 $4,099North Battleford $19,600 $29,500 $22,700 $29,100 $28,600 $1,348Prince Albert $8,526 $11,293 $10,825 $24,686 $3,665 $277Estevan $8,346 $19,398 $17,356 $18,115 $28,268 $1,411
Saskatchewan $1,890,271 $2,077,000 $2,613,908 $3,114,054 $3,173,868 $2,491
N
* 4-year average, 2009 not available** based on 2011 metropolitan area population
Annual
$4,099
$3,331
$1,411
$1,348
$1,194
$1,103
$765
$277
$2,491
$0 $500 $1,000 $1,500 $2,000 $2,500 $3,000 $3,500 $4,000 $4,500
Saskatoon
Regina
Estevan
North Battleford
Swift Current
Yorkton
Moose Jaw*
Prince Albert
Saskatchewan
Value of Residential Building Permits per Capita, Five‐Year Average, 2009 to 2013
Swift Current Economic Systems Analysis October 2014 Page 9.9

Economic Systems Analysis
Notes
1: Key Economic Growth Indicators
Number of Business Establishments* "Establishments" include all sizes of businesses; "employers" have at least one
employee; "large employers" have at least 50. Public sector establishments are includedin the table.
Population Growth* The population counts include all persons whose "usual place of residence" is in the
community at the time of the census. Specifically included are the so-called"non-permanent residents", namely those who are from another country who had anemployment authorization, a student authorization, or who are refugee claimants.
* The census measures two kinds of population - the population living in collective orinstitutional dwellings and the population living in private dwellings. Institutional dwellingsinclude, for example, jails and prisons, special care homes for seniors and the disabled,Hutterite colonies, and hotels.
* Only the population and age are collected for individuals living in collective dwellings. Allother statistics - education, employment, family structure, Aboriginal identity, etc. - applyonly to the population in private dwellings.
* Statistics Canada acknowledges that the populations from the census are too lowbecause of a phenomenon called "under coverage". Undercoverage is typically 1%-2%.
GDP per Capita* Calculating GDP in a metropolitan area involves a number of assumptions so the data
should be interpreted with caution.* The "per capita" calculation uses the 2011 census population for the metropolitan area.
Employment Growth* Employment includes persons who did any work at all for pay or profit. Employed
persons can be self-employed or the so-called “unpaid family workers”, namely thosewho work without pay in a family farm, business or professional practice.
* Those who were absent from their job or business because of a vacation, illness, labourdispute, or other reason are still considered as employed. Persons with two or moresimultaneous jobs are counted only once.
Unemployment Rate* An individual is "unemployed" if they are not working, are available for work, and actively
seeking employment. The unemployment rate is the percentage of the labour force (theemployed plus the unemployed) who are looking for work.
Swift Current Economic Systems Analysis October 2014 Page 10.1

Average Annual Gross Incomes* The "individual incomes" are averages for those 15 years of age and older. Those with no
income are included in the calculation of the average.* The "household incomes" are aggregate incomes for all members in the household.
Household income is affected by both the level of individual incomes in the householdand the number of people in the household.
* Both kinds of income are gross incomes from all sources before taxes. They areadjusted for inflation using the Consumer Price Index.
Average Annual Increase in Personal Incomes* The calculation is the average annual compound increase.
2: Workplace and Skills Competency
General Employment Rate* The employment rate is the percentage of the population (25 to 64 years of age in this
case) who are working. The employment rate tends to be high if there is a shortage ofworkers. It tends to be low if the workforce lacks necessary skills or if there are few jobopportunities.
Youth Employment Rate* This is the employment rate for those 15 to 24 years of age.
Interprovincial Migration, Population 20 to 54 Years* The is the net flow to/from other provinces with positive figures showing a net inflow to the
urban centres. The rate is the net flow as a percentage of the population at the end of theperiod.
Intraprovincial Out Migration, Population 20 to 54 Years* The is the net flow to/from parts of Saskatchewan with positive figures showing a net
inflow to the urban centres. The rate is the net flow as a percentage of the population atthe end of the period.
Average Annual Employment Earnings* These figures represent gross income from employment (both paid work and
self-employment) during the year prior to the census (e.g. 2010 for the 2011 census).Only those who worked throughout the year on a full-time basis are included.
Growth in Employment Earnings* This is the average annual increase in the gross annual earnings from employment.
High School Graduates* This is the percentage of the population in the primary labour market age group that has
completed high school. The education need not be obtained in Canada.
Swift Current Economic Systems Analysis October 2014 Page 10.2

Post-Secondary Graduates* The highest level of completed education refers to the highest grade or year of
elementary or secondary school attended, or to the highest year of university or othernon-university education completed. University education is considered to be a “higher”level of schooling than other non-university education. Also, the attainment of a degree,certificate or diploma is considered to be at a higher level than years completed orattended without an educational qualification. Apprentices who have completed their programare counted under certificate and diploma, even if they did not complete grade 12.
3: Research and Development
University Degrees* This is the population in the primary labour market age group (25 to 64 years) with a
university degree. Note that they may not be employed and, if employed, may not beworking in a position that requires this level of education.
University Degrees in Technology Disciplines* The "major field of study" is the subject in which the person obtained the most advanced
degree that he or she holds at the post-secondary level.* The "Technology Disciplines" are defined as Mathematics, Engineering, Science,
Technology, and Computer Science. Note that persons may not be employed and, ifemployed, may not be working in a position that requires this level of education.
Employment in Technology Sectors* The technology sectors were defined to be
- support activities for oil and gas - software publishers- most kinds of manufacturing - telecommunications- professional, scientific, and technical services - waste management- medical and diagnostic laboratories - repair and maintenance- data processing and hosting services
Positions Requiring a University Degree* These figures show employment in occupations that typically require a university degree
(sometimes called professions) as a percentage of total employment. Some of those inthese positions will not have a degree. Management positions are not included.
4: Capital Accessibility
Personal Income from Investment* This the income from interest and dividends that is reported on income tax forms.
High Income Individuals* This the proportion of individuals who report gross income from all sources greater than
$100,000 on their income tax forms.
RRSP Contributions* This the average RRSP contribution (net not gross) made during the year.
Swift Current Economic Systems Analysis October 2014 Page 10.3
Home Ownership* Home owners typically have more assets than those who rent so this is an indication of
personal assets. A mortgage may or may not be present in owned dwellings.* For the purposes of calculating the ratio, Band Housing on Reserve is considered as
"owned".
5: Community Services and Infrastructure
Municipal Spending on Parks and Recreation* The is the amount reported in city reports under the heading of "Parks", "Recreation",
and/or "Cultural". Note that different cities may include somewhat different items underthese headings. Capital costs may be included.
* The "per capita" calculation uses the 2011 population for the metropolitan area.
Access to Health Care* As a proxy measure, this is the proportion of the population 12 years of age or older who
have a regular doctor. The data are only available for the population living in the healthregion.
Municipal Spending on Transportation* The is the amount reported in city reports under the heading of "Transportation",
"Transit", "Roads" and/or "Traffic". Note that different cities may include somewhatdifferent items under these headings. Capital costs may be included.
* The "per capita" calculation uses the 2011 population for the metropolitan area.
Institutional Building Permits* The value of institutional building permits is a good proxy for the level of capital investment by
the public sector in a city because these projects are typically funded by governments.
6: Quality of Life
Crime Rates* The Crime Severity Index takes into account both the volume and the seriousness of
crime, using average sentences to measure severity. All Criminal Code offences,including traffic offences and other federal statute offences, are included. The index usesCanada in 2006 as reference (Canada 2006 = 100).
Climate* These data are "normals" from Environment Canada
Commuting Times* The NHS assumes that the commute to work originates from the usual place of
residence and these figures show the average one-way time to get to their usual place ofwork if they have one. Note that some persons maintain a residence close to work andcommute to their home on weekends. Home-based workers are not included.
Swift Current Economic Systems Analysis October 2014 Page 10.4

7: Government Performance
Dependence on Property Taxes* The figures show the proportion of gross government revenues (excluding capital grants)
that are represented by property taxes.* Saskatoon and Swift Current have abnormally low figures because, all else being equal,
the revenues from the electrical utility make gross revenues larger than in other cities.
Municipal Government Debt* This is the "long term debt" reported on financial statements at the end of 2012
expressed as a percentage of gross revenue for 2012.
Commercial/Industrial Mill Rates* These are the mill rates after application of the conversion factors for commercial and
industrial properties.
Commercial/Industrial Taxation Rates* These are the property taxes that would be payable on a commercial property valued at
$100,000 in 2013.
Municipal Government Annual Surplus* The is the revenues less expenditures (including capital grants) reported in city financial
statements.* The "per capita" calculation uses the 2011 population for the metropolitan area.
8: Investment Attraction and Marketing
International Immigration* The figures measure direct migration from other countries into the Census Divisions
for 2012-13 expressed as a percentage of the population.
Non-Residential Building Permits* The value of commercial, industrial, institutional, and government building permits is a good
proxy for the level of capital investment in the city. Equipment and machinery are notincluded.
Growth in Value of Non-Residenital Building Permits, 2009 to 2013* This is the average annual increase in the trend line. It is susceptible to large swings if there
are particularly large projects in a given year.
Tourism* These figures represent the number of tourism-related businesses and the number of
events reported for the calendar year 2012.
Swift Current Economic Systems Analysis October 2014 Page 10.5
9: Residential Property Availability
Apartment Vacancy Rates* The vacancy rate applies to apartment buildings that are a) privately initiated and b) have
at least six units.* The survey is conducted in October.
Average Rent* The vacancy rate applies to apartment buildings that are a) privately initiated and b) have
at least six units.* The survey is conducted in October.
Property Tax Base* The Saskatchewan Assessment Management Agency calculates the total value of all
assessed property within the city boundaries.* The "per capita" calculation uses the 2011 population for the metropolitan area.
Average Housing Prices* NHS respondents not living on farms or on Reserves who own their home are asked to
estimate the market value of the dwelling.
New Housing Starts* The number of starts includes each unit in a multiple-unit building.
Housing Affordability* NHS respondents report their monthly rent (for tenants) or the mortgage payment,
property taxes, or condominium fees for owners. Utilities are included for both tenantsand homeowners. (These questions are not asked for dwellings on Reserves or farms.)Statistics Canada classifies as dwelling as "unaffordable" if these payments exceed 30%of gross income before taxes.
Housing Condition* The condition of the dwelling is based on responses to the question: “Is this dwelling in
need of any repairs?”. Possible responses were:· No, only regular maintenance is needed (painting, furnace cleaning, etc.)· Yes, minor repairs are needed (missing or loose floor tiles, or siding, etc.)· Yes, major repairs are needed (defective plumbing or electrical wiring,
structural repairs to walls, floors or ceilings, etc.)Respondents were asked not to include desirable remodelling or additions.
Value of Residential Building Permits* The value of residential building permits (new and renovation) is a good proxy for the level of
capital investment in the city's housing stock. It is a broader measure than the numberof starts because it includes renovations and repairs.
Swift Current Economic Systems Analysis October 2014 Page 10.6


![Swift Current Minor Hockey Association Monthly …cloud.rampinteractive.com/swiftcurrentmha/files/August...[Type here] Swift Current Minor Hockey Association Monthly Meeting Minutes](https://static.fdocuments.in/doc/165x107/5f674facbb64c0164e587ad2/swift-current-minor-hockey-association-monthly-cloud-type-here-swift-current.jpg)