
Bre overview
38
Introduction Methods Results Conclusion Quantifying uncertainties in national estimates of living biomass – a comparison of methods Johannes Breidenbach J. Heikkinen, G. Ståhl, H. Petersson, A. Ringvall, R. Astrup Norwegian Forest and Landscape Institute, Climate Center and National Forest Inventory P.O. Box 115, 1431 Ås Tel: +47 6494 8981; [email protected] 1 / 18
-
Upload
melnhe -
Category
Environment
-
view
61 -
download
2
Transcript of Bre overview

Introduction Methods Results Conclusion
Quantifying uncertainties in nationalestimates of living biomass – a comparison of
methods
Johannes Breidenbach
J. Heikkinen, G. Ståhl, H. Petersson, A. Ringvall, R. Astrup
Norwegian Forest and Landscape Institute,Climate Center and National Forest Inventory
P.O. Box 115, 1431 ÅsTel: +47 6494 8981; [email protected]
1 / 18

Introduction Methods Results Conclusion
Contents
IntroductionBackgroundNFI
MethodsAnalytic approachParametric bootstrap
Results
Conclusion
2 / 18

Introduction Methods Results Conclusion
Background
• Sample surveys (NFI). Sampling error. Measurement error• Biomass not measured – dbh and ht. Model error• UNFCCC GPG require quantification of uncertainties
3 / 18

Introduction Methods Results Conclusion
Background
• Sample surveys (NFI). Sampling error. Measurement error• Biomass not measured – dbh and ht. Model error⇐• UNFCCC GPG require quantification of uncertainties
3 / 18

biometrics
Sample-Based Estimation of GreenhouseGas Emissions From Forests—A NewApproach to Account for Both Samplingand Model ErrorsGoran Stahl, Juha Heikkinen, Hans Petersson, Jaakko Repola, and Soren Holm
The Good Practice Guidance (GPG) for reporting emissions and removals of greenhouse gases from the land use, land-use change, and forestry (LULUCF) sector of theUnited Nation’s Framework Convention on Climate Change states that uncertainty estimates should always accompany the estimates of net emissions. Two basic proceduresare suggested: simple error propagation and Monte-Carlo simulation. In this article, we argue that these methods are not very well-suited for uncertainty assessmentsin connection with sample-based surveys such as national forest inventories (NFIs), which provide a majority of the data for the LULUCF sector reporting in severalcountries. We suggest that a more straightforward approach would be to use standard sampling theory for assessing the sampling errors; however, it may be importantto also include the error contribution from biomass and other models that are applied and this requires new methods for the variance estimation. In this article, a methodfor sample-based uncertainty assessment, including both model and sampling errors, is developed and applied using data from the NFIs of Finland and Sweden. Thestudy revealed that the model error contribution to the combined sampling-model mean square error of ratio estimators of mean aboveground biomass on forestlandamounted to about 10% in both countries. In estimating 5-year change of the corresponding biomass stocks, using permanent sampling units, the model error contributionwas reduced to less than 1%. The smaller impact in the case of change estimation is due to the fact that any tendency of models to either over- or underestimate dueto random parameter estimation errors will be the same both at the beginning and the end of a study period. The fairly small model error contributions in our studyare due to the large number of sample trees used in the fitting of biomass models in Finland and Sweden; with less sample trees the model error contributions couldbe expected to be substantial. The proposed framework applies not only to greenhouse gas inventories but also to traditional NFI estimates of, e.g., growing stock inwhich uncertainties due to model errors typically are neglected in applications.
Keywords: National forest inventory, model-dependent inference, uncertainty assessment, model error, UNFCCC, LULUCF sector, greenhouse gas inventory.
The Good Practice Guidance (GPG; IPCC 2003) for report-ing emissions and removals of greenhouse gases for the landuse, land-use change, and forestry (LULUCF) sector of the
United Nation’s Framework Convention on Climate Change(UNFCCC) states that uncertainty estimates must accompany theannual estimates of greenhouse gas emissions and removals. Twodifferent procedures are suggested: simple error propagation and useof Monte-Carlo simulation. The first procedure is based on standardapproximation techniques for estimating the variance of the productof two stochastic variables, i.e., when the basic estimate is of theform C � A � B, which is the standard assumption of the GPG asgreenhouse gas emissions (C) are assumed to be estimated as an“activity estimate” (A) times an “emission factor” (B; IPCC 2003).
With Monte-Carlo simulation the uncertainty estimate followsfrom detailed assumptions of probability densities linked to individ-ual random variables as well as the joint probability densities be-tween different variables to capture dependencies.
The step from simple error propagation to Monte-Carlo simula-tion is substantial in terms of required efforts to make the uncer-tainty analysis (e.g., Gertner 1987) and we argue that none of themethods suggested in the GPG are straightforward to apply in con-nection with LULUCF-sector related sample surveys, such as na-tional forest inventories (NFIs). Monte-Carlo simulation requireslarge efforts combining sampling simulation with assumptionsabout model errors that are nonstandard in sample surveys. Further,sampling and model errors do not interact as straightforwardly as
Manuscript received January 16, 2013; accepted May 3, 2013; published online August 29, 2013.
Affiliations: Goran Ståhl ([email protected]), Swedish University of Agricultural Sciences, Umeå, Sweden. Juha Heikkinen ([email protected]), FinnishForest Research Institute. Hans Petersson ([email protected]), Swedish University of Agricultural Sciences. Jaakko Repola ([email protected]), FinnishForest Research Institute. Soren Holm ([email protected]), Swedish University of Agricultural Sciences.
Acknowledgments: We thank two anonymous reviewers for their encouraging and helpful comments.
FUNDAMENTAL RESEARCH For. Sci. 60(1):3–13http://dx.doi.org/10.5849/forsci.13-005
Copyright © 2014 Society of American Foresters
Forest Science • February 2014 3
biometrics
Quantifying the Model-Related Variability ofBiomass Stock and Change Estimates in theNorwegian National Forest InventoryJohannes Breidenbach, Clara Anton-Fernandez, Hans Petersson, Ronald E. McRoberts, andRasmus Astrup
National Forest Inventories (NFIs) provide estimates of forest parameters for national and regional scales. Many key variables of interest, such as biomass and timbervolume, cannot be measured directly in the field. Instead, models are used to predict those variables from measurements of other field variables. Therefore, theuncertainty or variability of NFI estimates results not only from selecting a sample of the population but also from uncertainties in the models used to predict the variablesof interest. The aim of this study was to quantify the model-related variability of Norway spruce (Picea abies [L.] Karst) biomass stock and change estimates for theNorwegian NFI. The model-related variability of the estimates stems from uncertainty in parameter estimates of biomass models as well as residual variability and wasquantified using a Monte Carlo simulation technique. Uncertainties in model parameter estimates, which are often not available for published biomass models, hadconsiderable influence on the model-related variability of biomass stock and change estimates. The assumption that the residual variability is larger than documentedfor the models and the correlation of within-plot model residuals influenced the model-related variability of biomass stock change estimates much more than estimatesof the biomass stock. The larger influence on the stock change resulted from the large influence of harvests on the stock change, although harvests were observedrarely on the NFI sample plots in the 5-year period that was considered. In addition, the temporal correlation between model residuals due to changes in the allometryhad considerable influence on the model-related variability of the biomass stock change estimate. The allometry may, however, be assumed to be rather stable overa 5-year period. Because the effects of model-related variability of the biomass stock and change estimates were much smaller than those of the sampling-relatedvariability, efforts to increase the precision of estimates should focus on reducing the sampling variability. If the model-related variability is to be decreased, the focusshould be on the tree fractions of living branches as well as stump and roots.
Keywords: uncertainty, variance, mean squared error, biomass stock, biomass change, Monte Carlo simulation, parametric bootstrap
National forest inventories (NFIs) provide estimates of forestparameters for national and regional scales. Because of thevast geographical extent of forests, a full census is impossi-
ble. Therefore, NFI results are estimates based on measurements ofa sample of the population. The sample usually consists of sampleplots distributed over the country. Because only a sample is taken,uncertainty in the form of sampling-related variability is introducedinto the estimates. Many variables of interest such as timber volume,biomass, or carbon cannot be measured directly in the field. There-fore, models are used to estimate these variables from tree-levelmeasurements of field variables such as diameter and height. Thisprocess introduces uncertainty in the form of model-related variabil-ity. Other sources of uncertainty in NFI estimates are measurement
errors during fieldwork and calculation errors during data process-ing for variables that are estimated from measured variables (e.g.,Cunia 1965, Intergovernmental Panel on Climate Change 2000).
The uncertainty associated with forest inventory estimates is ofcentral relevance in the further use of inventory results in policy-making and international reporting. For example, an inadequaterepresentation of uncertainties in estimates can result in consider-able biases for future projections (Valle 2011, Fortin and Langevin2012). The uncertainty is also a declaration of quality and reveals theweaknesses of an inventory, which form the basis for identifyingareas of further improvement.
The different sources of uncertainty in forest inventories andhow they can be considered in estimates have long been studied. For
Manuscript received November 14, 2012; accepted April 29, 2013; published online July 11, 2013.
Affiliations: Johannes Breidenbach ([email protected]), The Norwegian Forest and Landscape Institute, Climate Center and National Forest Inventory, Ås,Norway. Clara Anton-Fernandez ([email protected]), The Norwegian Forest and Landscape Institute. Hans Petersson ([email protected]), SwedishUniversity of Agricultural Sciences. Ronald E. McRoberts ([email protected]), USDA Forest Service, Northern Research Station. Rasmus Astrup([email protected]), The Norwegian Forest and Landscape Institute.
Acknowledgments: We thank the reviewers for their comments.
FUNDAMENTAL RESEARCH For. Sci. 60(1):25–33http://dx.doi.org/10.5849/forsci.12-137
Copyright © 2014 Society of American Foresters
Forest Science • February 2014 25

biometrics
Sample-Based Estimation of GreenhouseGas Emissions From Forests—A NewApproach to Account for Both Samplingand Model ErrorsGoran Stahl, Juha Heikkinen, Hans Petersson, Jaakko Repola, and Soren Holm
The Good Practice Guidance (GPG) for reporting emissions and removals of greenhouse gases from the land use, land-use change, and forestry (LULUCF) sector of theUnited Nation’s Framework Convention on Climate Change states that uncertainty estimates should always accompany the estimates of net emissions. Two basic proceduresare suggested: simple error propagation and Monte-Carlo simulation. In this article, we argue that these methods are not very well-suited for uncertainty assessmentsin connection with sample-based surveys such as national forest inventories (NFIs), which provide a majority of the data for the LULUCF sector reporting in severalcountries. We suggest that a more straightforward approach would be to use standard sampling theory for assessing the sampling errors; however, it may be importantto also include the error contribution from biomass and other models that are applied and this requires new methods for the variance estimation. In this article, a methodfor sample-based uncertainty assessment, including both model and sampling errors, is developed and applied using data from the NFIs of Finland and Sweden. Thestudy revealed that the model error contribution to the combined sampling-model mean square error of ratio estimators of mean aboveground biomass on forestlandamounted to about 10% in both countries. In estimating 5-year change of the corresponding biomass stocks, using permanent sampling units, the model error contributionwas reduced to less than 1%. The smaller impact in the case of change estimation is due to the fact that any tendency of models to either over- or underestimate dueto random parameter estimation errors will be the same both at the beginning and the end of a study period. The fairly small model error contributions in our studyare due to the large number of sample trees used in the fitting of biomass models in Finland and Sweden; with less sample trees the model error contributions couldbe expected to be substantial. The proposed framework applies not only to greenhouse gas inventories but also to traditional NFI estimates of, e.g., growing stock inwhich uncertainties due to model errors typically are neglected in applications.
Keywords: National forest inventory, model-dependent inference, uncertainty assessment, model error, UNFCCC, LULUCF sector, greenhouse gas inventory.
The Good Practice Guidance (GPG; IPCC 2003) for report-ing emissions and removals of greenhouse gases for the landuse, land-use change, and forestry (LULUCF) sector of the
United Nation’s Framework Convention on Climate Change(UNFCCC) states that uncertainty estimates must accompany theannual estimates of greenhouse gas emissions and removals. Twodifferent procedures are suggested: simple error propagation and useof Monte-Carlo simulation. The first procedure is based on standardapproximation techniques for estimating the variance of the productof two stochastic variables, i.e., when the basic estimate is of theform C � A � B, which is the standard assumption of the GPG asgreenhouse gas emissions (C) are assumed to be estimated as an“activity estimate” (A) times an “emission factor” (B; IPCC 2003).
With Monte-Carlo simulation the uncertainty estimate followsfrom detailed assumptions of probability densities linked to individ-ual random variables as well as the joint probability densities be-tween different variables to capture dependencies.
The step from simple error propagation to Monte-Carlo simula-tion is substantial in terms of required efforts to make the uncer-tainty analysis (e.g., Gertner 1987) and we argue that none of themethods suggested in the GPG are straightforward to apply in con-nection with LULUCF-sector related sample surveys, such as na-tional forest inventories (NFIs). Monte-Carlo simulation requireslarge efforts combining sampling simulation with assumptionsabout model errors that are nonstandard in sample surveys. Further,sampling and model errors do not interact as straightforwardly as
Manuscript received January 16, 2013; accepted May 3, 2013; published online August 29, 2013.
Affiliations: Goran Ståhl ([email protected]), Swedish University of Agricultural Sciences, Umeå, Sweden. Juha Heikkinen ([email protected]), FinnishForest Research Institute. Hans Petersson ([email protected]), Swedish University of Agricultural Sciences. Jaakko Repola ([email protected]), FinnishForest Research Institute. Soren Holm ([email protected]), Swedish University of Agricultural Sciences.
Acknowledgments: We thank two anonymous reviewers for their encouraging and helpful comments.
FUNDAMENTAL RESEARCH For. Sci. 60(1):3–13http://dx.doi.org/10.5849/forsci.13-005
Copyright © 2014 Society of American Foresters
Forest Science • February 2014 3
biometrics
Quantifying the Model-Related Variability ofBiomass Stock and Change Estimates in theNorwegian National Forest InventoryJohannes Breidenbach, Clara Anton-Fernandez, Hans Petersson, Ronald E. McRoberts, andRasmus Astrup
National Forest Inventories (NFIs) provide estimates of forest parameters for national and regional scales. Many key variables of interest, such as biomass and timbervolume, cannot be measured directly in the field. Instead, models are used to predict those variables from measurements of other field variables. Therefore, theuncertainty or variability of NFI estimates results not only from selecting a sample of the population but also from uncertainties in the models used to predict the variablesof interest. The aim of this study was to quantify the model-related variability of Norway spruce (Picea abies [L.] Karst) biomass stock and change estimates for theNorwegian NFI. The model-related variability of the estimates stems from uncertainty in parameter estimates of biomass models as well as residual variability and wasquantified using a Monte Carlo simulation technique. Uncertainties in model parameter estimates, which are often not available for published biomass models, hadconsiderable influence on the model-related variability of biomass stock and change estimates. The assumption that the residual variability is larger than documentedfor the models and the correlation of within-plot model residuals influenced the model-related variability of biomass stock change estimates much more than estimatesof the biomass stock. The larger influence on the stock change resulted from the large influence of harvests on the stock change, although harvests were observedrarely on the NFI sample plots in the 5-year period that was considered. In addition, the temporal correlation between model residuals due to changes in the allometryhad considerable influence on the model-related variability of the biomass stock change estimate. The allometry may, however, be assumed to be rather stable overa 5-year period. Because the effects of model-related variability of the biomass stock and change estimates were much smaller than those of the sampling-relatedvariability, efforts to increase the precision of estimates should focus on reducing the sampling variability. If the model-related variability is to be decreased, the focusshould be on the tree fractions of living branches as well as stump and roots.
Keywords: uncertainty, variance, mean squared error, biomass stock, biomass change, Monte Carlo simulation, parametric bootstrap
National forest inventories (NFIs) provide estimates of forestparameters for national and regional scales. Because of thevast geographical extent of forests, a full census is impossi-
ble. Therefore, NFI results are estimates based on measurements ofa sample of the population. The sample usually consists of sampleplots distributed over the country. Because only a sample is taken,uncertainty in the form of sampling-related variability is introducedinto the estimates. Many variables of interest such as timber volume,biomass, or carbon cannot be measured directly in the field. There-fore, models are used to estimate these variables from tree-levelmeasurements of field variables such as diameter and height. Thisprocess introduces uncertainty in the form of model-related variabil-ity. Other sources of uncertainty in NFI estimates are measurement
errors during fieldwork and calculation errors during data process-ing for variables that are estimated from measured variables (e.g.,Cunia 1965, Intergovernmental Panel on Climate Change 2000).
The uncertainty associated with forest inventory estimates is ofcentral relevance in the further use of inventory results in policy-making and international reporting. For example, an inadequaterepresentation of uncertainties in estimates can result in consider-able biases for future projections (Valle 2011, Fortin and Langevin2012). The uncertainty is also a declaration of quality and reveals theweaknesses of an inventory, which form the basis for identifyingareas of further improvement.
The different sources of uncertainty in forest inventories andhow they can be considered in estimates have long been studied. For
Manuscript received November 14, 2012; accepted April 29, 2013; published online July 11, 2013.
Affiliations: Johannes Breidenbach ([email protected]), The Norwegian Forest and Landscape Institute, Climate Center and National Forest Inventory, Ås,Norway. Clara Anton-Fernandez ([email protected]), The Norwegian Forest and Landscape Institute. Hans Petersson ([email protected]), SwedishUniversity of Agricultural Sciences. Ronald E. McRoberts ([email protected]), USDA Forest Service, Northern Research Station. Rasmus Astrup([email protected]), The Norwegian Forest and Landscape Institute.
Acknowledgments: We thank the reviewers for their comments.
FUNDAMENTAL RESEARCH For. Sci. 60(1):25–33http://dx.doi.org/10.5849/forsci.12-137
Copyright © 2014 Society of American Foresters
Forest Science • February 2014 25

Introduction Methods Results Conclusion
Aims of the study
• Comparison of methods to quantify model-related error. Analytical approach (Ståhl et al., 2014). Parametric bootstrap (Breidenbach et al., 2014)
5 / 18

Introduction Methods Results Conclusion
The Norwegian National Forest Inventory
• Interpenetrating panel design –1/5th of plots measured every year
• 22.008 sample plots for land-useclassification
• Circular sample plots, 250 m2
• Species, diameter, location, height(subsample)
• Swedish biomass functions
6 / 18

Introduction Methods Results Conclusion
The Norwegian National Forest Inventory
1980
1981
1982
1983
1984
1985
1986
1987
1988
1989
1990
1991
1992
1993
1994
1995
1996
1997
1998
1999
2000
2001
2002
2003
2004
2005
2006
2007
2008
2009
2010
2011
2012
2013
2014
2015
2016
2017
2018
2019
2020
NFI 5 NFI 6 NFI 7 NFI 8 NFI 9 NFI 10
Rotating inventory
Yearly change estimates possible
Inventory of mountain forests
Inventory of Finnmark
Last year for KP rep.
7 / 18

Introduction Methods Results Conclusion
Basic idea
• Biomass estimate based on 2 stage sample• Stage 1 (S1): NFI• Stage 2 (S2): Independent sample to estimate model
parameters
8 / 18

Introduction Methods Results Conclusion
Biomass models
Species specific, fitted on independent stage 2 (S2) sample:
AGBS2i = f (β,xi ,ei), xi = x1i , ..., xpi
• 2 sources of uncertainty. Parameter estimates β → Σ,p × p. Residual error ei → σ
9 / 18

Introduction Methods Results Conclusion
Biomass models
Species specific, fitted on independent stage 2 (S2) sample:
AGBS2i = f (β,xi ,ei), xi = x1i , ..., xpi
• 2 sources of uncertainty. Parameter estimates β → Σ,p × p. Residual error ei → σ
9 / 18

Introduction Methods Results Conclusion
Sampling errorStage 1 (S1) sample = NFI
yj =∑
i
f (xij)
y = 1/n∑
j
yj VarS(y) =1n
s2
Y = Ny VarS(Y ) = N2VarS(y)
10 / 18

Introduction Methods Results Conclusion
Sampling errorStage 1 (S1) sample = NFI
yj =∑
i
f (xij)
y = 1/n∑
j
yj VarS(y) =1n
s2
Y = Ny VarS(Y ) = N2VarS(y)
10 / 18

Introduction Methods Results Conclusion
Sampling errorStage 1 (S1) sample = NFI
yj =∑
i
f (xij)
y = 1/n∑
j
yj VarS(y) =1n
s2
Y = Ny VarS(Y ) = N2VarS(y)
10 / 18

Introduction Methods Results Conclusion
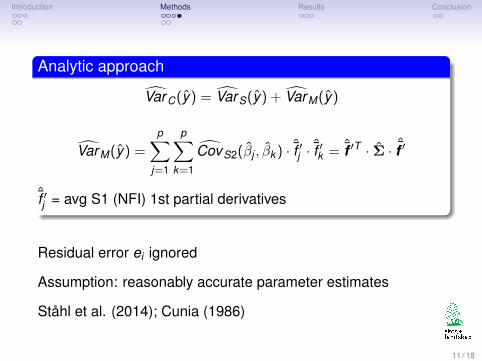
Analytic approach
VarC(y) = VarS(y) + VarM(y)
VarM(y) =
p∑j=1
p∑k=1
CovS2(βj , βk ) · ˆf ′j ·ˆf ′k = ˆf ′T · Σ · ˆf ′
ˆf ′j = avg S1 (NFI) 1st partial derivatives
Residual error ei ignored
Assumption: reasonably accurate parameter estimates
Ståhl et al. (2014); Cunia (1986)
11 / 18

Introduction Methods Results Conclusion
Analytic approach
VarC(y) = VarS(y) + VarM(y)
VarM(y) =
p∑j=1
p∑k=1
CovS2(βj , βk ) · ˆf ′j ·ˆf ′k = ˆf ′T · Σ · ˆf ′
ˆf ′j = avg S1 (NFI) 1st partial derivatives
Residual error ei ignored
Assumption: reasonably accurate parameter estimates
Ståhl et al. (2014); Cunia (1986)
11 / 18

Introduction Methods Results Conclusion
Parametric bootstrapRepeat B times:
. β∗ = N(β,Σ)
. AGB∗i = f (β∗,di ,hi)
B Estimates of y∗ or Y ∗
VarMB(y) = Var(y∗) and VarMB(Y ) = Var(Y ∗)
12 / 18

Introduction Methods Results Conclusion
Parametric bootstrapRepeat B times:
. β∗ = N(β,Σ)
. AGB∗i = f (β∗,di ,hi)
B Estimates of y∗ or Y ∗
VarMB(y) = Var(y∗) and VarMB(Y ) = Var(Y ∗)
12 / 18

Introduction Methods Results Conclusion
Parametric bootstrapRepeat B times:
. β∗ = N(β,Σ)
. AGB∗i = f (β∗,di ,hi)
B Estimates of y∗ or Y ∗
VarMB(y) = Var(y∗) and VarMB(Y ) = Var(Y ∗)
12 / 18

Introduction Methods Results Conclusion
Parametric bootstrap – residual error – meas. error
Repeat B times:
. β∗ = N(β,Σ)
. AGB∗i = f (β∗,di ,hi)
. e∗ = N(0, σ)→ same e∗i for remeasured trees
. AGB∗∗i = f (β∗,e∗i ,di ,hi)
B Estimates of y∗∗ and Y ∗∗
13 / 18

Introduction Methods Results Conclusion
Parametric bootstrap – residual error – meas. error
Repeat B times:
. β∗ = N(β,Σ)
. AGB∗i = f (β∗,di ,hi)
. e∗ = N(0, σ)→ same e∗i for remeasured trees
. AGB∗∗i = f (β∗,e∗i ,di ,hi)
B Estimates of y∗∗ and Y ∗∗
13 / 18

Introduction Methods Results Conclusion
Parametric bootstrap – residual error – meas. error
Repeat B times:
. β∗ = N(β,Σ)
. AGB∗i = f (β∗,di ,hi)
. e∗ = N(0, σ)→ same e∗i for remeasured trees
. AGB∗∗i = f (β∗,e∗i ,di ,hi)
B Estimates of y∗∗ and Y ∗∗
13 / 18

Introduction Methods Results Conclusion
Biomass stock
500000 510000 520000 530000 540000
0e+
002e
−05
4e−
056e
−05
NFI 9
AGB (kt)
Den
sity
14 / 18

Introduction Methods Results Conclusion
Biomass stock
500000 510000 520000 530000 540000
0e+
002e
−05
4e−
056e
−05
NFI 9
AGB (kt)
Den
sity
14 / 18

Introduction Methods Results Conclusion
Biomass stock
500000 510000 520000 530000 540000
0e+
002e
−05
4e−
056e
−05
NFI 9
AGB (kt)
Den
sity RMSE %:
Analytical Boot Sampling1.055 1.057 0.967
14 / 18

Introduction Methods Results Conclusion
Biomass stock change
45000 46000 47000 48000 49000 50000
0e+
001e
−04
2e−
043e
−04
4e−
045e
−04
6e−
047e
−04
Change NFI 9 − NFI 8
AGB (kt)
Den
sity
15 / 18

Introduction Methods Results Conclusion
Biomass stock change
45000 46000 47000 48000 49000 50000
0e+
001e
−04
2e−
043e
−04
4e−
045e
−04
6e−
047e
−04
Change NFI 9 − NFI 8
AGB (kt)
Den
sity
15 / 18

Introduction Methods Results Conclusion
Biomass stock change
45000 46000 47000 48000 49000 50000
0e+
001e
−04
2e−
043e
−04
4e−
045e
−04
6e−
047e
−04
Change NFI 9 − NFI 8
AGB (kt)
Den
sity RMSE %:
Analytical Boot Sampling1.185 1.187 3.540
15 / 18
Introduction Methods Results Conclusion
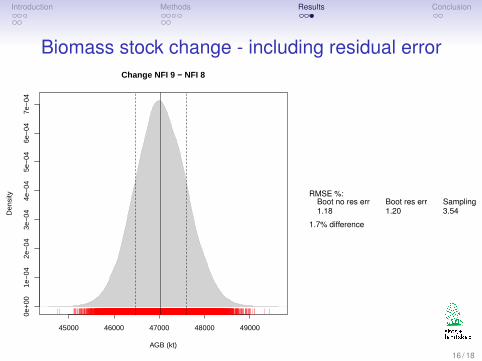
Biomass stock change - including residual error
45000 46000 47000 48000 49000
0e+
001e
−04
2e−
043e
−04
4e−
045e
−04
6e−
047e
−04
Change NFI 9 − NFI 8
AGB (kt)
Den
sity RMSE %:
Boot no res err Boot res err Sampling1.18 1.20 3.54
1.7% difference
16 / 18

Introduction Methods Results Conclusion
Summary – comparison of methods
• Analytic approach & param. bootstrap were equal• Both methods require the same information - parameter
covariance matrix– Many repititions needed in boostraping to obtain stable
result+ Bootstrap simpler in theory - e.g., extension for residual
error or measurement error
17 / 18

Introduction Methods Results Conclusion
Summary of results
• Model error = sampling error in stock estimates• Sampling error dominates over model error in change
estimates• Biomass residual error = marginal influence• Dependent on S1 and S2 sample size!
18 / 18
Additional Slides
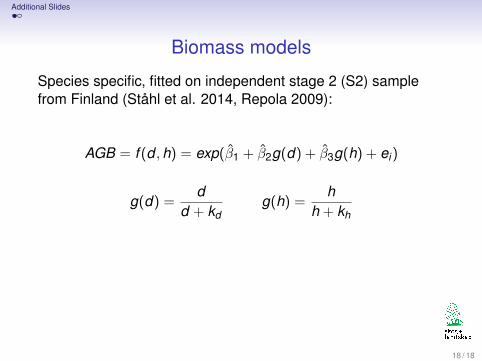
Biomass models
Species specific, fitted on independent stage 2 (S2) samplefrom Finland (Ståhl et al. 2014, Repola 2009):
AGB = f (d ,h) = exp(β1 + β2g(d) + β3g(h) + ei)
g(d) =d
d + kdg(h) =
hh + kh
f (d ,h)′d = d · exp(β1 + β2g(d) + β3g(h))
f (d ,h)′d =1
nS1
∑i
di · f (di ,hi)
18 / 18
Additional Slides
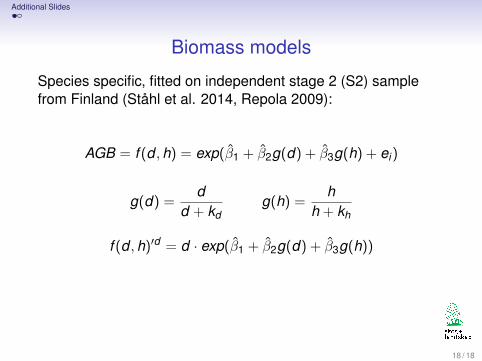
Biomass models
Species specific, fitted on independent stage 2 (S2) samplefrom Finland (Ståhl et al. 2014, Repola 2009):
AGB = f (d ,h) = exp(β1 + β2g(d) + β3g(h) + ei)
g(d) =d
d + kdg(h) =
hh + kh
f (d ,h)′d = d · exp(β1 + β2g(d) + β3g(h))
f (d ,h)′d =1
nS1
∑i
di · f (di ,hi)
18 / 18

Additional Slides
Parameter error and tree height measurement error
45000 46000 47000 48000 49000
0e+
001e
−04
2e−
043e
−04
4e−
045e
−04
6e−
047e
−04
Change NFI 9 − NFI 8
AGB (kt)
Den
sity
Ht err: 2.5% and 7.5%RMSE %:
Boot no ht err Boot ht err Sampling1.18 1.20 3.54
1.7% difference
Ht err: 5% and 20%RMSE %:
Boot no ht err Boot ht err Sampling1.18 1.27 3.54
5.0% difference
18 / 18