CITY OF ROCHESTER 2016 - Federal Reserve Bank of New … · 14620 14610 14621 14611 14613 14608...
60
FEDERAL RESERVE BANK of NEW YORK CITY OF ROCHESTER CREDIT PROFILE 2016 o ROC Genessee Valley Park Durand Eastman Park 14612 14606 14609 14616 14615 14620 14610 14621 14611 14613 14608 14605 14607 14619 14616 14604 14614 14627
Transcript of CITY OF ROCHESTER 2016 - Federal Reserve Bank of New … · 14620 14610 14621 14611 14613 14608...

F E D E R A L R E S E RV E B A N K o f N E W YO R K
CITY OF ROCHESTERCREDIT PROFILE 20
16
oROC
Genessee ValleyPark
Durand Eastman
Park
14612
1460614609
14616
14615
14620
14610
14621
14611
14613
14608
14605
14607
14619
14616
14604
14614
14627

The views represented here are those of the authors and do not represent those of the Federal Bank of New York or of the Federal Reserve System.
Editors
Kausar Hamdani, Ph.D. SVP and Senior Advisor
Claire Kramer Mills, Ph.D. AVP and Community Affairs Officer
Javier Silva Associate Director
Data Support
Jessica Battisto Senior Analyst
Scott Lieberman Senior Analyst
Sanjay Sudhir Senior Research Analyst
Design
Namrata Kalola Kalola Design
Mapping
James Labate Cartographer and GIS Analyst

CITY OF ROCHESTERCREDIT PROFILE, 2016
Foreword by Mayor Lovely A. Warren 2
Foreword by Alicia Kitsuse 3
Acknowledgments 4
Preface 5
Overview 7
City of Rochester and its Zip Codes 8
Key Takeaways 9
Indicators Summary Table 12
Community Credit and Inclusive Growth 13
Inclusive Growth 14
Micro Data Analytics 15
The Community Credit Paradigm 16
Access to Credit Is an Indicator of Individual Well-Being 16
Access to Credit Is an Indicator of Community Well-Being 17
Access to Credit Is an Indicator of Inclusive Growth 18
Summary 18
Brief Overview of Community Credit Indicators 19
Inclusion 20
Credit Stress 20
City of Rochester Micro Analytics and Maps 23
Credit Product Snapshots 49
About the Data 53
CONTENTS

FOREWORDMany of us take for granted the vital foundation that banks and credit institutions provide for the economic health of individuals and families. The reality is that too many households in Rochester and other Upstate New York communities lack access to credit and live outside our modern financial system. These families don’t have the tools to build equity and savings, take on economic uncertainty, or invest in themselves, their families, and their future. It hurts our neighborhoods, weakens our local economy, and makes our region less competitive.
One in three Rochester residents live in poverty, and many more lack the savings to weather unexpected hurdles in life. The loss of a job, a serious medical event, or even an unexpected car repair can send a family into a tail-spin that will force parents to choose between feeding their children and paying their heating bill. Credit can be a fallback to help bridge these gaps, but not everyone in our community is able to access these resources.
This report adds a critical new lens to our understanding of these issues and the general economic health of our city. Sobering community credit indicators provide further evidence that despite recent economic growth, residents of Rochester and urban communities across Upstate New York are still struggling. Rochester adults are about 10% less likely to have a credit history, and 15% less likely to have access to credit when compared to Monroe County or New York State residents overall. The data also shows that those who do have access to credit have poor credit scores, and face increased costs to borrow. We cannot accept the persistence of this poverty premium, whereby the poor are locked out of our mainstream financial system or are forced to pay more for predatory financial products and services.
The City of Rochester is committed to growing the financial and economic health of our diverse neighborhoods and helping individuals and families achieve economic security. We believe that our economy should work for everyone, and under my administration we have developed several new programs to address some of these bar-riers. Bridges to Success, a pilot program in collaboration with the Rochester Monroe Anti-Poverty Initiative and several local nonprofits, strives to help residents in targeted high-poverty neighborhoods set and achieve goals towards achieving self-sufficiency. Part of the program’s comprehensive approach includes supports around financial literacy and access, and assistance navigating the financial system. The City also launched a local chapter of the Kiva microloan program, which helps underserved entrepreneurs and small business owners get access to 0% interest crowd funded loans up to $10,000. We also provide regular financial literacy seminars at our libraries, and maintain strong relationships with local financial institutions and non-profits working to impact these issues. However, there is still much work to be done to address access and affordability of credit for citi-zens in our community.
Insights from this report can help Upstate New York leaders develop a deeper understanding of local challenges and provide a rallying point for communities to come together to address these disparities. Using this informa-tion to inform strategy, we need to augment and continue to support ongoing anti-poverty strategies. This will require continued partnership from all levels of government, business, and community organizations, as only together can we alter such large and complex systems. It is our moral duty to support our citizens’ economic and social wellbeing, and we must commit to tackling the challenge of inclusive growth if we hope to reach our true potential as a region.
Lovely A. Warren Mayor, City of Rochester, New York
2

FOREWORDFor community and economic development practitioners working in distressed cities, the stubborn inequities of economic growth are an all-too-familiar challenge. Despite investments intended to restore central business districts and foster new, more diverse industries, the dividends of urban economic renewal often remain concen-trated within a limited commercial core, with few if any opportunities extending to cities’ poorer neighborhoods. As a recent report on recovering post-industrial cities observed, shared prosperity does not result from growth alone. Produced jointly by the Funders’ Network for Smart Growth and Livable Communities and the Federal Reserve Banks of Chicago, Atlanta, Boston, and New York, the study, which included Rochester, New York, sug-gested that inclusive recovery requires informed, intentional effort to bind the transformative arc of economic growth to a corresponding arc of economic opportunities for struggling people and communities.1
This recognition has coincided with the proliferation of new sources of data, and growing action by local, place-based funders—an increasingly prominent stakeholder in community development practice—to harness the power of that data to inform both growth and opportunity strategies. The drive for economic inclusion has also coincided with the increasing tendency among funders to pursue a range of place-based interventions that are adapted to on-the-ground conditions in different parts of the city. Determining how best to invest resources to meet disparate needs requires access to high-quality data that ideally illuminate social and economic disparities at the neighborhood level while also suggesting actionable strategies for improvement.
Enter the Federal Reserve Bank of New York, whose Community Credit framework puts an important new re-source in the service of equitable community development. The framework calls upon a novel source of data—consumer credit information—to analyze economic inequalities across communities, and conceives of access to credit as a financial asset that can be unlocked to promote resilience and prosperity for both individuals and communities. Aggregated at the community level, consumer credit scores are an instructive indicator of com-munity health that can inform funders’ strategies for addressing gaps in wealth and well-being. For example, a high aggregate credit score indicates that residents are able to access resources that allow them to invest in wealth-building opportunities such as higher education, homeownership, or business development, and points funders toward strategies that support and incentivize that investment. Conversely, in communities with low aggregate scores, funders may seek to support non-traditional wealth-building strategies, such as cooperative community enterprises. Because it is readily accessible and frequently updated, consumer credit data is also a user-friendly means of analysis that enables close tracking of changes in community circumstances.
Equally as important, community credit and other forms of local-level data offer funders a device for creating a new decision-making table that melds strategies for economic growth with those of economic opportunity. As conveners and resource providers, place-based funders can engage a full spectrum of community and economic development stakeholders in jointly analyzing and interpreting data, and can incentivize implemen-tation of mutually developed interventions and metrics that hold the community accountable to meaningful change. Used to their fullest potential, data frames such as the Community Credit paradigm can not only help place-based funders advance a narrative of inclusive growth, but shift the norms of community and eco-nomic development practice toward the collaboration and accountability needed to achieve that growth.
Alicia Kitsuse Director, Older Industrial Cities Program, The Funders’ Network for Smart Growth and Livable Communities
The Funders’ Network for Smart Growth and Livable Communities is a mission-driven membership organization dedicated to inspiring, strengthening and expanding funding and philanthropic leadership that yield environmentally sustainable, socially equitable and economically prosperous regions and communities.
1 Looking for Progress in America’s Smaller Legacy Cities: A Report for Place-Based Funders,” A joint publication of the Funders’ Network for Smart Growth and Livable Communities, it’s members, and the Federal Reserve Banks of Atlanta, Boston, Chicago, and New York, 2017. Available at http://cdps.chicagofedblogs.org/?p=2376
3
ACKNOWLEDGMENTSMany individuals generously shared their time and expertise to help make this project more robust, relevant and accessible to practitioners, policymakers, funders and other community stakeholders. Their feedback and comments deepened our knowledge of local issues, decision-making processes and governance systems, and helped make our analytics more grounded in the realities of community life and focused on community concerns. Their enthusiasm and strong support for the work was also very encouraging. However, in no way do they bear responsibility for any remaining shortcomings.
We particularly wish to thank the following people and their organizations:
� Sol Marie Alfonso-Jones Senior Program Officer, Long Island Community Foundation
� Bryan Byrd Program Officer, New York State Health Foundation
� Adam Ciminello Executive Coordinator, The Financial Clinic
� Dennis Deleo President & Director, Venture Jobs Foundation
� Robert Duffy President & CEO, Greater Rochester Chamber of Commerce
� Pat Edwards Vice President, Citi Community Development
� Henry Fitts Director of Innovation, Mayors Office
� Jill Freeman Director of Strategic Partnerships, Venture Jobs Foundation
� Colleen Galvin Senior Vice President, Citi Community Development
� Nicky Grist Principal, Cities for Financial Empowerment Fund
� Alicia Kitsuse Director, The Funders’ Network for Smart Growth and Livable Communities
� Jennifer Leonard President & CEO, Rochester Area Community Foundation
� Ruhi Maker Senior Attorney, Empire Justice Center
� David Okorn Executive Director, Long Island Community Foundation
� Jasmine Thomas Senior Vice President of National Initiatives, Citi Community Development
� Heidi Zimmer-Meyer President, Rochester Downtown Development Corporation
We also thank our colleagues at the Federal Reserve Bank of New York: Andrew Haughwout, SVP, Wilbert van Der Klaauw, SVP, Richard Deitz, AVP, Donghoon Lee and Jaison Abel, Research Officers, and Joelle Scally, Re-search Associate, at the Federal Reserve Bank of New York for valuable input as we developed the Community Credit framework and this report. We thank Jessica Battisto, Scott Lieberman and Sanjay Sudhir for undertaking the extensive data analytics in this report; Namrata Kalola for report design and layout; and James Labate, Cartographer & GIS Analyst, for the mapping.
The views presented here are those of the authors and do not necessarily reflect the position of the Federal Reserve Bank of New York or the Federal Reserve System.
4

PREFACEIn 2014, the Federal Reserve Bank of New York released Community Credit: A New Perspective on America’s Communities.2 Unlike previous efforts that use credit data primarily to assess households’ well-being, Community Credit is designed to meet the need for reliable local data that can be used to evaluate a commu-nity’s well-being. The Community Credit paradigm uses residents’ credit data to gauge and benchmark the economic resiliency of their communities, helping to inform choices and monitor responses to programs.
We viewed that effort as the start of a conversation and, indeed, the response from the community has been very encouraging. The most frequent request was for more micro-level data analytics. While the Community Credit data provided valuable information for broad-brush benchmarking and identifying areas of greatest need, the data were too blunt for policy implementation by communities with active revitalization efforts under way. More refined analytics are needed for several reasons.
As is becoming increasingly apparent, overall prosperity can mask underlying inequality. Thriving cities and communities have distressed segments that are being missed in the macro metrics. This issue of inclusive growth is discussed in more detail in the main report. Micro data analytics are one way to identify and under-stand the needs of underserved segments within a community.
As data are more widely used to inform policy and are integrated into programs and practice, the need is grow-ing for follow-up data. Is the proverbial needle being moved? Is it being moved in the targeted communities? Are midcourse adjustments needed? Micro data analytics that indicate directionally how conditions are chang-ing, or not, are very much needed.
Perhaps most challenging of all is to determine whether the metrics are relevant and useful for practice. Individuals in underserved communities live very challenging lives. The metrics must acknowledge these realities and align with how intervention programs are administered.
The Community Credit project is a work in progress. We have not yet met all the needs we heard voiced. Our conversations with communities on how to make the analytics more useful are continuing. We are pleased to contribute to and be a part of the conversation on a very important topic.
2 http://www.nyfed.org/communitycredit
Kausar Hamdani, Ph.D. SVP and Senior Advisor
Claire Kramer Mills, Ph.D. AVP and Community Affairs Officer
Javier Silva Associate Director
5

6

OVERVIEW
777

Overview
CITY OF ROCHESTER AND ITS ZIP CODES
CITY OF ROCHESTER
oROC
Genessee ValleyPark
Durand Eastman
Park
14612
1460614609
14616
14615
14620
14610
14621
14611
14613
14608
14605
14607
14619
14616
14604
14614
14627
Lake Ontario
8

Overview
KEY TAKEAWAYS
Access to credit is a key contributor to financial security and economic well-being for households and communities alike. The following section presents detailed credit analytics, including measures of access to credit, for the City of Rochester, New York.3 When these analytics are viewed as a whole, a mosaic of the city emerges.
While Rochester continues to rank among the lowest in the nation and the region according to various mea-sures of credit access, progress is occurring relative to where the city was in the fourth quarter of 2007. However, some neighborhoods, especially those around the central/ downtown area, continue to lag and their needs persist. This report highlights where those credit needs are most extreme and where they are similar or dissimilar.
We hope readers of this report and users of these analytics will gain an overall understanding of conditions in Rochester and the diverse needs of its neighborhoods, especially its underserved neighborhoods. This under-standing can allow civic conversations to focus on overall development strategies that are based on the needs of the whole. Resources can be allocated among neighborhoods where the needs are most dire and persistent, and community programs can be targeted to achieve the highest social return. By providing this information we hope that the City of Rochester will move forward more confidently on a path of revitalization that is inclusive and promotes prosperity for the city and the region.
3 The city-level data presented in this report are calculated as the aggregate of all Census blocks within the city; this level of aggregation provides the most accurate estimates of city-level indicators. We also provide ranges of values for all zip codes within or partially within the city (expect where too few obser-vations are available), but these zip codes in no way play a role in defining the “City of Rochester.” See About the Data for details.
4 For this ranking of cities, Census Designated Place (CDP) data are aggregated using census block data sourced from the NY Fed CCP/Equifax credit records. Population data is sourced from the U.S. Census Bureau’s 2015 American Community Survey 1-Year estimates (as 2016 estimates are not yet available). Only cities whose populations are estimated by the American Community Survey are included in this comparison.
City of Rochester AnalyticsData for the city indicate that its percentage of adult residents in the credit economy (meaning those having a credit file and a score with a major credit bureau) has fluctuated between 70% and 82% over the last decade.
� As of the fourth quarter of 2016, 77.2% of Rochester’s adult population was in the credit economy. By this broadest measure of access to credit, Rochester ranks below the U.S. (89.5%), New York State (85.4%), and Monroe County (91.4%).
� Compared to the other ten large New York State cities (Census Designated Places), Rochester ranks in the middle by credit inclusion. Regionally, access to credit in the fourth quarter of 2016 ranged from 65.2% in Albany to 98.1% in Cheektowaga. In the Upstate New York region, Rochester ranks higher than Buffalo (75.8%) and Syracuse (70%).4
� Credit inclusion in the city peaked in 2008 and declined to a decade low of 71% in 2012. Since then, a steady recovery has occurred, although credit inclusion has not fully reached the pre-crisis level.
� The other indicators of credit, such as access to revolving credit or credit line capacity, show a similar pattern of post-crisis declines followed by a subsequent, but incomplete, recovery and remain below the pre-crisis level of the 2007 fourth quarter. However, Rochester’s values are a little lower than those of Buffalo and Syracuse, and its relative recovery has been a bit weaker.
9

Overview
The pattern is more positive when examined through the lens of credit behaviors or by how well the community is managing credit. Individuals who have strong credit quality not only are more financially secure but are also a source of strength to their community, contributing to its overall well-being and resiliency.
� As of the fourth quarter of 2016, 68.5% of Rochester’s credit economy was current on all debt obligations over the previous year; 32.1% of the city’s credit economy had a “prime” credit risk score, and 52.3% had a “subprime” credit risk score.
� While these quality measures for the city are weaker than those for the U.S., New York State, and the region, the cyclical pattern is more positive. Unlike for the U.S., Rochester (and its sister regional cities) did not experi-ence a marked decline post-crisis in these indicator values. On the contrary, values remained above the levels of the fourth quarter of 2007 and have continued to trend upward, though not monotonically. In other words, while the size of the credit economy declined in relative size, the quality of credit use by the city’s residents remained unchanged or even improved in some years.
While the inclusion and credit quality indicators are snapshots at a point in time, the credit stress indicators measure progress over the past year. We segment the credit economy into five groups, ranging from a group that continues to be free of debt problems to those that had persistent debt problems based on their payment history over a five-quarter period. A similarly positive pattern emerges for the City of Rochester when payment histories are examined.
� As of the fourth quarter of 2016, 70.8% of the city’s credit economy did not appear to have a debt payment problem. These individuals were either fully current on all debt obligations for the previous year or were able to make up any late payments before slipping into more serious delinquency status. During the same period, 7% of the credit economy showed improved payment behaviors while 21% experienced some degree of credit stress. A sub-segment of this latter group, or 12 percentage points, was seriously delinquent on some debt obligations during each quarter of the previous year.
� All the credit stress indicators suggest Rochester continues to have a higher share of credit-stressed individu-als than the U.S., New York State, Monroe County, Buffalo, or Syracuse. Which, if any, particular credit prod-ucts are the primary drivers of this credit stress is something that needs research.
� Even so, the indicators show post-crisis improvement. In other words, while the city continues to rank lower than other communities, it continues to improve relative to its own fourth-quarter 2007 benchmark.
Micro Data AnalyticsWhile the City of Rochester numbers tell one story, the micro data show that experience across neighborhoods varies considerably. Using zip codes as a proxy for neighborhoods, we find a group of about ten zip codes locat-ed in the central part of the city that rank among the lowest in the U.S. when measured by the various Commu-nity Credit indicators.
� Seven zip codes—14605, 14607, 14608, 14611, 14613, 14620, and 14621—have the lowest share of residents that are included in the credit economy, whether in the city or among zip codes in the nation. These zip codes form a cluster in the central/ downtown part of the city.
� A subset of four zip codes—14605, 14611, 14613, and 14621—at the northern half of the central city cluster are particularly notable. These four zip codes consistently rank in the lowest value band of zip codes in the city and in the nation by all the Community Credit measures.
10

Overview
� Three zip codes—14609, 14615, and 14619—are flagged by the indicators as neighborhoods where credit needs are more specific. Credit inclusion in these neighborhoods is similar to that in other Rochester neighborhoods, but there may be credit stress issues, which manifest in two ways: 14619 has a lower concentration of individuals who are managing their debt without problems, and all three zip codes have higher concentrations of individuals who are consistently delinquent. These neighborhoods may benefit from strategies and timely interventions that prioritize goals and actions to relieve credit stress.
� Two zip codes—14607 and 14620—are flagged as neighborhoods where broadening access to credit is a relative priority. The current credit economy is relatively small in these zip codes and residents are managing their debt reasonably well. Leveraging this base of local strength would be positive for the community as well as the City of Rochester as a whole.
CITY OF ROCHESTER ZIP CODES RANKED IN THE LOWEST VALUE BAND
Indicator/ Zip Code Included
Revolving Credit Utilization
On-time Payers Prime Subprime
Good Payment History
Consistently Delinquent Payment History
14605
14607
14608
14611
14613
14620
14621
14609
14615
14619
Lowest value band
<85% <50% <30% <70% <30% ≥50% <74% ≥11%
11

Overview
INDICATORS SUMMARY TABLE (Percent, as of 2016 Q4)
Indicator Definition U.S. NYSMonroe County Rochester Buffalo Syracuse Elmira
Cred
it Ec
onom
y
Included% of adult
population with credit score
89.5 85.4 91.4 77.2 75.8 70.0 71.3
Not Included
% of adult population without a
credit score
10.5 14.6 8.6 22.8 24.2 30.0 28.7
Avai
labl
e Cr
edit Revolving
Credit
% of credit economy with
revolving credit products
71.9 79.0 75.9 59.0 62.8 64.7 60.7
Utilization ≤30%
% of credit economy with 70+ % capacity
on revolving credit products
39.4 44.2 43.3 25.7 28.3 30.6 30.9
Cred
it Q
ualit
y
On-time Payers
% of credit economy current
on all credit obligations for
the most recent 4 quarters
79.4 81.0 81.6 68.5 71.9 71.0 77.0
Prime Credits
% of credit economy with Equifax Credit
Risk Score ≥720
51.0 55.1 56.7 32.1 36.1 38.8 43.1
Subprime Credits
% of credit economy with Equifax Credit
Risk Score <660
32.0 27.3 28.0 52.3 46.4 45.0 43.4
Cred
it St
ress
Good History
% of credit economy; based on most recent
5 quarters of payment history
81.4 83.2 83.7 70.8 73.6 73.7 78.1
Improved History 5.3 5.0 4.6 7.4 7.4 6.3 5.1
Declining History 1.3 1.3 1.4 2.3 1.9 2.1 1.2
Struggling History 3.8 3.7 3.6 7.1 6.5 6.8 5.5
Consistently Delinquent
History8.2 6.8 6.7 12.4 10.5 10.8 10.0
12

COMMUNITY CREDIT AND INCLUSIVE GROWTH
131313

Community Credit and Inclusive Growth
INCLUSIVE GROWTHAs Rochester and similar cities shed their industrial pasts and reinvent for the 21st century, the paradigm of inclusive growth—an economic growth strategy that systematically values prosperity for all residents in a com-munity5—is receiving increased attention. The importance of looking at smaller geographies, such as cities and neighborhoods, when assessing conditions of economic inequality is also being discussed.6
Fortunately, the growing availability of “big data7” is fostering the development of analytic tools that are granular enough for these micro-geographic applications. This report uses consumer credit data as a lens for viewing communities’ economic well-being. Specifically, it uses the Community Credit paradigm8 and metrics, created by the Federal Reserve Bank of New York, as proxy indicators of a community’s broader economic prosperity.
Previous growth strategies focused largely on rebuilding deteriorated downtowns, restoring physical infrastruc-tures, attracting new business ventures, and establishing amenities to reverse population outflows and attract new workers.9 These strategies assumed, implicitly or explicitly, that positive economic growth would benefit all residents in a community, that the proverbial rising tide would lift all boats, and that economic growth was sufficient to ensure broader prosperity.
Evidence from cities farther along the economic revitalization trajectory, however, reveals that the growth tide has not raised all boats equally—and some boats not at all.10 Not all segments of society have benefited from an expanding economy, and some may have fallen even farther behind. In case after case, inequality manifests itself in local conditions repeatedly characterized as “a tale of two cities,” a reference to the disparate outcomes within a single city.
In addition, there is an emerging realization that persistent distress in the form of troubled neighborhoods, poor housing stock, inadequate schools, and an insufficiently skilled workforce may slow or even stop the momen-tum of prosperity for an entire community, not just the poor segments, and thereby threaten a city’s long-term prospects and competitiveness.11 In order to assess the impact of growth policies and programs, it is important to examine conditions at a more granular level, including by neighborhoods or by particular segments of the population, such as the financially distressed. By looking at zip code-level data, we can examine whether trends at the city and county levels are also reflected in individual communities.
5 OECD, “Inclusive Growth,” available at http://www.oecd.org/inclusive-growth/ and “The 2016 Economic Report of the President,” available at https://obamawhitehouse.archives.gov/blog/2016/02/22/2016-economic-report-president.
6 Amy Liu, “Why Economic Development Matters,” The Avenue, Brookings, 2016. Available at http://www.brookings.edu/blog/the-avenue/2016/03/07/why-economic-development-matters/.
7 The increased integration of technology in our daily lives and business and government operations is resulting in the collection and potential analysis of micro data that would have been very difficult, if not impossible, without the technology. These data, usually measured in the thousands and millions of records, are often referred to as ‘big data.’
8 For a more complete discussion, please see the Community Credit website and chart book at http://www.nyfed.org/communitycredit.
9 Allan Mallach, “Out of the Shadow: Strategies for Change in Small Postindustrial Cities, A Special Report by the Community Development Studies and Education Department,” Federal Reserve Bank of Philadelphia.
10 “Looking for Progress in America’s Smaller Legacy Cities: A Report for Place-Based Funders,” A joint Publication of the Funders’ Network for Smart Growth and Livable Communities, its Members and the Federal Reserve Banks of Atlanta, Boston, Chicago and New York, 2017. Available at http://cdps.chicagofedblogs.org/?p=2376.
11 Joseph Parilla and Alan Berube, “Achieving Inclusive Growth in Cities.” The Avenue, July 5, 2016. Available at https://www.brookings.edu/blog/the-avenue/2016/07/05/achieving-inclusive-growth-in-cities/. See discussions by OECD Secretary-General Angel Gurria and JPMorgan Chase’s Peter Scher.
14

Community Credit and Inclusive Growth
MICRO DATA ANALYTICSData are valuable to address at least three essential information gaps:
� To identify and understand the financial circumstances and needs of communities: Data can describe local conditions and communicate both needs and successes to leaders and key stakeholders. Measurable metrics allow communities to be compared, either as peers or potential competitors. Within a community, changes in local conditions can be tracked over time to measure local progress.
� To develop policies and identify effective practices: Data can help prioritize resources for competing policy objectives by informing the costs, benefits, and trade-offs of alternative strategies. For example, data metrics are useful for comparing local needs and targeting resources in communities where needs are most critical.
� To evaluate programs and assess community impact: Indicators of residents’ well-being, coupled with metrics of program-specific outcomes, are useful for gauging the broader effectiveness of policy actions and social programs. Data analysis also helps in identifying the lessons learned, which can be used to improve the efficiency of programs customized for a specific region or to adapt policies in mid-course. Increasingly, inves-tors and funders are seeking greater accountability from their grantees by requesting performance metrics that can be used to assess progress over time.
In practice, policymakers and practitioners often have had to rely on broader indicators of growth—population, employment, income per capita, and so on—to assess growth in smaller geographies such as cities or towns and their component neighborhoods. These broader indicators, however, are not well designed for analyzing micro-level differences or for identifying conditions of economic inequality within a city or a community.
Data analytics, ideally, need to be granular enough for analysts to be able to understand and monitor the more incremental changes and to document long-term trends from an inclusive growth perspective, whether by place or by segment of society.12 Hence, the emergence of micro data analytics is particularly useful. Increasingly, public and nonprofit organizations are mapping data, designing dashboards, and otherwise making U.S. Census and other micro data more readily accessible for public use.13 Unfortunately, micro-level metrics may not always be available to the actual problem solvers in communities14 due to a lack of availability, capacity, or resources.
12 IBM. “Rochester USA Smarter Cities Challenge Report.” p. 3 and pp. 38–42.
13 Many examples exist including PolicyMap.com, Scorecard Prosperity Now, and the Federal Reserve Bank of Chicago’s Peer Cities Identification Tool.
14 The IBM report cited above mentions data gaps.
15

Community Credit and Inclusive Growth
THE COMMUNITY CREDIT PARADIGMAfter reviewing the available micro analytic tools, the New York Fed created the Community Credit framework, which uses local credit conditions as a lens for examining the financial well-being of a community of people identified by location.15 We focus on consumer credit data, which are: 1) more frequently available than more direct measures of prosperity such as income and net wealth; 2) carefully updated at a timely frequency to be highly accurate, since diverse stakeholders make important business decisions based on these data;16 3) good proxies, since they are highly correlated with the income and net wealth indicators of prosperity that are avail-able only with a longer lag; and 4) a recognized expertise of the Federal Reserve Bank of New York.
Community Credit indicators measure the percentage of adults (18+ years of age) in a community exhibiting specific credit traits and experiences. With these indicators, communities can track their own progress over time and compare themselves with peers and competitors. The community of interest may be the entire nation or an individual state or county.17
Over time, we received requests for Community Credit indicators at a more micro-geographic level. These requests made sense; community development programs and initiatives are often executed at the neighbor-hood level, where data are frequently sparse or unavailable, progress is difficult to monitor, and practices need to be modified as circumstances change.
This report is our first response. We continue to use the Community Credit framework, but take the analytics from the U.S., state, and county levels to the city and zip code levels. Our analysis uses the New York Fed Consumer Credit Panel/ Equifax data, which include a little over 11 million individual credit files, all in anony-mous form, up to and including the fourth quarter of 2016.18 The most recent values for the Community Credit indicators show year-over-year change on an annual basis for the decade covering the years 2007 to 2016. (See www.nyfed.org/communitycredit).
Data are no substitute for good judgment and experience, however, and the Community Credit indicators should be viewed only as tools to help policymakers and others advance the well-being of communities. We hope that this deeper drill-down to smaller geographies will help officials, planners, business leaders, funders, practi-tioners, and others in their attempts to build more prosperous communities for all, and not just some, residents.
ACCESS TO CREDIT IS AN INDICATOR OF INDIVIDUAL WELL-BEING Credit is a useful proxy for individual well-being because it affects the lives of individuals through multiple channels, both financial and nonfinancial, making it a broad-based measure of economic behavior.19 It is also a financial tool that individuals use to pursue economic prosperity, not something to be accumulated for its own sake. Accordingly, changes in the demand for and uses of credit are likely to capture and mirror changes in economic circumstances and behavior.20
15 For a more complete discussion, please see the Community Credit website and chart book at http://www.nyfed.org/communitycredit.
16 For example, on June 1, 2017, the U.S. Census Bureau released the 2013 “Wealth and Asset Ownership Detailed Tables,” highlighting household net worth from the Survey of Income and Program Participation. In contrast, credit data, in principle, is available daily for clients.
17 The most recent values for the indicators show year over year change on an annual basis for the years 2007–2016. See http://www.nyfed.org/communitycredit.
18 See About the Data for details.
19 “Financial inclusion is a key driver of inclusive growth. Connecting people to a secure way to receive, store and use money enables their full economic participation. And by bringing the 2 billion people who are currently excluded into the formal financial system, countries can grow at a much faster pace for the benefit of everyone.” MasterCard Center for Inclusive Growth. Available at https://mastercardcenter.org/about-inclusive-growth/.
20 Center for Financial Services Innovation, Understanding and Improving Consumer Financial Health in America. Available at https://www.metlife.com/assets/cao/foundation/understanding-and-improving-consumer-financial-health-in-america.pdf.
16

Community Credit and Inclusive Growth
The familiar financial channel is individuals’ access to credit and the associated costs of borrowing. Individuals with a history of on-time credit payments can obtain funds to finance special opportunities, or they can access emergency funds when needed, at reasonable rates and terms. Without such a history, individuals may find their credit options limited or nonexistent for activities such as obtaining education loans to invest in their future. Or it may be that credit will be available to them only on expensive terms, possibly through predatory channels, which can lead to prolonged cycles of mounting debt and costly default.
Access to credit also affects one’s ability to access economic opportunities more broadly. For example, credit information is frequently used by employers, landlords, and mobile phone companies to prescreen and qualify individuals; insurance companies sometimes use credit scores to determine premiums; and utilities and other companies may waive security deposits for those with established credit histories. Researchers have highlight-ed how young adults with heavy student loan debt often delay marriage and household formation.21 Meanwhile, nonexistent or uneven credit histories may result in higher costs for services and impede, or perhaps even pre-vent, individuals’ efforts to pursue economic opportunities. For these reasons, access to credit is an important financial asset for individuals.
ACCESS TO CREDIT IS AN INDICATOR OF COMMUNITY WELL-BEINGIndividuals with assets, while personally prosperous, can also be a potential source of strength to their commu-nity. For example, in the wake of Super Storm Sandy in the New York/ New Jersey area, wealthier communities seemed to recover sooner than other communities.22 In other words, we posit that residents’ ability to access credit not only describes their personal situation but also says something useful, in the aggregate, about the financial well-being of their community.
Persons with more financial assets, such as income and net wealth, are referenced as financially better off than those with fewer assets. Communities with higher concentrations of financially well-off individuals are ranked as more financially prosperous than communities with lower concentrations. Analogously, communities with high concentrations of individuals with access to credit, viewed as a financial asset, are posited to be financially stronger than communities with lower concentrations.23 In other words, access to credit is used as a relative indicator of a community’s financial well-being, and the Community Credit indicators are useful place-based metrics for assessing the well-being of cities and their component neighborhoods.
The use of place-based descriptors by researchers is well established.24 Communities are frequently referenced as low, moderate, middle, or high income for analytical purposes.25 Researchers have shown that where people live affects their future earning power and well-being.26 Others have documented that cities offering attractive amenities, including good schools, transportation, and well-kept neighborhoods, attract individuals and families. And the financial crisis illustrated firsthand the negative externalities of a single foreclosure adversely affecting
21 AICPA Survey, “68 Percent of Americans Regret How They Financed College,” April 29, 2015.
22 The Federal Reserve Bank of New York held several outreach events in the aftermath of the storm; this pattern was observed from those meetings and discussions.
23 Credit allows individuals to access resources from the future for use today. As such, it is a complement to other financial assets, namely income (i.e., finan-cial resources earned today) and net wealth (i.e., resources earned in the past). Since persons with more financial assets are generally viewed as ‘richer’ and better off financially than others in similar circumstances but with fewer assets, so also does the ability to access credit make a community ‘richer.’
24 Justin Wolfers. “Why the New Research on Mobility Matters: An Economist’s View.” The Upshot, The New York Times. Available at https://www.nytimes.com/2015/05/05/upshot/why-the-new-research-on-mobility-matters-an-economists-view.html?_r=1.
25 See the Federal Financial Institutions Examination Council’s Geocoding System for definitions of these classifications. Available at https://geomap.ffiec.gov/FFIECGeocMap/GeocodeMap1.aspx.
26 Raj Chetty and Nathaniel Hendren. “The Impacts of Neighborhoods on Intergenerational Mobility: Childhood Exposure Effects and County-Level Estimates.” Harvard University Working Paper Series, 2015. Available at http://www.equality-of-opportunity.org/images/nbhds_exec_summary.pdf.
17

Community Credit and Inclusive Growth
the value of nearby houses and even entire neighborhoods.27 Likewise, place-based measures of credit access, usage, and payment histories, as provided in the Community Credit framework, are useful complements to exist-ing community-level metrics
ACCESS TO CREDIT IS AN INDICATOR OF INCLUSIVE GROWTHAccess to credit may be particularly well-suited as a tool for assessing inclusive growth. It may be reasoned that credit behavior is a sensitive barometer of early and small changes in family circumstances, especially for individuals on the middle or lower rungs of the economic ladder. This segment of the population is known to be financially fragile,28 experiencing uneven income flows while having limited financial buffers. Some families are often just one emergency away from financial distress.29 For them, the ability to access credit for income smoothing may be even more consequential than for more affluent segments of the population. Obtaining credit from traditional mainstream sources may be their most cost-effective debt option. Also, for these individuals, access to credit is likely to be a larger component of their financial portfolio than are income and net wealth.
It is important to note that the Community Credit indicators do not reflect causal inferences. Moreover, the indicators do not measure who or how many adult residents are actually contributing to community prosperity. For example, individuals in a community may be accessing credit through informal30 or alternative31 channels instead of using mainstream financial products.32 As a result, they would not be in the Community Credit measures, while they may be contributing to their community’s prosperity.
Also, structural barriers may exist in the form of financial products and practices that do not mesh well with the financial lives and exigencies of lower-income families. Such factors may contribute to variations in credit access rates among communities across the nation and over time.
SUMMARY Growth strategies are likely to be more effective when coupled with good data and metrics. Metrics are useful for identifying where resources are most needed and for assessing progress over time, both within and across geographies. Yet, acute knowledge gaps exist at the community level, where programs are implemented and individuals live. Metrics such as median income or average or total debt balances are blunt measures for assessing inequality, yet they are widely used for this purpose because better options are lacking.
27 G. Timothy Kingsley, Robin Smith and David Price. “The Impacts of Foreclosures on Families and Communities,” The Urban Institute, May 2009 and Dan Immergluck and Geoff Smith, “The External Cost of Foreclosure: The Impact of Single-Family Mortgage Foreclosures on Property Values,” Housing Policy Debate, 17(6), 2006, pp. 57–79.
28 “Preliminary USFD data reveal that household incomes are complex. Incomes often fluctuate from month to month in both amount and timing, and in ways that are often outside of the households’ control. Income fluctuations create problems even for households whose finances are adequate on average over the course of the year. Households regularly experience swings in their ability to cover basic expenses, pay down debt or save for the future. In this context, budgeting and planning become quite difficult.” Jonathan Morduch and Rachel Schneider. “Spikes and Dips: How Income Uncertainly Affects Households.” Available at http://www.usfinancialdiaries.org/issue1-spikes. See also Annamaria Lusardi, Peter Tufano, and Daniel Schneider, “Financially Fragile Households: Evidence and Implications,” Brookings Papers on Economic Activity, Spring 2011. Available at https://www.brookings.edu/bpea-articles/financially-fragile-households-evidence-and-implications/.
29 The Federal Reserve Board of Governors Report on Economic Well-Being of U.S. Households in 2016 indicated 44% of adults would not be able to cover an emergency expense of $400 without selling something or borrowing money. Available at https://www.federalreserve.gov/publications/files/2016-report- economic-well-being-us-households-201705.pdf.
30 Friends and family are examples of this channel. This option may be preferred, or be the only option available, for families for small dollar loans.
31 Payday lenders and pawnshops are examples of this channel.
32 Evidence from the U.S. Financial Diaries indicates that especially lower income families use multiple channels to access credit. See Jonathan Morduch, Timothy Ogden and Rachel Schneider, “An Invisible Finance Sector: How Households Use Financial Tools of Their Own Making.” Available at http://www.usfinancialdiaries.org/issue3-informal.
18

Community Credit and Inclusive Growth
The Community Credit indicators are place-based metrics that examine the collective credit behaviors of residents to infer the well-being of the community, where the geography is broadly or narrowly defined. The micro analytics version of the indicators is a useful complement to other economic measures for gauging economic inclusiveness. Communities can track their own progress over time and compare themselves with peers and competitors
In the Community Credit paradigm, access to credit is a financial asset since it allows individuals to access resources from the future for use today. Residents’ access to and use of credit, however, enhances not just their individual well-being but also that of their community because these residents are a potential source of strength.
BRIEF OVERVIEW OF COMMUNITY CREDIT INDICATORS33 In the community credit paradigm, a community is defined as all adults in a geography with a credit file and a credit score in a data base of about 11 million people in 2016 (New York Fed Consumer Credit Panel/Equifax data). We can assess communities at the U.S., state, county, or local level. There are two groups of indicators: Inclusion and Credit Stress.
33 See Community Credit 2014 for a detailed description.
Credit Economy (have a credit file and
a credit score)
Included
Not Included
Convenient Credit (have credit products
and sufficient borrowing capacity)
Revolving Credit
Utilization
Credit Quality (have a payment history and credit
score to obtain timely and affordable credit)
On-time Payers
Prime Credits
Subprime Credits
Good Payment History
Improving Payment History
Declining Payment History
Struggling Payment History
Consistently Delinquent
Payment History
A. Inclusion B. Credit Stress
Community Credit Indicators
19

Community Credit and Inclusive Growth
InclusionThe first group of indicators, Inclusion, gauges a community’s “access to credit” by examining its residents’ abili-ty to obtain credit when needed or as desired. Three pairs of credit behaviors that contribute to credit access are calculated as indicators, each pair focusing on a separate aspect of creditworthiness. The three groups are:
Credit Economy—What share of a community’s residents are attached to the mainstream credit infrastructure, a first step to access credit from traditional financial sources?
i. Included—the percent of residents (18+ years of age) with a credit file and a credit score at a major credit bureau.
ii. Not-Included—the percent of adult residents who do not have a credit file and credit score at a major credit bureau.
Convenient Credit—What share of the credit economy is able to access credit as needed and without having to apply or reapply and requalify for a loan?
i. Revolving Credit—the percent of the credit economy with a revolving credit product and a non-zero credit limit.
ii. Utilization—the percent of the credit economy with at least 70% available capacity on their credit limits.
Credit Quality—What percent of the credit economy consists of individuals with a credit history and credit score that allows for timely and affordable loan approvals?
i. On-time Payers—the percent of the credit economy that was current on all credit obligations for the past year.
ii. Prime Credits—the percent of the credit economy that has a “prime” credit score.
Credit Stress A separate group of indicators measure how credit distressed a community is as a whole. Every individual in the credit economy is sorted into one of five categories based on five quarters of payment history. The three filters used to sort are:
� Delinquency status today—Is the individual 60+ days past due on any credit obligation as of year-end?
� Most severe delinquency status over the preceding four quarters—Was the individual 60+ days past due during any of the preceding four quarters?
� Number of quarters 60+ days late—Was the individual 60+ days past due during any or all of the preceding four quarters?
Based on the pattern of their payment history, individuals are sorted into one of the five groups listed below, which are the Credit Stress indicators: i. Good Payment History—unlikely to have a credit problem.
ii. Improved Payment History—payment status today is improved over the past year.
iii. Declining Payment History—payment status today is worse than during the past year.
iv. Struggling Payment History—payments were overdue during the past year.
v. Consistently Delinquent Payment History—payments were 60+ days overdue for every quarter of the past year.
20

Community Credit and Inclusive Growth
Struggling History
Consistently Delinquent History
Because the indicator groups are mutually exclusive, the measures sum to 100 percent for a given geography.
Was the person 60+ days past due on any credit obligation during any of the preceding four quarters?
Was the person 60+ days past due on any credit obligation during each of the preceding four quarters?
Payment Status as of Year-end Current 30-59 Days Late 60+ Days Late
Current On-time PayersImproved History
30-59 Days Late Good History
60+ Days Late Declining History
Credit Stress based on Five Quarters of Payment History of Individuals
Good HistoryCurrent or only 30-59 days late
Improved HistoryImproved from 60+ days late to current or less than 60 days late
Declining HistoryDeteriorated from current or less than 59 days late to 60+ days late
Struggling HistoryWas 60+ days late for some, but not all, of the period
Consistently Delinquent HistoryWas 60+ days late the entire period
21

Community Credit and Inclusive Growth
In our online data interactive (www.nyfed.org/communitycredit), there are two levels of data mapping: the U.S. with state values and county values.
The city-level data presented in this report are calculated as the aggregate of all Census blocks within the city; this level of aggregation provides the most accurate estimates of city-level indica-tors. However, to illustrate differences at the neighborhood-level, the maps present values for the zip codes within or partially within the City, except where too few observations are available (see About the Data for details).
In this report, we also provide maps at the city and zip code levels for the City of Rochester.
City and Zip Code Level Data
oROC
Genessee ValleyPark
Durand Eastman
Park
14612
1460614609
14616
14615
14620
14610
14621
14611
14613
14608
14605
14607
14619
14616
14604
14614
14627
U.S. and State level County level
22

CITY OF ROCHESTER MICRO ANALYTICS AND MAPS
232323

City of Rochester Micro Analytics and Maps
Data Source: FRBNY Consumer Credit Panel / Equifax
CREDIT ECONOMY / INCLUDEDINCLUDED is the broadest gauge of the ability to access credit. It measures the percent of adult residents (18+ years of age) in a community that have a credit file and a credit score with a major credit bureau, which positions them to obtain a loan from mainstream credit channels. These residents comprise what we call the “credit economy.” A larger credit economy within a community means more residents are likely to be able to access credit when needed or desired.
77.1% of Rochester’s residents were in the credit economy in 2016 Q4, as compared to 89.5% for the U.S. and 85.4% for New York State.
Over the past decade, the Rochester credit economy peaked at 82.2% in 2008. Even though the City’s adult population grew from 2009 to 2012, the credit economy simultaneously shrank,33 resulting in a decade low of 71.0% in 2012. The underlying data suggest that the share of residents included in the credit economy declined due to two forces: net population inflows of individuals without a credit file and credit score, and City residents who, on net, exited the credit economy in the wake of the Great Recession.
33 The U.S. Census Bureau’s 1-Year American Community Survey estimates the number of individuals 18 or older in the City of Rochester was 160,650 in 2009 and 163,153 in 2012.
24
201520142013 20162012201120092008 201020072006
Rochester Credit Economy: Included, 2006–2016
60%
65%
70%
75%
80%
85%
77%78% 79%82%
73%75% 74%
71%
76% 77% 77%
201520142013 20162012201120092008 20102007200680
100
120
140
160
180
65%
70%
75%
80%
85%
90%
Rochester Credit Economy: Included, 2006–2016
Num
ber o
f Ind
ividu
als (
Thou
sand
s)
18+ Population Credit Economy Credit Economy: Included (%, Right-Hand Axis)

City of Rochester Micro Analytics and Maps
Data Source: FRBNY Consumer Credit Panel / Equifax
The index of the INCLUDED indicator shows annual values normalized to 2007 Q4 as the base year.34 The index is useful to illustrate the post-crisis trajectory of credit conditions, to see whether the levels have returned to, ex-ceeded, or remain below their 2007 Q4 values. The chart below indicates the Rochester credit economy shrank post-2007 Q4, and has not recovered fully to its 2007 Q4 relative size. How much has it recovered? The chart shows the recovery path by year—a sharp early decline followed by an uneven recovery. As of 2016 Q4, Roch-ester’s credit economy, as a share of the adult resident population, was only 97.5% of its 2007 Q4 size. Other cities in upstate New York had similar paths of incomplete recoveries relative to 2007 Q4. However, Rochester’s trajectory may be building some positive momentum, with an uptick in credit inclusion since 2012 Q4.35
34 In these charts, we use 2007 Q4 values as the base and equal to 100 in the index. All other values are calculated relative to the 2007 Q4 base. For example, the value for 2007 Q4 is always 100 percent of the 2007Q4 value by definition. However, the U.S. 2016 Q4 value for the Included indicator is 97.5, meaning the values in 2016 Q4 had only recovered to 97.5% percent of their 2007 Q4 values. In other words, the chart is useful to see the path of recovery relative to the base year.
35 The sharp drop in values for Buffalo and Syracuse may not persist and should be interpreted with caution.
25
201520142013 20162012201120092008 20102007200680
85
90
95
100
105
Index of Included Indicator
Inde
x (20
07 Q
4=10
0)
U.S. Rochester Buffalo Syracuse

City of Rochester Micro Analytics and Maps
Data Source: FRBNY Consumer Credit Panel / Equifax
CREDIT ECONOMY / INCLUDED (continued)Despite the relatively positive metrics for the city overall, the micro data map illustrates the variation in condi-tions that exists among the City’s neighborhoods. At the zip code-level of aggregation, the northern part of the City has the highest share of its residents included in the credit economy, while credit inclusion is lowest in the cluster of seven zip codes located around the downtown area: 14605, 14607, 14608, 14611, 14613, 14620, and 14621. In these zip codes, less than 85% of adult residents were included in the credit economy in 2016 Q4. A zip code indicated as <85% is in the lowest tier of the Included indicator values among all zip codes in the U.S.36 Therefore, these zip codes are among the group of U.S. zip codes with the lowest levels of credit inclusion in the nation.
36 In other words, we examined the distribution of indicator values for all U.S. zip codes from 2005 to 2016 to determine the six ranges presented for the various neighborhood maps.
26
oROC
Genessee ValleyPark
Durand Eastman
Park
14612
1460614609
14616
14615
14620
14610
14621
14611
14613
14608
14605
14607
14619
14616
14604
14614
14627
90%–91%
94%–95%
≥96%
92%–93%
85%–89%
<85%
UNMAPPED
CITY OF ROCHESTER
Rochester Map: Included

City of Rochester Micro Analytics and Maps
Data Source: FRBNY Consumer Credit Panel / Equifax
27

City of Rochester Micro Analytics and Maps
Data Source: FRBNY Consumer Credit Panel / Equifax
CREDIT ECONOMY / NOT INCLUDEDThe NOT INCLUDED indicator, which is the reverse of the INCLUDED measure, is useful to identify areas of high-est need and opportunity for policy and programmatic interventions. NOT INCLUDED is the percent of Roches-ter’s adult population that does not have a credit file and a credit score with a major credit bureau and is there-fore not a part of the credit economy; this group is sometimes referred to as “credit invisible.” 37 However, these persons may access credit from informal or alternative credit channels not captured by our indicators.
22.8% of City of Rochester adult residents were not a part of the credit economy in 2016 Q4. This share is higher than that for the U.S. at 10.5% and New York State at 14.6%.
Since 2012, the share of Rochester residents not included in the credit economy has declined, which is similar to the national pattern. However, the Not Included share has remained steady at about 23% over the last few years, without showing further improvements.
The index of the NOT INCLUDED indicator shows progress, or lack thereof, for the City relative to where the City was in 2007 Q4. While inclusion deteriorated through 2012, slow recovery has been observed since then. Comparing across Rochester, Buffalo, and Syracuse, Rochester has made a stronger relative recovery since 2012, though none of these upstate cities have fully recovered to their 2007 Q4 levels of inclusion.
37 See the Consumer Financial Protection Bureau’s report, “CFPB data point: Becoming credit visible,” 2017. https://www.consumerfinance.gov/data-research/research-reports/cfpb-data-point-becoming-credit-visible/.
28
201520142013 20162012201120092008 201020072006
201520142013 20162012201120092008 201020072006
Rochester Credit Economy: Not Included, 2006–2016
5%
10%
15%
20%
25%
30%
23%22% 21%18%
27%25% 26%
29%
24% 23% 23%
75
100
125
150
175
200
Index of Not Included Indicator
Inde
x (20
07 Q
4=10
0)
U.S. Rochester Buffalo Syracuse

City of Rochester Micro Analytics and Maps
Data Source: FRBNY Consumer Credit Panel / Equifax
The micro data map shows a mosaic of need among the City’s neighborhoods. At the zip code-level of aggre-gation, the northern part of the City has the lowest share of residents not included in the credit economy. Credit invisible concentrations are highest in the seven centrally located zip codes surrounding the downtown area: 14605, 14607, 14608, 14611, 14613, 14620, and 14621. More than 15% of adult residents in these zip codes are not included in the credit economy, as shown by the darkest brown sections on the map.
!!
! !
!!!!
!!!!
!!
!!!!
!!
!!!!
! !! !
! !!! ! ! ! ! !!
!!
! !
!!
! !! !
! !! !
! !
!!
!!
!!!!
!!!!
!!!!
! !
! !!!
!!!!
!!!!
!!!!
! !! ! ! ! !!
! !! ! ! ! ! !
!! ! ! !!! !
! ! ! ! ! ! ! ! ! !
!!!!
!!!!
!!! !
! !! !
!!
! !
!!!!
!!!!
! !!!
!!!!!!!!
! !! !
! !! ! ! !
! !! !
! !! ! !!
!!!!
! !!!!!!!
!!
! !
!!!!
!!!!
!!! !
!!!!
!!!!
!!
! !
! !
! !
!!! !
! !
!!
!!!!
! !
!!
!!
!!!!
!!!!
!!! !
!!!!
! !! ! ! ! ! ! ! ! ! !
! !
!!!!
!!!!
!!
!!!!
!!!!
!!!!
!!!!!!!!!!!!
!!!!!!
!!!!
!!
!!
!!
!!
!!!!
!!!!
!
!
! !!!
!!!!
!!!!
!!
!!!!
! !
!!
! !!!!!!!!!!!! !
!!
!!
!!! !! !
! !
! !! !
!!!!
!!
!!!!
!!!!
!!!!
!!!!
!!!!
!!!!
!!
!!
!!!! ! ! ! ! ! ! ! !
!!!!
!!!!
!!!!!!
!!!!!!!!!!
! !! !
! !! ! ! !
! !! !
! !! !
!!!!
!!
! ! ! ! ! !
! !! !
!!!!
! ! ! !
! !! !
! !! !
! !!!
!!! !
! !! !
!
! !
!
!! !!
!!
!!!!
!!
oROC
Genessee ValleyPark
Durand Eastman
Park
14612
1460614609
14616
14615
14620
14610
14621
14611
14613
14608
14605
14607
14619
14616
14604
14614
14627
7%–8%
11%–14%
≥15%
9%–10%
4%–6%
<4%
UNMAPPED
CITY OF ROCHESTER
Rochester Map: Not Included
29

City of Rochester Micro Analytics and Maps
Data Source: FRBNY Consumer Credit Panel / Equifax
CONVENIENT CREDIT / REVOLVING CREDITThe REVOLVING CREDIT indicator measures the percent of Rochester’s credit economy with a revolving credit product and a non-zero credit limit.
Having a credit file and a credit score does not ensure that an individual may obtain credit at all or in a timely way. The ability to access credit might be better gauged, in practice, by the ability to obtain credit as needed and without having to apply or reapply and requalify for a loan. Revolving credit products, such as bank-issued credit cards and HELOCs, are convenient credit options since they allow individuals to incur credit, up to a limit, at their own discretion.
59.0% of Rochester’s credit economy had revolving credit in 2016 Q4, compared with 71.9% for the U.S. and 79.0% for New York State. This percent has steadily declined over the past decade, from a high of 68.8% in 2007 to a low of 54.7% in 2013. Since then, there has been consistent improvement.
30
201520142013 20162012201120092008 201020072006
The index of the REVOLVING CREDIT indicator shows that Rochester’s access to revolving credit remains below the City’s 2007 Q4 level. Post-crisis, revolving credit access deteriorated and continued to decline for several years; a turnaround did not start until 2014. Other upstate cities, such as Buffalo and Syracuse, experienced a similar history of post-crisis decline. However, their turnarounds started earlier than Rochester’s, and their recoveries to their 2007 levels are nearly complete.
201520142013 20162012201120092008 201020072006
Rochester Credit Economy: Revolving Credit, 2006–2016
45%
50%
55%
60%
65%
70%
59%
68% 69%67%
60% 59%57% 56% 55% 55%
57%
60
70
80
90
100
110
Index of Revolving Credit Indicator
Inde
x (20
07 Q
4=10
0)
U.S. Rochester Buffalo Syracuse

City of Rochester Micro Analytics and Maps
Data Source: FRBNY Consumer Credit Panel / Equifax
!!
! !
!!!!
!!!!
!!
!!!!
!!
!!!!
! !! !
! !!! ! ! ! ! !!
!!
! !
!!
! !! !
! !! !
! !
!!
!!
!!!!
!!!!
!!!!
! !
! !!!
!!!!
!!!!
!!!!
! !! ! ! ! !!
! !! ! ! ! ! !
!! ! ! !!! !
! ! ! ! ! ! ! ! ! !
!!!!
!!!!
!!! !
! !! !
!!
! !
!!!!
!!!!
! !!!
!!!!!!!!
! !! !
! !! ! ! !
! !! !
! !! ! !!
!!!!
! !!!!!!!
!!
! !
!!!!
!!!!
!!! !
!!!!
!!!!
!!
! !
! !
! !
!!! !
! !
!!
!!!!
! !
!!
!!
!!!!
!!!!
!!! !
!!!!
! !! ! ! ! ! ! ! ! ! !
! !
!!!!
!!!!
!!
!!!!
!!!!
!!!!
!!!!!!!!!!!!
!!!!!!
!!!!
!!
!!
!!
!!
!!!!
!!!!
!
!
! !!!
!!!!
!!!!
!!
!!!!
! !
!!
! !!!!!!!!!!!! !
!!
!!
!!! !! !
! !
! !! !
!!!!
!!
!!!!
!!!!
!!!!
!!!!
!!!!
!!!!
!!
!!
!!!! ! ! ! ! ! ! ! !
!!!!
!!!!
!!!!!!
!!!!!!!!!!
! !! !
! !! ! ! !
! !! !
! !! !
!!!!
!!
! ! ! ! ! !
! !! !
!!!!
! ! ! !
! !! !
! !! !
! !!!
!!! !
! !! !
!
! !
!
!! !!
!!
!!!!
!!
oROC
Genessee ValleyPark
Durand Eastman
Park
14612
1460614609
14616
14615
14620
14610
14621
14611
14613
14608
14605
14607
14619
14616
14604
14614
14627
60%–69%
73%
≥74%
70%–72%
50%–59%
<50%
UNMAPPED
CITY OF ROCHESTER
Rochester Map: Revolving Credit
31
The micro data map shows that the distribution of revolving credit holders in Rochester’s credit economy varies across the city’s zip codes. Zip codes with the highest share of revolving credit holders are located in the northwest and southeast portions of the City. There is variation, however, among the seven centrally located zip codes. By this indicator, only four zip codes (14605, 14611, 14613, and 14621), fewer than before, are in the lowest band of values in the nation. In these four zip codes (colored light yellow),) less than 50% of the popula-tion uses revolving credit.

City of Rochester Micro Analytics and Maps
Data Source: FRBNY Consumer Credit Panel / Equifax
CONVENIENT CREDIT / UTILIZATIONThe UTILIZATION indicator complements the REVOLVING CREDIT indicator. As a practical matter, only individ-uals with borrowing capacity within their revolving credit limits will be able to conveniently access credit when desired and without lowering their credit score. While opinions vary, we use a sufficiency threshold of 70% of unused revolving credit limits to identify individuals with clearly available borrowing capacity. In other words, these individuals have utilized no more than 30% of their available credit lines.
25.7% of the Rochester credit economy had 70% or more borrowing capacity on their revolving credit lines. Compare this value with 39.4% for the U.S. and 44.2% for New York State.
The percent of Rochester’s credit economy with strong revolving credit borrowing capacity has fluctuated over the past decade. After reaching a high of 30.2% in 2008, this value has subsequently hovered between 25% and 26% for the last several years.
32
201520142013 20162012201120092008 201020072006
The UTILIZATION indicator index shows that Rochester has not recovered to its 2007 Q4 level. Post-crisis, the City experienced a sharp deterioration in its revolving credit access and remained relatively flat until 2015, when some improvement was seen. The recovery cycle for Buffalo and Syracuse was closer to the U.S. pattern, and recovery to 2007 Q4 levels may have completed in 2016.
201520142013 20162012201120092008 201020072006
Rochester Credit Economy: Utilization, 2006–2016
5%
10%
15%
20%
25%
30%
26%27%30% 30%
26% 26% 25% 25% 25% 25% 26%
60
70
80
90
100
110
Index of Utilization Indicator
Inde
x (20
07 Q
4=10
0)
U.S. Rochester Buffalo Syracuse

City of Rochester Micro Analytics and Maps
Data Source: FRBNY Consumer Credit Panel / Equifax
!!
! !
!!!!
!!!!
!!
!!!!
!!
!!!!
! !! !
! !!! ! ! ! ! !!
!!
! !
!!
! !! !
! !! !
! !
!!
!!
!!!!
!!!!
!!!!
! !
! !!!
!!!!
!!!!
!!!!
! !! ! ! ! !!
! !! ! ! ! ! !
!! ! ! !!! !
! ! ! ! ! ! ! ! ! !
!!!!
!!!!
!!! !
! !! !
!!
! !
!!!!
!!!!
! !!!
!!!!!!!!
! !! !
! !! ! ! !
! !! !
! !! ! !!
!!!!
! !!!!!!!
!!
! !
!!!!
!!!!
!!! !
!!!!
!!!!
!!
! !
! !
! !
!!! !
! !
!!
!!!!
! !
!!
!!
!!!!
!!!!
!!! !
!!!!
! !! ! ! ! ! ! ! ! ! !
! !
!!!!
!!!!
!!
!!!!
!!!!
!!!!
!!!!!!!!!!!!
!!!!!!
!!!!
!!
!!
!!
!!
!!!!
!!!!
!
!
! !!!
!!!!
!!!!
!!
!!!!
! !
!!
! !!!!!!!!!!!! !
!!
!!
!!! !! !
! !
! !! !
!!!!
!!
!!!!
!!!!
!!!!
!!!!
!!!!
!!!!
!!
!!
!!!! ! ! ! ! ! ! ! !
!!!!
!!!!
!!!!!!
!!!!!!!!!!
! !! !
! !! ! ! !
! !! !
! !! !
!!!!
!!
! ! ! ! ! !! !
! !!!
!!
! ! ! !
! !! !
! !! !
! !!!
!!! !
! !! !
!
! !
!
!! !!
!!
!!!!
!!
oROC
Genessee ValleyPark
Durand Eastman
Park
14612
1460614609
14616
14615
14620
14610
14621
14611
14613
14608
14605
14607
14619
14616
14604
14614
14627
35%–38%
42%–44%
≥45%
39%–41%
30%–34%
<30%
UNMAPPED
CITY OF ROCHESTER
Rochester Map: Utilization
33
The micro data map shows a pattern at the zip code-level that is very similar to the Included indicator. Six zip codes (14605, 14607, 14608, 14611, 14613, and 14621) in the central downtown area display lower ability to access credit conveniently than elsewhere in the City. In these zip codes, depicted in the lightest green, less than 30% of the credit economy individuals have revolving credit products, such as credit cards, with sufficient credit limit capacity to readily borrow to meet emergencies or to take advantage of an economic opportunity. In such circumstances, many others in these zip codes, depending on their credit limits, might need to rely on friends and family, or even nontraditional or predatory products for their credit needs.

City of Rochester Micro Analytics and Maps
Data Source: FRBNY Consumer Credit Panel / Equifax
CREDIT QUALITY / ON-TIME PAYERSCreditworthiness affects an individual’s ability to access credit and broader economic opportunities such as qualifying for a rental or a job. Lenders and other organizations often assess creditworthiness through one’s payment history and credit risk score.
The ON-TIME PAYERS indicator focuses on payment history. It measures the percent of the credit economy that is current, or never more than 30 days past due on any of their credit obligations, for every quarter of the ana-lyzed year. It is intended to gauge how well the community is handling credit obligations, regardless of loan size and the number or types of credit products held.
68.5% of Rochester’s credit economy was characterized as ON-TIME PAYERS in 2016 Q4. Compare this with 79.4% for the U.S. and 81.0% for New York State. By this measure, there is an overall positive trend over the last decade.
34
201520142013 20162012201120092008 201020072006
A similarly positive picture emerges from the ON-TIME PAYERS indicator index chart. By this indicator, there was no post-2007 Q4 decline in Rochester, Buffalo, or Syracuse, as was the case nationally. For the U.S., most of the indicators hit their post-2007 low in 2012. While 2016 did manifest some weakness for all the cities, the on-time payment index remains above the 2007 Q4 level for both Rochester and Buffalo.
90
95
100
105
110
115
Index of On-time Payers Indicator
Inde
x (20
07 Q
4=10
0)
U.S. Rochester Buffalo Syracuse
Rochester Credit Economy: On-time Payers, 2006–2016
201520142013 20162012201120092008 20102007200645%
50%
55%
60%
65%
70%
68%
63% 64% 65% 66%68% 68% 67% 68%
70% 70%

City of Rochester Micro Analytics and Maps
Data Source: FRBNY Consumer Credit Panel / Equifax
!!
! !
!!!!
!!!!
!!
!!!!
!!
!!!!
! !! !
! !!! ! ! ! ! !!
!!
! !
!!
! !! !
! !! !
! !
!!
!!
!!!!
!!!!
!!!!
! !
! !!!
!!!!
!!!!
!!!!
! !! ! ! ! !!
! !! ! ! ! ! !
!! ! ! !!! !
! ! ! ! ! ! ! ! ! !
!!!!
!!!!
!!! !
! !! !
!!
! !
!!!!
!!!!
! !!!
!!!!!!!!
! !! !
! !! ! ! !
! !! !
! !! ! !!
!!!!
! !!!!!!!
!!
! !
!!!!
!!!!
!!! !
!!!!
!!!!
!!
! !
! !
! !
!!! !
! !
!!
!!!!
! !
!!
!!
!!!!
!!!!
!!! !
!!!!
! !! ! ! ! ! ! ! ! ! !
! !
!!!!
!!!!
!!
!!!!
!!!!
!!!!
!!!!!!!!!!!!
!!!!!!
!!!!
!!
!!
!!
!!
!!!!
!!!!
!
!
! !!!
!!!!
!!!!
!!
!!!!
! !
!!
! !!!!!!!!!!!! !
!!
!!
!!! !! !
! !
! !! !
!!!!
!!
!!!!
!!!!
!!!!
!!!!
!!!!
!!!!
!!
!!
!!!! ! ! ! ! ! ! ! !
!!!!
!!!!
!!!!!!
!!!!!!!!!!
! !! !
! !! ! ! !
! !! !
! !! !
!!!!
!!
! ! ! ! ! !
! !! !
!!!!
! ! ! !
! !! !
! !! !
! !!!
!!! !
! !! !
!
! !
!
!! !!
!!
!!!!
!!
oROC
Genessee ValleyPark
Durand Eastman
Park
14612
1460614609
14616
14615
14620
14610
14621
14611
14613
14608
14605
14607
14619
14616
14604
14614
14627
75%–79%
83%–84%
≥85%
80%–82%
70%–74%
<70%
UNMAPPED
CITY OF ROCHESTER
Rochester Map: On-time Payers
35
While the City-level values are positive overall, the micro data map of ON-TIME PAYERS shows a broader pattern of distress. Here, six Rochester zip codes (14605, 14608, 14611, 14613, 14619, and 14621) are in the lowest band of zip code values in the U.S. In these zip codes, depicted in light purple on the map, less than 70% of cred-it economy participants were current on all payments on all credit products during all four quarters of 2016.
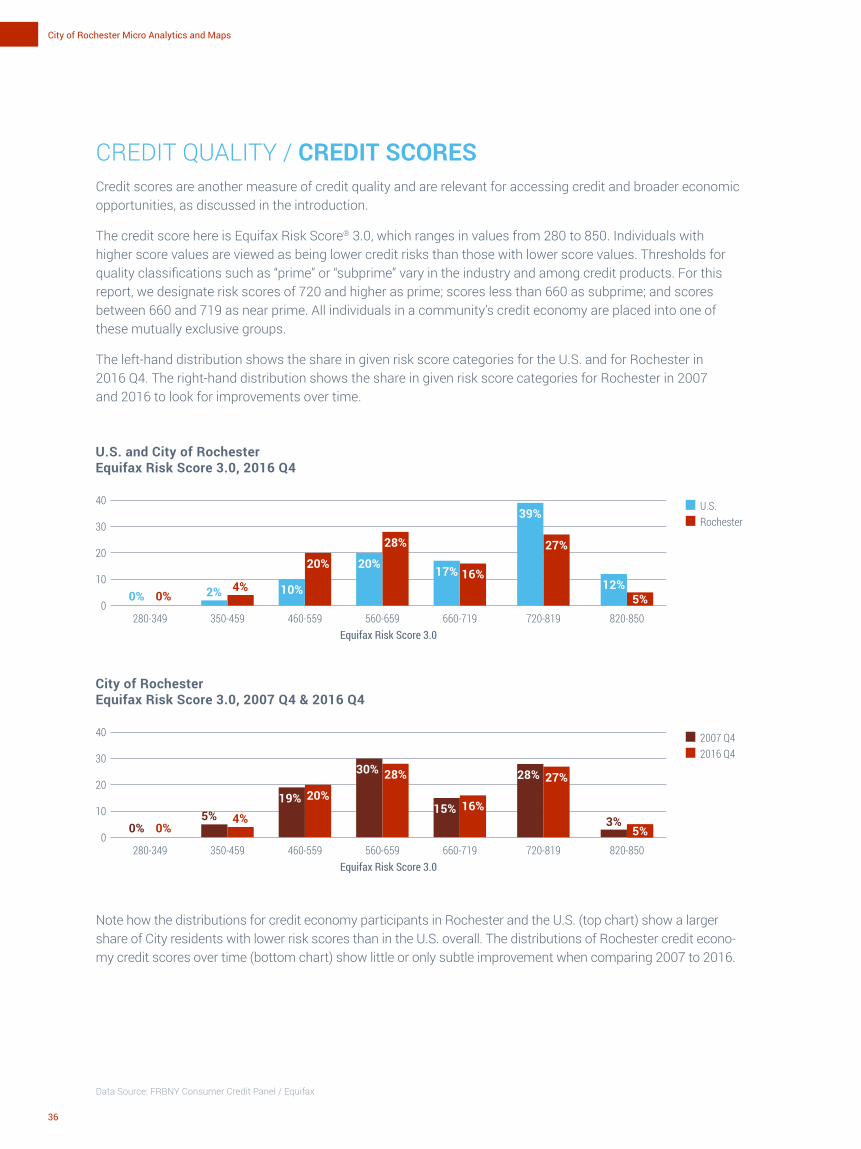
City of Rochester Micro Analytics and Maps
Data Source: FRBNY Consumer Credit Panel / Equifax
CREDIT QUALITY / CREDIT SCORESCredit scores are another measure of credit quality and are relevant for accessing credit and broader economic opportunities, as discussed in the introduction.
The credit score here is Equifax Risk Score® 3.0, which ranges in values from 280 to 850. Individuals with higher score values are viewed as being lower credit risks than those with lower score values. Thresholds for quality classifications such as “prime” or “subprime” vary in the industry and among credit products. For this report, we designate risk scores of 720 and higher as prime; scores less than 660 as subprime; and scores between 660 and 719 as near prime. All individuals in a community’s credit economy are placed into one of these mutually exclusive groups.
The left-hand distribution shows the share in given risk score categories for the U.S. and for Rochester in 2016 Q4. The right-hand distribution shows the share in given risk score categories for Rochester in 2007 and 2016 to look for improvements over time.
Note how the distributions for credit economy participants in Rochester and the U.S. (top chart) show a larger share of City residents with lower risk scores than in the U.S. overall. The distributions of Rochester credit econo-my credit scores over time (bottom chart) show little or only subtle improvement when comparing 2007 to 2016.
36
U.S. and City of Rochester Equifax Risk Score 3.0, 2016 Q4
280-349 350-459 460-559 560-659Equifax Risk Score 3.0
660-719 720-819 820-8500
10
20
30
40 U.S. Rochester
0% 2%0%4% 10%
20% 17%
39%
12%
20%
28%
16%
27%
5%
280-349 350-459 460-559 560-659Equifax Risk Score 3.0
660-719 720-819 820-850
City of Rochester Equifax Risk Score 3.0, 2007 Q4 & 2016 Q4
0
10
20
30
40 2007 Q4 2016 Q4
0%5%
0%4%
19%
30%
15%
28%
3%
20%
28%
16%
27%
5%

City of Rochester Micro Analytics and Maps
Data Source: FRBNY Consumer Credit Panel / Equifax
37
146061460414615 14607 14616 14620 14612 1461014609146191461114605 146211461314608
The following bar charts show the percent of the credit economy in each risk score group for the U.S., Roch-ester, and two upstate cities. In 2016 Q4, 52% of Rochester’s credit economy was subprime, with credit scores below 660, as compared to 32% for the U.S.
The bar chart below ranks the City’s zip codes, within or partially within Rochester, by the percent of each zip code’s credit economy that is subprime. In six zip codes (14605, 14608, 14611, 14613, 14619, and 14621), the share of the subprime credit economy ranges from 57% to 70%.
Rochester Buffalo Syracuse U.S.0
20
40
60
80
100
Credit Score Groups, 2016 Q4
Prime Nearprime Subprime
51%
32%
17%
39%
45%
16%
36%
46%
18%
32%
52%
16%
0
20
40
60
80
100
Credit Score Groups by Rochester Zip Codes, 2016Q4
Prime Nearprime Subprime
70%
16%
14%
68%
18%
14%
68%
15%
17%
65%
22%
13%
64%
21%
15%
57%
28%
15%
45%
41%
14%
44%
40%
16%
40%
44%
16%
39%
46%
15%
33%
46%
21%
30%
53%
17%
27%
57%
16%
24%
57%
19%
18%
69%
13%

City of Rochester Micro Analytics and Maps
Data Source: FRBNY Consumer Credit Panel / Equifax
CREDIT QUALITY / PRIME CREDITSIn the Community Credit framework, we designate as PRIME all individuals in the credit economy with Equifax Risk Score® 3.0 values of 720 or higher.
32.1% of Rochester’s credit economy has a prime risk score. Compare this with 51.0% for the U.S. and 55.1% for New York State.
From 2006 through 2010, the percent of the economy with prime credit scores rose steadily. Whether this improvement was due to an inflow of prime residents to the population or credit quality improvements among longer term residents is not discernible from this indicator.
38
201520142013 20162012201120092008 20102007200680
90
100
110
120
130
Index of Prime Credits Indicator
Inde
x (20
07 Q
4=10
0)
U.S. Rochester Buffalo Syracuse
The index of the PRIME indicator shows a similar trajectory of small but consistent improvement over 2007 Q4 levels. Following 2007 Q4, there was no sharp decline as seen with some of the inclusion indicators. A decline did occur between 2010 and 2011, but small progress has since maintained.
201520142013 20162012201120092008 201020072006
Rochester Credit Economy: Prime Credits, 2006–2016
29%
30%
31%
32%
33%
34%
32%
30%
31% 31%
32%
33%
31%
32% 32% 32% 32%

City of Rochester Micro Analytics and Maps
Data Source: FRBNY Consumer Credit Panel / Equifax
!!
! !
!!!!
!!!!
!!
!!!!
!!
!!!!
! !! !
! !!! ! ! ! ! !!
!!
! !
!!
! !! !
! !! !
! !
!!
!!
!!!!
!!!!
!!!!
! !
! !!!
!!!!
!!!!
!!!!
! !! ! ! ! !!
! !! ! ! ! ! !
!! ! ! !!! !
! ! ! ! ! ! ! ! ! !
!!!!
!!!!
!!! !
! !! !
!!
! !
!!!!
!!!!
! !!!
!!!!!!!!
! !! !
! !! ! ! !
! !! !
! !! ! !!
!!!!
! !!!!!!!
!!
! !
!!!!
!!!!
!!! !
!!!!
!!!!
!!
! !
! !
! !
!!! !
! !
!!
!!!!
! !
!!
!!
!!!!
!!!!
!!! !
!!!!
! !! ! ! ! ! ! ! ! ! !
! !
!!!!
!!!!
!!
!!!!
!!!!
!!!!
!!!!!!!!!!!!
!!!!!!
!!!!
!!
!!
!!
!!
!!!!
!!!!
!
!
! !!!
!!!!
!!!!
!!
!!!!
! !
!!
! !!!!!!!!!!!! !
!!
!!
!!! !! !
! !
! !! !
!!!!
!!
!!!!
!!!!
!!!!
!!!!
!!!!
!!!!
!!
!!
!!!! ! ! ! ! ! ! ! !
!!!!
!!!!
!!!!!!
!!!!!!!!!!
! !! !
! !! ! ! !
! !! !
! !! !
!!!!
!!
! ! ! ! ! !
! !! !
!!!!
! ! ! !
! !! !
! !! !
! !!!
!!! !
! !! !
!
! !
!
!! !!
!!
!!!!
!!
oROC
Genessee ValleyPark
Durand Eastman
Park
14612
1460614609
14616
14615
14620
14610
14621
14611
14613
14608
14605
14607
14619
14616
14604
14614
14627
45%–49%
55%–58%
≥59%
50%–54%
30%–44%
<30%
UNMAPPED
CITY OF ROCHESTER
Rochester Map: Prime Credits
39
The micro data map shows spatial patterns similar to the previous indicators. Once again, six centrally-locat-ed zip codes (14605, 14608, 14611, 14613, 14619, and 14621) are highlighted as areas containing the lowest shares of prime residents. In these zip codes, less than 30% of the credit economy is prime, the lowest band of prime values for the nation.

City of Rochester Micro Analytics and Maps
Data Source: FRBNY Consumer Credit Panel / Equifax
CREDIT QUALITY / SUBPRIME CREDITSThe SUBPRIME indicator measures the percent of the credit economy that has an Equifax Risk Score® 3.0 below 660.
52.3% of Rochester’s credit economy has a subprime risk score. Compare this with 32.0% for the U.S. and 27.3% for New York State in 2016 Q4.
Since 2006, this share dropped by more than three percentage points. However, this steady improvement may have abated in 2016.
201520142013 20162012201120092008 201020072006
40
The index of the SUBPRIME indicator shows a similar post-2007 trajectory of small but consistent credit quality improvement in the City, reflecting the declining share of subprime credit economy participants. Buffalo and Syracuse exhibit similar positive trajectories. With fresh and possibly revised data released in later years, we will check to see whether the steep decline in subprime credits between 2015 and 2016 is significant or simply noise.
80
85
90
95
100
105
Index of Subprime Credits Indicator
Inde
x (20
07 Q
4=10
0)
U.S. Rochester Buffalo Syracuse
201520142013 20162012201120092008 201020072006
Rochester Credit Economy: Subprime Credits, 2006–2016
51%
52%
53%
54%
55%
56%
52%
56%
55%
54%
53% 53% 53% 53% 53%
52% 52%

City of Rochester Micro Analytics and Maps
Data Source: FRBNY Consumer Credit Panel / Equifax
!!
! !
!!!!
!!!!
!!
!!!!
!!
!!!!
! !! !
! !!! ! ! ! ! !!
!!
! !
!!
! !! !
! !! !
! !
!!
!!
!!!!
!!!!
!!!!
! !
! !!!
!!!!
!!!!
!!!!
! !! ! ! ! !!
! !! ! ! ! ! !
!! ! ! !!! !
! ! ! ! ! ! ! ! ! !
!!!!
!!!!
!!! !
! !! !
!!
! !
!!!!
!!!!
! !!!
!!!!!!!!
! !! !
! !! ! ! !
! !! !
! !! ! !!
!!!!
! !!!!!!!
!!
! !
!!!!
!!!!
!!! !
!!!!
!!!!
!!
! !
! !
! !
!!! !
! !
!!
!!!!
! !
!!
!!
!!!!
!!!!
!!! !
!!!!
! !! ! ! ! ! ! ! ! ! !
! !
!!!!
!!!!
!!
!!!!
!!!!
!!!!
!!!!!!!!!!!!
!!!!!!
!!!!
!!
!!
!!
!!
!!!!
!!!!
!
!
! !!!
!!!!
!!!!
!!
!!!!
! !
!!
! !!!!!!!!!!!! !
!!
!!
!!! !! !
! !
! !! !
!!!!
!!
!!!!
!!!!
!!!!
!!!!
!!!!
!!!!
!!
!!
!!!! ! ! ! ! ! ! ! !
!!!!
!!!!
!!!!!!
!!!!!!!!!!
! !! !
! !! ! ! !
! !! !
! !! !
!!!!
!!
! ! ! ! ! !
! !! !
!!!!
! ! ! !
! !! !
! !! !
! !!!
!!! !
! !! !
!
! !
!
!! !!
!!
!!!!
!!
oROC
Genessee ValleyPark
Durand Eastman
Park
14612
1460614609
14616
14615
14620
14610
14621
14611
14613
14608
14605
14607
14619
14616
14604
14614
14627
29%–33%
40%–49%
≥50%
34%–39%
26%–28%
<26%
UNMAPPED
CITY OF ROCHESTER
Rochester Map: Subprime Credits
41
The subprime distribution by zip codes is shown in the zip code-level map of the City. Six zip codes previously highlighted by the other indicators as areas of high need are also prominent here: 14605, 14608, 14611, 14613, 14619, and 14621. In these zip codes, 50% or more of the credit economy is subprime, as shown by the darkest pink zip codes. These zip codes are among the highest-ranked zip codes in the U.S. for subprime credit scores.

City of Rochester Micro Analytics and Maps
Data Source: FRBNY Consumer Credit Panel / Equifax
CREDIT STRESS / TAXONOMYThe indicators so far focus on attributes that enhance the potential for individuals’ financial well-being. It is also useful to examine how well a community is doing in practice.
We created the credit stress indicators as follows: Every individual in the credit economy is placed into one of five mutually exclusive categories based on five quarters of their payment history using three filters:
� Delinquency status today � Most severe delinquency status over the previous four quarters � Number of quarters 60+ days late
Struggling History
Consistently Delinquent History
Was the person 60+ days past due on any credit obligation during any of the preceding four quarters?
Was the person 60+ days past due on any credit obligation during each of the preceding four quarters?
Payment Status as of Year-end Current 30-59 Days Late 60+ Days Late
Current On-time PayersImproved History
30-59 Days Late Good History
60+ Days Late Declining History
Good HistoryCurrent or only 30-59 days late
Improved HistoryImproved from 60+ days late to current or less than 60 days late
Declining HistoryDeteriorated from current or less than 59 days late to 60+ days late
Struggling HistoryWas 60+ days late for some, but not all, of the period
Consistently Delinquent HistoryWas 60+ days late the entire period
42

City of Rochester Micro Analytics and Maps
Data Source: FRBNY Consumer Credit Panel / Equifax
CREDIT STRESS / GOOD PAYMENT HISTORYThe GOOD PAYMENT HISTORY indicator is intended to gauge the share of the credit economy that most likely does not have a credit stress problem. To do so, we start with individuals current on all credit products and add in those who were never more than 59 days past due on any credit obligation during the previous five quarters of payment history. We included the latter group because some individuals may occasionally miss payment deadlines due to busy schedules, sickness, traveling, or other factors. Unless this pattern persists, however, they are more likely to be ‘sloppy payers’ rather than nascent credit stress cases.
43
Rochester Buffalo Syracuse U.S.0
20
40
60
80
100
Credit Stress, 2016 Q4
Good Improved Declining Struggling Consistently Delinquent
82%
1%
8%
74%
2%
11%
74%
2%
11%
71%
2%
12%
5%4%
6%
7%
7%
6%
8%
7%

City of Rochester Micro Analytics and Maps
Data Source: FRBNY Consumer Credit Panel / Equifax
CREDIT STRESS / GOOD PAYMENT HISTORY (continued)70.8% of Rochester’s credit economy had good payment history. Compare this with 81.4% for the U.S. and 83.2% for New York State in 2016 Q4.
Overall, the trend since 2007 has been positive in Rochester. Following a low of 65.9% in 2006 and 2007, the share of good payment history has been rising steadily.
The index of the GOOD PAYMENT HISTORY indicator shows a similar pattern of improvement. Note that the im-pact of the financial crisis is more visible in the trajectory for the U.S. than for the upstate New York cities. Since 2007 Q4, Rochester has seen an increase in its share of “Good Payers.” Compare this with the U.S., which only saw a return to pre-crisis levels in 2012, but the indicator has since been on the rise.
44
201520142013 20162012201120092008 201020072006
201520142013 20162012201120092008 201020072006
Rochester Credit Economy: Good Payment History, 2006–2016
50%
55%
60%
65%
70%
75%
71%
66% 66% 67% 68% 69% 70% 70% 70% 71%73%
90
95
100
105
110
115
Index of Good Payment History Indicator
Inde
x (20
07 Q
4=10
0)
U.S. Rochester Buffalo Syracuse

City of Rochester Micro Analytics and Maps
Data Source: FRBNY Consumer Credit Panel / Equifax
!!
! !
!!!!
!!!!
!!
!!!!
!!
!!!!
! !! !
! !!! ! ! ! ! !!
!!
! !
!!
! !! !
! !! !
! !
!!
!!
!!!!
!!!!
!!!!
! !
! !!!
!!!!
!!!!
!!!!
! !! ! ! ! !!
! !! ! ! ! ! !
!! ! ! !!! !
! ! ! ! ! ! ! ! ! !
!!!!
!!!!
!!! !
! !! !
!!
! !
!!!!
!!!!
! !!!
!!!!!!!!
! !! !
! !! ! ! !
! !! !
! !! ! !!
!!!!
! !!!!!!!
!!
! !
!!!!
!!!!
!!! !
!!!!
!!!!
!!
! !
! !
! !
!!! !
! !
!!
!!!!
! !
!!
!!
!!!!
!!!!
!!! !
!!!!
! !! ! ! ! ! ! ! ! ! !
! !
!!!!
!!!!
!!
!!!!
!!!!
!!!!
!!!!!!!!!!!!
!!!!!!
!!!!
!!
!!
!!
!!
!!!!
!!!!
!
!
! !!!
!!!!
!!!!
!!
!!!!
! !
!!
! !!!!!!!!!!!! !
!!
!!
!!! !! !
! !
! !! !
!!!!
!!
!!!!
!!!!
!!!!
!!!!
!!!!
!!!!
!!
!!
!!!! ! ! ! ! ! ! ! !
!!!!
!!!!
!!!!!!
!!!!!!!!!!
! !! !
! !! ! ! !
! !! !
! !! !
!!!!
!!
! ! ! ! ! !
! !! !
!!!!
! ! ! !
! !! !
! !! !
! !!!
!!! !
! !! !
!
! !
!
!! !!
!!
!!!!
!!
oROC
Genessee ValleyPark
Durand Eastman
Park
14612
1460614609
14616
14615
14620
14610
14621
14611
14613
14608
14605
14607
14619
14616
14604
14614
14627
76%–81%
84%–85%
≥86%
82%–83%
74%–75%
<74%
UNMAPPED
CITY OF ROCHESTER
Rochester Map: Good Payment History
45
The zip code micro data map again identifies a spatial pattern consistent with the other indicators. If anything, the micro differences here are even more evident than with the other indicators. Less than 74% of the credit economy participants had good payment histories in the six zip codes colored light green. These same zip codes had patterns of lower credit inclusion, decreased access to revolving credit, late payments, and subprime credit scores.

City of Rochester Micro Analytics and Maps
Data Source: FRBNY Consumer Credit Panel / Equifax
CREDIT STRESS / CONSISTENTLY DELINQUENT PAYMENT HISTORYThe CONSISTENTLY DELINQUENT PAYMENT HISTORY indicator is intended to measure the share of the credit economy that has more persistent credit problems. Individuals with consistently delinquent payment histories have had balances 60 or more days past due for the five most recent quarters.
12.4% of Rochester’s credit economy is consistently delinquent. Compare this value with 8.2% for the U.S. and 6.8% for New York State in 2016 Q4.
Rochester’s consistent delinquency rates have improved after a high of 14.8% in 2006. This improvement is not linear, and the pattern is similar to other upstate cities.
46
201520142013 20162012201120092008 201020072006
201520142013 20162012201120092008 201020072006
Rochester Credit Economy: Consistently Delinquent Payment History, 2006–2016
10%
11%
12%
13%
14%
15%
12%
15%
14%
13%
12%
14% 14%
13%
14%
11%
12%
The index of the CONSISTENTLY DELINQUENT PAYMENT HISTORY indicator shows that the trajectory has moved within a narrow band, though recently deteriorating a little. The trajectory for Rochester remains below the 2007 Q4 level. In 2016 Q4, fewer City of Rochester residents were consistently delinquent than prior to the recession in 2007.
70
80
90
100
110
120
Index of Consistently Delinquent Payment History Indicator
Inde
x (20
07 Q
4=10
0)
U.S. Rochester Buffalo Syracuse

City of Rochester Micro Analytics and Maps
Data Source: FRBNY Consumer Credit Panel / Equifax
!!
! !
!!!!
!!!!
!!
!!!!
!!
!!!!
! !! !
! !!! ! ! ! ! !!
!!
! !
!!
! !! !
! !! !
! !
!!
!!
!!!!
!!!!
!!!!
! !
! !!!
!!!!
!!!!
!!!!
! !! ! ! ! !!
! !! ! ! ! ! !
!! ! ! !!! !
! ! ! ! ! ! ! ! ! !
!!!!
!!!!
!!! !
! !! !
!!
! !
!!!!
!!!!
! !!!
!!!!!!!!
! !! !
! !! ! ! !
! !! !
! !! ! !!
!!!!
! !!!!!!!
!!
! !
!!!!
!!!!
!!! !
!!!!
!!!!
!!
! !
! !
! !
!!! !
! !
!!
!!!!
! !
!!
!!
!!!!
!!!!
!!! !
!!!!
! !! ! ! ! ! ! ! ! ! !
! !
!!!!
!!!!
!!
!!!!
!!!!
!!!!
!!!!!!!!!!!!
!!!!!!
!!!!
!!
!!
!!
!!
!!!!
!!!!
!
!
! !!!
!!!!
!!!!
!!
!!!!
! !
!!
! !!!!!!!!!!!! !
!!
!!
!!! !! !
! !
! !! !
!!!!
!!
!!!!
!!!!
!!!!
!!!!
!!!!
!!!!
!!
!!
!!!! ! ! ! ! ! ! ! !
!!!!
!!!!
!!!!!!
!!!!!!!!!!
! !! !
! !! ! ! !
! !! !
! !! !
!!!!
!!! ! ! ! ! !
! !! !
!!!!
! ! ! !
! !! !
! !! !
! !!!
!!! !
! !! !
!
! !
!
!! !!
!!
!!!!
!!
oROC
Genessee ValleyPark
Durand Eastman
Park
14612
1460614609
14616
14615
14620
14610
14621
14611
14613
14608
14605
14607
14619
14616
14604
14614
14627
8%
10%
≥11%
9%
7%
<7%
UNMAPPED
CITY OF ROCHESTER
Rochester Map: Consistently Delinquent Payment History
47
The micro data map shows a broader pattern of credit distress. In addition to the six centrally-located zip codes mentioned previously, zip codes 14609 and 14615 are also in the highest distress tier. Here, 11% or more of the population is consistently delinquent, as shown by the zip codes colored darkest orange.

48

4949
CREDIT PRODUCT SNAPSHOTS
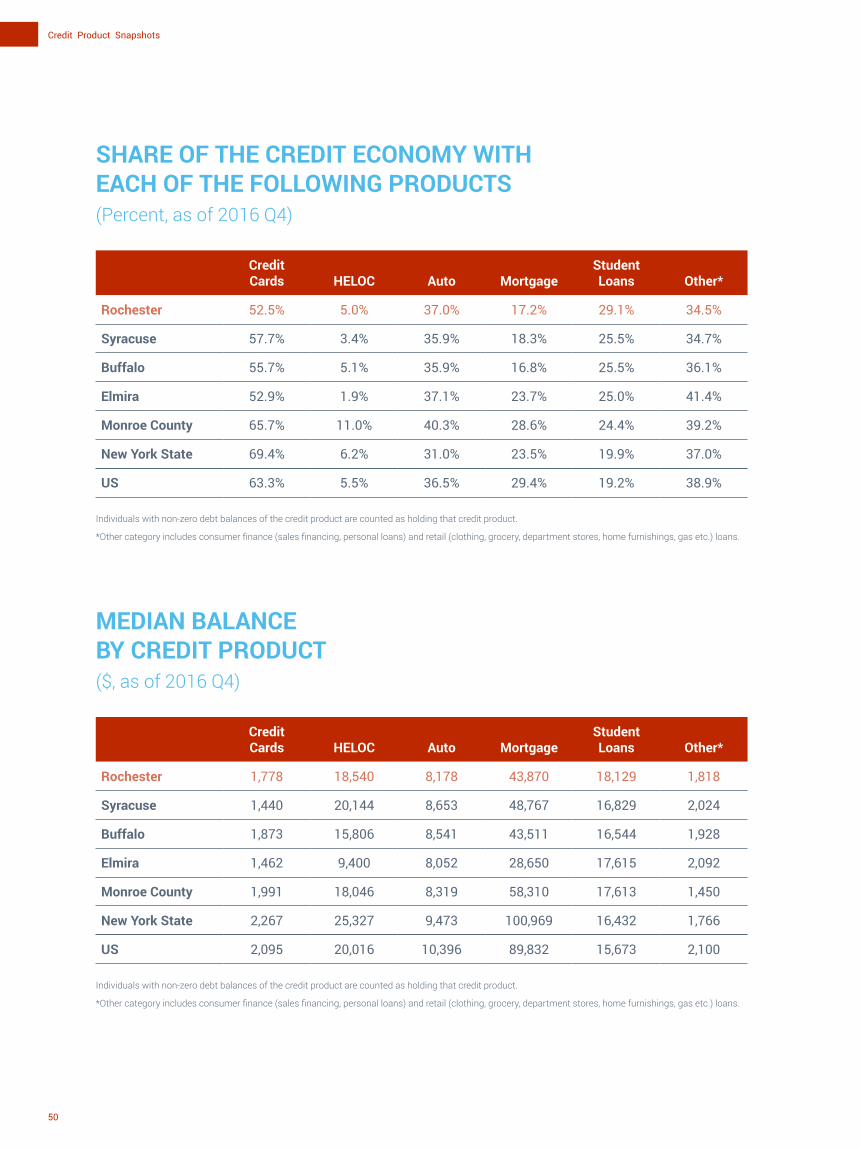
Credit Product Snapshots
SHARE OF THE CREDIT ECONOMY WITH EACH OF THE FOLLOWING PRODUCTS (Percent, as of 2016 Q4)
Credit Cards HELOC Auto Mortgage
Student Loans Other*
Rochester 52.5% 5.0% 37.0% 17.2% 29.1% 34.5%
Syracuse 57.7% 3.4% 35.9% 18.3% 25.5% 34.7%
Buffalo 55.7% 5.1% 35.9% 16.8% 25.5% 36.1%
Elmira 52.9% 1.9% 37.1% 23.7% 25.0% 41.4%
Monroe County 65.7% 11.0% 40.3% 28.6% 24.4% 39.2%
New York State 69.4% 6.2% 31.0% 23.5% 19.9% 37.0%
US 63.3% 5.5% 36.5% 29.4% 19.2% 38.9%
Individuals with non-zero debt balances of the credit product are counted as holding that credit product.
*Other category includes consumer finance (sales financing, personal loans) and retail (clothing, grocery, department stores, home furnishings, gas etc.) loans.
MEDIAN BALANCE BY CREDIT PRODUCT ($, as of 2016 Q4)
Credit Cards HELOC Auto Mortgage
Student Loans Other*
Rochester 1,778 18,540 8,178 43,870 18,129 1,818
Syracuse 1,440 20,144 8,653 48,767 16,829 2,024
Buffalo 1,873 15,806 8,541 43,511 16,544 1,928
Elmira 1,462 9,400 8,052 28,650 17,615 2,092
Monroe County 1,991 18,046 8,319 58,310 17,613 1,450
New York State 2,267 25,327 9,473 100,969 16,432 1,766
US 2,095 20,016 10,396 89,832 15,673 2,100
Individuals with non-zero debt balances of the credit product are counted as holding that credit product.
*Other category includes consumer finance (sales financing, personal loans) and retail (clothing, grocery, department stores, home furnishings, gas etc.) loans.
50

Credit Product Snapshots
SHARE OF PRODUCT HOLDERS THAT ARE 60+ DAYS DELINQUENT BY CREDIT PRODUCT (Percent, as of 2016 Q4)
Credit Cards HELOC Auto Mortgage
Student Loans Other*
Rochester 14.6% 1.9% 14.9% 4.4% 22.3% 19.3%
Syracuse 13.4% 0.8% 14.3% 5.0% 19.4% 17.8%
Buffalo 12.9% 0.5% 13.0% 4.2% 22.1% 15.5%
Elmira 15.0% 6.7% 11.7% 1.1% 17.9% 10.8%
Monroe County 7.7% 0.8% 6.2% 2.3% 12.5% 9.6%
New York State 9.0% 1.6% 5.5% 3.3% 12.2% 10.6%
US 9.0% 1.4% 7.9% 2.4% 15.8% 12.3%
This is a snapshot of 60 or more days delinquent; not the consistently delinquent indicator, which incorporates 5 quarters of payment history.
*Other category includes consumer finance (sales financing, personal loans) and retail (clothing, grocery, department stores, home furnishings, gas etc.) loans.
MEDIAN BALANCE 60+ DAYS DELINQUENT BY CREDIT PRODUCT ($, as of 2016 Q4)
Credit Cards HELOC Auto Mortgage
Student Loans Other*
Rochester 1,296 17,271 5,156 36,516 12,367 1,964
Syracuse 952 17,222 4,408 52,236 9,356 2,028
Buffalo 1,365 8,615 5,639 25,746 11,703 2,265
Elmira 1,341 22,039 4,414 60,393 13,867 1,680
Monroe County 1,809 24,430 4,829 57,080 11,392 2,201
New York State 2,005 49,443 6,086 131,274 12,155 2,607
US 1,501 30,244 5,880 72,169 11,243 2,274
This is a snapshot of 60 or more days delinquent; not the consistently delinquent indicator, which incorporates 5 quarters of payment history.
*Other category includes consumer finance (sales financing, personal loans) and retail (clothing, grocery, department stores, home furnishings, gas etc.) loans.
51

52

5353
ABOUT THE DATA

About the Data
DATA SOURCES
Credit The Community Credit measures have two data sources. For the credit values, we use the New York Fed Con-sumer Credit Panel/Equifax (CCP), which consists of quarterly credit report data for a unique longitudinal panel of individuals and households from the Equifax credit bureau. The panel is a five percent nationally representa-tive sample of all individuals with a social security number and a credit report. All information is anonymized. Data are available quarterly, and year-end (Q4) values are used to calculate all indicators unless otherwise noted. For more information about the CCP, see the Federal Reserve Bank of New York Staff Report, An Introduction to the FRBNY Consumer Credit Panel.
For 2016, our sample size was 11.16 million U.S. individuals. Because this panel is a five percent nationally rep-resentative sample, our sample represents approximately 223.26 million adult residents in the United States.
PopulationFor the U.S., state, and county population values needed to calculate the Included and Not-Included measures, we use adult population estimates provided by the U.S. Census Bureau’s 1-Year American Community Survey (ACS). Due to data unavailability, the values for 2016 use adult population estimates provided by the U.S. Census Bureau’s Population Estimates Program (PEP). In contrast, the Community Credit chart book and web interactive use PEP adult population estimates to calculate these measures for all years analyzed. We use the ACS in this report in order to maintain comparability to more granular geographies (city and zip code) that are not estimated by the PEP.
For city-level calculations of the Included and Not-Included measures, we use the 1-Year ACS. Due to data unavailability, the 2016 city-level estimates use the 2015 ACS adult population estimates, and the 2016 Elmira data source adult population estimates from the 2011-2015 5-Year ACS. For zip code-level calculations of these measures for 2016, we use adult population estimates from the 2011-2015 5-Year ACS.
MICRO DATA MAPS AND ANALYTICSThe City of Rochester refers to the Census-Designated Place (CDP) boundary (FIPS/ANSI code 3663000) and does not include any outlying areas. Likewise, the definitions of the City of Buffalo, the City of Syracuse, and Elmira City also refer to CDP boundaries. City-level data is aggregated using census block data sourced from the NY Fed CCP/Equifax credit records. Census blocks are matched to CDP using Census shape files.
Zip codes were sourced directly from the NY Fed CCP/Equifax credit records. Zip codes included in the maps are situated within or partially within the City of Rochester proper. The zip code maps exclude geographies with less than 50 observations in the CCP data as of 2016 Q4. As a result, we do not display values for two zip codes (14614 and 14627). Zip code 14614 is located close to Center City and has very little housing, and zip code 14627 contains the University of Rochester.
54

About the Data
When mapping the Community Credit indicators at the zip code level, we assign a range of percentages to each zip code instead of the calculated value. These ranges provide broader estimates that incorporate the potential variation within a community, which results from fewer observations being present in smaller geographies. To create nationally representative percentage breaks that hold up over time, we calculate each indicator for every zip code in the U.S. based on the fourth quarter of every year from 2005 to 2016. We then graph the distribu-tions for each indicator (omitting zip codes with fewer than 50 observations) and segment each into six per-centage breaks so that the share of zip codes in each percentage break is comparable. These ranges allow for consistency in reporting values for zip codes in other geographic areas and can be preserved across time.
COMMUNITY CREDIT INDICATORS
Calculation NotesCredit Economy: The credit economy for any geography is estimated as 20 times the number of people with a credit score in the CCP for that geography.
Adult Population: Adults are defined as age 18 and above.
Revolving Credit Products: An individual in the credit economy is counted as holding a revolving credit product if he or she has a bankcard account that has a credit limit greater than $0 and/or a revolving HELOC account that has a credit limit greater than $0. We do not include store-specific credit cards because their use is limited to specific products and services offered by the respective stores.
Utilization Rate: The utilization rate for an individual is computed as the sum of all revolving account balances divided by the sum of credit limits for all revolving accounts.
Credit Score Status: Credit score is the Equifax Risk Score 3.0. It was developed by Equifax and its values range from 280 to 850. Individuals with higher scores are viewed as better credit risks than those with lower scores. We use score classifications of less than 660 as subprime, scores between 660 and 719 as near prime, and scores 720 and higher as prime. However, classifications vary in the industry and in practice.
Indicator DefinitionsCredit Economy Included: CCP-based estimate of the number of individuals in the population with a credit score as of year-end (multiplied by 20) divided by the Census estimate of the population 18 or older for that year. The 2016 county and sub-county-level estimates, however, use a denominator of the 2015 adult population estimate due to data unavailability.
Credit Economy Not-Included: 100 percent minus the Included rate. Due to differences between CCP and Census data, this measure is bottom coded at zero percent. As for Credit Economy Included, 2016 county and sub-county level data use 2015 adult population estimates as the denominator.
Revolving Credit: Number of individuals with a revolving credit product, divided by the number of individuals in the credit economy.
55

About the Data
Utilization Limits: Number of individuals with a revolving credit product and a utilization rate of 30 percent or less, divided by the number of individuals in the credit economy.
On-Time Payers: Number of individuals in the credit economy who were current on all debt for the four quarters of 2016, divided by the number of individuals in the credit economy.
Prime Credits: Number of individuals in the credit economy with an Equifax Risk Score of 720 or higher, divided by the number of individuals in the credit economy.
Subprime Credits: Number of individuals in the credit economy with an Equifax Risk Score below 660, divided by the number of individuals in the credit economy.
Credit Stress: For each individual in the credit economy, credit stress status is determined based on year-end data. We first determine whether the person was 60+ days past due on any account as of year-end 2016. Then, using payment history on all accounts for each of the preceding four quarters (2015:Q4, 2016:Q1, 2016:Q2, and 2016:Q3), we categorize individuals based on the following three filters:
� Was the person 60+ days past due on any account as of year-end 2016 (i.e., at the end of 2016:Q4)? � Was the person 60+ days past due during any of the preceding four quarters? � Was the person 60+ days past due during all preceding four quarters?
Using these filters, we classify each individual in the credit economy at year-end 2016 into one of the following five mutually exclusive credit stress categories:
� Good History: Individual was never 60+ days past due during any of the quarters analyzed.
� Improved History: Individual was not 60+ days past due as of year-end 2016, but was 60+ days past due at some point during the preceding four quarters.
� Declining/ Newly Delinquent History: Individual was 60+ days past due as of year-end 2016, but was not 60+ days past due during any of the four preceding quarters.
� Struggling History: Individual was 60+ days past due as of year-end 2016 and was 60+ days past due during some, but not all, of the preceding four quarters.
� Consistently Delinquent History: Individual was 60+ days past due during all of the quarters analyzed.
Good HistoryCurrent or only 30-59 days late
Improved HistoryImproved from 60+ days late to current or less than 60 days late
Declining HistoryDeteriorated from current or less than 59 days late to 60+ days late
Struggling HistoryWas 60+ days late for some, but not all, of the period
Consistently Delinquent HistoryWas 60+ days late the entire period
56

About the Data
NOTES ON CLASS BREAK RANGES FOR THE MAPS For the sake of visual clarity, the class break ranges on the maps are displayed as whole integers. However, the underlying data are sorted and mapped using up to two decimal places (rounded up from six decimal places). So how do they correspond?
We used the following convention, which is best explained with an example. Assume the following class break ranges from the Not Included maps:
Shading on the Maps
Map Legend ≥15% 11%–14% 9%–10% 7%–8% 4%–6% <4% Unmapped
Corresponding Data Values for the Geography
≥15.00% 11.00– 14.99 9.00–10.99 7.00–8.99 4.00–6.99 <4.00%
For example, a county with the value of 3.88 will be in the class labeled <4 percent. A county with the value of 4.22 percent will be in the class labeled 4 to 6 percent. A county with the value of 6.99 percent will also be in the class labeled 4 to 6 percent. However, a county with the value of 7.01 percent will be in the class labeled 7 to 8 percent.
Data and calculations are subject to future revisions as data are updated.
57

“ This report is a great piece of work, and fills in significant gaps in the ability of local areas like ours to grapple with economic inequality. Good and nuanced metrics allow for communities to design better poverty mitiga-tion programs, to measure what works and what doesn’t, and to gauge whether our programs and resources deployments are moving any real needles. Geographically gross/aggregated statistics can’t adequately reflect the experience on the streets—in neighborhoods and other pockets of poverty.”
Heidi Zimmer-Meyer | President, Rochester Downtown Development Corporation
The level of detail regarding credit quality—particularly compared against the other neighboring urban centers in Buffalo and Syracuse—is fascinating and informative.
Adam Ciminello | Executive Coordinator, The Financial Clinic
“ This report will be incredibly helpful in the access to affordable lending research and advocacy work that Empire Justice Center is doing now, and will be undertaking in the future. We deeply appreciate the New York Federal Reserve’s focus on these critical issues. We will be using this information extensively as we seek to advance initiatives focused on making small dollar loans, and safe and affordable credit products, more accessible to low income individuals and communities of color in the coming year.”
Ruhi Maker | Senior Attorney, Empire Justice Center
“ This kind of reporting holds so much promise...by analyzing data that is not otherwise readily available, the Federal Reserve Bank of New York offers policymakers a new and meaningful tool. Local government leaders can use these reports to explore neighborhood dynamics of growth, resilience, and risk to design service strategies that address inclusive growth.”
Nicky Grist | Principal, Cities for Financial Empowerment Fund
“ Thanks so much to the Federal Reserve Bank of New York for providing more localized credit data and analysis for residents of the City of Rochester. This richly detailed information will help our community understand and address family self-sufficiency and financial education at the city and neighborhood level.”
Jennifer Leonard | President & CEO, Rochester Area Community Foundation
For more information, contact:
Kausar Hamdani, Ph.D. SVP and Senior Advisor [email protected]
Claire Kramer Mills, Ph.D. AVP and Community Affairs Officer [email protected]
Javier Silva Associate Director [email protected]