CITY OF MORENO VALLEY · Gabriel Diaz, Associate Planner, Planning Division, City of Moreno Valley...
91
Final CITY OF MORENO VALLEY Greenhouse Gas Analysis February 2012 Prepared for: City of Moreno Valley 14177 Frederick Street Moreno Valley, California 92552 Prepared by: formerly PBS&J, an Atkins Company 650 East Hospitality Lane, Suite 450 San Bernardino, California 92408
Transcript of CITY OF MORENO VALLEY · Gabriel Diaz, Associate Planner, Planning Division, City of Moreno Valley...
Final
CITY OF MORENO VALLEY
Greenhouse Gas Analysis
February 2012
Prepared for:
City of Moreno Valley
14177 Frederick Street
Moreno Valley, California 92552
Prepared by:
formerly PBS&J, an Atkins Company
650 East Hospitality Lane, Suite 450
San Bernardino, California 92408

A C K N O W L E D G E M E N T S
CITY OF MORENO VALLEY i GREENHOUSE GAS ANALYSIS
ACKNOWLEDGEMENTS
This Greenhouse Gas Analysis is the outcome of work contributed by numbers individuals. We wish to
thank all individuals who contributed to the success of this report, in particular:
■ John Terell, Planning Official, Planning Division, City of Moreno Valley
■ Chris Ormsby, Senior Planner, Planning Division, City of Moreno Valley
■ Gabriel Diaz, Associate Planner, Planning Division, City of Moreno Valley
■ John Kerenyi, Senior Traffic Engineer, City of Moreno Valley
■ Chauncy Tou, Local Government Partnerships, Customer Programs, Southern California Gas
Company
■ Laurel Rothschild, Program Manager, The Energy Coalition
C O N T E N T S
CITY OF MORENO VALLEY ii GREENHOUSE GAS ANALYSIS
CONTENTS
EXECUTIVE SUMMARY..........................................................................................................................................VI
CHAPTER 1 INTRODUCTION ....................................................................................................................... 1-1
1.1 Purpose............................................................................................................................1-2
1.2 Goals ................................................................................................................................1-2
1.3 Relationship to the City’s General Plan ...........................................................................1-2
1.4 Background ......................................................................................................................1-3
1.5 Greenhouse Gases ...........................................................................................................1-3
1.6 Regulatory Setting ...........................................................................................................1-4
CHAPTER 2 METHODOLOGY ...................................................................................................................... 2-1
2.1 Overview..........................................................................................................................2-2
2.2 Calculation of GHGs .........................................................................................................2-3
CHAPTER 3 GREENHOUSE GAS EMISSIONS INVENTORY............................................................................. 3-1
3.1 2010 Municipal Emissions Inventory ...............................................................................3-2
3.2 2010 Community-Wide Emissions Inventory...................................................................3-6
3.3 2020 Business-as-Usual Community-Wide Emissions Inventory .....................................3-9
3.4 2020 Reduction Target ..................................................................................................3-11
3.5 Emissions Comparison by Year ......................................................................................3-12
CHAPTER 4 GHG EMISSIONS REDUCTION PROGRAMS AND REGULATIONS................................................ 4-1
4.1 Existing Moreno Valley Programs ....................................................................................4-3
4.2 Transportation .................................................................................................................4-6
4.3 Energy ............................................................................................................................4-12
4.4 Area Source....................................................................................................................4-23
4.5 Water .............................................................................................................................4-25
4.6 Solid Waste ....................................................................................................................4-28
CHAPTER 5 TOTAL ESTIMATED REDUCTIONS ............................................................................................. 5-1
CHAPTER 6 CONCLUSION ........................................................................................................................... 6-1
CHAPTER 7 IMPLEMENTATION .................................................................................................................. 7-1
CHAPTER 8 REFERENCES ............................................................................................................................ 8-1
TABLES
Table ES-1 Projected GHG Emissions Comparison............................................................................................ vii
Table 3-1 2010 Municipal Data Inputs .......................................................................................................... 3-2
Table 3-2 2010 Total Municipal Emissions.................................................................................................... 3-3
Table 3-3 2010 Municipal Emissions and Costs by Department ................................................................... 3-4
Table 3-4 Estimated Municipal Energy Costs................................................................................................ 3-5

C O N T E N T S
CITY OF MORENO VALLEY iii GREENHOUSE GAS ANALYSIS
Table 3-5 2010 Community-Wide Data Inputs ............................................................................................. 3-6
Table 3-6 2010 Community-wide GHG Emissions by Source ....................................................................... 3-7
Table 3-7 2010 Community-wide GHG Emissions by Land Use ................................................................... 3-8
Table 3-8 2020 BAU Community-Wide Data Inputs...................................................................................... 3-9
Table 3-9 2020 BAU GHG Emissions by Source.......................................................................................... 3-10
Table 3-10 2020 BAU Community-wide GHG Emissions by Land Use ......................................................... 3-11
Table 3-11 2020 GHG Emissions Reduction Target....................................................................................... 3-12
Table 3-12 GHG Emissions by Source............................................................................................................ 3-12
Table 3-13 2020 GHG Emissions Reduction Target....................................................................................... 3-13
Table 4-1 Municipal EECBG Projects ............................................................................................................. 4-4
Table 4-2 General Plan Polices Related to Reducing GHG Emissions ........................................................... 4-6
FIGURES
Figure 3-1 2010 Municipal Emissions by Source (metric tons CO2e) ............................................................. 3-3
Figure 3-2 2010 Comparison of Municipal Emissions Generated by Department (MT CO2e) ....................... 3-5
Figure 3-3 2010 Emissions Generated by Source........................................................................................... 3-7
Figure 3-4 2010 GHG Emissions by Land Use................................................................................................. 3-8
Figure 3-5 2020 BAU Emissions Generated by Source (MT CO2e) ............................................................... 3-10
Figure 3-6 2020 BAU GHG Emissions by Land Use ....................................................................................... 3-11
A C R O N Y M S
CITY OF MORENO VALLEY iv GREENHOUSE GAS ANALYSIS
ACRONYMS
AB 32 Assembly Bill 32, The California Climate Change Solutions Act of 2006
ATMS Advanced Transportation Management Systems
ADWF Average Daily Wastewater Flow
BAU Business-As-Usual scenario
BTU British thermal unit
CARB California Air Resources Board
CAA Clean Air Act
CAAQS California Ambient Air Quality Standards
Cal EPA California Environmental Protection Agency
CAS California Climate Adaption Strategy
CAT Climate Action Team
CCAT California Climate Action Team
CCAR California Climate Action Registry
CCR California Code of Regulations
CCTP Climate Change Technology Program
CEC California Energy Commission
CEQA California Environmental Quality Act
CFC Chlorofluorocarbons
C2F6 Hexafluoroethane
CF4 Carbon Tetrafluoride
CH4 Methane
CIWMB California Integrated Waste Management Board
CO Carbon Monoxide
CO2 Carbon Dioxide
CO2e Carbon dioxide Equivalent
DPM Diesel Particulate Matter
EMFAC2007 On-Road Emission Factors published by the CARB in 2007
EMWD Eastern Metropolitan Water District
GCC Global Climate Change
GHG Greenhouse Gas
GWh Gigawatt Hours
GWP Global Warming Potential
HFC Hydrofluorocarbons
A C R O N Y M S
CITY OF MORENO VALLEY v GREENHOUSE GAS ANALYSIS
HFC-23 Trifluoromethane
HFC-134 Hydrofluorocarbon 134
HFC-152a Difluoroethane
IPCC Intergovernmental Panel on Climate Change
Lbs/year Pounds per Year
LEED Leadership in Energy and Environmental Design
MMBTU Million BTUs
MMT Million Metric Tons
MMT CO2e Million Metric Tons Carbon Dioxide Equivalent
MVU Moreno Valley Utility
MWD Metropolitan Water District of Southern California
MWh/year Megawatt hours per year
MWh Megawatt hours
N2O Nitrous Oxide
O3 Ozone
OPR California Office of Planning and Research
PSD Prevention of Significant Deterioration
SCAG Southern California Association of Governments
SCAQMD South Coast Air Quality Management District
SCE Southern California Edison
SCG Southern California Gas Company
SIP State Implementation Plan
SF6 Sulfur Hexafluoride
SRI Solar Reflective Index
UNFCCC United Nations Framework Convention on Climate Change
URBEMIS 2007 Urban Emissions Model, version 9.2 published in June 2007
USEPA United States Environmental Protection Agency
VMT Vehicle miles traveled
E X E C U T I V E S U M M A R Y
CITY OF MORENO VALLEY vi GREENHOUSE GAS ANALYSIS
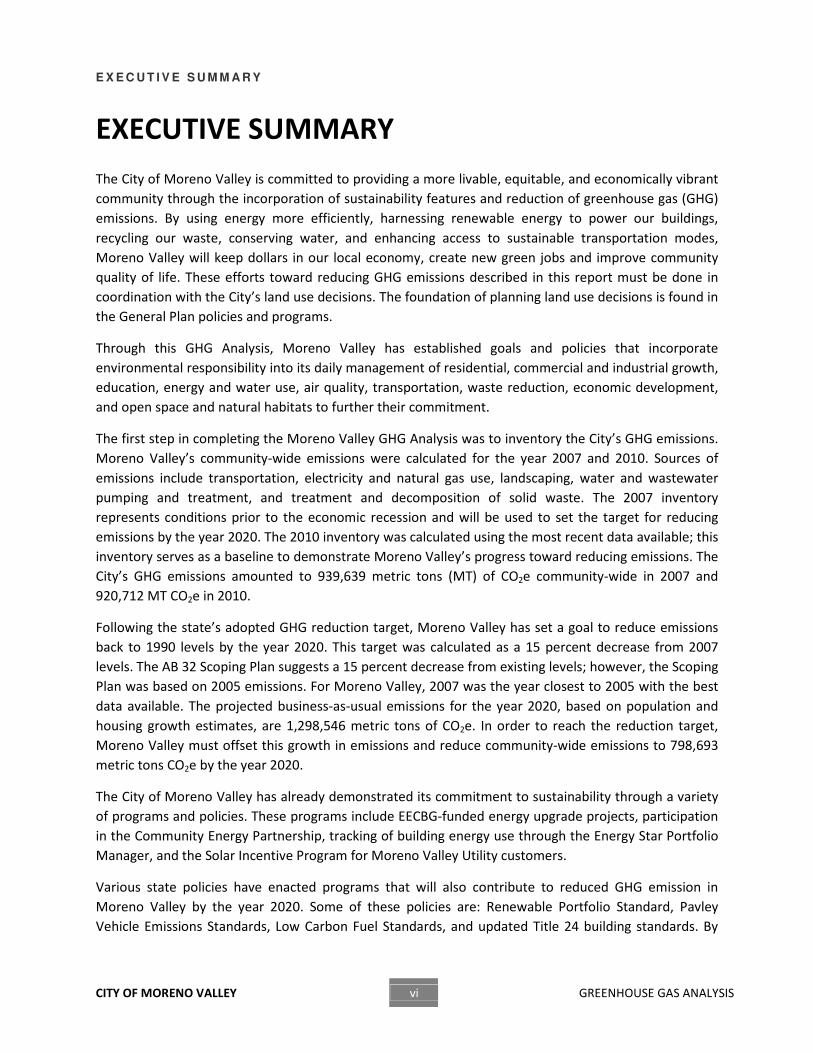
EXECUTIVE SUMMARY
The City of Moreno Valley is committed to providing a more livable, equitable, and economically vibrant
community through the incorporation of sustainability features and reduction of greenhouse gas (GHG)
emissions. By using energy more efficiently, harnessing renewable energy to power our buildings,
recycling our waste, conserving water, and enhancing access to sustainable transportation modes,
Moreno Valley will keep dollars in our local economy, create new green jobs and improve community
quality of life. These efforts toward reducing GHG emissions described in this report must be done in
coordination with the City’s land use decisions. The foundation of planning land use decisions is found in
the General Plan policies and programs.
Through this GHG Analysis, Moreno Valley has established goals and policies that incorporate
environmental responsibility into its daily management of residential, commercial and industrial growth,
education, energy and water use, air quality, transportation, waste reduction, economic development,
and open space and natural habitats to further their commitment.
The first step in completing the Moreno Valley GHG Analysis was to inventory the City’s GHG emissions.
Moreno Valley’s community-wide emissions were calculated for the year 2007 and 2010. Sources of
emissions include transportation, electricity and natural gas use, landscaping, water and wastewater
pumping and treatment, and treatment and decomposition of solid waste. The 2007 inventory
represents conditions prior to the economic recession and will be used to set the target for reducing
emissions by the year 2020. The 2010 inventory was calculated using the most recent data available; this
inventory serves as a baseline to demonstrate Moreno Valley’s progress toward reducing emissions. The
City’s GHG emissions amounted to 939,639 metric tons (MT) of CO2e community-wide in 2007 and
920,712 MT CO2e in 2010.
Following the state’s adopted GHG reduction target, Moreno Valley has set a goal to reduce emissions
back to 1990 levels by the year 2020. This target was calculated as a 15 percent decrease from 2007
levels. The AB 32 Scoping Plan suggests a 15 percent decrease from existing levels; however, the Scoping
Plan was based on 2005 emissions. For Moreno Valley, 2007 was the year closest to 2005 with the best
data available. The projected business-as-usual emissions for the year 2020, based on population and
housing growth estimates, are 1,298,546 metric tons of CO2e. In order to reach the reduction target,
Moreno Valley must offset this growth in emissions and reduce community-wide emissions to 798,693
metric tons CO2e by the year 2020.
The City of Moreno Valley has already demonstrated its commitment to sustainability through a variety
of programs and policies. These programs include EECBG-funded energy upgrade projects, participation
in the Community Energy Partnership, tracking of building energy use through the Energy Star Portfolio
Manager, and the Solar Incentive Program for Moreno Valley Utility customers.
Various state policies have enacted programs that will also contribute to reduced GHG emission in
Moreno Valley by the year 2020. Some of these policies are: Renewable Portfolio Standard, Pavley
Vehicle Emissions Standards, Low Carbon Fuel Standards, and updated Title 24 building standards. By
E X E C U T I V E S U M M A R Y
CITY OF MORENO VALLEY vii GREENHOUSE GAS ANALYSIS
supporting the state in the implementation of these measures, Moreno Valley will experience
substantial emissions reductions.
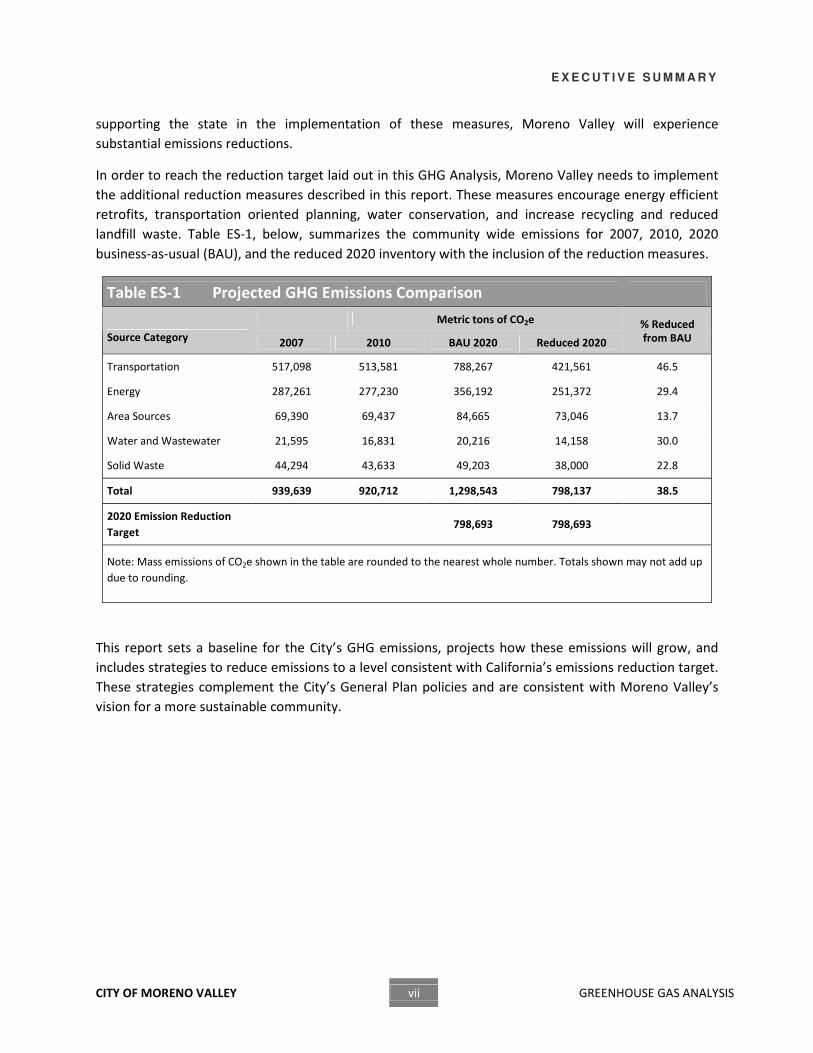
In order to reach the reduction target laid out in this GHG Analysis, Moreno Valley needs to implement
the additional reduction measures described in this report. These measures encourage energy efficient
retrofits, transportation oriented planning, water conservation, and increase recycling and reduced
landfill waste. Table ES-1, below, summarizes the community wide emissions for 2007, 2010, 2020
business-as-usual (BAU), and the reduced 2020 inventory with the inclusion of the reduction measures.
Table ES-1 Projected GHG Emissions Comparison
Metric tons of CO2e
Source Category 2007 2010 BAU 2020 Reduced 2020
% Reduced from BAU
Transportation 517,098 513,581 788,267 421,561 46.5
Energy 287,261 277,230 356,192 251,372 29.4
Area Sources 69,390 69,437 84,665 73,046 13.7
Water and Wastewater 21,595 16,831 20,216 14,158 30.0
Solid Waste 44,294 43,633 49,203 38,000 22.8
Total 939,639 920,712 1,298,543 798,137 38.5
2020 Emission Reduction
Target
798,693 798,693
Note: Mass emissions of CO2e shown in the table are rounded to the nearest whole number. Totals shown may not add up
due to rounding.
This report sets a baseline for the City’s GHG emissions, projects how these emissions will grow, and
includes strategies to reduce emissions to a level consistent with California’s emissions reduction target.
These strategies complement the City’s General Plan policies and are consistent with Moreno Valley’s
vision for a more sustainable community.


CITY OF MORENO VALLEY 1-1 GREENHOUSE GAS ANALYSIS
Chapter 1 Introduction
C H A P T E R 1 I N T R O D U C T I O N
CITY OF MORENO VALLEY 1-2 GREENHOUSE GAS ANALYSIS
The City of Moreno Valley is committed to providing a more livable, equitable and economically vibrant
community through the reduction of greenhouse gas (GHG) emissions. By using energy more efficiently,
harnessing renewable energy to power our buildings, recycling our waste, and enhancing access to
sustainable transportation modes, we can keep dollars in our local economy, create new green jobs and
improve community quality of life.
This section describes the purpose and goals of this report; describes the relationship of the report to
the current City General Plan; provides background information on GHG emissions; and summarizes the
regulatory framework surrounding GHG emissions and climate change.
1.1 Purpose The analysis was completed under the premise that the City and the community it represents are
uniquely capable of addressing emissions associated with sources under the City’s jurisdiction. The City’s
emission reduction efforts should coordinate with the state strategies in order to accomplish emission
reductions in an efficient and cost effective manner. The City developed this document with the
following purposes in mind:
■ Create a GHG baseline from which to benchmark GHG reductions;
■ Provide a plan that is consistent with and complementary to: the GHG emissions reduction
efforts being conducted by the State of California through the Global Warming Solutions Act (AB
32); the Federal Government through the actions of the Environmental Protection Agency; and
the global community through the Kyoto Protocol; and
■ Guide the development, enhancement, and implementation of actions that reduce GHG
emissions.
1.2 Goals With regards to reducing GHG emissions, the City identified the following achievement goals:
■ Provide a list of specific measures that will reduce GHG emissions from community sources and
municipal operations.
■ Reduce emissions attributable to Moreno Valley to levels at or below 1990 GHG emissions by
year 2020 consistent with the target reductions of AB 32.
1.3 Relationship to the City’s General Plan The current Moreno Valley General Plan discusses the City’s vision and the realization of this vision the
following areas: Community Development; Economic Development; Parks, Recreation, and Open
Spaces; Circulation; Safety; Conservation; and Housing. Many of the policies of the General Plan
indirectly reduce GHG emissions by conserving energy, promoting the use of alternative transportation,
1 . 4 B A C K G R O U N D
CITY OF MORENO VALLEY 1-3 GREENHOUSE GAS ANALYSIS
and reducing waste sent to landfills. These policies that are related to reducing GHG emissions are
summarized in Section 4.1.
1.4 Background This report achieves the purpose and goals described above by providing: an analysis of GHG emissions
and sources attributable to the City of Moreno Valley; estimates on how those emissions are expected
to increase to 2020; and recommended policies and actions that can reduce GHG emissions to meet
State, Federal and International targets.
The following discussion includes a brief overview regarding the nature of GHG emissions, the climate
change impacts anticipated within the City of Moreno Valley, and the international, federal, state, and
local regulatory framework designed to address climate change.
1.5 Greenhouse Gases Parts of the Earth’s atmosphere act as an insulating blanket, trapping sufficient solar energy to keep the
global average temperature within a suitable range. The 'blanket' is a collection of atmospheric gases
called 'greenhouse gases' or GHGs based on the idea that these gases also trap heat like the glass walls
of a greenhouse. These gases, mainly water vapor, carbon dioxide, methane, nitrous oxide, ozone, and
chlorofluorocarbons (CFCs) all act as effective global insulators, reflecting back to earth infrared
radiation. Human activities, such as producing electricity and driving internal combustion vehicles, emit
these gases in the atmosphere.
Due to the successful global bans on chlorofluorocarbons (primarily used as refrigerants, aerosol
propellants and cleaning solvents), Moreno Valley does not generate significant emissions of these
GHGs and therefore, they are not considered any further in this analysis. This also includes other
synthesized gases such as HFCs and CF4 which have been banned and are no longer available on the
market. Because of the ban, Moreno Valley will not generate emissions of these GHGs and therefore,
they are not considered any further in this analysis.
Another GHG with a high global warming potential is sulfur hexafluoride, which is mainly used as a
gaseous dielectric medium in electric switchgear of high voltage electric transmission lines and medical
use in retinal detachment surgery and ultrasound imaging. In both uses, sulfur hexafluoride is not
released to the atmosphere and therefore, it is not considered further in this analysis.
Because GHGs have variable potencies, a common unit of measurement, the carbon dioxide equivalent
(CO2e) is used to report the combined potency from all of the GHGs. The potency each GHG has in the
atmosphere is measured as a combination of the volume of its emissions and its global warming
C H A P T E R 1 I N T R O D U C T I O N
CITY OF MORENO VALLEY 1-4 GREENHOUSE GAS ANALYSIS
potential1, and is expressed as a function of the potency with respect to the same mass of carbon
dioxide. Thus, by multiplying the individual gas by its global warming potential, the emissions of each
individual gas can be measured in terms of metric tons of CO2e (MT CO2e).
1.6 Regulatory Setting In an effort to stabilize GHG emissions and reduce impacts associated with climate change, international
agreements, as well as federal and State actions were implemented beginning as early as 1988. The
international, federal, State, regional, and local government agencies discussed below work jointly, as
well as individually, to address GHG emissions through legislation, regulations, planning, policy-making,
education, and a variety of programs.
International and Federal
KYOTO PROTOCOL The United States participated in the United Nations Framework Convention on Climate Change
(UNFCCC) signed on March 21, 1994. The Kyoto Protocol is a treaty made under the UNFCCC and was
the first international agreement to regulate GHG emissions. It has been estimated that if the
commitments outlined in the Kyoto Protocol are met, global GHG emissions could be reduced by an
estimated 5 percent from 1990 levels during the first commitment period of 2008–2012 (UNFCCC 1997).
It should be noted that although the United States is a signatory to the Kyoto Protocol, Congress has not
ratified the Protocol and the United States is not bound by the Protocol’s commitments.
In anticipation of providing an updated international treaty for the reduction of GHG emissions,
representatives from 170 countries met in Copenhagen in December 2009 to ratify an updated UNFCCC
agreement (Copenhagen Accord). The Copenhagen Accord, a voluntary agreement between the United
States, China, India, and Brazil, recognizes the need to keep global temperature rise to below 2 0C and
obliges signatories to establish measures to reduce GHG emissions and prepare to help poorer countries
in adapting to climate change. The countries met again in Cancun in December 2010 and adopted the
Cancun Agreements, which reinforces and builds upon the Copenhagen Accord. The nations agreed to
recognize country targets, develop low-carbon development plans and strategies, and report inventories
annually. In addition, agreements were made regarding financing for developing countries and
technology support and coordination among all nations. The next conference of the parties is scheduled
for December 2011 in South Africa.
CLIMATE CHANGE TECHNOLOGY PROGRAM The United States has opted for a voluntary and incentive-based approach toward emissions reductions
in lieu of the Kyoto Protocol’s mandatory framework. The Climate Change Technology Program (CCTP) is
1 The potential of a gas or aerosol to trap heat in the atmosphere.
1 . 6 R E G U L A T O R Y S E T T I N G
CITY OF MORENO VALLEY 1-5 GREENHOUSE GAS ANALYSIS
a multi-agency research and development coordination effort (led by the Secretaries of Energy and
Commerce) that is charged with carrying out the President’s National Climate Change Technology
Initiative.
UNITED STATES ENVIRONMENTAL PROTECTION AGENCY The United States Environmental Protection Agency (USEPA) is responsible for
implementing federal policy to address global climate change. The Federal government
administers a wide array of public-private partnerships to reduce GHG intensity
generated by the United States. These programs focus on energy efficiency, renewable energy, methane
and other non-carbon dioxide gases, agricultural practices, and implementation of technologies to
achieve GHG reductions. The USEPA implements several voluntary programs that substantially
contribute to the reduction of GHG emissions.
In Massachusetts v. Environmental Protection Agency (Docket No. 05–1120), argued November 29,
2006 and decided April 2, 2007, the U.S. Supreme Court held that the USEPA has authority to regulate
GHG, and the USEPA's reasons for not regulating this area did not fit the statutory requirements. As
such, the U.S. Supreme Court ruled that the USEPA should be required to regulate carbon dioxide and
other GHGs as pollutants under Section 202(a)(1) of the federal Clean Air Act (CAA).
EPA issued a Final Rule for mandatory reporting of GHG emissions in October 2009. This Final Rule
applies to fossil fuel suppliers, industrial gas suppliers, direct GHG emitters, and manufactures of heavy-
duty and off-road vehicles and vehicle engines, and requires annual reporting of emissions. The Final
Rule was effective December 29, 2009, with data collection to begin on January 1, 2010, and the first
annual reports due in September 2011. This rule does not regulate the emission of GHGs—it only
requires monitoring and reporting of GHG emissions for those sources above certain thresholds (EPA
2009). EPA adopted a Final Endangerment Finding for the six defined GHGs on December 7, 2009. The
Endangerment Finding is required before EPA can regulate GHG emissions under Section 202(a)(1) of
the CAA in fulfillment of the U.S. Supreme Court decision.
On May 13, 2010, the USEPA issued a final rule that establishes a common sense approach to addressing
GHG emissions from stationary sources under the CAA permitting programs. This final rule sets a
threshold of 75,000 tons per year for GHG emissions. New and existing industrial facilities that meet or
exceed that threshold will require a permit under the New Source Review Prevention of Significant
Deterioration (PSD) and title V Operating Permit programs. This rule took effect on January 2, 2011.
State
CALIFORNIA AIR RESOURCES BOARD The California Air Resources Board, a part of the
California EPA (CalEPA) is responsible for the
coordination and administration of both federal and state air pollution control programs within
C H A P T E R 1 I N T R O D U C T I O N
CITY OF MORENO VALLEY 1-6 GREENHOUSE GAS ANALYSIS
California. In this capacity, CARB conducts research, sets state ambient air quality standards (California
Ambient Air Quality Standards (CAAQS)), compiles emission inventories, develops suggested control
measures, and provides oversight of local programs. CARB establishes emissions standards for motor
vehicles sold in California, consumer products (such as hairspray, aerosol paints, and barbecue lighter
fluid), and various types of commercial equipment. It also sets fuel specifications to further reduce
vehicular emissions. CARB has primary responsibility for the development of California’s State
Implementation Plan (SIP), for which it works closely with the federal government and the local air
districts.
EXECUTIVE ORDER S-3-05 California Governor Arnold Schwarzenegger announced on June 1, 2005, through Executive Order S-3-
05, the following GHG emission reduction targets:
■ By 2010, California shall reduce GHG emissions to 2000 levels;
■ By 2020, California shall reduce GHG emissions to 1990 levels; and
■ By 2050, California shall reduce GHG emissions to 80 percent below 1990 levels.
The first California Climate Action Team (CCAT) Report to the Governor in 2006 contained
recommendations and strategies to help meet the targets in Executive Order S-3-05. In April 2010, the
Draft California Action Team (CAT) Biennial Report expanded on the policy oriented 2006 assessment.
The new information detailed in the CAT Assessment Report includes development of revised climate
and sea-level projections using new information and tools that have become available in the last two
years; and an evaluation of climate change within the context of broader social changes, such as land-
use changes and demographic shifts 2. The action items in the report focus on the preparation of the
Climate Change Adaptation Strategy, required by Executive Order S-13-08, described below.
ASSEMBLY BILL 1493, CLEAN CAR STANDARDS
AB 1493 (also known as the Pavley Bill, in reference to its author Fran Pavley) was enacted in 2002 and
requires the “maximum feasible and cost effective reduction” of GHGs from automobiles and light-duty
trucks. Subsequently, in 2004, CARB approved the “Pavley I” regulations limiting the amount of GHGs
that may be released from new passenger automobiles beginning with model year 2009 through 2016;
these regulations would reduce emissions by 30% from 2002 levels by 2016. The second set of
regulations (“Pavley II”) is currently in development and will cover model years 2017 through 2025 in
order to reduce emissions by 45% by the year 2020. The automotive industry legally challenged the bill
claiming that the federal gas mileage standards preempted these state regulations. In 2005, California
filed a waiver request to the U.S. EPA in order to implement the GHG standards and in March of 2008,
the U.S. EPA denied the request. However, in June 2009, the decision was reversed and the U.S. EPA
2 California Environmental Protection Agency, Climate Action Team Report to Governor Schwarzenegger and
the Legislature, March 2006.
1 . 6 R E G U L A T O R Y S E T T I N G
CITY OF MORENO VALLEY 1-7 GREENHOUSE GAS ANALYSIS
granted California the authority to implement the GHG reduction standards for passenger cars, pickup
trucks, and sport utility vehicles.
In September 2009, CARB adopted amendments to the “Pavley I” regulations that cemented California’s
enforcement of the Pavley rule starting in 2009 while providing vehicle manufacturers with new
compliance flexibility. The amendments also allowed California to coordinate its rules with the federal
rules for passenger vehicles.
ASSEMBLY BILL 32, THE CALIFORNIA GLOBAL WARMING SOLUTIONS ACT OF 2006 In 2006, the California State Legislature adopted AB 32, the California
Global Warming Solutions Act of 2006. AB 32 focuses on reducing GHG
in California. GHGs as defined under AB 32 include carbon dioxide,
methane, nitrous oxide, hydrofluorocarbons, perfluorocarbons, and
sulfur hexafluoride. AB 32 required CARB to adopt rules and regulations
that would achieve GHG emissions equivalent to 1990 statewide levels by 2020. On or before June 30,
2007, CARB was required to publish a list of discrete early action GHG emission reduction measures that
would be implemented by 2010. The law further required that such measures achieve the maximum
technologically feasible and cost effective reductions in GHGs from sources or categories of sources to
achieve the statewide GHG emissions limit for 2020.
CARB published its final report for Proposed Early Actions to Mitigate Climate Change in California in
October 2007. This report described recommendations for discrete early action measures to reduce
GHG emissions. The measures included are part of California’s strategy for achieving GHG reductions
under AB 32. Three new regulations are proposed to meet the definition of “discrete early action GHG
reduction measures,” which include the following: a low carbon fuel standard; reduction of HFC-134a
emissions from non-professional servicing of motor vehicle air conditioning systems; and improved
landfill methane capture3. CARB estimates that by 2020, the reductions from those three measures
would be approximately 13-26 million metric tons (MMT) CO2e.
Under AB 32, CARB has the primary responsibility for reducing GHG emissions. CARB has published a
staff report titled California 1990 GHG Emissions Level and 2020 Emissions Limit4 that determined the
statewide levels of GHG emissions in 1990 to be 427 million MT CO2e. Additionally, in December 2008,
CARB adopted the Climate Change Scoping Plan, which outlines the state’s strategy to achieve the 2020
GHG limit. This Scoping Plan proposes a comprehensive set of actions designed to reduce overall GHG
emissions in California, improve the environment, reduce dependence on oil, diversify energy sources,
save energy, create new jobs, and enhance public health. The plan emphasizes a cap-and-trade
program, but also includes the discrete early actions.
3 California EPA- California Air Resources Board, Proposed Early Actions to Mitigate Climate Change in California,
October 2007. 4 California EPA- California Air Resources Board, California 1990 GHG Emissions Level and 2020 Emissions Limit,
November 2007.
C H A P T E R 1 I N T R O D U C T I O N
CITY OF MORENO VALLEY 1-8 GREENHOUSE GAS ANALYSIS
SENATE BILL 97 (SB 97) SB 97, enacted in 2007, amends the CEQA statute to clearly establish that GHG emissions and the effects
of GHG emissions are appropriate subjects for CEQA analysis. It directed the California Office of Planning
and Research (OPR) to develop draft CEQA Guidelines “for the mitigation of GHG emissions or the
effects of GHG emissions” and directed the Resources Agency to certify and adopt the State CEQA
Guidelines.
On April 13, 2009, OPR submitted the proposed amendments to the Secretary for Natural Resources.
The Natural Resources Agency conducted formal rulemaking in 2009, certified, and adopted the
amendments in December 2009. The California Office of Administrative Law codified into law the
amendments in March 2010. The amendments became effective in June 2010 and provide regulatory
guidance with respect to the analysis and mitigation of the potential effects of GHG emissions.
CEQA Guidelines § 15183.5, Tiering and Streamlining the Analysis of GHG Emissions, was added as part
of the CEQA Guideline amendments and describes the criteria needed in a Climate Action Plan that
would allow for the tiering and streamlining of CEQA analysis for subsequent development projects. The
following quote is from the CEQA Guideline amendments:
Ҥ15183.5. Tiering and Streamlining the Analysis of Greenhouse Gas Emissions.
(a) Lead agencies may analyze and mitigate the significant effects of greenhouse gas emissions at a
programmatic level, such as in a general plan, a long range development plan, or a separate
plan to reduce greenhouse gas emissions. Later project-specific environmental documents may
tier from and/or incorporate by reference that existing programmatic review. Project-specific
environmental documents may rely on an EIR containing a programmatic analysis of greenhouse
gas emissions as provided in section 15152 (tiering), 15167 (staged EIRs) 15168 (program EIRs),
15175-15179.5 (Master EIRs), 15182 (EIRs Prepared for Specific Plans), and 15183 (EIRs Prepared
for General Plans, Community Plans, or Zoning).
(b) Plans for the Reduction of Greenhouse Gas Emissions. Public agencies may choose to analyze and
mitigate significant greenhouse gas emissions in a plan for the reduction of greenhouse gas
emissions or similar document. A plan to reduce greenhouse gas emissions may be used in a
cumulative impacts analysis as set forth below. Pursuant to sections 15064(h)(3) and 15130(d), a
lead agency may determine that a project’s incremental contribution to a cumulative effect is
not cumulatively considerable if the project complies with the requirements in a previously
adopted plan or mitigation program under specified circumstances.
(1) Plan Elements. A plan for the reduction of greenhouse gas emissions should:
(A) Quantify greenhouse gas emissions, both existing and projected over a specified time
period, resulting from activities within a defined geographic area;
(B) Establish a level, based on substantial evidence, below which the contribution to
greenhouse gas emissions from activities covered by the plan would not be cumulatively
considerable;
1 . 6 R E G U L A T O R Y S E T T I N G
CITY OF MORENO VALLEY 1-9 GREENHOUSE GAS ANALYSIS
(C) Identify and analyze the greenhouse gas emissions resulting from specific actions or
categories of actions anticipated within the geographic area;
(D) Specify measures or a group of measures, including performance standards, that
substantial evidence demonstrates, if implemented on a project-by-project basis, would
collectively achieve the specified emissions level;
(E) Establish a mechanism to monitor the plan’s progress toward achieving the level and to
require amendment if the plan is not achieving specified levels;
(F) Be adopted in a public process following environmental review.
(2) Use with Later Activities. A plan for the reduction of greenhouse gas emissions, once adopted
following certification of an EIR or adoption of an environmental document, may be used in
the cumulative impacts analysis of later projects. An environmental document that relies on
a greenhouse gas reduction plan for a cumulative impacts analysis must identify those
requirements specified in the plan that apply to the project, and, if those requirements are
not otherwise binding and enforceable, incorporate those requirements as mitigation
measures applicable to the project. If there is substantial evidence that the effects of a
particular project may be cumulatively considerable notwithstanding the project’s
compliance with the specified requirements in the plan for the reduction of greenhouse gas
emissions, an EIR must be prepared for the project.”
EXECUTIVE ORDER S-13-08 On November 14, 2008, Governor Schwarzenegger issued Executive Order S-13-08, the Climate
Adaptation and Sea Level Rise Planning Directive, which provides clear direction for how the State
should plan for future climate impacts. Executive Order S-13-08 calls for the implementation of four key
actions to reduce the vulnerability of California to climate change:
■ Initiate California's first statewide Climate Change Adaptation Strategy (CAS) that will assess the
State's expected climate change impacts, identify where California is most vulnerable, and
recommend climate adaptation policies;
■ Request that the National Academy of Sciences establish an expert panel to report on sea level
rise impacts in California in order to inform State planning and development efforts;
■ Issue interim guidance to State agencies for how to plan for sea level rise in designated coastal
and floodplain areas for new and existing projects; and
■ Initiate studies on critical infrastructure and land-use policies vulnerable to sea level rise.
The 2009 CAS report summarizes the best known science on climate change impacts in the state to
assess vulnerability, and outlines possible solutions that can be implemented within and across state
C H A P T E R 1 I N T R O D U C T I O N
CITY OF MORENO VALLEY 1-10 GREENHOUSE GAS ANALYSIS
agencies to promote resiliency. This is the first step in an ongoing, evolving process to reduce
California’s vulnerability to climate impacts5.
CALIFORNIA CODE OF REGULATIONS (CCR) TITLE 24, PART 6 CCR Title 24, Part 6: California’s Energy Efficiency Standards for Residential and Nonresidential Buildings
(Title 24) were first established in 1978 in response to a legislative mandate to reduce California's energy
consumption. The standards are updated periodically to allow consideration and possible incorporation
of new energy efficiency technologies and methods. Although it was not originally intended to reduce
GHG emissions, electricity production by fossil fuels results in GHG emissions and energy efficient
buildings require less electricity. Therefore, increased energy efficiency results in decreased GHG
emissions.
The Energy Commission adopted 2008 Standards on April 23, 2008 and the Building Standards
Commission approved them for publication on September 11, 2008. These updates became effective on
August 1, 2009. The Energy Commission adopted the 2008 changes to the Building Energy Efficiency
Standards for several reasons:
■ To provide California with an adequate, reasonably priced, and environmentally sound supply of
energy;
■ To respond to AB 32, the Global Warming Solutions Act of 2006, which mandates that California
must reduce its GHG emissions to 1990 levels by 2020;
■ To pursue California energy policy, which states that energy efficiency is the resource of first
choice for meeting California's energy needs;
■ To act on the findings of California's Integrated Energy Policy Report (IEPR) that concludes that
the Standards are the most cost effective means to achieve energy efficiency, expects the
Building Energy Efficiency Standards to continue to be upgraded over time to reduce electricity
and peak demand, and recognizes the role of the Standards in reducing energy related to
meeting California's water needs and in reducing GHG emissions;
■ To meet the West Coast Governors' Global Warming Initiative commitment to include
aggressive energy efficiency measures into updates of state building codes; and
■ To meet the Executive Order in the Green Building Initiative to improve the energy efficiency of
nonresidential buildings through aggressive standards.
5 California Natural Resources Agency, 2009 California Climate Adaption Strategy- A Report to the Governor in
Response to Executive Order S-13-2008, WWW.Climatechange.Ca.Gov/Adaptation, September 2009
1 . 6 R E G U L A T O R Y S E T T I N G
CITY OF MORENO VALLEY 1-11 GREENHOUSE GAS ANALYSIS
SENATE BILL 375 Senate Bill 375 (SB 375), which establishes mechanisms for the development of regional targets for
reducing passenger vehicle GHG emissions, was adopted by the State on September 30, 2008. On
September 23, 2010, CARB adopted the vehicular GHG emissions reduction targets that had been
developed in consultation with the metropolitan planning organizations (MPOs); the targets require a 7
to 8 percent reduction by 2020 and between 13 to 16 percent reduction by 2035 for each MPO. SB 375
recognizes the importance of achieving significant GHG reductions by working with cities and counties to
change land use patterns and improve transportation alternatives. Through the SB 375 process, MPOs
will work with local jurisdictions in the development of sustainable communities strategies (SCS)
designed to integrate development patterns and the transportation network in a way that reduces GHG
emissions while meeting housing needs and other regional planning objectives. MPOs will prepare their
first SCS according to their respective regional transportation plan (RTP) update schedule; to date, no
region has adopted an SCS. The first of the RTP updates with SCS strategies are expected in 2012.
The Southern California Association of Governments (SCAG) is the MPO serving the area including
Moreno Valley. SCAG is currently in the process of developing the 2012 RTP and SCS for their jurisdiction
aimed at attaining the reduction targets of an 8% per capita reduction in GHG emissions from passenger
vehicles by the year 2020 and a 13% reduction by 2035. SCAG is currently developing the SCS and
expecting to adopt the SCS, RTP, and the associated programmatic EIR in April 2012. Many of the
transportation-related reduction measures included in this analysis will coordinate with efforts in SCAG’s
SCS.
CALIFORNIA GREEN BUILDING CODE 2010
The California Green Building Standards Code referred to as CALGreen went into effect on January 1,
2011. The code sets new mandatory measures with sensible minimum standards for all new structures
in the State. Each local jurisdiction can additionally exceed the new standards by adopting CALGreen
voluntary measures as mandatory in their jurisdiction. The measures aim to reduce water consumption,
employ building commissioning to increase building system efficiencies, divert construction waste from
landfills, and install low pollutant-emitting finish materials.
CALGreen has approximately 52 nonresidential mandatory measures and an additional 130 provisions
that have been placed in the appendix for optional use. Some key mandatory measures for commercial
occupancies include specified parking for clean air vehicles, a 20% reduction of potable water use within
buildings, a 50% construction waste diversion from landfills, use of building finish materials that emit
low levels of volatile organic compounds (VOCs), and commissioning for new, nonresidential buildings
over 10,000 square feet. For residential buildings, some key measures include a 20% reduction in water
use, required irrigation controllers for outdoor water use, 50% construction waste diversion from
landfills, and required use of low-VOC paints and building materials (CBSC 2010).
C H A P T E R 1 I N T R O D U C T I O N
CITY OF MORENO VALLEY 1-12 GREENHOUSE GAS ANALYSIS
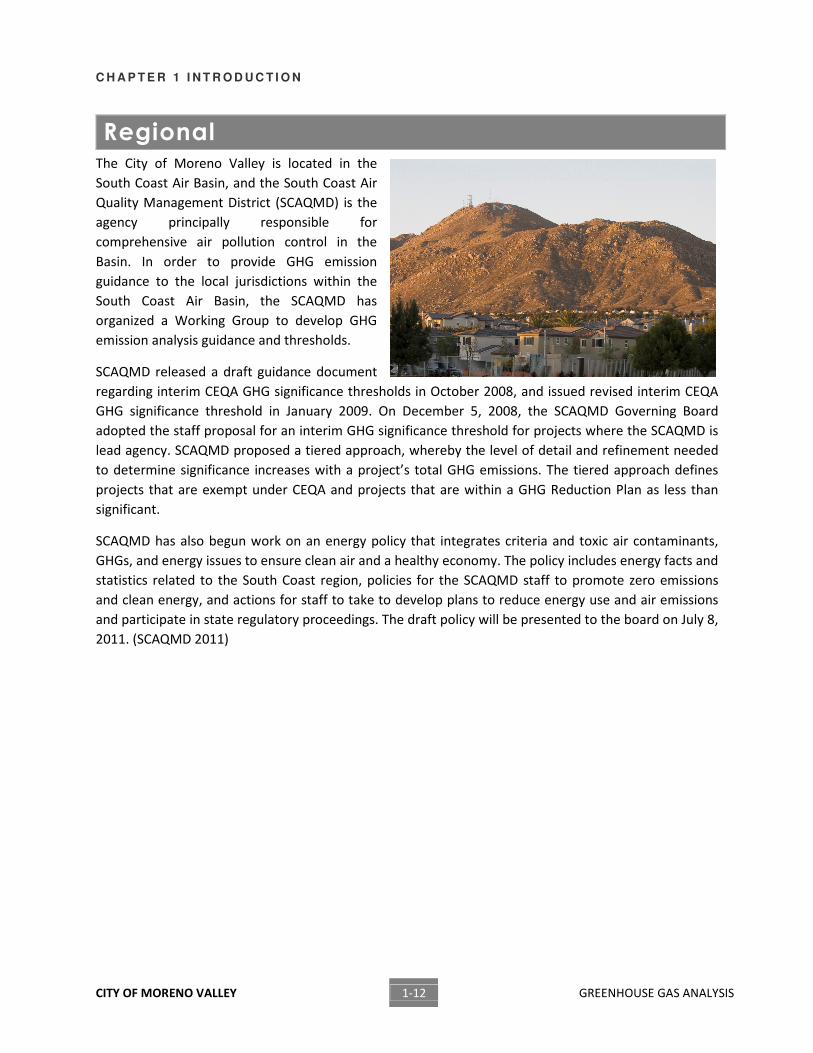
Regional The City of Moreno Valley is located in the
South Coast Air Basin, and the South Coast Air
Quality Management District (SCAQMD) is the
agency principally responsible for
comprehensive air pollution control in the
Basin. In order to provide GHG emission
guidance to the local jurisdictions within the
South Coast Air Basin, the SCAQMD has
organized a Working Group to develop GHG
emission analysis guidance and thresholds.
SCAQMD released a draft guidance document
regarding interim CEQA GHG significance thresholds in October 2008, and issued revised interim CEQA
GHG significance threshold in January 2009. On December 5, 2008, the SCAQMD Governing Board
adopted the staff proposal for an interim GHG significance threshold for projects where the SCAQMD is
lead agency. SCAQMD proposed a tiered approach, whereby the level of detail and refinement needed
to determine significance increases with a project’s total GHG emissions. The tiered approach defines
projects that are exempt under CEQA and projects that are within a GHG Reduction Plan as less than
significant.
SCAQMD has also begun work on an energy policy that integrates criteria and toxic air contaminants,
GHGs, and energy issues to ensure clean air and a healthy economy. The policy includes energy facts and
statistics related to the South Coast region, policies for the SCAQMD staff to promote zero emissions
and clean energy, and actions for staff to take to develop plans to reduce energy use and air emissions
and participate in state regulatory proceedings. The draft policy will be presented to the board on July 8,
2011. (SCAQMD 2011)
CITY OF MORENO VALLEY 2-1 GREENHOUSE GAS ANALYSIS
Chapter 2 Methodology
C H A P T E R 2 M E T H O D O L O G Y
CITY OF MORENO VALLEY 2-2 GREENHOUSE GAS ANALYSIS
2.1 Overview GHG inventories include all major sources of emissions attributable directly or indirectly to the City’s
municipal operations or activities within the community the City serves. GHG inventories are divided
into two broad categories, Municipal GHG inventories and Community-wide GHG inventories. Municipal
GHG Inventories are emissions resulting from City municipal operations. Community-wide GHG
inventories are a broader measure of emissions associated with both the activities within the
community the City serves and the municipal operations. As such, the Municipal GHG inventory is a
subset of the larger Community-wide GHG inventory. The methodology for preparing GHG inventories
incorporates the protocols, methods, and emission factors found in the California Climate Action
Registry (CCAR) General Reporting Protocol (version 3.1, January 2009), the Local Government
Operations Protocol (LGOP) (version 1.1, May 2010), and the Draft Community-wide GHG Emissions
Protocol under development by the Association of Environmental Professionals (AEP) and the
International Council for Local Environmental Initiatives (ICLEI). The LGOP provides the guidance and
protocols in the development of the Municipal GHG inventory. Currently, there is not an adopted
protocol for the development of Community-wide GHG inventories. However, the AEP/ICLEI Draft
Community-wide GHG Emissions Protocols provide draft guidance in the development of the
Community-wide inventory.
The LGOP and the draft AEP/ICLEI Draft Community-wide GHG Emissions Protocols categorize GHG
emissions into three distinct “scopes” as a way of organizing GHG emissions, as follows:
■ Scope 1 Emissions – All “direct” sources of community-wide GHG emissions from sources within
the jurisdictional boundaries of the City. This includes fuel burned onsite in buildings and
equipment such as natural gas or diesel fuel; transportation fuels burned in motor vehicles; and
wood-burning emissions from household hearths. For inventories of only municipal operations,
these emissions are limited to activities under the operational control of the local government.
■ Scope 2 Emissions – Encompasses “indirect” sources of GHG emissions resulting from the
consumption of purchased electricity, which is electricity used by the residents, businesses, and
City’s facilities. An “indirect” source is one where the action that generates GHGs is separated
from where the GHGs are actually emitted. For example, when a building uses electricity, it
necessitates the burning of fossil fuels, such as coal or natural gas (and resultant release of
GHGs) to generate electricity by a utility facility located elsewhere. Thus they are distinguished
from direct emissions (i.e., Scope 1 emissions) from electricity production, which are reported
by the utility itself, in order to avoid double counting.
■ Scope 3 Emissions is an optional reporting category that encompasses all other “indirect
emissions” that are a consequence of activities of the City’s residents and businesses, but occur
from sources out of the jurisdictional control of the local government. The key to this category
of emissions is that they must be “indirect or embodied emissions over which the local
government exerts significant control or influence.” (CCAR 2010) For example, when
2 . 2 C A L C U L A T I O N O F G H G S
CITY OF MORENO VALLEY 2-3 GREENHOUSE GAS ANALYSIS
considering GHG emissions from trucks hauling waste under a City contract, the City does not
own the waste hauling trucks, but does have significant control over how many pickups the
trucks make.
Scope 1 emissions are characterized in this report as “direct emissions” While Scope 2 emissions are
characterized as “indirect source emissions.”
The analysis herein is tailored to include all existing and projected emission sources within the City to
provide, to the fullest extent feasible, a comprehensive analysis of GHG impacts. The Global Warming
Solutions Act of 2006 (AB 32) established a comprehensive program of regulatory and market
mechanisms to achieve real, quantifiable, cost-effective reductions of GHG emissions. The law mandates
the reduction of GHG emissions in California to 1990 levels by 2020.
2.2 Calculation of GHGs This report establishes 2010 as the year on which to base the existing inventory; this is the most recent
year for which reliable data concerning the City’s residential, commercial, and government operations
are available. This inventory provides a framework on which to design programs and actions that
specifically target reductions by emissions sources. Programs and actions already in place within the City
are described in Section 4. The 2010 inventory serves as a reference against which to measure the City’s
progress towards reducing GHG emissions since 2007 and into the future, and also serves as
documentation for potential emission trading opportunities.
The methodology used for the calculation GHG emissions differs depending on the emission source, as
described below. The emissions calculations follow the CCAR General Reporting Protocol, version 3.1;
LGOP, version 1.1; and CARB’s Mandatory GHG Reporting Regulations (Title 17, California Code of
Regulations, Sections 95100 et seq.). These protocols are consistent with the methodology and emission
factors endorsed by CARB and USEPA. In cases where these protocols do not contain specific source
emission factors, current industry standards or the USEPA’s AP 42 Compilation of Air Pollution Emission
Factors were used.
In estimating Moreno Valley’s total GHG emissions, data sources from the City, regional, and state
agencies were used. Southern California Edison (SCE) and Southern California Gas Company (SCG)
provided both municipal and community wide electricity and natural gas data, respectively. Solid waste
data was taken from the California Integrated Waste Management Board’s (CIWMB) database.
Transportation emissions were calculated based on vehicle miles traveled (VMT) modeled by the City’s
traffic engineer using the TRANSIMS traffic model. Total water use in the City was provided by EMWD.
The data used in the calculations for each inventory are summarized in Chapter 3. All of the contributors
to GHG emissions (kilowatt-hours of electricity generated by fossil fuel combustion in power plants,
natural gas in therms, vehicle travel in VMT, and solid waste in tons) are expressed in the common unit
of MT of CO2e released into the atmosphere in a given year.
In addition, the costs associated with the GHG emissions were calculated for each sector (based on
availability of data). The costs were based on the consumer fees for each fuel type included in the
C H A P T E R 2 M E T H O D O L O G Y
CITY OF MORENO VALLEY 2-4 GREENHOUSE GAS ANALYSIS
inventory. By including the costs, the City can assess where consumers are spending the most money
and utilize the information in making decisions on reduction measures.
GHG emissions are typically segregated into direct and indirect sources as discussed previously.
However, direct and indirect sources are not completely independent of each other and are often
combined into other more encompassing categories. For example, although natural gas combustion is a
direct source and electricity generation is an indirect source, they both are typically discussed under a
heading of “Energy” when policies are put in place to reduce emissions. Therefore, this report discusses
emissions with respect to the general source categories of Transportation, Energy, Area Source, Water,
Wastewater, and Solid Waste.
Transportation
ON-ROAD VEHICLES Carbon dioxide emissions from vehicles were calculated utilizing EMFAC2007 emission factors for the
existing and 2020 inventories. The Emission Factors (EMFAC) model was developed by CARB and used to
calculate emission rates from on-road motor vehicles from light-duty passenger vehicles to heavy-duty
trucks that operate on highways, freeways, and local roads in California. Motor vehicle emissions of CH4,
and N2O were also calculated using USEPA emission factors for on-road vehicles based on the total
annual mileage driven multiplied by their respective emission factors by year.
Vehicle miles traveled (VMT) and total number of trips were determined by the City’s Transportation
Analysis and Simulation System (TRANSIMS) model. TRANSIMS is a transportation model developed by
the Federal Highway Administration (FHWA) and tracks individual vehicles second-by-second through
the road network. This model is based on the Riverside County Traffic Analysis Model (RivTAM) and the
SCAG Regional Transportation Model. TRANSIMS estimates 2007 VMT for all trips that begin and/or end
within the City limits. This accounts for traffic entering or exiting Moreno Valley and traffic within the
City, but excludes pass-through traffic. Moreno Valley’s VMT includes miles from all trips within Moreno
Valley and half of the miles from trips that begin or end in Moreno Valley; Moreno Valley is held
accountable for all trips within the city limits while the City shares accountability with other jurisdictions
for trips that have only one end point in Moreno Valley.
The estimates do not account for electrical, biodiesel (a blend of diesel and vegetable oil), or hydrogen
powered systems. Any electrically powered vehicle which draws power from a residence, commercial or
industrial land use will be accounted for in the electrical usage for the City. Predicted 2020 (business as
usual) BAU vehicle trips were estimated by using predicted land use changes and growth. Costs
associated with transportation were based on the diesel and gasoline fuel use and their associated per
gallon costs in 2007.
2 . 2 C A L C U L A T I O N O F G H G S
CITY OF MORENO VALLEY 2-5 GREENHOUSE GAS ANALYSIS
Energy
ELECTRICITY The City emits carbon dioxide, methane, and nitrous oxide
indirectly through the use of electricity provided by Southern
California Edison (SCE); SCE provided annual energy usage for
2007. 2020 BAU electricity use was estimated based on anticipated
growth in the residential and commercial/industrial areas.
SCE provides electricity from a variety of sources including natural
gas, nuclear energy, and large hydroelectric systems. Each of these
sources of electricity emits different levels of GHGs. The annual
usage in megawatt hours per year (MWh/year) was multiplied by the emission factors appropriate to
the inventory year for carbon dioxide, methane, and nitrous oxide to determine emissions from these
sources.
Costs of electricity calculations were based on the annual kWh use and price per kWh for each rate class.
Electricity rates fluctuate throughout the year, so average values were used.
NATURAL GAS COMBUSTION The City emits GHGs from the combustion of natural gas. The annual natural gas usage for the City in
thousand cubic feet (Mcf) was converted to million British Thermal Units (MMBTUs) and multiplied by
the respective emissions factors for carbon dioxide, methane, and nitrous oxide to determine the
emissions from natural gas combustion, typically used for heating. Natural gas usage for 2007 was
obtained from The Southern California Gas Company. Anticipated 2020 natural gas data was based on
per unit usage in 2007 and the anticipated unit growth by 2020. The costs associated with natural gas
use were calculated using California 2007 average rates obtained from the U.S. Energy Information
Administration (EIA). The rates align with the use breakdowns of residential, industrial, and commercial
use.
Area Source
LANDSCAPING Emissions of carbon dioxide, methane, and nitrous oxide are generated by the use of landscape
equipment through the combustion of gasoline. Carbon dioxide emissions were determined directly
through URBEMIS2007 for the existing and 2020 inventories. URBEMIS2007 is a computer software
package that is used for modeling projected emissions of air quality pollutants including carbon dioxide.
From the carbon dioxide emissions, the approximate number of gallons of gasoline consumed through
landscape equipment use was calculated. This number was then multiplied by emission factors
presented in the General Reporting Protocol, version 3.1 to determine both methane and nitrous oxide
emissions.
C H A P T E R 2 M E T H O D O L O G Y
CITY OF MORENO VALLEY 2-6 GREENHOUSE GAS ANALYSIS
WOOD BURNING Direct carbon dioxide emissions are produced from the burning of wood in wood stoves, fireplaces, and
natural gas fired stoves. The emissions from natural gas fired stoves are included in the Energy source
category. Carbon dioxide, methane, and nitrous oxide emissions from wood stoves and fireplaces are
calculated based on the percentage of residential units using each type of hearth and the estimated
annual amount of wood burned. The emission coefficients used are taken from the USEPA’s AP-42
document. Cost estimates were made for wood burning using the average cost of wood.
Water
POTABLE WATER Electricity is needed to move and treat water. Moreno
Valley residents and businesses currently use
approximately 9 billion gallons of potable water. The
water for Moreno Valley is provided by the Eastern
Municipal Water District (EMWD) and Box Springs
Mutual Water Company. A portion of EMWD’s water
comes from local sources while the remaining water is
from the Colorado River and the State Project water
originating in Northern California, which is delivered to Southern California via the California aqueduct.
Box Springs’ water comes primarily from local sources; however, the company does purchase a small
amount of water from Western Municipal Water District (WMWD). WMWD water comes from similar
sources as those described for EMWD. The emissions associated with the energy used to pump the local
water are included in the Electricity section described above. There are additional emissions associated
with this purchased water from the Colorado River and the State Water Project due to the electricity
used to transport the water over a long distance. Costs associated with water were based on the
average rates for residential, commercial, and industrial customers.
WASTEWATER TREATMENT EMWD is also the main provider of wastewater and sewer
treatment for the City of Moreno Valley. Wastewater-related
GHG emissions arise from the electricity used to pump and
treat the water, the transportation fuel used to truck the
biosolids to an off-site disposal area, and the direct methane
emissions from the anaerobic digesters used in the treatment
process. The electricity and transportation emissions are included in their respective categories. This
category of emissions only represents the direct methane emissions.
2 . 2 C A L C U L A T I O N O F G H G S
CITY OF MORENO VALLEY 2-7 GREENHOUSE GAS ANALYSIS
Waste Management
SOLID WASTE Emissions from solid waste are determined as the sum of
emissions generated by transportation from its source to the
landfill, the equipment used in its disposal at the landfill,
fugitive emissions from decomposition in landfills, and the
anthropogenic carbon sink generated by the incomplete
decomposition of materials in the landfill.
Emissions from the transportation of solid waste is determined
based on the annual lbs/year (pounds per year) of total waste
disposed in landfills including biosolids waste from wastewater treatment plants, the density of the
waste, the capacity of the hauling trucks, the average number of miles traveled by each truck; and the
carbon dioxide, methane, and nitrous oxide emissions generated per mile traveled.
Landfill equipment emissions are only included in the inventory if the landfill is under the direct control
of the City or County of interest. As the Badlands landfill used for the disposal of waste for Moreno
Valley, is not under the City’s direct control, emissions from onsite equipment are not included in this
inventory.
Fugitive emissions of methane from the decomposition of solid waste are calculated based on the
annual waste generation multiplied by the USEPA emission factor for waste production for methane.
The emission factor to determine methane generation varies if the landfill operations are known to
operate a methane flare or to generate electricity from methane capture. Carbon dioxide generated by
decomposition of waste in landfills is not considered anthropogenic because it would be produced
through the natural decomposition process regardless of its disposition in the landfill. Nitrous oxide is
not a by-product of decomposition and therefore no fugitive emissions of nitrous oxide are anticipated
from this source.

CITY OF MORENO VALLEY 3-1 GREENHOUSE GAS ANALYSIS
Chapter 3 Greenhouse Gas Emissions Inventory
C H A P T E R 3 G R E E N H O U S E G A S E M I S S I O N S I N V E N T O R Y
CITY OF MORENO VALLEY 3-2 GREENHOUSE GAS ANALYSIS
The following sections include Moreno Valley’s 2010 municipal operations and community-wide
emissions inventories. The municipal operations inventory includes sources and quantities of GHG
emissions from government owned or rented buildings, facilities, vehicles, and equipment. The
community-wide emissions inventory identifies and categorizes the major sources and quantities of GHG
emissions being produced by residents, businesses, and municipal operations taking place in the City of
Moreno Valley using the best available data. By having the municipal emissions separated from the
community as a whole, the local government can implement reduction strategies where it has direct
control, closely monitor the changes in emissions over time, and set an example for the rest of the City.
3.1 2010 Municipal Emissions Inventory
Data Inputs Data for the municipal inventory was gathered from various City departments. Table 3-1, below,
summarizes the data inputs and sources for each of the emission categories included in the inventory.
Table 3-1 2010 Municipal Data Inputs
Category Data Input Data Source
Electricity (kWh)
9,937,015
3,847,738
SCE
MVU
Natural Gas (therms) 90,651 SCG
Vehicle Fleet
Gasoline(gallons)
Diesel (gallons)
77,325
28,544
Fleet Manager
Special Districts
Equipment
Gasoline(gallons)
Diesel (gallons)
2,118
2,208
Parks Division
Special Districts
Employee Commute (responses) 141 Employee Survey
With the exception of the employee commute data, each data input was then multiplied by the
associated emission factor to calculate the emissions inventory. The data from the employee commute
survey was used to estimate total miles traveled, fuel used, and associated GHG emissions for all City
employees’ commutes. Additionally, where possible, the emissions were categorized by City
Department.
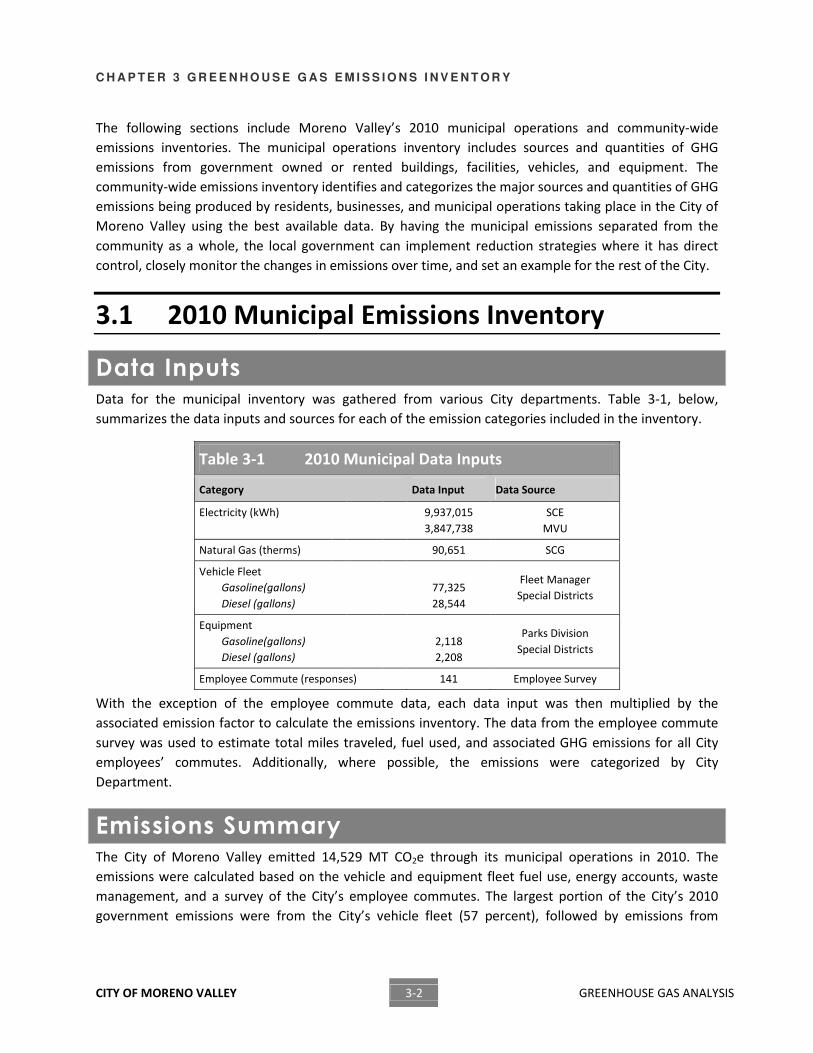
Emissions Summary The City of Moreno Valley emitted 14,529 MT CO2e through its municipal operations in 2010. The
emissions were calculated based on the vehicle and equipment fleet fuel use, energy accounts, waste
management, and a survey of the City’s employee commutes. The largest portion of the City’s 2010
government emissions were from the City’s vehicle fleet (57 percent), followed by emissions from
3 . 1 2 0 1 0 M U N I C I P A L E M I S S I O N S I N V E N T O R Y
CITY OF MORENO VALLEY 3-3 GREENHOUSE GAS ANALYSIS
electricity (20 percent). Table 3-2 summarizes the City’s net 2010 emissions of CO2e as broken down by
emissions category. Figure 3-1 is a graphical representation of Table 3-2.
Table 3-2 2010 Total Municipal Emissions
Category Metric tons of CO2e
Vehicle Fleet 7,988
Electricity 2,898
Natural Gas 1,712
Employee Commute 1,538
Equipment 41
Total 14,529
Figure 3-1 2010 Municipal Emissions by Source (metric tons CO2e)
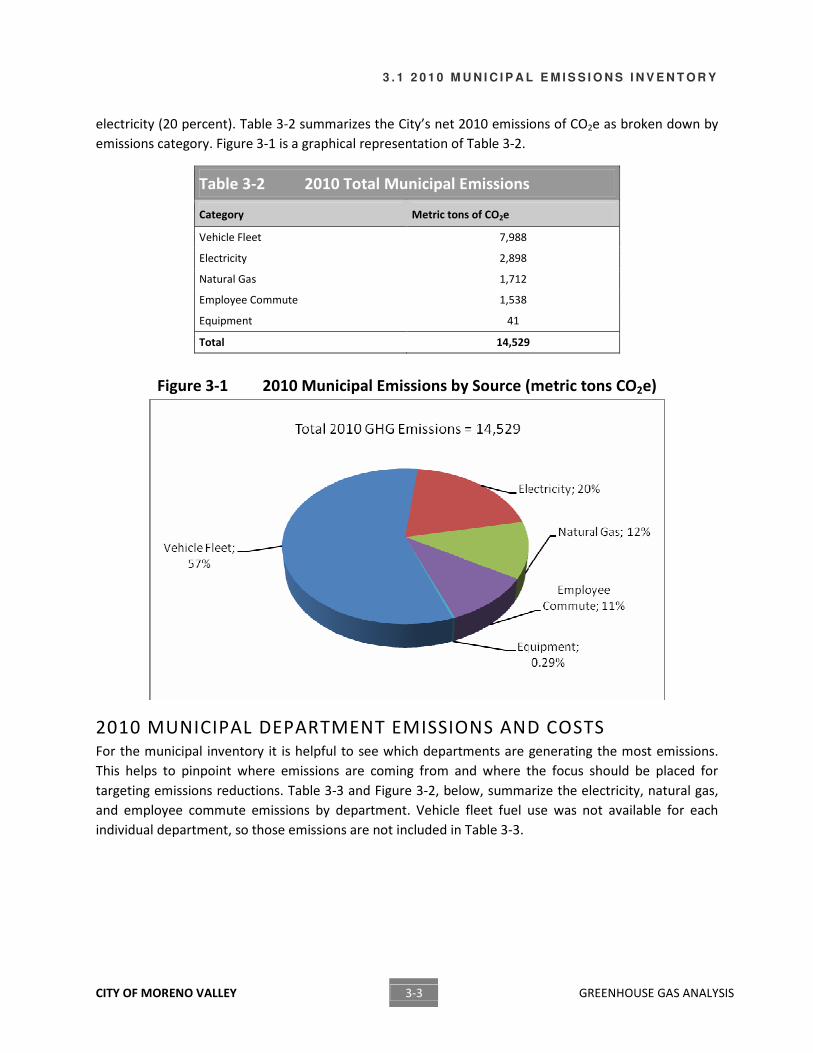
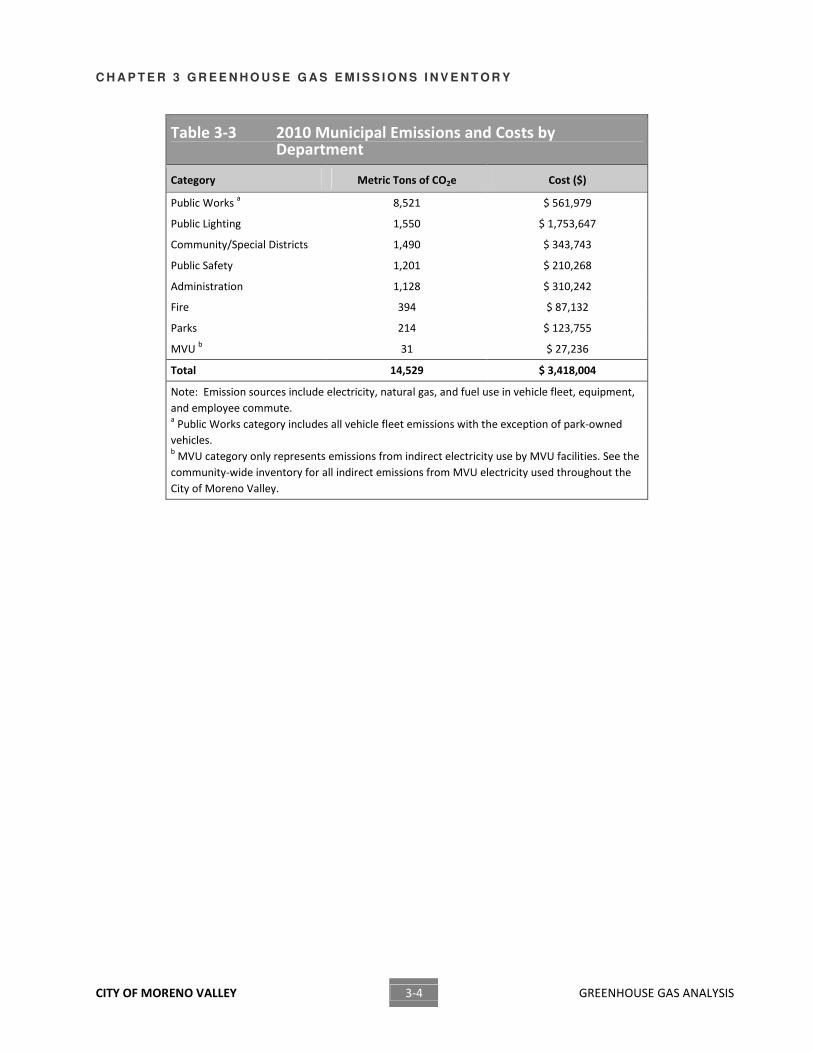
2010 MUNICIPAL DEPARTMENT EMISSIONS AND COSTS For the municipal inventory it is helpful to see which departments are generating the most emissions.
This helps to pinpoint where emissions are coming from and where the focus should be placed for
targeting emissions reductions. Table 3-3 and Figure 3-2, below, summarize the electricity, natural gas,
and employee commute emissions by department. Vehicle fleet fuel use was not available for each
individual department, so those emissions are not included in Table 3-3.
C H A P T E R 3 G R E E N H O U S E G A S E M I S S I O N S I N V E N T O R Y
CITY OF MORENO VALLEY 3-4 GREENHOUSE GAS ANALYSIS
Table 3-3 2010 Municipal Emissions and Costs by Department
Category Metric Tons of CO2e Cost ($)
Public Works a 8,521 $ 561,979
Public Lighting 1,550 $ 1,753,647
Community/Special Districts 1,490 $ 343,743
Public Safety 1,201 $ 210,268
Administration 1,128 $ 310,242
Fire 394 $ 87,132
Parks 214 $ 123,755
MVU b 31 $ 27,236
Total 14,529 $ 3,418,004
Note: Emission sources include electricity, natural gas, and fuel use in vehicle fleet, equipment,
and employee commute. a Public Works category includes all vehicle fleet emissions with the exception of park-owned
vehicles. b MVU category only represents emissions from indirect electricity use by MVU facilities. See the
community-wide inventory for all indirect emissions from MVU electricity used throughout the
City of Moreno Valley.
3 . 1 2 0 1 0 M U N I C I P A L E M I S S I O N S I N V E N T O R Y
CITY OF MORENO VALLEY 3-5 GREENHOUSE GAS ANALYSIS
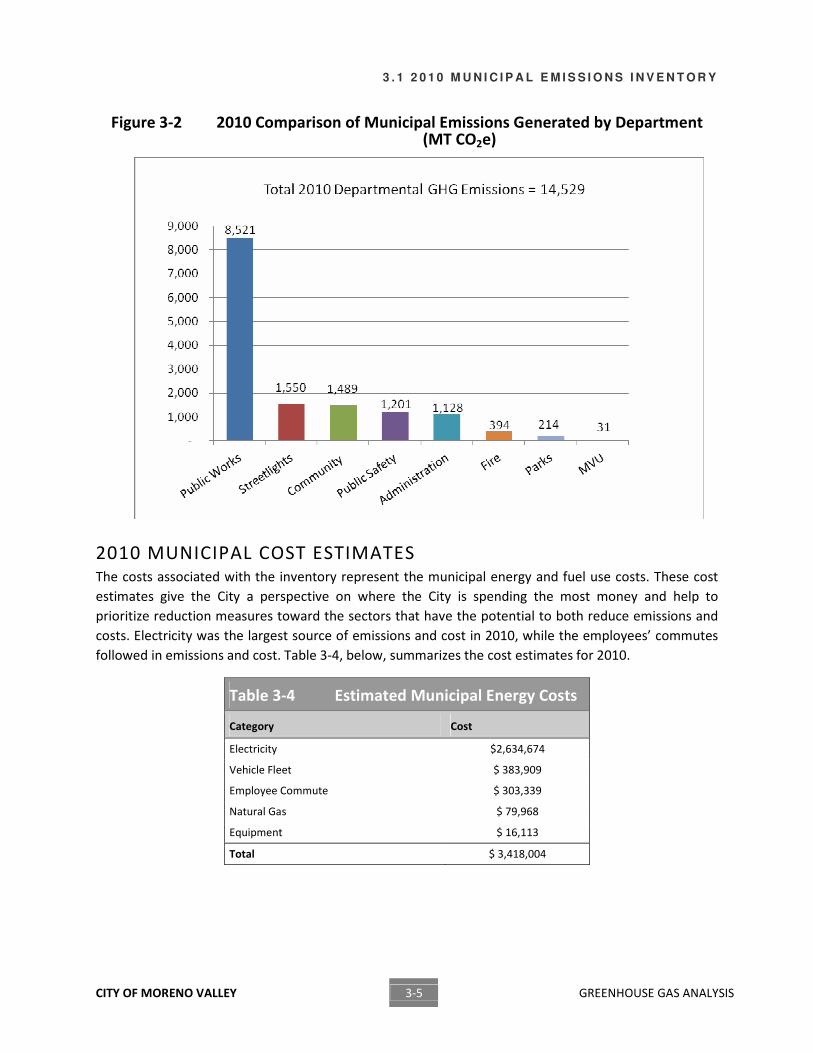
Figure 3-2 2010 Comparison of Municipal Emissions Generated by Department (MT CO2e)
2010 MUNICIPAL COST ESTIMATES The costs associated with the inventory represent the municipal energy and fuel use costs. These cost
estimates give the City a perspective on where the City is spending the most money and help to
prioritize reduction measures toward the sectors that have the potential to both reduce emissions and
costs. Electricity was the largest source of emissions and cost in 2010, while the employees’ commutes
followed in emissions and cost. Table 3-4, below, summarizes the cost estimates for 2010.
Table 3-4 Estimated Municipal Energy Costs
Category Cost
Electricity $2,634,674
Vehicle Fleet $ 383,909
Employee Commute $ 303,339
Natural Gas $ 79,968
Equipment $ 16,113
Total $ 3,418,004
C H A P T E R 3 G R E E N H O U S E G A S E M I S S I O N S I N V E N T O R Y
CITY OF MORENO VALLEY 3-6 GREENHOUSE GAS ANALYSIS
3.2 2010 Community-Wide Emissions Inventory The community-wide inventory represents all emissions from sources located with the jurisdictional
boundaries of the City of Moreno Valley. Therefore, the municipal emissions described in the previous
section are a subset of the community-wide inventories presented here. In 2010, the City of Moreno
Valley emitted a total of 920,657 MT CO2e from the community as a whole. The following sections
describe the data inputs, emissions by source, and emissions by land use in 2010.
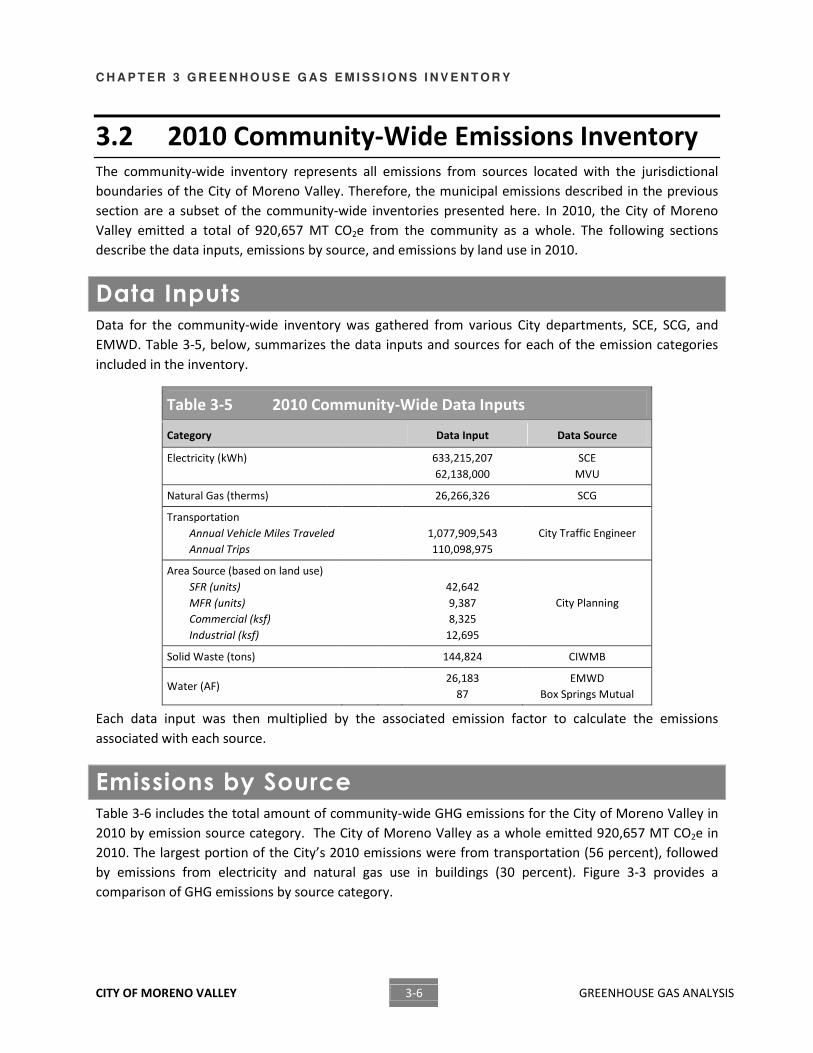
Data Inputs Data for the community-wide inventory was gathered from various City departments, SCE, SCG, and
EMWD. Table 3-5, below, summarizes the data inputs and sources for each of the emission categories
included in the inventory.
Table 3-5 2010 Community-Wide Data Inputs
Category Data Input Data Source
Electricity (kWh)
633,215,207
62,138,000
SCE
MVU
Natural Gas (therms) 26,266,326 SCG
Transportation
Annual Vehicle Miles Traveled
Annual Trips
1,077,909,543
110,098,975
City Traffic Engineer
Area Source (based on land use)
SFR (units)
MFR (units)
Commercial (ksf)
Industrial (ksf)
42,642
9,387
8,325
12,695
City Planning
Solid Waste (tons) 144,824 CIWMB
Water (AF) 26,183
87
EMWD
Box Springs Mutual
Each data input was then multiplied by the associated emission factor to calculate the emissions
associated with each source.
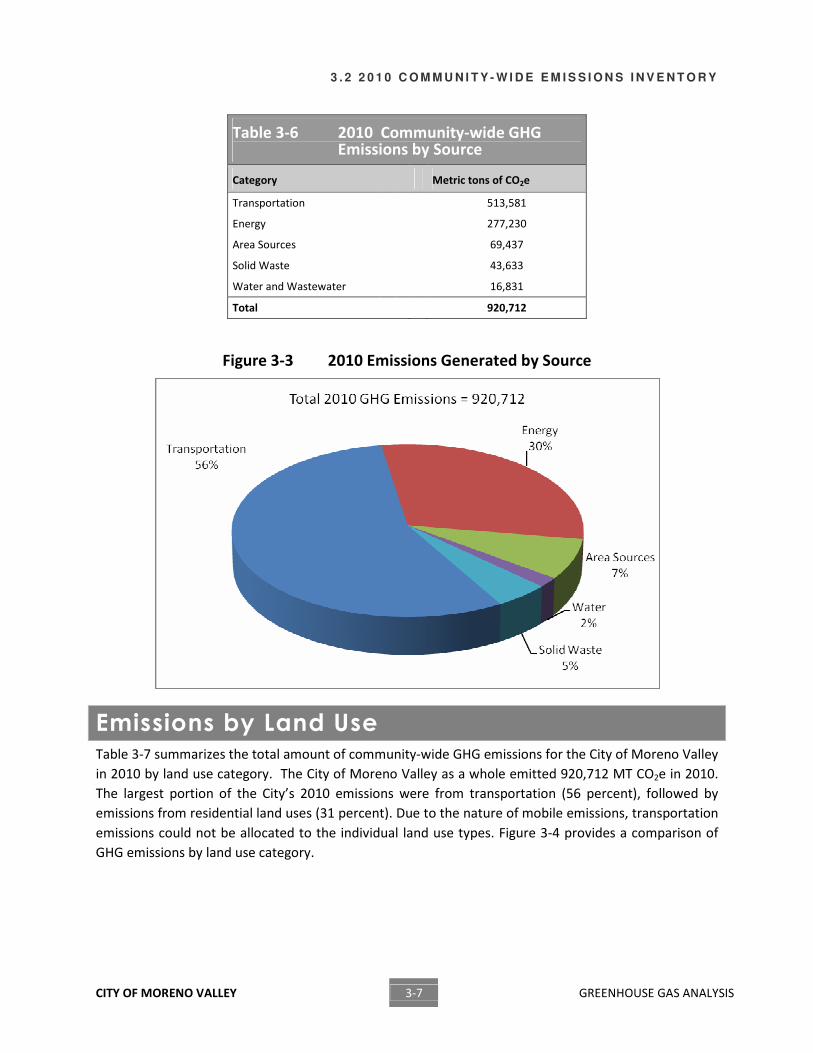
Emissions by Source Table 3-6 includes the total amount of community-wide GHG emissions for the City of Moreno Valley in
2010 by emission source category. The City of Moreno Valley as a whole emitted 920,657 MT CO2e in
2010. The largest portion of the City’s 2010 emissions were from transportation (56 percent), followed
by emissions from electricity and natural gas use in buildings (30 percent). Figure 3-3 provides a
comparison of GHG emissions by source category.
3 . 2 2 0 1 0 C O M M U N I T Y - W I D E E M I S S I O N S I N V E N T O R Y
CITY OF MORENO VALLEY 3-7 GREENHOUSE GAS ANALYSIS
Table 3-6 2010 Community-wide GHG Emissions by Source
Category Metric tons of CO2e
Transportation 513,581
Energy 277,230
Area Sources 69,437
Solid Waste 43,633
Water and Wastewater 16,831
Total 920,712
Figure 3-3 2010 Emissions Generated by Source
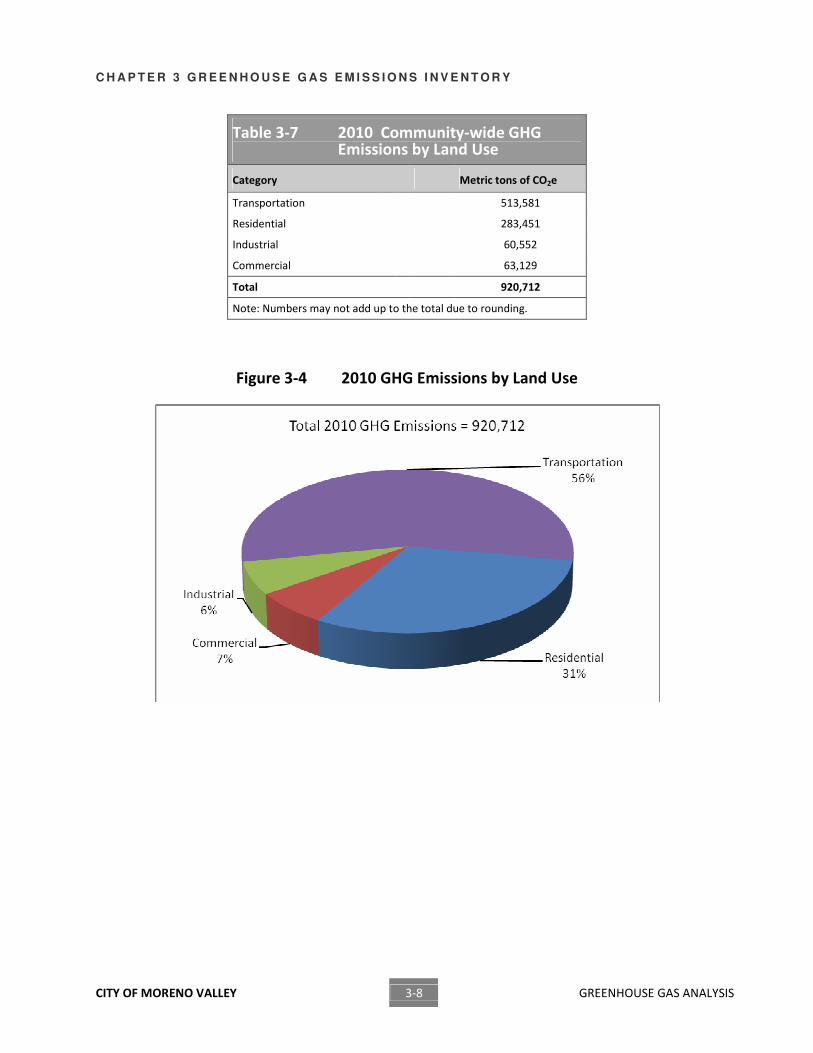
Emissions by Land Use Table 3-7 summarizes the total amount of community-wide GHG emissions for the City of Moreno Valley
in 2010 by land use category. The City of Moreno Valley as a whole emitted 920,712 MT CO2e in 2010.
The largest portion of the City’s 2010 emissions were from transportation (56 percent), followed by
emissions from residential land uses (31 percent). Due to the nature of mobile emissions, transportation
emissions could not be allocated to the individual land use types. Figure 3-4 provides a comparison of
GHG emissions by land use category.
C H A P T E R 3 G R E E N H O U S E G A S E M I S S I O N S I N V E N T O R Y
CITY OF MORENO VALLEY 3-8 GREENHOUSE GAS ANALYSIS
Table 3-7 2010 Community-wide GHG Emissions by Land Use
Category Metric tons of CO2e
Transportation 513,581
Residential 283,451
Industrial 60,552
Commercial 63,129
Total 920,712
Note: Numbers may not add up to the total due to rounding.
Figure 3-4 2010 GHG Emissions by Land Use
3 . 3 2 0 2 0 B U S I N E S S - A S - U S U A L C O M M U N I T Y - W I D E E M I S S I O N S I N V E N T O R Y
CITY OF MORENO VALLEY 3-9 GREENHOUSE GAS ANALYSIS
3.3 2020 Business-as-Usual Community-Wide Emissions Inventory
In 2020, Moreno Valley is projected to emit a total of 1,298,543 MT CO2e from a BAU standpoint. BAU
refers to continued operations and development of the City according to existing approved General Plan
policies, without the inclusion of recently-adopted sustainability initiatives or proposed policies included
as part of the General Plan Update as described in Chapter 4. As with the 2010 community-wide
inventory, these emissions represent all sources within the jurisdictional boundary of the City of Moreno
Valley, including emissions due to the municipal operations of the City. The following sections describe
the data inputs, emissions by source, and emissions by land use category for the year 2020.
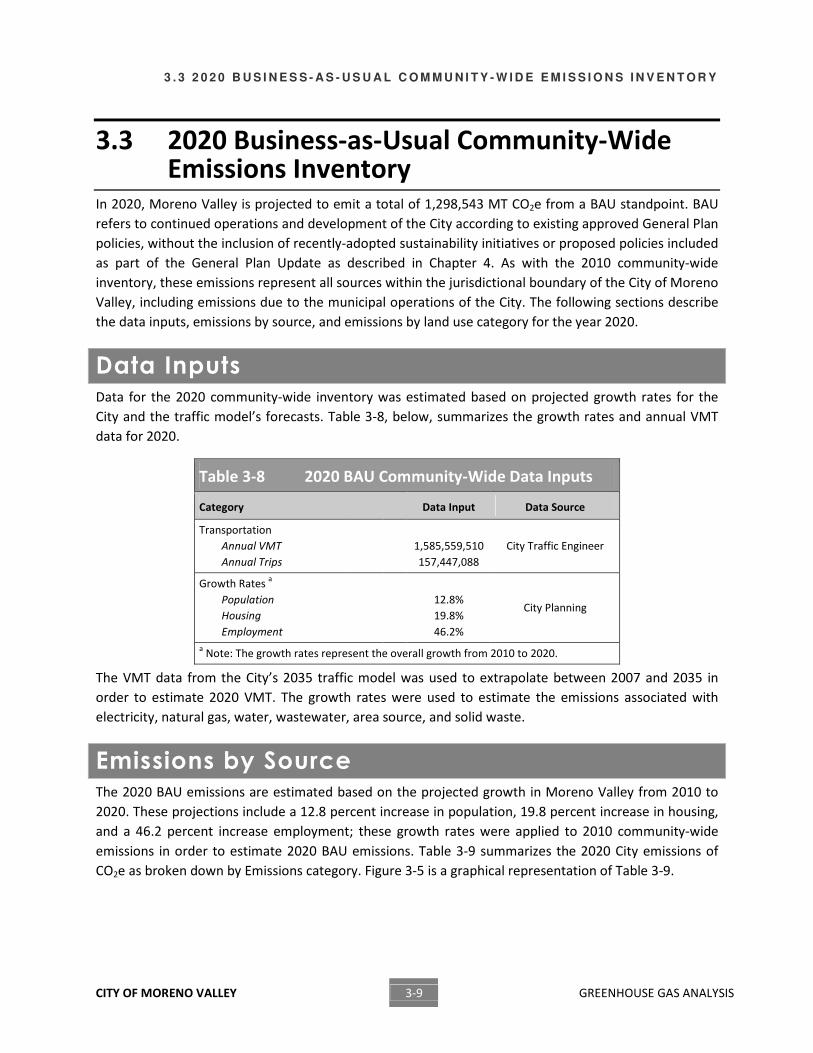
Data Inputs Data for the 2020 community-wide inventory was estimated based on projected growth rates for the
City and the traffic model’s forecasts. Table 3-8, below, summarizes the growth rates and annual VMT
data for 2020.
Table 3-8 2020 BAU Community-Wide Data Inputs
Category Data Input Data Source
Transportation
Annual VMT
Annual Trips
1,585,559,510
157,447,088
City Traffic Engineer
Growth Rates a
Population
Housing
Employment
12.8%
19.8%
46.2%
City Planning
a Note: The growth rates represent the overall growth from 2010 to 2020.
The VMT data from the City’s 2035 traffic model was used to extrapolate between 2007 and 2035 in
order to estimate 2020 VMT. The growth rates were used to estimate the emissions associated with
electricity, natural gas, water, wastewater, area source, and solid waste.
Emissions by Source The 2020 BAU emissions are estimated based on the projected growth in Moreno Valley from 2010 to
2020. These projections include a 12.8 percent increase in population, 19.8 percent increase in housing,
and a 46.2 percent increase employment; these growth rates were applied to 2010 community-wide
emissions in order to estimate 2020 BAU emissions. Table 3-9 summarizes the 2020 City emissions of
CO2e as broken down by Emissions category. Figure 3-5 is a graphical representation of Table 3-9.
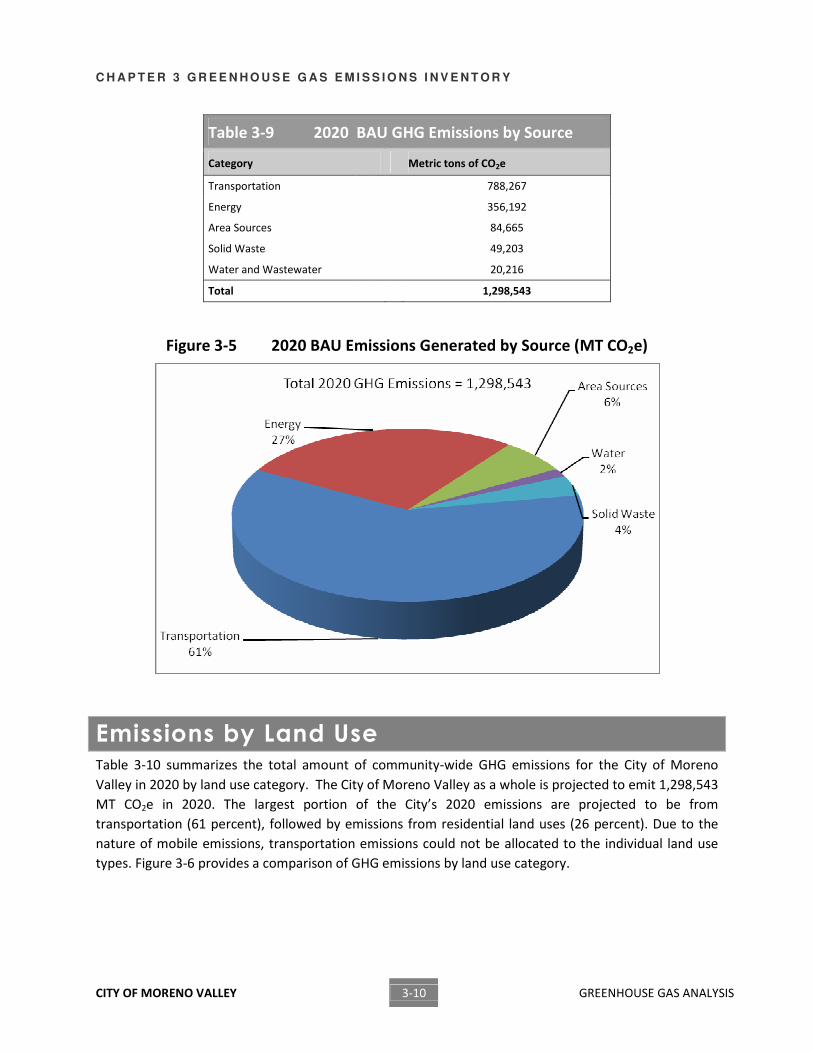
C H A P T E R 3 G R E E N H O U S E G A S E M I S S I O N S I N V E N T O R Y
CITY OF MORENO VALLEY 3-10 GREENHOUSE GAS ANALYSIS
Table 3-9 2020 BAU GHG Emissions by Source
Category Metric tons of CO2e
Transportation 788,267
Energy 356,192
Area Sources 84,665
Solid Waste 49,203
Water and Wastewater 20,216
Total 1,298,543
Figure 3-5 2020 BAU Emissions Generated by Source (MT CO2e)
Emissions by Land Use Table 3-10 summarizes the total amount of community-wide GHG emissions for the City of Moreno
Valley in 2020 by land use category. The City of Moreno Valley as a whole is projected to emit 1,298,543
MT CO2e in 2020. The largest portion of the City’s 2020 emissions are projected to be from
transportation (61 percent), followed by emissions from residential land uses (26 percent). Due to the
nature of mobile emissions, transportation emissions could not be allocated to the individual land use
types. Figure 3-6 provides a comparison of GHG emissions by land use category.
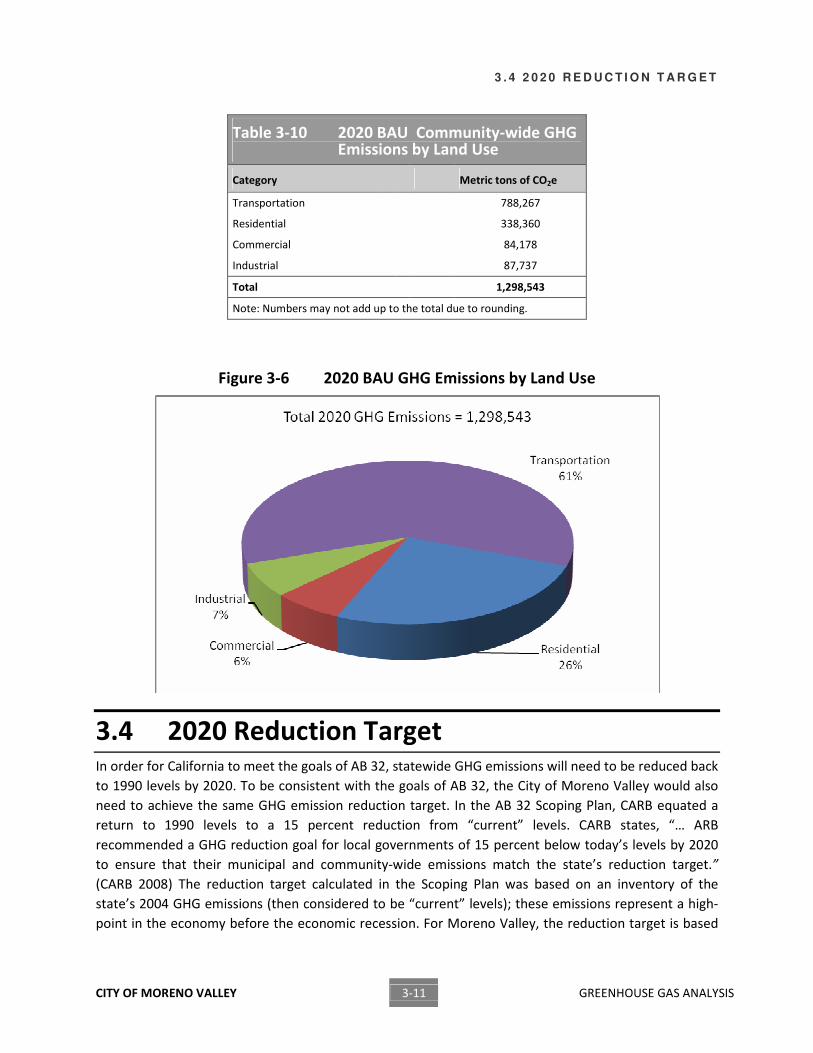
3 . 4 2 0 2 0 R E D U C T I O N T A R G E T
CITY OF MORENO VALLEY 3-11 GREENHOUSE GAS ANALYSIS
Table 3-10 2020 BAU Community-wide GHG Emissions by Land Use
Category Metric tons of CO2e
Transportation 788,267
Residential 338,360
Commercial 84,178
Industrial 87,737
Total 1,298,543
Note: Numbers may not add up to the total due to rounding.
Figure 3-6 2020 BAU GHG Emissions by Land Use
3.4 2020 Reduction Target In order for California to meet the goals of AB 32, statewide GHG emissions will need to be reduced back
to 1990 levels by 2020. To be consistent with the goals of AB 32, the City of Moreno Valley would also
need to achieve the same GHG emission reduction target. In the AB 32 Scoping Plan, CARB equated a
return to 1990 levels to a 15 percent reduction from “current” levels. CARB states, “… ARB
recommended a GHG reduction goal for local governments of 15 percent below today’s levels by 2020
to ensure that their municipal and community-wide emissions match the state’s reduction target.”
(CARB 2008) The reduction target calculated in the Scoping Plan was based on an inventory of the
state’s 2004 GHG emissions (then considered to be “current” levels); these emissions represent a high-
point in the economy before the economic recession. For Moreno Valley, the reduction target is based
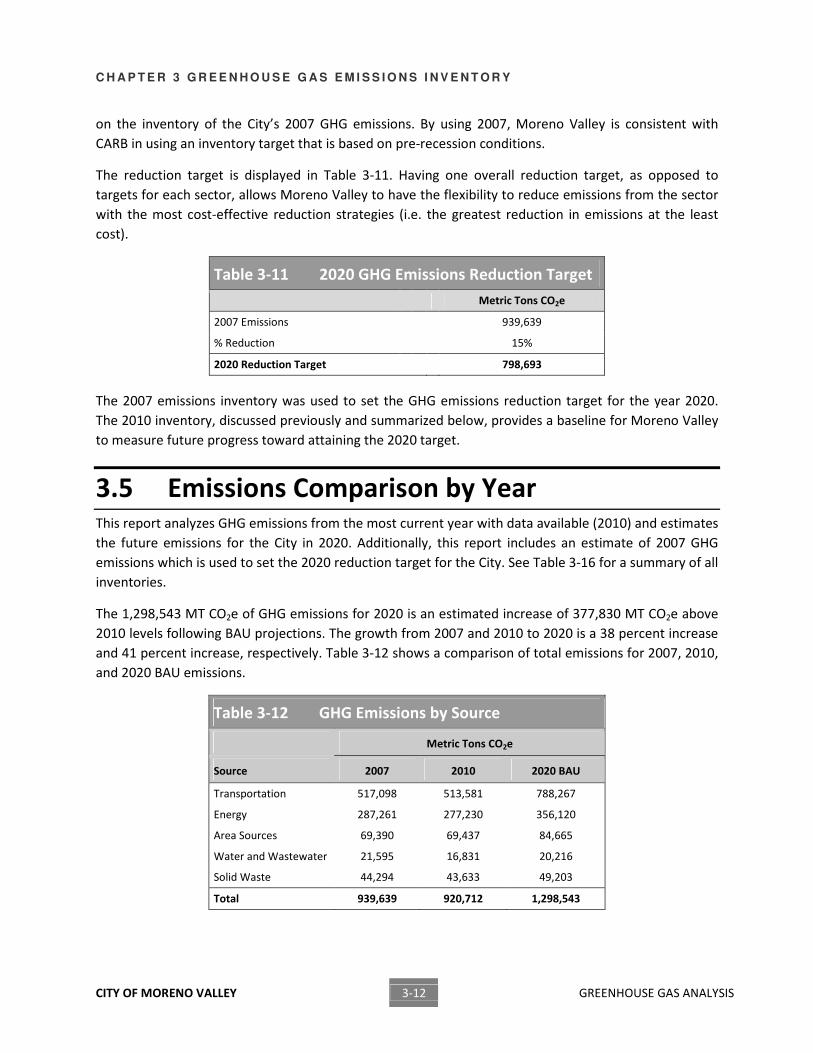
C H A P T E R 3 G R E E N H O U S E G A S E M I S S I O N S I N V E N T O R Y
CITY OF MORENO VALLEY 3-12 GREENHOUSE GAS ANALYSIS
on the inventory of the City’s 2007 GHG emissions. By using 2007, Moreno Valley is consistent with
CARB in using an inventory target that is based on pre-recession conditions.
The reduction target is displayed in Table 3-11. Having one overall reduction target, as opposed to
targets for each sector, allows Moreno Valley to have the flexibility to reduce emissions from the sector
with the most cost-effective reduction strategies (i.e. the greatest reduction in emissions at the least
cost).
Table 3-11 2020 GHG Emissions Reduction Target
Metric Tons CO2e
2007 Emissions 939,639
% Reduction 15%
2020 Reduction Target 798,693
The 2007 emissions inventory was used to set the GHG emissions reduction target for the year 2020.
The 2010 inventory, discussed previously and summarized below, provides a baseline for Moreno Valley
to measure future progress toward attaining the 2020 target.
3.5 Emissions Comparison by Year This report analyzes GHG emissions from the most current year with data available (2010) and estimates
the future emissions for the City in 2020. Additionally, this report includes an estimate of 2007 GHG
emissions which is used to set the 2020 reduction target for the City. See Table 3-16 for a summary of all
inventories.
The 1,298,543 MT CO2e of GHG emissions for 2020 is an estimated increase of 377,830 MT CO2e above
2010 levels following BAU projections. The growth from 2007 and 2010 to 2020 is a 38 percent increase
and 41 percent increase, respectively. Table 3-12 shows a comparison of total emissions for 2007, 2010,
and 2020 BAU emissions.
Table 3-12 GHG Emissions by Source
Metric Tons CO2e
Source 2007 2010 2020 BAU
Transportation 517,098 513,581 788,267
Energy 287,261 277,230 356,120
Area Sources 69,390 69,437 84,665
Water and Wastewater 21,595 16,831 20,216
Solid Waste 44,294 43,633 49,203
Total 939,639 920,712 1,298,543
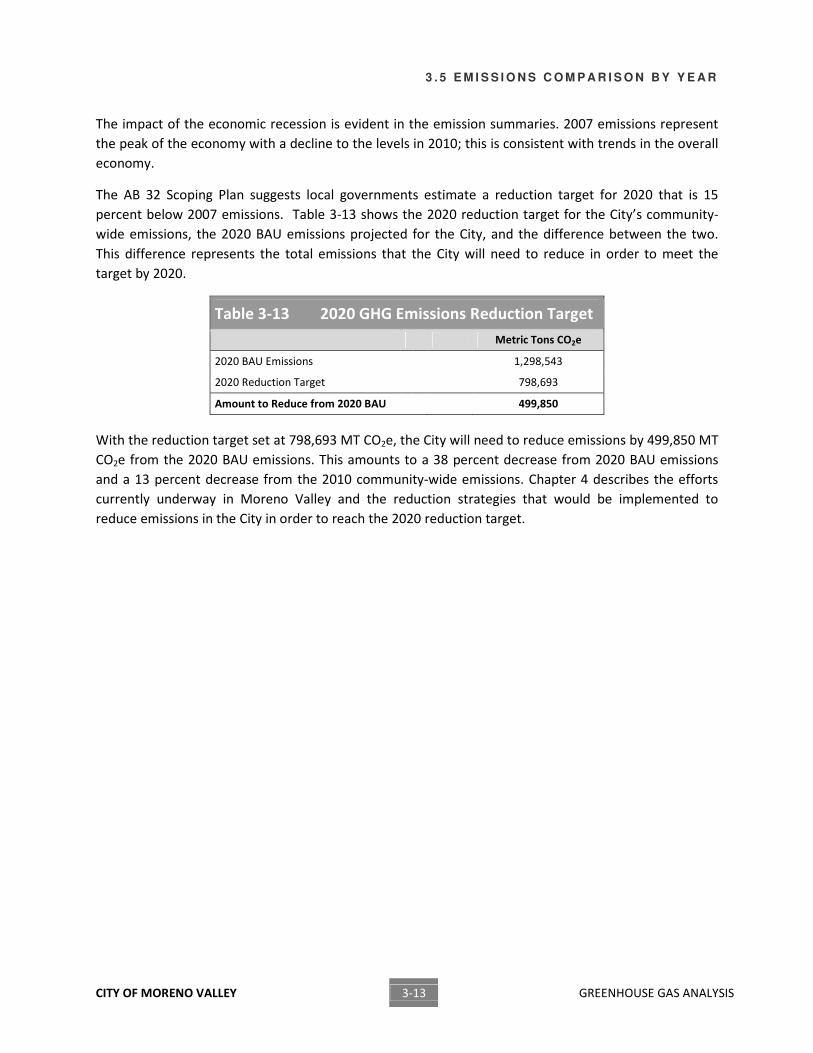
3 . 5 E M I S S I O N S C O M P A R I S O N B Y Y E A R
CITY OF MORENO VALLEY 3-13 GREENHOUSE GAS ANALYSIS
The impact of the economic recession is evident in the emission summaries. 2007 emissions represent
the peak of the economy with a decline to the levels in 2010; this is consistent with trends in the overall
economy.
The AB 32 Scoping Plan suggests local governments estimate a reduction target for 2020 that is 15
percent below 2007 emissions. Table 3-13 shows the 2020 reduction target for the City’s community-
wide emissions, the 2020 BAU emissions projected for the City, and the difference between the two.
This difference represents the total emissions that the City will need to reduce in order to meet the
target by 2020.
Table 3-13 2020 GHG Emissions Reduction Target
Metric Tons CO2e
2020 BAU Emissions 1,298,543
2020 Reduction Target 798,693
Amount to Reduce from 2020 BAU 499,850
With the reduction target set at 798,693 MT CO2e, the City will need to reduce emissions by 499,850 MT
CO2e from the 2020 BAU emissions. This amounts to a 38 percent decrease from 2020 BAU emissions
and a 13 percent decrease from the 2010 community-wide emissions. Chapter 4 describes the efforts
currently underway in Moreno Valley and the reduction strategies that would be implemented to
reduce emissions in the City in order to reach the 2020 reduction target.
C H A P T E R 3 G R E E N H O U S E G A S E M I S S I O N S I N V E N T O R Y
CITY OF MORENO VALLEY 3-14 GREENHOUSE GAS ANALYSIS
This page intentionally left blank.
CITY OF MORENO VALLEY 4-1 GREENHOUSE GAS ANALYSIS
Chapter 4 GHG Emissions Reduction Programs and Regulations
C H A P T E R 4 G H G E M I S S I O N S R E D U C T I O N P R O G R A M S A N D R E G U L A T I O N S
CITY OF MORENO VALLEY 4-2 GREENHOUSE GAS ANALYSIS
The State of California has set specific targets for reducing GHG
emissions from the burning of fossil fuels in both power plants and
vehicles by adopting various regulations. In addition, State energy
efficiency and renewable requirements provide another level of
reductions. In order to provide credit to Moreno Valley for
regulatory actions already taken or planned by the State of
California, this analysis first evaluates the GHG reductions that will
occur within the City as a result of these actions. These will be
identified as R1 reduction measures. The R1 measures are
included here to show all of the anticipated reduction strategies
identified in the AB 32 Scoping Plan for implementation at the State Level that will ultimately result in a
reduction of GHG emissions at the City level. The R1 measures are not administered or enforced by the
City, but the City - by describing them herein- substantiates the reductions associated with these State
Measures.
R2 and R3 reduction measures are measures that will be incorporated at the City level to provide
additional reductions in GHG emissions. R2 measures are those measures that can be quantified to show
the value of the reduction from the incorporation of those measures.
R3 measures are those measures that, although they provide a means through which reductions in
emissions will occur, cannot be quantified at this time. The R3 measures are supportive measures or
methods of implementation for the R2 measures. For example, R3-E2: Energy Efficiency Training and
Public education, is a measure that provides education to inform people of the programs, technology,
and potential funding available to them to be more energy efficient, and provides the incentives to
participate in the voluntary programs shown in R2-E1 through R2-E7. R3-E2 is supportive of measures
R2-E1 through R2-E7 because it will provide more publicity, reduce the perceived challenge of being
energy efficient, and provide information on potential rebates and other funding programs which will
make retrofits more accessible to everyone. Therefore, although by itself R3-E2 cannot be quantified, its
implementation provides a level of assurance that the reduction goals specified in the R2 measures will
be achieved.
Also included in the R3 measures are reduction measures that reduce Moreno Valley’s government
operation emissions. Government operations make up less than 2% of the City’s total emissions, but the
City can set an example for residents by implementing reduction measures at the municipal level.
Over the last few years Moreno Valley has implemented several programs that have already begun to
reduce the City’s GHG emissions and will continue to provide reductions through to 2020. Programs that
were in place prior to 2010 are accounted for in the existing inventory while programs implemented
since 2010 are included below as reduction measures used to reach the 2020 target.
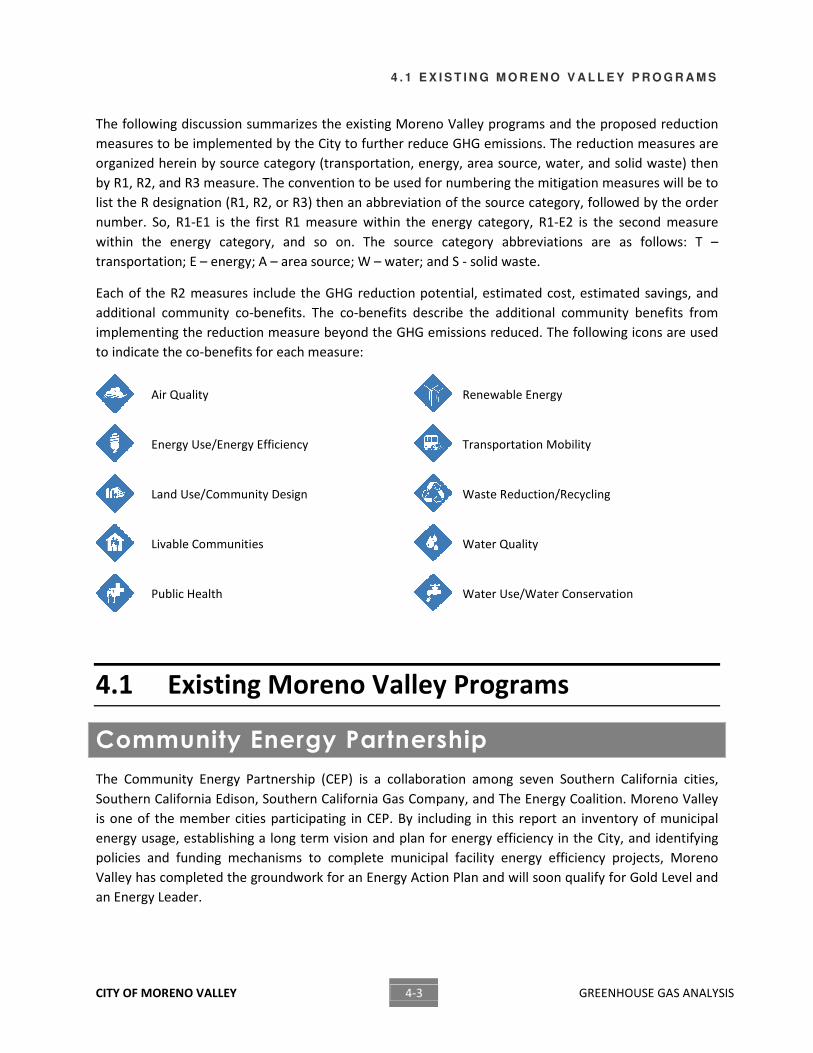
4 . 1 E X I S T I N G M O R E N O V A L L E Y P R O G R A M S
CITY OF MORENO VALLEY 4-3 GREENHOUSE GAS ANALYSIS
The following discussion summarizes the existing Moreno Valley programs and the proposed reduction
measures to be implemented by the City to further reduce GHG emissions. The reduction measures are
organized herein by source category (transportation, energy, area source, water, and solid waste) then
by R1, R2, and R3 measure. The convention to be used for numbering the mitigation measures will be to
list the R designation (R1, R2, or R3) then an abbreviation of the source category, followed by the order
number. So, R1-E1 is the first R1 measure within the energy category, R1-E2 is the second measure
within the energy category, and so on. The source category abbreviations are as follows: T –
transportation; E – energy; A – area source; W – water; and S - solid waste.
Each of the R2 measures include the GHG reduction potential, estimated cost, estimated savings, and
additional community co-benefits. The co-benefits describe the additional community benefits from
implementing the reduction measure beyond the GHG emissions reduced. The following icons are used
to indicate the co-benefits for each measure:
Air Quality
Renewable Energy
Energy Use/Energy Efficiency
Transportation Mobility
Land Use/Community Design
Waste Reduction/Recycling
Livable Communities
Water Quality
Public Health
Water Use/Water Conservation
4.1 Existing Moreno Valley Programs
Community Energy Partnership
The Community Energy Partnership (CEP) is a collaboration among seven Southern California cities,
Southern California Edison, Southern California Gas Company, and The Energy Coalition. Moreno Valley
is one of the member cities participating in CEP. By including in this report an inventory of municipal
energy usage, establishing a long term vision and plan for energy efficiency in the City, and identifying
policies and funding mechanisms to complete municipal facility energy efficiency projects, Moreno
Valley has completed the groundwork for an Energy Action Plan and will soon qualify for Gold Level and
an Energy Leader.
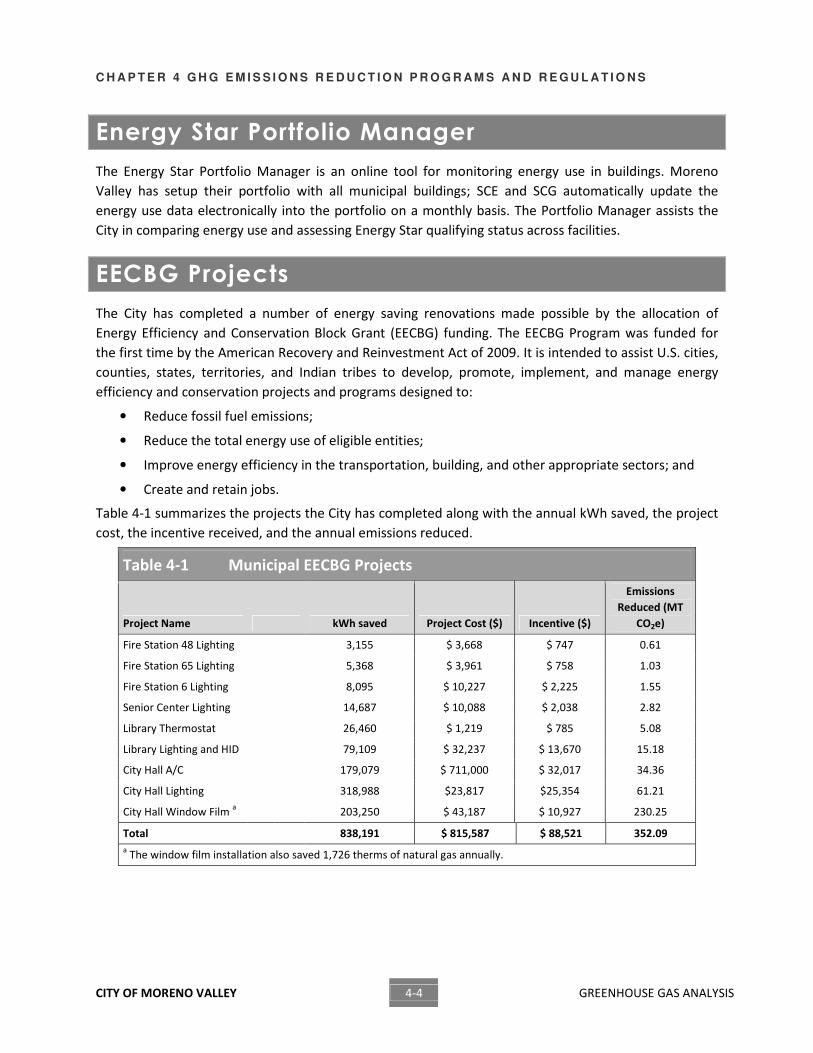
C H A P T E R 4 G H G E M I S S I O N S R E D U C T I O N P R O G R A M S A N D R E G U L A T I O N S
CITY OF MORENO VALLEY 4-4 GREENHOUSE GAS ANALYSIS
Energy Star Portfolio Manager
The Energy Star Portfolio Manager is an online tool for monitoring energy use in buildings. Moreno
Valley has setup their portfolio with all municipal buildings; SCE and SCG automatically update the
energy use data electronically into the portfolio on a monthly basis. The Portfolio Manager assists the
City in comparing energy use and assessing Energy Star qualifying status across facilities.
EECBG Projects
The City has completed a number of energy saving renovations made possible by the allocation of
Energy Efficiency and Conservation Block Grant (EECBG) funding. The EECBG Program was funded for
the first time by the American Recovery and Reinvestment Act of 2009. It is intended to assist U.S. cities,
counties, states, territories, and Indian tribes to develop, promote, implement, and manage energy
efficiency and conservation projects and programs designed to:
• Reduce fossil fuel emissions;
• Reduce the total energy use of eligible entities;
• Improve energy efficiency in the transportation, building, and other appropriate sectors; and
• Create and retain jobs.
Table 4-1 summarizes the projects the City has completed along with the annual kWh saved, the project
cost, the incentive received, and the annual emissions reduced.
Table 4-1 Municipal EECBG Projects
Project Name kWh saved Project Cost ($) Incentive ($)
Emissions
Reduced (MT
CO2e)
Fire Station 48 Lighting 3,155 $ 3,668 $ 747 0.61
Fire Station 65 Lighting 5,368 $ 3,961 $ 758 1.03
Fire Station 6 Lighting 8,095 $ 10,227 $ 2,225 1.55
Senior Center Lighting 14,687 $ 10,088 $ 2,038 2.82
Library Thermostat 26,460 $ 1,219 $ 785 5.08
Library Lighting and HID 79,109 $ 32,237 $ 13,670 15.18
City Hall A/C 179,079 $ 711,000 $ 32,017 34.36
City Hall Lighting 318,988 $23,817 $25,354 61.21
City Hall Window Film a
203,250 $ 43,187 $ 10,927 230.25
Total 838,191 $ 815,587 $ 88,521 352.09
a The window film installation also saved 1,726 therms of natural gas annually.
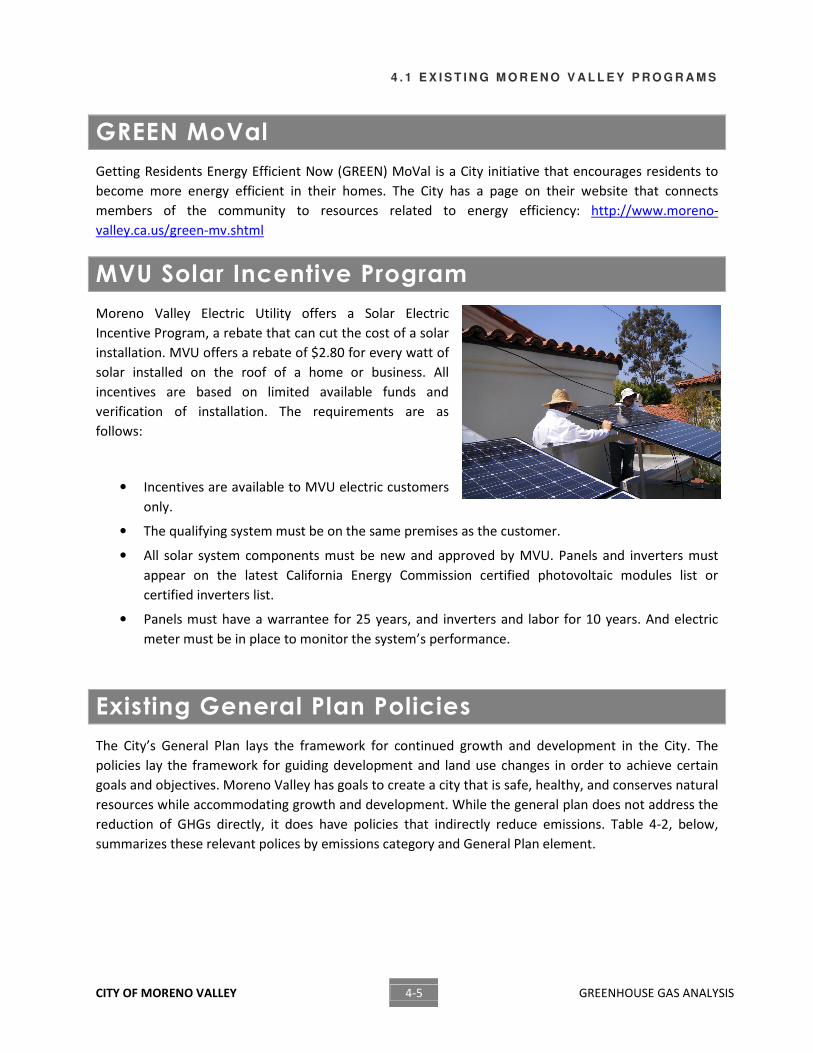
4 . 1 E X I S T I N G M O R E N O V A L L E Y P R O G R A M S
CITY OF MORENO VALLEY 4-5 GREENHOUSE GAS ANALYSIS
GREEN MoVal
Getting Residents Energy Efficient Now (GREEN) MoVal is a City initiative that encourages residents to
become more energy efficient in their homes. The City has a page on their website that connects
members of the community to resources related to energy efficiency: http://www.moreno-
valley.ca.us/green-mv.shtml
MVU Solar Incentive Program
Moreno Valley Electric Utility offers a Solar Electric
Incentive Program, a rebate that can cut the cost of a solar
installation. MVU offers a rebate of $2.80 for every watt of
solar installed on the roof of a home or business. All
incentives are based on limited available funds and
verification of installation. The requirements are as
follows:
• Incentives are available to MVU electric customers
only.
• The qualifying system must be on the same premises as the customer.
• All solar system components must be new and approved by MVU. Panels and inverters must
appear on the latest California Energy Commission certified photovoltaic modules list or
certified inverters list.
• Panels must have a warrantee for 25 years, and inverters and labor for 10 years. And electric
meter must be in place to monitor the system’s performance.
Existing General Plan Policies
The City’s General Plan lays the framework for continued growth and development in the City. The
policies lay the framework for guiding development and land use changes in order to achieve certain
goals and objectives. Moreno Valley has goals to create a city that is safe, healthy, and conserves natural
resources while accommodating growth and development. While the general plan does not address the
reduction of GHGs directly, it does have policies that indirectly reduce emissions. Table 4-2, below,
summarizes these relevant polices by emissions category and General Plan element.
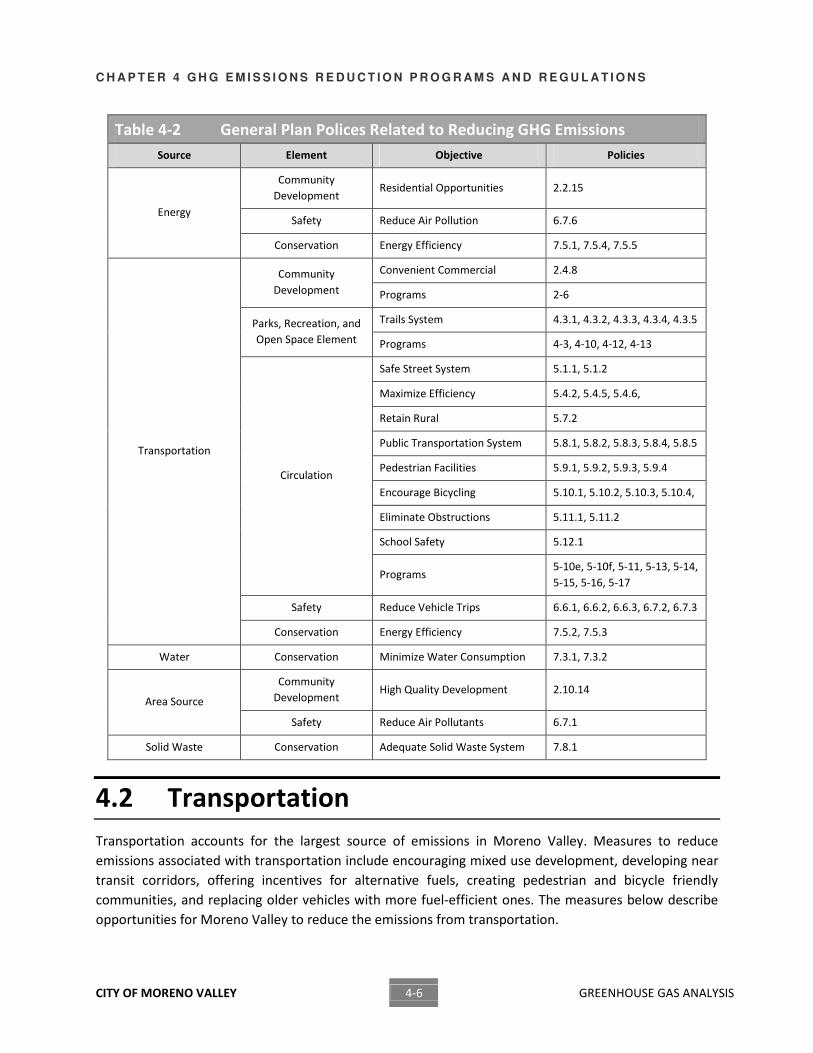
C H A P T E R 4 G H G E M I S S I O N S R E D U C T I O N P R O G R A M S A N D R E G U L A T I O N S
CITY OF MORENO VALLEY 4-6 GREENHOUSE GAS ANALYSIS
Table 4-2 General Plan Polices Related to Reducing GHG Emissions
Source Element Objective Policies
Community
Development Residential Opportunities 2.2.15
Safety Reduce Air Pollution 6.7.6 Energy
Conservation Energy Efficiency 7.5.1, 7.5.4, 7.5.5
Convenient Commercial 2.4.8 Community
Development Programs 2-6
Trails System 4.3.1, 4.3.2, 4.3.3, 4.3.4, 4.3.5 Parks, Recreation, and
Open Space Element Programs 4-3, 4-10, 4-12, 4-13
Safe Street System 5.1.1, 5.1.2
Maximize Efficiency 5.4.2, 5.4.5, 5.4.6,
Retain Rural 5.7.2
Public Transportation System 5.8.1, 5.8.2, 5.8.3, 5.8.4, 5.8.5
Pedestrian Facilities 5.9.1, 5.9.2, 5.9.3, 5.9.4
Encourage Bicycling 5.10.1, 5.10.2, 5.10.3, 5.10.4,
Eliminate Obstructions 5.11.1, 5.11.2
School Safety 5.12.1
Circulation
Programs 5-10e, 5-10f, 5-11, 5-13, 5-14,
5-15, 5-16, 5-17
Safety Reduce Vehicle Trips 6.6.1, 6.6.2, 6.6.3, 6.7.2, 6.7.3
Transportation
Conservation Energy Efficiency 7.5.2, 7.5.3
Water Conservation Minimize Water Consumption 7.3.1, 7.3.2
Community
Development High Quality Development 2.10.14
Area Source
Safety Reduce Air Pollutants 6.7.1
Solid Waste Conservation Adequate Solid Waste System 7.8.1
4.2 Transportation
Transportation accounts for the largest source of emissions in Moreno Valley. Measures to reduce
emissions associated with transportation include encouraging mixed use development, developing near
transit corridors, offering incentives for alternative fuels, creating pedestrian and bicycle friendly
communities, and replacing older vehicles with more fuel-efficient ones. The measures below describe
opportunities for Moreno Valley to reduce the emissions from transportation.
4 . 2 T R A N S P O R T A T I O N
CITY OF MORENO VALLEY 4-7 GREENHOUSE GAS ANALYSIS
R1 Transportation Measures The following list of R1 transportation related measures are those measures that California has
identified in the AB 32 Scoping Plan that will result in emission reductions within the City.
R1-T1: ASSEMBLY BILL 1493: PAVLEY I Assembly Bill (AB) 1493 (Pavley) required the California Air Resources Board (CARB) to adopt regulations
that will reduce GHG from automobiles and light-duty trucks by 30 percent below 2002 levels by the
year 2016, effective with 2009 models. By 2020, this requirement will reduce emissions in California by
approximately 16.4 MMTCO2e, representing 17.3 percent of emissions from passenger/light-duty
vehicles in the State (CARB 2008). Implementation of Pavley I was delayed by the USEPA’s denial of
California’s waiver request to set State standards that are more stringent than the federal standards, but
in June 2009 the denial of the waiver was reversed and California was able to begin enforcing the Pavley
requirements.
R1-T2: ASSEMBLY BILL 1493: PAVLEY II California committed to further strengthening the AB1493 standards beginning in 2017 to obtain a 45
percent GHG reduction from 2020 model year vehicles. This requirement will reduce emissions in
California by approximately 4.0 MMTCO2e, representing 2.5 percent of emissions from passenger/light-
duty vehicles in the State beyond the reductions from the Pavley I regulations described above (CARB
2008).
R1-T3: EXECUTIVE ORDER S-1-07 (LOW CARBON FUEL STANDARD) The Low Carbon Fuel Standard (LCFS) will require a reduction of at least ten (10) percent in the carbon
intensity of California's transportation fuels by 2020. By 2020, this requirement will reduce emissions in
California by approximately 15 MMTCO2e, representing 6.9 percent of emissions from passenger/light-
duty vehicles in the State (CARB 2008). The emissions reduced by this strategy overlap with emissions as
a result of the Pavley legislation; adding the emissions reductions would be an overestimate of the
actual emissions reductions. This is accounted for in the emission reduction calculations following the
methodology used by CARB to calculate emissions reductions in the AB 32 Scoping Plan.
R1-T4: TIRE PRESSURE PROGRAM The AB 32 early action measure involves actions to ensure that vehicle tire pressure is maintained to
manufacturer specifications. The State’s plan for implementing this measure is directed at automotive
service providers. CARB is requiring automotive service providers to check and inflate each vehicle’s
tires to the recommended tire pressure rating at the time of performing any automotive maintenance or
repair service, indicate on the vehicle service invoice that a tired inflation service was completed and the
tire pressure measurements after the services were performed, and keep a copy of the service invoice
for a minimum of three years, and make the vehicle service invoice available to the ARB, or its
authorized representative upon request. By 2020, CARB estimates that this requirement will reduce
emissions in California by approximately 0.55 MMTCO2e, representing 0.3 percent of emissions from
passenger/light-duty vehicles in the State (CARB 2008).
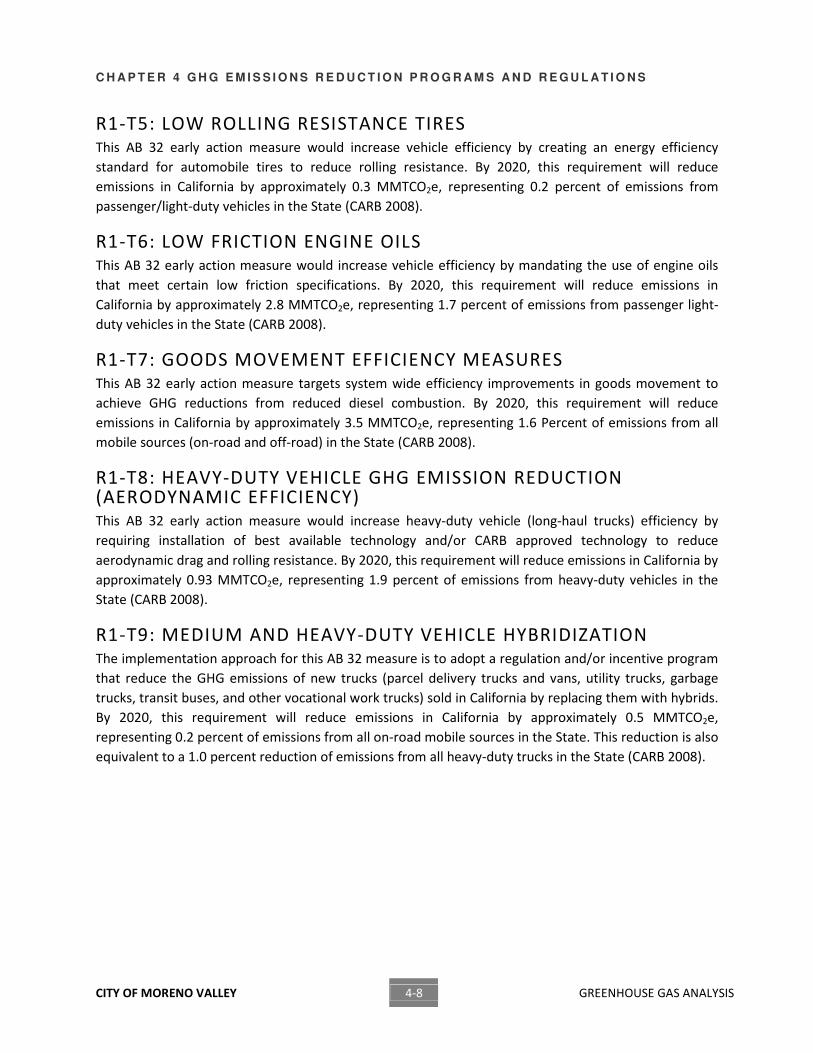
C H A P T E R 4 G H G E M I S S I O N S R E D U C T I O N P R O G R A M S A N D R E G U L A T I O N S
CITY OF MORENO VALLEY 4-8 GREENHOUSE GAS ANALYSIS
R1-T5: LOW ROLLING RESISTANCE TIRES This AB 32 early action measure would increase vehicle efficiency by creating an energy efficiency
standard for automobile tires to reduce rolling resistance. By 2020, this requirement will reduce
emissions in California by approximately 0.3 MMTCO2e, representing 0.2 percent of emissions from
passenger/light-duty vehicles in the State (CARB 2008).
R1-T6: LOW FRICTION ENGINE OILS This AB 32 early action measure would increase vehicle efficiency by mandating the use of engine oils
that meet certain low friction specifications. By 2020, this requirement will reduce emissions in
California by approximately 2.8 MMTCO2e, representing 1.7 percent of emissions from passenger light-
duty vehicles in the State (CARB 2008).
R1-T7: GOODS MOVEMENT EFFICIENCY MEASURES This AB 32 early action measure targets system wide efficiency improvements in goods movement to
achieve GHG reductions from reduced diesel combustion. By 2020, this requirement will reduce
emissions in California by approximately 3.5 MMTCO2e, representing 1.6 Percent of emissions from all
mobile sources (on-road and off-road) in the State (CARB 2008).
R1-T8: HEAVY-DUTY VEHICLE GHG EMISSION REDUCTION (AERODYNAMIC EFFICIENCY) This AB 32 early action measure would increase heavy-duty vehicle (long-haul trucks) efficiency by
requiring installation of best available technology and/or CARB approved technology to reduce
aerodynamic drag and rolling resistance. By 2020, this requirement will reduce emissions in California by
approximately 0.93 MMTCO2e, representing 1.9 percent of emissions from heavy-duty vehicles in the
State (CARB 2008).
R1-T9: MEDIUM AND HEAVY-DUTY VEHICLE HYBRIDIZATION The implementation approach for this AB 32 measure is to adopt a regulation and/or incentive program
that reduce the GHG emissions of new trucks (parcel delivery trucks and vans, utility trucks, garbage
trucks, transit buses, and other vocational work trucks) sold in California by replacing them with hybrids.
By 2020, this requirement will reduce emissions in California by approximately 0.5 MMTCO2e,
representing 0.2 percent of emissions from all on-road mobile sources in the State. This reduction is also
equivalent to a 1.0 percent reduction of emissions from all heavy-duty trucks in the State (CARB 2008).
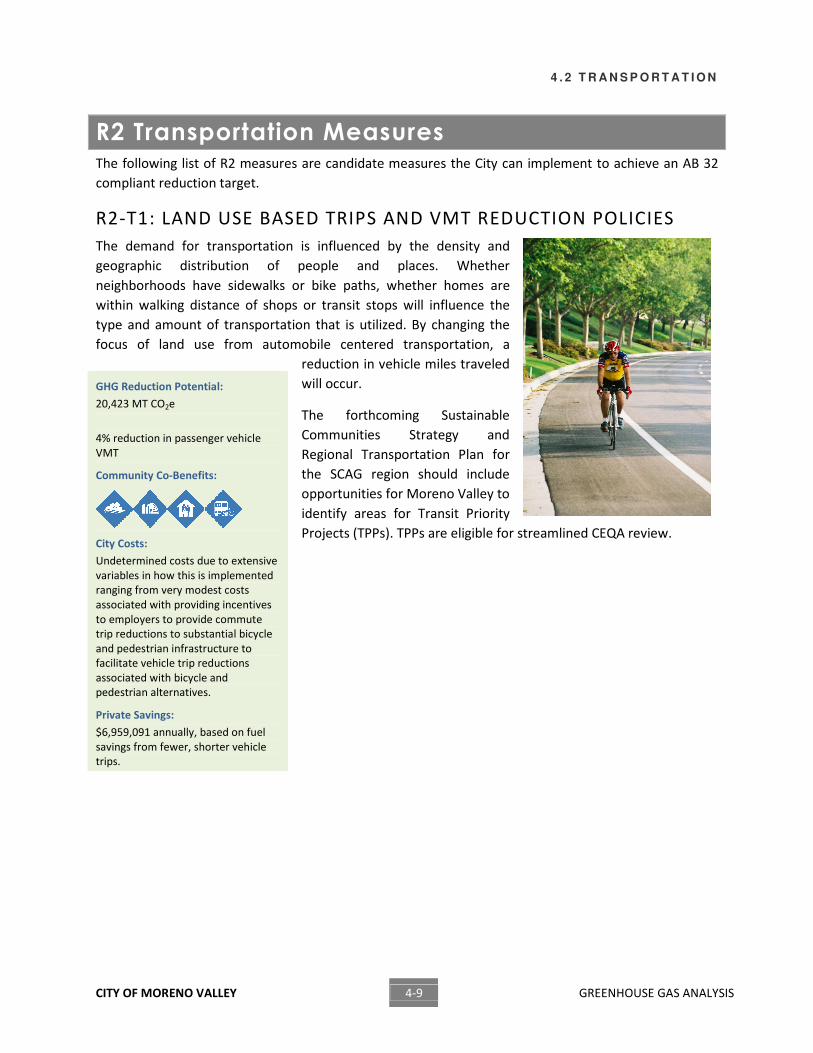
4 . 2 T R A N S P O R T A T I O N
CITY OF MORENO VALLEY 4-9 GREENHOUSE GAS ANALYSIS
R2 Transportation Measures The following list of R2 measures are candidate measures the City can implement to achieve an AB 32
compliant reduction target.
R2-T1: LAND USE BASED TRIPS AND VMT REDUCTION POLICIES
The demand for transportation is influenced by the density and
geographic distribution of people and places. Whether
neighborhoods have sidewalks or bike paths, whether homes are
within walking distance of shops or transit stops will influence the
type and amount of transportation that is utilized. By changing the
focus of land use from automobile centered transportation, a
reduction in vehicle miles traveled
will occur.
The forthcoming Sustainable
Communities Strategy and
Regional Transportation Plan for
the SCAG region should include
opportunities for Moreno Valley to
identify areas for Transit Priority
Projects (TPPs). TPPs are eligible for streamlined CEQA review.
GHG Reduction Potential:
20,423 MT CO2e
4% reduction in passenger vehicle
VMT
Community Co-Benefits:
City Costs:
Undetermined costs due to extensive
variables in how this is implemented
ranging from very modest costs
associated with providing incentives
to employers to provide commute
trip reductions to substantial bicycle
and pedestrian infrastructure to
facilitate vehicle trip reductions
associated with bicycle and
pedestrian alternatives.
Private Savings:
$6,959,091 annually, based on fuel
savings from fewer, shorter vehicle
trips.
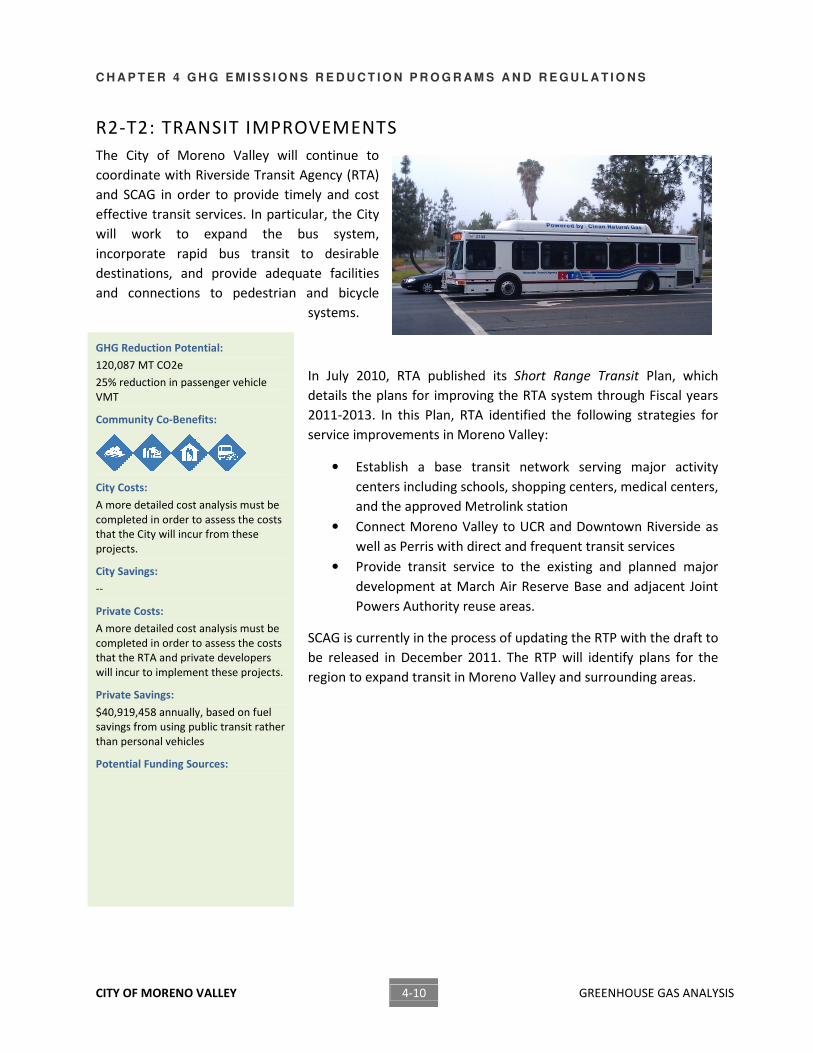
C H A P T E R 4 G H G E M I S S I O N S R E D U C T I O N P R O G R A M S A N D R E G U L A T I O N S
CITY OF MORENO VALLEY 4-10 GREENHOUSE GAS ANALYSIS
R2-T2: TRANSIT IMPROVEMENTS
The City of Moreno Valley will continue to
coordinate with Riverside Transit Agency (RTA)
and SCAG in order to provide timely and cost
effective transit services. In particular, the City
will work to expand the bus system,
incorporate rapid bus transit to desirable
destinations, and provide adequate facilities
and connections to pedestrian and bicycle
systems.
In July 2010, RTA published its Short Range Transit Plan, which
details the plans for improving the RTA system through Fiscal years
2011-2013. In this Plan, RTA identified the following strategies for
service improvements in Moreno Valley:
• Establish a base transit network serving major activity
centers including schools, shopping centers, medical centers,
and the approved Metrolink station
• Connect Moreno Valley to UCR and Downtown Riverside as
well as Perris with direct and frequent transit services
• Provide transit service to the existing and planned major
development at March Air Reserve Base and adjacent Joint
Powers Authority reuse areas.
SCAG is currently in the process of updating the RTP with the draft to
be released in December 2011. The RTP will identify plans for the
region to expand transit in Moreno Valley and surrounding areas.
GHG Reduction Potential:
120,087 MT CO2e
25% reduction in passenger vehicle
VMT
Community Co-Benefits:
City Costs:
A more detailed cost analysis must be
completed in order to assess the costs
that the City will incur from these
projects.
City Savings:
--
Private Costs:
A more detailed cost analysis must be
completed in order to assess the costs
that the RTA and private developers
will incur to implement these projects.
Private Savings:
$40,919,458 annually, based on fuel
savings from using public transit rather
than personal vehicles
Potential Funding Sources:
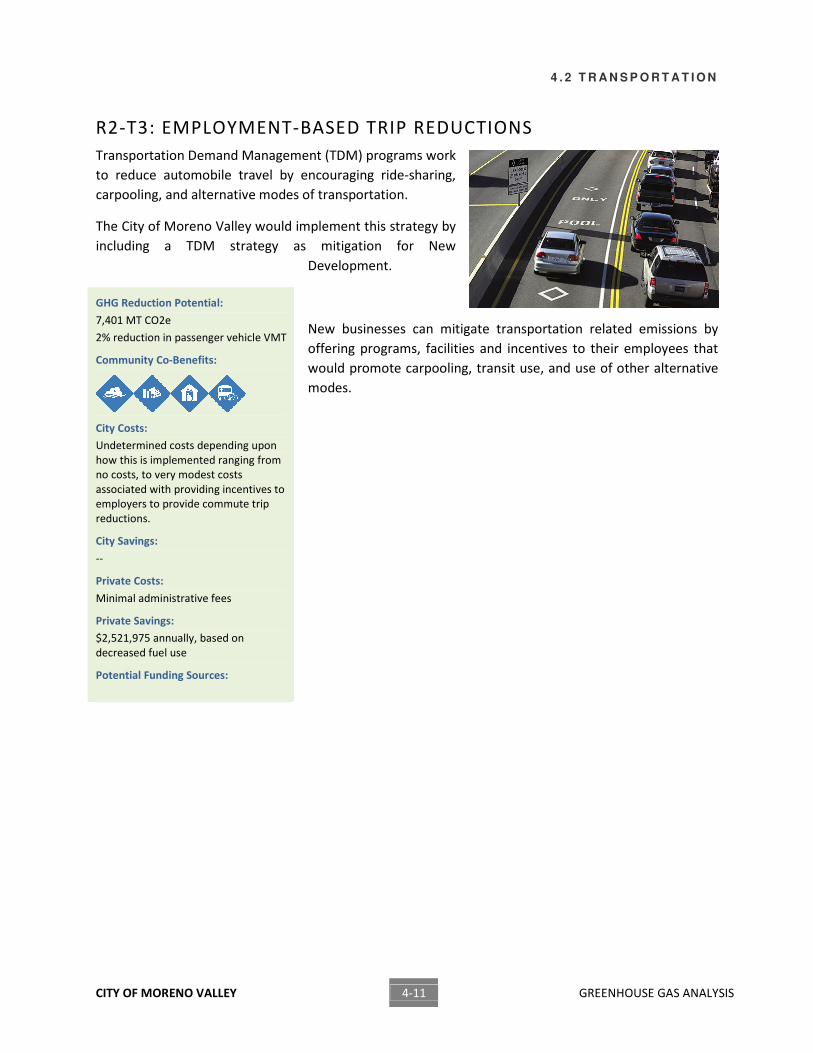
4 . 2 T R A N S P O R T A T I O N
CITY OF MORENO VALLEY 4-11 GREENHOUSE GAS ANALYSIS
R2-T3: EMPLOYMENT-BASED TRIP REDUCTIONS
Transportation Demand Management (TDM) programs work
to reduce automobile travel by encouraging ride-sharing,
carpooling, and alternative modes of transportation.
The City of Moreno Valley would implement this strategy by
including a TDM strategy as mitigation for New
Development.
New businesses can mitigate transportation related emissions by
offering programs, facilities and incentives to their employees that
would promote carpooling, transit use, and use of other alternative
modes.
GHG Reduction Potential:
7,401 MT CO2e
2% reduction in passenger vehicle VMT
Community Co-Benefits:
City Costs:
Undetermined costs depending upon
how this is implemented ranging from
no costs, to very modest costs
associated with providing incentives to
employers to provide commute trip
reductions.
City Savings:
--
Private Costs:
Minimal administrative fees
Private Savings:
$2,521,975 annually, based on
decreased fuel use
Potential Funding Sources:
C H A P T E R 4 G H G E M I S S I O N S R E D U C T I O N P R O G R A M S A N D R E G U L A T I O N S
CITY OF MORENO VALLEY 4-12 GREENHOUSE GAS ANALYSIS
R3 Transportation Measures The following R3 measures enhance and/or ensure the reductions accounted for within the R2 measures
through education programs or are measures that will reduce emissions but cannot be quantified. Also,
reduction measures implemented at the municipal level are described.
R3-T1: REGIONAL LAND USE AND TRANSPORTATION COORDINATION Promoting the development and use of transit between Moreno Valley and other jurisdictions including
the County and neighboring cities enhances the implementation of R2-T1 and R2-T2 described above.
4.3 Energy
Electricity and natural gas use in buildings represent the second largest source of emissions in the City of
Moreno Valley. The state has begun to address this source of emissions by requiring new buildings to
attain higher standards for energy efficiency and requiring utilities to use more renewable power
sources. At the local level, Moreno Valley can encourage developers to go beyond the state
requirements and offer incentives to bring older buildings up to current standards.
R1 Energy Reduction Measures The following list of R1 building energy efficiency related measures are those measures that California
has identified in the AB 32 Scoping Plan that will result in emission reductions within the City.
R1-E1: RENEWABLE PORTFOLIO STANDARD FOR BUILDING ENERGY USE Senate Bills (SBs) 1075 (2002) and 107 (2006) created the State's Renewable Portfolio Standard (RPS),
with an initial goal of 20 percent renewable energy production by 2010. Executive Order (EO) S-14-08
establishes a RPS target of 33 percent by the year 2020 and requires State agencies to take all
appropriate actions to ensure the target is met. In April 2011, Governor Jerry Brown signed Senate Bill 2
(2011), which codified the Executive Order and requires the State to reach the 2020 goal (CARB 2008).
R1-E2 AND R1-E3: AB 1109 ENERGY EFFICIENCY STANDARDS FOR LIGHTING (RESIDENTIAL AND COMMERCIAL INDOOR AND OUTDOOR LIGHTING) Assembly Bill (AB 1109) mandated that the California Energy Commission (CEC) on or before December
31, 2008, adopt energy efficiency standards for general purpose lighting. These regulations, combined
with other State efforts, shall be structured to reduce State-wide electricity consumption in the
following ways:
4 . 3 E N E R G Y
CITY OF MORENO VALLEY 4-13 GREENHOUSE GAS ANALYSIS
■ R1-E2: At least 50 percent reduction from 2007 levels for indoor residential lighting by 2018; and
■ R1-E3: At least 25 percent reduction from 2007 levels for indoor commercial and outdoor
lighting by 2018 (CARB 2008).
R1-E4: ELECTRICITY ENERGY EFFICIENCY (AB32) This measure captures the emission reductions associated with electricity
energy efficiency activities included in CARB's AB32 Scoping Plan that are
not attributed to other R1 or R2 reductions, as described in this report.
This measure includes energy efficiency measures that CARB views as
crucial to meeting the State-wide 2020 target, and will result in additional
emissions reductions beyond those already accounted for in California's
Energy Efficiency Standards for Residential and Non-Residential Buildings
(Title 24, Part 6 of the California Code of Regulations; hereinafter referred
to as, "Title 24 Energy Efficiency Standards") of California’s Green Building
Standards Code (Title 24, Part 11 of the California Code of Regulations;
hereinafter referred to as “CALGreen”).
By 2020, this requirement will reduce emissions in California by approximately 21.3 MMTCO2e,
representing 17.5 percent of emissions from all electricity in the State (CARB 2008). This measure
includes the following strategies:
■ “Zero Net Energy" buildings (buildings that combine energy efficiency and renewable generation
so that they, based on an annual average, extract no energy from the grid);
■ Broader standards for new types of appliances and for water efficiency;
■ Improved compliance and enforcement of existing standards;
■ Voluntary efficiency and green building targets beyond mandatory codes;
■ Voluntary and mandatory whole-building retrofits for existing buildings;
■ Innovative financing to overcome first-cost and split incentives for energy efficiency, on-site
renewables, and high efficiency distributed generation;
■ More aggressive utility programs to achieve long-term savings;
■ Water system and water use efficiency and conservation measures;
■ Additional industrial and agricultural efficiency initiatives; and
■ Providing real time energy information technologies to help consumers conserve and optimize
energy performance.
R1-E5: NATURAL GAS ENERGY EFFICIENCY (AB32) This measure captures the emission reductions associated with natural gas energy efficiency activities
included in CARB's AB32 Scoping Plan that are not attributed to other R1 or R2 reductions, as described
in this report. This measure includes energy efficiency measures that CARB views as crucial to meeting
C H A P T E R 4 G H G E M I S S I O N S R E D U C T I O N P R O G R A M S A N D R E G U L A T I O N S
CITY OF MORENO VALLEY 4-14 GREENHOUSE GAS ANALYSIS
the State-wide 2020 target, and will result in additional emissions reductions beyond those already
accounted for in the Title 24 Energy Efficiency Standards or CALGreen. By 2020, this requirement will
reduce emissions in California by approximately 4.3 MMTCO2e, representing 6.2 percent of emissions
from all natural gas combustion in the State (CARB 2008). This measure includes similar strategies to
those listed above for R1-E4.
R1-E6: INCREASED COMBINED HEAT AND POWER (AB32) This measure captures the reduction in building electricity emissions associated with the increase of
combined heat and power activities, as outlined in CARB's AB 32 Scoping Plan. The Scoping Plan suggests
that increased combined heat and power systems, which capture "waste heat" produced during power
generation for local use, will offset 30,000 GWh State-wide in 2020. Approaches to lowering market
barriers include utility-provided incentive payments, a possible CHP portfolio standard, transmission and
distribution support systems, or the use of feed-in tariffs. By 2020, this requirement will reduce
emissions in California by approximately 6.7 MMTCO2e, representing 7.6 percent of emissions from all
electricity in the State (CARB 2008).
R1-E7: INDUSTRIAL EFFICIENCY MEASURES (AB32) This measure captures the reduction in industrial building energy emissions associated with the energy
efficiency measures for industrial sources included in CARB's AB 32 Scoping Plan. By 2020, this
requirement will reduce emissions in California by approximately 1.0 MMTCO2e, representing 3.9
percent of emissions from all industrial natural gas combustion in the State (CARB 2008). CARB proposes
the following possible State-wide measures:
■ Oil and gas extraction regulations and programs to reduce fugitive CH4 emissions;
■ GHG leak reduction from oil and gas transmission;
■ Refinery flare recovery process improvements; and
■ Removal of methane exemption from existing refinery regulations.
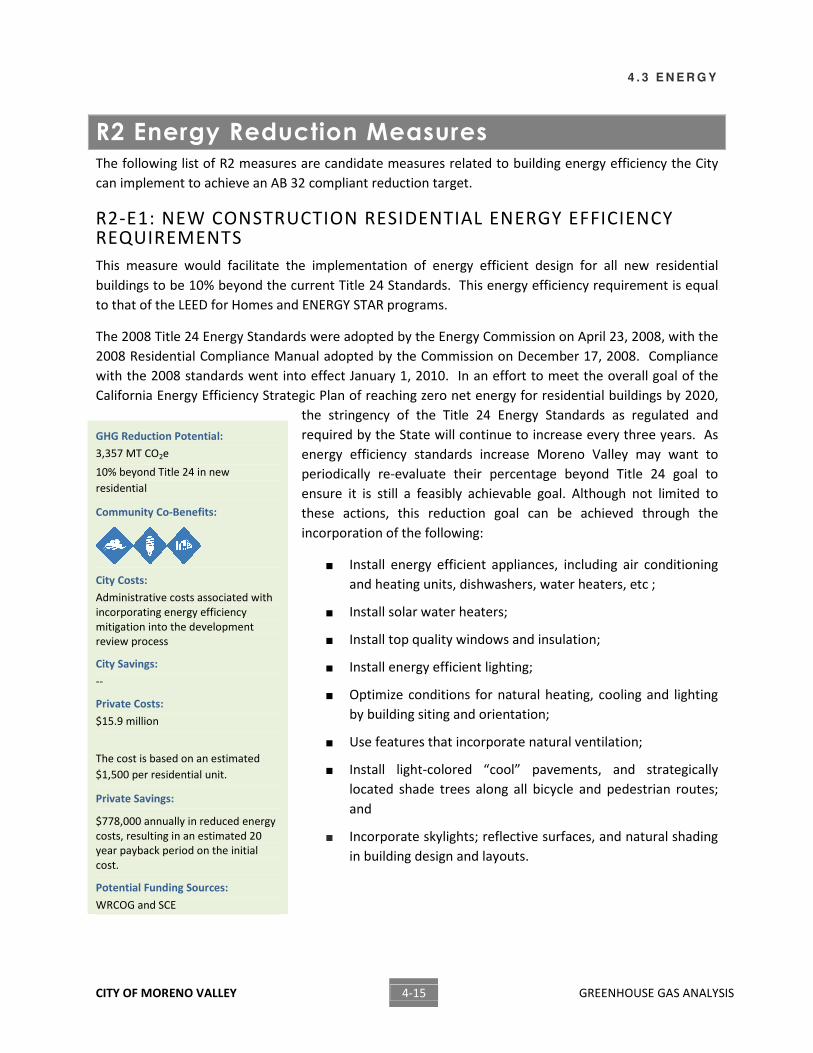
4 . 3 E N E R G Y
CITY OF MORENO VALLEY 4-15 GREENHOUSE GAS ANALYSIS
R2 Energy Reduction Measures The following list of R2 measures are candidate measures related to building energy efficiency the City
can implement to achieve an AB 32 compliant reduction target.
R2-E1: NEW CONSTRUCTION RESIDENTIAL ENERGY EFFICIENCY REQUIREMENTS
This measure would facilitate the implementation of energy efficient design for all new residential
buildings to be 10% beyond the current Title 24 Standards. This energy efficiency requirement is equal
to that of the LEED for Homes and ENERGY STAR programs.
The 2008 Title 24 Energy Standards were adopted by the Energy Commission on April 23, 2008, with the
2008 Residential Compliance Manual adopted by the Commission on December 17, 2008. Compliance
with the 2008 standards went into effect January 1, 2010. In an effort to meet the overall goal of the
California Energy Efficiency Strategic Plan of reaching zero net energy for residential buildings by 2020,
the stringency of the Title 24 Energy Standards as regulated and
required by the State will continue to increase every three years. As
energy efficiency standards increase Moreno Valley may want to
periodically re-evaluate their percentage beyond Title 24 goal to
ensure it is still a feasibly achievable goal. Although not limited to
these actions, this reduction goal can be achieved through the
incorporation of the following:
■ Install energy efficient appliances, including air conditioning
and heating units, dishwashers, water heaters, etc ;
■ Install solar water heaters;
■ Install top quality windows and insulation;
■ Install energy efficient lighting;
■ Optimize conditions for natural heating, cooling and lighting
by building siting and orientation;
■ Use features that incorporate natural ventilation;
■ Install light-colored “cool” pavements, and strategically
located shade trees along all bicycle and pedestrian routes;
and
■ Incorporate skylights; reflective surfaces, and natural shading
in building design and layouts.
GHG Reduction Potential:
3,357 MT CO2e
10% beyond Title 24 in new
residential
Community Co-Benefits:
City Costs:
Administrative costs associated with
incorporating energy efficiency
mitigation into the development
review process
City Savings:
--
Private Costs:
$15.9 million
The cost is based on an estimated
$1,500 per residential unit.
Private Savings:
$778,000 annually in reduced energy
costs, resulting in an estimated 20
year payback period on the initial
cost.
Potential Funding Sources:
WRCOG and SCE
C H A P T E R 4 G H G E M I S S I O N S R E D U C T I O N P R O G R A M S A N D R E G U L A T I O N S
CITY OF MORENO VALLEY 4-16 GREENHOUSE GAS ANALYSIS
R2-E2: NEW CONSTRUCTION RESIDENTIAL RENEWABLE ENERGY
This measure would facilitate the incorporation of renewable energy
(such as photovoltaic panels or small wind turbines) into new
residential developments. For participating developments,
renewable energy application should be such that the new home’s
projected energy use from the grid is reduced by 50%. The
California Energy Commissions’ New Solar Homes Partnership is a
component of the California Solar Initiative and provides rebates to
developers of 6 or more units where 50% of the units include solar
power. In addition this measure would encourage that all residents
be equipped with “solar ready” features where feasible, to
encourage future installation of solar energy systems. These
features should include the proper solar orientation (south facing
roof sloped at 20° to 55° from the horizontal), clear access on south
sloped roofs, electrical conduit installed for solar electric system
wiring, plumbing installed for solar hot water systems, and space
provided for a solar hot water tank. The incentive program should
provide enough funding and other incentives as shown in the R3
measures to result in approximately 20% of new residential
development participation in this program, thereby resulting in a
10% reduction in electrical consumption from new residential
developments.
As an alternative to, or in support of, providing onsite renewable
energy, the project proponent can buy into a purchased energy
offset program that will allow for the purchase of electricity
generated from renewable energy resources offsite. Purchased
energy offsets (or a combination of incorporated renewables and
purchased offsets) must be equal to 50% of the total projected
energy consumption for the development. See R3-E3 for further
details on the financing program.
GHG Reduction Potential:
1,252 MT CO2e
10% of energy in new residential from
on-site renewable energy
Community Co-Benefits:
City Costs:
Administrative costs associated with
incorporating alternative energy
mitigation into the development
review process
City Savings:
--
Private Costs:
$20 million
Costs assume 10% of units install 2kW
solar PV systems at $7,796/kW.
(Anders 2009)
Private Savings:
$760,000 annually in reduced energy
costs, resulting in an estimated 26 year
payback period on the initial cost.
Potential Funding Sources:
WRCOG and SCE
4 . 3 E N E R G Y
CITY OF MORENO VALLEY 4-17 GREENHOUSE GAS ANALYSIS
R2-E3: RESIDENTIAL ENERGY EFFICIENCY RETROFITS
This reduction measure would set a goal for the City to increase
energy efficiency in existing homes. With the rebates and incentive
programs currently available, this measure could allow for all
residential units to become, on average, 20% more efficient. One
key program ensuring the achievement of this reduction measures is
Moreno Valley’s partnership with the Western Riverside Council of
Governments (WRCOG) surrounding their Energy Efficiency and
Water Conservation Program (WRCOG 2009). The program would
provide residences with low-interest loans that can be used to
implement energy efficient improvements on their homes. This
program has the potential to reduce energy consumption in
retrofitted homes by a minimum of 15%. Although not limited to
these actions, this reduction goal can be achieved through the
incorporation of the following:
■ Replace inefficient air conditioning and heating units with
new energy efficient models;
■ Replace older, inefficient appliances with new energy
efficient models;
■ Replace old windows and insulation with top-quality
windows and insulation;
■ Install solar water heaters;
■ Replace inefficient and incandescent lighting with energy
efficient lighting; and
■ Weatherize the existing building to increase energy
efficiency.
GHG Reduction Potential:
33,418 MT CO2e
On average, all existing units become
20% more efficient
Community Co-Benefits:
Private Costs:
$49 million
Assumes cost is equal to $0.75/kWh
and $4.35/therm saved. (Anders 2009)
Private Savings:
$7.7 million annually in reduced
energy costs, resulting in an estimated
6 year payback period on the initial
cost.
Potential Funding Sources:
WRCOG and SCE
C H A P T E R 4 G H G E M I S S I O N S R E D U C T I O N P R O G R A M S A N D R E G U L A T I O N S
CITY OF MORENO VALLEY 4-18 GREENHOUSE GAS ANALYSIS
R2-E4: RESIDENTIAL RENEWABLE ENERGY RETROFITS
This measure would set a goal for City residents to retrofit their
homes with photovoltaic panels or small wind turbines such that
50% of the home’s electrical usage is offset. With the current
rebates and incentives available, a participation rate of 20% can be
achieved. In particular, the California Energy Commission’s Solar
Initiative has incentives available to home owners. In addition,
WRCOG’s Energy Efficiency and Water Conservation Program helps
finance solar photovoltaic systems for residents.
Residents may also be eligible for an MVU rebate of $2.80 for every
watt of solar installed on the roof of a home.
GHG Reduction Potential:
5,750 MT CO2e
10% of energy in residential from on-
site renewable energy
Community Co-Benefits:
City Costs:
Undetermined costs depending upon
how this is implemented ranging from
modest administration costs to
moderate costs of incentive programs.
City Savings:
--
Private Costs:
$81.1 million
Costs assume 10% of units install 2kW
solar PV systems at $7,796/kW.
(Anders 2009)
Private Savings:
$3.5 million annually in reduced
energy costs, resulting in an estimated
23 year payback period on the initial
cost.
Potential Funding Sources:
WRCOG, SCE, SEC, MVU Solar Incentive
4 . 3 E N E R G Y
CITY OF MORENO VALLEY 4-19 GREENHOUSE GAS ANALYSIS
R2-E5: NEW CONSTRUCTION COMMERCIAL ENERGY EFFICIENCY REQUIREMENTS
This measure would facilitate the implementation of energy efficient
design for all new commercial buildings to be 10% beyond the
current Title 24 Standards. This energy efficiency requirement meets
the minimum requirements of the LEED and ENERGY STAR programs.
As energy efficiency standards increase the City may want to
periodically re-evaluate their percentage beyond Title 24 goal to
ensure it is still a feasibly achievable goal. Although not limited to
these actions, this reduction goal can be achieved through the
incorporation of the following:
■ Install energy efficient appliances, including air conditioning
and heating units, dishwashers, water heaters, etc.;
■ Install solar water heaters;
■ Install top quality windows and insulation;
■ Install energy efficient lighting;
■ Optimize conditions for natural heating, cooling and lighting
by building siting and orientation;
■ Use features that incorporate natural ventilation;
■ Install light-colored “cool” pavements, and strategically
located shade trees along all bicycle and pedestrian routes;
and
■ Incorporate skylights; reflective surfaces, and natural
shading in building design and layouts.
GHG Reduction Potential:
3,357 MT CO2e
On average, all existing units become
10% more efficient
Community Co-Benefits:
City Costs:
Administrative costs associated with
incorporating energy efficiency
mitigation into the development
review process
City Savings:
--
Private Costs:
$9.7 million
The cost is based on an estimated
$1.00 per square foot to achieve 10%
beyond Title 24. (Anders 2009)
Private Savings:
$1.3 million annually in reduced
energy costs, resulting in an estimated
8 year payback period on the initial
cost.
Potential Funding Sources:
WRCOG and SCE
C H A P T E R 4 G H G E M I S S I O N S R E D U C T I O N P R O G R A M S A N D R E G U L A T I O N S
CITY OF MORENO VALLEY 4-20 GREENHOUSE GAS ANALYSIS
R2-E6: NEW CONSTRUCTION COMMERCIAL/INDUSTRIAL RENEWABLE ENERGY
This measure would facilitate the incorporation of renewable (solar
or other renewable) energy generation into the design and
construction of new commercial, office, and industrial
developments. Renewable energy generation would be
incorporated such that a minimum of 10% of the project’s total
energy needs are offset. In addition, this measure would encourage
all facilities be equipped with “solar ready” features where feasible,
to facilitate future installation of solar energy systems. These
features should include the proper solar orientation, clear access on
south sloped roofs, electrical conduit installed for solar electric
system wiring, plumbing installed for solar hot water systems, and
space provided for a solar hot water tank.
As an alternative to, or in support of, providing onsite renewable
energy, the project proponent could buy into an offset program that
will allow for the purchase of renewable energy resources offsite.
Purchased energy offsets (or a combination of incorporated
renewables and purchased offsets) must equal 20% of the total
projected energy consumption for the development. See R3-E3 for
further details on the financing program.
GHG Reduction Potential:
2,030 MT CO2e
10% of energy in commercial is from
on-site renewable energy
Community Co-Benefits:
City Costs:
Administrative costs associated with
incorporating alternative energy
mitigation into the development
review process
City Savings:
--
Private Costs:
$31.7 million
This cost represents 5kW of solar
photovoltaic per 10,000 square feet of
new commercial development at an
estimated $6,526/kW. (Anders 2009)
Private Savings:
$1.2 million annually in reduced
energy costs, resulting in an estimated
26 year payback period on the initial
cost.
Potential Funding Sources:
SCE, WRCOG
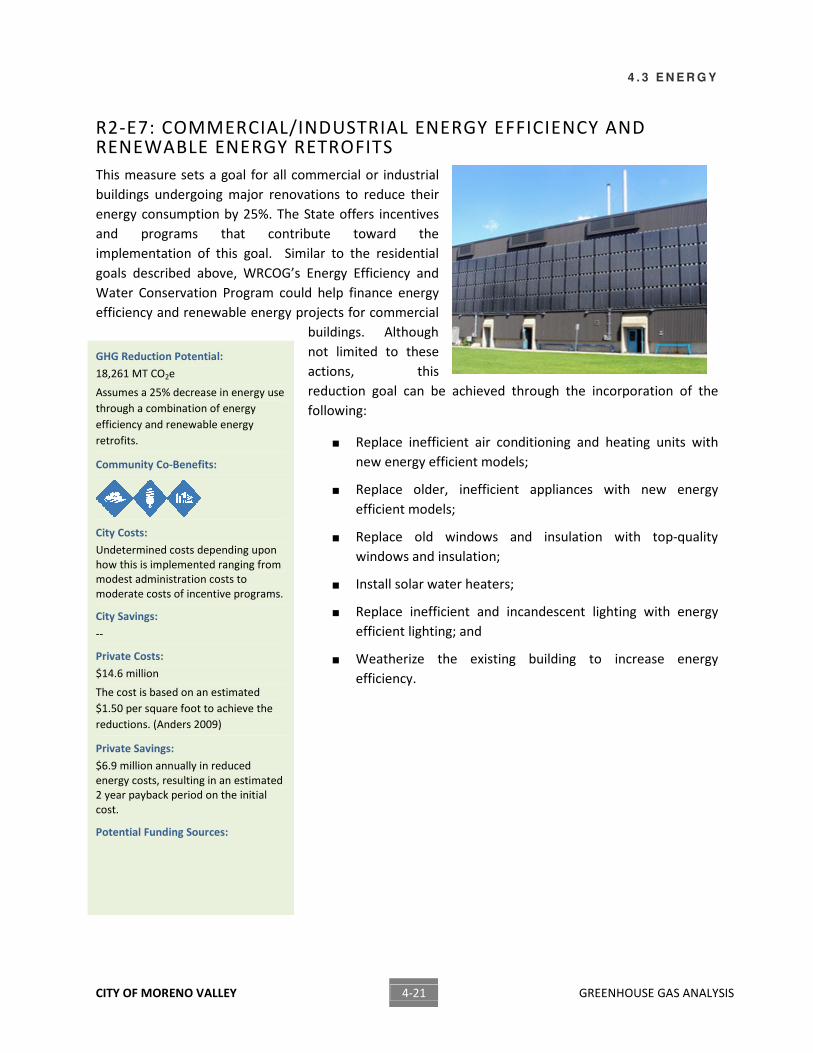
4 . 3 E N E R G Y
CITY OF MORENO VALLEY 4-21 GREENHOUSE GAS ANALYSIS
R2-E7: COMMERCIAL/INDUSTRIAL ENERGY EFFICIENCY AND RENEWABLE ENERGY RETROFITS
This measure sets a goal for all commercial or industrial
buildings undergoing major renovations to reduce their
energy consumption by 25%. The State offers incentives
and programs that contribute toward the
implementation of this goal. Similar to the residential
goals described above, WRCOG’s Energy Efficiency and
Water Conservation Program could help finance energy
efficiency and renewable energy projects for commercial
buildings. Although
not limited to these
actions, this
reduction goal can be achieved through the incorporation of the
following:
■ Replace inefficient air conditioning and heating units with
new energy efficient models;
■ Replace older, inefficient appliances with new energy
efficient models;
■ Replace old windows and insulation with top-quality
windows and insulation;
■ Install solar water heaters;
■ Replace inefficient and incandescent lighting with energy
efficient lighting; and
■ Weatherize the existing building to increase energy
efficiency.
GHG Reduction Potential:
18,261 MT CO2e
Assumes a 25% decrease in energy use
through a combination of energy
efficiency and renewable energy
retrofits.
Community Co-Benefits:
City Costs:
Undetermined costs depending upon
how this is implemented ranging from
modest administration costs to
moderate costs of incentive programs.
City Savings:
--
Private Costs:
$14.6 million
The cost is based on an estimated
$1.50 per square foot to achieve the
reductions. (Anders 2009)
Private Savings:
$6.9 million annually in reduced
energy costs, resulting in an estimated
2 year payback period on the initial
cost.
Potential Funding Sources:
C H A P T E R 4 G H G E M I S S I O N S R E D U C T I O N P R O G R A M S A N D R E G U L A T I O N S
CITY OF MORENO VALLEY 4-22 GREENHOUSE GAS ANALYSIS
R3 Energy Reduction Measures The following R3 measures enhance and/or ensure the reductions accounted for within the R2 measures
through education programs or are measures that will reduce emissions but cannot be quantified.
R3-E1: ENERGY EFFICIENT DEVELOPMENT, AND RENEWABLE ENERGY DEPLOYMENT FACILITATION AND STREAMLINING This measure would encourage the City to identify key opportunities for the implementation of green
building practices and the incorporation of renewable energy systems. This could include the updating
of codes and zoning requirements and guidelines. This measure could be further enhanced by providing
incentives for energy efficient projects such as priority in the reviewing, permitting, and inspection
process. Additional incentives could include flexibility in building requirements such as height limits or
set-backs in exchange for incorporating green building practices or renewable energy systems.
R3-E2: ENERGY EFFICIENCY TRAINING & PUBLIC EDUCATION This measure would strengthen Moreno Valley General Plan Policy Infrastructure & Utilities 7.6.8 which
provides public education and publicity about energy efficiency measures and reduction programs
available within the City through a variety of methods including newsletters, brochures, and the City’s
Website. This measure would enhance this existing program by including rebates and incentives
available for residences and businesses as well as providing training in green building materials,
techniques, and practices for all plan review and building inspection staff.
R3-E3: ENERGY EFFICIENCY AND SOLAR ENERGY FINANCING This measure would facilitate the incorporation of innovative, grant funded or low-interest financing
programs for energy efficiency and renewable energy projects for both existing and new developments.
This would include financing for heating, ventilation, air conditioning, lighting, water heating equipment,
insulation, weatherization, and residential and commercial renewable energy. The City is a member of a
partnership with WRCOG surrounding their Energy Efficiency and Water Conservation Program. The
program would provide property with low-interest loans that would be repaid over time through annual
property tax payments.
R3-E4: CROSS-JURISDICTIONAL COORDINATION Under this reduction measure the City would coordinate with other local governments, special districts,
nonprofit, and other organizations in order to optimize energy efficiency and renewable resource
development and usage. This would allow for economies of scale and shared resources to more
effectively implement these environmental enhancements.
R3-E5: ALTERNATIVE ENERGY DEVELOPMENT PLAN The accomplishment of this measure would encourage the City and MVU to work with SCE to explore
the possibilities for producing energy by renewable means within the built environment. This would be
developed to identify appropriate alternative energy facilities (i.e., photovoltaic) for use within
residential and commercial developments. The Alternative Energy Development Plan will encourage the
4 . 4 A R E A S O U R C E
CITY OF MORENO VALLEY 4-23 GREENHOUSE GAS ANALYSIS
establishment of City policies and ordinances to address how alternative energy production would be
conducted. This measure would identify the most optimal locations and the best means by which to
avoid noise, aesthetics and other land use compatibility conflicts. Another provision of this Plan could
be to identify possible sites for the production of renewable energy using local renewable sources such
as solar, wind, small hydro, and/or biogas. This would encourage adopting measures to protect these
resources and providing right-of-way easements, utility easements, or by setting aside land for future
development of these potential production sites.
4.4 Area Source The following list includes measures related to landscaping and wood burning emissions that will reduce
emissions and help the City to achieve an AB 32 compliant reduction target.
R1 Area Source Reduction Measure
R1-L1: SCAQMD HEALTHY HEARTHS PROGRAM AQMD’s Rule 445-Wood Burning Devices, adopted on March 7, 2008, applies to residents in the South
Coast Air Basin and includes the following key components:
■ No permanently installed indoor or outdoor wood burning devices in new developments;
■ Establishes a mandatory wood burning curtailment program on high pollution days during
November through February, beginning November 1, 2011. Based on current air quality
conditions, there may be 10 to 25 mandatory curtailment days in specific areas (AQMD 2008).
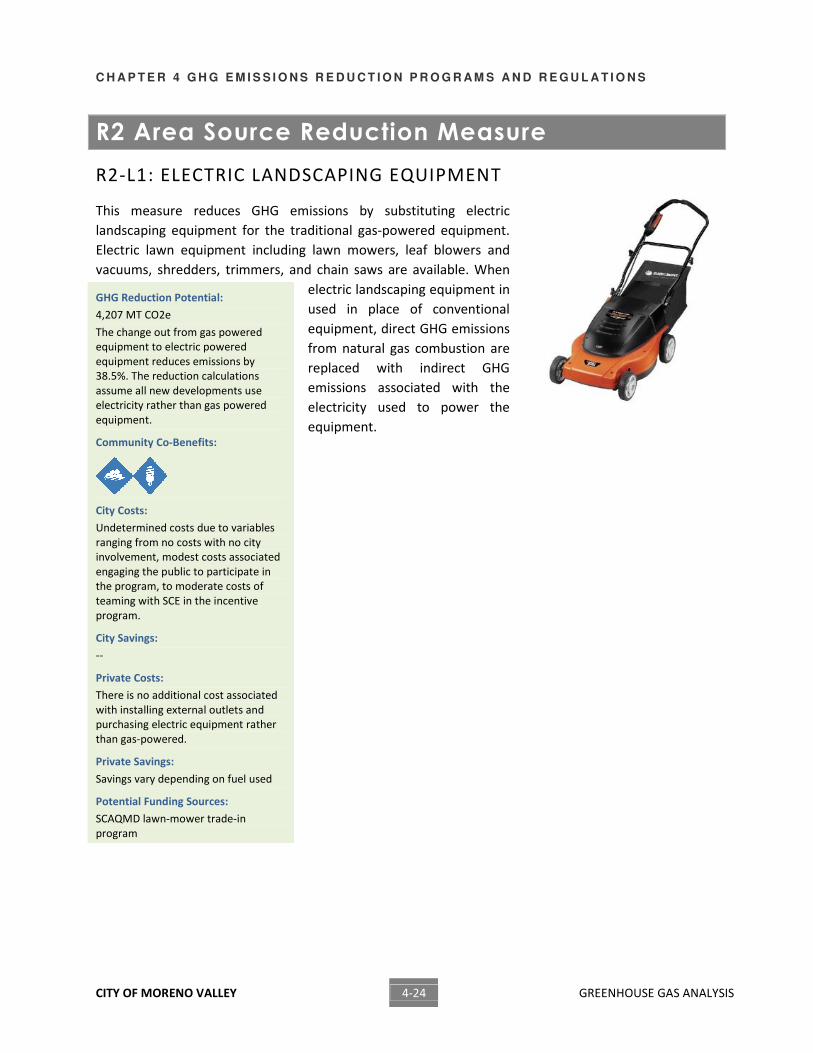
C H A P T E R 4 G H G E M I S S I O N S R E D U C T I O N P R O G R A M S A N D R E G U L A T I O N S
CITY OF MORENO VALLEY 4-24 GREENHOUSE GAS ANALYSIS
R2 Area Source Reduction Measure
R2-L1: ELECTRIC LANDSCAPING EQUIPMENT
This measure reduces GHG emissions by substituting electric
landscaping equipment for the traditional gas-powered equipment.
Electric lawn equipment including lawn mowers, leaf blowers and
vacuums, shredders, trimmers, and chain saws are available. When
electric landscaping equipment in
used in place of conventional
equipment, direct GHG emissions
from natural gas combustion are
replaced with indirect GHG
emissions associated with the
electricity used to power the
equipment.
GHG Reduction Potential:
4,207 MT CO2e
The change out from gas powered
equipment to electric powered
equipment reduces emissions by
38.5%. The reduction calculations
assume all new developments use
electricity rather than gas powered
equipment.
Community Co-Benefits:
City Costs:
Undetermined costs due to variables
ranging from no costs with no city
involvement, modest costs associated
engaging the public to participate in
the program, to moderate costs of
teaming with SCE in the incentive
program.
City Savings:
--
Private Costs:
There is no additional cost associated
with installing external outlets and
purchasing electric equipment rather
than gas-powered.
Private Savings:
Savings vary depending on fuel used
Potential Funding Sources:
SCAQMD lawn-mower trade-in
program
4 . 5 W A T E R
CITY OF MORENO VALLEY 4-25 GREENHOUSE GAS ANALYSIS
R3 Area Source Reduction Measures The following R3 measures are related to landscape strategies that will help reduce GHG emissions and
can be incorporated into development projects without additional cost. These measures strategically
place trees and other landscape mechanisms that create shade to reduce the heat island effect within
parking lots and adjacent to buildings, which in turn, reduces the temperature of buildings and cars
during the summer.
R3-L1: EXPAND CITY TREE PLANTING This program evaluates the feasibility of expanding tree planting within the City. This includes the
evaluation of potential carbon sequestration from different tree species, potential reductions of building
energy use from shading, and GHG emissions associated with pumping water used for irrigation.
Commercial and retail development should be encouraged to exceed shading requirements by a
minimum of 10% and to plant low emission trees. In support of Environmental Resources Goal 10.10
from Moreno Valley’s General Plan, all future development shall be encouraged to preserve native trees
and vegetation to the furthest extent possible.
R3-L2: HEAT ISLAND PLAN The implementation of this measure would include promoting the use of cool roofs, cool pavements,
and parking lot shading by increasing the number of strategically placed shade trees. Further, City wide
Design Guidelines should be amended to include that all new developments and major renovations
(additions of 25,000 square feet or more) would be encouraged to incorporate the following strategies
such that heat gain would be reduced for 50% of the non-roof impervious site landscape (including
parking, roads, sidewalks, courtyards, and driveways). The strategies include:
■ Strategically placed shade trees;
■ Paving materials with a Solar Reflective Index (SRI) of at least 29;
■ Open grid pavement system; or
■ Covered parking (with shade or cover having an SRI of at least 29).
4.5 Water
Although emissions associated with water represent a small portion of the total emissions for the City,
Moreno Valley can still conserve water use in order to reduce the reliance on imported water from the
state and encourage the use of recycled water.
C H A P T E R 4 G H G E M I S S I O N S R E D U C T I O N P R O G R A M S A N D R E G U L A T I O N S
CITY OF MORENO VALLEY 4-26 GREENHOUSE GAS ANALYSIS
R1 Water Reduction Measure The following R1 water related reduction measure has been identified in the AB 32 Scoping Plan and will
result in emission reductions within the City.
R1-W1: RENEWABLE PORTFOLIO STANDARD (33 PERCENT BY 2020) RELATED TO WATER SUPPLY AND CONVEYANCE This measure would increase electricity production from eligible renewable power sources to 33 percent
by 2020. A reduction in GHG emissions results from replacing natural gas-fired electricity production
with zero GHG-emitting renewable sources of power. By 2020, this requirement will reduce emissions
from electricity used for water supply and conveyance in California by approximately 21.3 MMTCO2e,
representing 15.2 percent of emissions from electricity generation (in-State and imports) (CARB 2008).
R1-W2: CAL GREEN BUILDING STANDARDS
The 2010 California Green Building Standards (CALGreen) went into effect January 1, 2011. The
standards include a 20% mandated reduction in indoor water use for all residential and commercial
buildings. For outdoor water use, CALGreen requires developers to install landscaping devices that can
sense moisture content of soil and restrict landscaping-related water use when moisture content is high.
4 . 5 W A T E R
CITY OF MORENO VALLEY 4-27 GREENHOUSE GAS ANALYSIS
R2 Water Reduction Measure The following R2 measure is a candidate measure related to water that the City can implement to
achieve an AB 32 compliant reduction target.
R2-W1: WATER USE REDUCTION INITIATIVE
This initiative would reduce emissions associated with electricity
consumption for water treatment and conveyance. This measure
encourages the City to adopt a per capita water use reduction goal
in support of the Governors Executive Order S-14-08 which
mandates the reduction of water use of 20 percent per capita. The
City’s adoption of a water use reduction goal would introduce
requirements for new development and would provide cooperative
support for water purveyors that are required to implement these
reductions for existing developments. The City would also provide
internal reduction measures such that City facilities will support this
reduction requirement. The following represent potential programs
that could be implemented to attain this reduction goal.
WATER CONSERVATION PROGRAM
Under this program the excessive watering of landscaping, excessive
fountain operation, watering during peak daylight hours, water of
non-permeable surfaces, excessive water use for noncommercial
washing, and water use resulting in flooding or runoff would be
prohibited. In addition the program would encourage efficient
water use for construction activities, the installation of low-flow
toilets and showerheads for all new developments, use of drought-
tolerant plants with efficient landscape watering systems for all new
developments, recycling of water used for cooling systems, use of
pool covers, and the posting of water conservation signage at all
hotels.
WATER EFFICIENCY RETROFIT PROGRAM
This program would encourage upgrades in water efficiency for renovations or additions of residential,
commercial, office, and industrial properties equivalent to that of new developments. The City would
work with local water purveyors to achieve consistent standards, and to develop, approve, and review
procedures for implementation.
INCREASED RECYCLED WATER USE
Coordinate with EMWD to promote the use of municipal wastewater and graywater for agricultural,
industrial and irrigation purposes. This measure would be subject to approval of the State Health
Department and compliance with Title 22 provisions. This measure would facilitate the following:
GHG Reduction Potential:
3,493 MT CO2e
The calculated emission reductions
assume all new developments reduce
water consumption by 20%.
Community Co-Benefits:
City Costs:
Administrative costs associated with
water conservation included in the
development review process.
City Savings:
--
Private Costs:
Considered negligible if implemented
with new development
Private Savings:
$3.9 million annually in reduced water
costs.
Potential Funding Sources:
EMWD rebates
C H A P T E R 4 G H G E M I S S I O N S R E D U C T I O N P R O G R A M S A N D R E G U L A T I O N S
CITY OF MORENO VALLEY 4-28 GREENHOUSE GAS ANALYSIS
■ Inventory of non-potable water uses that could be substituted with recycled or graywater;
■ Determination of the feasibility of producing and distributing recycled water for groundwater
replenishment;
■ Determine the associated energy/GHG tradeoffs for treatment/use vs. out of basin water supply
usage;
■ Cooperation and coordination with responsible agencies to encourage the use of recycled water
where energy tradeoffs are favorable.
R3 Water Reduction Measure The following R3 measure enhances and/or ensures the reductions accounted for within the R2 measure
identified above.
R3-W1: WATER EFFICIENCY TRAINING AND EDUCATION Under this measure the City, in coordination with EMWD and local water purveyors would implement a
public information and education program that promotes water conservation. The program could
include certification programs for irrigation designers, installers, and managers, as well as classes to
promote the use of drought tolerant, native species and xeriscaping. This measure supports measure
R2-W1 discussed above.
4.6 Solid Waste
The following measures describe ways for the City of Moreno Valley to reduce the amount of waste sent
to the landfill and thus reduce the associated GHG emissions.
R1 Solid Waste Measure The following R1 solid waste related measure is a measure that California has identified in the AB 32
Scoping Plan that will result in emission reductions within the City.
R1-S1: WASTE MEASURES The CARB AB 32 Scoping Plan recommends three measures for reducing emissions from Municipal Solid
Waste at the State level, including: 1) landfill methane control; 2) increase the efficiency of landfill
methane capture; and 3) high recycling/zero waste. CARB approved a regulation implementing the
discrete early action program for methane recovery (1), which became effective June 17, 2010. This
measure is expected to result in a 1.0 MMTCO2e reduction by 2020 (CARB 2008). Other measures
proposed by CARB include increasing efficiency of landfill methane capture (2) and instituting high
recycling/zero waste policies (3). Potential reductions associated with these measures are still to be
determined.
4 . 6 S O L I D W A S T E
CITY OF MORENO VALLEY 4-29 GREENHOUSE GAS ANALYSIS
R1-S2: CAL GREEN CONSTRUCTION WASTE REDUCTION
The 2010 CALGreen Standards also include a measure for the reduction of construction waste. This
measure states that at least 50% of non-hazardous construction and demolition debris must be recycled
or salvaged. This reduces the amount of waste sent to the landfill and thus reduces GHG emissions
associated with the decomposition of solid waste.
R2 Solid Waste Measures The following R2 measure reduces emissions related to solid waste and helps Moreno Valley to achieve
an AB 32 compliant reduction target.
R2-S1: CITY DIVERSION PROGRAM
The state has set the following targets for Moreno Valley’s solid
waste disposal: 4.4 pounds per day (PPD) per resident and 31.8 PPD
per employee (equating to a diversion rate of 50%). As of 2009, the
City is below the target for both categories: 3.3 PPD per resident and
26 PPD per employee. To further reduce the amount of waste
disposed, and comply with AB 341, this measure would set a target
for the City to increase the waste diverted to 75% by 2020 (this
equates to 2.2 PPD per resident and 15.9 PPD per employee). The
following is a potential list of waste reduction measures that will
further strengthen existing waste reduction/diversion programs
along with coordination with Waste Management of the Inland
Empire and Riverside County Waste Management.
■ Provide outreach and education programs for residential,
commercial, and industrial land uses in order to further
promote existing City diversion programs;
■ Encourage businesses to adopt a voluntary procurement
standard and prioritize those products that have less
packaging, are reusable, or recyclable;
■ Support State level policies that provide incentives for
efficient and reduced packaging waste for commercial
products;
■ Provide waste audits;
■ Make recycling mandatory at all public events;
■ Support legislation which advocates for extended producer responsibility;
■ Reuse and recycle construction and demolition waste (including, but not limited to, soil,
vegetation, concrete, lumber, metal, and cardboard);
GHG Reduction Potential:
26,577 MT CO2e
The emissions reductions account for a
20% decrease in non-construction
waste sent to landfills. Non-
construction waste represents 87% of
Moreno Valley’s total waste.
Community Co-Benefits:
City Costs:
Administrative costs of including
construction material recycling,
interior and exterior recycling storage
areas in new development, and
recycling at public events.
City Savings:
--
Private Costs:
--
Private Savings:
Undetermined
Potential Funding Sources:
--
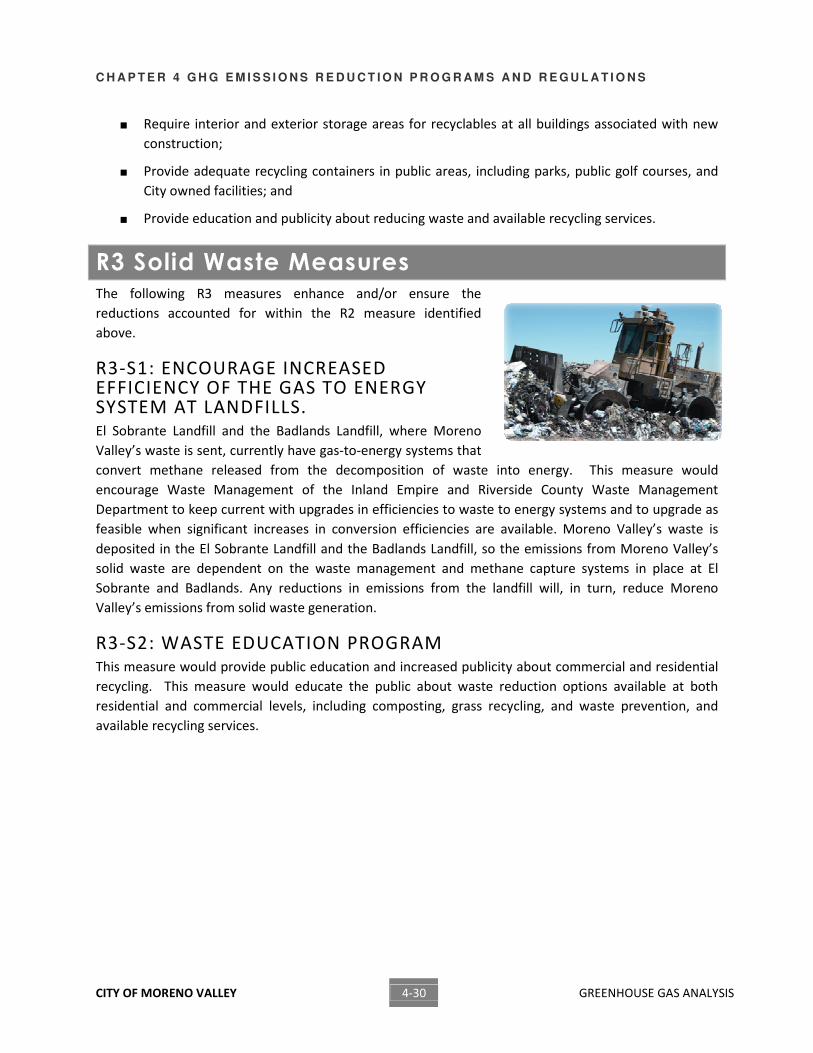
C H A P T E R 4 G H G E M I S S I O N S R E D U C T I O N P R O G R A M S A N D R E G U L A T I O N S
CITY OF MORENO VALLEY 4-30 GREENHOUSE GAS ANALYSIS
■ Require interior and exterior storage areas for recyclables at all buildings associated with new
construction;
■ Provide adequate recycling containers in public areas, including parks, public golf courses, and
City owned facilities; and
■ Provide education and publicity about reducing waste and available recycling services.
R3 Solid Waste Measures The following R3 measures enhance and/or ensure the
reductions accounted for within the R2 measure identified
above.
R3-S1: ENCOURAGE INCREASED EFFICIENCY OF THE GAS TO ENERGY SYSTEM AT LANDFILLS. El Sobrante Landfill and the Badlands Landfill, where Moreno
Valley’s waste is sent, currently have gas-to-energy systems that
convert methane released from the decomposition of waste into energy. This measure would
encourage Waste Management of the Inland Empire and Riverside County Waste Management
Department to keep current with upgrades in efficiencies to waste to energy systems and to upgrade as
feasible when significant increases in conversion efficiencies are available. Moreno Valley’s waste is
deposited in the El Sobrante Landfill and the Badlands Landfill, so the emissions from Moreno Valley’s
solid waste are dependent on the waste management and methane capture systems in place at El
Sobrante and Badlands. Any reductions in emissions from the landfill will, in turn, reduce Moreno
Valley’s emissions from solid waste generation.
R3-S2: WASTE EDUCATION PROGRAM This measure would provide public education and increased publicity about commercial and residential
recycling. This measure would educate the public about waste reduction options available at both
residential and commercial levels, including composting, grass recycling, and waste prevention, and
available recycling services.
CITY OF MORENO VALLEY 5-1 GREENHOUSE GAS ANALYSIS
Chapter 5 Total Estimated Reductions
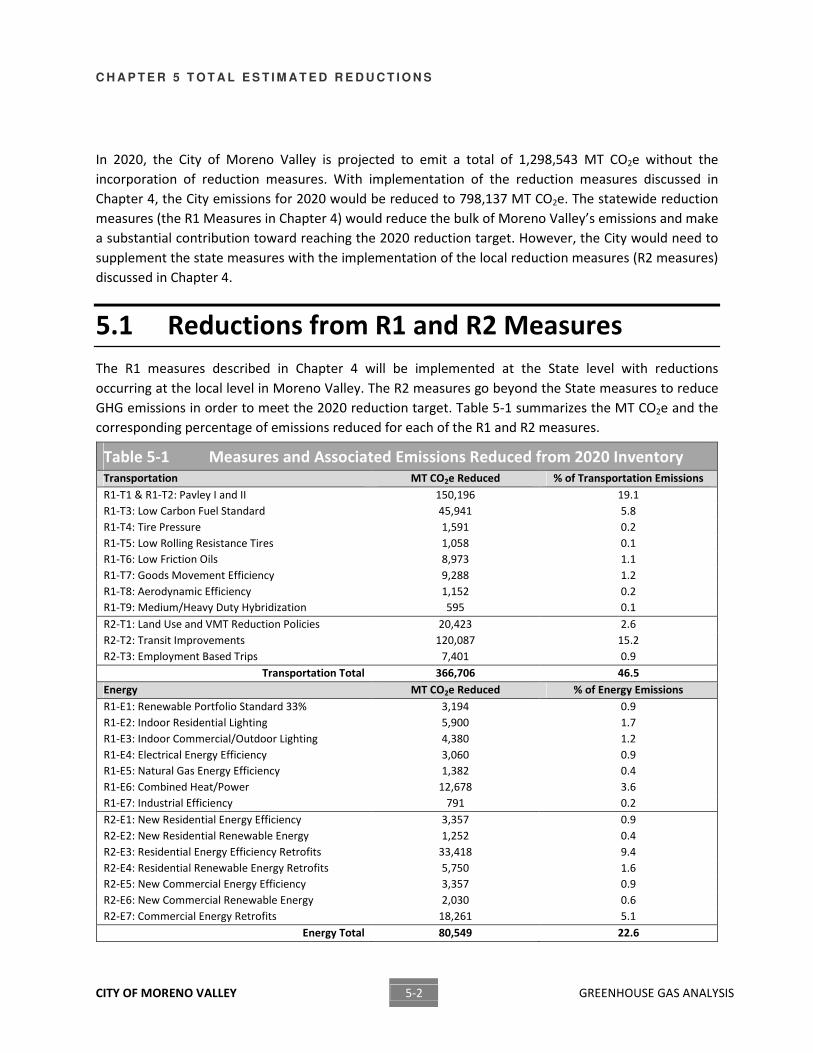
C H A P T E R 5 T O T A L E S T I M A T E D R E D U C T I O N S
CITY OF MORENO VALLEY 5-2 GREENHOUSE GAS ANALYSIS
In 2020, the City of Moreno Valley is projected to emit a total of 1,298,543 MT CO2e without the
incorporation of reduction measures. With implementation of the reduction measures discussed in
Chapter 4, the City emissions for 2020 would be reduced to 798,137 MT CO2e. The statewide reduction
measures (the R1 Measures in Chapter 4) would reduce the bulk of Moreno Valley’s emissions and make
a substantial contribution toward reaching the 2020 reduction target. However, the City would need to
supplement the state measures with the implementation of the local reduction measures (R2 measures)
discussed in Chapter 4.
5.1 Reductions from R1 and R2 Measures
The R1 measures described in Chapter 4 will be implemented at the State level with reductions
occurring at the local level in Moreno Valley. The R2 measures go beyond the State measures to reduce
GHG emissions in order to meet the 2020 reduction target. Table 5-1 summarizes the MT CO2e and the
corresponding percentage of emissions reduced for each of the R1 and R2 measures.
Table 5-1 Measures and Associated Emissions Reduced from 2020 Inventory Transportation MT CO2e Reduced % of Transportation Emissions
R1-T1 & R1-T2: Pavley I and II 150,196 19.1
R1-T3: Low Carbon Fuel Standard 45,941 5.8
R1-T4: Tire Pressure 1,591 0.2
R1-T5: Low Rolling Resistance Tires 1,058 0.1
R1-T6: Low Friction Oils 8,973 1.1
R1-T7: Goods Movement Efficiency 9,288 1.2
R1-T8: Aerodynamic Efficiency 1,152 0.2
R1-T9: Medium/Heavy Duty Hybridization 595 0.1
R2-T1: Land Use and VMT Reduction Policies 20,423 2.6
R2-T2: Transit Improvements 120,087 15.2
R2-T3: Employment Based Trips 7,401 0.9
Transportation Total 366,706 46.5
Energy MT CO2e Reduced % of Energy Emissions
R1-E1: Renewable Portfolio Standard 33% 3,194 0.9
R1-E2: Indoor Residential Lighting 5,900 1.7
R1-E3: Indoor Commercial/Outdoor Lighting 4,380 1.2
R1-E4: Electrical Energy Efficiency 3,060 0.9
R1-E5: Natural Gas Energy Efficiency 1,382 0.4
R1-E6: Combined Heat/Power 12,678 3.6
R1-E7: Industrial Efficiency 791 0.2
R2-E1: New Residential Energy Efficiency 3,357 0.9
R2-E2: New Residential Renewable Energy 1,252 0.4
R2-E3: Residential Energy Efficiency Retrofits 33,418 9.4
R2-E4: Residential Renewable Energy Retrofits 5,750 1.6
R2-E5: New Commercial Energy Efficiency 3,357 0.9
R2-E6: New Commercial Renewable Energy 2,030 0.6
R2-E7: Commercial Energy Retrofits 18,261 5.1
Energy Total 80,549 22.6
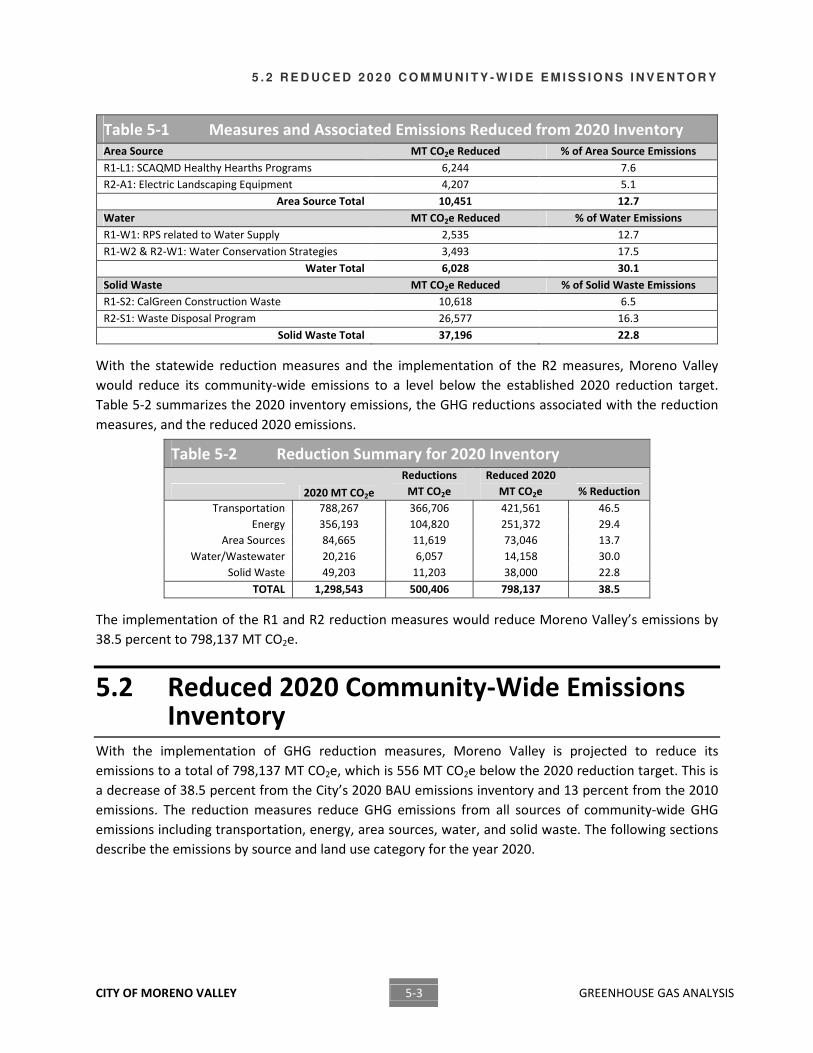
5 . 2 R E D U C E D 2 0 2 0 C O M M U N I T Y - W I D E E M I S S I O N S I N V E N T O R Y
CITY OF MORENO VALLEY 5-3 GREENHOUSE GAS ANALYSIS
Table 5-1 Measures and Associated Emissions Reduced from 2020 Inventory Area Source MT CO2e Reduced % of Area Source Emissions
R1-L1: SCAQMD Healthy Hearths Programs 6,244 7.6
R2-A1: Electric Landscaping Equipment 4,207 5.1
Area Source Total 10,451 12.7
Water MT CO2e Reduced % of Water Emissions
R1-W1: RPS related to Water Supply 2,535 12.7
R1-W2 & R2-W1: Water Conservation Strategies 3,493 17.5
Water Total 6,028 30.1
Solid Waste MT CO2e Reduced % of Solid Waste Emissions
R1-S2: CalGreen Construction Waste 10,618 6.5
R2-S1: Waste Disposal Program 26,577 16.3
Solid Waste Total 37,196 22.8
With the statewide reduction measures and the implementation of the R2 measures, Moreno Valley
would reduce its community-wide emissions to a level below the established 2020 reduction target.
Table 5-2 summarizes the 2020 inventory emissions, the GHG reductions associated with the reduction
measures, and the reduced 2020 emissions.
Table 5-2 Reduction Summary for 2020 Inventory
2020 MT CO2e
Reductions
MT CO2e
Reduced 2020
MT CO2e % Reduction
Transportation 788,267 366,706 421,561 46.5
Energy 356,193 104,820 251,372 29.4
Area Sources 84,665 11,619 73,046 13.7
Water/Wastewater 20,216 6,057 14,158 30.0
Solid Waste 49,203 11,203 38,000 22.8
TOTAL 1,298,543 500,406 798,137 38.5
The implementation of the R1 and R2 reduction measures would reduce Moreno Valley’s emissions by
38.5 percent to 798,137 MT CO2e.
5.2 Reduced 2020 Community-Wide Emissions Inventory
With the implementation of GHG reduction measures, Moreno Valley is projected to reduce its
emissions to a total of 798,137 MT CO2e, which is 556 MT CO2e below the 2020 reduction target. This is
a decrease of 38.5 percent from the City’s 2020 BAU emissions inventory and 13 percent from the 2010
emissions. The reduction measures reduce GHG emissions from all sources of community-wide GHG
emissions including transportation, energy, area sources, water, and solid waste. The following sections
describe the emissions by source and land use category for the year 2020.
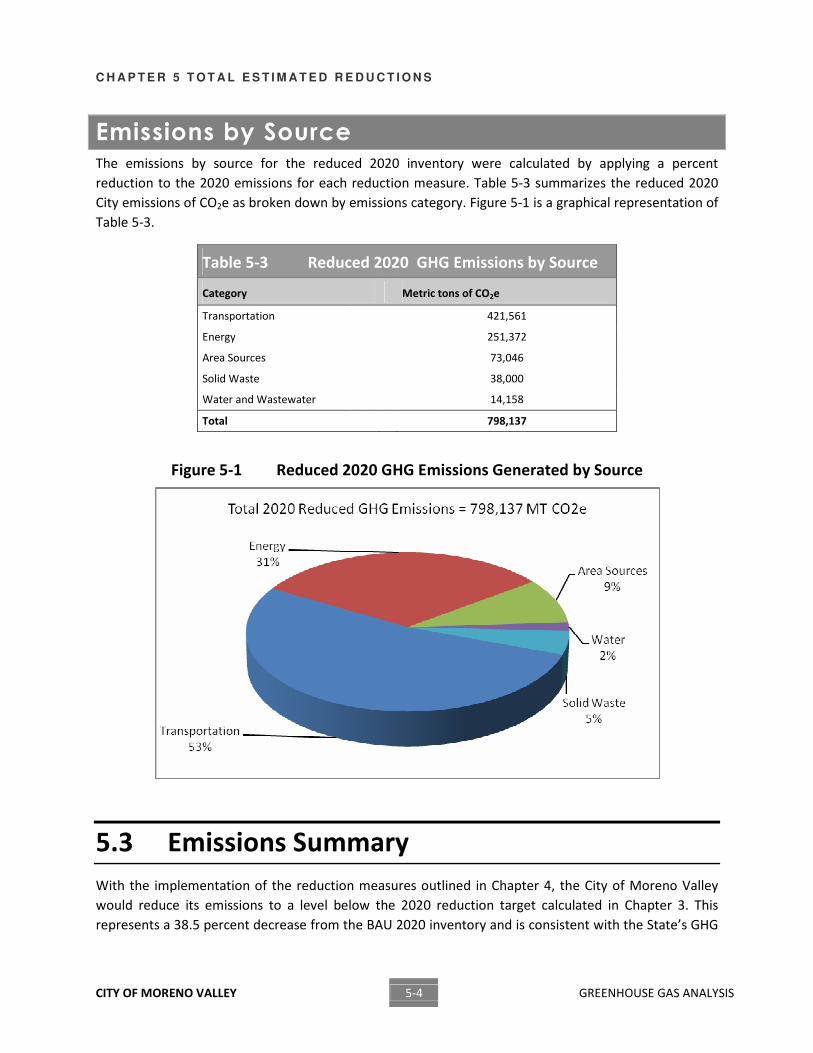
C H A P T E R 5 T O T A L E S T I M A T E D R E D U C T I O N S
CITY OF MORENO VALLEY 5-4 GREENHOUSE GAS ANALYSIS
Emissions by Source The emissions by source for the reduced 2020 inventory were calculated by applying a percent
reduction to the 2020 emissions for each reduction measure. Table 5-3 summarizes the reduced 2020
City emissions of CO2e as broken down by emissions category. Figure 5-1 is a graphical representation of
Table 5-3.
Table 5-3 Reduced 2020 GHG Emissions by Source
Category Metric tons of CO2e
Transportation 421,561
Energy 251,372
Area Sources 73,046
Solid Waste 38,000
Water and Wastewater 14,158
Total 798,137
Figure 5-1 Reduced 2020 GHG Emissions Generated by Source
5.3 Emissions Summary
With the implementation of the reduction measures outlined in Chapter 4, the City of Moreno Valley
would reduce its emissions to a level below the 2020 reduction target calculated in Chapter 3. This
represents a 38.5 percent decrease from the BAU 2020 inventory and is consistent with the State’s GHG
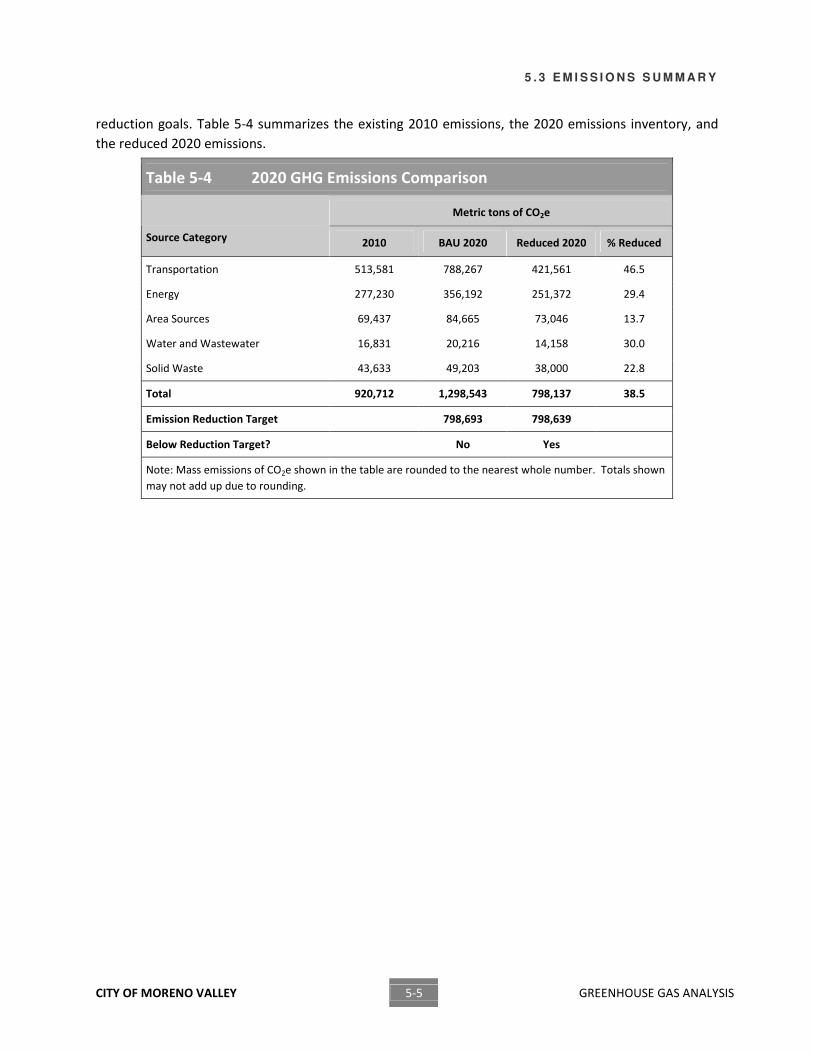
5 . 3 E M I S S I O N S S U M M A R Y
CITY OF MORENO VALLEY 5-5 GREENHOUSE GAS ANALYSIS
reduction goals. Table 5-4 summarizes the existing 2010 emissions, the 2020 emissions inventory, and
the reduced 2020 emissions.
Table 5-4 2020 GHG Emissions Comparison
Metric tons of CO2e
Source Category 2010 BAU 2020 Reduced 2020 % Reduced
Transportation
513,581 788,267 421,561 46.5
Energy 277,230 356,192 251,372 29.4
Area Sources
69,437 84,665 73,046 13.7
Water and Wastewater
16,831 20,216 14,158 30.0
Solid Waste
43,633 49,203 38,000 22.8
Total 920,712 1,298,543 798,137 38.5
Emission Reduction Target 798,693 798,639
Below Reduction Target? No Yes
Note: Mass emissions of CO2e shown in the table are rounded to the nearest whole number. Totals shown
may not add up due to rounding.


CITY OF MORENO VALLEY 6-1 GREENHOUSE GAS ANALYSIS
Chapter 6 Conclusion
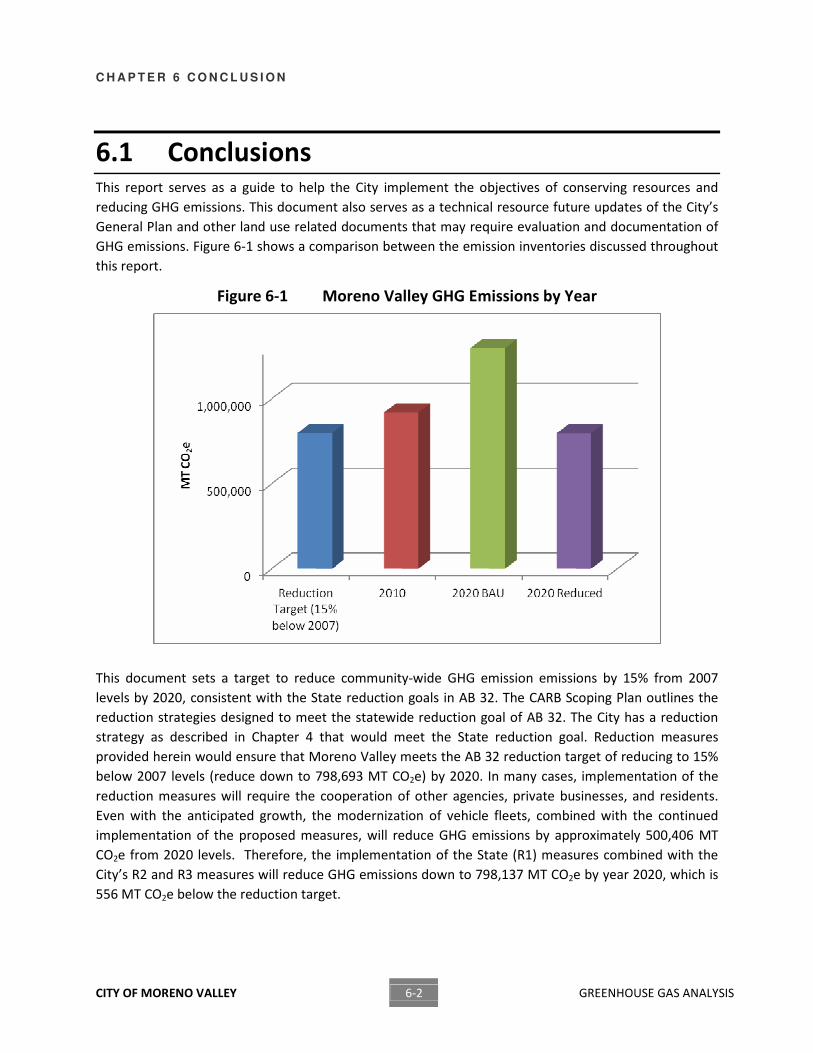
C H A P T E R 6 C O N C L U S I O N
CITY OF MORENO VALLEY 6-2 GREENHOUSE GAS ANALYSIS
6.1 Conclusions This report serves as a guide to help the City implement the objectives of conserving resources and
reducing GHG emissions. This document also serves as a technical resource future updates of the City’s
General Plan and other land use related documents that may require evaluation and documentation of
GHG emissions. Figure 6-1 shows a comparison between the emission inventories discussed throughout
this report.
Figure 6-1 Moreno Valley GHG Emissions by Year
This document sets a target to reduce community-wide GHG emission emissions by 15% from 2007
levels by 2020, consistent with the State reduction goals in AB 32. The CARB Scoping Plan outlines the
reduction strategies designed to meet the statewide reduction goal of AB 32. The City has a reduction
strategy as described in Chapter 4 that would meet the State reduction goal. Reduction measures
provided herein would ensure that Moreno Valley meets the AB 32 reduction target of reducing to 15%
below 2007 levels (reduce down to 798,693 MT CO2e) by 2020. In many cases, implementation of the
reduction measures will require the cooperation of other agencies, private businesses, and residents.
Even with the anticipated growth, the modernization of vehicle fleets, combined with the continued
implementation of the proposed measures, will reduce GHG emissions by approximately 500,406 MT
CO2e from 2020 levels. Therefore, the implementation of the State (R1) measures combined with the
City’s R2 and R3 measures will reduce GHG emissions down to 798,137 MT CO2e by year 2020, which is
556 MT CO2e below the reduction target.

6 . 2 A D D I T I O N A L R E D U C T I O N O P P O R T U N I T I E S
CITY OF MORENO VALLEY 6-3 GREENHOUSE GAS ANALYSIS
6.2 Additional Reduction Opportunities
The quantitative analysis of reductions demonstrates that the City can achieve the reduction target by
implementing the reduction strategies. The quantitative analysis of future emissions in Moreno Valley
also demonstrates that the target is achieved with only 556 MT CO2e to spare. However, there are
many additional opportunities to reduce emissions that cannot be calculated in a quantitative manner at
this time.
One class of additional reduction opportunities includes many of the R3 measures which are anticipated
to reduce emissions but cannot be calculated due to indeterminate variables. These include cross-
jurisdictional coordination on transportation and energy programs that can reap huge additional
reduction opportunities beyond what Moreno Valley can do on their own, an Alternative Energy
Development Plan coordinated with SCE, City tree planting program that provides additional
sequestration and shade, and a Heat Island Plan. Addressing the heat island affect will reduce the
energy needed to cool buildings and automobiles, which would result in a reduction in GHG emissions.
However, the current state of emission modeling cannot calculate the emissions reductions associated
with addressing the heat island effect.
Another class of additional reduction opportunities includes the implementation of the Regional
Sustainable Communities Strategy (SCS) within Moreno Valley. The Southern California Association of
Governments (SCAG) has released the draft SCS, but has not finalized it or provided the quantitative
values to estimate the GHG reductions within Moreno Valley attributable to implementation of the SCS.
Once more quantitative data is available, additional reductions due to the SCS within Moreno Valley can
be calculated and provided.
The last class of additional reduction opportunities includes the City’s ability to implement the R2
measures in a manner that reduces emissions beyond what was calculated in Section 4. As an example,
a very modest participation in voluntary energy efficiency retrofits of existing buildings was expected in
the calculations that are shown. Increasing participation in these programs will result in additional
reductions.
The City should monitor progress of achieving the reduction goal as the R2 measures are implemented
and take advantage of these additional reduction opportunities to insure that the target is achieved.

CITY OF MORENO VALLEY 7-1 GREENHOUSE GAS ANALYSIS
Chapter 7 Implementation
C H A P T E R 7 I M P L E M E N T A T I O N
CITY OF MORENO VALLEY 7-2 GREENHOUSE GAS ANALYSIS
This GHG Analysis sets a framework for Moreno Valley to reduce its GHG emissions. Through this
analysis, the City has set a baseline for emissions, a target for emissions reductions, and a strategy to
attain the reductions to a series of reduction measures. The implementation of these measures will
depend on development review; coordination with other agencies, businesses, and residents; and
availability of funding through rebates and incentives.
Many of the proposed reduction measures will be implemented through the development review
process. New construction offers the opportunity to build with energy efficiency and renewable energy
integrated from the start. Additionally, making land use decisions based on transit accessibility and
proximity to a variety of uses will help to reduce the dependency on vehicles as the main mode of
transportation. Reductions from existing development will also be critical in order to reduce emissions in
Moreno Valley. These improvements to existing buildings can offer direct energy cost savings and there
are a variety of rebates and incentives available at the state and local level to make the upfront costs
more affordable.
On a municipal level, the City of Moreno Valley has already begun to implement energy efficiency
upgrades with funding from the EECBG grant money. By implementing all of the remaining planned
projects, the City can set an example for the rest of the community and demonstrate how these retrofits
are saving the City money and reducing GHG emissions. The City has also been monitoring its energy use
through the Energy Star Portfolio Manager program. This has allowed the City to assess energy use in its
facilities and monitor changes in energy use based on the retrofits described above. In the future,
Moreno Valley can also work to identify additional funding for future projects and continue to
administrate the Energy Star Portfolio Manager.
This report is the first step in getting Moreno Valley on track with reducing its GHG emissions. Moving
forward, the City will need to monitor and evaluate the implementation of the plan, reassess the
reduction measures, and continually update the plan in order to address emissions beyond 2020.

CITY OF MORENO VALLEY 8-1 GREENHOUSE GAS ANALYSIS
Chapter 8 References
C H A P T E R 8 R E F E R E N C E S
CITY OF MORENO VALLEY 8-2 GREENHOUSE GAS ANALYSIS
Association of Environmental Professionals (AEP) White Paper: Alternative Approaches to Analyzing
Greenhouse Gases and Global Climate Change Impacts in CEQA Documents, June 2007.
Association of Environmental Professionals (AEP) White Paper: Community-wide Greenhouse Gas
Emission Inventory Protocols, March 2011.
California Air Pollution Control Officers Association (CAPCOA), White Paper: CEQA and Climate Change,
January 2008.
California Air Pollution Control Officers Association (CAPCOA), Quantifying Greenhouse Gas Mitigation
Measures, August 2010.
California Air Resources Board (CARB), AB-32 Scoping Plan, December 2008.
California Air Resources Board (CARB), California 1990 GHG Emissions Level and 2020 Emissions Limit,
November 2007. [CARB 2007a]
California Air Resources Board (CARB), EMFAC2007, 2007. [CARB 2007b]
California Air Resources Board (CARB), Proposed Early Actions to Mitigate Climate Change in California,
December 20, 2007. [CARB 2007c]
California Air Resources Board (CARB), URBEMIS2007 for Windows Version 9.2.4, 2007. [CARB 2007d]
California Building Standards Commission (CBSC), California Cod of Regulations Title 24, Part 6:
California’s 2008 Energy Efficiency Standards for Residential and Nonresidential Buildings, April
2008.
California Building Standards Commission (CBSC), California Code of Regulations Title 24, Part 11: 2010
California Green Building Standards Code (CALGreen), June 2010.
California Climate Action Team (CCAT), The Climate Action Biannual Report, April 2010.
California Climate Action Team (CCAT), The California Climate Action Team’s Final Report to the
Governor and Legislature, March 2006.
California Climate Action Registry (CCAR), General Reporting Protocol, Version 3.1, January 2009.
California Climate Action Registry (CCAR), Local Government Protocol, Version 1.1, May 2010.
California Department of Finance (DOF), E-4 Population Estimates,
http://www.dof.ca.gov/research/demographic/reports/estimates/e-4_2001-10/, August 2011
California Department of Transportation (Caltrans) Headquarters Divisions of Transportation Planning
and Research & Innovation, Trip-Generation Rates for Urban Infill, June 15, 2009.
6 . 2 A D D I T I O N A L R E D U C T I O N O P P O R T U N I T I E S
CITY OF MORENO VALLEY 8-3 GREENHOUSE GAS ANALYSIS
California Energy Commission (CEC), Refining Estimates of Water Related Energy Use in California: CEC-
500-2006-118, December 2006.
California Energy Commission (CEC), Climate Change and Electricity - Demand in California, February
2006.
California Natural Resources Agency, California Climate Adaption Strategy- A Report to the Governor in
Response to Executive Order S-13-2008, September 2009.
Climate Action Reserve, Urban Forestry Protocol, Version 1.1, March 2010.
Intergovernmental Panel on Climate Change, Climate Change 2001: The Scientific Basis, Contribution of
Working Group I to the Third Assessment Report of the Intergovernmental Panel on Climate.
http://www.ipcc.ch/pub/reports.htm. 2001.
Intergovernmental Panel on Climate Change, Sixteen Years of Scientific Assessment in Support of the
Climate Convention, http://www.ipcc.ch/about/anniversarybrochure.pdf. December 2004.
Managing an Uncertain Future Climate Change Adaption Strategies for California’s Water - California
Dept. of Water Resources, October 2008
South Coast Air Quality Management District (SCAQMD), Draft AQMD Energy Policy, May 20, 2011.
South Coast Air Quality Management District (SCAQMD), Rule 445 Wood Burning Devices, March 7,
2008.
Union of Concerned Scientists and The Ecological Society of America, Confronting climate change in
California, November 1999.
U.S. Environmental Protection Agency, AP-42, Compilation of Air Pollutant Emission Factors, Fourth
Edition, September 1985.
U.S. Environmental Protection Agency, Solid Waste Management and Greenhouse Gases: A Life-Cycle
Assessment of Emissions and Sinks, Third Edition, September 2006.
U.S. Environmental Protection Agency, 2009b U.S. Greenhouse Gas Inventory Report, Section 6
Agriculture, accessed February 2010.
Western Riverside Council of Governments (WRCOG), 4-City Neighborhood Electric Vehicle
Transportation Plan, June 2010.
Western Riverside Council of Governments (WRCOG), Resolution No. 2009-103: AB 811 Energy
Efficiency and Water Conservation Program, October 7, 2009.

C H A P T E R 8 R E F E R E N C E S
CITY OF MORENO VALLEY 8-4 GREENHOUSE GAS ANALYSIS
This page intentionally left blank.