City of Miami General Employees’ and Sanitation Employees’ Retirement … SSgA.pdf · ·...
44
1 City of Miami General Employees’ and Sanitation Employees’ Retirement Trust September 28, 2012 Corinne Larson CMINST-7234
Transcript of City of Miami General Employees’ and Sanitation Employees’ Retirement … SSgA.pdf · ·...

1
City of Miami General Employees’ and Sanitation Employees’ Retirement Trust
September 28, 2012
Corinne Larson
CMINST-7234
2
Table of Contents
1. SSgA Firm Overview
2. Account Summary
3. Global Equity Beta Solutions Overview
4. Conservative S&P 500® Index Strategy
Appendix A: Important Disclosures
Appendix B: GIPS® Presentation
Appendix C: Biography
The material contained in this presentation is current as of the presentation date, unless otherwise indicated. CMINST-7234

SSgA Firm Overview
GLSTND-0157
4
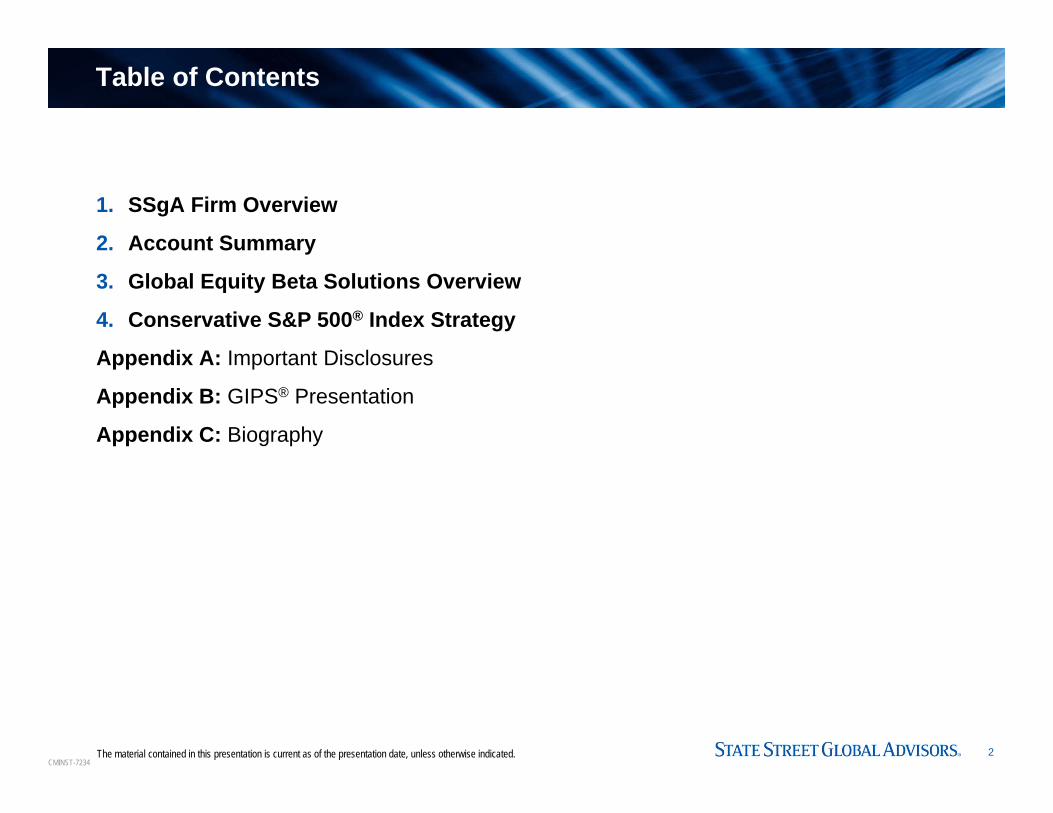
A Leading Provider of Financial Services to Institutional Investors
State StreetGlobal Advisors
A global leader in asset management
• Subsidiary of State Street Corporation, one of the world's leading providers of financial services to institutional investors, with a heritage dating back over two centuries
• Entrusted with over $1.9 trillion* in assets worldwide
• Clients include governmental entities, corporations, endowments and foundations, third party asset gatherers, multi employer plans, pension funds and sovereign wealth funds
• ETF industry pioneer and leader since 1993 with $305 billion* in AUM
SSgA is a global leader
in asset management relied
on by sophisticated
institutions worldwide for
their investment needs
State StreetGlobal Markets
A global leader in research and trading
State StreetGlobal Services
A global leader in asset servicing
As of June 30, 2012* This AUM includes the assets of the SPDR Gold Trust (approx. $65.7 billion as of June 30, 2012), for which State Street Global Markets, LLC, an affiliate of State Street Global Advisors, serves as the marketing agent.
GLSTND-0157
5
Our heritage and people
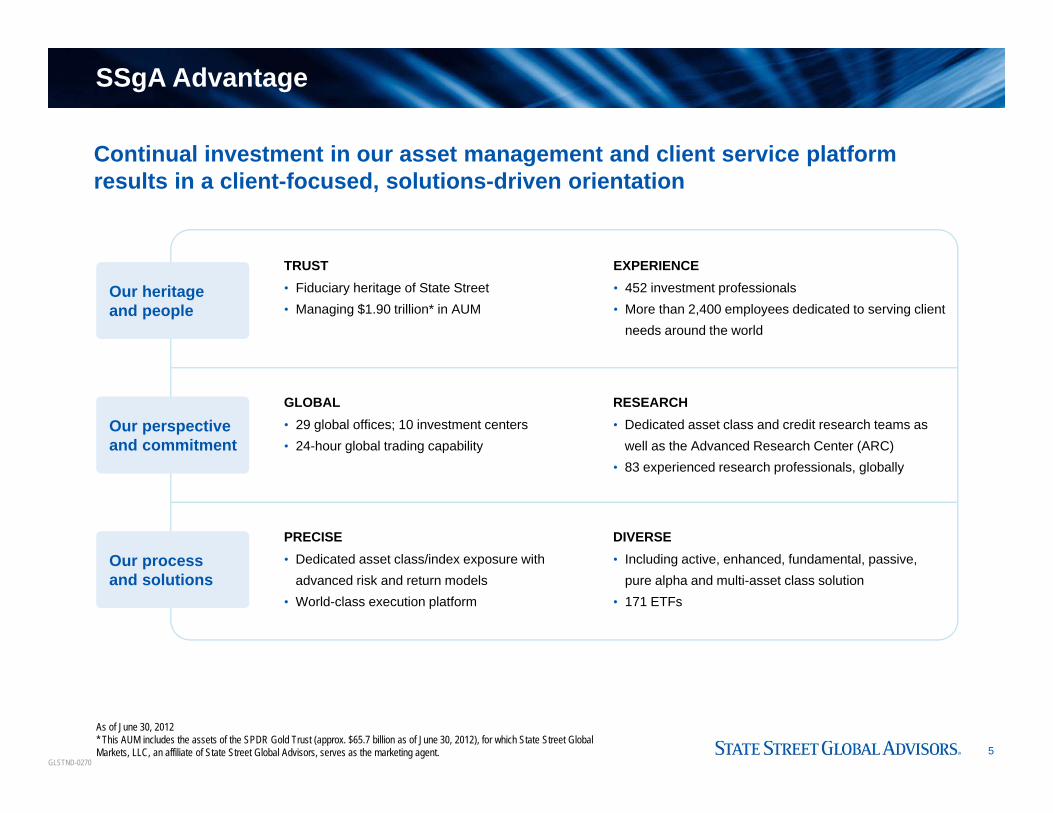
SSgA Advantage
Continual investment in our asset management and client service platform results in a client-focused, solutions-driven orientation
TRUST• Fiduciary heritage of State Street• Managing $1.90 trillion* in AUM
EXPERIENCE• 452 investment professionals• More than 2,400 employees dedicated to serving client
needs around the world
GLOBAL • 29 global offices; 10 investment centers• 24-hour global trading capability
RESEARCH• Dedicated asset class and credit research teams as
well as the Advanced Research Center (ARC)• 83 experienced research professionals, globally
DIVERSE• Including active, enhanced, fundamental, passive,
pure alpha and multi-asset class solution• 171 ETFs
PRECISE• Dedicated asset class/index exposure with
advanced risk and return models• World-class execution platform
Our process and solutions
Our perspective and commitment
As of June 30, 2012* This AUM includes the assets of the SPDR Gold Trust (approx. $65.7 billion as of June 30, 2012), for which State Street GlobalMarkets, LLC, an affiliate of State Street Global Advisors, serves as the marketing agent.
GLSTND-0270

6As of June 30, 2012
A Global Perspective with Local Expertise
New York
Munich
ParisZurich
Hong Kong
Singapore
Tokyo
London
Frankfurt
Atlanta
San Francisco
Brussels
Dubai
Melbourne
MontrealChicagoToronto
Sydney
Wilton, CTBoston
Rye Brook
Bangalore
Amsterdam
MilanSeoul
Geneva
Dublin
Hangzhou Shanghai
Investment Center
Marketing/RelationshipManagement Office
Global Alliance Company
• 29 local offices, bringing a global perspective to managing client needs
• 24 hour global trading capability with trading desks in Boston, London, Hong Kong and Dublin
• 10 investment centers, promoting diversity of ideas
• Acquired Bank of Ireland Asset Management in Q1 2011
GLSTND-0157

7
90
SSgA clients with two or
more strategies*
Percentage of new business from existing
SSgA clients*
100
0
10
20
30
40
50
60
70
80Cash4
$379.5 BEquity
$734.6 B
Fixed Income$240.6 B
Solutions (ISG)3
$122.8 B
ETFs1
$305.3 B
All Other2
$125.1 B
$1.90 Trillion1 in Assets Under Management*
Active, enhanced, fundamental, passive, pure alpha and multi-asset class solutions
SSgA — A Trusted Partner
*As of June 30, 20121 This AUM includes the assets of the SPDR Gold Trust (approx. $65.7 billion as of June 30, 2012), for which State Street Global Markets, LLC, an affiliate of State Street Global Advisors, serves as the marketing agent.2 Includes Absolute Return, Commodities, Currency, Company Stock, Global Multi Strategy, Hedge Fund of Funds, Managed Futures, Private Equity and Real Estate3 Assets in Solutions are not counted in the underlying asset class4 Includes securities lending collateral, cash, and money market
GLSTND-0521
53% 81%
8
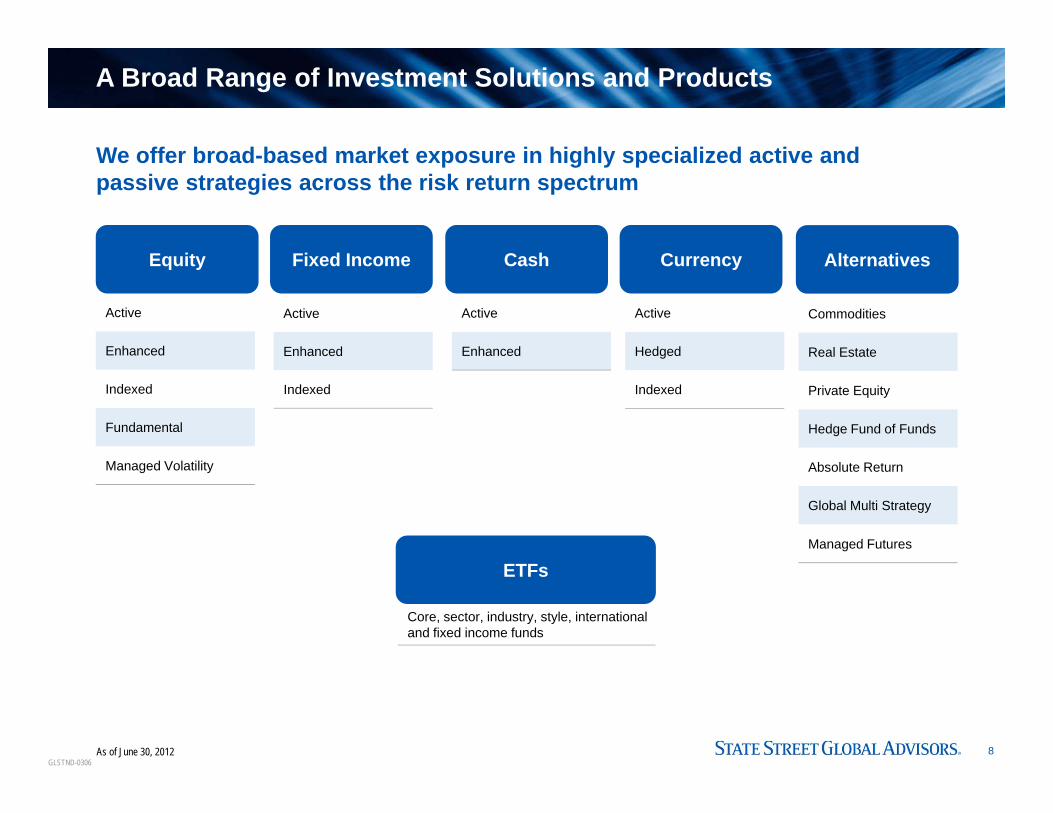
A Broad Range of Investment Solutions and Products
As of June 30, 2012
We offer broad-based market exposure in highly specialized active and passive strategies across the risk return spectrum
Equity Fixed Income AlternativesCash Currency
Active
Enhanced
Indexed
Fundamental
Managed Volatility
Active
Enhanced
Indexed
Active
Hedged
Indexed
Active
Enhanced
Commodities
Real Estate
Private Equity
Hedge Fund of Funds
Absolute Return
Global Multi Strategy
Managed Futures
GLSTND-0306
ETFs
Core, sector, industry, style, international and fixed income funds

9
Other SSgA Investment Solutions and Services
The Investment Solutions Group (ISG)The increasing complexity of our clients' needs requires them to think more holistically abouttheir portfolios, from efficient portfolio construction to creating outcome-oriented solutions inaddition to benchmark-driven portfolios
• ISG oversees:– The development, recommendation and implementation of customized strategies across asset classes to achieve
each client’s specific investment goals
• ISG is composed of three competencies:
Portfolio Management
Asset allocation
Manager allocation
Design, Consulting and Research
Investment policy
Solution design
Fiduciary Services
Manager research and selection
Manager relations
Regulatory
GLSTND-0306As of June 30, 2012
10
Our Investment Approach
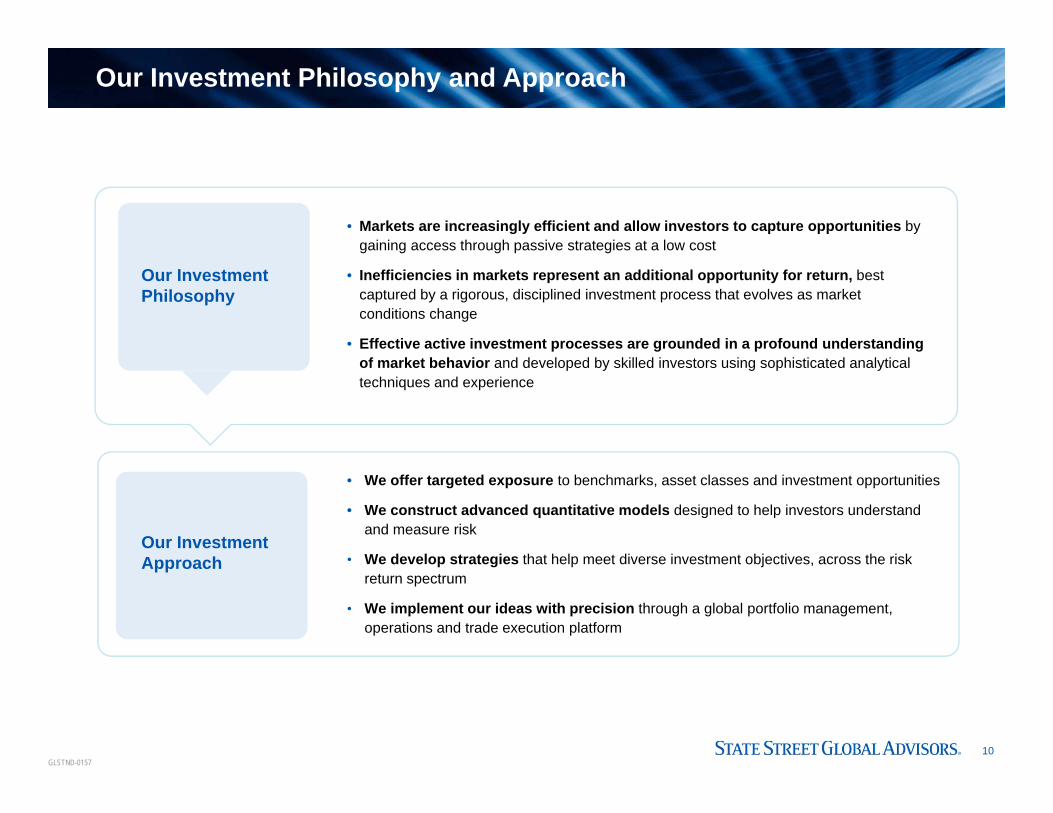
Our Investment Philosophy and Approach
• We offer targeted exposure to benchmarks, asset classes and investment opportunities
• We construct advanced quantitative models designed to help investors understand and measure risk
• We develop strategies that help meet diverse investment objectives, across the risk return spectrum
• We implement our ideas with precision through a global portfolio management, operations and trade execution platform
• Markets are increasingly efficient and allow investors to capture opportunities by gaining access through passive strategies at a low cost
• Inefficiencies in markets represent an additional opportunity for return, best captured by a rigorous, disciplined investment process that evolves as market conditions change
• Effective active investment processes are grounded in a profound understanding of market behavior and developed by skilled investors using sophisticated analytical techniques and experience
Our InvestmentPhilosophy
GLSTND-0157

11
Deep Research behind Every Portfolio
Advanced Research Center
Dedicated Asset Class
Research
Specialized Cash Credit
Research
Combination of strong academic experience with practical, real-world applications
• Includes 28 professionals who work with portfolio teams, over half hold PhD degrees
• ARC identifies and captures new alpha sources derived from behavioral finance, asset pricing, other social and physical sciences
• Proprietary models continuously evolve with research-based process improvements
Dedicated asset allocation, equity, fixed income research teams
• Active approaches aim to capitalize on inefficiencies in the market
• Passive approach aims to match key risk/return characteristics
• Insightful, top-down and bottom-up proprietary fixed income investment process that analyzes macro-economic, sector, industry, issuer and security risk and return drivers
Among the largest and most experienced dedicated cash credit research teams
• Features an independent, fundamental research process
• Fundamental credit analysis incorporates quantitative tools to ensure discipline
• Includes a structure that separates portfolio and risk management to ensure robust controls
GLSTND-0157As of June 30, 2012

12
State Street Global Advisors
Scott Powers President and
Chief Executive Officer
APAC Market Development
James MacNevin
Institutional Client GroupKristi Mitchem
Charitable AssetManagementJan Adams
CanadaPeter Lindley
NA IntermediaryBusiness Group & Global Exchange Traded Products
Jim Ross
CIO Investment
Solutions Group Dan Farley
Asia PacificOfficial Institutions
GroupHon Cheung
Head of InvestmentsAsia Pacific
Lochiel Crafter
Institutional Business Asia ex-
JapanTing Li
Southeast Asia Janice Wu
Global Alliance, LLC
Mergers & Acquisitions
Economists
Amy ArmstrongHuman Resources*
Marc BrownChief Administrative
Officer
Phil GillespieChief Legal
Officer*
Jacques LongerstaeyChief Risk
Officer*
Bernard ReillyAsia Pacific
Shawn JohnsonInvestment Committee
James KaseGlobal Head of
Sales & Marketing
Rick LacailleGlobal
Chief Investment Officer
August 23, 2012Notes member of the Executive Management Group
* Functions also report into corporate competency centers
Global Cash Business
Barry Smith
Official Institutions Group
John Nugée
CIOGlobal Fixed Income
& CurrencyKevin Anderson
CIOPassive Equities
Lynn Blake
Global TradingChris Rice
CIOFundamental Active EquityChris Johns
CIOO InvestmentManagementRene Guilmet
CIOGlobal CashSteve Meier
Alyssa Albertelli(Interim)
Chief Compliance Officer*
Greg EhretEurope, Middle East,
Africa (EMEA)
AustraliaRob Goodlad
CIO Global Equities
Ali Lowe
JapanKoji Yamamoto
GLSTND-0157
ETFs Asia PacificFrank Henze
Global Product & Marketing
Andrew Astley
Head of Northern Europe
Benoit Fally
Head of UK/MEA and Ireland
Michael Karpik
Head of Southern Europe
Marco Fusco
Information Technology*
Stan Wasilauski
Global Investment OperationsKevin Griffin
SSgA Interactive
Peter Bennett
Finance*Juan Carlos Morales
Project Mgmt. Office
IndiaDeval Shah
Global Business Continuity
Susan Armstrong

13As of July 2012
SSgA Committees and Governance
The EMG acts as the CEO’s cabinet, a consultative and decision-making body responsible for:
• Overall Firm governance• Code of Ethics oversight• Staffing/HR matters• Extraordinary events
Executive Management Group (EMG)
SSgA CEO
Investments Committee Global Product Committee Global Fiduciary Committee Operations and
Compliance Committee
Responsible for the firm’s investment philosophy and processes, investment strategies, approach to new markets and instruments, and relationships with counterparties.
Responsible for the creation of products based on the firm’s investment strategies.
Responsible for the maintenance of products based on the firm’s investment strategies. Accountable to State Street Board of Directors.
Responsible for the firm’s infrastructure, compliance and control functions.
Subcommittees:• Technical • Proxy Review • Derivatives/New Instruments • Credit Advisory• Trade Management Oversight• Investment Risk
Subcommittees:• Funding/Seed Capital • North American Product
- Canadian Product• EMEA Product • APAC Product• Sub-Advisory Oversight
Subcommittees:• EMEA Fiduciary• Independent Fiduciary • Global Disclosure &
Communications- North American DCC- EMEA DCC- APAC DCC
Subcommittees:• Global Operations • Global Compliance • North American Valuation • EMEA Valuation • APAC Valuation• Global Operational Risk
– EMEA Operational Risk– APAC Operational Risk
• Data Governance • IT Steering • Performance Standards
GLSTND-0521

Account Summary
GLSTND-0228
Investing involves risk including the risk of loss of principal.

15
City of Miami General Employees’ and Sanitation Employees’ Retirement Trust
Source: SSgA* Includes dividends, interest, and realized/unrealized gains and losses.Past performance is not a guarantee of future results.Return periods of less than one year are not annualized.Index returns are unmanaged and do not reflect the deduction of any fees or expenses. Index returns reflect all items of income, gain and loss and the reinvestment of dividends and other income.
Investment SummaryAs of July 31, 2012
Statement of Asset Changes The following changes took place in the City of Miami General Employees' and Sanitation Employees' Retirement Trust account for the period July 1, 2012 to July 31, 2012:
Summary of PerformanceFollowing are the gross returns for the City of Miami General Employees' and Sanitation Employees' Retirement Trustportfolio versus the corresponding benchmark as of July 31, 2012:
Market Value
S&P 500 Conservative Index $75,790,998
Total $75,790,998
Starting Balance7/1/2012 Contributions Withdrawals
Appreciation/(Depreciation)*
Ending Balance7/31/2012
S&P 500 Conservative Index $74,757,058 $0 $0 $1,033,940 $75,790,998
Total $74,757,058 $0 $0 $1,033,940 $75,790,998
OneMonth
ThreeMonths
Year to Date
Last 12 Months
Three Years
Five Years
Since Inception
Inception Date
S&P 500 Conservative Index 1.38% -0.79% 10.96% 9.07% 14.11% 1.19% 8.03% Nov/1993
S&P 500® 1.39 -0.78 11.01 9.13 14.12 1.13 7.99
GLSTND-0228
GLSTND-0229
Global Equity Beta Solutions Overview
Investing involves risk including the risk of loss of principal.
17
Benefits of Indexing
Theory
• Capital Asset Pricing Model (CAPM)
• Attractive risk/return tradeoff
• Efficient, broad-based equity exposure
Cost
• Low management fees
• Offers cost-efficiencies in the form of lower portfolio turnover and transaction costs
• Overall, long-term cost benefits to Plan Sponsors: lower fees, implementation costs, and search costs
Evidence
• Avoids manager biases and reduces downside risks from concentration or out-of-benchmark risk that active management can entail
• S&P Indices Versus Active Funds (SPIVA) Scorecard
Why Passive?
GLSTND-0229
18
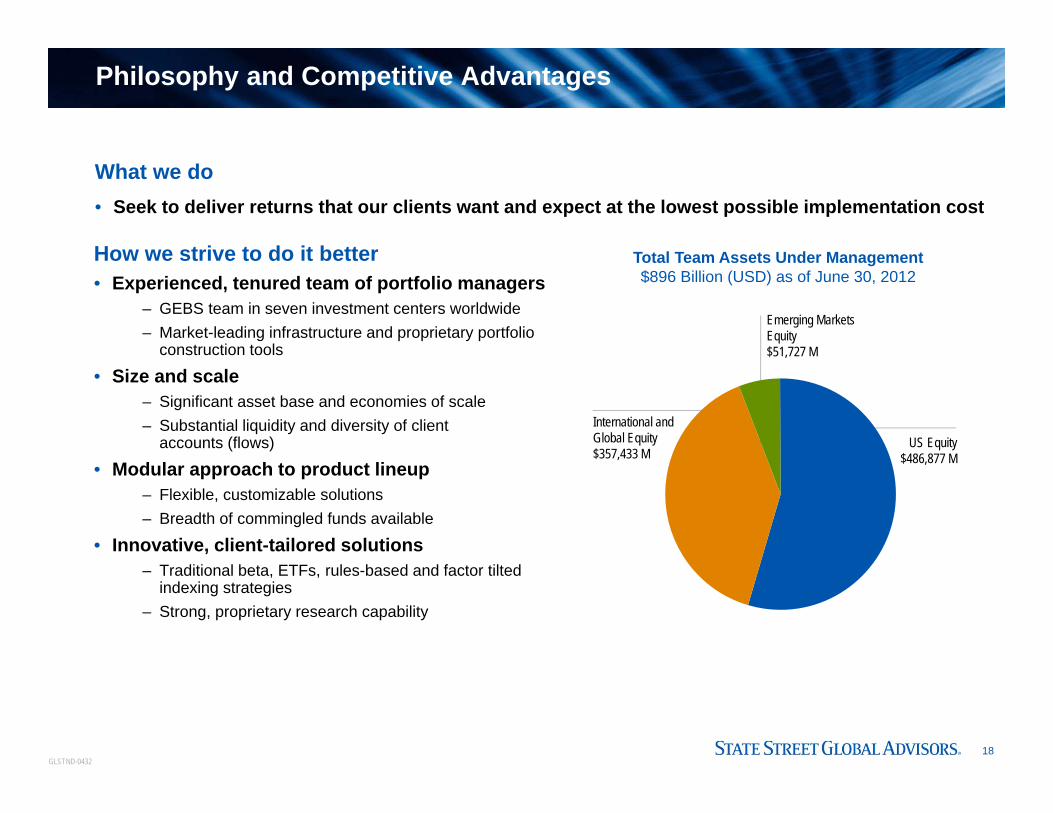
Philosophy and Competitive Advantages
How we strive to do it better• Experienced, tenured team of portfolio managers
– GEBS team in seven investment centers worldwide– Market-leading infrastructure and proprietary portfolio
construction tools
• Size and scale– Significant asset base and economies of scale– Substantial liquidity and diversity of client
accounts (flows)
• Modular approach to product lineup– Flexible, customizable solutions– Breadth of commingled funds available
• Innovative, client-tailored solutions– Traditional beta, ETFs, rules-based and factor tilted
indexing strategies– Strong, proprietary research capability
Total Team Assets Under Management$896 Billion (USD) as of June 30, 2012
Emerging Markets Equity$51,727 M
International and Global Equity$357,433 M
US Equity$486,877 M
What we do• Seek to deliver returns that our clients want and expect at the lowest possible implementation cost
GLSTND-0432
19
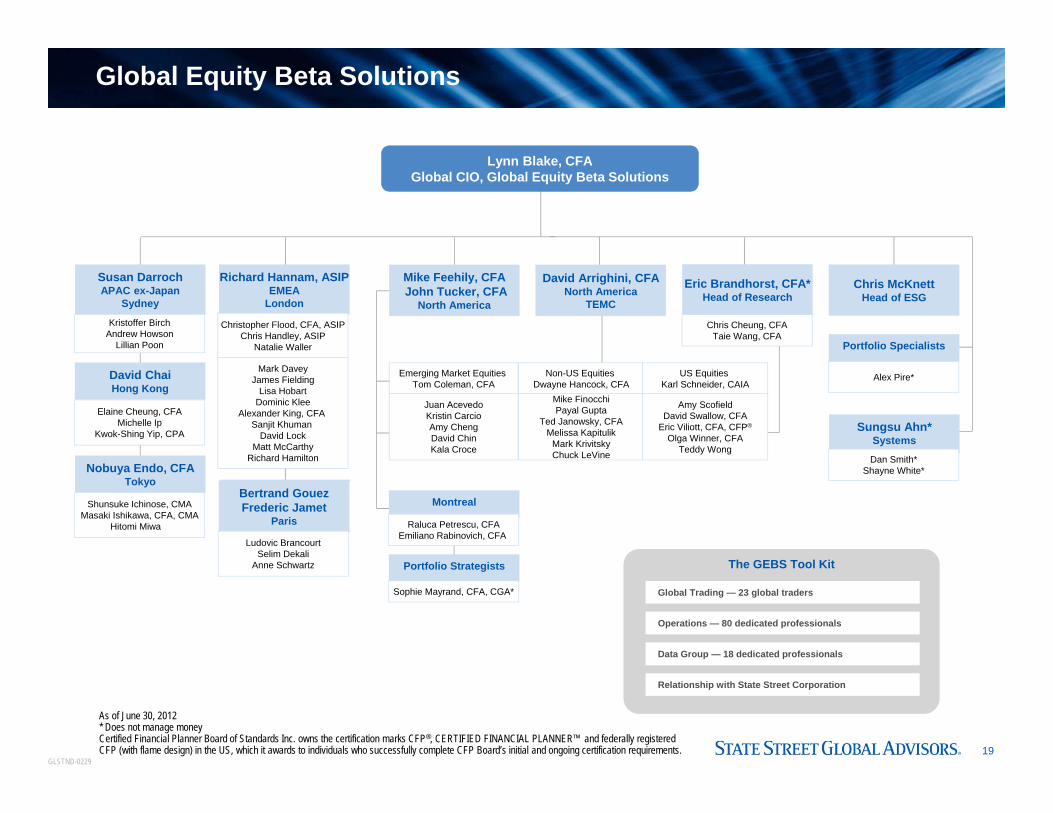
Global Equity Beta Solutions
Susan DarrochAPAC ex-Japan
Sydney
David ChaiHong Kong
Nobuya Endo, CFA Tokyo
Mike Feehily, CFAJohn Tucker, CFA
North America
David Arrighini, CFANorth America
TEMC
Eric Brandhorst, CFA*Head of Research
Lynn Blake, CFAGlobal CIO, Global Equity Beta Solutions
The GEBS Tool Kit
Global Trading — 23 global traders
Operations — 80 dedicated professionals
Data Group — 18 dedicated professionals
Relationship with State Street Corporation
Chris McKnettHead of ESG
Portfolio Specialists
Montreal
Portfolio Strategists
Bertrand GouezFrederic Jamet
Paris
Richard Hannam, ASIPEMEA
London
Sungsu Ahn*Systems
As of June 30, 2012* Does not manage moneyCertified Financial Planner Board of Standards Inc. owns the certification marks CFP®, CERTIFIED FINANCIAL PLANNER™ and federally registered CFP (with flame design) in the US, which it awards to individuals who successfully complete CFP Board’s initial and ongoing certification requirements.
GLSTND-0229
Kristoffer BirchAndrew Howson
Lillian Poon
Elaine Cheung, CFAMichelle Ip
Kwok-Shing Yip, CPA
Shunsuke Ichinose, CMAMasaki Ishikawa, CFA, CMA
Hitomi Miwa
Christopher Flood, CFA, ASIPChris Handley, ASIP
Natalie Waller
Mark DaveyJames Fielding
Lisa HobartDominic Klee
Alexander King, CFA Sanjit Khuman
David LockMatt McCarthy
Richard Hamilton
Ludovic BrancourtSelim Dekali
Anne Schwartz
Emerging Market Equities Tom Coleman, CFA
Juan AcevedoKristin CarcioAmy ChengDavid ChinKala Croce
Non-US Equities Dwayne Hancock, CFA
US Equities Karl Schneider, CAIA
Mike FinocchiPayal Gupta
Ted Janowsky, CFAMelissa Kapitulik
Mark KrivitskyChuck LeVine
Amy ScofieldDavid Swallow, CFA
Eric Viliott, CFA, CFP®
Olga Winner, CFATeddy Wong
Chris Cheung, CFATaie Wang, CFA
Alex Pire*
Raluca Petrescu, CFAEmiliano Rabinovich, CFA
Sophie Mayrand, CFA, CGA*
Dan Smith*Shayne White*

20
A Leading Manager of Global Indexed Assets
*As of December 31, 2011, includes 5 year GEBS institutional average of $50 B and 5 year average SSgA ETF of $21 B, updated annually.**Exclusive of Emerging Markets Equities invested in other MSCI-benchmarked strategies such as MSCI ACWI and MSCI ACWI ex US."FTSE®”, "FT-SE®” and "Footsie®” are trade marks of the Exchange and FT and are used by FTSE under license. "All-World", "All-Share", "All-Small" and "FTSE4Good" are trademarks of FTSE.All Standard & Poor's Indexes are registered trademarks of Standard & Poor's Financial Services LLC.Dow Jones and Dow Jones Indices are service marks of Dow Jones & Company, Inc. and have been licensed for use for certain purposes by State Street Global Advisors (SSgA).Russell Investment Group is the source and owner of the trademarks, service marks and copyrights related to the Russell Indexes.Russell Indices are trademarks of Russell Investment Group.The MSCI Indexes are trademarks of MSCI Inc.
S&P and S&P®/
IFCI $3,537M
MSCI Emerging Markets$45,069 M
Customized Emerging Market Indices
$1,381 MFTSE Emerging
Markets $1,739M
Emerging Markets Equity AUM$51,727 Million as of June 30, 2012**
Total Assets Under Management: $896 Billion (USD) as of June 30, 2012 • An average of $72 billion in annual net new assets over past five years*• 85% of new assets derived from existing clients
S&P Indexes$348,149 M
Dow Jones/DJ IndexesSM
$20,583 M
Russell Indexes$94,277 M
MSCI $6,289 M
US TEMC$10,091M
Other$7,489 M
US Index Assets Under Management$486,877 Million as of June 30, 2012
International and Global Equity AUM$357,433 Million as of June 30, 2012
MSCI Developed$251,708 M
Global TEMC$2,618 M
Other (Nasdaq…)
$37,177 M
S&P Developed$26,085 M
FTSE Strategies$28,322 M
Dow Jones Developed$11,524 M
GLSTND-0432
21
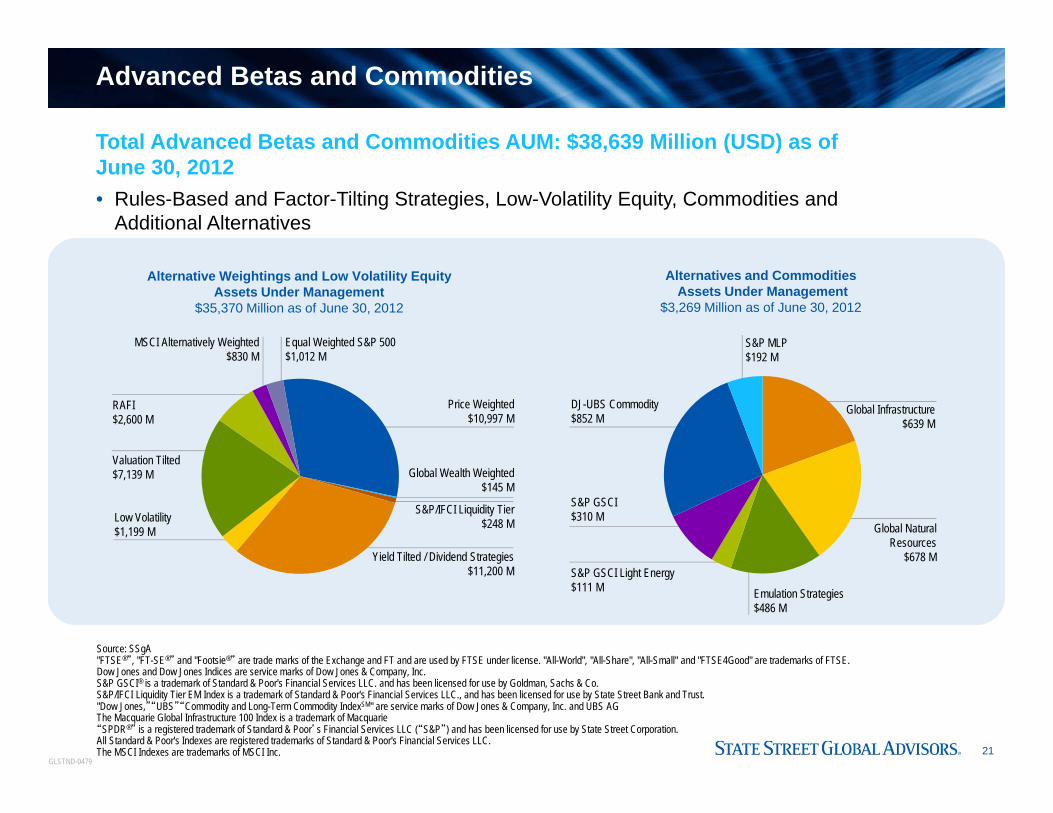
Advanced Betas and Commodities
Source: SSgA"FTSE®”, "FT-SE®” and "Footsie®” are trade marks of the Exchange and FT and are used by FTSE under license. "All-World", "All-Share", "All-Small" and "FTSE4Good" are trademarks of FTSE.Dow Jones and Dow Jones Indices are service marks of Dow Jones & Company, Inc.S&P GSCI® is a trademark of Standard & Poor's Financial Services LLC. and has been licensed for use by Goldman, Sachs & Co.S&P/IFCI Liquidity Tier EM Index is a trademark of Standard & Poor's Financial Services LLC., and has been licensed for use by State Street Bank and Trust. "Dow Jones,”“UBS”“Commodity and Long-Term Commodity IndexSM" are service marks of Dow Jones & Company, Inc. and UBS AGThe Macquarie Global Infrastructure 100 Index is a trademark of Macquarie “SPDR®” is a registered trademark of Standard & Poor’s Financial Services LLC (“S&P”) and has been licensed for use by State Street Corporation. All Standard & Poor's Indexes are registered trademarks of Standard & Poor's Financial Services LLC.The MSCI Indexes are trademarks of MSCI Inc.
Alternative Weightings and Low Volatility EquityAssets Under Management
$35,370 Million as of June 30, 2012
Alternatives and CommoditiesAssets Under Management
$3,269 Million as of June 30, 2012
Valuation Tilted$7,139 M
MSCI Alternatively Weighted$830 M
Price Weighted$10,997 M
Equal Weighted S&P 500$1,012 M
RAFI$2,600 M
S&P GSCI$310 M
S&P GSCI Light Energy$111 M
DJ-UBS Commodity$852 M
S&P MLP$192 M
Emulation Strategies$486 M
Global Infrastructure$639 M
Global Natural Resources
$678 M
Total Advanced Betas and Commodities AUM: $38,639 Million (USD) as of June 30, 2012• Rules-Based and Factor-Tilting Strategies, Low-Volatility Equity, Commodities and
Additional Alternatives
GLSTND-0479
Low Volatility$1,199 M
S&P/IFCI Liquidity Tier$248 M
Global Wealth Weighted$145 M
Yield Tilted / Dividend Strategies$11,200 M
22
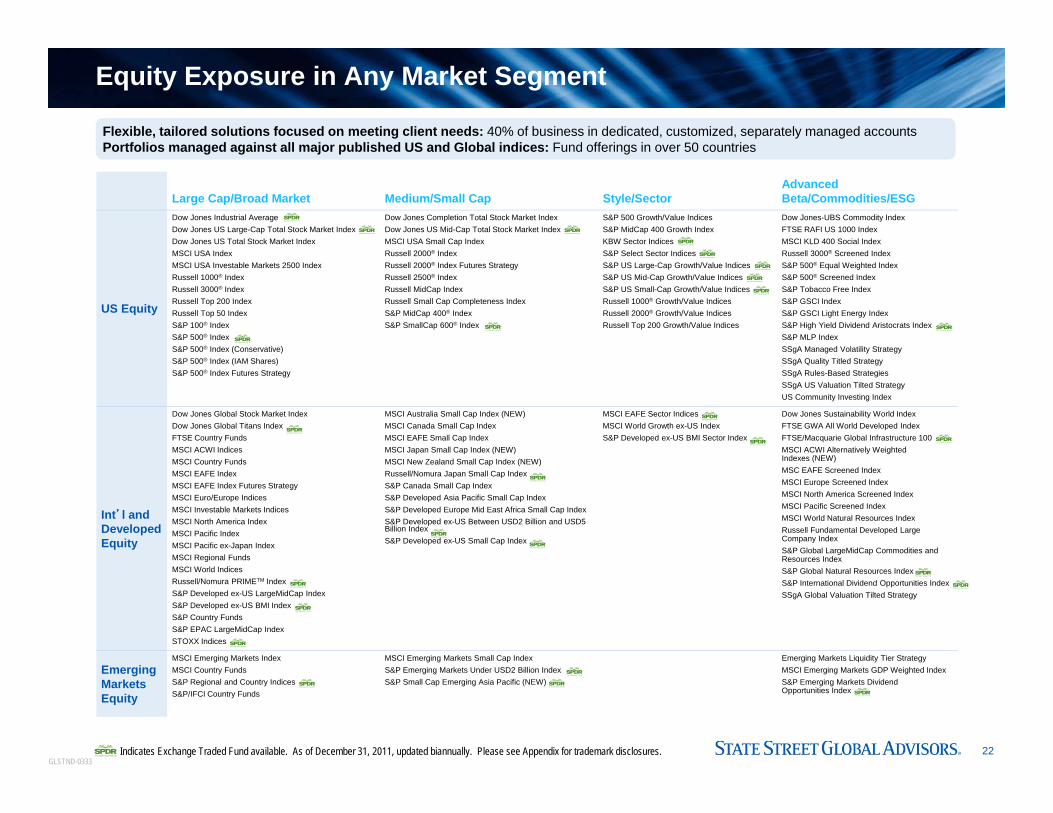
Large Cap/Broad Market Medium/Small Cap Style/SectorAdvanced Beta/Commodities/ESG
US Equity
Dow Jones Industrial AverageDow Jones US Large-Cap Total Stock Market Index Dow Jones US Total Stock Market IndexMSCI USA IndexMSCI USA Investable Markets 2500 IndexRussell 1000® IndexRussell 3000® IndexRussell Top 200 IndexRussell Top 50 IndexS&P 100® IndexS&P 500® Index S&P 500® Index (Conservative)S&P 500® Index (IAM Shares)S&P 500® Index Futures Strategy
Dow Jones Completion Total Stock Market IndexDow Jones US Mid-Cap Total Stock Market IndexMSCI USA Small Cap IndexRussell 2000® IndexRussell 2000® Index Futures StrategyRussell 2500® IndexRussell MidCap IndexRussell Small Cap Completeness IndexS&P MidCap 400® IndexS&P SmallCap 600® Index
S&P 500 Growth/Value IndicesS&P MidCap 400 Growth IndexKBW Sector IndicesS&P Select Sector IndicesS&P US Large-Cap Growth/Value Indices S&P US Mid-Cap Growth/Value IndicesS&P US Small-Cap Growth/Value IndicesRussell 1000® Growth/Value IndicesRussell 2000® Growth/Value IndicesRussell Top 200 Growth/Value Indices
Dow Jones-UBS Commodity IndexFTSE RAFI US 1000 IndexMSCI KLD 400 Social IndexRussell 3000® Screened IndexS&P 500® Equal Weighted Index S&P 500® Screened IndexS&P Tobacco Free IndexS&P GSCI IndexS&P GSCI Light Energy IndexS&P High Yield Dividend Aristocrats IndexS&P MLP IndexSSgA Managed Volatility StrategySSgA Quality Titled StrategySSgA Rules-Based StrategiesSSgA US Valuation Tilted StrategyUS Community Investing Index
Int’l and Developed Equity
Dow Jones Global Stock Market IndexDow Jones Global Titans IndexFTSE Country FundsMSCI ACWI Indices MSCI Country FundsMSCI EAFE IndexMSCI EAFE Index Futures StrategyMSCI Euro/Europe IndicesMSCI Investable Markets IndicesMSCI North America IndexMSCI Pacific IndexMSCI Pacific ex-Japan IndexMSCI Regional FundsMSCI World IndicesRussell/Nomura PRIMETM IndexS&P Developed ex-US LargeMidCap IndexS&P Developed ex-US BMI IndexS&P Country FundsS&P EPAC LargeMidCap IndexSTOXX Indices
MSCI Australia Small Cap Index (NEW)MSCI Canada Small Cap IndexMSCI EAFE Small Cap IndexMSCI Japan Small Cap Index (NEW)MSCI New Zealand Small Cap Index (NEW)Russell/Nomura Japan Small Cap IndexS&P Canada Small Cap IndexS&P Developed Asia Pacific Small Cap IndexS&P Developed Europe Mid East Africa Small Cap IndexS&P Developed ex-US Between USD2 Billion and USD5 Billion IndexS&P Developed ex-US Small Cap Index
MSCI EAFE Sector IndicesMSCI World Growth ex-US IndexS&P Developed ex-US BMI Sector Index
Dow Jones Sustainability World IndexFTSE GWA All World Developed IndexFTSE/Macquarie Global Infrastructure 100MSCI ACWI Alternatively Weighted Indexes (NEW)MSC EAFE Screened IndexMSCI Europe Screened IndexMSCI North America Screened IndexMSCI Pacific Screened IndexMSCI World Natural Resources IndexRussell Fundamental Developed LargeCompany IndexS&P Global LargeMidCap Commodities andResources IndexS&P Global Natural Resources IndexS&P International Dividend Opportunities IndexSSgA Global Valuation Tilted Strategy
Emerging Markets Equity
MSCI Emerging Markets IndexMSCI Country FundsS&P Regional and Country IndicesS&P/IFCI Country Funds
MSCI Emerging Markets Small Cap IndexS&P Emerging Markets Under USD2 Billion IndexS&P Small Cap Emerging Asia Pacific (NEW)
Emerging Markets Liquidity Tier StrategyMSCI Emerging Markets GDP Weighted IndexS&P Emerging Markets Dividend Opportunities Index
Equity Exposure in Any Market Segment
Indicates Exchange Traded Fund available. As of December 31, 2011, updated biannually. Please see Appendix for trademark disclosures.
Flexible, tailored solutions focused on meeting client needs: 40% of business in dedicated, customized, separately managed accountsPortfolios managed against all major published US and Global indices: Fund offerings in over 50 countries
GLSTND-0333
23
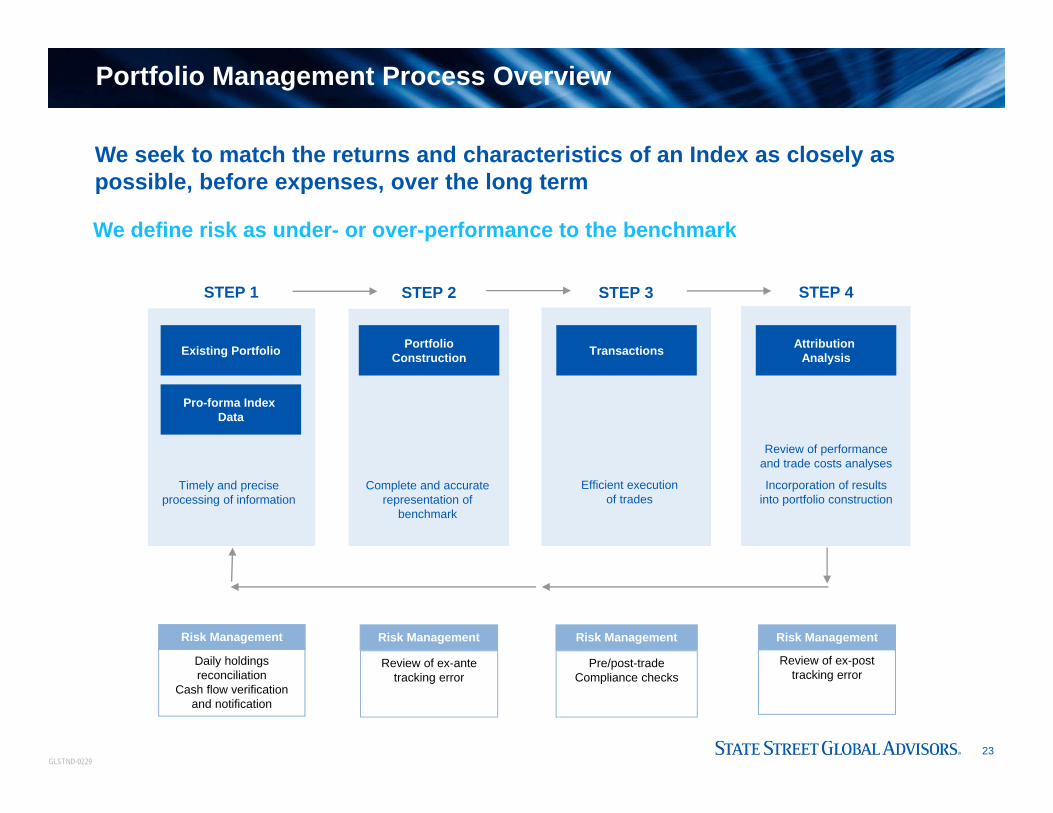
Portfolio Management Process Overview
We define risk as under- or over-performance to the benchmark
We seek to match the returns and characteristics of an Index as closely as possible, before expenses, over the long term
Risk Management
Daily holdings reconciliation
Cash flow verification and notification
Risk Management
Review of ex-ante tracking error
Risk Management
Pre/post-trade Compliance checks
STEP 3
Timely and precise processing of information
Complete and accurate representation of
benchmark
Efficient execution of trades
Existing Portfolio
Pro-forma Index Data
STEP 1 STEP 2 STEP 4
Review of performance and trade costs analyses
Incorporation of results into portfolio construction
Risk Management
Review of ex-post tracking error
PortfolioConstruction Transactions Attribution
Analysis
GLSTND-0229

24
Managing index changes
• Managing risk
• Capturing index returns
• Minimizing cost
Other value-added opportunities• Stock lending
• Mergers and takeovers
• Rights issues
Intelligent Execution of Index Changes and Reconstitutions
1
2
Recognition and analysis of index changes• Detailed analysis before the index change
date — using pro-forma index files
• Size of change; sector/industry/country
• Estimated supply/demand
• Economic events/earnings releases
• Volatility/liquidity/bid-ask spread
Execution strategies• Team discussion with equity dealers to create
trading strategy
• Guarantees/averaging in/crossing/patient trading
• Post-trade analysis
GLSTND-0229
25
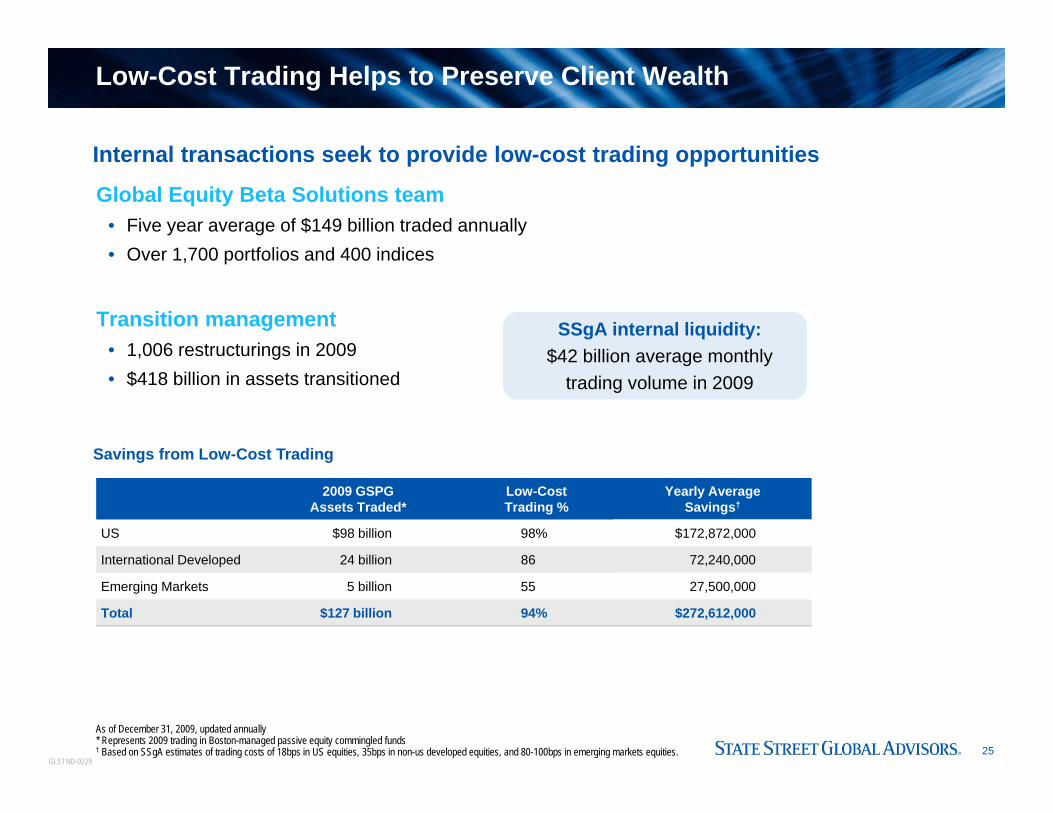
Low-Cost Trading Helps to Preserve Client Wealth
Global Equity Beta Solutions team• Five year average of $149 billion traded annually• Over 1,700 portfolios and 400 indices
Transition management• 1,006 restructurings in 2009• $418 billion in assets transitioned
Internal transactions seek to provide low-cost trading opportunities
As of December 31, 2009, updated annually* Represents 2009 trading in Boston-managed passive equity commingled funds† Based on SSgA estimates of trading costs of 18bps in US equities, 35bps in non-us developed equities, and 80-100bps in emerging markets equities.
SSgA internal liquidity:$42 billion average monthly
trading volume in 2009
2009 GSPGAssets Traded*
Low-CostTrading %
Yearly AverageSavings†
US $98 billion 98% $172,872,000
International Developed 24 billion 86 72,240,000
Emerging Markets 5 billion 55 27,500,000
Total $127 billion 94% $272,612,000
Savings from Low-Cost Trading
GLSTND-0229
26
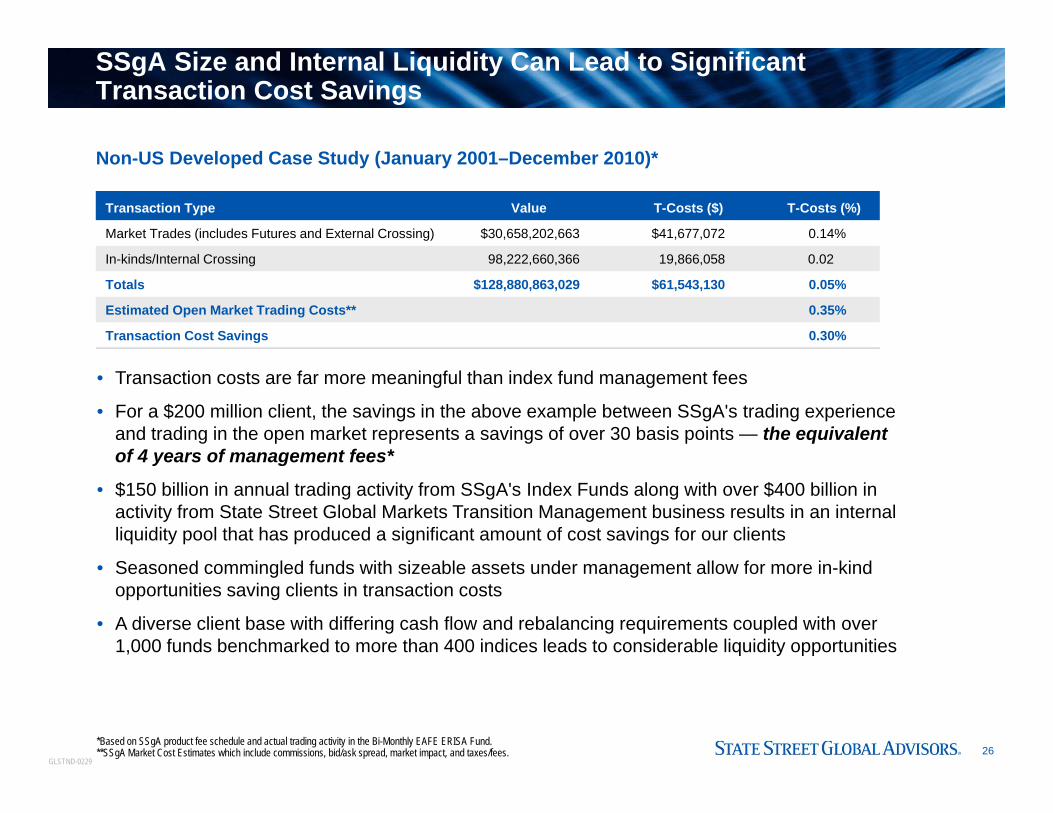
SSgA Size and Internal Liquidity Can Lead to Significant Transaction Cost Savings
Non-US Developed Case Study (January 2001–December 2010)*
*Based on SSgA product fee schedule and actual trading activity in the Bi-Monthly EAFE ERISA Fund.**SSgA Market Cost Estimates which include commissions, bid/ask spread, market impact, and taxes/fees.
• Transaction costs are far more meaningful than index fund management fees
• For a $200 million client, the savings in the above example between SSgA's trading experience and trading in the open market represents a savings of over 30 basis points — the equivalent of 4 years of management fees*
• $150 billion in annual trading activity from SSgA's Index Funds along with over $400 billion in activity from State Street Global Markets Transition Management business results in an internal liquidity pool that has produced a significant amount of cost savings for our clients
• Seasoned commingled funds with sizeable assets under management allow for more in-kind opportunities saving clients in transaction costs
• A diverse client base with differing cash flow and rebalancing requirements coupled with over 1,000 funds benchmarked to more than 400 indices leads to considerable liquidity opportunities
Transaction Type Value T-Costs ($) T-Costs (%)
Market Trades (includes Futures and External Crossing) $30,658,202,663 $41,677,072 0.14%
In-kinds/Internal Crossing 98,222,660,366 19,866,058 0.02
Totals $128,880,863,029 $61,543,130 0.05%
Estimated Open Market Trading Costs** 0.35%
Transaction Cost Savings 0.30%
GLSTND-0229

27
SSgA Size and Internal Liquidity Can Lead to Significant Transaction Cost Savings
US Markets Case Study (January 2001–December 2010)*
* Based on SSgA product fee schedule and actual trading activity in the S&P 500® ERISA Commingled Fund.**SSgA Market Cost Estimates which include commissions, bid/ask spread, market impact, and taxes/fees.
• Transaction costs are far more meaningful than index fund management fees
• For a $200 million client, the savings in the above example between SSgA's trading experience and trading in the open market represents a savings of over 14 basis points — the equivalent of almost 4.5 years of management fees*
• $150 billion in annual trading activity from SSgA's Index Funds along with over $400 billion in activity from State Street Global Markets Transition Management business results in an internal liquidity pool that has produced a significant amount of cost savings for our clients
• Seasoned commingled funds with sizeable assets under management allow for more in-kind opportunities saving clients in transaction costs
• A diverse client base with differing cash flow and rebalancing requirements coupled with over 1,000 funds benchmarked to more than 400 indices leads to considerable liquidity opportunities
Transaction Type Value T-Costs ($) T-Costs (%)
Market Trades (includes Futures and External Crossing) $17,057,320,120 $16,058,642 0.094%
In-kinds/Internal Crossing 324,089,082,285 2,030,550 0.001
Totals $341,146,402,405 $18,089,193 0.005%
Estimated Open Market Trading Costs** 0.150%
Transaction Cost Savings 0.145%
GLSTND-0229
28
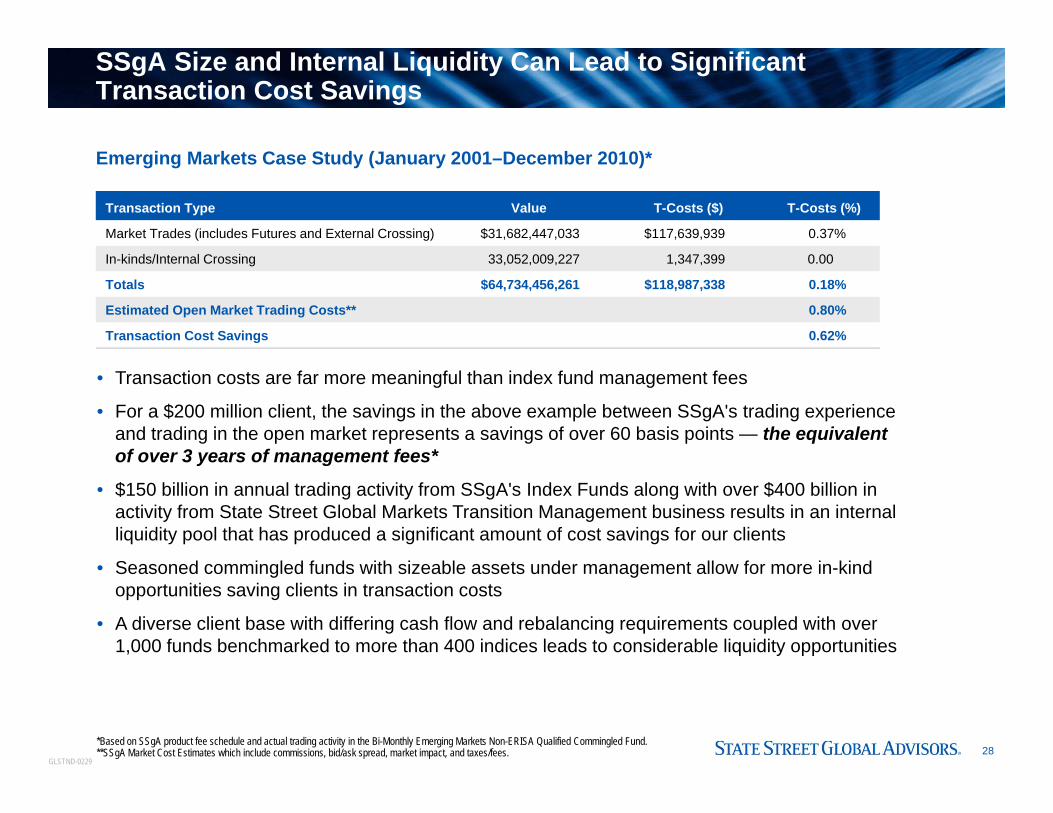
SSgA Size and Internal Liquidity Can Lead to Significant Transaction Cost Savings
Emerging Markets Case Study (January 2001–December 2010)*
*Based on SSgA product fee schedule and actual trading activity in the Bi-Monthly Emerging Markets Non-ERISA Qualified Commingled Fund.**SSgA Market Cost Estimates which include commissions, bid/ask spread, market impact, and taxes/fees.
• Transaction costs are far more meaningful than index fund management fees
• For a $200 million client, the savings in the above example between SSgA's trading experience and trading in the open market represents a savings of over 60 basis points — the equivalent of over 3 years of management fees*
• $150 billion in annual trading activity from SSgA's Index Funds along with over $400 billion in activity from State Street Global Markets Transition Management business results in an internal liquidity pool that has produced a significant amount of cost savings for our clients
• Seasoned commingled funds with sizeable assets under management allow for more in-kind opportunities saving clients in transaction costs
• A diverse client base with differing cash flow and rebalancing requirements coupled with over 1,000 funds benchmarked to more than 400 indices leads to considerable liquidity opportunities
Transaction Type Value T-Costs ($) T-Costs (%)
Market Trades (includes Futures and External Crossing) $31,682,447,033 $117,639,939 0.37%
In-kinds/Internal Crossing 33,052,009,227 1,347,399 0.00
Totals $64,734,456,261 $118,987,338 0.18%
Estimated Open Market Trading Costs** 0.80%
Transaction Cost Savings 0.62%
GLSTND-0229

29
Research Capabilities
Commitment to Research-Driven ProcessOur Areas of Focus:
Better portfolio management
• Seeks to minimize costs
• Seeks to minimize risk versus benchmark
Research examples:
• Transaction cost analysis
• Implementation tools — full replication, sampling and optimization
Investment themes• What investors should be
thinking about• How the investment landscape
is changing
Research examples:
• The passive perspective on valuation errors
• Passive investing versus indexing
• Rethinking the market portfolio
• Problems with manager universe data
• The equity risk premium
• True costs of active management
• Fundamentals-based Indexing
Understanding theInvestment opportunity set
• Benchmark characteristics
• Benchmark dynamics
• Ways to manage exposure
Research examples:
• Benchmark comparisons
• Index change analysis
• New passive applications: hedge funds, commodities and wealth weighted benchmarks
GLSTND-0229
30
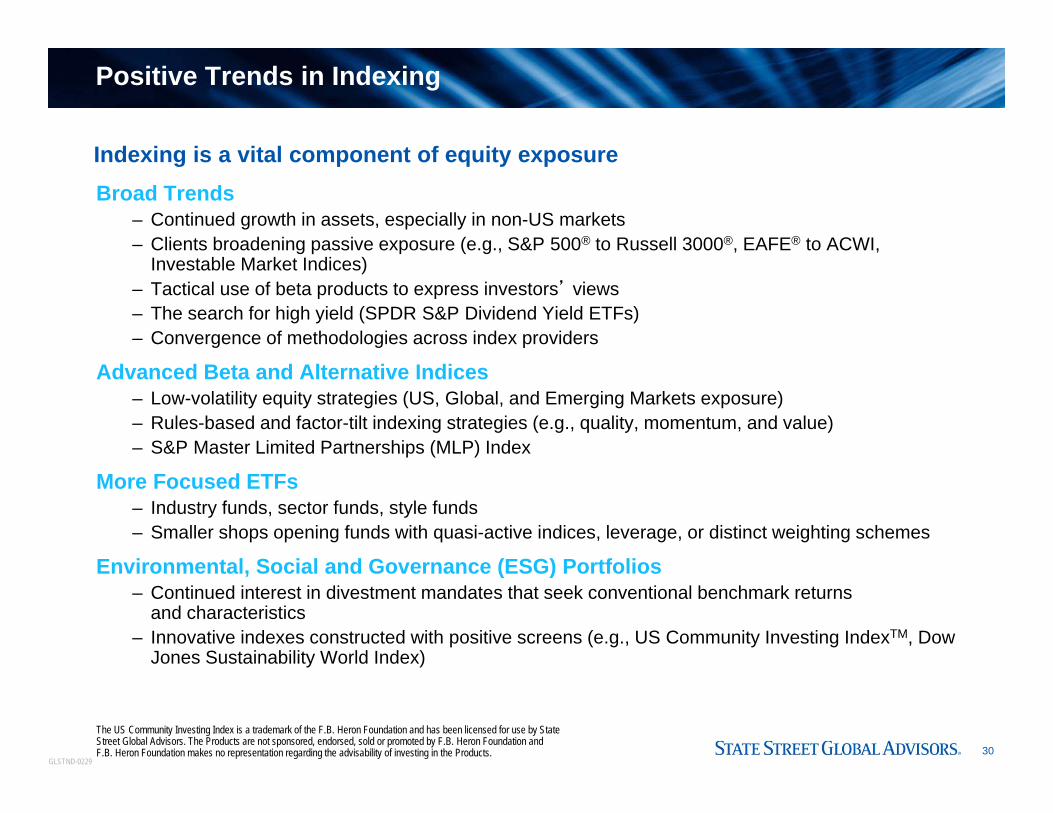
Positive Trends in Indexing
Broad Trends– Continued growth in assets, especially in non-US markets– Clients broadening passive exposure (e.g., S&P 500® to Russell 3000®, EAFE® to ACWI,
Investable Market Indices) – Tactical use of beta products to express investors’ views – The search for high yield (SPDR S&P Dividend Yield ETFs)– Convergence of methodologies across index providers
Advanced Beta and Alternative Indices– Low-volatility equity strategies (US, Global, and Emerging Markets exposure)– Rules-based and factor-tilt indexing strategies (e.g., quality, momentum, and value) – S&P Master Limited Partnerships (MLP) Index
More Focused ETFs– Industry funds, sector funds, style funds– Smaller shops opening funds with quasi-active indices, leverage, or distinct weighting schemes
Environmental, Social and Governance (ESG) Portfolios– Continued interest in divestment mandates that seek conventional benchmark returns
and characteristics– Innovative indexes constructed with positive screens (e.g., US Community Investing IndexTM, Dow
Jones Sustainability World Index)
Indexing is a vital component of equity exposure
The US Community Investing Index is a trademark of the F.B. Heron Foundation and has been licensed for use by State Street Global Advisors. The Products are not sponsored, endorsed, sold or promoted by F.B. Heron Foundation and F.B. Heron Foundation makes no representation regarding the advisability of investing in the Products.
GLSTND-0229

31
Why SSgA for Index Management?
Stable, tenured, team• Over 30 years of dedicated index management with an average of 16 years industry
experience across the global portfolio management team
Indexed equity exposure while minimizing costs• Significant cost-savings through crossing opportunities
Customized investment strategies• Modular approach enables clients to realize all of the benefits of our sizeable, seasoned,
commingled fund portfolios
Timely research that provides clients with innovative guidance and options• Researchers dedicated to practical as well as strategic and theoretical issues
Seeks to provide client with an organization with strong and lasting client relationships• Over 1,700 client portfolios managed globally against over 400 indices
SSgA’s competitive strengths:
As of December 31, 2011. Updated annually.GLSTND-0229
Conservative S&P 500® Index Strategy
In addition to the normal market risks associated with equity investing, investment in smaller companies typically exhibit higher volatility.
GLSTND-0198

33
SSgA Index Experience
• SSgA introduced our first Standards' & Poor’s mutual fund in 1978
• Currently managing assets benchmarked to over 20 domestic S&P Indices
Dow Jones IndicesSM are service marks of Dow Jones & Company, Inc. and have been licensed for use for certain purposes by State Street Global Advisors (SSgA).Russell Investment Group is the source and owner of the trademarks, service marks and copyrights related to the Russell Indexes.Russell Indices are trademarks of Russell Investment Group.Standard & Poor's S&P Indices are registered trademarks of Standard & Poor's Financial Services LLC.
S&P Domestic Equity Index Strategies AUM
Strategy AssetsS&P 500® Index $145,592M SPDR S&P 500® Index (SPY) 107,435 S&P 500® Conservative Index 310 S&P 500® Index Futures 735S&P 500® Hedged Index 503 S&P 500® Equal Weighted Index 1,012 S&P 500® Index Screened 5,811S&P 500® Ex Tobacco Index 1,619S&P 500® Growth Index 312 S&P 500® Value Index 352 S&P MidCap 400™ Index 15,586S&P Mid Cap Growth™ Index 108 S&P Mid Cap Value™ Index 22S&P Small Cap 600® Index 183 S&P 600® Growth Index 151 S&P 600® Value Index 121 S&P 100 Index 430 S&P GSCI 310 S&P GSCI Light Energy Index 111 S&P High Yield Div. Aristocrat 10,080 S&P MLP Index 192 S&P US Sector Index 57,174Total $348,149M
GLSTND-0142
S&P Indexes$348,149 M
Dow Jones/DJ IndexesSM
$20,583 M
Russell Indexes$94,277 M
MSCI $6,289 M
US TEMC$10,091M
Other$7,489 M
US Index Assets Under Management$486,877 Million as of June 30, 2012

34
Conservative S&P 500® Index Strategy Overview
• Conservative S&P 500 Index Strategy– Replication with additive offsets– No use of derivatives for cash management and market exposure – Limited opening dates (Friday and last day of month) for cash flows
• S&P 500 Index: Exposure to 500 leading companies in leading industries– Large-cap equity covering about 75% of US market – Float-adjusted market capitalization – Continuous reconstitution– Five year average historical turnover: 4.4%
As of June 30, 2012Although some investments may exhibit certain characteristics of leverage transactions, SSgA will not borrow money or use derivatives for the S&P 500 Index Strategy in a manner that SSgA considers to have the purpose of creating investment leverage. Investments made by SSgA to hedge or reduce risk will not be considered to have been made for the purpose of creating investment leverage; SSgA generally will determine whether an investment has the effect of creating investment leverage by evaluating the effect of the investment on the exposure and risk profile of the Strategy's portfolio as a whole.Standard & Poor's S&P 500® Index is a registered trademark of Standard & Poor's Financial Services, LLC.
Objective: Seeks to match the returns and characteristics of the S&P 500 Index as closely as practicable, before expenses
GLSTND-0198

35
Cost-Effective Trading
95% of the S&P 500 Index Strategy’s cash flows traded at low or no cost*
Total Cash Flows: $580.5 Billion, 1995–2009
Internal Cross39%
Futures21%
Unit Cross24%
Agency5%
External Cross11%
Source: SSgAGLSTND-0197
36
-22.05
28.71
10.8815.81
-36.93
26.54
2.14
-11.89
-22.10
28.68
4.91 5.49
26.46
5.534.94 9.5115.12
-11.91
9.492.11
15.06
-37.00
10.8715.79
-50
-40
-30
-20
-10
0
10
20
30
40
2001 2002 2003 2004 2005 2006 2007 2008 2009 2010 2011 2012 YTD
Perc
ent
S&P 500 Composite Standard & Poor's 500 Index
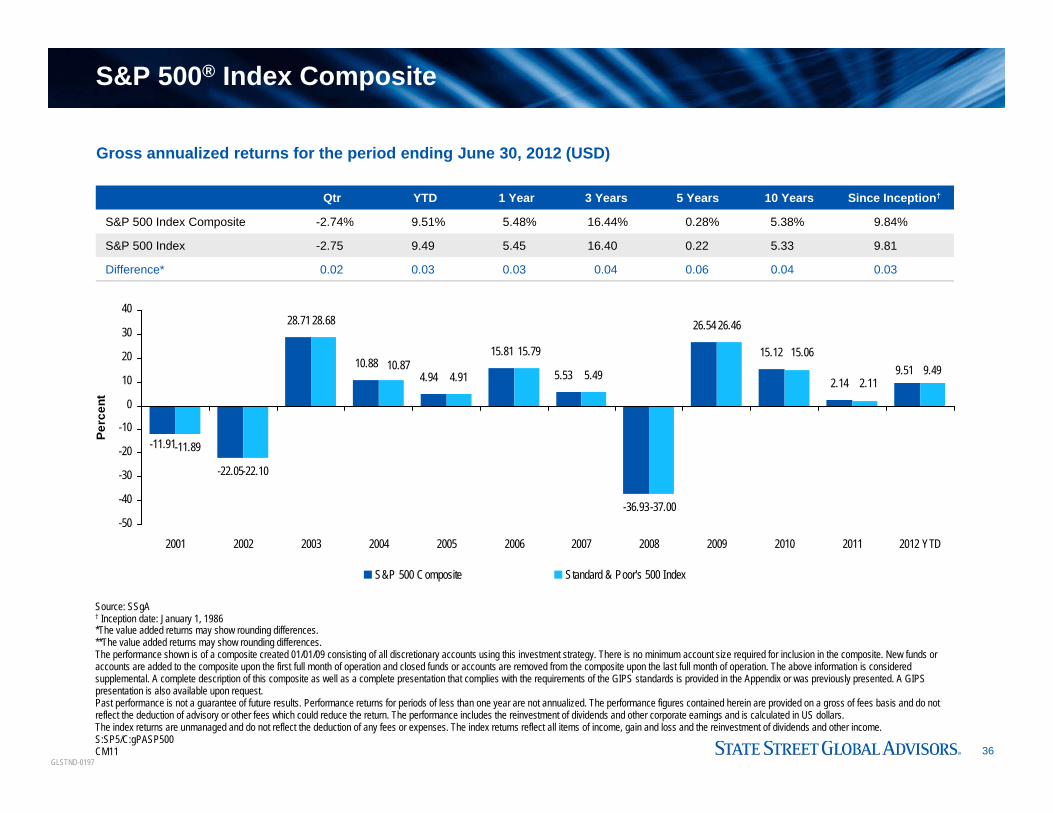
S&P 500® Index Composite
Qtr YTD 1 Year 3 Years 5 Years 10 Years Since Inception†
S&P 500 Index Composite -2.74% 9.51% 5.48% 16.44% 0.28% 5.38% 9.84%
S&P 500 Index -2.75 9.49 5.45 16.40 0.22 5.33 9.81
Difference* 0.02 0.03 0.03 0.04 0.06 0.04 0.03
Source: SSgA† Inception date: January 1, 1986*The value added returns may show rounding differences.**The value added returns may show rounding differences.The performance shown is of a composite created 01/01/09 consisting of all discretionary accounts using this investment strategy. There is no minimum account size required for inclusion in the composite. New funds or accounts are added to the composite upon the first full month of operation and closed funds or accounts are removed from the composite upon the last full month of operation. The above information is considered supplemental. A complete description of this composite as well as a complete presentation that complies with the requirements of the GIPS standards is provided in the Appendix or was previously presented. A GIPS presentation is also available upon request. Past performance is not a guarantee of future results. Performance returns for periods of less than one year are not annualized. The performance figures contained herein are provided on a gross of fees basis and do not reflect the deduction of advisory or other fees which could reduce the return. The performance includes the reinvestment of dividends and other corporate earnings and is calculated in US dollars.The index returns are unmanaged and do not reflect the deduction of any fees or expenses. The index returns reflect all items of income, gain and loss and the reinvestment of dividends and other income.S:SP5/C:gPASP500CM11
GLSTND-0197
Gross annualized returns for the period ending June 30, 2012 (USD)

37
Conservative S&P 500 Index Strategy
28.73
4.92 5.59
26.50
9.45
-22.10
28.68
10.8815.79
-37.00
15.06
-21.94
2.12
15.78
-36.82
10.8515.08
5.494.91
26.46
2.119.49
-50
-40
-30
-20
-10
0
10
20
30
40
2002 2003 2004 2005 2006 2007 2008 2009 2010 2011 2012 YTD
Perc
ent
Conservative S&P 500 Index Strategy Standard & Poor's 500 Index
Qtr YTD 1 Year 3 Years 5 Years 10 Years Since Inception†
Conservative S&P 500 Index Strategy -2.75% 9.45% 5.41% 16.39% 0.29% 5.39% 9.51%
S&P 500® Index -2.75 9.49 5.45 16.39 0.22 5.33 9.48
Difference* 0.00 0.04 -0.04 0.00 0.07 0.06 0.03
Source: SSgA† Inception date: June 1, 1988*The value added returns may show rounding differences.Past performance is not a guarantee of future results. The performance figures contained herein are provided on a gross of fees basis only, but net of administrative costs. The performance figures do not reflect the deduction of advisory or other fees which could reduce the return. The performance includes the reinvestment of dividends and other corporate earnings and is calculated in US dollars. The index returns are unmanaged and do not reflect the deduction of any fees or expenses. The index returns reflect all items of income, gain and loss and the reinvestment of dividends and other income.The above information is considered supplemental to the GIPS® presentation for this Composite, which can be found in the Appendix or was previously presented. A GIPS® presentation is also available upon request.There are a number of risks associated with futures investing including but not limited to counterparty credit risk, currency risk, derivatives risk, foreign issuer exposure risk, sector concentration risk, leveraging and liquidity risks.S:SP5/C:CM12
GLSTND-0198
Gross annualized returns for the period ending June 30, 2012 (USD)

Appendix A: Important Disclosures

39
Index Trademark Attribution
• Dow Jones IndicesSM, are service marks of Dow Jones & Company, Inc. and have been licensed for use for certain purposes by State Street Global Advisors (SSgA).
• "FTSE®”, "FT-SE®” and "Footsie®” are trade marks jointly owned by the London Stock Exchange Plc and The Financial Times Limited and are used by FTSE International Limited ("FTSE") under license. "All-World", "All-Share" and "All-Small" and "FTSE4Good" are trademarks of FTSE.
• The MSCI Indexes are trademarks of MSCI, Inc.
• Russell Investment Group is the source and owner of the trademarks, service marks and copyrights related to the Russell Indexes. Russell Indices are trademarks of Russell Investment Group.
• Standard & Poor's S&P Indices are registered trademarks of Standard & Poor's Financial Services LLC.
• S&P GSCI™ is a trademark of Standard & Poor's Financial Services LLC. and has been licensed for use by Goldman, Sachs & Co.
GLSTND-0229

40
MSCI Index Disclaimer
MSCI Indices are trademarks of MSCI Inc. Any financial products referred to herein are not sponsored, endorsed, or promoted by MSCI, and MSCI bears no liability with respect to any such financial products or any index on which such financial products are based. The fund documents contain a more detailed description of the limited relationship MSCI has with SSgA and any related financial products. Source: MSCI: Neither MSCI nor any other party involved in or related to compiling, computing or creating the MSCI data makes any express or implied warranties or representations with respect to such data (or the results to be obtained by the use thereof), and all such parties hereby expressly disclaim all warranties of originality, accuracy, completeness, merchantability or fitness for a particular purpose with respect to any of such data. Without limiting any of the foregoing, in no event shall MSCI, any of its affiliates or any third party involved in or related to compiling, computing or creating the data have any liability for any direct, indirect, special, punitive, consequential or any other damages (including lost profits) even if notified of the possibility of such damages. No further distribution or dissemination of the MSCI data is permitted without MSCI’s express written consent.

Appendix B: GIPS® Presentation

42
gPASP500* Less than 5 accounts** Less than 3 yearsQuarterly and YTD returns are not annualized
GIPS® Report: S&P 500 Index CompositeAs of December 31, 2011
Quarter YTD1
Year3
Years5
Years10
YearsInception Jan 1986
S&P 500 Index Composite 11.81 2.14 2.14 14.16 -0.19 2.96 9.65S&P 500® 11.82 2.11 2.11 14.11 -0.25 2.92 9.63
Year S&P 500 Index Composite S&P 500®
2011 2.14 2.112010 15.12 15.062009 26.54 26.462008 -36.93 -37.002007 5.53 5.492006 15.81 15.792005 4.94 4.912004 10.88 10.872003 28.71 28.682002 -22.05 -22.10
FootnotesComposite Description: The S&P 500 Index Composite seeks to replicate the returns and characteristics of the Standard & Poor's 500 Index.Firm Definition: For the purpose of complying with the Global Investment Performance Standards (GIPS®), the firm ('SSgA-Global') is defined as all portfolios managed across the global offices of State Street Global Advisors (SSgA) and SSgA Funds Management, Inc., with the exception of business units which are held out to the market place as distinct business entities – the Office of the Fiduciary Advisor (OFA) and Charitable Asset Management (CAM). Prior to 1/1/2011, SSgA-Global also excluded its wrap fee business (Intermediary Business Group [IBG]) and assets accounted for on a book value basis (global cash and stable value assets).List Available: A complete list of the firm’s composites and their descriptions is available upon request.Compliance Statement: SSgA-Global has prepared and presented this report in compliance with the Global Investment Performance Standards (GIPS®). SSgA-Global claims compliance with GIPS® from January 1, 2000.Creation Date: The composite was created on 1 Jan 09.Verification Statement: SSgA-Global claims compliance with the Global Investment Performance Standards (GIPS®) and has prepared and presented this report in compliance with the GIPS® standards. SSgA-Global has been verified for the periods from 1 January 2000 through 31 December 2009 by an independent third party. A copy of the verification report is available upon request. Verification assesses whether (1) the firm has complied with all the composite construction requirements of the GIPS standards on a firm-wide basis and (2) the firm’s policies and procedures are designed to calculate and present performance in compliance with the GIPS standards. Verification does not ensure the accuracy of any specific composite presentation.Benchmark Description: The benchmark for the composite is the S&P 500(R). The index returns are unmanaged and do not reflect the deduction of any fees or expenses. The index returns reflect all items of income, gain and loss.Currency: Performance is presented in USD.Use of Subadvisors: This composite contains portfolios that were managed on a sub-advised basis for the period from 01/09/02 to 31/08/08.Fees: Returns are expressed gross of management fees. Some members of this composite may accrue administration fees.Fee Schedule: For commingled funds, management fees are .05% of the first 50,000,000; .04% of the next $50,000,000; and .02% thereafter. The annual minimum management fee for these accounts is $10,000. For separately managed accounts, management fees are .05% of the first $50,000,000; .04% of the next $50,000,000 and .02% thereafter. The minimum annual management fee for separately managed accounts is $50,000. Management fees maybe adjusted based upon specific client requirements.Derivatives Use: SSgA may use futures and other derivatives from time to time in the management of the Strategy generally as a temporary substitute for cash investments or for hedging purposes and not with the purpose of creating investment leverage.Calculation Methodology: Additional information regarding the firm’s policies and procedures for calculating and reporting performance results is available upon request.Annualized Returns: All returns for periods greater than one year have been annualized.Withholding Taxes Differences: None.Exchange Rates Differences Between Composite & Benchmark: None.Minimum Asset Level for Inclusion: 0.Dispersion: Asset-Weighted standard deviation is calculated using the annual returns of the accounts that were included in the composite for all periods of the year.Significant Events: In November 2007, on the departure of the North America CIO Sean Flannery, Global asset class CIOs were appointed (Alistair Lowe, Asset Allocation and Currency CIO; Mark Marinella, Fixed Income CIO; Steve Meier, Cash CIO and Arlene Rockefeller, Equities CIO). In May 2010, Lynn Blake assumed the role as global head of Index Equity following the retirement of Paul Brakke.Past and Future Performance: Historic performance is not necessarily indicative of actual future investment performance, which could differ substantially.
Gross Returns
YearNo. of
Portfolios Composite Dispersion
3 Yr Annualized Standard
Deviation -Composite
3 Yr Annualized Standard
Deviation -Benchmark
Total Assets at End of Period
% of Firm’s Assets
Total Firm Assets ($ mil)
2011 19 0.01 18.69 18.71 62,533,513,974 3.50 1,789,204
2010 14 0.02 21.84 21.85 58,677,181,141 3.86 1,519,244
2009 17 0.06 19.62 19.63 56,089,319,018 4.12 1,360,125
2008 13 0.02 15.07 15.08 63,339,358,250 6.67 949,988
2007 12 0.07 7.68 7.68 105,916,299,878 8.50 1,246,382
2006 12 0.10 6.82 6.82 105,498,089,610 9.83 1,073,038
2005 12 0.05 9.04 9.04 102,507,256,676 11.26 910,097
2004 15 0.05 14.86 14.86 101,019,651,849 12.01 841,422
2003 16 0.08 18.07 18.07 109,663,641,800 13.46 814,497
2002 17 0.04 18.55 18.55 81,604,207,292 14.78 552,079

Appendix C: Biography

44
Corinne Larson
Corinne Larson is a Vice President of State Street Global Advisors and a Senior Relationship Manager. She is responsible for managing all aspects of client relationships within SSgA's public funds and not-for-profit client base. Prior to joining SSgA, Corinne served as the Chief Marketing Officer, Senior Vice President for a start-up offering OPEB (other post-employment benefits) services. Previously, she was a director of marketing with Bear, Stearns & Co. Inc. in the Pension, Endowment, and Foundation Services Group. Corinne also was a vice president with MBIA Asset Management, overseeing the marketing and client service functions for the firm's institutional accounts. Prior to MBIA, she served as assistant director in the Research Center of the Government Finance Officers Association (GFOA) where she was responsible for the association's cash management and investment programs.
Corinne is a recognized speaker and author of numerous publications, and has contributed chapters on cash management and investing for textbooks published by GFOA, the World Bank and the International City/County Management Association. She sits as an advisor on GFOA's Standing Committee on Retirement and Benefits Administration.
Corinne holds the designation of Certified Treasury Professional through the Association for Financial Professionals and has more than ten years of experience in corporate treasury management.
She received her Bachelor of Arts degree from Indiana University and her Master of Business Administration degree from the University of Notre Dame, and holds Series 7 and 63 licenses from the Financial Industry Regulatory Authority (FINRA).
Biography