
City of Melbourne medium-term economic outlook - July 2021
13
CITY OF MELBOURNE MEDIUM-TERM ECONOMIC OUTLOOK JULY 2021
Transcript of City of Melbourne medium-term economic outlook - July 2021

CITY OF MELBOURNE MEDIUM-TERM ECONOMIC OUTLOOK JULY 2021

melbourne.vic.gov.au
Acknowledgement of Traditional Custodians
The City of Melbourne respectfully acknowledges the Traditional Custodians of the land, the Bunurong Boon Wurrung and Wurundjeri Woi Wurrung peoples of the Eastern Kulin Nation and pays respect to their Elders past, present and emerging. We are committed to our reconciliation journey, because at its heart, reconciliation is about strengthening relationships between Aboriginal and non-Aboriginal peoples, for the benefit of all Victorians.

City of Melbourne Medium-Term Economic Outlook 1
The City of Melbourne sought data and projections from Deloitte Access Economics on the impact of COVID-19 on the CBD economy to help guide ongoing recovery and reactivation efforts.The study area included the Hoddle Grid and parts of Docklands, city north and Southbank.
The other Australian capital cities included in the analysis were Sydney, Brisbane, Adelaide and Perth.
Deloitte found that of all Australia’s states and territories, Victoria has been the hardest hit by the COVID-19 pandemic.
The economic toll of the pandemic on Melbourne occurred not just in 2020 but has lasted as restrictions ease in 2021, with the city having far more economic ground to recover than other capital cities.
The higher density of people in public places and workplaces in the central city has led to Melburnians being more cautious about returning to their regular everyday activities.
Despite the economic shocks, the City of Melbourne has been able to act swiftly to accelerate our city’s economic recovery, including negotiating a $300 million joint fund with the Victorian Government to revitalise our city.
Deloitte found that Melbourne’s CBD is forecast to return to being one of the nation’s fastest-growing economies in the coming years. The CBD will reach its pre-COVID-19 peak of around $74 billion in the second half of 2024.
The forecasts show that the central Melbourne economy will have put the pandemic behind it by 2024, which is a forecast recovery timeline of four years.
While there will be some small permanent impacts of COVID-induced work-from-home, the number of daily workers in the city is also expected to recover strongly.
These measures indicate there are good reasons to be confident about Melbourne’s economic future.
EXECUTIVE SUMMARY
Data and insights provided by Deloitte.
This analysis was completed in May 2021 and does not account for the Melbourne circuit-breaker lockdown in June 2021 or subsequent restrictions across Australia over June and July 2021.
melbourne.vic.gov.au2
Gross regional product (GRP) is a monetary measure of the market value of all final goods and services produced in a region or subdivision of a country in a period (quarterly or yearly) of time.
Prior to COVID-19, the city’s GRP (CBD area only) was around $74 billion.
The city’s GRP decreased by 53% ($39.8 billion) in 2020 due to the pandemic, to a total of $35.4 billion.
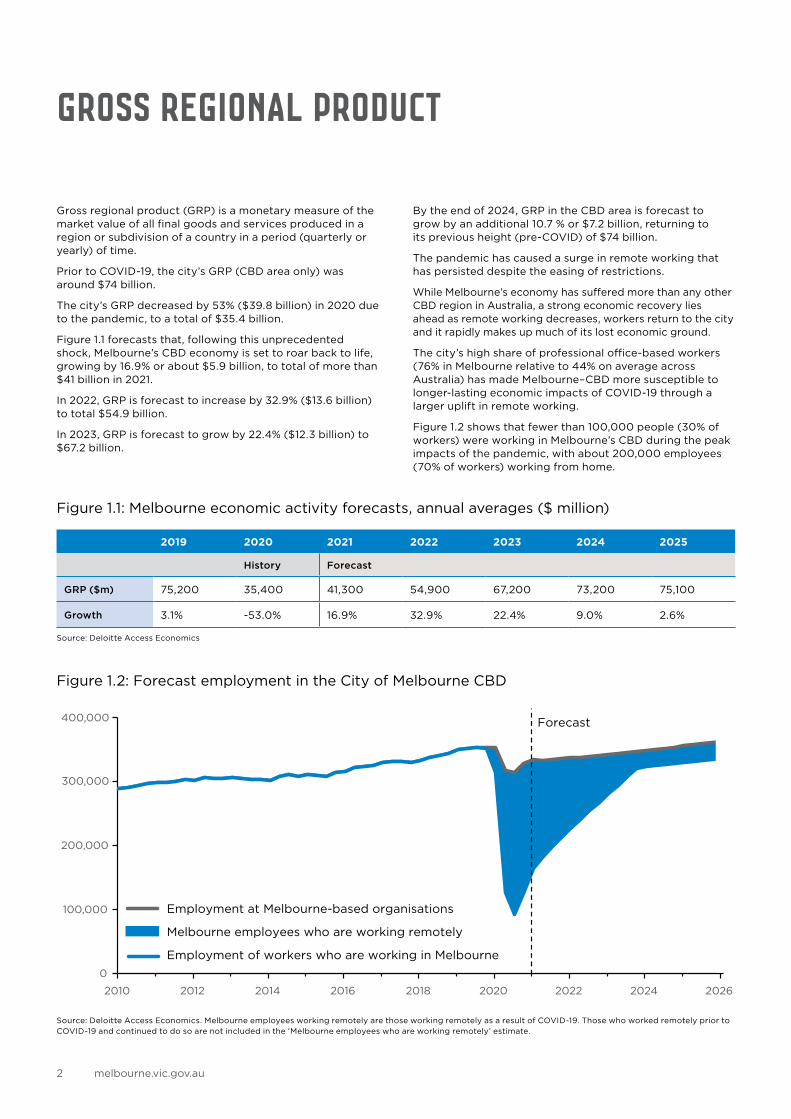
Figure 1.1 forecasts that, following this unprecedented shock, Melbourne’s CBD economy is set to roar back to life, growing by 16.9% or about $5.9 billion, to total of more than $41 billion in 2021.
In 2022, GRP is forecast to increase by 32.9% ($13.6 billion) to total $54.9 billion.
In 2023, GRP is forecast to grow by 22.4% ($12.3 billion) to $67.2 billion.
By the end of 2024, GRP in the CBD area is forecast to grow by an additional 10.7 % or $7.2 billion, returning to its previous height (pre-COVID) of $74 billion.
The pandemic has caused a surge in remote working that has persisted despite the easing of restrictions.
While Melbourne’s economy has suffered more than any other CBD region in Australia, a strong economic recovery lies ahead as remote working decreases, workers return to the city and it rapidly makes up much of its lost economic ground.
The city’s high share of professional office-based workers (76% in Melbourne relative to 44% on average across Australia) has made Melbourne–CBD more susceptible to longer-lasting economic impacts of COVID-19 through a larger uplift in remote working.
Figure 1.2 shows that fewer than 100,000 people (30% of workers) were working in Melbourne’s CBD during the peak impacts of the pandemic, with about 200,000 employees (70% of workers) working from home.
GROSS REGIONAL PRODUCT
Figure 1.1: Melbourne economic activity forecasts, annual averages ($ million)
2019 2020 2021 2022 2023 2024 2025
History Forecast
GRP ($m) 75,200 35,400 41,300 54,900 67,200 73,200 75,100
Growth 3.1% -53.0% 16.9% 32.9% 22.4% 9.0% 2.6%
Source: Deloitte Access Economics
Figure 1.2: Forecast employment in the City of Melbourne CBD
0
100,000
200,000
300,000
400,000
2010 2012 2014 2016 2018 2020 2022 2024 2026
Employment at Melbourne-based organisations
Melbourne employees who are working remotely
Employment of workers who are working in Melbourne
Forecast
Source: Deloitte Access Economics. Melbourne employees working remotely are those working remotely as a result of COVID-19. Those who worked remotely prior to COVID-19 and continued to do so are not included in the ‘Melbourne employees who are working remotely’ estimate.

City of Melbourne Medium-Term Economic Outlook 3
The number of people working in Melbourne’s CBD on an average day is forecast to grow rapidly over the coming years.
It is forecast that 332,600 workers will be working in the CBD each day by 2025.
As Melbourne bounces back, an additional 24,400 workers will return to the city by the end of 2021.
RETURN TO WORKPLACE RATES IN MELBOURNE
Figure 1.3 Melbourne employment forecasts, annual averages
2019 2020 2021 2022 2023 2024 2025
History Forecast
Employment in Melbourne-based organisations
Level 352,300 328,200 334,600 339,300 345,000 351,500 358,500
Growth 3.9% -6.8% 2.0% 1.4% 1.7% 1.9% 2.0%
Estimated number of workers in the city
Level 352,300 164,700 189,100 247,400 300,900 326,400 332,600
Growth 3.9% -53.2% 14.8% 30.9% 21.6% 8.5% 1.9%
DifferenceLevel 0 163,500 145,500 91,900 44,100 25,100 25,900
Growth 0% -46% 13% 29% 20% 7% 0%
Source: Deloitte Access Economics. The estimated number of workers in the city excludes people working remotely due to COVID-19. It does not exclude people who were working remotely prior to COVID-19 and have continued to do so to the same extent following COVID-19.
A full breakdown of workers returning over the coming years is provided below:
• 189,100 workers in 2021 (up 14.8% or 24,400 workers more than in 2020)
• 247,400 workers in 2022 (up 30.9% or 58,300 workers more than in 2021)
• 300,900 workers in 2023 (up 21.6% or 53,500 workers more than in 2022)
• 326,400 workers in 2024 (up 8.5% or 25,500 workers more than in 2023)
• 332,600 workers in 2025 (up 1.9% or 6,200 workers more than in 2024)

melbourne.vic.gov.au4
The chart below compares forecast annual employment of people working in Melbourne to that of people working in Australia’s other major capital cities.
The forecast suggests employment of people working in Brisbane and Perth will return to 2019 levels during 2023.
In Adelaide, employment is forecast to return to pre-COVID levels at the start of 2026 (the very end of the five-year forecast horizon).
Employment of people working in Sydney is not forecast to reach pre-COVID levels within the five-year forecast horizon.
However, it is forecast to get back to within 1.0% (3,400 workers) of pre-COVID levels which is a much narrower gap than the 5.6% (19,700 workers) below pre-COVID forecast for Melbourne employment by the start of 2025.
HOW MELBOURNE COMPARES: NATIONAL RETURN TO WORKPLACE RATES
Figure 1.4: Forecast employment of people working Melbourne other major capital cities
0
50,000
100,000
150,000
200,000
250,000
300,000
350,000
400,000
2010 2012 2014 2016 2018 2020 2022 2024 2026
Forecast
Sydney
Melbourne
Brisbane Adelaide
Perth
Source: Deloitte Access Economics Employment of people working in the given location excludes those working remotely due to COVID-19. It does not exclude those who were working remotely prior to COVID-19 and have continued to do so to following COVID-19.

City of Melbourne Medium-Term Economic Outlook 5
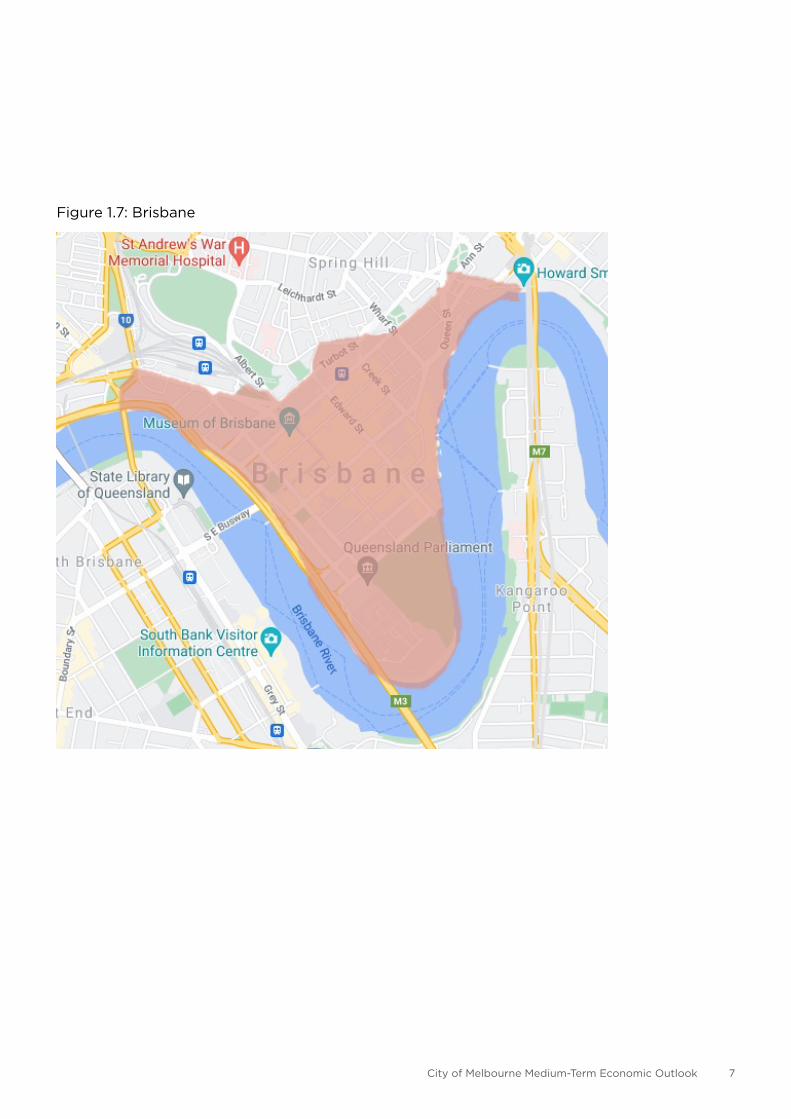
The outlined shaded areas in the following figures demonstrate the geographic locations used for the analysis and forecasts of each city area provided in this report.
Please note, this report measures employment and output based on where employees are located, in order to account for remote working.
Other sources tend to measure employment and output based on where the employing company is located.
The definition of Melbourne’s CBD used in this report (see Appendix A) does not capture the entire City of Melbourne.
APPENDIX A: CITY AREA DEFINITIONS
Figure 1.5: Melbourne

melbourne.vic.gov.au6
Figure 1.6: Sydney
City of Melbourne Medium-Term Economic Outlook 7
Figure 1.7: Brisbane

melbourne.vic.gov.au8
Figure 1.8: Adelaide

City of Melbourne Medium-Term Economic Outlook 9
Figure 1.9: Perth (includes West Perth)

melbourne.vic.gov.au10
EmploymentEmployment is typically measured using one of the following two standard definitions:
• Place of Work: Captures the number of people employed in a location based on the address of the business that an employee works for. For Melbourne, this measure of employment includes everyone employed by a business with its main address in Melbourne, whether or not the employees are conducting their work at that Melbourne address or somewhere else.
• Place of Usual Residence: Measures the number of people employed in a location based on the address of where the person lives. For Melbourne, this measure of employment captures everyone whose main residential address is in Melbourne, whether or not their job is based there or somewhere else.
These definitions show that employment is typically measured based on the address of the employing business (place of work) or the address of the employee (place of usual residence). Neither of these measures focuses on where work is actually being done.
Under typical, pre-COVID conditions, the place of work measure of employment would be the most appropriate for measuring Melbourne’s CBD employment as it would capture everyone employed by a Melbourne-based business.
However, the pandemic has caused a surge in remote working that has persisted despite the easing of restrictions. This leaves the place of work measure of employment (and other standard measures of employment) unable to accurately measure the number of people actually working in Melbourne’s CBD on any given day.
Large-scale remote working has major implications for employment and economic activity in CBD areas beyond affecting the number of people carrying out their work there. Most of the workforce commutes into the city from other locations, so when they aren’t entering cities to work, the CBDs miss out on the activity and spending of city workers such as on transport, food and entertainment in the city.
Analysis of Google mobility data measuring the number of people attending workplaces relative to before COVID-19 found that in the June quarter of 2020 when the national impacts of COVID-19 were at their peak, CBD workplace mobility plummeted most in Sydney and Melbourne.
The workplace mobility differences below -62% and -67% respectively suggest that about two-thirds of Sydney and Melbourne-based employment was being done remotely, outside of the CBDs.
Having the majority of all work done by employees of Melbourne based organisations being done remotely during June 2020 and still half done remotely in the March quarter of 2021 has significant implications for measuring Melbourne’s economy. A very large share of employment that would typically be measured as Melbourne-based (using the place of work measure) has not actually been occurring in Melbourne. This also has large flow-on impacts to CBD spending as fewer people are travelling to Melbourne and spending money in the city.
In light of the remote working impacts resulting from the pandemic, and in order to measure employment in a way that more accurately reflects its full and lasting impacts on the city of Melbourne, the analysis and forecasts in this report measure employment by excluding the share of the workforce working remotely as a result of COVID-19. This provides a more accurate picture of people actually working in the city, along with the persistent and large impacts of the pandemic on the city.
Economic activityEconomic activity, otherwise known as economic output, is typically measured by Gross Domestic Product (GDP) at the national level. The state and regional equivalents of GDP are Gross State Product (GSP) and Gross Regional Product (GRP) respectively.
Each of GDP, GSP and GRP represent the economic activity occurring in the relevant location and are generally measured through one, or a combination, of the following measures:
• Income measure of economic activity: Adds together the different types of income being generated in a location to determine economic activity. The major types of income are the earnings of employees (mostly form their wages and salaries), the profits of businesses, income earned from renting out a property and Government tax income.
• Expenditure measure of economic activity: Measures economic activity by adding up the different types of expenditure occurring in a location. Key types of expenditure include household consumption, dwelling investment (e.g. investment in building or renovating homes), private business investment, government sector consumption and investment, as well expenditure on imports and exports.
• Production measure of economic activity: The production measure adds together the production (or output) coming from each industry in a location. For example, this measure adds together the value of output produced by the agricultural, manufacturing, construction, professional services, health and education industries along with that from all other industries. A common means for estimating the output of each industry is to multiply the number of employees working in an industry by the average productivity of workers in that industry, where productivity is measured as the output produced per employee.
Following a review of methodologies used to measure economic activity , it was determined that using the production measure by multiplying employment forecasts by productivity forecasts would be the best approach to forecasting Melbourne’s economic activity for this report.
This method is largely driven by employment estimates which in this analysis, have been measured in a way that reflects the full and lasting impacts of COVID-19 on the city by excluding employment and work that is being done remotely due to COVID-19.
Applying the production measure to Melbourne employment forecasts that exclude work being done remotely, means the resulting forecasts of economic activity in Melbourne will also more accurately represent economic activity actually occurring within Melbourne.
METHODOLOGY: MEASURING EMPLOYMENT AND ACTIVITY

melbourne.vic.gov.au


