City of Bunbury Financial Plan 2019-20 to... · Construct Community Fishing & Crabbing Platform...
77
City of Bunbury Integrated Financial Plan - Part A Financial Years: Tuesday, 7 May, 2019 2019-20 to 2033-34 Provides a summary of the key elements of the Integrated Financial Plan including an Executive Summary, Financial Overview, Workforce Plan, and Asset Management Plan
Transcript of City of Bunbury Financial Plan 2019-20 to... · Construct Community Fishing & Crabbing Platform...
City of BunburyIntegrated Financial Plan - Part A
Financial Years:Tuesday, 7 May, 2019
2019-20 to 2033-34
Provides a summary of the key elements of the Integrated Financial Planincluding an Executive Summary, Financial Overview,
Workforce Plan, and Asset Management Plan

Integrated Financial Plan 2019-20 to 2033-34
BACKGROUND
Our Integrated Planning and Reporting Framework 8
Engaging Our Community 8
Performance Management Framework 8
Vision and Core Values 9
Community Profile 9
Strategic Planning Relationship 10
Service Delivery 10
Table of Contents
WORKFORCE PLAN
Workforce Plan Strategies 42
Corporate Structure 43
Purpose of the Plan 3
Executive Summary 3
Key Projects 4
FINANCIAL OVERVIEW
Financial Summary 12
Budget Type Summary 13
Key Assumptions and Sustainability Measures 14
Financial Indicators 15
Statutory Statements 21
Base Operating 28
Reserves 30
ASSET MANAGEMENT PLAN
Asset Management Plan Assumptions and Ratios 44
Asset Management Plan comparison to Integrated Financial Plan 47
Capital Expenditure by Asset Class 53
SCENARIO MODELLING and SENSITIVITY ANALYSIS
Scenario Models 38
Scenario Graphs and Analysis 38
RISK MANAGEMENT PLAN
Risk Management Outline 36
Risk Consequences Likelihood Matrix 37
Glossary of Terms 76
Page 2 of 77

Integrated Financial Plan 2019‐20 to 2033‐34
Purpose of the Plan
The City of Bunbury's Integrated Financial Plan is aligned to our Strategic Community Plan and details what the Council proposes to do over the next fifteen (15) years to ensure the City's financial viability.
Information contained in our Asset Management Plan and Workforce Plan has informed the Integrated Financial Plan, which will form the basis for the preparation of our Annual Budget.
The Integrated Financial Plan is a dynamic document that analyses financial trends over a fifteen (15) year period, based on a range of decisions and assumptions which provide the City with information to assess resourcing requirements to achieve its strategic objectives and ensure its future financial viability.
The Integrated Financial Plan covers the period 2019-20 to 2033-34. The plan is based on a high level of detail in the first four (4) years underpinned by a number of assumptions and resolutions of Council. The remaining years are shown with indicative forecasts.
It is important to note that the Integrated Financial Plan will be reviewed on an annual basis, in line with the budget process, for each ensuing financial year. This will ensure that the projects included reflect current Council priorities and anticipated funding availability.
Gary BrennanMayor
Mal OsborneChief Executive Officer
Executive SummaryThe Integrated Financial Plan (IFP) provides the Bunbury community a plan to deliver the vision, goals and objectives of the Strategic Community Plan. It incorporates the requirements of the ‘Integrated Planning and Reporting Framework’ for local governments to have a Corporate Business Plan for the next four years and also a long term financial plan which covers the next fifteen years.
The IFP demonstrates Council’s financial capacity to deliver services, provide facilities and manage assets that will sustain the Bunbury community into the future.
Due to the comprehensive information provided, the IFP is divided into three sections. Part A provides a summary of the key elements of the IFP including financial analysis and an overview of both the City’s Work Force Plan and Asset Management Plan. Part B highlights the first four years (2019/20 to 2022/23) under the Corporate Business Plan detailing core operations, and operating and capital projects in relation to Council’s goals and objectives. Part C details the fifteen year long term financial plan (2019/20 to 2033/34).
Key projects contained within the fifteen years of the IFP, shown on pages 4, 5 and 6, include: Renewal and expansion of infrastructure assets including: roads, paths, drainage and marine Renewal or refurbish of community, sport and leisure buildings Construction of a Youth Precinct Hay Park infrastructure redevelopment Renew Hands Oval infrastructure Replace Forrest Park pavilion Replace playground equipment Replace athletics track surface Bunbury waste water recycling project
The IFP is funded from the City’s own source of funds includes rates, fees and charges and reserve funds but is also dependent on external sources of funds including State Government and Federal Government Grants, contributions and loan borrowings.
Based on previous Council resolutions and agreed key assumptions, the IFP is a fully funded budget for the next 15 years for operating and capital programs while achieving:
A surplus at the end of each year to cover budget contingencies (ranging from $10K to $82K). Low reliance on loan borrowings. Over the next 15 years total loans will decrease from $14.5M in
2018/19 to $550K in 2033/34.
Cash-backed Reserves remain stable with a balance between $15.4M and $16.5M during 2019/20 to2022/23, the first four years of the IFP i.e. the Corporate Business Plan.
A new reserve, “City Growth and Major Development” for new major projects which will be initially usedto fund the design and part construction costs of the Youth Precinct. At the end of 2022/23 the balanceof this reserve is estimated at $1.2M.
Rate increases over the life of the plan range from 3.0% in 2019/20 to a maximum of 4.5%. This includesan allocation of 1.0% up to 2020/21 to be used specifically for the renewal and upgrade of existinginfrastructure assets; and then reduces to 0.5% from 2021/22 to 2030/31. While a further 0.5% will beallocated for new assets from 2021/22 to 2030/31.
A reduction in employee costs from Workforce Plan efficiencies.
Allocating the equivalent amount of the reduction in loan repayments in future years (benchmarkedfrom 2019/20) to the City Growth and Major Development Reserve (where possible) for new assets.
Investment in renewable energy efficient projects of $118K p.a. in the first four years and then $40Keach year.
Financial ratios that are either meeting the Local Government standards or improving over the life of theplan.
Capital projects totalling $207M over the next 15 years, averaging $13.8M per annum.
Capital expenditure included in the IFP is guided by the Asset Management Plan’s focus on asset renewal to maintain the community assets to an acceptable condition.
Page 3 of 77

Integrated Financial Plan 2019‐20 to 2033‐34
Key Projects
The following key projects are projected to be delivered through to 2033‐34:
Forecast Draft Budget Forecast Forecast Forecast Forecast Forecast Forecast Forecast Forecast Forecast Forecast Forecast Forecast Forecast Forecast
2018‐19 2019‐20 2020‐21 2021‐22 2022‐23 2023‐24 2024‐25 2025‐26 2026‐27 2027‐28 2028‐29 2029‐30 2030‐31 2031‐32 2032‐33 2033‐34
Operating ‐ New Initiative One Off
Renewable Energy and Energy Efficient ProjectsReneExpenditure 118,000 118,000 118,000 118,000 118,000 90,000 90,000 90,000 90,000 90,000 90,000 90,000 90,000 90,000 90,000 90,000
Implement South West Sport Centre Bushfire Mitigation ProjectImpl Expenditure 55,000 150,000 250,000 ‐ ‐ ‐ ‐ ‐ ‐ ‐ ‐ ‐ ‐ ‐ ‐ ‐
Provide funding for a "Community Grants" Funding RoundProv Expenditure 100,000 101,500 103,023 104,568 106,137 107,729 109,345 110,985 112,650 114,340 116,055 117,796 119,563 121,356 123,176 125,024
Implement Economic Development StrategyImpl Expenditure 150,000 100,000 100,000 100,000 100,000 100,000 100,000 100,000 100,000 100,000 100,000 100,000 100,000 100,000 100,000 100,000
Dredging of Pelican Point Grand CanalsDredExpenditure 190,000 410,000 ‐ ‐ ‐ ‐ ‐ ‐ ‐ ‐ ‐ ‐ ‐ ‐ ‐ ‐
Provide funding for an "Events Grants" Funding RoundProv Expenditure 250,000 253,750 257,556 261,419 265,340 269,320 273,360 277,460 281,622 285,846 290,134 294,486 298,903 303,387 307,938 312,557
Support Bunbury Regional Entertainment Centre (BREC) ‐ operating subsidySuppExpenditure 420,000 426,300 432,695 439,185 445,773 445,773 445,773 445,773 445,773 445,773 445,773 445,773 445,773 445,773 445,773 445,773
Capital ‐ New (Expansion)
Install Shade Sails in Public Open SpaceInstaExpenditure 80,000 ‐ 50,000 ‐ 50,000 ‐ 50,000 ‐ 50,000 ‐ 50,000 ‐ 50,000 ‐ 50,000 ‐
Expand cycleways (implement Bunbury Bike Plan)Expa Expenditure 179,710 200,000 200,000 200,000 200,000 200,000 200,000 200,000 200,000 200,000 200,000 200,000 200,000 200,000 200,000 200,000
Expand path networkExpa Expenditure 511,377 320,000 520,000 520,000 520,000 520,000 520,000 520,000 520,000 520,000 520,000 520,000 520,000 520,000 520,000 520,000
Expand path network in Bunbury Wildlife Park to create/improve access to exhibitsExpa Expenditure ‐ 10,000 ‐ ‐ ‐ ‐ ‐ 10,000 ‐ ‐ ‐ ‐ 10,000 ‐ ‐ ‐
Traffic calming and minor intersection treatmentsTraff Expenditure ‐ 100,000 100,000 100,000 100,000 100,000 100,000 100,000 100,000 100,000 100,000 100,000 100,000 100,000 100,000 100,000
Construct Forrest Highway shared pathConsExpenditure ‐ 400,000 ‐ ‐ ‐ ‐ ‐ ‐ ‐ ‐ ‐ ‐ ‐ ‐ ‐ ‐
Construct Youth PrecinctConsExpenditure ‐ 500,000 5,000,000 ‐ ‐ ‐ ‐ ‐ ‐ ‐ ‐ ‐ ‐ ‐ ‐ ‐
Purchase of new Public ArtPurc Expenditure ‐ ‐ 25,000 25,000 25,000 25,000 25,000 25,000 25,000 25,000 25,000 25,000 25,000 25,000 25,000 25,000
Construct Community Fishing & Crabbing Platform Jetty Road Koombana BayConsExpenditure ‐ ‐ 208,000 ‐ ‐ ‐ ‐ ‐ ‐ ‐ ‐ ‐ ‐ ‐ ‐ ‐
Construct Bunbury Wildlife Park interpretive education centre and function roomConsExpenditure ‐ ‐ ‐ ‐ ‐ 20,000 200,000 ‐ ‐ ‐ ‐ ‐ ‐ ‐ ‐ ‐
Hay Park Infrastructure RedevelopmentHay Expenditure ‐ ‐ ‐ ‐ ‐ 300,000 ‐ 2,000,000 ‐ ‐ 2,000,000 ‐ ‐ 500,000 ‐ ‐
Construct Bunbury Wildlife Park nocturnal houseConsExpenditure ‐ ‐ ‐ ‐ ‐ ‐ ‐ ‐ ‐ 200,000 ‐ ‐ ‐ ‐ ‐ ‐
Duplicate carriageway on Old Coast Rd Pelican PointDupl Expenditure ‐ ‐ ‐ ‐ ‐ ‐ ‐ ‐ ‐ ‐ 40,000 750,000 750,000 ‐ ‐ ‐
Page 4 of 77

Integrated Financial Plan 2019‐20 to 2033‐34
Key Projects
The following key projects are projected to be delivered through to 2033‐34:
Forecast Draft Budget Forecast Forecast Forecast Forecast Forecast Forecast Forecast Forecast Forecast Forecast Forecast Forecast Forecast Forecast
2018‐19 2019‐20 2020‐21 2021‐22 2022‐23 2023‐24 2024‐25 2025‐26 2026‐27 2027‐28 2028‐29 2029‐30 2030‐31 2031‐32 2032‐33 2033‐34
Install ablution facility (toilet block or Exeloo) in Elliot Street, BunburyInstaExpenditure ‐ ‐ ‐ ‐ ‐ ‐ ‐ ‐ ‐ ‐ ‐ ‐ 300,000 ‐ ‐ ‐
Install infrastructure (pipes/irrigation) for Bunbury waste water recycling projectInstaExpenditure ‐ ‐ ‐ ‐ ‐ ‐ ‐ ‐ ‐ ‐ ‐ ‐ 7,300,000 ‐ ‐ ‐
Capital ‐ Renewal
Replace boardwalks and lookoutsRepl Expenditure 10,000 ‐ 10,000 275,000 365,000 10,000 ‐ ‐ 190,000 710,000 735,000 385,000 170,000 250,000 250,000 250,000
Renew open space furniture and equipmentReneExpenditure 50,000 ‐ 100,000 100,000 100,000 100,000 100,000 100,000 100,000 100,000 100,000 100,000 100,000 100,000 100,000 100,000
Support Bunbury Regional Entertainment Centre (BREC) through the purchase of equipmentSuppExpenditure 100,000 100,000 100,000 100,000 100,000 100,000 100,000 100,000 100,000 100,000 100,000 100,000 100,000 100,000 100,000 100,000
Renew and upgrade pathsReneExpenditure 108,775 200,000 100,000 100,000 200,000 425,000 500,000 500,000 500,000 500,000 500,000 500,000 500,000 500,000 500,000 500,000
Renew, resleeve and improve drainage networkReneExpenditure 325,000 240,000 ‐ 200,000 500,000 250,000 250,000 250,000 100,000 250,000 200,000 250,000 250,000 250,000 250,000 250,000
Reseal Picton Road, East BunburyRese Expenditure 300,000 ‐ ‐ ‐ ‐ ‐ ‐ ‐ ‐ ‐ ‐ ‐ ‐ ‐ ‐ ‐
Improve City's Landscaping, Parks, Gardens and Entry StatementsImpr Expenditure 599,298 325,000 325,000 ‐ ‐ ‐ ‐ ‐ ‐ ‐ ‐ ‐ ‐ ‐ ‐ ‐
Renew foreshore marine walls ‐ Leschenault InletReneExpenditure 938,224 800,000 230,000 ‐ ‐ ‐ ‐ ‐ ‐ ‐ ‐ ‐ ‐ ‐ ‐ ‐
Replace street lightingRepl Expenditure ‐ 15,000 10,000 25,000 25,000 ‐ ‐ ‐ 180,000 600,000 600,000 620,000 ‐ ‐ ‐ ‐
Replace Forrest Park PavilionRepl Expenditure ‐ 80,000 1,500,000 ‐ ‐ ‐ ‐ ‐ ‐ ‐ ‐ ‐ ‐ ‐ ‐ ‐
Replace playground equipmentRepl Expenditure ‐ 225,000 275,000 325,000 375,000 425,000 425,000 425,000 425,000 425,000 425,000 425,000 425,000 425,000 425,000 425,000
Renew South West Sports Centre (SWSC) aquatic changeroom amenitiesReneExpenditure ‐ 350,000 ‐ ‐ ‐ ‐ ‐ ‐ ‐ ‐ ‐ ‐ ‐ ‐ ‐ ‐
Renew or refurbish community, corporate, sport and leisure buildings as per AMPReneExpenditure ‐ ‐ 250,000 250,000 250,000 1,000,000 1,000,000 1,250,000 2,000,000 2,000,000 2,000,000 1,000,000 1,000,000 1,000,000 1,000,000 1,000,000
Reseal and repair pavement Sandridge Road, East Bunbury (King Rd to Eelup RAB)Rese Expenditure ‐ ‐ 300,000 300,000 ‐ ‐ ‐ ‐ ‐ ‐ ‐ ‐ ‐ ‐ ‐ ‐
Renew stormwater infrastructureReneExpenditure ‐ ‐ 440,000 ‐ 330,000 250,000 250,000 300,000 200,000 300,000 250,000 300,000 300,000 300,000 300,000 300,000
Reseal roads projects (yet to be determined) for Roads to RecoveryRese Expenditure ‐ ‐ 445,000 445,000 445,000 445,000 615,000 615,000 615,000 615,000 615,000 615,000 615,000 615,000 615,000 615,000
Renew pavement and drainage, and re‐seal Victoria StreetReneExpenditure ‐ ‐ 1,000,000 ‐ ‐ ‐ ‐ ‐ ‐ ‐ ‐ ‐ ‐ ‐ ‐ ‐
Replace athletics track surfaceRepl Expenditure ‐ ‐ 1,000,000 ‐ ‐ ‐ ‐ ‐ ‐ ‐ ‐ ‐ 1,000,000 ‐ ‐ ‐
Rehabilitate foreshore marine wallsRehaExpenditure ‐ ‐ ‐ 100,000 100,000 100,000 100,000 100,000 100,000 100,000 1,100,000 1,100,000 1,100,000 1,100,000 1,100,000 1,100,000
Capital ‐ New (Expansion)
Page 5 of 77

Integrated Financial Plan 2019‐20 to 2033‐34
Key Projects
The following key projects are projected to be delivered through to 2033‐34:
Forecast Draft Budget Forecast Forecast Forecast Forecast Forecast Forecast Forecast Forecast Forecast Forecast Forecast Forecast Forecast Forecast
2018‐19 2019‐20 2020‐21 2021‐22 2022‐23 2023‐24 2024‐25 2025‐26 2026‐27 2027‐28 2028‐29 2029‐30 2030‐31 2031‐32 2032‐33 2033‐34
Replace or refurbish Eastman Pavilion at Recreation Ground BunburyRepl Expenditure ‐ ‐ ‐ 100,000 625,000 ‐ ‐ ‐ ‐ ‐ ‐ ‐ ‐ ‐ ‐ ‐
Reseal airport bitumen taxiways and runwaysRese Expenditure ‐ ‐ ‐ 600,000 ‐ ‐ ‐ ‐ ‐ ‐ ‐ ‐ ‐ ‐ ‐ ‐
Renew roads as per Asset Management PlanReneExpenditure ‐ ‐ ‐ 600,000 1,000,000 2,200,000 1,500,000 2,450,000 2,700,000 2,450,000 2,550,000 2,450,000 3,450,000 3,450,000 2,450,000 2,450,000
Renew footpath and paving at Graham Bricknell Sound ShellReneExpenditure ‐ ‐ ‐ ‐ 100,000 ‐ ‐ ‐ ‐ ‐ ‐ ‐ ‐ ‐ ‐ ‐
Reconstruct Nuytsia AvenueRecoExpenditure ‐ ‐ ‐ ‐ ‐ 200,000 200,000 ‐ ‐ ‐ ‐ ‐ ‐ ‐ ‐ ‐
Replace southern carpark retaining wall, Bunbury Library, Parkfield StreetRepl Expenditure ‐ ‐ ‐ ‐ ‐ ‐ ‐ ‐ 1,000,000 ‐ ‐ ‐ ‐ ‐ ‐ ‐
Renew Hands Oval InfrastructureReneExpenditure ‐ ‐ ‐ ‐ ‐ ‐ ‐ ‐ 1,000,000 500,000 ‐ ‐ ‐ ‐ ‐ ‐
Capital ‐ Upgrade
Upgrade Forrest Avenue and Blair Street intersection and construct slip laneUpgrExpenditure 60,000 ‐ 450,000 750,000 ‐ ‐ ‐ ‐ ‐ ‐ ‐ ‐ ‐ ‐ ‐ ‐
Realign and widen Koombana Drive EastRealiExpenditure 90,000 1,100,000 ‐ ‐ ‐ ‐ ‐ ‐ ‐ ‐ ‐ ‐ ‐ ‐ ‐ ‐
Upgrade facilities to meet the goal of becoming the Most Accessible Regional City in AustraliaUpgrExpenditure 100,000 100,000 100,000 100,000 ‐ ‐ ‐ ‐ ‐ ‐ ‐ ‐ ‐ ‐ ‐ ‐
Realign and widen Ocean Drive, South Bunbury (Hastie St to Washington Ave)RealiExpenditure 498,527 750,000 750,000 ‐ ‐ ‐ ‐ ‐ ‐ ‐ ‐ ‐ ‐ ‐ ‐ ‐
Improve traffic configuration Blair St, Bussell Hwy, Timperley Dve and Spencer St, South BunburyImpr Expenditure ‐ 60,000 ‐ 900,000 ‐ ‐ ‐ ‐ ‐ ‐ ‐ ‐ ‐ ‐ ‐ ‐
Reconstruct, widen and improve drainage on Estuary Drive, Pelican Point (St Andrews to Railway Crossing)RecoExpenditure ‐ 750,000 750,000 ‐ ‐ ‐ ‐ ‐ ‐ ‐ ‐ ‐ ‐ ‐ ‐ ‐
Modify intersection geometry and install traffic control signals at South West Highway / Dodson RoadMod Expenditure ‐ ‐ 750,000 750,000 ‐ ‐ ‐ ‐ ‐ ‐ ‐ ‐ ‐ ‐ ‐ ‐
Upgrade Spencer Street, Stirling Street & Arthur Street (dedicated turning lanes)UpgrExpenditure ‐ ‐ ‐ 450,000 750,000 ‐ ‐ ‐ ‐ ‐ ‐ ‐ ‐ ‐ ‐ ‐
Modify intersection Haley Street, Prinsep Street and Carmody Street, Bunbury (Design PR‐1091)Mod Expenditure ‐ ‐ ‐ 600,000 600,000 ‐ ‐ ‐ ‐ ‐ ‐ ‐ ‐ ‐ ‐ ‐
Upgrade streetscape Victoria Street (Carey Street to Wollaston)UpgrExpenditure ‐ ‐ ‐ ‐ 550,000 ‐ ‐ ‐ ‐ ‐ ‐ ‐ ‐ ‐ ‐ ‐
Widen and improve alignment of Adam Road, South BunburyWideExpenditure ‐ ‐ ‐ ‐ ‐ 400,000 ‐ ‐ ‐ ‐ ‐ ‐ ‐ ‐ ‐ ‐
Construct roundabout Vittoria Road and Erica Entrance, Glen Iris (Design PR‐1234)ConsExpenditure ‐ ‐ ‐ ‐ ‐ 600,000 ‐ ‐ ‐ ‐ ‐ ‐ ‐ ‐ ‐ ‐
Upgrade roads as per AMPUpgrExpenditure ‐ ‐ ‐ ‐ ‐ 725,000 800,000 800,000 300,000 800,000 800,000 800,000 800,000 1,550,000 1,550,000 1,550,000
Upgrade and widen King Road (Stage 1 ‐ Strickland St to Herbert Rd, Stage 2 ‐ Herbert Rd to Austral Pde)UpgrExpenditure ‐ ‐ ‐ ‐ ‐ ‐ ‐ ‐ 450,000 550,000 ‐ ‐ ‐ ‐ ‐ ‐
Capital ‐ Renewal
Page 6 of 77

Integrated Financial Plan 2019-20 to 2033-34
Background

Integrated Financial Plan 2019-20 to 2033-34
Engaging Our Community
In order to develop our Strategic Community Plan, we have sought the views of as many members of ourcommunity as possible.
Between May and December 2017, our community was invited to provide input into a major review of ourStrategic Community Plan through a series of surveys and questionnaires, interactive workshops, and focusgroups. Each workshop and discussion was conducted by a professional and independent facilitator.
This Plan encompasses the views sought during this period and strives to be inclusive whilst balancing diverseviews within our community. Maintaining equilibrium between competing community priorities and limited resources will be a focus for the City of Bunbury during the life of the Plan.
"The future is not some place we are going to,but one we are creating"
- John H. Schaar
Our Integrated Planning and Reporting Framework Performance Management Framework
Page 8 of 77

Integrated Financial Plan 2019-20 to 2033-34
Community Profile
Bunbury is an accessible and inclusive City, where all people are valued equally.
The City of Bunbury has a resident population of 32,684 (2017 Census) and is located in the south west of Western Australia, approximately 180km south of the State Capital, Perth. The Bunbury Geographe region includes the City of Bunbury and the Shires of Capel, Dardanup and Harvey, and has a population of approximately 90,000 residents. The South West region, to which Bunbury acts as a hub, has a total population of 175,904.
Bunbury is a beautiful place to live, work and visit and has something for everyone. The quality of life is one of its biggest attractions offering residents a variety of amenities, schools, shops, beaches and nightlife, all within easy reach. It has everything a family needs including public and private schools, tertiary education, and a range of health services, not to mention an extensive and diverse events calendar.
The City of Bunbury will continue to grow, develop and improve thanks to these qualities and the massive potential for investment and growth in our region.
Page 9 of 77

Integrated Financial Plan 2019-20 to 2033-34
Service Delivery
It is proposed that existing service levels will be reviewed for all operational activities in the short term,however the strategic objectives contained in our Strategic Community Plan aspire to setting appropriate levels of service in the longer term
whilst moving toward achieving annual operating surpluses each year to fund the provision of new and replacement infrastructure.
Service levels will be reviewed on an ongoing basis and the impact of ongoing growth will be monitored and assessed.
Page 10 of 77

Integrated Financial Plan 2019-20 to 2033-34
Financial Overview

Integrated Financial Plan 2019-20 to 2033-34
ForecastForecastForecastForecastForecastForecastDraft Budget ForecastForecast2026-272025-262024-252023-242022-232021-222020-212018-19 2019-20
ForecastFinancial Summary Forecast Forecast Forecast Forecast ForecastForecast2027-28 2028-29 2029-30 2030-31 2031-32 2032-33 2033-34
Revenue38,349,437 39,416,164 40,042,566 40,996,861 41,943,670 42,924,524 43,901,029 44,901,176 45,925,580 47,983,829Rates 46,942,816 49,049,218 50,139,594 50,753,340 51,372,551 52,005,38812,736,225 12,993,987 12,992,987 12,992,987 12,992,987 12,992,987 12,992,987 12,992,987 12,992,987 12,992,987Fees and Charges 12,992,987 12,992,987 12,992,987 12,992,987 12,992,987 12,992,987
1,875,116 2,108,953 2,080,953 1,980,953 1,980,953 1,980,953 1,980,953 1,980,953 1,980,953 1,980,953Grants and Subsidies - Operating 1,980,953 1,980,953 1,980,953 1,980,953 1,980,953 1,980,9531,093,662 693,120 732,330 681,287 680,199 679,052 678,174 678,239 678,284 678,861Contributions, Reimbursements and Donations 678,543 679,486 680,216 680,956 681,696 682,4361,463,931 1,302,295 1,300,175 1,300,909 1,293,292 1,295,240 1,298,162 1,293,281 1,296,154 1,291,038Interest Received 1,295,973 1,293,855 1,296,742 1,291,826 1,294,662 1,297,569
409,756 323,815 323,815 323,815 323,815 323,815 323,815 323,815 323,815 323,815Other Revenue 323,815 323,815 323,815 323,815 323,815 323,815
55,928,127 56,838,334 57,472,826 58,276,812 59,214,916 60,196,571 61,175,120 62,170,451 63,197,773 65,251,48364,215,087 66,320,314 67,414,307 68,023,877 68,646,664 69,283,148
Less Expenditure)(26,411,876 )(26,619,992 )(26,573,407 )(26,583,407 )(26,573,407 )(26,583,407 )(26,573,407 )(26,583,407 )(26,573,407 )(26,573,407Employee Costs )(26,583,407 )(26,583,407 )(26,573,407 )(26,583,407 )(26,573,407 )(26,583,407)(18,412,022 )(15,569,828 )(14,972,571 )(14,099,218 )(14,222,030 )(14,409,326 )(14,016,356 )(14,063,082 )(14,390,699 )(14,113,026Materials and Contracts )(14,196,127 )(14,818,666 )(14,387,687 )(14,460,909 )(15,110,132 )(14,571,856)(597,572 )(651,744 )(651,744 )(651,744 )(651,744 )(651,744 )(651,744 )(651,744 )(651,744 )(651,744Insurance )(651,744 )(651,744 )(651,744 )(651,744 )(651,744 )(651,744)(629,128 )(645,105 )(644,096 )(727,332 )(606,982 )(484,400 )(426,627 )(340,739 )(267,808 )(125,381Interest Expense )(194,496 )(116,593 )(78,260 )(52,805 )(43,326 )(33,464)(2,820,140 )(2,827,830 )(2,783,930 )(2,740,040 )(2,696,170 )(2,752,310 )(2,758,470 )(2,764,630 )(2,770,810 )(2,783,230Utilities )(2,777,010 )(2,789,460 )(2,795,720 )(2,802,020 )(2,808,330 )(2,814,650)(2,644,215 )(2,556,080 )(2,503,491 )(2,521,083 )(2,525,868 )(2,545,155 )(2,486,539 )(2,498,016 )(2,499,593 )(2,513,042Other Expense )(2,541,266 )(2,524,917 )(2,526,897 )(2,538,980 )(2,541,171 )(2,553,469
)(51,514,953 )(48,870,579 )(48,129,239 )(47,322,824 )(47,276,201 )(47,426,342 )(46,913,143 )(46,901,618 )(47,154,061 )(46,759,830)(46,944,050 )(47,484,787 )(47,013,715 )(47,089,865 )(47,728,110 )(47,208,590
Net Revenue (Expenditure) 4,413,174 7,967,755 9,343,587 10,953,988 11,938,715 12,770,229 14,261,977 15,268,833 16,043,712 17,271,037 18,491,653 18,835,527 20,400,592 20,934,012 20,918,554 22,074,558
Capital Revenue2,104,080 661,120 265,008 312,268 179,342 493,096 567,608 471,052 317,341 562,096Proceeds on Disposal of Assets 226,248 538,120 286,252 312,766 176,342 669,021
10,235,643 54,180 1,429,212 )(38,449 )(1,110,008 )(94,098 )(2,467,184 )(2,260,798 )(1,873,811 )(2,382,885Transfers from Restricted Cash )(2,574,714 )(4,716,923 )(2,362,591 )(7,584,757 )(6,998,063 )(7,707,39221,367 43,591 44,965 46,382 47,845 49,355 17,852 18,359 14,323 5,181Loan Repayments - Self Supporting 10,128
5,063,029 2,696,666 5,294,666 3,659,666 1,880,333 1,055,000 825,000 1,465,000 925,000 1,325,000Grants and Contributions - Development of Assets 775,000 1,235,000 4,875,000 725,000 725,000 725,0001,400,000 2,000,000 4,500,000 1,000,000 1,000,000Proceeds from New Loans
18,824,119 5,455,557 11,533,851 3,979,867 997,512 2,503,353 )(1,056,724 )(306,387 )(617,147 509,392)(1,563,338 )(2,943,803 2,798,661 )(6,546,991 )(6,096,721 )(6,313,371
Capital Expenditure)(24,149,564 )(12,188,175 )(18,799,946 )(12,353,828 )(10,267,935 )(12,845,397 )(11,236,516 )(13,434,281 )(13,845,043 )(17,796,208Acquisition and Renewal of Assets )(14,230,188 )(15,051,747 )(22,561,637 )(14,278,239 )(14,678,650 )(15,597,033)(2,213,708 )(2,186,400 )(2,151,451 )(2,621,020 )(2,724,007 )(2,459,418 )(2,029,400 )(1,613,766 )(1,635,002 )(1,248,631Principal Repayment of Loans )(1,546,464 )(926,840 )(714,426 )(199,687 )(207,754 )(216,147
)(26,363,272 )(14,374,575 )(20,951,397 )(14,974,848 )(12,991,942 )(15,304,815 )(13,265,916 )(15,048,047 )(15,480,045 )(19,044,839)(15,776,652 )(15,978,587 )(23,276,063 )(14,477,926 )(14,886,404 )(15,813,180
Movement in Non-Current Assets and Liabilities62,693 62,100 62,100 62,100 62,100 62,100 62,100 62,100 62,100 62,100Adjust Non Current Provisions and Accruals 62,100 62,100 62,100 62,100 62,100 62,100
62,693 62,100 62,100 62,100 62,100 62,100 62,100 62,100 62,100 62,10062,100 62,100 62,100 62,100 62,100 62,100
ADD Estimated Surplus (Deficit) July 1 Brought Forward
Estimated Surplus (Deficit) June 30 Carried ForwardLESS
3,988,508 925,222
36,059
36,059
24,200
24,200
45,307 51,692 82,559 83,996 60,495 69,115 62,262 80,568 55,805 41,095 9,81912,290 19,926
45,307 51,692 82,559 83,996 60,495 69,115 62,262 80,568 55,805 41,095 12,290 9,819
925,222
38,349,437 39,416,164 40,996,861 41,943,670 42,924,524 43,901,029 44,901,176 45,925,58040,042,566Amount required to be raised from rates 46,942,816 47,983,829 49,049,218 50,139,594 50,753,340 51,372,551 52,005,388
Page 12 of 77

Integrated Financial Plan 2019-20 to 2033-34
ForecastDraft BudgetForecast Forecast Forecast Forecast Forecast Forecast Forecast Forecast Forecast Forecast Forecast Forecast Forecast ForecastBudget Type Summary2018-19 2033-342032-332031-322030-312029-302028-292027-282026-272025-262024-252023-242022-232021-222020-212019-20
Base OperatingIncome 55,055,865 58,264,062 59,202,166 60,183,82156,686,584 57,310,076 61,162,370 62,157,701 63,185,023 64,202,337 65,238,733 66,307,564 67,401,557 68,011,127 68,633,914 69,270,398Expenditure )(58,886,424 )(60,331,963 )(60,363,209 )(60,523,089)(59,617,135 )(60,043,843 )(60,731,008 )(60,852,729 )(61,015,093 )(61,197,770 )(61,385,668 )(61,631,082 )(62,254,917 )(62,437,463 )(62,656,322 )(62,900,390
)(3,830,559 )(2,067,901 )(1,161,043 )(339,268)(2,930,551 )(2,733,767 431,362 1,304,972 2,169,930 3,004,567 3,853,065 4,676,482 5,146,640 5,573,664 5,977,592 6,370,008
Operating ProjectsIncome 872,262 12,750 12,750 12,750151,750 162,750 12,750 12,750 12,750 12,750 12,750 12,750 12,750 12,750 12,750 12,750Expenditure )(6,641,641 )(2,146,998 )(2,243,888 )(2,428,160)(3,947,040 )(3,033,621 )(1,916,564 )(1,947,041 )(2,228,118 )(2,043,291 )(1,888,047 )(2,560,942 )(1,838,422 )(1,898,005 )(2,502,196 )(1,950,494
)(5,769,379 )(2,134,248 )(2,231,138 )(2,415,410)(3,795,290 )(2,870,871 )(1,903,814 )(1,934,291 )(2,215,368 )(2,030,541 )(1,875,297 )(2,548,192 )(1,825,672 )(1,885,255 )(2,489,446 )(1,937,744
Capital Projects - IncomeIncome 7,167,109 3,971,934 2,059,675 1,548,0963,357,786 5,559,674 1,392,608 1,936,052 1,242,341 1,001,248 1,887,096 1,773,120 5,161,252 1,037,766 901,342 1,394,021
7,167,109 3,971,934 2,059,675 1,548,0963,357,786 5,559,674 1,392,608 1,936,052 1,242,341 1,001,248 1,887,096 1,773,120 5,161,252 1,037,766 901,342 1,394,021
Capital Projects - New and ExpansionExpenditure )(9,705,118 )(1,782,000 )(1,027,000 )(1,339,000)(2,151,000 )(6,804,246 )(1,324,295 )(3,082,000 )(1,047,000 )(1,109,000 )(2,987,000 )(1,677,000 )(9,307,000 )(1,397,000 )(947,000 )(897,000
)(9,705,118 )(1,782,000 )(1,027,000 )(1,339,000)(2,151,000 )(6,804,246 )(1,324,295 )(3,082,000 )(1,047,000 )(1,109,000 )(2,987,000 )(1,677,000 )(9,307,000 )(1,397,000 )(947,000 )(897,000
Capital Projects - RenewalExpenditure )(11,677,470 )(6,661,828 )(6,594,935 )(9,546,897)(6,517,175 )(8,715,700 )(8,096,221 )(9,372,281 )(11,578,043 )(11,576,188 )(13,989,208 )(12,554,747 )(12,434,637 )(11,311,239 )(12,161,650 )(13,130,033
)(11,677,470 )(6,661,828 )(6,594,935 )(9,546,897)(6,517,175 )(8,715,700 )(8,096,221 )(9,372,281 )(11,578,043 )(11,576,188 )(13,989,208 )(12,554,747 )(12,434,637 )(11,311,239 )(12,161,650 )(13,130,033
Capital Projects - UpgradeExpenditure )(2,766,976 )(3,910,000 )(2,646,000 )(1,959,500)(3,520,000 )(3,280,000 )(1,816,000 )(980,000 )(1,220,000 )(1,545,000 )(820,000 )(820,000 )(820,000 )(1,570,000 )(1,570,000 )(1,570,000
)(2,766,976 )(3,910,000 )(2,646,000 )(1,959,500)(3,520,000 )(3,280,000 )(1,816,000 )(980,000 )(1,220,000 )(1,545,000 )(820,000 )(820,000 )(820,000 )(1,570,000 )(1,570,000 )(1,570,000
Capital Projects - Asset DisposalExpenditure )(1,084,766 - - -- - - - - - - - - - - -
)(1,084,766 - - -- - - - - - - - - - - -
)(12,584,043 )(11,600,441 )(14,051,979)(27,667,159 )(15,556,230 )(18,844,910 )(11,316,360 )(12,127,548 )(12,648,140 )(12,254,914 )(13,931,344 )(11,150,337 )(14,079,417 )(9,552,064 )(10,289,162 )(9,770,748
SummaryOperatingIncomeExpenditure
Operating Surplus (Deficit)
CapitalIncomeExpenditure
Capital Surplus (Deficit)
Total
55,928,127)(65,528,065
)(27,667,159
)(18,067,221
)(25,234,3307,167,109
)(9,599,938
)(15,556,230
)(8,830,389
)(12,188,1753,357,786
)(6,725,841
)(63,564,17556,838,334
)(18,844,910
)(13,240,272
)(18,799,9465,559,674
)(5,604,638
)(63,077,46457,472,826
)(12,584,043
58,276,812)(62,478,961
)(4,202,149
3,971,934)(12,353,828
)(8,381,894
59,214,916)(62,607,097
)(3,392,181
2,059,675)(10,267,935
)(8,208,260
)(12,845,397 )(11,236,516 )(13,434,281 )(13,845,043 )(14,230,188 )(17,796,208 )(15,051,747 )(22,561,637 )(14,278,239 )(14,678,650 )(15,597,0331,548,096 1,392,608 1,936,052 1,242,341 1,001,248 1,887,096 1,773,120 5,161,252 1,037,766 901,342 1,394,021
)(11,297,301 )(9,843,908 )(11,498,229 )(12,602,702 )(13,228,940 )(15,909,112 )(13,278,627 )(17,400,385 )(13,240,473 )(13,777,308 )(14,203,012
60,196,571 61,175,120 62,170,451 63,197,773 64,215,087 65,251,483 66,320,314 67,414,307 68,023,877 68,646,664 69,283,148)(62,951,249 )(62,647,572 )(62,799,770 )(63,243,211 )(63,241,061 )(63,273,715 )(64,192,024 )(64,093,339 )(64,335,468 )(65,158,518 )(64,850,884
)(2,754,678 )(1,472,452 )(629,319 )(45,438 974,026 1,977,768 2,128,290 3,320,968 3,688,409 3,488,146 4,432,264
)(14,051,979 )(9,770,748)(10,289,162)(9,552,064)(14,079,417)(11,150,337)(13,931,344)(12,254,914)(12,648,140)(12,127,548)(11,316,360)(11,600,441
Page 13 of 77

Integrated Financial Plan 2019‐20 to 2033‐34
Key Assumptions Underpinning the Integrated Financial Plan (IFP)
The forecasts contained in the Integrated Financial Plan are based on a number of assumptions and strategies including those adopted in the previous IFP and are used to effectively forecast the long term planning requirements of Council. These assumptions and strategies are based on current economic conditions and, should economic conditions alter, these assumptions and strategies will be reviewed as part of the annual budget process to take into account community affordability. It is recognised that community affordability will fluctuate over time and it will be necessary to review these assumptions and strategies on an annual basis. The key assumptions and strategies are:
Income* Annual general rate revenue (exclusive of natural growth) has been projected to increase by 2.0% in 2019-20, 2.75% in 2020-21 ,and then by 3.5% for the remaining life of the plan.* An additional 1.0% rate increase will be raised in 2019-20 and 2020-21 to be used specifically for the renewal and upgrade of existing infrastructure assets. This strategy commenced in 2016-17 and the funds will be held in the Infrastructure Development Reserve
until required. Over the next fifteen (15) years it is proposed that $24.9M of capital expenditure will be funded from the Infrastructure Development Reserve for the renewal of infrastructure including: drainage, roads, paths, marine walls, andbuilding projects.
* In 2019-20, approximately $1.5M additional rates will be raised to fund infrastructure development projects. By the end of 2020-21, an additional $1.9M p.a. will be available for infrastructure development and will continue in eachsubsequent year.
* The additional 1% rate increase will continue from 2021-22 for a further ten (10) years, however, instead of 100% of funds being allocated to infrastructure renewal and upgrade, this will be reduced to 50% and held in the Asset Management and Renewal Reserve.The remaining 50% will be for new assets and held (until required) in the City Growth and Major Development Reserve.
* The rate base will increase by an average of 0.3% per annum through anticipated growth in new development based on current development projections.* City of Bunbury fees and charges will increase, on average, by 1.5%. (Note: some charges are regulatory and not controlled by Council).* Waste charges have been raised under the provisions of the WARR Act for residential and non-residential waste services. Any operating surplus from residential waste services is transferred to the Refuse Collection and Waste Minimisation
Reserve, while a portion of the surplus from non-residential waste services will be used for infrastructure development.* Residential annual waste collection charges for refuse, recycling or organic bins to increase by CPI ie: 2.0%. However, in 2019-20, refuse and organics will be reduced to an increase of 1.5% while recycling will increase by 14.5% due to increased processing costs.* Interest rates for invested funds will be 2.5% over the life of the plan.* No increase in general purpose grants.
Expenditure* Staff numbers will not increase over the next fifteen (15) years and any growth in services will be covered through the use of fliexible staffing models, improved efficiencies or through the use of external service providers. It is also possible that over this
time, as services provided by contractors are reviewed, the City may decide to bring these services in-house. This would result in an increase in employee costs but would be offset by an equal or greater reduction in contract labour.* Staff costs will increase by approximately 1.5% in nominal terms per annum. The 2019-20 employee costs include Workforce Plan efficiencies identified in 2018-19.* Interest rates for new borrowings will be an average of 4.0% over the life of the plan, inclusive of the Government Guarantee Fee.* Materials and Contracts operating expenditure has been increase by CPI where unavoidable.* Utility expenses will increase, with electricity costs increasing by 2.8% p.a., water rates and consumption by 6.0% in 2019-20 and then by 2.5% for future years, and gas charges by CPI.* Insurance costs have been increased by 2.5% p.a.* Depreciation is based on current depreciation rates and asset condition ratings. However, a current review of these depreciation rates and condition ratings may have a significant impact on future year depreciation expenses.* The impact of new and upgrade capital projects on operating expenditure (ie: increase maintenance, repairs, insurance, utilities, etc.), of 2.0% (increasing to 3% from 2023-24) of capital expenditure, and has been included in the IFP to
recognise whole-of-life costs.
Other* The base operating budgets for 2019-20 have been allocated funding based on service efficiency and necessity rather than budget history. Directors and Managers have reviewed each line item from 2018-19 and justified each base budget in
order for it to receive funding in 2019-20 - a process call Zero-Based Budgeting. No item was automatically included in the next year's budget. All future years are presented in 2019-20 values.* Existing service levels will be systematically reviewed with a view to improve services in the long-term.* The annual operating deficit forecast of $6.7M in 2019-20 will return to surplus from 2027-28.* CPI of 2.00% has been used for 2019-20, 2.50% for all future years. (Note: CPI is based on forecasts contained in the 2018-19 WA State Government Budget).* Cash reserves will increase from $16.6M in 2018-19 to $57.5M in 2033-34.* New loan borrowings will be required in each of the following years; 2019-20 ($2M), 2020-21 ($4.5M), 2023-24 ($1M) and 2028-29 ($1M).* Debt levels peaked in 2017-18 at $17.9M and will reduce to $550K by 2033-34.* Proceeds from land sales (excluding joint venture land) will be either transferred to a Cash-Backed Reserve Fund for future capital works or used for debt reduction.* Rationalise where practical, and subject to community consultation, the current assets deemed no longer required over time. The intention is to remove assets to reduce maintenance and replacement costs.
Measuring Sustainability
Several statutory financial indicators have been prescribed in the Local Government (Financial Management) Regulations 2011 to measure the financial sustainability of local governments.The Integrated Financial Plan has been assessed against the following measures:
Statutory Financial Indicators Ratio Standards as determined by Local Government Other Financial Indicators* Current Ratio Greater than 1.00 * Annual Operating Surplus (Deficit) $000's* Asset Sustainability Ratio Greater than 0.90 * Loan Liability* Debt Service Cover Ratio Greater than 2.00 * Annual Capital Expenditure* Operating Surplus Ratio Greater than 0.01 * Cash and Cash Equivalents* Own Source Revenue Coverage Ratio Greater than 0.90* Asset Consumption Ratio Greater than 60%* Asset Renewal Ratio Greater than 95%
Page 14 of 77

Integrated Financial Plan 2019-20 to 2033-34
DefinitionOperating revenue minus operating expense, divided by own source operating revenue.
Interpretation15% or greater indicates the City is achieving a strong operating surpluswhich will enable future improvements in service delivery and support asset management.
Lower than 0% indicates the City is generating insufficient revenue to sustain existing levels of service and adequately maintain its assets.
CommentA positive trend is achieved, but an operating surplus is not acheived until 2026-27, at which time the basic standard result is realised.
DefinitionOwn source operating revenue divided by operating expense.
InterpretationMeasures the City's ability to cover operating expenses from own source revenue; the higher the ratio, the more self-reliant the Council is.
90% or greater represents low risk
60% or lower represents high risk
CommentThe City is in a strong position with its own source revenue and achieves an advanced ratio (ie: low risk) result from 2021-22.
DefinitionAnnual operating surplus (before interest and depreciation) divided by principal and interest.
InterpretationThis ratio measures a Council's ability to service debt.
500% or greater represents low risk
200% or lower represents high risk
Council's Integrated Financial Plan forecasts total loan borrowings to reduce to nil by 2029-30.
CommentAs the City reduces its debt, the ratio continues to improve from a basic standard to an advanced standard as the City has reduces its debt level.
Page 15 of 77

Integrated Financial Plan 2019-20 to 2033-34
DefinitionCurrent assets minus restricted assets, divided by, current liabilities minus liabilities associated with restricted assets.
InterpretationA ratio of greater than 1.0 means that a local government has sufficient assets that can be converted into cash to meet its immediate cash commitments.
CommentThe current ratio improves over the IFP and meets the basic standard until an advanced standard is achieved in 2028-29. The Actual result includes cash carried forward for uncompleted projects, budgeted in the next financial year, which improves the current ratio.
DefinitionDepreciated replacement cost of assets divided by current replacement cost of depreciable assets.
InterpretationMeasures the extent to which depreciable assets have been consumed by comparing their written down value to their replacement cost.
60% or greater indicates the City is investing in asset renewal.
50% or less indicates the City is having difficulty undertaking a sustained capital renewal program.
CommentAssets are maintained at an advanced standard over the life of the IFP.
DefinitionCapital renewal and replacement expenditure divided by depreciation expense.
InterpretationMeasures the extent to which assets are being renewed or replaced compared to the amount consumed (depreciation).
110% or greater indicates that the City is investing in asset renewal to the degree that offsets the current consumption of its assets.
90% or less indicates that the City is failing to allocate sufficient funds for asset renewal.
CommentThe ratio improves in the outer years as more capital expenditure is allocated to asset renewal.
Page 16 of 77

Integrated Financial Plan 2019-20 to 2033-34
DefinitionNet present value (NPV) of planned capital works over ten (10) years, divided by net present value (NPV) of required capital renewals over ten (10) years.
InterpretationMeasures the extent to which assets are being renewed compared to the amount consumed (depreciation).
95% or greater indicates that the City is investing in asset renewal to the degree that offsets the current consumption of its assets.
75% or less indicates that the City is failing to allocate sufficient funds to asset renewal.
CommentThe amount of asset renewal (as a 10 year average) maintains an advanced standard from 2019-20 to 2024-25. Due to the ratio being based on a 10 year average the ratio can only be calculated to 2024-25.
Operating surplus (deficit) measures the financial sustainability of the City and is determined by operating revenue less operating expenditure (excludes non-operating income and expenditure such as capital grants and contributions).
A surplus indicates that the City has sufficient funds to meet its asset management obligations and has the capacity to repay loan borrowings without impacting its long term financial stability.
A deficit indicates that the City is generating insufficient funds for asset renewal.
CommentThe operating result continues to improve over the life of the IFP and achieves an operating surplus in 2027-28.
Base operating income includes rate income, grants and subsidies, contributions, reimbursements and donations, fees and charges, interest received and other revenue.
Non-operating income is excluded from this total.
CommentAnnual operating income continues to increase over the IFP.
Page 17 of 77
Integrated Financial Plan 2019-20 to 2033-34
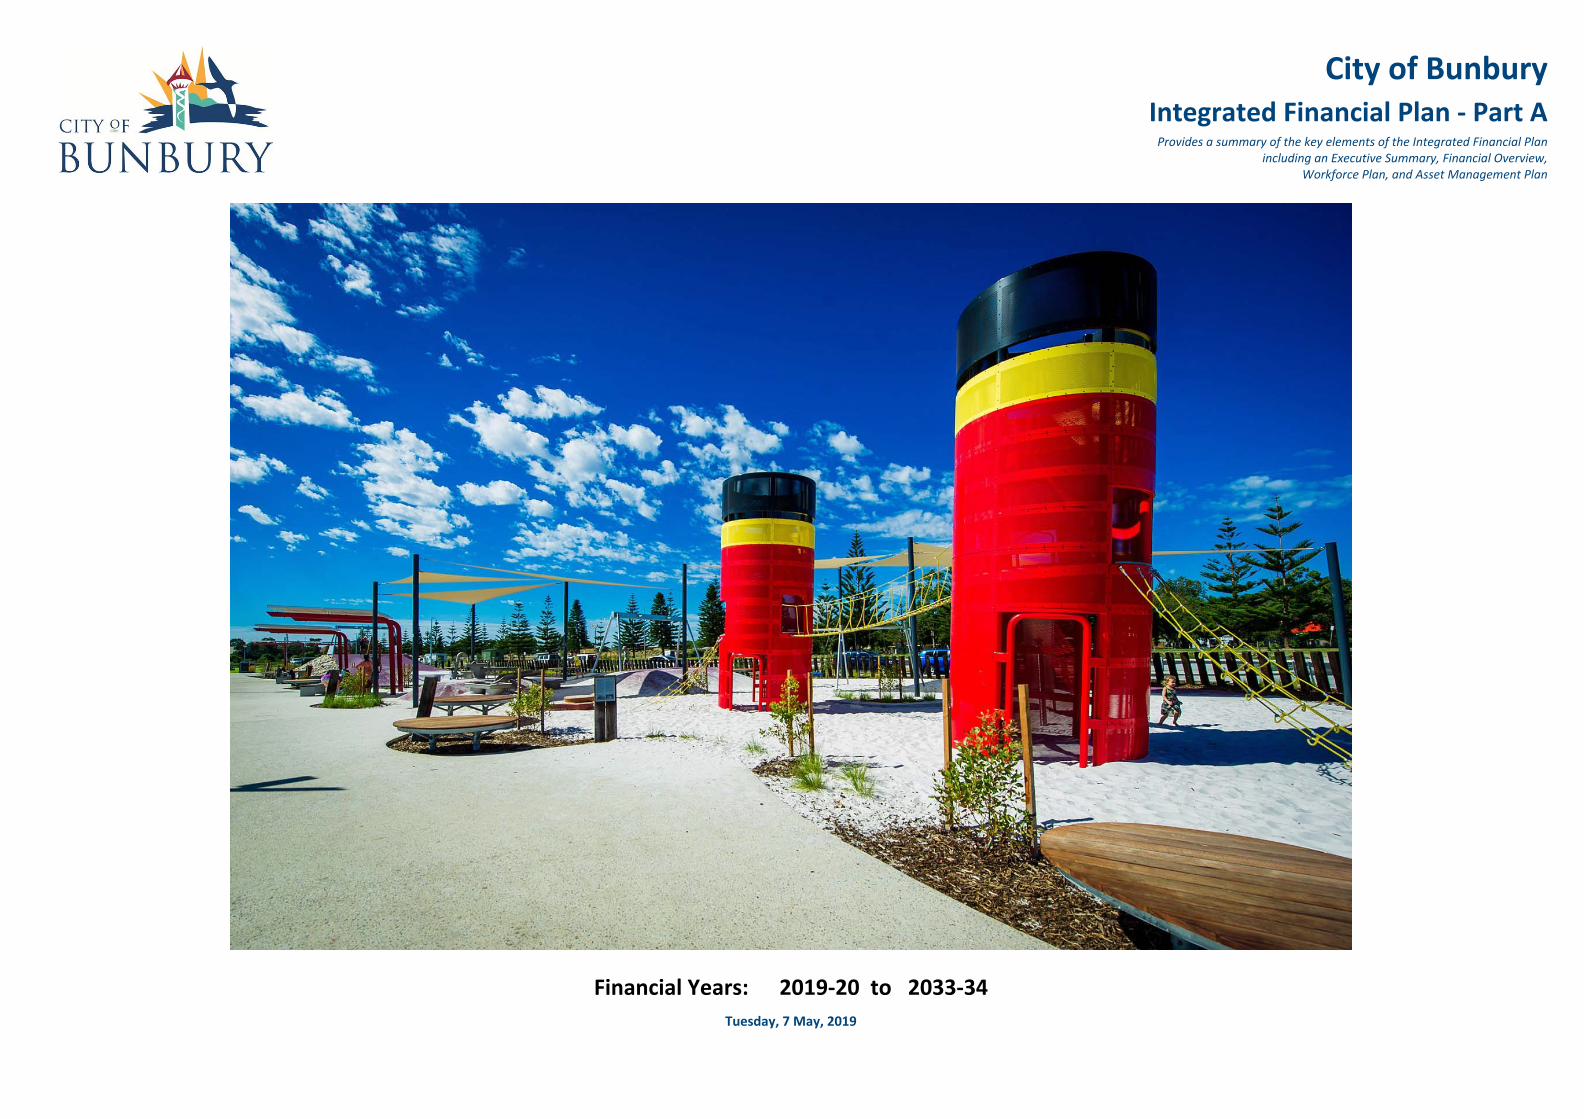
Annual operating expenditure includes employee costs, materials and contracts, utilities, insurance, depreciation, interest on loan borrowings and other expenses.
CommentOperating expenditure increases only slightly over the IFP when CPI increases are excluded. CPI is excluded to show only real increases in expenditure.
Annual expenses for materials and contracts.
CommentMaterials and contract expenditure varies only marginally over the IFP due to one-off operating projects. CPI increases have been excluded.
Annual operating expenses for depreciation.
CommentDepreciation continues to increase as new assets are completed as budgeted in the IFP.
Page 18 of 77
Integrated Financial Plan 2019-20 to 2033-34
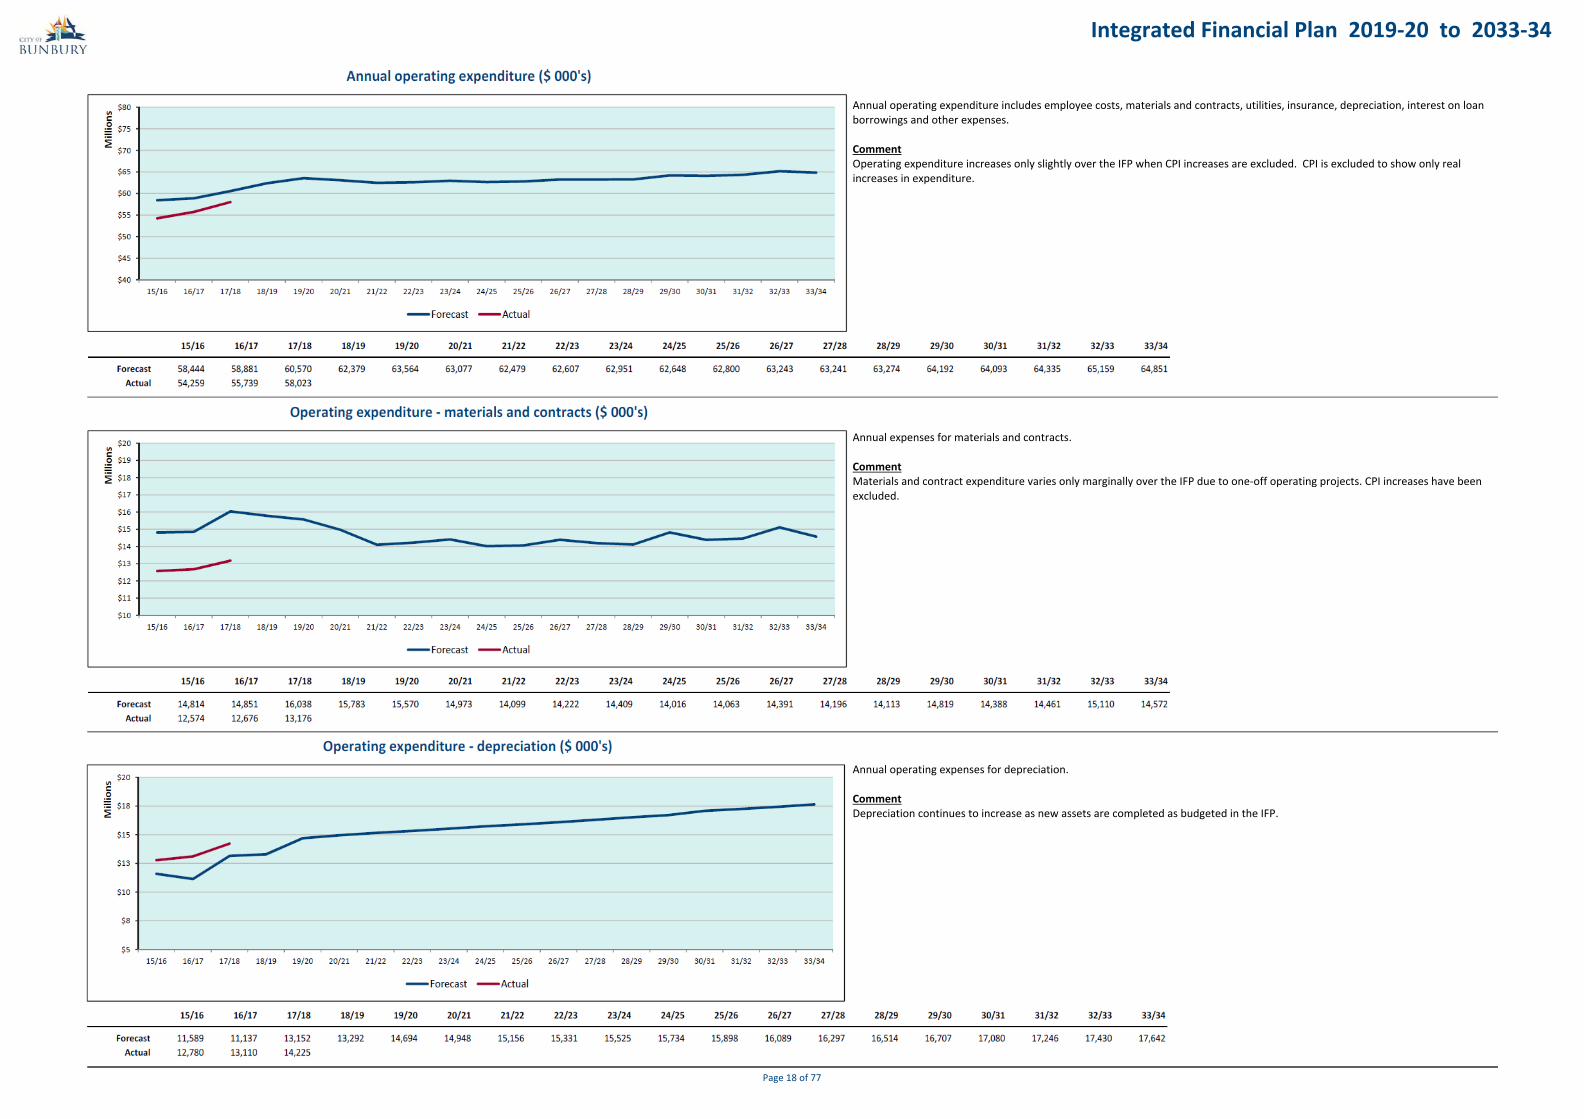
Operating expenditure employee costs excludes salaries and wages allocated to capital works, but includes one-off operating project employee costs.
CommentStaff numbers will not increase over the next fifteen (15) years and any growth in services will be covered through the use of flexible staffing models, improved efficiencies or through the use of external service providers. It is also possible that over this time, as services provided by contractors are reviewed, the City may decide to bring these services in-house. This would result in an increase in employee costs but would be offset by an equal or greater reduction in contract labour.
Staff costs will increase by approximately 2.50%, in nominal terms, per annum. Therefore, assuming CPI of 2.00% for 2019-20 and 2.50% for all future years, the increase in staff costs of 2.50% is offset by CPI increases as the employee costs only show real increases excluding CPI.
The 2019-20 employee costs include Workforce Plan efficiencies identified in 2018-19.
Excluding CPI increases from 2019-20 results in a flat-line trend over the IFP.
Capital expenditure on capital new (expansion), capital renewal and capital upgrade projects.
CommentCapital expenditure varies from year to year and is subject to the availability of grant funds.
DefinitionGeneral purpose commercial, industrial and residential rate revenue received.
InterpretationA steady increase in this measure indicates strong economic growth and a commitment to a sustainable Council.
CommentAnnual general rate revenue (exclusive of natural growth) has been projected to increase by 2.0% for 2019-20, then 2.75% for 2020-21, and then 3.5% for the life of the plan.
An additional 1.0% rate increase will be raised in 2019-20 to 2030-31, to be used for existing and new infrastructure development.
Page 19 of 77

Integrated Financial Plan 2019-20 to 2033-34
Includes unrestricted and restricted cash balances.
CommentSteady growth in cash is predicted over the IFP particularly for cash in Reserve Funds which are held for specific purposes (refer pages 30-35.)
The City's loans will decrease from $14.5M in 2018-19 to $550K in 2033-34.
Total current and non-current liabilities, including self-supporting loans.
CommentThe IFP includes new borrowing in 2019-20 ($2M), 2020-21 ($4.5M), 2023-24 ($1M), and 2028-29 ($1M). No further loans are planned at this stage.
Page 20 of 77

Integrated Financial Plan 2019-20 to 2033-34
Statement ofComprehensive Income
Draft Budget Forecast Forecast Forecast Forecast Forecast Forecast Forecast ForecastForecast Forecast Forecast Forecast Forecast Forecast Forecast2018-19 2019-20 2020-21 2021-22 2022-23 2023-24 2024-25 2025-26 2026-27 2027-28 2028-29 2029-30 2030-31 2031-32 2032-33 2033-34
Operating IncomeRates
38,223,132 39,254,635 39,860,301 40,794,944 41,767,840 42,733,095 43,733,072 44,728,609 45,748,255 46,792,638 47,829,702 48,891,016 49,977,188 50,586,596 51,205,936 51,830,790Rates General Inc46,305 48,272 48,755 49,243 49,735 50,232 50,734 51,241 51,753 52,271 52,794 53,322 53,855 54,394 54,938 55,487Rates Specified Area Inc80,000 113,257 133,510 152,674 126,095 141,197 117,223 121,326 125,572 97,907 101,333 104,880 108,551 112,350 111,677 119,111Rates Interim Inc
38,349,437 39,416,164 40,042,566 40,996,861 41,943,670 42,924,524 43,901,029 44,901,176 45,925,580 46,942,816 47,983,829 49,049,218 50,139,594 50,753,340 51,372,551 52,005,388
Operating Grants and Subsidies1,875,116 2,108,953 2,080,953 1,980,953 1,980,953 1,980,953 1,980,953 1,980,953 1,980,953 1,980,953 1,980,953 1,980,953 1,980,953 1,980,953 1,980,953 1,980,953Operating Grant Inc
1,875,116 2,108,953 2,080,953 1,980,953 1,980,953 1,980,953 1,980,953 1,980,953 1,980,953 1,980,953 1,980,953 1,980,953 1,980,953 1,980,953 1,980,953 1,980,953
Contributions, Reimbursements and Donations417,558 106,433 146,433 96,433 96,433 96,433 96,433 96,433 96,433 96,433 96,433 96,433 96,433 96,433 96,433 96,433Contribution Inc673,504 584,087 583,297 582,254 581,166 580,019 579,141 579,206 579,251 579,510 579,828 580,453 581,183 581,923 582,663 583,403Reimbursement Inc
2,600 2,600 2,600 2,600 2,600 2,600 2,600 2,600 2,600 2,600 2,600 2,600 2,600 2,600 2,600 2,600Donation Inc
1,093,662 693,120 732,330 681,287 680,199 679,052 678,174 678,239 678,284 678,543 678,861 679,486 680,216 680,956 681,696 682,436
Fees and Charges5,566,055 5,679,451 5,679,451 5,679,451 5,679,451 5,679,451 5,679,451 5,679,451 5,679,451 5,679,451 5,679,451 5,679,451 5,679,451 5,679,451 5,679,451 5,679,451Waste Collection Charge Inc
424,500 424,500 424,500 424,500 424,500 424,500 424,500 424,500 424,500 424,500 424,500 424,500 424,500 424,500 424,500 424,500Parking Fee Inc828,615 852,446 852,446 852,446 852,446 852,446 852,446 852,446 852,446 852,446 852,446 852,446 852,446 852,446 852,446 852,446Property Lease and Rental Fee Inc
61,655 81,570 81,570 81,570 81,570 81,570 81,570 81,570 81,570 81,570 81,570 81,570 81,570 81,570 81,570 81,570General Hire Fee Inc218,673 216,350 216,350 216,350 216,350 216,350 216,350 216,350 216,350 216,350 216,350 216,350 216,350 216,350 216,350 216,350Fine and Penalty Fee Inc472,821 481,500 481,500 481,500 481,500 481,500 481,500 481,500 481,500 481,500 481,500 481,500 481,500 481,500 481,500 481,500Building and Planning Fee Inc142,000 142,000 142,000 142,000 142,000 142,000 142,000 142,000 142,000 142,000 142,000 142,000 142,000 142,000 142,000 142,000Rating Fee Inc
3,302,165 3,418,070 3,418,070 3,418,070 3,418,070 3,418,070 3,418,070 3,418,070 3,418,070 3,418,070 3,418,070 3,418,070 3,418,070 3,418,070 3,418,070 3,418,070Sports Facility Fee Inc1,719,741 1,698,100 1,697,100 1,697,100 1,697,100 1,697,100 1,697,100 1,697,100 1,697,100 1,697,100 1,697,100 1,697,100 1,697,100 1,697,100 1,697,100 1,697,100Miscellaneous Fee and Charge Inc
12,736,225 12,993,987 12,992,987 12,992,987 12,992,987 12,992,987 12,992,987 12,992,987 12,992,987 12,992,987 12,992,987 12,992,987 12,992,987 12,992,987 12,992,987 12,992,987
Interest Received1,023,079 899,795 897,675 898,409 890,792 892,740 895,662 890,781 893,654 893,473 888,538 891,355 894,242 889,326 892,162 895,069Cash and Investment Interest Inc
440,852 402,500 402,500 402,500 402,500 402,500 402,500 402,500 402,500 402,500 402,500 402,500 402,500 402,500 402,500 402,500Rates Debtor Interest Inc
1,463,931 1,302,295 1,300,175 1,300,909 1,293,292 1,295,240 1,298,162 1,293,281 1,296,154 1,295,973 1,291,038 1,293,855 1,296,742 1,291,826 1,294,662 1,297,569
Other Revenue409,756 323,815 323,815 323,815 323,815 323,815 323,815 323,815 323,815 323,815 323,815 323,815 323,815 323,815 323,815 323,815Miscellaneous Inc
409,756 323,815 323,815 323,815 323,815 323,815 323,815 323,815 323,815 323,815 323,815 323,815 323,815 323,815 323,815 323,815
55,928,127Total Operating Income 56,838,334 57,472,826 58,276,812 59,214,916 60,196,571 61,175,120 62,170,451 63,197,773 64,215,087 65,251,483 66,320,314 67,414,307 68,023,877 68,646,664 69,283,148
Page 21 of 77

Integrated Financial Plan 2019-20 to 2033-34
Statement ofComprehensive Income
Draft Budget Forecast Forecast Forecast Forecast Forecast Forecast Forecast ForecastForecast Forecast Forecast Forecast Forecast Forecast Forecast2018-19 2019-20 2020-21 2021-22 2022-23 2023-24 2024-25 2025-26 2026-27 2027-28 2028-29 2029-30 2030-31 2031-32 2032-33 2033-34
Operating ExpenditureEmployee Costs
)(22,767,119 )(22,950,914 )(22,904,329 )(22,914,329 )(22,904,329 )(22,914,329 )(22,904,329 )(22,914,329 )(22,904,329 )(22,914,329 )(22,904,329 )(22,914,329 )(22,904,329 )(22,914,329 )(22,904,329 )(22,914,329Salary Exp)(561,815 )(554,733 )(554,733 )(554,733 )(554,733 )(554,733 )(554,733 )(554,733 )(554,733 )(554,733 )(554,733 )(554,733 )(554,733 )(554,733 )(554,733 )(554,733Salary Accruals Exp)(3,082,942 )(3,114,345 )(3,114,345 )(3,114,345 )(3,114,345 )(3,114,345 )(3,114,345 )(3,114,345 )(3,114,345 )(3,114,345 )(3,114,345 )(3,114,345 )(3,114,345 )(3,114,345 )(3,114,345 )(3,114,345Other Employee Related Exp
)(26,411,876 )(26,619,992 )(26,573,407 )(26,583,407 )(26,573,407 )(26,583,407 )(26,573,407 )(26,583,407 )(26,573,407 )(26,583,407 )(26,573,407 )(26,583,407 )(26,573,407 )(26,583,407 )(26,573,407 )(26,583,407
Material and Contracts)(3,080,896 )(2,878,004 )(2,934,732 )(2,960,594 )(3,015,116 )(3,005,592 )(3,048,622 )(3,121,348 )(3,143,465 )(3,206,393 )(3,202,292 )(3,254,932 )(3,568,453 )(3,589,175 )(3,656,398 )(3,647,122Material Exp)(453,950 )(437,950 )(437,950 )(437,950 )(437,950 )(437,950 )(437,950 )(437,950 )(437,950 )(437,950 )(437,950 )(437,950 )(437,950 )(437,950 )(437,950 )(437,950Fuel Exp)(2,201,899 )(1,135,915 )(1,716,415 )(1,150,915 )(1,242,915 )(1,494,915 )(1,100,915 )(1,032,915 )(1,424,915 )(1,100,915 )(1,062,915 )(1,674,915 )(950,915 )(962,915 )(1,634,915 )(1,020,915Consultants Exp)(11,435,246 )(9,863,132 )(8,628,647 )(8,294,932 )(8,271,222 )(8,216,042 )(8,174,042 )(8,216,042 )(8,129,542 )(8,196,042 )(8,155,042 )(8,196,042 )(8,175,542 )(8,216,042 )(8,126,042 )(8,211,042Contractors Exp)(876,291 )(875,215 )(875,215 )(875,215 )(875,215 )(875,215 )(875,215 )(875,215 )(875,215 )(875,215 )(875,215 )(875,215 )(875,215 )(875,215 )(875,215 )(875,215Software License or Maintenance Exp)(223,375 )(228,242 )(228,242 )(228,242 )(228,242 )(228,242 )(228,242 )(228,242 )(228,242 )(228,242 )(228,242 )(228,242 )(228,242 )(228,242 )(228,242 )(228,242Equipment Lease or Hire Exp)(140,365 )(151,370 )(151,370 )(151,370 )(151,370 )(151,370 )(151,370 )(151,370 )(151,370 )(151,370 )(151,370 )(151,370 )(151,370 )(151,370 )(151,370 )(151,370Bank Fee and Charges Exp
)(18,412,022 )(15,569,828 )(14,972,571 )(14,099,218 )(14,222,030 )(14,409,326 )(14,016,356 )(14,063,082 )(14,390,699 )(14,196,127 )(14,113,026 )(14,818,666 )(14,387,687 )(14,460,909 )(15,110,132 )(14,571,856
Insurance)(597,572 )(651,744 )(651,744 )(651,744 )(651,744 )(651,744 )(651,744 )(651,744 )(651,744 )(651,744 )(651,744 )(651,744 )(651,744 )(651,744 )(651,744 )(651,744Insurance Exp
)(597,572 )(651,744 )(651,744 )(651,744 )(651,744 )(651,744 )(651,744 )(651,744 )(651,744 )(651,744 )(651,744 )(651,744 )(651,744 )(651,744 )(651,744 )(651,744
Interest Expense)(696,508 )(656,753 )(644,096 )(727,332 )(606,982 )(484,400 )(426,627 )(340,739 )(267,808 )(194,496 )(125,381 )(116,593 )(78,260 )(52,805 )(43,326 )(33,464Interest Loan Borrowings Exp
67,380 11,648Interest Accrual Exp
)(629,128 )(645,105 )(644,096 )(727,332 )(606,982 )(484,400 )(426,627 )(340,739 )(267,808 )(194,496 )(125,381 )(116,593 )(78,260 )(52,805 )(43,326 )(33,464
Utilities)(1,913,794 )(1,904,250 )(1,860,350 )(1,816,460 )(1,772,590 )(1,828,730 )(1,834,890 )(1,841,050 )(1,847,230 )(1,853,430 )(1,859,650 )(1,865,880 )(1,872,140 )(1,878,440 )(1,884,750 )(1,891,070Electricity Exp)(581,416 )(596,020 )(596,020 )(596,020 )(596,020 )(596,020 )(596,020 )(596,020 )(596,020 )(596,020 )(596,020 )(596,020 )(596,020 )(596,020 )(596,020 )(596,020Water Exp)(275,130 )(280,650 )(280,650 )(280,650 )(280,650 )(280,650 )(280,650 )(280,650 )(280,650 )(280,650 )(280,650 )(280,650 )(280,650 )(280,650 )(280,650 )(280,650Gas Exp)(49,800 )(46,910 )(46,910 )(46,910 )(46,910 )(46,910 )(46,910 )(46,910 )(46,910 )(46,910 )(46,910 )(46,910 )(46,910 )(46,910 )(46,910 )(46,910Sewerage Exp
)(2,820,140 )(2,827,830 )(2,783,930 )(2,740,040 )(2,696,170 )(2,752,310 )(2,758,470 )(2,764,630 )(2,770,810 )(2,777,010 )(2,783,230 )(2,789,460 )(2,795,720 )(2,802,020 )(2,808,330 )(2,814,650
Depreciation)(3,254,614 )(3,925,428 )(3,945,646 )(3,951,521 )(3,959,947 )(3,968,829 )(3,982,348 )(3,995,828 )(4,021,069 )(4,042,160 )(4,059,101 )(4,076,449 )(4,098,279 )(4,115,129 )(4,131,979 )(4,148,829Depreciation Building Exp)(3,951,480 )(3,969,389 )(4,055,682 )(4,148,032 )(4,198,673 )(4,255,398 )(4,308,966 )(4,354,025 )(4,401,697 )(4,449,384 )(4,489,884 )(4,545,036 )(4,600,188 )(4,651,215 )(4,702,242 )(4,753,269Depreciation Roads Exp)(1,508,904 )(1,378,762 )(1,396,162 )(1,414,312 )(1,443,712 )(1,465,102 )(1,486,752 )(1,508,852 )(1,533,002 )(1,557,527 )(1,579,427 )(1,601,327 )(1,623,427 )(1,645,327 )(1,667,227 )(1,689,127Depreciation Pathways Exp)(1,378,370 )(1,165,500 )(1,168,425 )(1,175,425 )(1,179,675 )(1,184,134 )(1,186,984 )(1,189,734 )(1,192,609 )(1,195,484 )(1,198,459 )(1,201,334 )(1,204,209 )(1,207,084 )(1,209,959 )(1,212,834Depreciation Stormwater Exp)(624,298 )(698,042 )(773,432 )(803,822 )(832,162 )(858,302 )(885,442 )(911,582 )(938,972 )(965,112 )(992,252 )(1,018,392 )(1,241,532 )(1,267,922 )(1,295,062 )(1,321,202Depreciation Open Space Exp)(306,725 )(641,417 )(650,363 )(652,406 )(654,219 )(655,469 )(657,282 )(658,532 )(660,345 )(661,595 )(663,408 )(664,658 )(666,471 )(667,721 )(669,534 )(670,784Depreciation Marine Exp)(897,463 )(843,655 )(854,128 )(864,893 )(877,952 )(890,336 )(905,136 )(917,645 )(933,754 )(958,388 )(983,022 )(1,008,597 )(1,021,564 )(1,034,656 )(1,067,748 )(1,080,965Depreciation Other Infrastructure Exp)(519,457 )(368,709 )(375,297 )(381,740 )(390,105 )(391,456 )(393,558 )(395,243 )(416,133 )(438,088 )(451,546 )(461,163 )(465,269 )(470,795 )(475,987 )(482,014Depreciation Structures Exp)(154,184 )(163,478 )(164,143 )(164,276 )(164,276 )(164,276 )(164,442 )(164,442 )(164,442 )(164,941 )(165,506 )(165,506 )(165,706 )(165,706 )(165,706 )(165,706Depreciation Bridges Exp)(694,138 )(782,433 )(797,136 )(820,639 )(836,758 )(888,781 )(916,987 )(947,429 )(964,747 )(985,810 )(1,043,401 )(1,069,855 )(1,087,137 )(1,106,838 )(1,121,886 )(1,183,848Depreciation Plant and Vehicle Exp)(645,059 )(682,563 )(691,925 )(703,185 )(717,531 )(726,938 )(770,646 )(778,954 )(786,494 )(802,636 )(811,993 )(819,034 )(829,956 )(837,324 )(847,192 )(857,830Depreciation Equipment Exp)(47,512 )(45,563 )(47,229 )(47,229 )(47,229 )(47,229 )(47,229 )(47,229 )(47,229 )(47,229 )(47,229 )(47,229 )(47,229 )(47,229 )(47,229 )(47,229Depreciation Furniture and Fittings Exp)(30,908 )(28,657 )(28,657 )(28,657 )(28,657 )(28,657 )(28,657 )(28,657 )(28,657 )(28,657 )(28,657 )(28,657 )(28,657 )(28,657 )(28,657 )(28,657Depreciation Other Asset Exp
)(14,013,112 )(14,693,596 )(14,948,225 )(15,156,137 )(15,330,896 )(15,524,907 )(15,734,429 )(15,898,152 )(16,089,150 )(16,297,011 )(16,513,885 )(16,707,237 )(17,079,624 )(17,245,603 )(17,430,408 )(17,642,294
Other Expense)(1,482,410 )(1,319,055 )(1,271,466 )(1,284,058 )(1,296,843 )(1,281,130 )(1,257,514 )(1,263,991 )(1,270,568 )(1,277,241 )(1,284,017 )(1,290,892 )(1,297,872 )(1,304,955 )(1,312,146 )(1,319,444Contrib, Donation and Sponsorship Exp)(459,250 )(495,250 )(495,250 )(495,250 )(495,250 )(495,250 )(495,250 )(495,250 )(495,250 )(495,250 )(495,250 )(495,250 )(495,250 )(495,250 )(495,250 )(495,250Elected Member Exp)(57,994 )(60,550 )(60,550 )(60,550 )(60,550 )(60,550 )(60,550 )(60,550 )(60,550 )(60,550 )(60,550 )(60,550 )(60,550 )(60,550 )(60,550 )(60,550Taxation and Levy Exp)(133,000 )(133,000 )(133,000 )(133,000 )(133,000 )(133,000 )(133,000 )(133,000 )(133,000 )(133,000 )(133,000 )(133,000 )(133,000 )(133,000 )(133,000 )(133,000Write-Off Exp)(511,561 )(548,225 )(543,225 )(548,225 )(540,225 )(575,225 )(540,225 )(545,225 )(540,225 )(575,225 )(540,225 )(545,225 )(540,225 )(545,225 )(540,225 )(545,225Miscellaneous Exp
)(2,644,215 )(2,556,080 )(2,503,491 )(2,521,083 )(2,525,868 )(2,545,155 )(2,486,539 )(2,498,016 )(2,499,593 )(2,541,266 )(2,513,042 )(2,524,917 )(2,526,897 )(2,538,980 )(2,541,171 )(2,553,469
)(65,528,065Total Operating Expenditure )(63,564,175 )(63,077,464 )(62,478,961 )(62,607,097 )(62,951,249 )(62,647,572 )(62,799,770 )(63,243,211 )(63,241,061 )(63,273,715 )(64,192,024 )(64,093,339 )(64,335,468 )(65,158,518 )(64,850,884
OPERATING SURPLUS (DEFICIT) )(9,599,938 )(6,725,841 )(5,604,638 )(4,202,149 )(3,392,181 )(2,754,678 )(1,472,452 )(629,319 )(45,438 974,026 1,977,768 2,128,290 3,320,968 3,688,409 3,488,146 4,432,264
Page 22 of 77

Integrated Financial Plan 2019-20 to 2033-34
Statement ofComprehensive Income
Draft Budget Forecast Forecast Forecast Forecast Forecast Forecast Forecast ForecastForecast Forecast Forecast Forecast Forecast Forecast Forecast2018-19 2019-20 2020-21 2021-22 2022-23 2023-24 2024-25 2025-26 2026-27 2027-28 2028-29 2029-30 2030-31 2031-32 2032-33 2033-34
Non-Operating Income and ExpenditureGrants and Contributions for the Development of Assets
5,063,029 2,696,666 5,294,666 3,659,666 1,880,333 1,055,000 825,000 1,465,000 925,000 775,000 1,325,000 1,235,000 4,875,000 725,000 725,000 725,000Capital Grant Subsidy and Contrib Inc21,367 43,591 44,965 46,382 47,845 49,355 17,852 18,359 14,323 10,128 5,181Self Supporting Loans Inc
)(21,367 )(43,591 )(44,965 )(46,382 )(47,845 )(49,355 )(17,852 )(18,359 )(14,323 )(10,128 )(5,181Self Supporting Loans - Debtors
5,063,029 2,696,666 5,294,666 3,659,666 1,880,333 1,055,000 825,000 1,465,000 925,000 775,000 1,325,000 1,235,000 4,875,000 725,000 725,000 725,000
Sale or Disposal of Assets1,320,000Proceeds Land Disposal
746,990 661,120 265,008 312,268 179,342 493,096 567,608 471,052 317,341 226,248 562,096 538,120 286,252 312,766 176,342 669,021Proceeds Plant and Vehicle Disposals37,090Proceeds Equipment Disposals
)(26,000Value of Land Disposed)(317,328Value of Buildings Disposed)(740,489Value of Plant and Vehicles Disposed)(949Value of Equipment Disposed
1,019,314 661,120 265,008 312,268 179,342 493,096 567,608 471,052 317,341 226,248 562,096 538,120 286,252 312,766 176,342 669,021
6,082,343Total Non-Operating Income and Expenditure 3,357,786 5,559,674 3,971,934 2,059,675 1,548,096 1,392,608 1,936,052 1,242,341 1,001,248 1,887,096 1,773,120 5,161,252 1,037,766 901,342 1,394,021
TOTAL COMPREHENSIVE INCOME )(3,517,595 )(44,964 )(230,215 )(1,332,506 )(1,206,582 )(79,844 1,306,733 1,196,903 1,975,274)(3,368,055 3,864,864 3,901,410 8,482,220 4,726,175 4,389,488 5,826,285
Page 23 of 77

Integrated Financial Plan 2019-20 to 2033-34
2018-19Statement ofFinancial Position
Forecast2019-20 2020-21 2021-22 2022-23 2023-24 2024-25 2025-26 2026-27 2027-28
Draft Budget Forecast Forecast ForecastForecast Forecast Forecast Forecast Forecast Forecast Forecast Forecast Forecast Forecast Forecast2028-29 2029-30 2030-31 2031-32 2032-33 2033-34
Current Assets
Cash Unrestricted 6,672,978 6,276,448 6,757,222 7,270,962 7,769,980 8,293,480 8,787,550 9,256,682 9,757,935 10,243,715 10,754,654 11,222,524 11,700,447 12,164,275 12,654,437 13,157,177
Cash Restricted 16,842,342 16,788,162 15,358,950 15,397,399 16,507,407 16,601,505 19,068,689 21,329,487 23,203,298 25,778,012 28,160,897 32,877,820 35,240,411 42,825,168 49,823,231 57,530,623
Trade and Other Receivables 2,474,017 2,474,017 2,474,017 2,474,017 2,474,017 2,474,017 2,474,017 2,474,017 2,474,017 2,474,017 2,474,017 2,474,017 2,474,017 2,474,017 2,474,017 2,474,017
Inventories 61,991 61,991 61,991 61,991 61,991 61,991 61,991 61,991 61,991 61,991 61,991 61,991 61,991 61,991 61,991 61,991
26,051,328 25,600,618 24,652,180 25,204,369 26,813,395 27,430,993 30,392,247 33,122,177 35,497,241 38,557,735 41,451,559 46,636,352 49,476,866 57,525,451 65,013,676 73,223,808
Current Liabilities
Trade and Other Payables )(3,923,701 )(3,923,701 )(3,923,701 )(3,923,701 )(3,923,701 )(3,923,701 )(3,923,701 )(3,923,701 )(3,923,701 )(3,923,701 )(3,923,701 )(3,923,701 )(3,923,701 )(3,923,701 )(3,923,701 )(3,923,701
Current Provisions )(4,342,531 )(4,835,164 )(5,327,797 )(5,820,430 )(6,313,063 )(6,805,696 )(7,298,329 )(7,790,962 )(8,283,595 )(8,776,228 )(9,268,861 )(9,761,494 )(10,254,127 )(10,746,760 )(11,239,393 )(11,732,026
Current Loan Liability )(2,239,237 )(2,204,288 )(2,673,857 )(2,776,844 )(2,512,255 )(2,082,236 )(1,666,602 )(1,687,838 )(1,599,299 )(1,301,466 )(979,675 )(767,261 )(252,522 )(260,589 )(268,982 )(154,178
)(10,505,469 )(10,963,153 )(11,925,355 )(12,520,975 )(12,749,019 )(12,811,633 )(12,888,632 )(13,402,501 )(13,806,595 )(14,001,395 )(14,172,237 )(14,452,456 )(14,430,350 )(14,931,050 )(15,432,076 )(15,809,905
Non Current Assets
Non Current Receivables 801,943 758,352 713,387 667,005 619,160 569,805 551,953 533,594 519,271 509,143 503,962 503,962 503,962 503,962 503,962 503,962
Property Plant and Equipment 249,106,264 243,641,620 238,131,027 232,579,796 226,989,674 221,329,240 215,583,373 209,785,276 203,937,080 198,030,588 192,040,207 185,998,983 179,907,725 173,772,548 167,595,605 161,329,212
Infrastructure 305,631,801 296,402,849 286,965,217 277,360,311 267,619,537 257,755,064 247,766,502 237,666,447 227,425,493 217,034,974 206,511,470 195,845,457 184,857,091 173,746,665 162,493,200 151,117,299
Work in Progress 31,722,674 43,910,849 62,710,795 75,064,623 85,332,558 98,177,955 109,414,471 122,848,752 136,693,795 150,923,983 168,720,191 183,771,938 206,333,575 220,611,814 235,290,464 250,887,497
587,262,682 584,713,670 588,520,426 585,671,735 580,560,929 577,832,064 573,316,299 570,834,069 568,575,639 566,498,688 567,775,830 566,120,340 571,602,353 568,634,989 565,883,231 563,837,970
Non Current Liabilities
Non Current Payables )(12,893 )(12,893 )(12,893 )(12,893 )(12,893 )(12,893 )(12,893 )(12,893 )(12,893 )(12,893 )(12,893 )(12,893 )(12,893 )(12,893 )(12,893 )(12,893
Non Current Provisions )(587,610 )(649,710 )(711,810 )(773,910 )(836,010 )(898,110 )(960,210 )(1,022,310 )(1,084,410 )(1,146,510 )(1,208,610 )(1,270,710 )(1,332,810 )(1,394,910 )(1,457,010 )(1,519,110
Non Current Loan Liabilities )(12,291,657 )(12,140,206 )(14,019,186 )(11,295,179 )(8,835,761 )(7,806,362 )(6,192,596 )(4,557,594 )(3,011,131 )(1,762,500 )(1,835,660 )(1,121,234 )(921,547 )(713,793 )(497,646 )(396,303
)(12,892,160 )(12,802,809 )(14,743,889 )(12,081,982 )(9,684,664 )(8,717,365 )(7,165,699 )(5,592,797 )(4,108,434 )(2,921,903 )(3,057,163 )(2,404,837 )(2,267,250 )(2,121,596 )(1,967,549 )(1,928,306
Equity
Retained Surplus )(236,136,780 )(232,751,899 )(233,970,989 )(233,702,325 )(231,259,811 )(229,959,131 )(227,412,103 )(226,458,038 )(225,781,130 )(225,181,690 )(226,663,669 )(225,848,156 )(231,967,785 )(229,109,203 )(226,500,628 )(224,619,521
Reserves - Cash Backed )(16,590,848 )(16,607,674 )(15,343,620 )(15,382,069 )(16,492,077 )(16,586,175 )(19,053,359 )(21,314,157 )(23,187,968 )(25,762,682 )(28,145,567 )(32,862,490 )(35,225,081 )(42,809,838 )(49,807,901 )(57,515,293
Reserves - Asset Revaluation )(337,188,753 )(337,188,753 )(337,188,753 )(337,188,753 )(337,188,753 )(337,188,753 )(337,188,753 )(337,188,753 )(337,188,753 )(337,188,753 )(337,188,753 )(337,188,753 )(337,188,753 )(337,188,753 )(337,188,753 )(337,188,753
)(589,916,381 )(586,548,326 )(586,503,362 )(586,273,147 )(584,940,641 )(583,734,059 )(583,654,215 )(584,960,948 )(586,157,851 )(588,133,125 )(591,997,989 )(595,899,399 )(604,381,619 )(609,107,794 )(613,497,282 )(619,323,567
Page 24 of 77

Integrated Financial Plan 2019-20 to 2033-34
Statement ofCash Flows 2019-202018-19 2020-21 2021-22 2022-23 2023-24 2024-25 2025-26 2026-27 2027-28
Forecast Draft Budget Forecast Forecast Forecast Forecast Forecast Forecast Forecast Forecast ForecastForecastForecastForecastForecastForecast
2028-29 2029-30 2030-31 2031-32 2032-33 2033-34
CASH FLOWS FROM OPERATING ACTIVITIES
RECEIPTSRates 38,349,437 39,416,164 40,042,566 40,996,861 41,943,670 42,924,524 43,901,029 44,901,176 45,925,580 46,942,816 47,983,829 49,049,218 50,139,594 50,753,340 51,372,551 52,005,388Operating Grants and Subsidies 1,875,116 2,108,953 2,080,953 1,980,953 1,980,953 1,980,953 1,980,953 1,980,953 1,980,953 1,980,953 1,980,953 1,980,953 1,980,953 1,980,953 1,980,953 1,980,953Contributions Reimbursements and Donations 1,093,662 693,120 732,330 681,287 680,199 679,052 678,174 678,239 678,284 678,543 678,861 679,486 680,216 680,956 681,696 682,436Fees and Charges 12,736,225 12,993,987 12,992,987 12,992,987 12,992,987 12,992,987 12,992,987 12,992,987 12,992,987 12,992,987 12,992,987 12,992,987 12,992,987 12,992,987 12,992,987 12,992,987Interest Earnings 1,463,931 1,302,295 1,300,175 1,300,909 1,293,292 1,295,240 1,298,162 1,293,281 1,296,154 1,295,973 1,291,038 1,293,855 1,296,742 1,291,826 1,294,662 1,297,569Other Revenue 409,756 323,815 323,815 323,815 323,815 323,815 323,815 323,815 323,815 323,815 323,815 323,815 323,815 323,815 323,815 323,815
55,928,127 56,838,334 57,472,826 58,276,812 59,214,916 60,196,571 61,175,120 62,170,451 63,197,773 64,215,087 65,251,483 66,320,314 67,414,307 68,023,877 68,646,664 69,283,148
PAYMENTSEmployee Costs (Operating Only) )(25,850,061 )(26,065,259 )(26,018,674 )(26,028,674 )(26,018,674 )(26,028,674 )(26,018,674 )(26,028,674 )(26,018,674 )(26,028,674 )(26,018,674 )(26,028,674 )(26,018,674 )(26,028,674 )(26,018,674 )(26,028,674Materials and Contracts )(18,412,022 )(15,569,828 )(14,972,571 )(14,099,218 )(14,222,030 )(14,409,326 )(14,016,356 )(14,063,082 )(14,390,699 )(14,196,127 )(14,113,026 )(14,818,666 )(14,387,687 )(14,460,909 )(15,110,132 )(14,571,856Insurance )(597,572 )(651,744 )(651,744 )(651,744 )(651,744 )(651,744 )(651,744 )(651,744 )(651,744 )(651,744 )(651,744 )(651,744 )(651,744 )(651,744 )(651,744 )(651,744Interest Expense )(629,128 )(645,105 )(644,096 )(727,332 )(606,982 )(484,400 )(426,627 )(340,739 )(267,808 )(194,496 )(125,381 )(116,593 )(78,260 )(52,805 )(43,326 )(33,464Utilities )(2,820,140 )(2,827,830 )(2,783,930 )(2,740,040 )(2,696,170 )(2,752,310 )(2,758,470 )(2,764,630 )(2,770,810 )(2,777,010 )(2,783,230 )(2,789,460 )(2,795,720 )(2,802,020 )(2,808,330 )(2,814,650Other Expenses )(2,644,215 )(2,556,080 )(2,503,491 )(2,521,083 )(2,525,868 )(2,545,155 )(2,486,539 )(2,498,016 )(2,499,593 )(2,541,266 )(2,513,042 )(2,524,917 )(2,526,897 )(2,538,980 )(2,541,171 )(2,553,469
)(50,953,138 )(48,315,846 )(47,574,506 )(46,768,091 )(46,721,468 )(46,871,609 )(46,358,410 )(46,346,885 )(46,599,328 )(46,389,317 )(46,205,097 )(46,930,054 )(46,458,982 )(46,535,132 )(47,173,377 )(46,653,857
4,974,989 8,522,488 9,898,320 11,508,721 12,493,448 13,324,962 14,816,710 15,823,566 16,598,445 17,825,770CASH FLOWS FROM OPERATING ACTIVITIES 19,046,386 19,390,260 20,955,325 21,488,745 21,473,287 22,629,291
CASH FLOWS FROM INVESTING ACTIVITIES
CAPITAL RECEIPTSGrants and Contributions for the Development of Assets 5,063,029 2,696,666 5,294,666 3,659,666 1,880,333 1,055,000 825,000 1,465,000 925,000 775,000 1,325,000 1,235,000 4,875,000 725,000 725,000 725,000Proceeds from the Sale Plant and Vehicles 2,104,080 661,120 265,008 312,268 179,342 493,096 567,608 471,052 317,341 226,248 562,096 538,120 286,252 312,766 176,342 669,021
7,167,109 3,357,786 5,559,674 3,971,934 2,059,675 1,548,096 1,392,608 1,936,052 1,242,341 1,001,248 1,887,096 1,773,120 5,161,252 1,037,766 901,342 1,394,021
CAPITAL PAYMENTSAcquisition of Assets )(24,149,564 )(12,188,175 )(18,799,946 )(12,353,828 )(10,267,935 )(12,845,397 )(11,236,516 )(13,434,281 )(13,845,043 )(14,230,188 )(17,796,208 )(15,051,747 )(22,561,637 )(14,278,239 )(14,678,650 )(15,597,033
)(24,149,564 )(12,188,175 )(18,799,946 )(12,353,828 )(10,267,935 )(12,845,397 )(11,236,516 )(13,434,281 )(13,845,043 )(14,230,188 )(17,796,208 )(15,051,747 )(22,561,637 )(14,278,239 )(14,678,650 )(15,597,033
)(16,982,455 )(8,830,389 )(13,240,272 )(8,381,894 )(8,208,260 )(11,297,301 )(9,843,908 )(11,498,229 )(12,602,702 )(13,228,940CASH FLOWS FROM INVESTING ACTIVITIES )(15,909,112 )(13,278,627 )(17,400,385 )(13,240,473 )(13,777,308 )(14,203,012
CASH FLOWS FROM FINANCING ACTIVITIESProceeds from New Debentures 1,550,000 2,000,000 4,500,000 1,000,000 1,000,000Proceeds from Self Supporting Loans 21,367 43,591 44,965 46,382 47,845 49,355 17,852 18,359 14,323 10,128 5,181Repayment of Debentures )(2,213,708 )(2,186,400 )(2,151,451 )(2,621,020 )(2,724,007 )(2,459,418 )(2,029,400 )(1,613,766 )(1,635,002 )(1,546,464 )(1,248,631 )(926,840 )(714,426 )(199,687 )(207,754 )(216,147
)(642,341 )(142,809 2,393,514 )(2,574,638 )(2,676,162 )(1,410,063 )(2,011,548 )(1,595,407 )(1,620,679 )(1,536,336 )(243,450 )(926,840 )(714,426 )(199,687 )(207,754 )(216,147
)(642,341 )(142,809 2,393,514 )(2,574,638 )(2,676,162 )(1,410,063 )(2,011,548 )(1,595,407 )(1,620,679 )(1,536,336CASH FLOWS FROM FINANCING ACTIVITIES )(243,450 )(926,840 )(714,426 )(199,687 )(207,754 )(216,147
NET INCREASE (DECREASE) IN CASH HELDCash Movement )(12,799,807 )(450,710 )(948,438 552,189 1,609,026 617,598 2,961,254 2,729,930 2,375,064 3,060,494 2,893,824 5,184,793 2,840,514 8,048,585 7,488,225 8,210,132
Cash at the beginning of the year
Cash increase (decrease)
Cash at the end of the year
36,315,127
)(12,799,807 )(450,710
23,064,610
23,064,610
)(948,438
23,515,320
23,515,320
22,116,172
22,116,172
552,189 1,609,026
22,668,361
22,668,361
24,277,387
24,277,387
617,598 2,729,9302,961,254 2,375,064 3,060,494
24,894,985
24,894,985
27,856,239
27,856,239
30,586,169
30,586,169
32,961,233
32,961,233
36,021,727
2,893,824 5,184,793 2,840,514 8,048,585 7,488,225 8,210,132
36,021,727 38,915,551 44,100,344 46,940,858 54,989,443 62,477,668
38,915,551 44,100,344 46,940,858 54,989,443 62,477,668 70,687,800
Page 25 of 77

Integrated Financial Plan 2019-20 to 2033-34
Rate SettingStatement 2018-19
Forecast Draft Budget
2019-20 2020-21
Forecast Forecast
2021-22 2022-23
Forecast Forecast
2023-24 2024-25
Forecast Forecast
2025-26 2026-27
Forecast Forecast
2027-28 2028-29
Forecast Forecast
2029-30 2030-31
Forecast Forecast
2031-32 2032-33
Forecast Forecast
2033-34
Revenue (Excl Rates)Rates - Specified Area 46,305 48,272 48,755 49,243 49,735 50,232 50,734 51,241 51,753 52,271 55,48754,93854,39453,85553,32252,794Grants and Subsidies - Operating 1,875,116 2,108,953 2,080,953 1,980,953 1,980,953 1,980,953 1,980,953 1,980,953 1,980,953 1,980,953 1,980,9531,980,9531,980,9531,980,9531,980,9531,980,953Fees and Charges 12,736,225 12,993,987 12,992,987 12,992,987 12,992,987 12,992,987 12,992,987 12,992,987 12,992,987 12,992,987 12,992,98712,992,98712,992,98712,992,98712,992,98712,992,987Contributions, Reimbursements and Donation 1,093,662 693,120 732,330 681,287 680,199 679,052 678,174 678,239 678,284 678,543 682,436681,696680,956680,216679,486678,861Interest Received 1,463,931 1,302,295 1,300,175 1,300,909 1,293,292 1,295,240 1,298,162 1,293,281 1,296,154 1,295,973 1,297,5691,294,6621,291,8261,296,7421,293,8551,291,038Other Revenue 409,756 323,815 323,815 323,815 323,815 323,815 323,815 323,815 323,815 323,815 323,815323,815323,815323,815323,815323,815
17,333,24717,329,05117,324,93117,328,56817,324,41817,320,44817,324,54217,323,94617,320,51617,324,82517,322,27917,320,98117,329,19417,479,01517,470,44217,624,995
Less ExpenditureEmployee Costs )(26,411,876 )(26,619,992 )(26,573,407 )(26,583,407 )(26,573,407 )(26,583,407 )(26,573,407 )(26,583,407 )(26,573,407 )(26,583,407 )(26,583,407)(26,573,407)(26,583,407)(26,573,407)(26,583,407)(26,573,407Materials and Contracts )(18,412,022 )(15,569,828 )(14,972,571 )(14,099,218 )(14,222,030 )(14,409,326 )(14,016,356 )(14,063,082 )(14,390,699 )(14,196,127 )(14,571,856)(15,110,132)(14,460,909)(14,387,687)(14,818,666)(14,113,026Insurance )(597,572 )(651,744 )(651,744 )(651,744 )(651,744 )(651,744 )(651,744 )(651,744 )(651,744 )(651,744 )(651,744)(651,744)(651,744)(651,744)(651,744)(651,744Interest Expense )(629,128 )(645,105 )(644,096 )(727,332 )(606,982 )(484,400 )(426,627 )(340,739 )(267,808 )(194,496 )(33,464)(43,326)(52,805)(78,260)(116,593)(125,381Utilities )(2,820,140 )(2,827,830 )(2,783,930 )(2,740,040 )(2,696,170 )(2,752,310 )(2,758,470 )(2,764,630 )(2,770,810 )(2,777,010 )(2,814,650)(2,808,330)(2,802,020)(2,795,720)(2,789,460)(2,783,230Depreciation )(14,013,112 )(14,693,596 )(14,948,225 )(15,156,137 )(15,330,896 )(15,524,907 )(15,734,429 )(15,898,152 )(16,089,150 )(16,297,011 )(17,642,294)(17,430,408)(17,245,603)(17,079,624)(16,707,237)(16,513,885Other Expense )(2,644,215 )(2,556,080 )(2,503,491 )(2,521,083 )(2,525,868 )(2,545,155 )(2,486,539 )(2,498,016 )(2,499,593 )(2,541,266 )(2,553,469)(2,541,171)(2,538,980)(2,526,897)(2,524,917)(2,513,042
)(64,850,884)(65,158,518)(64,335,468)(64,093,339)(64,192,024)(63,273,715)(63,241,061)(63,243,211)(62,799,770)(62,647,572)(62,951,249)(62,607,097)(62,478,961)(63,077,464)(63,564,175)(65,528,065
Net Result Excluding Rates )(47,517,637)(47,829,467)(47,010,537)(46,764,771)(46,867,606)(45,953,267)(45,916,519)(45,919,265)(45,479,254)(45,322,747)(45,628,970)(45,286,116)(45,149,767)(45,598,449)(46,093,733)(47,903,070
Non Cash Expenditure and RevenueDepreciation 17,642,29417,430,40817,245,60317,079,62416,707,23716,513,88516,297,01116,089,15015,898,15215,734,42915,524,90715,330,89615,156,13714,948,22514,693,59614,013,112
New Self Supporting Loans )(240,000Movement in Non-Current Assets and Liabilities
Provisions and Accruals 62,693 62,100 62,100 62,100 62,100 62,100 62,100 62,100 62,100 62,100 62,10062,10062,10062,10062,10062,100
62,10062,10062,10062,10062,10062,10062,10062,10062,10062,10062,10062,10062,10062,10062,10062,693
Investing ActivitiesGrants/Contributions for Asset Development 5,063,029 2,696,666 5,294,666 3,659,666 1,880,333 1,055,000 825,000 1,465,000 925,000 775,000 725,000725,000725,0004,875,0001,235,0001,325,000Proceeds on Disposal of Assets 2,104,080 661,120 265,008 312,268 179,342 493,096 567,608 471,052 317,341 226,248 669,021176,342312,766286,252538,120562,096Acquisition of Assets - Employee Costs )(128,534 )(143,034 )(143,034 )(143,034 )(143,034 )(143,034 )(143,034 )(143,034 )(143,034 )(143,034 )(143,034)(143,034)(143,034)(143,034)(143,034)(143,034Acquisition of Assets - Material and Contracts )(23,954,779 )(11,992,413 )(18,604,184 )(12,158,066 )(10,072,173 )(12,649,635 )(11,040,754 )(13,238,519 )(13,649,281 )(14,034,426 )(15,401,271)(14,482,888)(14,082,477)(22,365,875)(14,855,985)(17,600,446Acquisition of Assets - Cost Allocations )(66,251 )(52,728 )(52,728 )(52,728 )(52,728 )(52,728 )(52,728 )(52,728 )(52,728 )(52,728 )(52,728)(52,728)(52,728)(52,728)(52,728)(52,728
)(14,203,012)(13,777,308)(13,240,473)(17,400,385)(13,278,627)(15,909,112)(13,228,940)(12,602,702)(11,498,229)(9,843,908)(11,297,301)(8,208,260)(8,381,894)(13,240,272)(8,830,389)(16,982,455
Financing ActivitiesLoan Repayments - Self Supporting 21,367 43,591 44,965 46,382 47,845 49,355 17,852 18,359 14,323 10,128 5,181Proceeds from New Debentures 1,640,000 2,000,000 4,500,000 1,000,000 1,000,000Transfers from Restricted Cash 10,235,643 54,180 1,429,212 )(38,449 )(1,110,008 )(94,098 )(2,467,184 )(2,260,798 )(1,873,811 )(2,574,714 )(7,707,392)(6,998,063)(7,584,757)(2,362,591)(4,716,923)(2,382,885Repayment of Debentures )(2,213,708 )(2,186,400 )(2,151,451 )(2,621,020 )(2,724,007 )(2,459,418 )(2,029,400 )(1,613,766 )(1,635,002 )(1,546,464 )(216,147)(207,754)(199,687)(714,426)(926,840)(1,248,631
)(7,923,539)(7,205,817)(7,784,444)(3,077,017)(5,643,763)(2,626,335)(4,111,050)(3,494,490)(3,856,205)(4,478,732)(1,504,161)(3,786,170)(2,613,0873,822,726)(88,6299,683,302
9,819
19,9269,819
12,29041,095
12,29041,095
55,80580,568
55,80580,568
62,26269,115
62,26269,115
60,49583,996
60,49583,996
82,55951,692
82,55951,692
45,30724,200
45,30724,200
36,059925,222
36,059925,222Estimated Surplus (Deficit) June 30 Carried ForwardLESS
Estimated Surplus (Deficit) July 1 Brought ForwardADD 3,988,508
51,949,90151,317,61350,698,94650,085,73948,995,89647,931,03546,890,54545,873,82744,849,93543,850,29542,874,29241,893,93540,947,61839,993,81139,367,89238,303,132Amount required to be raised from rates)(51,949,901)(51,317,613)(50,698,946)(50,085,739)(48,995,896)(47,931,035)(46,890,545)(45,873,827)(44,849,935)(43,850,295)(42,874,292)(41,893,935)(40,947,618)(39,993,811)(39,367,892)(38,303,132Estimated rate revenue
Page 26 of 77
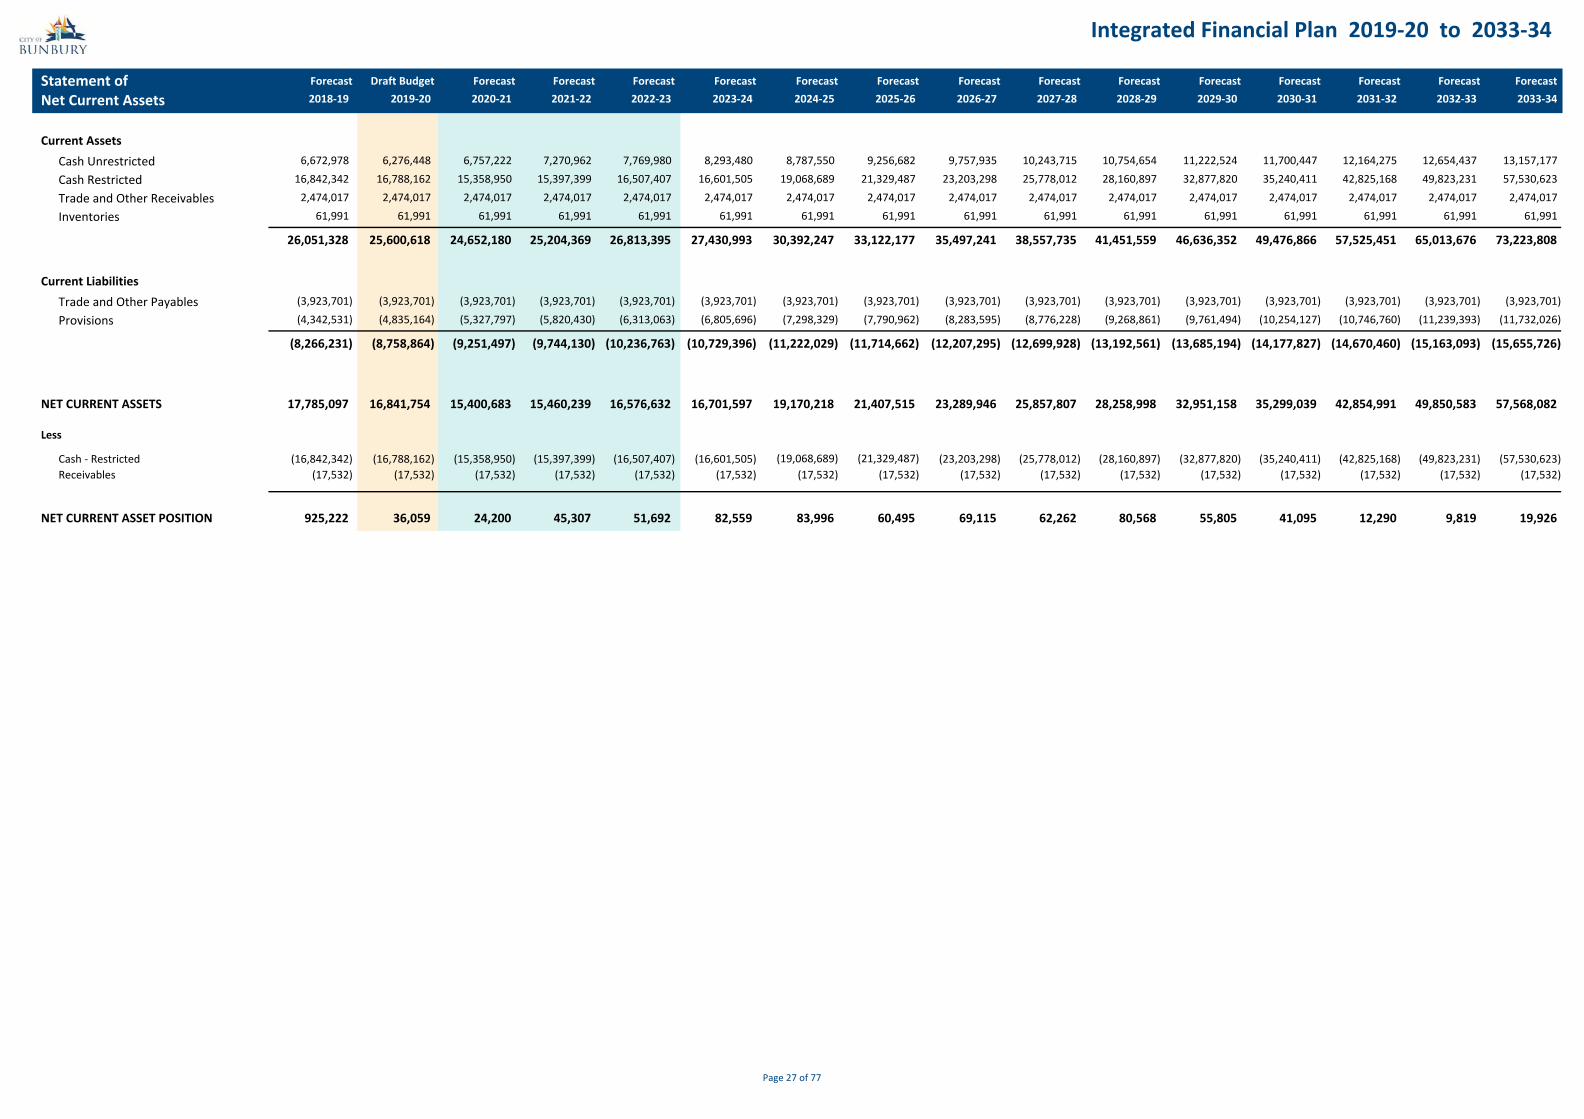
Integrated Financial Plan 2019-20 to 2033-34
2018-19Statement ofNet Current Assets
Forecast2019-20 2020-21 2021-22 2022-23 2023-24 2024-25 2025-26 2026-27 2027-28
Draft Budget Forecast Forecast ForecastForecast Forecast Forecast Forecast Forecast ForecastForecastForecastForecastForecastForecast2028-29 2029-30 2030-31 2031-32 2032-33 2033-34
Current Assets6,672,978 6,276,448 6,757,222 7,270,962 7,769,980 8,293,480 8,787,550 9,256,682 9,757,935 10,243,715Cash Unrestricted 10,754,654 11,222,524 11,700,447 12,164,275 12,654,437 13,157,177
16,842,342 16,788,162 15,358,950 15,397,399 16,507,407 16,601,505 19,068,689 21,329,487 23,203,298 25,778,012Cash Restricted 28,160,897 32,877,820 35,240,411 42,825,168 49,823,231 57,530,6232,474,017 2,474,017 2,474,017 2,474,017 2,474,017 2,474,017 2,474,017 2,474,017 2,474,017 2,474,017Trade and Other Receivables 2,474,017 2,474,017 2,474,017 2,474,017 2,474,017 2,474,017
61,991 61,991 61,991 61,991 61,991 61,991 61,991 61,991 61,991 61,991Inventories 61,991 61,991 61,991 61,991 61,991 61,991
26,051,328 25,600,618 24,652,180 25,204,369 26,813,395 27,430,993 30,392,247 33,122,177 35,497,241 38,557,735 41,451,559 46,636,352 49,476,866 57,525,451 65,013,676 73,223,808
Current Liabilities)(3,923,701 )(3,923,701 )(3,923,701 )(3,923,701 )(3,923,701 )(3,923,701 )(3,923,701 )(3,923,701 )(3,923,701 )(3,923,701Trade and Other Payables )(3,923,701 )(3,923,701 )(3,923,701 )(3,923,701 )(3,923,701 )(3,923,701)(4,342,531 )(4,835,164 )(5,327,797 )(5,820,430 )(6,313,063 )(6,805,696 )(7,298,329 )(7,790,962 )(8,283,595 )(8,776,228Provisions )(9,268,861 )(9,761,494 )(10,254,127 )(10,746,760 )(11,239,393 )(11,732,026
)(8,266,231 )(8,758,864 )(9,251,497 )(9,744,130 )(10,236,763 )(10,729,396 )(11,222,029 )(11,714,662 )(12,207,295 )(12,699,928 )(13,192,561 )(13,685,194 )(14,177,827 )(14,670,460 )(15,163,093 )(15,655,726
NET CURRENT ASSETS 17,785,097 16,841,754 15,400,683 15,460,239 16,576,632 16,701,597 19,170,218 21,407,515 23,289,946 25,857,807 28,258,998 32,951,158 35,299,039 42,854,991 49,850,583 57,568,082
Less
Cash - RestrictedReceivables
)(16,842,342 )(16,788,162 )(15,358,950 )(15,397,399 )(16,507,407 )(16,601,505 )(19,068,689 )(21,329,487 )(23,203,298 )(25,778,012 )(28,160,897 )(32,877,820 )(35,240,411 )(42,825,168 )(49,823,231 )(57,530,623)(17,532)(17,532)(17,532)(17,532)(17,532)(17,532)(17,532)(17,532)(17,532)(17,532)(17,532)(17,532)(17,532)(17,532)(17,532)(17,532
NET CURRENT ASSET POSITION 925,222 36,059 24,200 45,307 51,692 82,559 83,996 60,495 69,115 62,262 80,568 55,805 41,095 12,290 9,819 19,926
Page 27 of 77
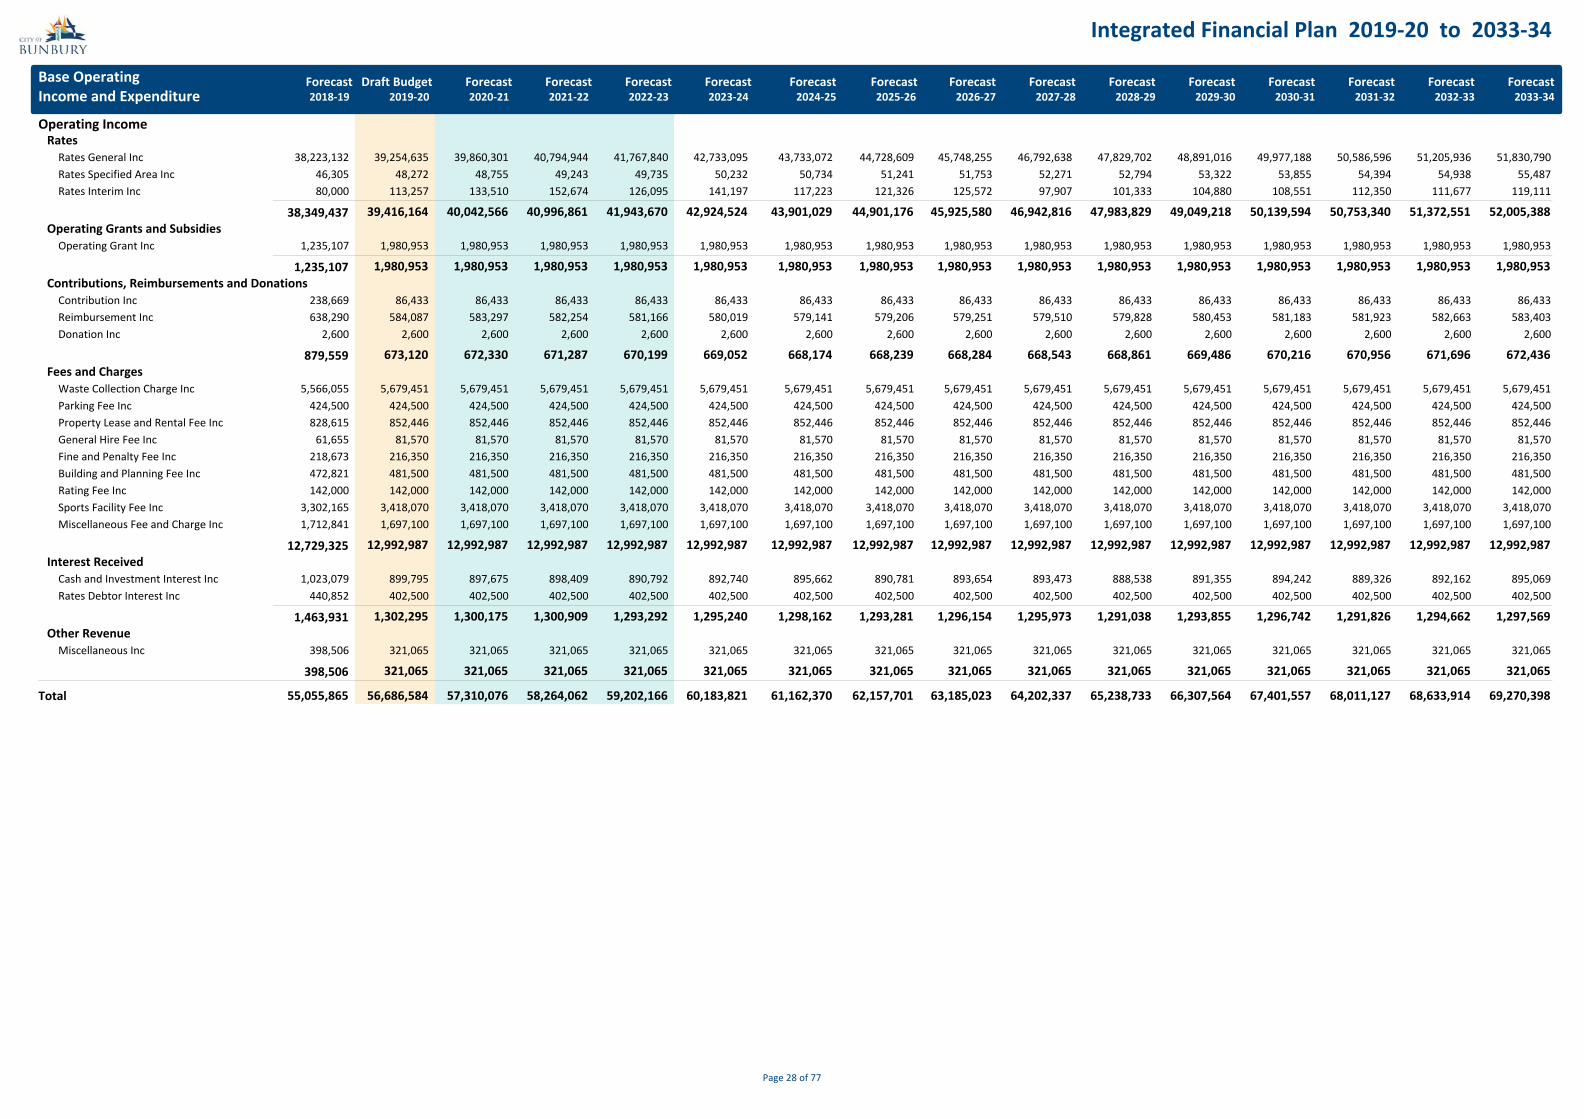
Integrated Financial Plan 2019-20 to 2033-34
Base OperatingIncome and Expenditure
Draft Budget Forecast Forecast Forecast Forecast Forecast Forecast Forecast Forecast ForecastForecast Forecast Forecast Forecast Forecast Forecast2033-342032-332031-322030-312029-302028-292027-282026-272025-262024-252023-242022-232021-222020-212019-202018-19
Operating IncomeRates
38,223,132Rates General Inc 39,254,635 39,860,301 40,794,944 41,767,840 42,733,095 43,733,072 44,728,609 45,748,255 46,792,638 47,829,702 48,891,016 49,977,188 50,586,596 51,205,936 51,830,79046,305Rates Specified Area Inc 48,272 48,755 49,243 49,735 50,232 50,734 51,241 51,753 52,271 52,794 53,322 53,855 54,394 54,938 55,48780,000Rates Interim Inc 113,257 133,510 152,674 126,095 141,197 117,223 121,326 125,572 97,907 101,333 104,880 108,551 112,350 111,677 119,111
38,349,437 39,416,164 40,042,566 40,996,861 41,943,670 42,924,524 43,901,029 44,901,176 45,925,580 46,942,816 47,983,829 49,049,218 50,139,594 50,753,340 51,372,551 52,005,388Operating Grants and Subsidies
1,235,107Operating Grant Inc 1,980,953 1,980,953 1,980,953 1,980,953 1,980,953 1,980,953 1,980,953 1,980,953 1,980,953 1,980,953 1,980,953 1,980,953 1,980,953 1,980,953 1,980,953
1,235,107 1,980,953 1,980,953 1,980,953 1,980,953 1,980,953 1,980,953 1,980,953 1,980,953 1,980,953 1,980,953 1,980,953 1,980,953 1,980,953 1,980,953 1,980,953Contributions, Reimbursements and Donations
238,669Contribution Inc 86,433 86,433 86,433 86,433 86,433 86,433 86,433 86,433 86,433 86,433 86,433 86,433 86,433 86,433 86,433638,290Reimbursement Inc 584,087 583,297 582,254 581,166 580,019 579,141 579,206 579,251 579,510 579,828 580,453 581,183 581,923 582,663 583,403
2,600Donation Inc 2,600 2,600 2,600 2,600 2,600 2,600 2,600 2,600 2,600 2,600 2,600 2,600 2,600 2,600 2,600
879,559 673,120 672,330 671,287 670,199 669,052 668,174 668,239 668,284 668,543 668,861 669,486 670,216 670,956 671,696 672,436Fees and Charges
5,566,055Waste Collection Charge Inc 5,679,451 5,679,451 5,679,451 5,679,451 5,679,451 5,679,451 5,679,451 5,679,451 5,679,451 5,679,451 5,679,451 5,679,451 5,679,451 5,679,451 5,679,451424,500Parking Fee Inc 424,500 424,500 424,500 424,500 424,500 424,500 424,500 424,500 424,500 424,500 424,500 424,500 424,500 424,500 424,500828,615Property Lease and Rental Fee Inc 852,446 852,446 852,446 852,446 852,446 852,446 852,446 852,446 852,446 852,446 852,446 852,446 852,446 852,446 852,446
61,655General Hire Fee Inc 81,570 81,570 81,570 81,570 81,570 81,570 81,570 81,570 81,570 81,570 81,570 81,570 81,570 81,570 81,570218,673Fine and Penalty Fee Inc 216,350 216,350 216,350 216,350 216,350 216,350 216,350 216,350 216,350 216,350 216,350 216,350 216,350 216,350 216,350472,821Building and Planning Fee Inc 481,500 481,500 481,500 481,500 481,500 481,500 481,500 481,500 481,500 481,500 481,500 481,500 481,500 481,500 481,500142,000Rating Fee Inc 142,000 142,000 142,000 142,000 142,000 142,000 142,000 142,000 142,000 142,000 142,000 142,000 142,000 142,000 142,000
3,302,165Sports Facility Fee Inc 3,418,070 3,418,070 3,418,070 3,418,070 3,418,070 3,418,070 3,418,070 3,418,070 3,418,070 3,418,070 3,418,070 3,418,070 3,418,070 3,418,070 3,418,0701,712,841Miscellaneous Fee and Charge Inc 1,697,100 1,697,100 1,697,100 1,697,100 1,697,100 1,697,100 1,697,100 1,697,100 1,697,100 1,697,100 1,697,100 1,697,100 1,697,100 1,697,100 1,697,100
12,729,325 12,992,987 12,992,987 12,992,987 12,992,987 12,992,987 12,992,987 12,992,987 12,992,987 12,992,987 12,992,987 12,992,987 12,992,987 12,992,987 12,992,987 12,992,987Interest Received
1,023,079Cash and Investment Interest Inc 899,795 897,675 898,409 890,792 892,740 895,662 890,781 893,654 893,473 888,538 891,355 894,242 889,326 892,162 895,069440,852Rates Debtor Interest Inc 402,500 402,500 402,500 402,500 402,500 402,500 402,500 402,500 402,500 402,500 402,500 402,500 402,500 402,500 402,500
1,463,931 1,302,295 1,300,175 1,300,909 1,293,292 1,295,240 1,298,162 1,293,281 1,296,154 1,295,973 1,291,038 1,293,855 1,296,742 1,291,826 1,294,662 1,297,569Other Revenue
398,506Miscellaneous Inc 321,065 321,065 321,065 321,065 321,065 321,065 321,065 321,065 321,065 321,065 321,065 321,065 321,065 321,065 321,065
398,506 321,065 321,065 321,065 321,065 321,065 321,065 321,065 321,065 321,065 321,065 321,065 321,065 321,065 321,065 321,065
55,055,865Total 56,686,584 57,310,076 58,264,062 59,202,166 60,183,821 61,162,370 62,157,701 63,185,023 64,202,337 65,238,733 66,307,564 67,401,557 68,011,127 68,633,914 69,270,398
Page 28 of 77
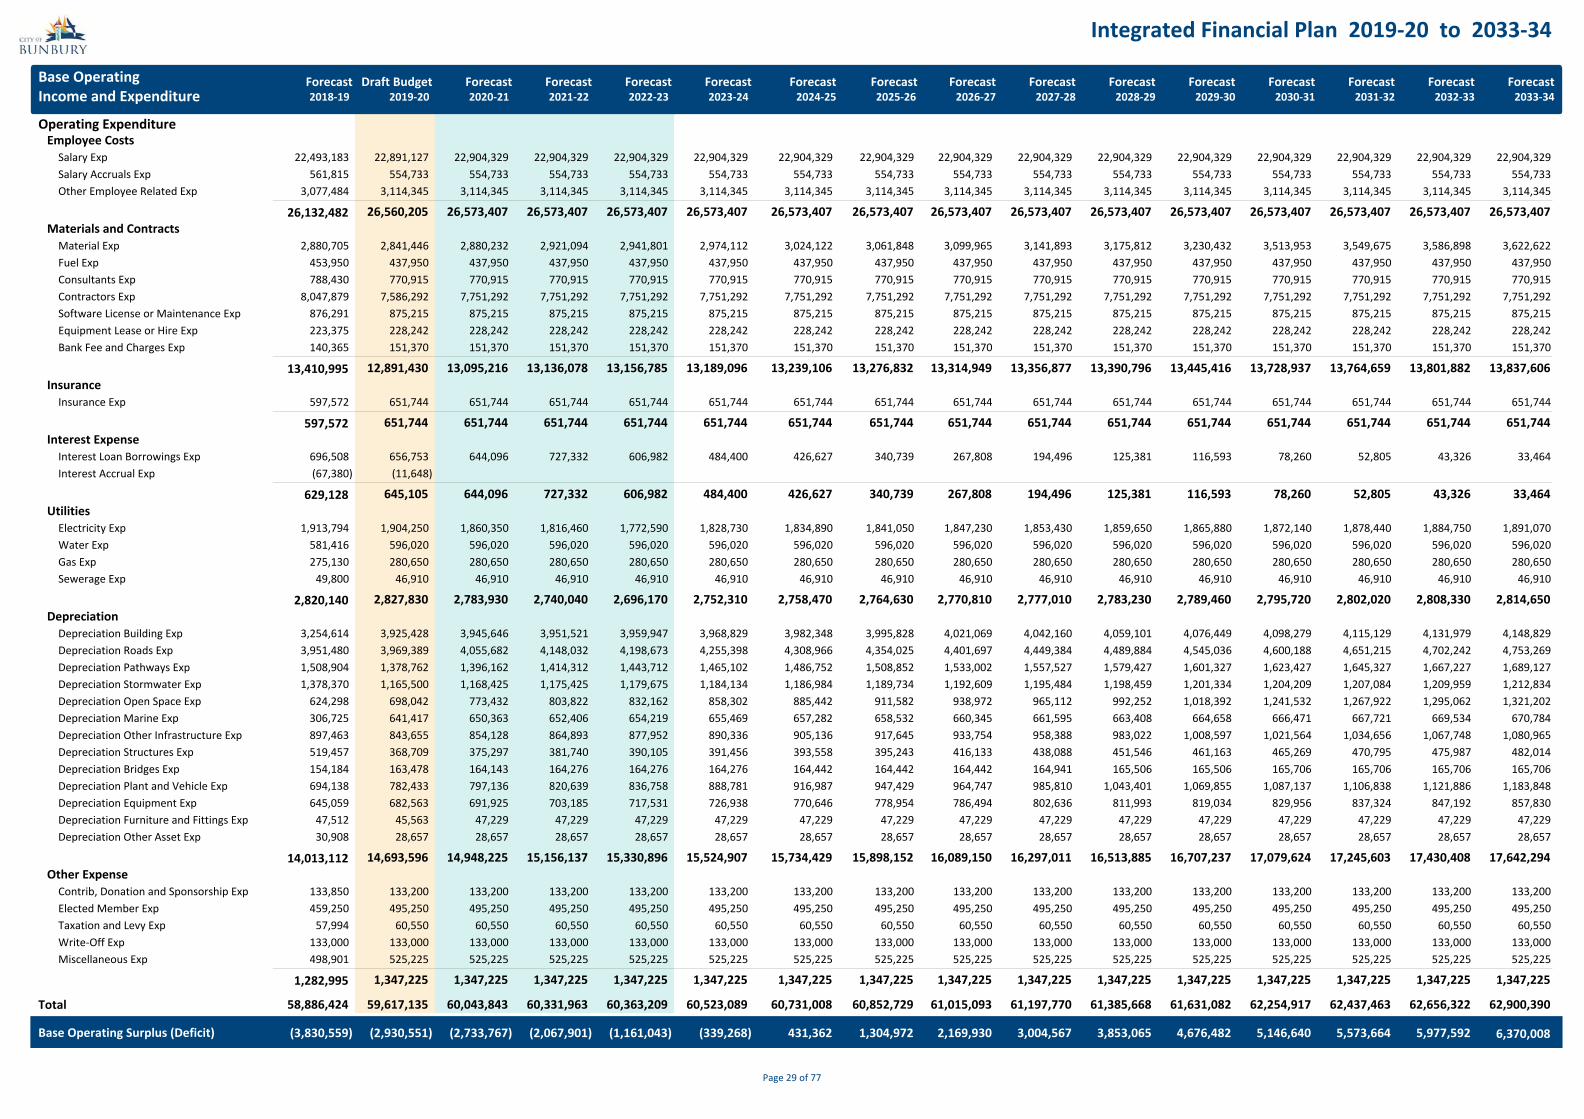
Integrated Financial Plan 2019-20 to 2033-34
Base OperatingIncome and Expenditure
Draft Budget Forecast Forecast Forecast Forecast Forecast Forecast Forecast Forecast ForecastForecast Forecast Forecast Forecast Forecast Forecast2033-342032-332031-322030-312029-302028-292027-282026-272025-262024-252023-242022-232021-222020-212019-202018-19
Operating ExpenditureEmployee Costs
22,493,183Salary Exp 22,891,127 22,904,329 22,904,329 22,904,329 22,904,329 22,904,329 22,904,329 22,904,329 22,904,329 22,904,329 22,904,329 22,904,329 22,904,329 22,904,329 22,904,329561,815Salary Accruals Exp 554,733 554,733 554,733 554,733 554,733 554,733 554,733 554,733 554,733 554,733 554,733 554,733 554,733 554,733 554,733
3,077,484Other Employee Related Exp 3,114,345 3,114,345 3,114,345 3,114,345 3,114,345 3,114,345 3,114,345 3,114,345 3,114,345 3,114,345 3,114,345 3,114,345 3,114,345 3,114,345 3,114,345
26,132,482 26,560,205 26,573,407 26,573,407 26,573,407 26,573,407 26,573,407 26,573,407 26,573,407 26,573,407 26,573,407 26,573,407 26,573,407 26,573,407 26,573,407 26,573,407Materials and Contracts
2,880,705Material Exp 2,841,446 2,880,232 2,921,094 2,941,801 2,974,112 3,024,122 3,061,848 3,099,965 3,141,893 3,175,812 3,230,432 3,513,953 3,549,675 3,586,898 3,622,622453,950Fuel Exp 437,950 437,950 437,950 437,950 437,950 437,950 437,950 437,950 437,950 437,950 437,950 437,950 437,950 437,950 437,950788,430Consultants Exp 770,915 770,915 770,915 770,915 770,915 770,915 770,915 770,915 770,915 770,915 770,915 770,915 770,915 770,915 770,915
8,047,879Contractors Exp 7,586,292 7,751,292 7,751,292 7,751,292 7,751,292 7,751,292 7,751,292 7,751,292 7,751,292 7,751,292 7,751,292 7,751,292 7,751,292 7,751,292 7,751,292876,291Software License or Maintenance Exp 875,215 875,215 875,215 875,215 875,215 875,215 875,215 875,215 875,215 875,215 875,215 875,215 875,215 875,215 875,215223,375Equipment Lease or Hire Exp 228,242 228,242 228,242 228,242 228,242 228,242 228,242 228,242 228,242 228,242 228,242 228,242 228,242 228,242 228,242140,365Bank Fee and Charges Exp 151,370 151,370 151,370 151,370 151,370 151,370 151,370 151,370 151,370 151,370 151,370 151,370 151,370 151,370 151,370
13,410,995 12,891,430 13,095,216 13,136,078 13,156,785 13,189,096 13,239,106 13,276,832 13,314,949 13,356,877 13,390,796 13,445,416 13,728,937 13,764,659 13,801,882 13,837,606Insurance
597,572Insurance Exp 651,744 651,744 651,744 651,744 651,744 651,744 651,744 651,744 651,744 651,744 651,744 651,744 651,744 651,744 651,744
597,572 651,744 651,744 651,744 651,744 651,744 651,744 651,744 651,744 651,744 651,744 651,744 651,744 651,744 651,744 651,744Interest Expense
696,508Interest Loan Borrowings Exp 656,753 644,096 727,332 606,982 484,400 426,627 340,739 267,808 194,496 125,381 116,593 78,260 52,805 43,326 33,464)(67,380Interest Accrual Exp )(11,648
629,128 645,105 644,096 727,332 606,982 484,400 426,627 340,739 267,808 194,496 125,381 116,593 78,260 52,805 43,326 33,464Utilities
1,913,794Electricity Exp 1,904,250 1,860,350 1,816,460 1,772,590 1,828,730 1,834,890 1,841,050 1,847,230 1,853,430 1,859,650 1,865,880 1,872,140 1,878,440 1,884,750 1,891,070581,416Water Exp 596,020 596,020 596,020 596,020 596,020 596,020 596,020 596,020 596,020 596,020 596,020 596,020 596,020 596,020 596,020275,130Gas Exp 280,650 280,650 280,650 280,650 280,650 280,650 280,650 280,650 280,650 280,650 280,650 280,650 280,650 280,650 280,650
49,800Sewerage Exp 46,910 46,910 46,910 46,910 46,910 46,910 46,910 46,910 46,910 46,910 46,910 46,910 46,910 46,910 46,910
2,820,140 2,827,830 2,783,930 2,740,040 2,696,170 2,752,310 2,758,470 2,764,630 2,770,810 2,777,010 2,783,230 2,789,460 2,795,720 2,802,020 2,808,330 2,814,650Depreciation
3,254,614Depreciation Building Exp 3,925,428 3,945,646 3,951,521 3,959,947 3,968,829 3,982,348 3,995,828 4,021,069 4,042,160 4,059,101 4,076,449 4,098,279 4,115,129 4,131,979 4,148,8293,951,480Depreciation Roads Exp 3,969,389 4,055,682 4,148,032 4,198,673 4,255,398 4,308,966 4,354,025 4,401,697 4,449,384 4,489,884 4,545,036 4,600,188 4,651,215 4,702,242 4,753,2691,508,904Depreciation Pathways Exp 1,378,762 1,396,162 1,414,312 1,443,712 1,465,102 1,486,752 1,508,852 1,533,002 1,557,527 1,579,427 1,601,327 1,623,427 1,645,327 1,667,227 1,689,1271,378,370Depreciation Stormwater Exp 1,165,500 1,168,425 1,175,425 1,179,675 1,184,134 1,186,984 1,189,734 1,192,609 1,195,484 1,198,459 1,201,334 1,204,209 1,207,084 1,209,959 1,212,834
624,298Depreciation Open Space Exp 698,042 773,432 803,822 832,162 858,302 885,442 911,582 938,972 965,112 992,252 1,018,392 1,241,532 1,267,922 1,295,062 1,321,202306,725Depreciation Marine Exp 641,417 650,363 652,406 654,219 655,469 657,282 658,532 660,345 661,595 663,408 664,658 666,471 667,721 669,534 670,784897,463Depreciation Other Infrastructure Exp 843,655 854,128 864,893 877,952 890,336 905,136 917,645 933,754 958,388 983,022 1,008,597 1,021,564 1,034,656 1,067,748 1,080,965519,457Depreciation Structures Exp 368,709 375,297 381,740 390,105 391,456 393,558 395,243 416,133 438,088 451,546 461,163 465,269 470,795 475,987 482,014154,184Depreciation Bridges Exp 163,478 164,143 164,276 164,276 164,276 164,442 164,442 164,442 164,941 165,506 165,506 165,706 165,706 165,706 165,706694,138Depreciation Plant and Vehicle Exp 782,433 797,136 820,639 836,758 888,781 916,987 947,429 964,747 985,810 1,043,401 1,069,855 1,087,137 1,106,838 1,121,886 1,183,848645,059Depreciation Equipment Exp 682,563 691,925 703,185 717,531 726,938 770,646 778,954 786,494 802,636 811,993 819,034 829,956 837,324 847,192 857,830
47,512Depreciation Furniture and Fittings Exp 45,563 47,229 47,229 47,229 47,229 47,229 47,229 47,229 47,229 47,229 47,229 47,229 47,229 47,229 47,22930,908Depreciation Other Asset Exp 28,657 28,657 28,657 28,657 28,657 28,657 28,657 28,657 28,657 28,657 28,657 28,657 28,657 28,657 28,657
14,013,112 14,693,596 14,948,225 15,156,137 15,330,896 15,524,907 15,734,429 15,898,152 16,089,150 16,297,011 16,513,885 16,707,237 17,079,624 17,245,603 17,430,408 17,642,294Other Expense
133,850Contrib, Donation and Sponsorship Exp 133,200 133,200 133,200 133,200 133,200 133,200 133,200 133,200 133,200 133,200 133,200 133,200 133,200 133,200 133,200459,250Elected Member Exp 495,250 495,250 495,250 495,250 495,250 495,250 495,250 495,250 495,250 495,250 495,250 495,250 495,250 495,250 495,250
57,994Taxation and Levy Exp 60,550 60,550 60,550 60,550 60,550 60,550 60,550 60,550 60,550 60,550 60,550 60,550 60,550 60,550 60,550133,000Write-Off Exp 133,000 133,000 133,000 133,000 133,000 133,000 133,000 133,000 133,000 133,000 133,000 133,000 133,000 133,000 133,000498,901Miscellaneous Exp 525,225 525,225 525,225 525,225 525,225 525,225 525,225 525,225 525,225 525,225 525,225 525,225 525,225 525,225 525,225
1,282,995 1,347,225 1,347,225 1,347,225 1,347,225 1,347,225 1,347,225 1,347,225 1,347,225 1,347,225 1,347,225 1,347,225 1,347,225 1,347,225 1,347,225 1,347,225
58,886,424Total 59,617,135 60,043,843 60,331,963 60,363,209 60,523,089 60,731,008 60,852,729 61,015,093 61,197,770 61,385,668 61,631,082 62,254,917 62,437,463 62,656,322 62,900,390
Base Operating Surplus (Deficit) )(3,830,559 )(2,930,551 )(2,733,767 )(2,067,901 )(1,161,043 )(339,268 431,362 1,304,972 2,169,930 3,004,567 3,853,065 6,370,0085,977,5925,573,6645,146,6404,676,482
Page 29 of 77

Integrated Financial Plan 2019-20 to 2033-34
Cash Backed Reserves Forecast Draft Budget2019-20
Opening Balance 2018-19
Forecast2020-21 2021-22 2022-23
ForecastForecastForecastForecastForecastForecastForecastForecastForecastForecastForecastForecastForecast2023-24 2024-25 2025-26 2026-27 2029-30 2030-312027-28 2028-29 2031-32 2032-33 2033-34
ACDI Equipment Replacement ProgramPurpose: For the purchase and upgrade of equipment used by Australian Centre for Digital Innovation
Opening Balance 734,693734,693 734,693 734,693 734,693 734,693 734,693 734,693 734,693 734,693 734,693 734,693 734,693 734,693 734,693 734,693 734,693
Transfers to Reserves (Based on Operating Surplus)
Transfers to Reserves (Specified Amount)
Transfers from Reserves (Operating and Capital Projects)Transfers from Reserves (Loan Principal and Interest)
Closing Balance 734,693 734,693 734,693 734,693 734,693 734,693 734,693 734,693 734,693 734,693 734,693 734,693 734,693 734,693 734,693 734,693
AirportPurpose: To receipt funds from airport leases for the future provision of asset management and expansion projects at the airport
Opening Balance 189,957133,278 133,278 246,618 340,447 134,451 208,635 303,006 397,570 501,356 625,142 748,928 852,714 976,500 1,100,286 1,204,072 1,327,858
Transfers to Reserves (Based on Operating Surplus) 123,786 123,786 123,786 123,786 123,786 123,786 123,786 123,786 123,786 123,786 123,786 123,786 123,786 123,786 123,786 123,786
Transfers to Reserves (Specified Amount)
Transfers from Reserves (Operating and Capital Projects) )(36,819 )(37,000 )(300,000 )(20,000 )(20,000 )(20,000 )(20,000Transfers from Reserves (Loan Principal and Interest) )(30,288 )(30,125 )(29,957 )(29,782 )(29,602 )(29,415 )(29,222
Closing Balance 189,957 246,618 340,447 134,451 208,635 303,006 397,570 501,356 625,142 748,928 852,714 976,500 1,100,286 1,204,072 1,327,858 1,451,644
Asset Management and RenewalPurpose: To provide funding for future asset management/renewal programs/projects
Opening Balance 580,4484,687,042 4,687,042 1,255,448 675,448 779,423 1,292,237 1,918,716 2,313,861 2,357,649 2,355,178 2,536,670 3,007,311 1,672,407 487,389 252,371 267,353
Transfers to Reserves (Based on Operating Surplus) 675,000 50,000 100,000 50,000 750,000 1,350,000
Transfers to Reserves (Specified Amount) 223,000 203,975 412,814 626,479 845,145 1,068,788 1,297,529 1,531,492 1,770,641 2,015,096 2,264,982 2,264,982 2,264,982 2,264,982
Transfers from Reserves (Operating and Capital Projects) )(4,329,594 )(580,000 )(150,000 )(450,000 )(1,075,000 )(1,300,000 )(1,350,000 )(1,300,000 )(3,350,000 )(3,450,000 )(2,500,000 )(3,000,000 )(2,000,000Transfers from Reserves (Loan Principal and Interest)
Closing Balance 580,448 1,255,448 675,448 779,423 1,292,237 1,918,716 2,313,861 2,357,649 2,355,178 2,536,670 3,007,311 1,672,407 487,389 252,371 267,353 1,882,335
Building Restoration and MaintenancePurpose: For the purchase and upgrade of Council Buildings
Opening Balance 1,163,9872,640,254 2,640,254 1,163,987 138,987 987 987 987 987 987 987 987 987 987 987 987 987
Transfers to Reserves (Based on Operating Surplus)
Transfers to Reserves (Specified Amount) 1,168,733
Transfers from Reserves (Operating and Capital Projects) )(2,645,000 )(1,025,000 )(138,000Transfers from Reserves (Loan Principal and Interest)
Closing Balance 1,163,987 1,163,987 138,987 987 987 987 987 987 987 987 987 987 987 987 987 987
Bunbury Museum and Heritage CentrePurpose: To provide funding for the Museum
Opening Balance 3,8503,850 3,850 3,850 3,850 3,850 3,850 3,850 3,850 3,850 3,850 3,850 3,850 3,850 3,850 3,850 3,850
Transfers to Reserves (Based on Operating Surplus)
Transfers to Reserves (Specified Amount)
Transfers from Reserves (Operating and Capital Projects)Transfers from Reserves (Loan Principal and Interest)
Closing Balance 3,850 3,850 3,850 3,850 3,850 3,850 3,850 3,850 3,850 3,850 3,850 3,850 3,850 3,850 3,850 3,850
Page 30 of 77

Integrated Financial Plan 2019-20 to 2033-34
Cash Backed Reserves Forecast Draft Budget2019-20
Opening Balance 2018-19
Forecast2020-21 2021-22 2022-23
ForecastForecastForecastForecastForecastForecastForecastForecastForecastForecastForecastForecastForecast2023-24 2024-25 2025-26 2026-27 2029-30 2030-312027-28 2028-29 2031-32 2032-33 2033-34
Canal ManagementPurpose: To receipt specified area rating from the Pelican Point Canal Development to provide for the ongoing management and maintenance of the Canal residential and commercial area
Opening Balance 393,609537,304 537,304 31,881 60,636 99,879 129,614 169,846 200,580 241,821 273,574 315,845 348,639 391,961 425,816 470,210 505,148
Transfers to Reserves (Based on Operating Surplus) 46,305 48,272 48,755 49,243 49,735 50,232 50,734 51,241 51,753 52,271 52,794 53,322 53,855 54,394 54,938 55,487
Transfers to Reserves (Specified Amount)
Transfers from Reserves (Operating and Capital Projects) )(190,000 )(410,000 )(20,000 )(10,000 )(20,000 )(10,000 )(20,000 )(10,000 )(20,000 )(10,000 )(20,000 )(10,000 )(20,000 )(10,000 )(20,000 )(10,000Transfers from Reserves (Loan Principal and Interest)
Closing Balance 393,609 31,881 60,636 99,879 129,614 169,846 200,580 241,821 273,574 315,845 348,639 391,961 425,816 470,210 505,148 550,635
City Arts CollectionPurpose: For the purchase and upgrade of Council's Art Collection
Opening Balance 46,36846,368 46,368 26,368 26,368 26,368 26,368 26,368 26,368 26,368 26,368 26,368 26,368 26,368 26,368 26,368 26,368
Transfers to Reserves (Based on Operating Surplus)
Transfers to Reserves (Specified Amount)
Transfers from Reserves (Operating and Capital Projects) )(20,000Transfers from Reserves (Loan Principal and Interest)
Closing Balance 46,368 26,368 26,368 26,368 26,368 26,368 26,368 26,368 26,368 26,368 26,368 26,368 26,368 26,368 26,368 26,368
City Growth and Major DevelopmentPurpose: To provide funds for the development and implementation of new major projects
Opening Balance - 500,000 766,223 1,243,407 1,936,450 2,979,594 4,377,304 6,134,144 8,383,951 11,130,744 15,670,304 20,450,901 26,022,813 31,709,562
Transfers to Reserves (Based on Operating Surplus) 500,000 500,000 500,000 500,000 500,000 629,169 757,751 885,721 1,142,224 1,397,478 2,943,121 2,931,514 3,306,930 3,421,767 3,406,262
Transfers to Reserves (Specified Amount) 203,975 412,814 626,479 845,145 1,068,788 1,297,529 1,531,492 1,770,641 2,015,096 2,264,982 2,264,982 2,264,982 2,264,982
Transfers from Reserves (Operating and Capital Projects) )(500,000Transfers from Reserves (Loan Principal and Interest) )(437,752 )(435,630 )(433,436 )(431,170 )(428,829 )(426,410 )(423,909 )(421,326 )(418,657 )(415,899
Closing Balance - 500,000 766,223 1,243,407 1,936,450 2,979,594 4,377,304 6,134,144 8,383,951 11,130,744 15,670,304 20,450,901 26,022,813 31,709,562 37,380,806
City of Bunbury General ParkingPurpose: To fund motor vehicle parking requirements within the City of Bunbury and promotion of the CBD
Opening Balance 7,647,7198,284,129 8,284,129 7,562,925 7,592,271 7,287,583 7,365,520 7,482,383 7,287,168 7,402,072 7,394,849 7,197,445 7,310,106 7,425,584 7,228,949 7,342,398 7,458,683
Transfers to Reserves (Based on Operating Surplus) )(77,614 25,432 23,312 24,046 16,429 18,377 21,299 16,418 19,291 19,110 14,175 16,992 19,879 14,963 17,799 20,706
Transfers to Reserves (Specified Amount) 123,486 123,486 123,486 123,486 123,486 123,486 123,486 123,486 123,486 123,486 123,486 123,486 123,486 123,486 123,486 123,486
Transfers from Reserves (Operating and Capital Projects) )(487,365 )(40,000 )(80,000 )(415,000 )(25,000 )(25,000 )(340,000 )(25,000 )(150,000 )(340,000 )(25,000 )(25,000 )(340,000 )(25,000 )(25,000 )(340,000Transfers from Reserves (Loan Principal and Interest) )(194,917 )(193,712 )(37,452 )(37,220 )(36,978
Closing Balance 7,647,719 7,562,925 7,592,271 7,287,583 7,365,520 7,482,383 7,287,168 7,402,072 7,394,849 7,197,445 7,310,106 7,425,584 7,228,949 7,342,398 7,458,683 7,262,875
College Grove Subdivision Amended Joint VenturePurpose: To provide funding for the development of land relating to the amended College Grove joint venture
Opening Balance 8,95728,107 28,107 9,807 10,657 11,507 12,357 13,207 14,057 14,907 15,757 16,607 17,457 18,307 19,157 20,007 20,857
Transfers to Reserves (Based on Operating Surplus) 850 850 850 850 850 850 850 850 850 850 850 850 850 850 850 850
Transfers to Reserves (Specified Amount)
Transfers from Reserves (Operating and Capital Projects) )(20,000Transfers from Reserves (Loan Principal and Interest)
Closing Balance 8,957 9,807 10,657 11,507 12,357 13,207 14,057 14,907 15,757 16,607 17,457 18,307 19,157 20,007 20,857 21,707
Page 31 of 77
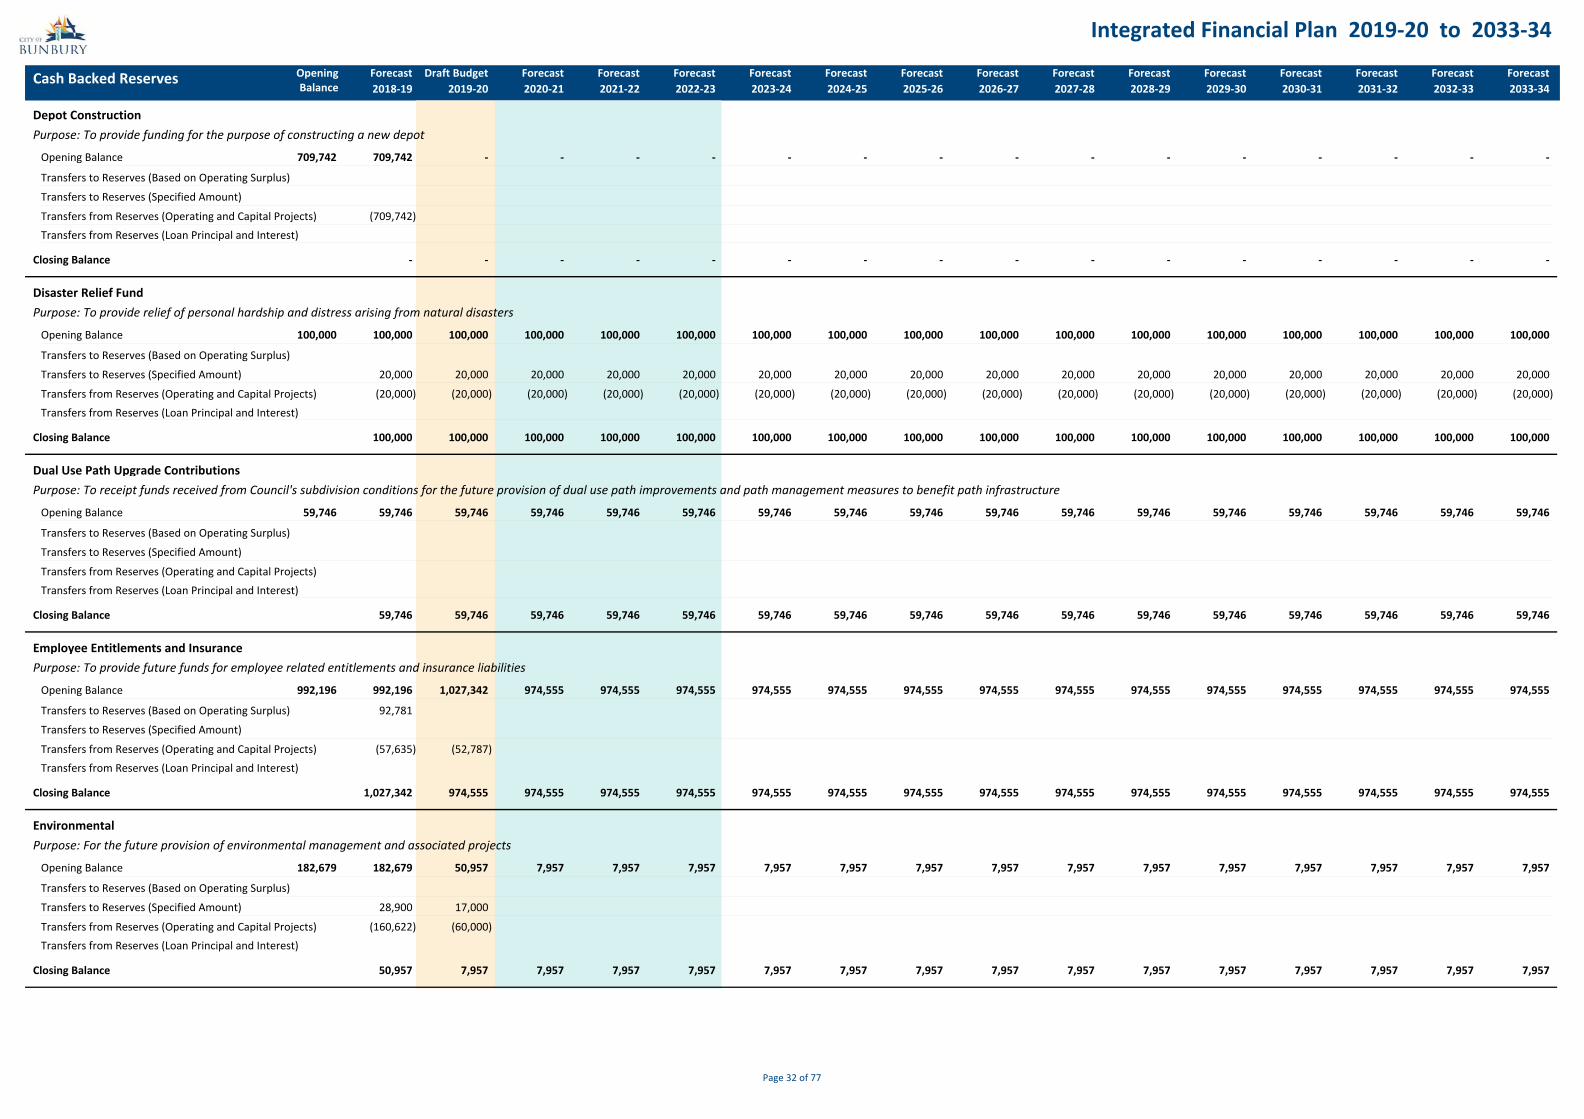
Integrated Financial Plan 2019-20 to 2033-34
Cash Backed Reserves Forecast Draft Budget2019-20
Opening Balance 2018-19
Forecast2020-21 2021-22 2022-23
ForecastForecastForecastForecastForecastForecastForecastForecastForecastForecastForecastForecastForecast2023-24 2024-25 2025-26 2026-27 2029-30 2030-312027-28 2028-29 2031-32 2032-33 2033-34
Depot ConstructionPurpose: To provide funding for the purpose of constructing a new depot
Opening Balance -709,742 709,742 - - - - - - - - - - - - - -
Transfers to Reserves (Based on Operating Surplus)
Transfers to Reserves (Specified Amount)
Transfers from Reserves (Operating and Capital Projects) )(709,742Transfers from Reserves (Loan Principal and Interest)
Closing Balance - - - - - - - - - - - - - - - -
Disaster Relief FundPurpose: To provide relief of personal hardship and distress arising from natural disasters
Opening Balance 100,000100,000 100,000 100,000 100,000 100,000 100,000 100,000 100,000 100,000 100,000 100,000 100,000 100,000 100,000 100,000 100,000
Transfers to Reserves (Based on Operating Surplus)
Transfers to Reserves (Specified Amount) 20,000 20,000 20,000 20,000 20,000 20,000 20,000 20,000 20,000 20,000 20,000 20,000 20,000 20,000 20,000 20,000
Transfers from Reserves (Operating and Capital Projects) )(20,000 )(20,000 )(20,000 )(20,000 )(20,000 )(20,000 )(20,000 )(20,000 )(20,000 )(20,000 )(20,000 )(20,000 )(20,000 )(20,000 )(20,000 )(20,000Transfers from Reserves (Loan Principal and Interest)
Closing Balance 100,000 100,000 100,000 100,000 100,000 100,000 100,000 100,000 100,000 100,000 100,000 100,000 100,000 100,000 100,000 100,000
Dual Use Path Upgrade ContributionsPurpose: To receipt funds received from Council's subdivision conditions for the future provision of dual use path improvements and path management measures to benefit path infrastructure
Opening Balance 59,74659,746 59,746 59,746 59,746 59,746 59,746 59,746 59,746 59,746 59,746 59,746 59,746 59,746 59,746 59,746 59,746
Transfers to Reserves (Based on Operating Surplus)
Transfers to Reserves (Specified Amount)
Transfers from Reserves (Operating and Capital Projects)Transfers from Reserves (Loan Principal and Interest)
Closing Balance 59,746 59,746 59,746 59,746 59,746 59,746 59,746 59,746 59,746 59,746 59,746 59,746 59,746 59,746 59,746 59,746
Employee Entitlements and InsurancePurpose: To provide future funds for employee related entitlements and insurance liabilities
Opening Balance 1,027,342992,196 992,196 974,555 974,555 974,555 974,555 974,555 974,555 974,555 974,555 974,555 974,555 974,555 974,555 974,555 974,555
Transfers to Reserves (Based on Operating Surplus) 92,781
Transfers to Reserves (Specified Amount)
Transfers from Reserves (Operating and Capital Projects) )(57,635 )(52,787Transfers from Reserves (Loan Principal and Interest)
Closing Balance 1,027,342 974,555 974,555 974,555 974,555 974,555 974,555 974,555 974,555 974,555 974,555 974,555 974,555 974,555 974,555 974,555
EnvironmentalPurpose: For the future provision of environmental management and associated projects
Opening Balance 50,957182,679 182,679 7,957 7,957 7,957 7,957 7,957 7,957 7,957 7,957 7,957 7,957 7,957 7,957 7,957 7,957
Transfers to Reserves (Based on Operating Surplus)
Transfers to Reserves (Specified Amount) 28,900 17,000
Transfers from Reserves (Operating and Capital Projects) )(160,622 )(60,000Transfers from Reserves (Loan Principal and Interest)
Closing Balance 50,957 7,957 7,957 7,957 7,957 7,957 7,957 7,957 7,957 7,957 7,957 7,957 7,957 7,957 7,957 7,957
Page 32 of 77

Integrated Financial Plan 2019-20 to 2033-34
Cash Backed Reserves Forecast Draft Budget2019-20
Opening Balance 2018-19
Forecast2020-21 2021-22 2022-23
ForecastForecastForecastForecastForecastForecastForecastForecastForecastForecastForecastForecastForecast2023-24 2024-25 2025-26 2026-27 2029-30 2030-312027-28 2028-29 2031-32 2032-33 2033-34
Hay Park Regional Athletics TrackPurpose: To retain funds for the future replacement of the regional athletics track
Opening Balance 510,665440,665 440,665 610,665 10,665 110,665 210,665 310,665 410,665 510,665 610,665 710,665 810,665 910,665 10,665 110,665 210,665
Transfers to Reserves (Based on Operating Surplus)
Transfers to Reserves (Specified Amount) 70,000 100,000 100,000 100,000 100,000 100,000 100,000 100,000 100,000 100,000 100,000 100,000 100,000 100,000 100,000 100,000
Transfers from Reserves (Operating and Capital Projects) )(700,000 )(1,000,000Transfers from Reserves (Loan Principal and Interest)
Closing Balance 510,665 610,665 10,665 110,665 210,665 310,665 410,665 510,665 610,665 710,665 810,665 910,665 10,665 110,665 210,665 310,665
Heritage Building MaintenancePurpose: To provide funding for the maintenance of heritage buildings
Opening Balance 27,50027,500 27,500 27,500 27,500 27,500 27,500 27,500 27,500 27,500 27,500 27,500 27,500 27,500 27,500 27,500 27,500
Transfers to Reserves (Based on Operating Surplus)
Transfers to Reserves (Specified Amount)
Transfers from Reserves (Operating and Capital Projects)Transfers from Reserves (Loan Principal and Interest)
Closing Balance 27,500 27,500 27,500 27,500 27,500 27,500 27,500 27,500 27,500 27,500 27,500 27,500 27,500 27,500 27,500 27,500
Infrastructure DevelopmentPurpose: To receipt funds specifically raised from the annual rates levied for the renewal and upgrade of existing infrastructure assets
Opening Balance 432,608557,739 557,739 467,838 446,671 338,504 30,670 24,503 698,336 847,169 96,002 44,835 193,668 792,501 11,334 1,110,167 1,659,000
Transfers to Reserves (Based on Operating Surplus)
Transfers to Reserves (Specified Amount) 1,107,253 1,500,230 1,898,833 1,898,833 1,898,833 1,898,833 1,898,833 1,898,833 1,898,833 1,898,833 1,898,833 1,898,833 1,898,833 1,898,833 1,898,833 1,898,833
Transfers from Reserves (Operating and Capital Projects) )(1,232,384 )(1,465,000 )(1,920,000 )(2,007,000 )(2,206,667 )(1,905,000 )(1,225,000 )(1,750,000 )(2,650,000 )(1,950,000 )(1,750,000 )(1,300,000 )(2,680,000 )(800,000 )(1,350,000Transfers from Reserves (Loan Principal and Interest)
Closing Balance 432,608 467,838 446,671 338,504 30,670 24,503 698,336 847,169 96,002 44,835 193,668 792,501 11,334 1,110,167 1,659,000 3,557,833
Land Subdivision and DevelopmentPurpose: To provide funding for land subdivision development
Opening Balance 340,723340,723 340,723 340,723 340,723 340,723 340,723 340,723 340,723 340,723 340,723 340,723 340,723 340,723 340,723 340,723 340,723
Transfers to Reserves (Based on Operating Surplus)
Transfers to Reserves (Specified Amount)
Transfers from Reserves (Operating and Capital Projects)Transfers from Reserves (Loan Principal and Interest)
Closing Balance 340,723 340,723 340,723 340,723 340,723 340,723 340,723 340,723 340,723 340,723 340,723 340,723 340,723 340,723 340,723 340,723
Local Planning Policy FrameworkPurpose: To provide funding for Local Planning Policy Framework
Opening Balance 69,74888,255 88,255 119,748 69,748 119,748 69,748 14,748 14,748 64,748 114,748 14,748 14,748 14,748 64,748 114,748 64,748
Transfers to Reserves (Based on Operating Surplus)
Transfers to Reserves (Specified Amount) 50,000 50,000 50,000 50,000 50,000 50,000 50,000 50,000 50,000 50,000 50,000 50,000 50,000 50,000 50,000 50,000
Transfers from Reserves (Operating and Capital Projects) )(68,507 )(100,000 )(100,000 )(105,000 )(50,000 )(150,000 )(50,000 )(50,000 )(100,000Transfers from Reserves (Loan Principal and Interest)
Closing Balance 69,748 119,748 69,748 119,748 69,748 14,748 14,748 64,748 114,748 14,748 14,748 14,748 64,748 114,748 64,748 114,748
Page 33 of 77

Integrated Financial Plan 2019-20 to 2033-34
Cash Backed Reserves Forecast Draft Budget2019-20
Opening Balance 2018-19
Forecast2020-21 2021-22 2022-23
ForecastForecastForecastForecastForecastForecastForecastForecastForecastForecastForecastForecastForecast2023-24 2024-25 2025-26 2026-27 2029-30 2030-312027-28 2028-29 2031-32 2032-33 2033-34
Meat InspectionPurpose: To make funds available to enable the monitoring of annual meat inspection income and expenditure to ensure as far as possible the service is carried out on a self balancing basis
Opening Balance 158,768163,554 163,554 157,754 156,740 155,726 154,712 153,698 152,684 151,670 150,656 149,642 148,628 147,614 146,600 145,586 144,572
Transfers to Reserves (Based on Operating Surplus) )(4,786 )(1,014 )(1,014 )(1,014 )(1,014 )(1,014 )(1,014 )(1,014 )(1,014 )(1,014 )(1,014 )(1,014 )(1,014 )(1,014 )(1,014 )(1,014
Transfers to Reserves (Specified Amount)
Transfers from Reserves (Operating and Capital Projects)Transfers from Reserves (Loan Principal and Interest)
Closing Balance 158,768 157,754 156,740 155,726 154,712 153,698 152,684 151,670 150,656 149,642 148,628 147,614 146,600 145,586 144,572 143,558
Planning and Development Act Section 152Purpose: To receipt income from the sale of Planning and Development Act Section 152 Public Open Space Reserves to fund other public open space developments in accordance with the Planning and Development Act
Opening Balance 703,146678,325 678,325 703,146 703,146 703,146 703,146 703,146 703,146 703,146 703,146 703,146 703,146 703,146 703,146 703,146 703,146
Transfers to Reserves (Based on Operating Surplus) 24,821
Transfers to Reserves (Specified Amount)
Transfers from Reserves (Operating and Capital Projects)Transfers from Reserves (Loan Principal and Interest)
Closing Balance 703,146 703,146 703,146 703,146 703,146 703,146 703,146 703,146 703,146 703,146 703,146 703,146 703,146 703,146 703,146 703,146
Plant and EquipmentPurpose: To provide for the purchase of plant and equipment, including office furniture, office equipment, computer hardware and software
Opening Balance 314,170417,357 417,357 64,170 170 170 170 170 170 170 170 170 170 170 170 170 170
Transfers to Reserves (Based on Operating Surplus)
Transfers to Reserves (Specified Amount)
Transfers from Reserves (Operating and Capital Projects) )(103,187 )(250,000 )(64,000Transfers from Reserves (Loan Principal and Interest)
Closing Balance 314,170 64,170 170 170 170 170 170 170 170 170 170 170 170 170 170 170
Public ArtPurpose: To provide funding for the installation of artworks in public spaces
Opening Balance 73,53673,536 73,536 98,536 123,536 148,536 173,536 198,536 223,536 248,536 273,536 298,536 323,536 348,536 373,536 398,536 423,536
Transfers to Reserves (Based on Operating Surplus)
Transfers to Reserves (Specified Amount) 25,000 25,000 25,000 25,000 25,000 25,000 25,000 25,000 25,000 25,000 25,000 25,000 25,000 25,000 25,000
Transfers from Reserves (Operating and Capital Projects)Transfers from Reserves (Loan Principal and Interest)
Closing Balance 73,536 98,536 123,536 148,536 173,536 198,536 223,536 248,536 273,536 298,536 323,536 348,536 373,536 398,536 423,536 448,536
Refuse Collection and Waste MinimisationPurpose: To receipt any annual surplus from Council's waste collection / minimisation program to provide future funding for Council's sanitation program
Opening Balance 1,416,3942,996,047 2,996,047 1,506,139 1,905,486 2,116,509 2,287,661 747,102 1,047,245 1,282,945 1,830,402 2,031,495 674,036 1,180,048 1,592,385 2,304,950 2,702,604
Transfers to Reserves (Based on Operating Surplus) 665,616 647,536 697,506 747,476 797,446 847,416 847,386 847,356 847,326 847,296 847,266 847,236 847,206 847,176 847,146 847,116
Transfers to Reserves (Specified Amount)
Transfers from Reserves (Operating and Capital Projects) )(2,058,112 )(371,878 )(113,188 )(352,456 )(443,302 )(2,206,020 )(366,359 )(432,877 )(121,232 )(468,744 )(2,204,725 )(341,224 )(434,869 )(134,611 )(449,492 )(2,473,084Transfers from Reserves (Loan Principal and Interest) )(187,157 )(185,913 )(184,971 )(183,997 )(182,992 )(181,955 )(180,884 )(178,779 )(178,637 )(177,459
Closing Balance 1,416,394 1,506,139 1,905,486 2,116,509 2,287,661 747,102 1,047,245 1,282,945 1,830,402 2,031,495 674,036 1,180,048 1,592,385 2,304,950 2,702,604 1,076,636
Page 34 of 77

Integrated Financial Plan 2019-20 to 2033-34
Cash Backed Reserves Forecast Draft Budget2019-20
Opening Balance 2018-19
Forecast2020-21 2021-22 2022-23
ForecastForecastForecastForecastForecastForecastForecastForecastForecastForecastForecastForecastForecast2023-24 2024-25 2025-26 2026-27 2029-30 2030-312027-28 2028-29 2031-32 2032-33 2033-34
Road Upgrade ContributionsPurpose: To receipt funds received from Council's subdivision conditions for the future provision of road improvements and traffic management measures to benefit road infrastructure
Opening Balance 171,704171,704 171,704 171,704 171,704 171,704 171,704 171,704 171,704 171,704 171,704 171,704 171,704 171,704 171,704 171,704 171,704
Transfers to Reserves (Based on Operating Surplus)
Transfers to Reserves (Specified Amount)
Transfers from Reserves (Operating and Capital Projects)Transfers from Reserves (Loan Principal and Interest)
Closing Balance 171,704 171,704 171,704 171,704 171,704 171,704 171,704 171,704 171,704 171,704 171,704 171,704 171,704 171,704 171,704 171,704
Town Planning Scheme Land Acquisition and CompensationPurpose: For land acquisitions and compensation payable in respect to the implementation of Council's Town Planning schemes
Opening Balance 132,505132,505 132,505 132,505 132,505 132,505 132,505 132,505 132,505 132,505 132,505 132,505 132,505 132,505 132,505 132,505 132,505
Transfers to Reserves (Based on Operating Surplus)
Transfers to Reserves (Specified Amount)
Transfers from Reserves (Operating and Capital Projects)Transfers from Reserves (Loan Principal and Interest)
Closing Balance 132,505 132,505 132,505 132,505 132,505 132,505 132,505 132,505 132,505 132,505 132,505 132,505 132,505 132,505 132,505 132,505
WithersPurpose: To provide funding for the implementation of the Withers Action Plan
Opening Balance 231,748459,748 459,748 29,411 29,411 29,411 29,411 29,411 29,411 29,411 29,411 29,411 29,411 29,411 29,411 29,411 29,411
Transfers to Reserves (Based on Operating Surplus)
Transfers to Reserves (Specified Amount)
Transfers from Reserves (Operating and Capital Projects) )(228,000 )(202,337Transfers from Reserves (Loan Principal and Interest)
Closing Balance 231,748 29,411 29,411 29,411 29,411 29,411 29,411 29,411 29,411 29,411 29,411 29,411 29,411 29,411 29,411 29,411
16,607,674 15,343,620 15,382,069 16,492,077Total - Cash Backed Reserves 16,590,848 16,586,175 19,053,359 21,314,157 23,187,968 25,762,682 28,145,567 32,862,490 35,225,081 42,809,838 49,807,901 57,515,293
Page 35 of 77
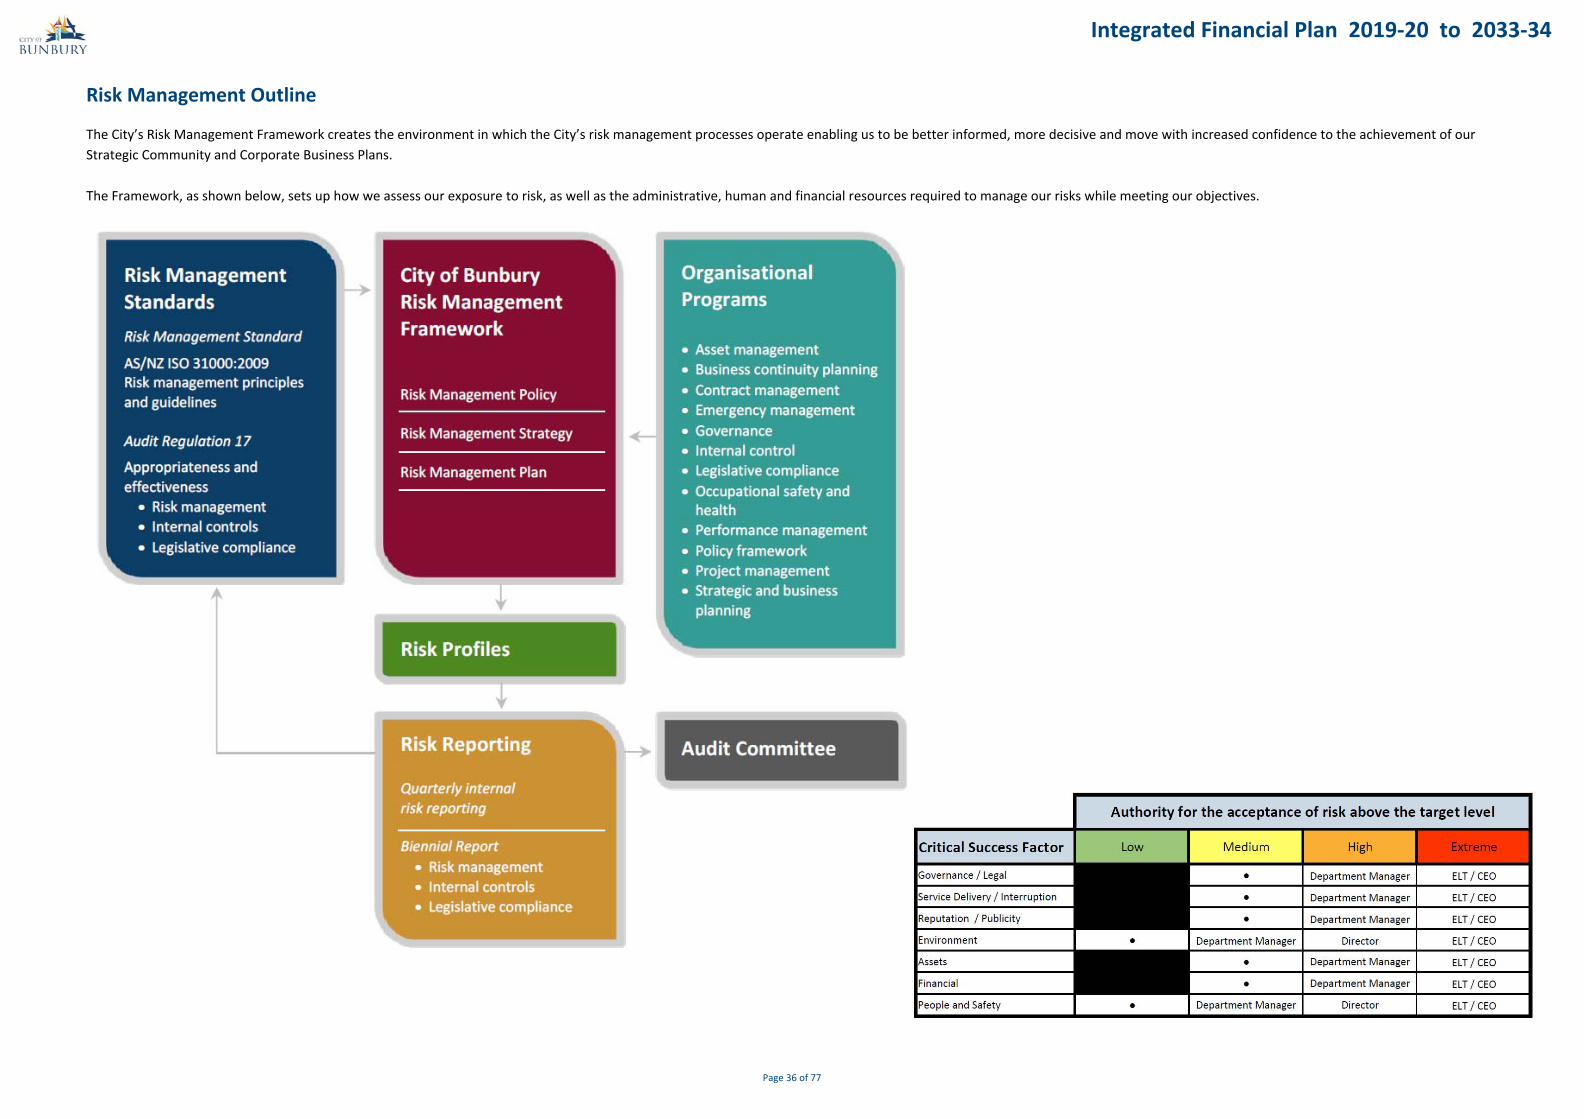
Integrated Financial Plan 2019-20 to 2033-34
Risk Management Outline
The City’s Risk Management Framework creates the environment in which the City’s risk management processes operate enabling us to be better informed, more decisive and move with increased confidence to the achievement of our Strategic Community and Corporate Business Plans.
The Framework, as shown below, sets up how we assess our exposure to risk, as well as the administrative, human and financial resources required to manage our risks while meeting our objectives.
Page 36 of 77

Integrated Financial Plan 2019‐20 to 2033‐34
Category / Rating Insignificant Minor Moderate Significant Severe
*
Governance/ Legal
Negligible breach of regulation, legislation, policy, or process that are detected early, does not require reporting.
Contract – insignificant legal issues or non‐compliance, with no effect on contract performance
Minor regulatory / legislation breaches with potential minor fines which does not require reporting to regulators
Contract – communication between both parties exposing minor concern with supply of goods / services, easily rectified
Regulatory / legislation breaches causing internal investigation / report to authority and prosecution and moderate fines
Contract – ongoing contractual issues which may become a substantial breach
Breach of regulation or legislation resulting in external investigation or third party actions resulting in litigation
Contract – termination of contract for default by either party
Regulatory / legislation breaches causing very serious litigation, including major class action
Contract – claim for damages or loss of profit / reputation as a result of termination
*
Service Delivery/ Interruption
Negligible impact on the effectiveness of the City's processes and / or any backlog cleared in < 2 hours
Brief disruption of important service area, noticeable effect to non‐crucial service area and / or backlog cleared in 3 hours – 1 day
Major effect to an important service area for a short period, brief impact on multiple areas and / or backlog cleared within 1 day – 2 weeks
Complete loss of an important service area for a short period and / or issue resolved within 3 – 4 weeks
Major loss including several important areas of service and / or for a protracted period >4 weeks
*Reputation / Publicity
Minor unsubstantiated publicity or damage to reputation to a small audience, complaint from individual / small group – gossip, limited social media exposure
Minor damage to reputation to a small audience, complaint from a large group of people – mainstream media, social media seen by local community
Damage to reputation to a specific audience, may not have significant long‐term or community effects – State‐wide mainstream media, social media item taken up by people outside City
Local publicity of a major and persistent nature, affecting the perception / standing with the community – Australia‐wide mainstream media, social media taken up by large number of people outside City
Substantial damage to public confidence leading to sustained compromise in the achievement of objectives, public embarrassment, high widespread multiple news profile, likely to lead to dismissal of Council / Councillors, or staff – World‐wide mainstream media, widespread social media item taken up by vast numbers of people outside City
Environment
Negligible impacts affecting one site; disturbance to individual native plants
Potential breach of state environmental law – negotiated / no management of issue
Localised impacts; resolvable; small scale clearing of bushland; small scale discharge of pollutants to waters (10's to 100's of L)
Breach of state environmental law – no litigation, warning issued by state, negotiated management of issue
Localised impacts; general resolvable; significant discharge of pollutants to waterways (1,000's of L); clearing of 10's of hectares of bushland
Breach of state environmental law – litigation
Widespread and / or acute impacts; may or may not be entirely resolvable; significant impact on listed threatened species; clearing of a large amount of bushland (100's of hectares)
Breach of federal environmental law ‐ litigation without jail time for perpetrator
Widespread and / or acute impacts; not resolvable; highly significant impact on listed threatened species
Breach of federal environmental law ‐ litigation with jail time for perpetrator
AssetsDamage where repairs are required however facility / infrastructure / network / hardware is still operational
Minor loss / damage, repairs required
<2% of asset value
Short to medium term loss of key assets, infrastructure and / or IT network / hardware
2% – 5% of asset value
Widespread, short to medium term loss of key assets, infrastructure and / or IT network / hardware
5% – 15% of asset value
Widespread, long‐term loss of substantial key assets, infrastructure and / or IT network / hardware
>15% of asset value
FinancialLess than $10,000
Project deviation <2% from budget
$10,000 – $50,000
Project deviation 2% – 5% from budget
$50,000 – $1M
Project deviation 5% – 14% from budget
$1M – $5M
Project deviation 15% – 20%Greater than $5M
People and Safety
Some isolated staff dissatisfaction
Minor injuries, first aid treatment may be needed; Full recovery 1 – 3 days
General staff morale problems and increase in turnover
Reversible injury or disability which requires medical treatment; Full recovery 1 – 3 weeks
Widespread staff morale problems and high turnover including key organisation roles
Serious reversible injury or disability requiring ongoing medical treatment or hospitalisation and / or lost timely; Full recovery 1 – 6 months
High turnover or experience / key staff, City not perceived as employer of choice
Single fatality and / or multiple irreversible disabilities
Key positions unable to be filled
Multiple fatalities and significant irreversible disabilities
Timeframe
Has ithappened atCOB in the
last 5 years?
Has ithappened at other
organisations in the last 5 years?
expected to occur in most circumstances or occurs
regularly – multiple times per year
or incident is clearly imminent
regularlyregularly or multiple
times at other organisations
Low Medium High Extreme Extreme
happens fairly regularly,probably occursonce every year
several timesonce at multiple
organisations Low Medium High High Extreme
occurs occasionallyor may occur
every five (5) yearsa few times
multiple times at one other organisation Low Medium Medium High High
occurs infrequently or is not likely to occur –
maybe once in five (5) toten (10) years
onceonce at one other
organisation Low Low Medium Medium High
only occurs in exceptional circumstances–
once every ten (10) years or greater
never never Low Low Low Medium Medium
CONSEQUENCE
Timeframes and Corporate History
RISK RATING
Use this matrix for all risk management (this includes decision‐making at all levels, projects and planning activities).
For further guidance or assistance with your risk management activities, please contact the Governance Team.
More information on how to perform a risk assessment may be found in the Risk Management Guidelines (available from the Governance Team and on the intranet).
Guidance
Likelihood
ALMOSTCERTAIN
LIKELY
POSSIBLE
UNLIKELY
RARE
Page 37 of 77
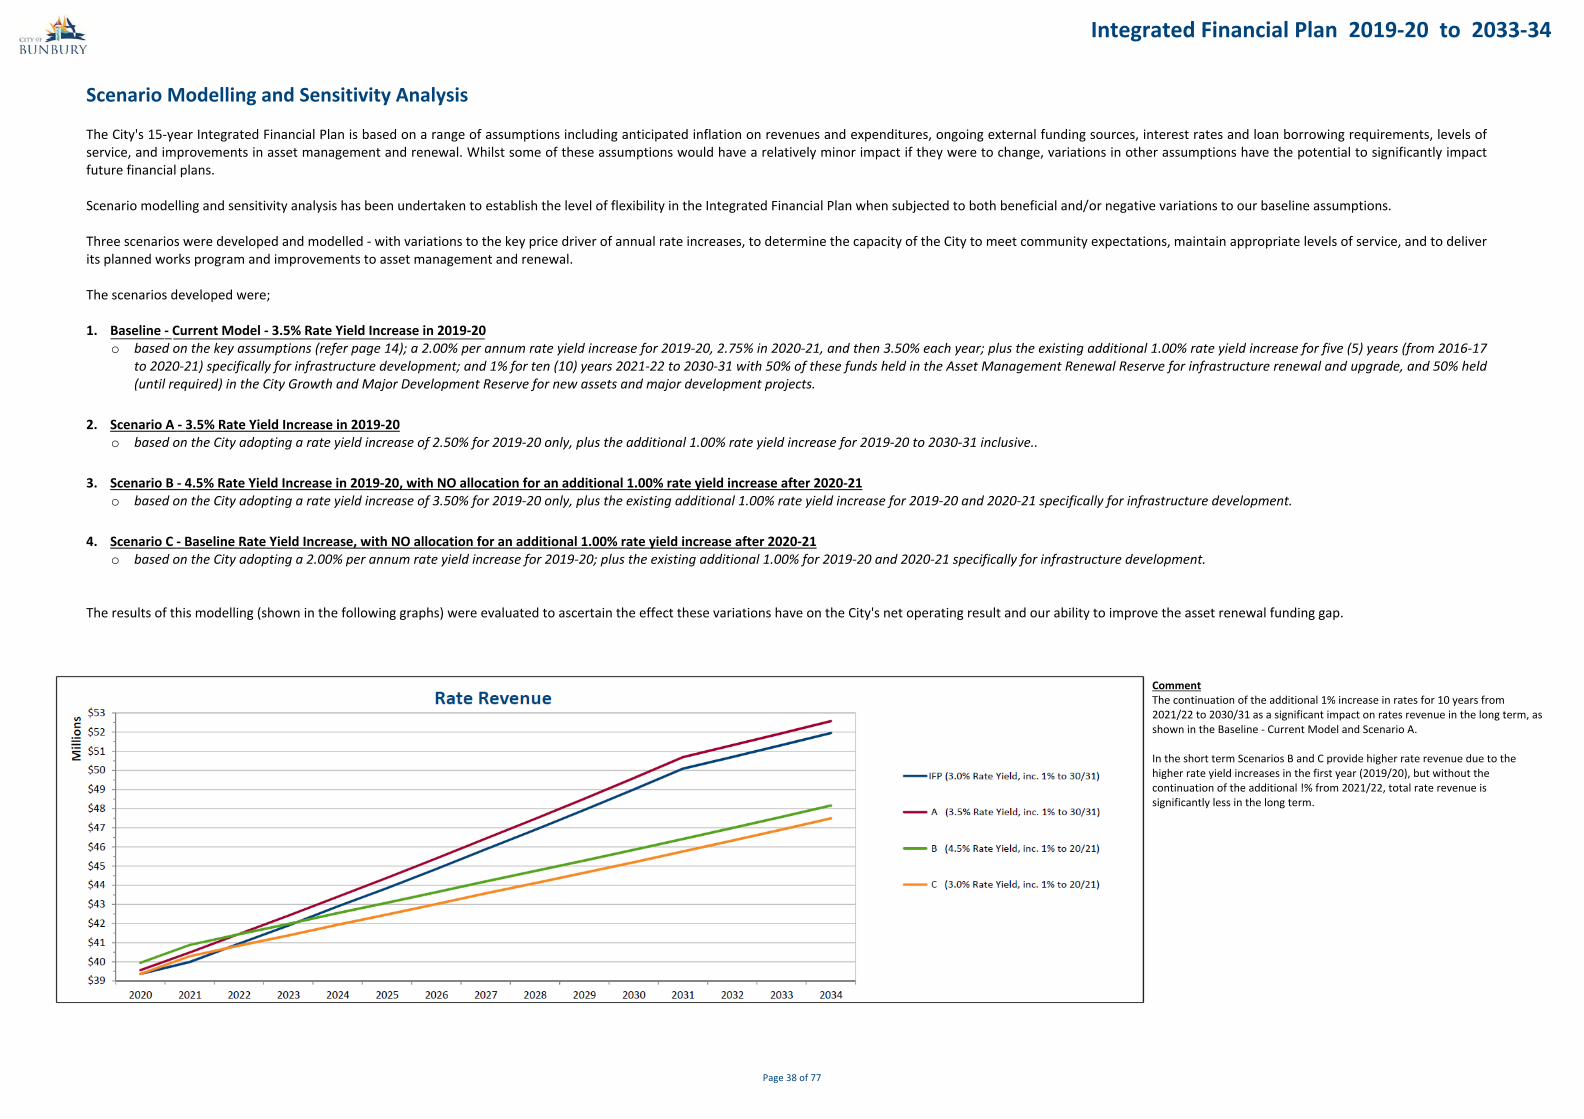
Integrated Financial Plan 2019‐20 to 2033‐34
Scenario Modelling and Sensitivity Analysis
The City's 15-year Integrated Financial Plan is based on a range of assumptions including anticipated inflation on revenues and expenditures, ongoing external funding sources, interest rates and loan borrowing requirements, levels of service, and improvements in asset management and renewal. Whilst some of these assumptions would have a relatively minor impact if they were to change, variations in other assumptions have the potential to significantly impact future financial plans.
Scenario modelling and sensitivity analysis has been undertaken to establish the level of flexibility in the Integrated Financial Plan when subjected to both beneficial and/or negative variations to our baseline assumptions.
Three scenarios were developed and modelled - with variations to the key price driver of annual rate increases, to determine the capacity of the City to meet community expectations, maintain appropriate levels of service, and to deliver its planned works program and improvements to asset management and renewal.
The scenarios developed were;
1. Baseline ‐ Current Model - 3.5% Rate Yield Increase in 2019-20o based on the key assumptions (refer page 14); a 2.00% per annum rate yield increase for 2019-20, 2.75% in 2020-21, and then 3.50% each year; plus the existing additional 1.00% rate yield increase for five (5) years (from 2016-17
to 2020-21) specifically for infrastructure development; and 1% for ten (10) years 2021-22 to 2030-31 with 50% of these funds held in the Asset Management Renewal Reserve for infrastructure renewal and upgrade, and 50% held(until required) in the City Growth and Major Development Reserve for new assets and major development projects.
2. Scenario A ‐ 3.5% Rate Yield Increase in 2019‐20o based on the City adopting a rate yield increase of 2.50% for 2019-20 only, plus the additional 1.00% rate yield increase for 2019-20 to 2030-31 inclusive..
3. Scenario B ‐ 4.5% Rate Yield Increase in 2019‐20, with NO allocation for an additional 1.00% rate yield increase after 2020‐21o based on the City adopting a rate yield increase of 3.50% for 2019-20 only, plus the existing additional 1.00% rate yield increase for 2019-20 and 2020-21 specifically for infrastructure development.
4. Scenario C ‐ Baseline Rate Yield Increase, with NO allocation for an additional 1.00% rate yield increase after 2020‐21o based on the City adopting a 2.00% per annum rate yield increase for 2019-20; plus the existing additional 1.00% for 2019-20 and 2020-21 specifically for infrastructure development.
The results of this modelling (shown in the following graphs) were evaluated to ascertain the effect these variations have on the City's net operating result and our ability to improve the asset renewal funding gap.
CommentThe continuation of the additional 1% increase in rates for 10 years from 2021/22 to 2030/31 as a significant impact on rates revenue in the long term, as shown in the Baseline - Current Model and Scenario A.
In the short term Scenarios B and C provide higher rate revenue due to the higher rate yield increases in the first year (2019/20), but without the continuation of the additional !% from 2021/22, total rate revenue is significantly less in the long term.
Page 38 of 77

Integrated Financial Plan 2019‐20 to 2033‐34
DefinitionOperating revenue minus operating expense, divded by own source operating revenue.
Interpretation15% or greater indicates the City is achieving a strong operating surplus which will enable future improvements in service delivery and support asset management.
Lower than 0% indicates the City of generating insufficient revenue to sustain existing levels of service and adequately maintain its assets.
CommentThe effect of continuing the additional 1% for a further 10 years can be clearly shown in this graph.
The result is the City achieving an operating surplus sooner under the Baseline - Current Model and Scenario A, while with the lower rate increases modelled over the 15 years of the IFP with Scenarios B and C results in an operating surplus being delayed by 7 years to 2033/34.
DefinitionOperating revenue minus operating expense, divided by own source operating revenue.
Interpretation0.15 or greater indicates the City is achieving a strong operating surplus which will enable future improvements in service delivery and support asset management.
Lower than zero indicates the City is generating insufficient revenue to sustain existing levels of service and adequately maintain its assets.
CommentEven with the higher rate increases, the City only achieves a 'basic' local government ratio standard.
DefinitionOwn source operating revenue divided by operating expense.
InterpretationMeasures the City's ability to cover operating expenses from own source revenue; the higher the ratio, the more self-reliant the City is.
0.90 or greater represents low risk0.60 or lower represents high risk
CommentThe Baseline - Current Model and all scenarios provide a strong Own Source Revenue Ratio with the Baseline and Scenario A providing a slightly better outcome.
Page 39 of 77
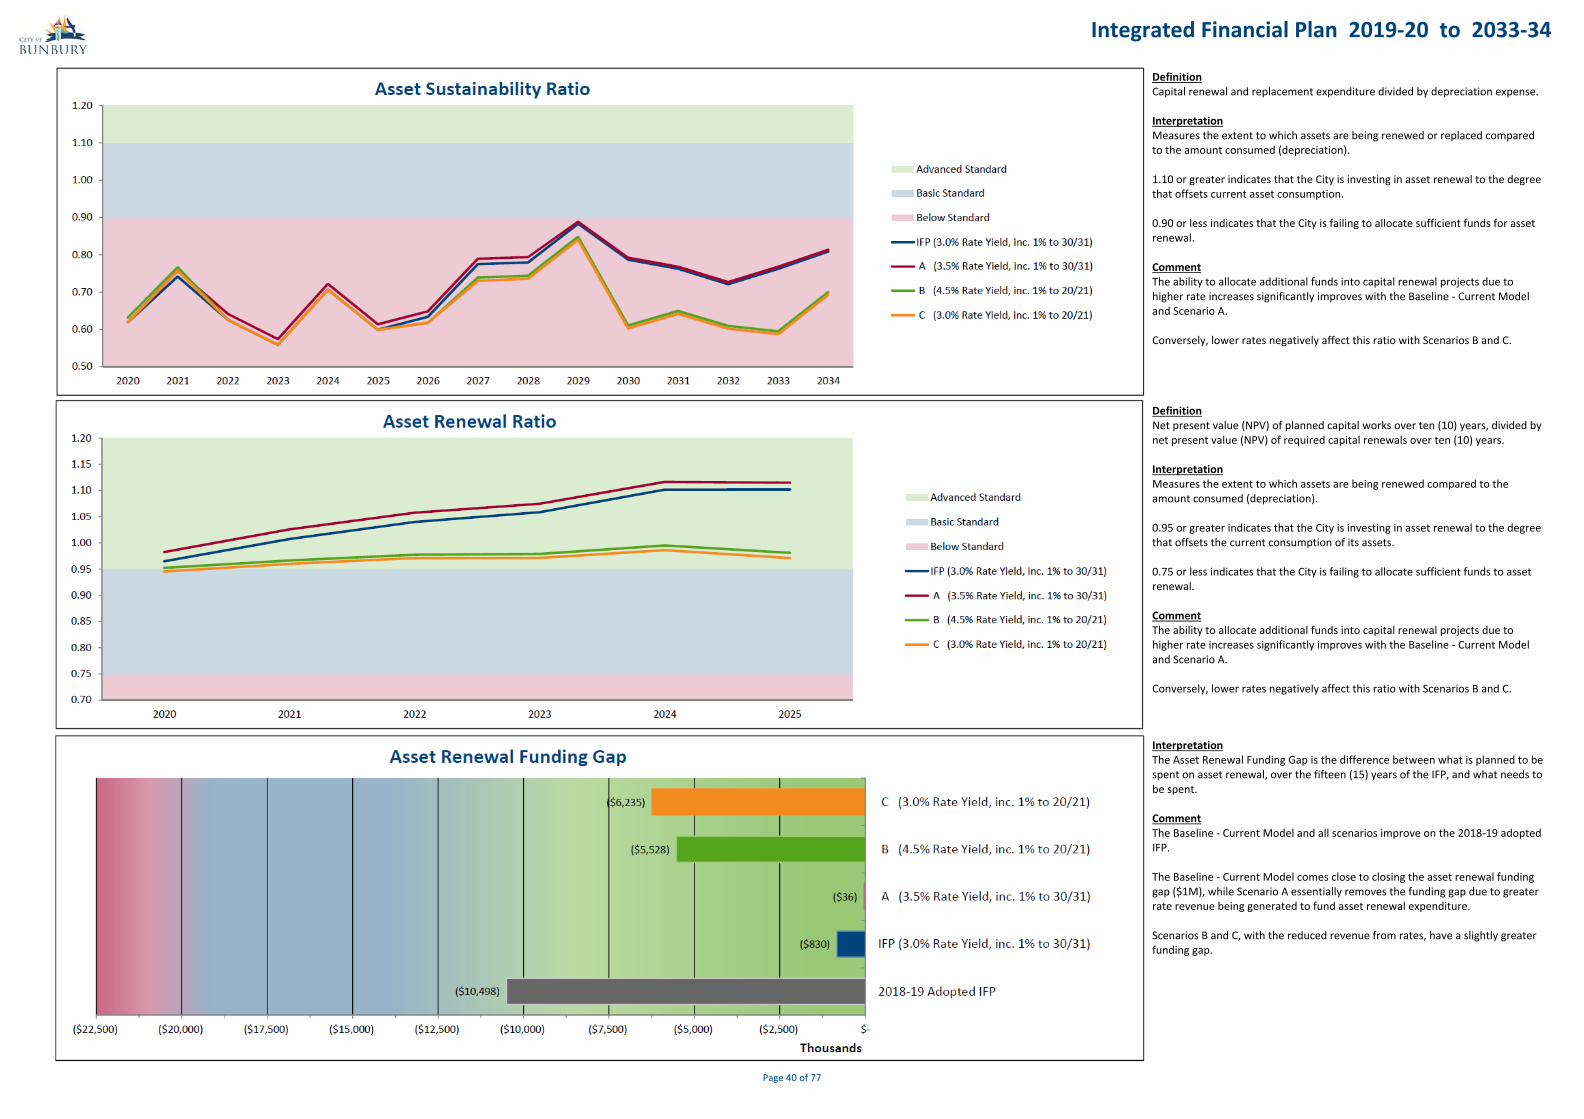
Integrated Financial Plan 2019‐20 to 2033‐34
DefinitionCapital renewal and replacement expenditure divided by depreciation expense.
InterpretationMeasures the extent to which assets are being renewed or replaced compared to the amount consumed (depreciation).
1.10 or greater indicates that the City is investing in asset renewal to the degree that offsets current asset consumption.
0.90 or less indicates that the City is failing to allocate sufficient funds for asset renewal.
CommentThe ability to allocate additional funds into capital renewal projects due to higher rate increases significantly improves with the Baseline - Current Model and Scenario A.
Conversely, lower rates negatively affect this ratio with Scenarios B and C.
DefinitionNet present value (NPV) of planned capital works over ten (10) years, divided by net present value (NPV) of required capital renewals over ten (10) years.
InterpretationMeasures the extent to which assets are being renewed compared to the amount consumed (depreciation).
0.95 or greater indicates that the City is investing in asset renewal to the degree that offsets the current consumption of its assets.
0.75 or less indicates that the City is failing to allocate sufficient funds to asset renewal.
CommentThe ability to allocate additional funds into capital renewal projects due to higher rate increases significantly improves with the Baseline - Current Model and Scenario A.
Conversely, lower rates negatively affect this ratio with Scenarios B and C.
InterpretationThe Asset Renewal Funding Gap is the difference between what is planned to be spent on asset renewal, over the fifteen (15) years of the IFP, and what needs to be spent.
CommentThe Baseline - Current Model and all scenarios improve on the 2018-19 adopted IFP.
The Baseline - Current Model comes close to closing the asset renewal funding gap ($1M), while Scenario A essentially removes the funding gap due to greater rate revenue being generated to fund asset renewal expenditure.
Scenarios B and C, with the reduced revenue from rates, have a slightly greater funding gap.
Page 40 of 77

Integrated Financial Plan 2019‐20 to 2033‐34
DefinitionCurrent assets minus restricted assets, divided by, current liabilities minus liabilities associated with restricted assets.
InterpretationA ratio of greater than 1.0 means that a local government has sufficient assets that can be converted into cash to meet its immediate cash commitments.
CommentThe Current Ratio improves over the life of the IFP with higher rates (Baseline - Current Model and Scenario A) and is impacted negatively with lower rates (Scenarios B and C).
InterpretationIncludes both restricted and unrestricted cash balances.
CommentCash funds improve with higher rate increases and reduce with lower rate increases.
Page 41 of 77
SUMMARY
In summary the three scenarios when compared to the Baseline – Current Model impact the City’s financial position in the following ways:
• Scenario A based on a higher rate increase of 3.5% compared to the Baseline – Current Model of 3.0%, generates additional revenue which reduces the City’s net operating deficit sooner and also further reduces the asset renewal funding gap. It therefore has a positive impact on the City’s financial position.
• Scenario B with a higher rate increase in the first year (4.5%) than the Baseline – Current Model and Scenario A, generates more rate revenue in the short term, but as the additional 1% rate yield is not continued in this model the long term rate revenue is significantly reduced. It therefore has a negative impact on both the operating surplus and asset renewal funding gap as less revenue is available. Consequently this model as a negative impact on the City’s financial position.
• Scenario C uses the Baseline – Current Model rate increase in the first year, but does not continue with the additional 1% rate yield. This results in being the worst performing scenario as reflected in the operating surplus graph and asset renewal funding gap. It therefore as a negative impact on the City’s financial position.
The analysis of these scenarios supports the Council in making informed decisions regarding future financial plans.

Integrated Financial Plan 2019-20 to 2033-34
Workforce Plan Strategies
Executive Summary
The City of Bunbury considers our workforce to be our most valuable asset. City employees are highly skilled and dedicated professionals who make significant contributions to the community of Bunbury. Our employees are passionate advocates for the City, its strategic direction and most importantly our community.
This Workforce Plan aims to support and empower our employees. The plan examines the current internal and external factors affecting our workforce; assesses the challenges we face going forward and proposes a number of outcomes to address these.
There are certainly some challenges for the City over the life of this plan and beyond. The impact of mining on the employment sector is set to increase again with the inevitable skill shortages that come with this especially being felt in the regions. Additional to this, the current social environment means that communities look to their Local Governments to supply more with less. Expectations on Local Governments to provide diversity of services, keep communications flowing through all channels, whilst also maintaining the traditional “roads, rates and rubbish” means constantly reviewing and assessing what we do and what level of service we provide.
This plan provides a strategic overview of how we will support the workforce for the next 4 years. The outcomes listed will look to improve our internal culture, look at ways to work more efficiently and effectively, develop our employees in a more strategic way and look at a new way to reward and recognise their contributions. Annual reporting against the Outcomes and Action Plan will ensure that we remain focused on these objectives.
The City is committed to making our workplace the best it can be. We want it to be a place where our employees feel safe; where that they can contribute to our community in a positive way; where they are valued and that their efforts are rewarded. Our wish is for the City of Bunbury to be an employer of choice and in line with the City’s Strategic Plan, “Welcoming and full of opportunities”.
The Workforce Plan has been developed to ensure that the City is well placed in terms of human resourcing requirements to enable the effective delivery of services, whist meeting community expectations. The Plan aims to deliver outcomes in a manner consistent with the values of the City and are in line with the adopted Strategic Community Plan. The Workforce Plan also helps to ensure that the City has the right people in the right place to build a resilient and sustainable organisation.
Strategic Workforce Planning Overview
The City of Bunbury’s (the City) Workforce Plan aims to forecast the strategic direction needed in Human Resource and Organisational Development management for the period of the Plan. The Plan will highlight the City requirements in relation to FTE and employee costs and explore the current internal workforce profile and define the way forward. A high level strategic approach has been taken in the development of this plan, with a key focus on how the City can look internally to work as efficiently and effectively as possible. A commitment to review all services provided to the community, not only by internal employees, but also those that the City contracts to deliver work will be undertaken during the course of this plan. The key outcome from this is to ensure that the best value for money and service delivery is achieved for the Bunbury community.
It is an exciting time for Bunbury. There is a great deal of growth in the region along with the City itself. A positive culture internally, along with a strong focus on the delivery of quality outcomes for the community will result in the City living up to its vision of being “Welcoming and Full of Opportunities.”
PurposeWorkforce planning is one of the core components of the WA Department of Local Government Integrated Planning and Reporting Framework and is "a continuous process of shaping the workforce to ensure that it is capable of delivering organisational objectives now and in the future”.
The Workforce Plan will allow the City to set its priorities within its resourcing capacity and deliver short, medium and long-term community priorities and aspirations. It is a plan that is continually evolving to ensure the City has the right people in the right place at the right time.
Page 42 of 77

Integrated Financial Plan 2019-20 to 2033-34
Workforce Plan Strategies - continued
Key DriversThe Workforce Plan is an enabling strategy of the Strategic Community Plan, Integrated Financial Plan and Corporate Business Plan. Good practice workforce planning involves the identification of the primary strategic focus of an organisation. The three alternative focus points can be either ‘growth’, ‘steady state’ or ‘decline’. Based on the review undertaken of the City’s key strategic documents, and in consultation with the organisation’s senior leaders, this workforce plan reflects the ‘steady state’ expected to be experienced over the next 4 years.
The City of Bunbury is administered through a structure of four Directorates containing sixteen Departments and over thirty service delivery units. These units are managed by a Chief Executive Officer, Directors, Managers and Team Leaders. The structure is adjusted when the City embarks on new opportunities, divests itself of service functions or when there is a need to reorganise functions into different units for better management.
The structure also ensures that the City complies with the obligation imposed on it by Section 5.2 of the Local Government Act, 1995, (the Act) which prescribes that the Council “…is to ensure that there is an appropriate structure for administering the local government.”
The City of Bunbury undertook the below process to develop the City’s 2018 - 2022 Workforce Plan:
This structure has been developed to guide flexibility in service delivery, whilst maintaining what has been identified as the core services and activities of the City.
Page 43 of 77

Integrated Financial Plan 2019-20 to 2033-34
Asset Management
An Asset Management Plan (AMP) assists Council in predicting infrastructure consumption and asset renewal needs, as well as identifying the additional expenditure required to renew or preserve current assets.
By ascertaining accurate replacement costs of assets, the length of time the asset will be able to service the community and the age of existing assets, the level of confidence in our asset data has increased and forms the basis of calculating our AMP targets.
Much of the City of Bunbury assets portfolio will last for a considerable time (Buildings - up to 80 years, Stormwater - up to 100 years, Pathways - up to 50 years) so will not fall due for replacement until after 2033-34. Please note that the AMP targets are based on specific assets that fall due for replacement over the next 15 years.
Assumptions and General Information regarding the Asset Management Plan
General information applying to all asset classes
* The bulk of the work undertaken to date has focused on the City’s infrastructure assets which represents a majority of City’s asset risk and associated renewal funding requirements.* All AMP targets provided are based on information available to date. Further improvements to the data relating to City assets (data knowledge and associated funding model predictions) will result in changes to the gap
analysis funding requirements.* The AMP target represents the recommended renewal funding requirements derived from the City’s AMP. Values are based on the City’s current asset portfolio and levels of service; noting that any future changes will
affect the predicted levels of funding required.* All Capital Expenditure totals are gross and do not include any grant or other project related income.* Renewal Calculation - all ‘upgrade’ projects include a renewal component; this has been estimated at 72% for Roads and 80% of the project value as an average value across all other asset classes.
Asset Specific Information by asset class
* Buildings The AMP target is based on the age of existing buildings (as a whole, not broken down into components - e.g. electrical, hydraulic and structural) and the building life expectancy. The replacement value of the building is then factored into the identified year of replacement. Our building assets have a life of 30 to 80 years, so the buildings that fall due for replacement in the next 15 years are only a small portion of our Building asset portfolio and does not include any of our higher value buildings like the South West Sports Centre or Bunbury Regional Entertainment Centre.
* Furniture & Fittings The AMP target is based on 2017-18 depreciation figures.
* Plant & Vehicles The AMP target is based on current asset class data. This includes light vehicles (corporate and utes), heavy vehicles and minor plant.
* Equipment The AMP target is based on 2017-18 depreciation for the current asset class inventory excluding IT Equipment and Parking Equipment. This includes CCTV, equipment at the South West Sports Centre, Bunbury Regional Entertainment Centre, Bunbury Wildlife Park, Libraries and other City facilities.
* IT Equipment The AMP target is based on replacement of computers, printers, photocopiers, phones, mobile devices and servers to industry recommended lives.
* Parking Equipment The AMP target is based on 2017-18 depreciation figures.
* Arts & Culture The AMP target is based on 2017-18 depreciation for the current asset class inventory. Please note Artwork does not depreciate so are not included in this figure.
* Bridges The AMP target is based on when specific bridges/component (e.g. handrails, decks, beams) are due for replacement.
* Bus Shelters The bus shelter replacement programme is developed in conjunction with the Public Transport Authority (PTA), and may not be reflective of renewal projections based solely on asset data, as passenger usage data is also included in the development of the programme.
* Lighting AMP target provides for replacement of City owned lighting. This includes street lighting owned by the City, pathway lighting, sportsground lighting, security, airport, playground, and information bay lighting.
* Marine The AMP target is based on when specific Marine assets (boat ramps, jetties, pontoons and sections of sea walls) are due for replacement.
* Open Space The AMP target is based on when specific Open Space assets are due for replacement (playground equipment, sporting surfaces and equipment, barbecues, drink fountains, bore, pumps, reticulation, etc). Please note that the renewal figures do not include Street Trees.
Page 44 of 77

Integrated Financial Plan 2019-20 to 2033-34
Assumptions and General Information regarding the Asset Management Plan - continued
* Pathways AMP target is based on the paths that fall due for replacement (based on age) and with a view to replace all slab paths within the next 15 years. The renewal figure has then been spread evenly over each of the 15 years as this represents a more realistic way to deliver the work.
* Refuse AMP target is for City owned refuse assets (bins and bin surrounds).
* Roads AMP target include renewal funding requirements for road seal, surface and pavement only. The renewal expenditure has been spread evenly over the 15 year period.
* Signs AMP target provides for replacement of street name and non-regulatory signs including advisory, tourist, information and parking signs.
* Stormwater AMP target are based on current known data collected. Some assumptions have been made over installation dates of stormwater assets, based on age of suburbs and roads in the area. Stormwater assets are long life assets (up to 100 years) so the replacements that fall due in the next 15 years is only a small portion of the $101,236,413 value for all stormwater assets.
* Structures AMP target provides for replacement of barriers, guardrails, shelters, boardwalks, lookouts, stairways/steps, fences, flag poles, retaining walls, entry statements and sporting structures. An allocation for preventative maintenance of Public Art has been included.
Total Replacement Cost of Assets, as at 30 June 2018;
Buildings 208,766,993Plant and Vehicles 9,832,878Equipment (including IT and Parking) 10,870,464Furniture and Fittings 1,474,974Arts and Culture 2,561,603Roads 245,585,951Paths 64,860,532Stormwater 101,236,413Open Space 37,160,594Marine 27,722,386Structures 28,380,620Bridges 8,981,388Other Infrastructure (including; Bus Shelters, Lighting, Refuse and Signs) 10,964,908
TOTAL 758,399,704
Page 45 of 77

Integrated Financial Plan 2019‐20 to 2033‐34
DefinitionDepreciated replacement cost of assets divided by current replacement cost of depreciable assets.
InterpretationMeasures the extent to which depreciable assets have been consumed by comparing their written down value to their replacement cost.
60% or greater indicates the City is investing in asset renewal.
50% or less indicates the City is having difficulty undertaking a sustained capital renewal program.
CommentAssets are maintained at an advanced standard over the life of the IFP.
Asset Management Ratios
DefinitionNet present value (NPV) of planned capital works over ten (10) years, divided by net present value (NPV) of required capital renewals over ten (10) years.
InterpretationMeasures the extent to which assets are being renewed compared to the amount consumed (depreciation).
95% or greater indicates that the City is investing in asset renewal to the degree that offsets the current consumption of its assets.
75% or less indicates that the City is failing to allocate sufficient funds to asset renewal.
CommentThe amount of asset renewal (as a 10 year average) maintains an advanced standard from 2019-20 to 2024-25. Due to the ratio being based on a 10 year average the ratio can only be calculated to 2024-25.
DefinitionCapital renewal and replacement expenditure divided by depreciation expense.
InterpretationMeasures the extent to which assets are being renewed or replaced compared to the amount consumed (depreciation).
110% or greater indicates that the City is investing in asset renewal to the degree that offsets the current consumption of its assets.
90% or less indicates that the City is failing to allocate sufficient funds for asset renewal.
CommentThe ratio improves in the outer years as more capital expenditure is allocated to asset renewal.
Page 46 of 77

Integrated Financial Plan 2019‐20 to 2033‐34
Capital Expenditure by Asset Class ‐ Summary Draft Budget Forecast Forecast Forecast Forecast Forecast Forecast Forecast Forecast Forecast Forecast Forecast Forecast Forecast Forecast TOTALAsset Management Plan Gap Analysis 2019‐20 2020‐21 2021‐22 2022‐23 2023‐24 2024‐25 2025‐26 2026‐27 2027‐28 2028‐29 2029‐30 2030‐31 2031‐32 2032‐33 2033‐34 Over 15 Yrs
Arts and CultureCapital ‐ New (Expansion) 20,000 20,000 20,000 20,000 20,000 20,000 20,000 20,000 20,000 20,000 20,000 20,000 20,000 20,000 20,000 300,000 Capital ‐ Renewal 16,920 17,061 17,317 17,577 17,840 18,108 18,380 18,655 18,935 19,219 19,507 19,800 20,000 20,297 20,601 280,217 Capital ‐ Upgrade ‐ ‐ ‐ ‐ ‐ ‐ ‐ ‐ ‐ ‐ ‐ ‐ ‐ ‐ ‐ ‐
Total 36,920 37,061 37,317 37,577 37,840 38,108 38,380 38,655 38,935 39,219 39,507 39,800 40,000 40,297 40,601 580,217
Renewal CalculationCapital ‐ Renewal 100% 16,920 17,061 17,317 17,577 17,840 18,108 18,380 18,655 18,935 19,219 19,507 19,800 20,000 20,297 20,601 280,217 Capital ‐ Upgrade 80% ‐ ‐ ‐ ‐ ‐ ‐ ‐ ‐ ‐ ‐ ‐ ‐ ‐ ‐ ‐ ‐
Total Renewal Expenditure 16,920 17,061 17,317 17,577 17,840 18,108 18,380 18,655 18,935 19,219 19,507 19,800 20,000 20,297 20,601 280,217
Asset Management Plan (AMP) Target 28,657 28,657 28,657 28,657 28,657 28,657 28,657 28,657 28,657 28,657 28,657 28,657 28,657 28,657 28,657 429,855 AMP Funding Gap (11,737) (11,596) (11,340) (11,080) (10,817) (10,549) (10,277) (10,002) (9,722) (9,438) (9,150) (8,857) (8,657) (8,360) (8,056) (149,638)
BridgesCapital ‐ New (Expansion) ‐ ‐ ‐ ‐ ‐ ‐ ‐ ‐ ‐ ‐ ‐ ‐ ‐ ‐ ‐ ‐ Capital ‐ Renewal ‐ 100,000 20,000 ‐ ‐ 25,000 ‐ ‐ 75,000 85,000 ‐ 30,000 ‐ ‐ ‐ 335,000 Capital ‐ Upgrade ‐ ‐ ‐ ‐ ‐ ‐ ‐ ‐ ‐ ‐ ‐ ‐ ‐ ‐ ‐ ‐
Total ‐ 100,000 20,000 ‐ ‐ 25,000 ‐ ‐ 75,000 85,000 ‐ 30,000 ‐ ‐ ‐ 335,000
Renewal CalculationCapital ‐ Renewal 100% ‐ 100,000 20,000 ‐ ‐ 25,000 ‐ ‐ 75,000 85,000 ‐ 30,000 ‐ ‐ ‐ 335,000 Capital ‐ Upgrade 80% ‐ ‐ ‐ ‐ ‐ ‐ ‐ ‐ ‐ ‐ ‐ ‐ ‐ ‐ ‐ ‐
Total Renewal Expenditure ‐ 100,000 20,000 ‐ ‐ 25,000 ‐ ‐ 75,000 85,000 ‐ 30,000 ‐ ‐ ‐ 335,000
Asset Management Plan (AMP) Target 15,246 8,227 138,838 ‐ ‐ 14,995 ‐ ‐ 15,422 64,003 ‐ ‐ ‐ 32,658 ‐ 289,389 AMP Funding Gap (15,246) 91,773 (118,838) ‐ ‐ 10,005 ‐ ‐ 59,578 20,997 ‐ 30,000 ‐ (32,658) ‐ 45,611
BuildingsCapital ‐ New (Expansion) 500,000 20,000 ‐ ‐ 20,000 200,000 ‐ ‐ ‐ ‐ 30,000 300,000 ‐ ‐ ‐ 1,070,000 Capital ‐ Renewal 884,550 2,185,000 512,000 985,000 1,000,000 1,033,000 1,594,000 3,011,000 2,511,000 2,011,000 1,000,000 1,000,000 1,000,000 1,000,000 1,000,000 20,726,550 Capital ‐ Upgrade 470,000 140,000 130,000 20,000 20,000 130,000 20,000 20,000 20,000 20,000 20,000 20,000 20,000 20,000 20,000 1,090,000
Total 1,854,550 2,345,000 642,000 1,005,000 1,040,000 1,363,000 1,614,000 3,031,000 2,531,000 2,031,000 1,050,000 1,320,000 1,020,000 1,020,000 1,020,000 22,886,550
Renewal CalculationCapital ‐ Renewal 100% 884,550 2,185,000 512,000 985,000 1,000,000 1,033,000 1,594,000 3,011,000 2,511,000 2,011,000 1,000,000 1,000,000 1,000,000 1,000,000 1,000,000 20,726,550 Capital ‐ Upgrade 80% 376,000 112,000 104,000 16,000 16,000 104,000 16,000 16,000 16,000 16,000 16,000 16,000 16,000 16,000 16,000 872,000
Total Renewal Expenditure 1,260,550 2,297,000 616,000 1,001,000 1,016,000 1,137,000 1,610,000 3,027,000 2,527,000 2,027,000 1,016,000 1,016,000 1,016,000 1,016,000 1,016,000 21,598,550
Asset Management Plan (AMP) Target 1,211,665 1,993,000 1,675,895 1,085,940 754,860 189,405 452,540 6,249,350 ‐ 65,975 862,750 502,425 1,831,060 1,169,280 2,132,515 20,176,660 AMP Funding Gap 48,885 304,000 (1,059,895) (84,940) 261,140 947,595 1,157,460 (3,222,350) 2,527,000 1,961,025 153,250 513,575 (815,060) (153,280) (1,116,515) 1,421,890
Page 47 of 77

Integrated Financial Plan 2019‐20 to 2033‐34
Capital Expenditure by Asset Class ‐ Summary Draft Budget Forecast Forecast Forecast Forecast Forecast Forecast Forecast Forecast Forecast Forecast Forecast Forecast Forecast Forecast TOTALAsset Management Plan Gap Analysis 2019‐20 2020‐21 2021‐22 2022‐23 2023‐24 2024‐25 2025‐26 2026‐27 2027‐28 2028‐29 2029‐30 2030‐31 2031‐32 2032‐33 2033‐34 Over 15 Yrs
Bus SheltersCapital ‐ New (Expansion) ‐ ‐ ‐ ‐ ‐ ‐ ‐ ‐ ‐ ‐ ‐ ‐ ‐ ‐ ‐ ‐ Capital ‐ Renewal 20,000 20,000 20,000 20,000 20,000 20,000 20,000 20,000 20,000 20,000 20,000 20,000 20,000 20,000 20,000 300,000 Capital ‐ Upgrade ‐ ‐ ‐ ‐ ‐ ‐ ‐ ‐ ‐ ‐ ‐ ‐ ‐ ‐ ‐ ‐
Total 20,000 20,000 20,000 20,000 20,000 20,000 20,000 20,000 20,000 20,000 20,000 20,000 20,000 20,000 20,000 300,000
Renewal CalculationCapital ‐ Renewal 100% 20,000 20,000 20,000 20,000 20,000 20,000 20,000 20,000 20,000 20,000 20,000 20,000 20,000 20,000 20,000 300,000 Capital ‐ Upgrade 80% ‐ ‐ ‐ ‐ ‐ ‐ ‐ ‐ ‐ ‐ ‐ ‐ ‐ ‐ ‐ ‐
Total Renewal Expenditure 20,000 20,000 20,000 20,000 20,000 20,000 20,000 20,000 20,000 20,000 20,000 20,000 20,000 20,000 20,000 300,000
Asset Management Plan (AMP) Target 41,373 41,373 41,373 41,373 41,373 41,373 41,373 41,373 41,373 41,373 41,373 41,373 41,373 41,373 41,373 620,595 AMP Funding Gap (21,373) (21,373) (21,373) (21,373) (21,373) (21,373) (21,373) (21,373) (21,373) (21,373) (21,373) (21,373) (21,373) (21,373) (21,373) (320,595)
EquipmentCapital ‐ New (Expansion) ‐ 12,000 ‐ 15,000 ‐ 142,295 ‐ ‐ 12,000 ‐ ‐ ‐ ‐ ‐ ‐ 181,295 Capital ‐ Renewal 130,215 139,680 137,235 183,645 172,270 136,750 196,310 150,290 160,185 169,290 120,420 117,030 140,000 140,000 100,000 2,193,320 Capital ‐ Upgrade ‐ ‐ ‐ ‐ ‐ ‐ ‐ ‐ ‐ ‐ ‐ ‐ ‐ ‐ ‐ ‐
Total 130,215 151,680 137,235 198,645 172,270 279,045 196,310 150,290 172,185 169,290 120,420 117,030 140,000 140,000 100,000 2,374,615
Renewal CalculationCapital ‐ Renewal 100% 130,215 139,680 137,235 183,645 172,270 136,750 196,310 150,290 160,185 169,290 120,420 117,030 140,000 140,000 100,000 2,193,320 Capital ‐ Upgrade 80% ‐ ‐ ‐ ‐ ‐ ‐ ‐ ‐ ‐ ‐ ‐ ‐ ‐ ‐ ‐ ‐
Total Renewal Expenditure 130,215 139,680 137,235 183,645 172,270 136,750 196,310 150,290 160,185 169,290 120,420 117,030 140,000 140,000 100,000 2,193,320
Asset Management Plan (AMP) Target 311,918 311,918 311,918 311,918 311,918 311,918 311,918 311,918 311,918 311,918 311,918 311,918 311,918 311,918 311,918 4,678,770 AMP Funding Gap (181,703) (172,238) (174,683) (128,273) (139,648) (175,168) (115,608) (161,628) (151,733) (142,628) (191,498) (194,888) (171,918) (171,918) (211,918) (2,485,450)
IT EquipmentCapital ‐ New (Expansion) 8,000 ‐ ‐ 5,000 ‐ 35,000 ‐ ‐ ‐ ‐ ‐ ‐ ‐ ‐ ‐ 48,000 Capital ‐ Renewal 201,200 201,200 201,200 301,200 261,200 201,200 201,200 201,200 301,200 261,200 201,200 201,200 201,200 301,200 201,200 3,438,000 Capital ‐ Upgrade ‐ ‐ ‐ ‐ ‐ ‐ ‐ ‐ ‐ ‐ ‐ ‐ ‐ ‐ ‐ ‐
Total 209,200 201,200 201,200 306,200 261,200 236,200 201,200 201,200 301,200 261,200 201,200 201,200 201,200 301,200 201,200 3,486,000
Renewal CalculationCapital ‐ Renewal 100% 201,200 201,200 201,200 301,200 261,200 201,200 201,200 201,200 301,200 261,200 201,200 201,200 201,200 301,200 201,200 3,438,000 Capital ‐ Upgrade 80% ‐ ‐ ‐ ‐ ‐ ‐ ‐ ‐ ‐ ‐ ‐ ‐ ‐ ‐ ‐ ‐
Total Renewal Expenditure 201,200 201,200 201,200 301,200 261,200 201,200 201,200 201,200 301,200 261,200 201,200 201,200 201,200 301,200 201,200 3,438,000
Asset Management Plan (AMP) Target 230,233 230,233 250,483 550,483 250,483 250,483 250,483 250,483 550,483 250,483 250,483 250,483 250,483 550,483 250,483 4,616,745 AMP Funding Gap (29,033) (29,033) (49,283) (249,283) 10,717 (49,283) (49,283) (49,283) (249,283) 10,717 (49,283) (49,283) (49,283) (249,283) (49,283) (1,178,745)
Parking EquipmentCapital ‐ New (Expansion) ‐ ‐ ‐ ‐ ‐ ‐ ‐ ‐ ‐ ‐ ‐ ‐ ‐ ‐ ‐ ‐ Capital ‐ Renewal 15,000 ‐ 315,000 ‐ ‐ 315,000 ‐ ‐ 315,000 ‐ ‐ 315,000 ‐ ‐ 315,000 1,590,000 Capital ‐ Upgrade ‐ ‐ ‐ ‐ ‐ ‐ ‐ ‐ ‐ ‐ ‐ ‐ ‐ ‐ ‐ ‐
Total 15,000 ‐ 315,000 ‐ ‐ 315,000 ‐ ‐ 315,000 ‐ ‐ 315,000 ‐ ‐ 315,000 1,590,000
Renewal CalculationCapital ‐ Renewal 100% 15,000 ‐ 315,000 ‐ ‐ 315,000 ‐ ‐ 315,000 ‐ ‐ 315,000 ‐ ‐ 315,000 1,590,000 Capital ‐ Upgrade 80% ‐ ‐ ‐ ‐ ‐ ‐ ‐ ‐ ‐ ‐ ‐ ‐ ‐ ‐ ‐ ‐
Total Renewal Expenditure 15,000 ‐ 315,000 ‐ ‐ 315,000 ‐ ‐ 315,000 ‐ ‐ 315,000 ‐ ‐ 315,000 1,590,000
Asset Management Plan (AMP) Target 149,312 149,312 149,312 149,312 149,312 149,312 149,312 149,312 149,312 149,312 149,312 149,312 149,312 149,312 149,312 2,239,680 AMP Funding Gap (134,312) (149,312) 165,688 (149,312) (149,312) 165,688 (149,312) (149,312) 165,688 (149,312) (149,312) 165,688 (149,312) (149,312) 165,688 (649,680)
Page 48 of 77
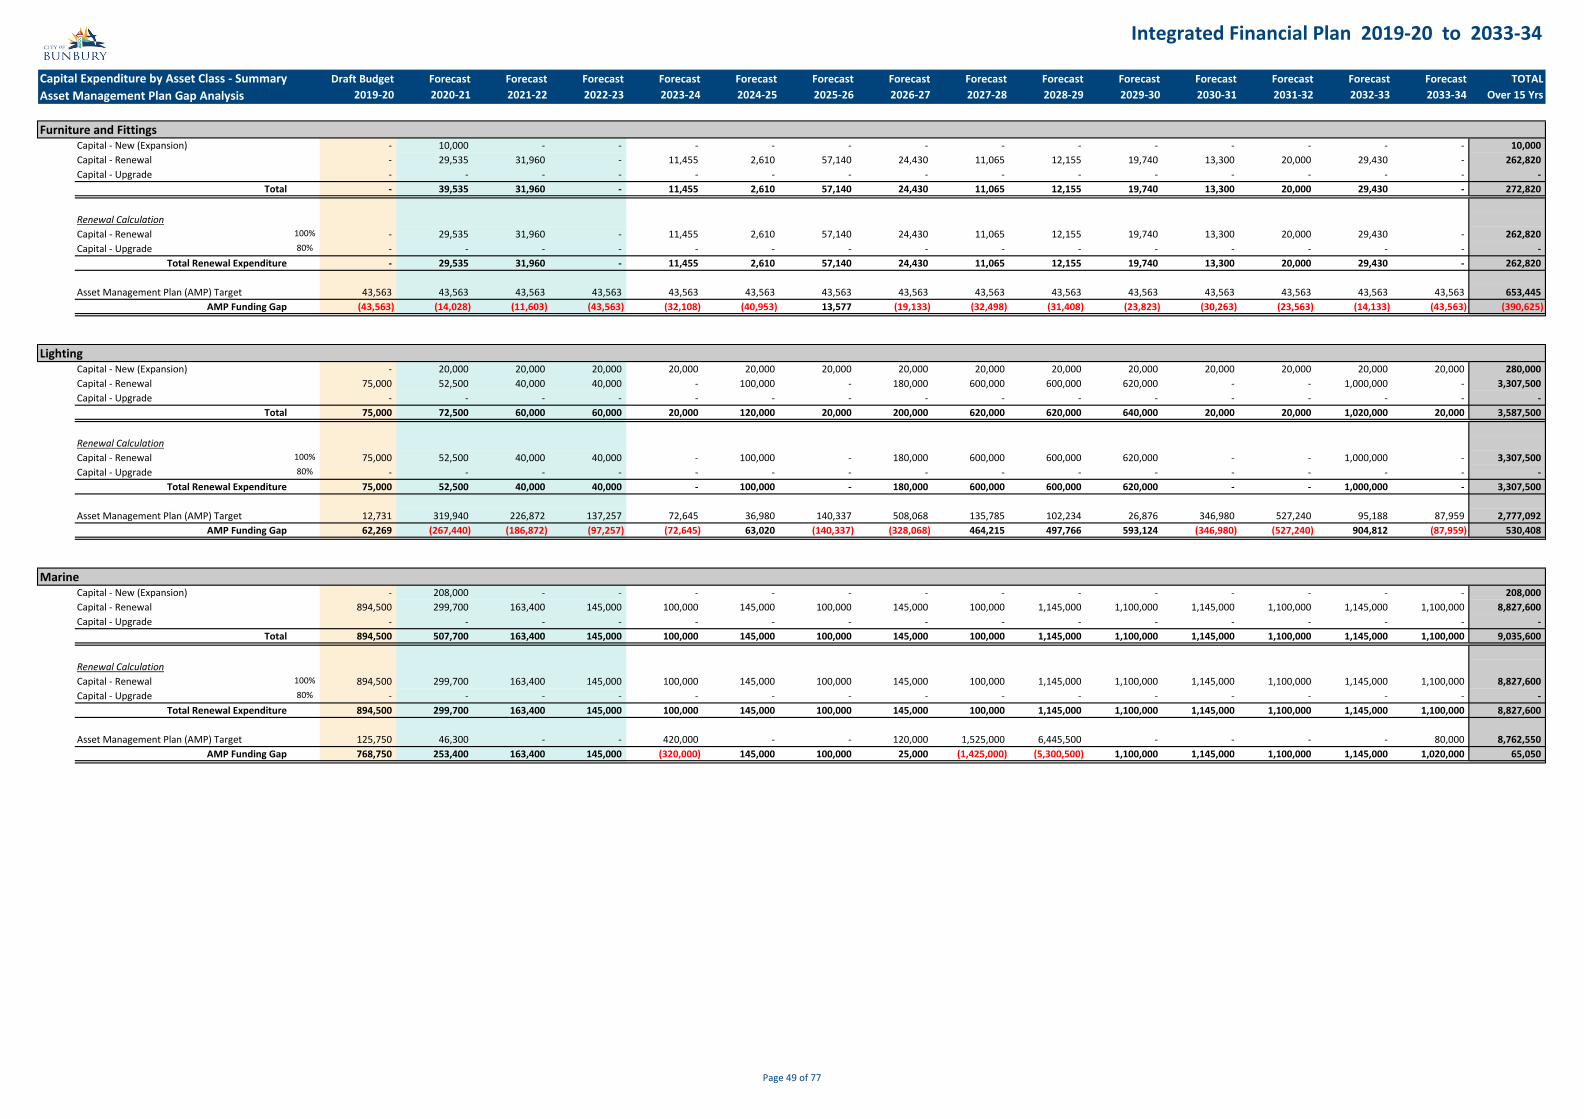
Integrated Financial Plan 2019‐20 to 2033‐34
Capital Expenditure by Asset Class ‐ Summary Draft Budget Forecast Forecast Forecast Forecast Forecast Forecast Forecast Forecast Forecast Forecast Forecast Forecast Forecast Forecast TOTALAsset Management Plan Gap Analysis 2019‐20 2020‐21 2021‐22 2022‐23 2023‐24 2024‐25 2025‐26 2026‐27 2027‐28 2028‐29 2029‐30 2030‐31 2031‐32 2032‐33 2033‐34 Over 15 Yrs
Furniture and FittingsCapital ‐ New (Expansion) ‐ 10,000 ‐ ‐ ‐ ‐ ‐ ‐ ‐ ‐ ‐ ‐ ‐ ‐ ‐ 10,000 Capital ‐ Renewal ‐ 29,535 31,960 ‐ 11,455 2,610 57,140 24,430 11,065 12,155 19,740 13,300 20,000 29,430 ‐ 262,820 Capital ‐ Upgrade ‐ ‐ ‐ ‐ ‐ ‐ ‐ ‐ ‐ ‐ ‐ ‐ ‐ ‐ ‐ ‐
Total ‐ 39,535 31,960 ‐ 11,455 2,610 57,140 24,430 11,065 12,155 19,740 13,300 20,000 29,430 ‐ 272,820
Renewal CalculationCapital ‐ Renewal 100% ‐ 29,535 31,960 ‐ 11,455 2,610 57,140 24,430 11,065 12,155 19,740 13,300 20,000 29,430 ‐ 262,820 Capital ‐ Upgrade 80% ‐ ‐ ‐ ‐ ‐ ‐ ‐ ‐ ‐ ‐ ‐ ‐ ‐ ‐ ‐ ‐
Total Renewal Expenditure ‐ 29,535 31,960 ‐ 11,455 2,610 57,140 24,430 11,065 12,155 19,740 13,300 20,000 29,430 ‐ 262,820
Asset Management Plan (AMP) Target 43,563 43,563 43,563 43,563 43,563 43,563 43,563 43,563 43,563 43,563 43,563 43,563 43,563 43,563 43,563 653,445 AMP Funding Gap (43,563) (14,028) (11,603) (43,563) (32,108) (40,953) 13,577 (19,133) (32,498) (31,408) (23,823) (30,263) (23,563) (14,133) (43,563) (390,625)
LightingCapital ‐ New (Expansion) ‐ 20,000 20,000 20,000 20,000 20,000 20,000 20,000 20,000 20,000 20,000 20,000 20,000 20,000 20,000 280,000 Capital ‐ Renewal 75,000 52,500 40,000 40,000 ‐ 100,000 ‐ 180,000 600,000 600,000 620,000 ‐ ‐ 1,000,000 ‐ 3,307,500 Capital ‐ Upgrade ‐ ‐ ‐ ‐ ‐ ‐ ‐ ‐ ‐ ‐ ‐ ‐ ‐ ‐ ‐ ‐
Total 75,000 72,500 60,000 60,000 20,000 120,000 20,000 200,000 620,000 620,000 640,000 20,000 20,000 1,020,000 20,000 3,587,500
Renewal CalculationCapital ‐ Renewal 100% 75,000 52,500 40,000 40,000 ‐ 100,000 ‐ 180,000 600,000 600,000 620,000 ‐ ‐ 1,000,000 ‐ 3,307,500 Capital ‐ Upgrade 80% ‐ ‐ ‐ ‐ ‐ ‐ ‐ ‐ ‐ ‐ ‐ ‐ ‐ ‐ ‐ ‐
Total Renewal Expenditure 75,000 52,500 40,000 40,000 ‐ 100,000 ‐ 180,000 600,000 600,000 620,000 ‐ ‐ 1,000,000 ‐ 3,307,500
Asset Management Plan (AMP) Target 12,731 319,940 226,872 137,257 72,645 36,980 140,337 508,068 135,785 102,234 26,876 346,980 527,240 95,188 87,959 2,777,092 AMP Funding Gap 62,269 (267,440) (186,872) (97,257) (72,645) 63,020 (140,337) (328,068) 464,215 497,766 593,124 (346,980) (527,240) 904,812 (87,959) 530,408
MarineCapital ‐ New (Expansion) ‐ 208,000 ‐ ‐ ‐ ‐ ‐ ‐ ‐ ‐ ‐ ‐ ‐ ‐ ‐ 208,000 Capital ‐ Renewal 894,500 299,700 163,400 145,000 100,000 145,000 100,000 145,000 100,000 1,145,000 1,100,000 1,145,000 1,100,000 1,145,000 1,100,000 8,827,600 Capital ‐ Upgrade ‐ ‐ ‐ ‐ ‐ ‐ ‐ ‐ ‐ ‐ ‐ ‐ ‐ ‐ ‐ ‐
Total 894,500 507,700 163,400 145,000 100,000 145,000 100,000 145,000 100,000 1,145,000 1,100,000 1,145,000 1,100,000 1,145,000 1,100,000 9,035,600
Renewal CalculationCapital ‐ Renewal 100% 894,500 299,700 163,400 145,000 100,000 145,000 100,000 145,000 100,000 1,145,000 1,100,000 1,145,000 1,100,000 1,145,000 1,100,000 8,827,600 Capital ‐ Upgrade 80% ‐ ‐ ‐ ‐ ‐ ‐ ‐ ‐ ‐ ‐ ‐ ‐ ‐ ‐ ‐ ‐
Total Renewal Expenditure 894,500 299,700 163,400 145,000 100,000 145,000 100,000 145,000 100,000 1,145,000 1,100,000 1,145,000 1,100,000 1,145,000 1,100,000 8,827,600
Asset Management Plan (AMP) Target 125,750 46,300 ‐ ‐ 420,000 ‐ ‐ 120,000 1,525,000 6,445,500 ‐ ‐ ‐ ‐ 80,000 8,762,550 AMP Funding Gap 768,750 253,400 163,400 145,000 (320,000) 145,000 100,000 25,000 (1,425,000) (5,300,500) 1,100,000 1,145,000 1,100,000 1,145,000 1,020,000 65,050
Page 49 of 77

Integrated Financial Plan 2019‐20 to 2033‐34
Capital Expenditure by Asset Class ‐ Summary Draft Budget Forecast Forecast Forecast Forecast Forecast Forecast Forecast Forecast Forecast Forecast Forecast Forecast Forecast Forecast TOTALAsset Management Plan Gap Analysis 2019‐20 2020‐21 2021‐22 2022‐23 2023‐24 2024‐25 2025‐26 2026‐27 2027‐28 2028‐29 2029‐30 2030‐31 2031‐32 2032‐33 2033‐34 Over 15 Yrs
Open SpaceCapital ‐ New (Expansion) 12,000 112,000 212,000 122,000 12,000 62,000 12,000 62,000 12,000 62,000 12,000 7,362,000 12,000 62,000 12,000 8,140,000 Capital ‐ Renewal 339,500 1,563,000 673,000 718,000 768,000 768,000 768,000 773,000 768,000 768,000 768,000 1,768,000 773,000 768,000 768,000 12,751,500 Capital ‐ Upgrade 75,000 ‐ ‐ ‐ ‐ ‐ ‐ ‐ ‐ ‐ ‐ ‐ ‐ ‐ ‐ 75,000
Total 426,500 1,675,000 885,000 840,000 780,000 830,000 780,000 835,000 780,000 830,000 780,000 9,130,000 785,000 830,000 780,000 20,966,500
Renewal CalculationCapital ‐ Renewal 100% 339,500 1,563,000 673,000 718,000 768,000 768,000 768,000 773,000 768,000 768,000 768,000 1,768,000 773,000 768,000 768,000 12,751,500 Capital ‐ Upgrade 80% 60,000 ‐ ‐ ‐ ‐ ‐ ‐ ‐ ‐ ‐ ‐ ‐ ‐ ‐ ‐ 60,000
Total Renewal Expenditure 399,500 1,563,000 673,000 718,000 768,000 768,000 768,000 773,000 768,000 768,000 768,000 1,768,000 773,000 768,000 768,000 12,811,500
Asset Management Plan (AMP) Target 470,055 1,709,002 513,526 719,054 495,309 469,109 431,666 634,980 793,915 801,480 698,886 1,438,408 1,221,360 644,478 1,763,625 12,804,853 AMP Funding Gap (70,555) (146,002) 159,474 (1,054) 272,691 298,891 336,334 138,020 (25,915) (33,480) 69,114 329,592 (448,360) 123,522 (995,625) 6,647
PathwaysCapital ‐ New (Expansion) 930,000 720,000 720,000 720,000 842,000 720,000 730,000 720,000 720,000 720,000 720,000 730,000 720,000 720,000 720,000 11,152,000 Capital ‐ Renewal 700,000 300,000 300,000 300,000 425,000 500,000 500,000 500,000 500,000 500,000 500,000 500,000 500,000 500,000 500,000 7,025,000 Capital ‐ Upgrade ‐ ‐ 50,000 800,000 20,000 150,000 ‐ 150,000 175,000 ‐ ‐ ‐ ‐ ‐ ‐ 1,345,000
Total 1,630,000 1,020,000 1,070,000 1,820,000 1,287,000 1,370,000 1,230,000 1,370,000 1,395,000 1,220,000 1,220,000 1,230,000 1,220,000 1,220,000 1,220,000 19,522,000
Renewal CalculationCapital ‐ Renewal 100% 700,000 300,000 300,000 300,000 425,000 500,000 500,000 500,000 500,000 500,000 500,000 500,000 500,000 500,000 500,000 7,025,000 Capital ‐ Upgrade 80% ‐ ‐ 40,000 640,000 16,000 120,000 ‐ 120,000 140,000 ‐ ‐ ‐ ‐ ‐ ‐ 1,076,000
Total Renewal Expenditure 700,000 300,000 340,000 940,000 441,000 620,000 500,000 620,000 640,000 500,000 500,000 500,000 500,000 500,000 500,000 8,101,000
Asset Management Plan (AMP) Target 400,000 400,000 400,000 400,000 400,000 400,000 400,000 400,000 400,000 400,000 400,000 400,000 400,000 400,000 400,000 6,000,000 AMP Funding Gap 300,000 (100,000) (60,000) 540,000 41,000 220,000 100,000 220,000 240,000 100,000 100,000 100,000 100,000 100,000 100,000 2,101,000
Plant and VehiclesCapital ‐ New (Expansion) ‐ ‐ ‐ ‐ ‐ ‐ ‐ ‐ ‐ ‐ ‐ ‐ ‐ ‐ ‐ ‐ Capital ‐ Renewal 2,220,790 882,524 1,410,716 967,513 3,122,632 1,693,053 1,827,251 1,039,468 1,264,303 3,456,844 1,587,880 1,037,307 1,182,539 903,223 3,719,232 26,315,275 Capital ‐ Upgrade ‐ ‐ ‐ ‐ ‐ ‐ ‐ ‐ ‐ ‐ ‐ ‐ ‐ ‐ ‐ ‐
Total 2,220,790 882,524 1,410,716 967,513 3,122,632 1,693,053 1,827,251 1,039,468 1,264,303 3,456,844 1,587,880 1,037,307 1,182,539 903,223 3,719,232 26,315,275
Renewal CalculationCapital ‐ Renewal 100% 2,220,790 882,524 1,410,716 967,513 3,122,632 1,693,053 1,827,251 1,039,468 1,264,303 3,456,844 1,587,880 1,037,307 1,182,539 903,223 3,719,232 26,315,275 Capital ‐ Upgrade 80% ‐ ‐ ‐ ‐ ‐ ‐ ‐ ‐ ‐ ‐ ‐ ‐ ‐ ‐ ‐ ‐
Total Renewal Expenditure 2,220,790 882,524 1,410,716 967,513 3,122,632 1,693,053 1,827,251 1,039,468 1,264,303 3,456,844 1,587,880 1,037,307 1,182,539 903,223 3,719,232 26,315,275
Asset Management Plan (AMP) Target 2,112,008 923,742 1,446,934 1,008,731 3,158,850 1,611,171 1,808,609 1,092,996 1,217,911 3,476,382 1,626,748 1,044,525 1,263,757 984,441 3,800,450 26,577,255 AMP Funding Gap 108,782 (41,218) (36,218) (41,218) (36,218) 81,882 18,642 (53,528) 46,392 (19,538) (38,868) (7,218) (81,218) (81,218) (81,218) (261,980)
RefuseCapital ‐ New (Expansion) ‐ ‐ ‐ ‐ ‐ ‐ ‐ ‐ ‐ ‐ ‐ ‐ ‐ ‐ ‐ ‐ Capital ‐ Renewal 99,500 94,500 96,000 96,000 97,500 102,500 99,000 99,000 100,500 100,500 107,000 102,000 103,500 103,500 105,000 1,506,000 Capital ‐ Upgrade ‐ ‐ ‐ ‐ ‐ ‐ ‐ ‐ ‐ ‐ ‐ ‐ ‐ ‐ ‐ ‐
Total 99,500 94,500 96,000 96,000 97,500 102,500 99,000 99,000 100,500 100,500 107,000 102,000 103,500 103,500 105,000 1,506,000
Renewal CalculationCapital ‐ Renewal 100% 99,500 94,500 96,000 96,000 97,500 102,500 99,000 99,000 100,500 100,500 107,000 102,000 103,500 103,500 105,000 1,506,000 Capital ‐ Upgrade 80% ‐ ‐ ‐ ‐ ‐ ‐ ‐ ‐ ‐ ‐ ‐ ‐ ‐ ‐ ‐ ‐
Total Renewal Expenditure 99,500 94,500 96,000 96,000 97,500 102,500 99,000 99,000 100,500 100,500 107,000 102,000 103,500 103,500 105,000 1,506,000
Asset Management Plan (AMP) Target 200,000 200,000 200,000 200,000 200,000 200,000 200,000 200,000 200,000 200,000 200,000 200,000 200,000 200,000 200,000 3,000,000 AMP Funding Gap (100,500) (105,500) (104,000) (104,000) (102,500) (97,500) (101,000) (101,000) (99,500) (99,500) (93,000) (98,000) (96,500) (96,500) (95,000) (1,494,000)
Page 50 of 77

Integrated Financial Plan 2019‐20 to 2033‐34
Capital Expenditure by Asset Class ‐ Summary Draft Budget Forecast Forecast Forecast Forecast Forecast Forecast Forecast Forecast Forecast Forecast Forecast Forecast Forecast Forecast TOTALAsset Management Plan Gap Analysis 2019‐20 2020‐21 2021‐22 2022‐23 2023‐24 2024‐25 2025‐26 2026‐27 2027‐28 2028‐29 2029‐30 2030‐31 2031‐32 2032‐33 2033‐34 Over 15 Yrs
RoadsCapital ‐ New (Expansion) 108,000 455,000 180,000 100,000 100,000 100,000 275,000 200,000 100,000 140,000 850,000 850,000 100,000 100,000 100,000 3,758,000 Capital ‐ Renewal 235,000 1,970,000 2,178,000 1,445,000 2,845,000 2,315,000 3,065,000 3,315,000 3,065,000 3,165,000 3,065,000 4,065,000 4,065,000 3,065,000 3,065,000 40,923,000 Capital ‐ Upgrade 2,975,000 3,140,000 3,730,000 1,826,000 1,725,000 1,536,000 960,000 1,050,000 1,350,000 800,000 800,000 800,000 1,550,000 1,550,000 1,550,000 25,342,000
Total 3,318,000 5,565,000 6,088,000 3,371,000 4,670,000 3,951,000 4,300,000 4,565,000 4,515,000 4,105,000 4,715,000 5,715,000 5,715,000 4,715,000 4,715,000 70,023,000
Renewal CalculationCapital ‐ Renewal 100% 235,000 1,970,000 2,178,000 1,445,000 2,845,000 2,315,000 3,065,000 3,315,000 3,065,000 3,165,000 3,065,000 4,065,000 4,065,000 3,065,000 3,065,000 40,923,000 Capital ‐ Upgrade 72% 2,142,000 2,260,800 2,685,600 1,314,720 1,242,000 1,105,920 691,200 756,000 972,000 576,000 576,000 576,000 1,116,000 1,116,000 1,116,000 18,246,240
Total Renewal Expenditure 2,377,000 4,230,800 4,863,600 2,759,720 4,087,000 3,420,920 3,756,200 4,071,000 4,037,000 3,741,000 3,641,000 4,641,000 5,181,000 4,181,000 4,181,000 59,169,240
Asset Management Plan (AMP) Target 4,000,000 4,000,000 4,000,000 4,000,000 4,000,000 4,000,000 4,000,000 4,000,000 4,000,000 4,000,000 4,000,000 4,000,000 4,000,000 4,000,000 4,000,000 60,000,000 AMP Funding Gap (1,623,000) 230,800 863,600 (1,240,280) 87,000 (579,080) (243,800) 71,000 37,000 (259,000) (359,000) 641,000 1,181,000 181,000 181,000 (830,760)
SignsCapital ‐ New (Expansion) ‐ ‐ ‐ ‐ ‐ ‐ ‐ ‐ ‐ ‐ ‐ ‐ ‐ ‐ ‐ ‐ Capital ‐ Renewal 20,000 10,000 20,000 75,000 75,000 75,000 75,000 75,000 75,000 75,000 75,000 80,000 80,000 80,000 80,000 970,000 Capital ‐ Upgrade ‐ ‐ ‐ ‐ ‐ ‐ ‐ ‐ ‐ ‐ ‐ ‐ ‐ ‐ ‐ ‐
Total 20,000 10,000 20,000 75,000 75,000 75,000 75,000 75,000 75,000 75,000 75,000 80,000 80,000 80,000 80,000 970,000
Renewal CalculationCapital ‐ Renewal 100% 20,000 10,000 20,000 75,000 75,000 75,000 75,000 75,000 75,000 75,000 75,000 80,000 80,000 80,000 80,000 970,000 Capital ‐ Upgrade 80% ‐ ‐ ‐ ‐ ‐ ‐ ‐ ‐ ‐ ‐ ‐ ‐ ‐ ‐ ‐ ‐
Total Renewal Expenditure 20,000 10,000 20,000 75,000 75,000 75,000 75,000 75,000 75,000 75,000 75,000 80,000 80,000 80,000 80,000 970,000
Asset Management Plan (AMP) Target 85,235 85,235 85,235 85,235 85,235 85,235 85,235 85,235 85,235 85,235 85,235 85,235 85,235 85,235 85,235 1,278,525 AMP Funding Gap (65,235) (75,235) (65,235) (10,235) (10,235) (10,235) (10,235) (10,235) (10,235) (10,235) (10,235) (5,235) (5,235) (5,235) (5,235) (308,525)
StormwaterCapital ‐ New (Expansion) 60,000 60,000 600,000 ‐ ‐ ‐ ‐ ‐ ‐ ‐ ‐ ‐ ‐ ‐ ‐ 720,000 Capital ‐ Renewal 315,000 465,000 200,000 850,000 600,000 570,000 550,000 575,000 575,000 595,000 575,000 575,000 575,000 575,000 575,000 8,170,000 Capital ‐ Upgrade ‐ ‐ ‐ ‐ 194,500 ‐ ‐ ‐ ‐ ‐ ‐ ‐ ‐ ‐ ‐ 194,500
Total 375,000 525,000 800,000 850,000 794,500 570,000 550,000 575,000 575,000 595,000 575,000 575,000 575,000 575,000 575,000 9,084,500
Renewal CalculationCapital ‐ Renewal 100% 315,000 465,000 200,000 850,000 600,000 570,000 550,000 575,000 575,000 595,000 575,000 575,000 575,000 575,000 575,000 8,170,000 Capital ‐ Upgrade 80% ‐ ‐ ‐ ‐ 155,600 ‐ ‐ ‐ ‐ ‐ ‐ ‐ ‐ ‐ ‐ 155,600
Total Renewal Expenditure 315,000 465,000 200,000 850,000 755,600 570,000 550,000 575,000 575,000 595,000 575,000 575,000 575,000 575,000 575,000 8,325,600
Asset Management Plan (AMP) Target 580,000 580,000 580,000 580,000 580,000 580,000 580,000 580,000 580,000 580,000 580,000 580,000 580,000 580,000 580,000 8,700,000 AMP Funding Gap (265,000) (115,000) (380,000) 270,000 175,600 (10,000) (30,000) (5,000) (5,000) 15,000 (5,000) (5,000) (5,000) (5,000) (5,000) (374,400)
Page 51 of 77

Integrated Financial Plan 2019‐20 to 2033‐34
Capital Expenditure by Asset Class ‐ Summary Draft Budget Forecast Forecast Forecast Forecast Forecast Forecast Forecast Forecast Forecast Forecast Forecast Forecast Forecast Forecast TOTALAsset Management Plan Gap Analysis 2019‐20 2020‐21 2021‐22 2022‐23 2023‐24 2024‐25 2025‐26 2026‐27 2027‐28 2028‐29 2029‐30 2030‐31 2031‐32 2032‐33 2033‐34 Over 15 Yrs
StructuresCapital ‐ New (Expansion) 13,000 167,246 30,000 25,000 25,000 25,000 25,000 25,000 225,000 25,000 25,000 25,000 25,000 25,000 25,000 710,246 Capital ‐ Renewal 25,000 61,000 326,000 451,000 31,000 76,000 51,000 1,201,000 866,000 756,000 526,000 196,000 281,000 261,000 311,000 5,419,000 Capital ‐ Upgrade ‐ ‐ ‐ ‐ ‐ ‐ ‐ ‐ ‐ ‐ ‐ ‐ ‐ ‐ ‐ ‐
Total 38,000 228,246 356,000 476,000 56,000 101,000 76,000 1,226,000 1,091,000 781,000 551,000 221,000 306,000 286,000 336,000 6,129,246
Renewal CalculationCapital ‐ Renewal 100% 25,000 61,000 326,000 451,000 31,000 76,000 51,000 1,201,000 866,000 756,000 526,000 196,000 281,000 261,000 311,000 5,419,000 Capital ‐ Upgrade 80% ‐ ‐ ‐ ‐ ‐ ‐ ‐ ‐ ‐ ‐ ‐ ‐ ‐ ‐ ‐ ‐
Total Renewal Expenditure 25,000 61,000 326,000 451,000 31,000 76,000 51,000 1,201,000 866,000 756,000 526,000 196,000 281,000 261,000 311,000 5,419,000
Asset Management Plan (AMP) Target 175,000 175,000 175,000 175,000 175,000 175,000 175,000 175,000 175,000 175,000 175,000 175,000 175,000 175,000 175,000 2,625,000 AMP Funding Gap (150,000) (114,000) 151,000 276,000 (144,000) (99,000) (124,000) 1,026,000 691,000 581,000 351,000 21,000 106,000 86,000 136,000 2,794,000
Multiple Asset ClassesCapital ‐ New (Expansion) 500,000 5,000,000 ‐ ‐ 300,000 ‐ 2,000,000 ‐ ‐ 2,000,000 ‐ ‐ 500,000 ‐ ‐ 10,300,000 Capital ‐ Renewal 325,000 325,000 ‐ ‐ ‐ ‐ ‐ ‐ ‐ ‐ ‐ ‐ ‐ ‐ ‐ 650,000 Capital ‐ Upgrade ‐ ‐ ‐ ‐ ‐ ‐ ‐ ‐ ‐ ‐ ‐ ‐ ‐ ‐ ‐ ‐
Total 825,000 5,325,000 ‐ ‐ 300,000 ‐ 2,000,000 ‐ ‐ 2,000,000 ‐ ‐ 500,000 ‐ ‐ 10,950,000
Renewal CalculationCapital ‐ Renewal 100% 325,000 325,000 ‐ ‐ ‐ ‐ ‐ ‐ ‐ ‐ ‐ ‐ ‐ ‐ ‐ 650,000 Capital ‐ Upgrade 80% ‐ ‐ ‐ ‐ ‐ ‐ ‐ ‐ ‐ ‐ ‐ ‐ ‐ ‐ ‐ ‐
Total Renewal Expenditure 325,000 325,000 ‐ ‐ ‐ ‐ ‐ ‐ ‐ ‐ ‐ ‐ ‐ ‐ ‐ 650,000
Asset Management Plan (AMP) Target ‐ ‐ ‐ ‐ ‐ ‐ ‐ ‐ ‐ ‐ ‐ ‐ ‐ ‐ ‐ ‐ AMP Funding Gap 325,000 325,000 ‐ ‐ ‐ ‐ ‐ ‐ ‐ ‐ ‐ ‐ ‐ ‐ ‐ 650,000
ALL ASSET CLASSESCapital ‐ New (Expansion) 2,151,000 6,804,246 1,782,000 1,027,000 1,339,000 1,324,295 3,082,000 1,047,000 1,109,000 2,987,000 1,677,000 9,307,000 1,397,000 947,000 897,000 36,877,541 Capital ‐ Renewal 6,517,175 8,715,700 6,661,828 6,594,935 9,546,897 8,096,221 9,122,281 11,328,043 11,326,188 13,739,208 10,304,747 11,184,637 10,061,239 9,911,650 11,880,033 144,990,782 Capital ‐ Upgrade 3,520,000 3,280,000 3,910,000 2,646,000 1,959,500 1,816,000 980,000 1,220,000 1,545,000 820,000 820,000 820,000 1,570,000 1,570,000 1,570,000 28,046,500
Total 12,188,175 18,799,946 12,353,828 10,267,935 12,845,397 11,236,516 13,184,281 13,595,043 13,980,188 17,546,208 12,801,747 21,311,637 13,028,239 12,428,650 14,347,033 209,914,823
Renewal CalculationCapital ‐ Renewal 6,517,175 8,715,700 6,661,828 6,594,935 9,546,897 8,096,221 9,122,281 11,328,043 11,326,188 13,739,208 10,304,747 11,184,637 10,061,239 9,911,650 11,880,033 144,990,782 Capital ‐ Upgrade 2,578,000 2,372,800 2,829,600 1,970,720 1,429,600 1,329,920 707,200 892,000 1,128,000 592,000 592,000 592,000 1,132,000 1,132,000 1,132,000 20,409,840
Total Renewal Expenditure 9,095,175 11,088,500 9,491,428 8,565,655 10,976,497 9,426,141 9,829,481 12,220,043 12,454,188 14,331,208 10,896,747 11,776,637 11,193,239 11,043,650 13,012,033 165,400,622
Asset Management Plan (AMP) Target 10,192,746 11,245,502 10,267,606 9,516,523 11,167,205 8,587,201 9,098,693 14,870,935 10,253,574 17,221,115 9,480,801 9,597,879 11,108,958 9,491,586 14,130,090 166,230,414 AMP Funding Gap (1,097,571) (157,002) (776,178) (950,868) (190,708) 838,940 730,788 (2,650,892) 2,200,614 (2,889,907) 1,415,946 2,178,758 84,281 1,552,064 (1,118,057) (829,792)
Asset Renewal / Future Capital Works CapacityCapital ‐ New (Expansion) ‐ ‐ ‐ ‐ ‐ ‐ ‐ ‐ ‐ ‐ ‐ ‐ ‐ ‐ ‐ ‐ Capital ‐ Renewal ‐ ‐ ‐ ‐ ‐ ‐ 250,000 250,000 250,000 250,000 2,250,000 1,250,000 1,250,000 2,250,000 1,250,000 9,250,000 Capital ‐ Upgrade ‐ ‐ ‐ ‐ ‐ ‐ ‐ ‐ ‐ ‐ ‐ ‐ ‐ ‐ ‐ ‐
Total ‐ ‐ ‐ ‐ ‐ ‐ 250,000 250,000 250,000 250,000 2,250,000 1,250,000 1,250,000 2,250,000 1,250,000 9,250,000
Renewal CalculationCapital ‐ Renewal 100% ‐ ‐ ‐ ‐ ‐ ‐ 250,000 250,000 250,000 250,000 2,250,000 1,250,000 1,250,000 2,250,000 1,250,000 9,250,000 Capital ‐ Upgrade 80% ‐ ‐ ‐ ‐ ‐ ‐ ‐ ‐ ‐ ‐ ‐ ‐ ‐ ‐ ‐ ‐
Total Renewal Expenditure ‐ ‐ ‐ ‐ ‐ ‐ 250,000 250,000 250,000 250,000 2,250,000 1,250,000 1,250,000 2,250,000 1,250,000 9,250,000
Page 52 of 77

Integrated Financial Plan 2019‐20 to 2033‐34
Draft Budget Forecast Forecast Forecast Forecast Forecast Forecast Forecast Forecast Forecast Forecast Forecast Forecast Forecast Forecast
2019‐20 2020‐21 2021‐22 2022‐23 2023‐24 2024‐25 2025‐26 2026‐27 2027‐28 2028‐29 2029‐30 2030‐31 2031‐32 2032‐33 2033‐34
Capital ‐ New (Expansion) ARTS AND CULTURE
Purchase artworks for the City Art CollectionPurc Expenditure (20,000) (20,000) (20,000) (20,000) (20,000) (20,000) (20,000) (20,000) (20,000) (20,000) (20,000) (20,000) (20,000) (20,000) (20,000)
Total ‐ Ca Total ‐ Capital ‐ New (Expansion) (20,000) (20,000) (20,000) (20,000) (20,000) (20,000) (20,000) (20,000) (20,000) (20,000) (20,000) (20,000) (20,000) (20,000) (20,000)
Capital ‐ Renewal ARTS AND CULTURE
Replace Christmas street decorationsRepl Expenditure (16,920) (17,061) (17,317) (17,577) (17,840) (18,108) (18,380) (18,655) (18,935) (19,219) (19,507) (19,800) (20,000) (20,297) (20,601)
Total ‐ Ca Total ‐ Capital ‐ Renewal (16,920) (17,061) (17,317) (17,577) (17,840) (18,108) (18,380) (18,655) (18,935) (19,219) (19,507) (19,800) (20,000) (20,297) (20,601)
TOTAL ARTS AND CULTURE (36,920) (37,061) (37,317) (37,577) (37,840) (38,108) (38,380) (38,655) (38,935) (39,219) (39,507) (39,800) (40,000) (40,297) (40,601)
Capital Expenditure by Asset Class
Page 53 of 77

Integrated Financial Plan 2019‐20 to 2033‐34
Draft Budget Forecast Forecast Forecast Forecast Forecast Forecast Forecast Forecast Forecast Forecast Forecast Forecast Forecast Forecast
2019‐20 2020‐21 2021‐22 2022‐23 2023‐24 2024‐25 2025‐26 2026‐27 2027‐28 2028‐29 2029‐30 2030‐31 2031‐32 2032‐33 2033‐34Capital Expenditure by Asset Class
Capital ‐ Renewal BRIDGES
Replace footbridge at Ocean Drive and Hayward StreetRepl Expenditure ‐ (100,000) ‐ ‐ ‐ ‐ ‐ ‐ ‐ ‐ ‐ ‐ ‐ ‐ ‐
Replace footbridgesRepl Expenditure ‐ ‐ (20,000) ‐ ‐ (25,000) ‐ ‐ (75,000) (85,000) ‐ (30,000) ‐ ‐ ‐
Total ‐ Ca Total ‐ Capital ‐ Renewal ‐ (100,000) (20,000) ‐ ‐ (25,000) ‐ ‐ (75,000) (85,000) ‐ (30,000) ‐ ‐ ‐
TOTAL BRIDGES ‐ (100,000) (20,000) ‐ ‐ (25,000) ‐ ‐ (75,000) (85,000) ‐ (30,000) ‐ ‐ ‐
Page 54 of 77
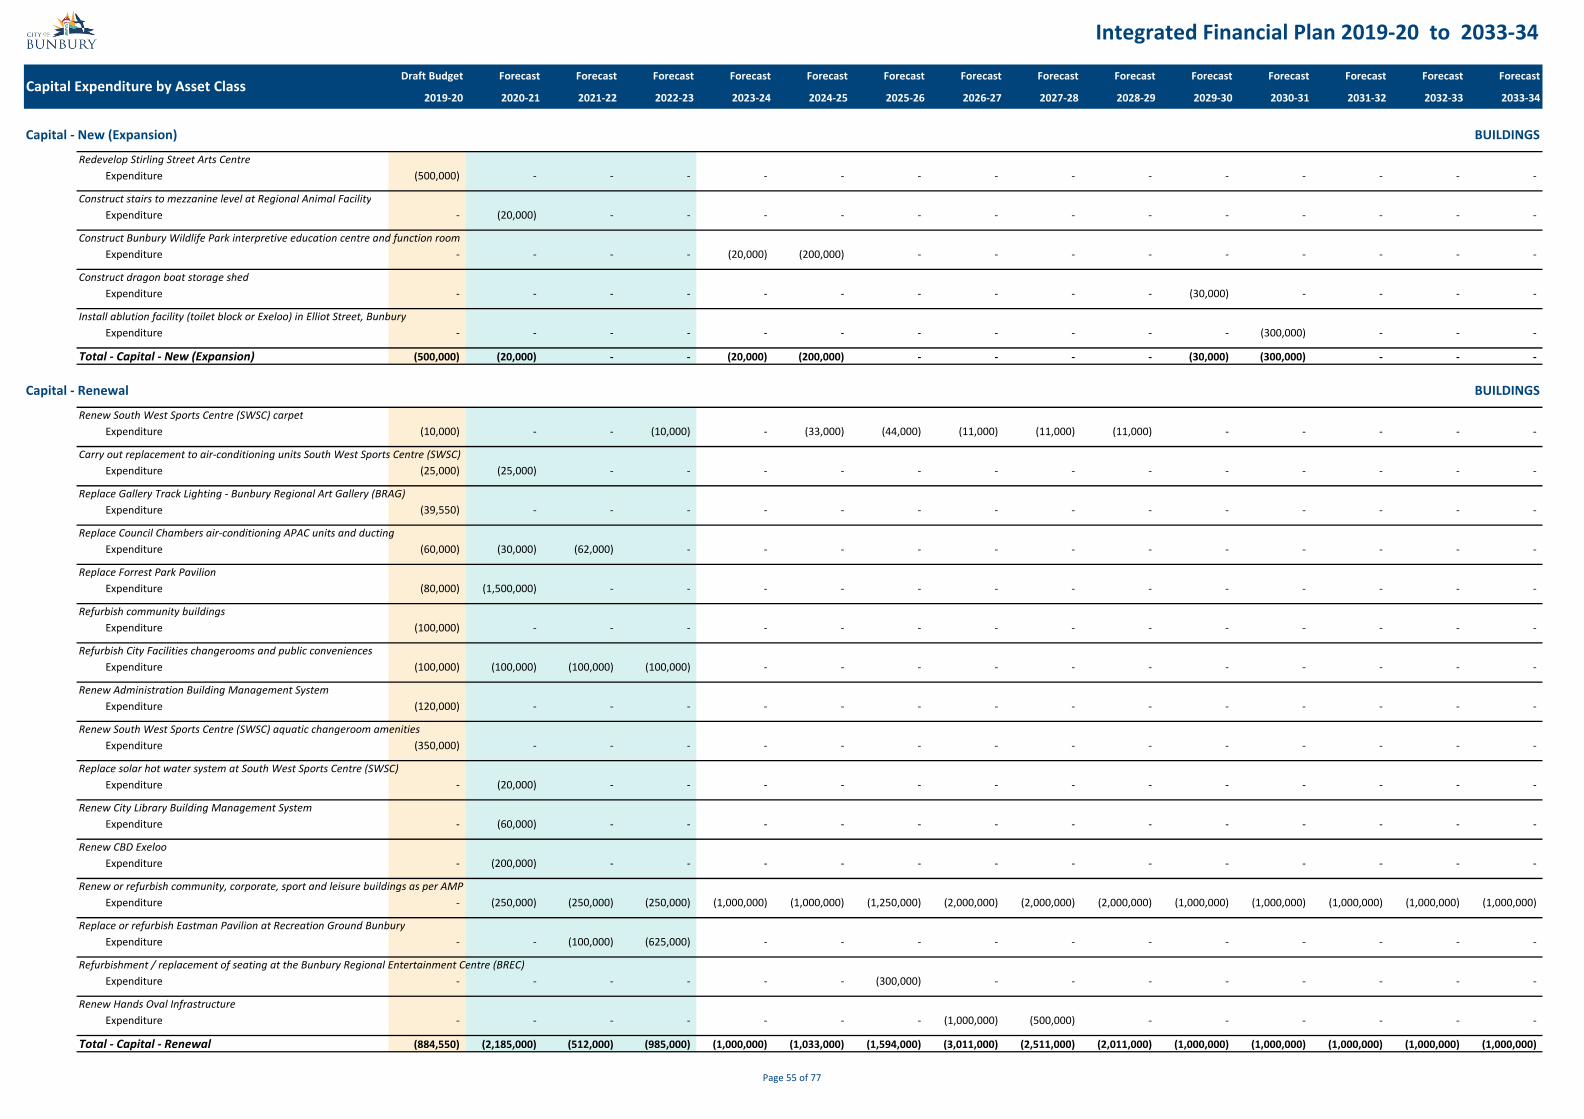
Integrated Financial Plan 2019‐20 to 2033‐34
Draft Budget Forecast Forecast Forecast Forecast Forecast Forecast Forecast Forecast Forecast Forecast Forecast Forecast Forecast Forecast
2019‐20 2020‐21 2021‐22 2022‐23 2023‐24 2024‐25 2025‐26 2026‐27 2027‐28 2028‐29 2029‐30 2030‐31 2031‐32 2032‐33 2033‐34Capital Expenditure by Asset Class
Capital ‐ New (Expansion) BUILDINGS
Redevelop Stirling Street Arts CentreRedeExpenditure (500,000) ‐ ‐ ‐ ‐ ‐ ‐ ‐ ‐ ‐ ‐ ‐ ‐ ‐ ‐
Construct stairs to mezzanine level at Regional Animal FacilityConsExpenditure ‐ (20,000) ‐ ‐ ‐ ‐ ‐ ‐ ‐ ‐ ‐ ‐ ‐ ‐ ‐
Construct Bunbury Wildlife Park interpretive education centre and function roomConsExpenditure ‐ ‐ ‐ ‐ (20,000) (200,000) ‐ ‐ ‐ ‐ ‐ ‐ ‐ ‐ ‐
Construct dragon boat storage shedConsExpenditure ‐ ‐ ‐ ‐ ‐ ‐ ‐ ‐ ‐ ‐ (30,000) ‐ ‐ ‐ ‐
Install ablution facility (toilet block or Exeloo) in Elliot Street, BunburyInstaExpenditure ‐ ‐ ‐ ‐ ‐ ‐ ‐ ‐ ‐ ‐ ‐ (300,000) ‐ ‐ ‐
Total ‐ Ca Total ‐ Capital ‐ New (Expansion) (500,000) (20,000) ‐ ‐ (20,000) (200,000) ‐ ‐ ‐ ‐ (30,000) (300,000) ‐ ‐ ‐
Capital ‐ Renewal BUILDINGS
Renew South West Sports Centre (SWSC) carpetReneExpenditure (10,000) ‐ ‐ (10,000) ‐ (33,000) (44,000) (11,000) (11,000) (11,000) ‐ ‐ ‐ ‐ ‐
Carry out replacement to air‐conditioning units South West Sports Centre (SWSC)CarryExpenditure (25,000) (25,000) ‐ ‐ ‐ ‐ ‐ ‐ ‐ ‐ ‐ ‐ ‐ ‐ ‐
Replace Gallery Track Lighting ‐ Bunbury Regional Art Gallery (BRAG)Repl Expenditure (39,550) ‐ ‐ ‐ ‐ ‐ ‐ ‐ ‐ ‐ ‐ ‐ ‐ ‐ ‐
Replace Council Chambers air‐conditioning APAC units and ductingRepl Expenditure (60,000) (30,000) (62,000) ‐ ‐ ‐ ‐ ‐ ‐ ‐ ‐ ‐ ‐ ‐ ‐
Replace Forrest Park PavilionRepl Expenditure (80,000) (1,500,000) ‐ ‐ ‐ ‐ ‐ ‐ ‐ ‐ ‐ ‐ ‐ ‐ ‐
Refurbish community buildingsRefu Expenditure (100,000) ‐ ‐ ‐ ‐ ‐ ‐ ‐ ‐ ‐ ‐ ‐ ‐ ‐ ‐
Refurbish City Facilities changerooms and public conveniencesRefu Expenditure (100,000) (100,000) (100,000) (100,000) ‐ ‐ ‐ ‐ ‐ ‐ ‐ ‐ ‐ ‐ ‐
Renew Administration Building Management SystemReneExpenditure (120,000) ‐ ‐ ‐ ‐ ‐ ‐ ‐ ‐ ‐ ‐ ‐ ‐ ‐ ‐
Renew South West Sports Centre (SWSC) aquatic changeroom amenitiesReneExpenditure (350,000) ‐ ‐ ‐ ‐ ‐ ‐ ‐ ‐ ‐ ‐ ‐ ‐ ‐ ‐
Replace solar hot water system at South West Sports Centre (SWSC)Repl Expenditure ‐ (20,000) ‐ ‐ ‐ ‐ ‐ ‐ ‐ ‐ ‐ ‐ ‐ ‐ ‐
Renew City Library Building Management SystemReneExpenditure ‐ (60,000) ‐ ‐ ‐ ‐ ‐ ‐ ‐ ‐ ‐ ‐ ‐ ‐ ‐
Renew CBD ExelooReneExpenditure ‐ (200,000) ‐ ‐ ‐ ‐ ‐ ‐ ‐ ‐ ‐ ‐ ‐ ‐ ‐
Renew or refurbish community, corporate, sport and leisure buildings as per AMPReneExpenditure ‐ (250,000) (250,000) (250,000) (1,000,000) (1,000,000) (1,250,000) (2,000,000) (2,000,000) (2,000,000) (1,000,000) (1,000,000) (1,000,000) (1,000,000) (1,000,000)
Replace or refurbish Eastman Pavilion at Recreation Ground BunburyRepl Expenditure ‐ ‐ (100,000) (625,000) ‐ ‐ ‐ ‐ ‐ ‐ ‐ ‐ ‐ ‐ ‐
Refurbishment / replacement of seating at the Bunbury Regional Entertainment Centre (BREC)Refu Expenditure ‐ ‐ ‐ ‐ ‐ ‐ (300,000) ‐ ‐ ‐ ‐ ‐ ‐ ‐ ‐
Renew Hands Oval InfrastructureReneExpenditure ‐ ‐ ‐ ‐ ‐ ‐ ‐ (1,000,000) (500,000) ‐ ‐ ‐ ‐ ‐ ‐
Total ‐ Ca Total ‐ Capital ‐ Renewal (884,550) (2,185,000) (512,000) (985,000) (1,000,000) (1,033,000) (1,594,000) (3,011,000) (2,511,000) (2,011,000) (1,000,000) (1,000,000) (1,000,000) (1,000,000) (1,000,000)
Page 55 of 77

Integrated Financial Plan 2019‐20 to 2033‐34
Draft Budget Forecast Forecast Forecast Forecast Forecast Forecast Forecast Forecast Forecast Forecast Forecast Forecast Forecast Forecast
2019‐20 2020‐21 2021‐22 2022‐23 2023‐24 2024‐25 2025‐26 2026‐27 2027‐28 2028‐29 2029‐30 2030‐31 2031‐32 2032‐33 2033‐34Capital Expenditure by Asset Class
Capital ‐ Upgrade BUILDINGS
Support the Stirling Street Arts CentreSuppExpenditure (20,000) (20,000) (20,000) (20,000) (20,000) (20,000) (20,000) (20,000) (20,000) (20,000) (20,000) (20,000) (20,000) (20,000) (20,000)
Upgrade facilities to meet the goal of becoming the Most Accessible Regional City in AustraliaUpgrExpenditure (100,000) (100,000) (100,000) ‐ ‐ ‐ ‐ ‐ ‐ ‐ ‐ ‐ ‐ ‐ ‐
Upgrade building fire suppression system at the South West Sports Centre (SWSC)UpgrExpenditure (350,000) ‐ ‐ ‐ ‐ ‐ ‐ ‐ ‐ ‐ ‐ ‐ ‐ ‐ ‐
Reconfigure Public PC Computer SpaceRecoExpenditure ‐ (20,000) ‐ ‐ ‐ ‐ ‐ ‐ ‐ ‐ ‐ ‐ ‐ ‐ ‐
Reconfigure Refreshments Area at LibrariesRecoExpenditure ‐ ‐ (10,000) ‐ ‐ ‐ ‐ ‐ ‐ ‐ ‐ ‐ ‐ ‐ ‐
Reconfiguration of Bunbury Library Front Desk ServiceRecoExpenditure ‐ ‐ ‐ ‐ ‐ (30,000) ‐ ‐ ‐ ‐ ‐ ‐ ‐ ‐ ‐
Upgrade Bunbury Wildlife Park's Wildside CafeUpgrExpenditure ‐ ‐ ‐ ‐ ‐ (80,000) ‐ ‐ ‐ ‐ ‐ ‐ ‐ ‐ ‐
Total ‐ Ca Total ‐ Capital ‐ Upgrade (470,000) (140,000) (130,000) (20,000) (20,000) (130,000) (20,000) (20,000) (20,000) (20,000) (20,000) (20,000) (20,000) (20,000) (20,000)
TOTAL BUILDINGS (1,854,550) (2,345,000) (642,000) (1,005,000) (1,040,000) (1,363,000) (1,614,000) (3,031,000) (2,531,000) (2,031,000) (1,050,000) (1,320,000) (1,020,000) (1,020,000) (1,020,000)
Page 56 of 77

Integrated Financial Plan 2019‐20 to 2033‐34
Draft Budget Forecast Forecast Forecast Forecast Forecast Forecast Forecast Forecast Forecast Forecast Forecast Forecast Forecast Forecast
2019‐20 2020‐21 2021‐22 2022‐23 2023‐24 2024‐25 2025‐26 2026‐27 2027‐28 2028‐29 2029‐30 2030‐31 2031‐32 2032‐33 2033‐34Capital Expenditure by Asset Class
Capital ‐ Renewal BUS SHELTERS
Renewal of bus stops, bus shelters and public transport ‐ road network expansionReneExpenditure (20,000) (20,000) (20,000) (20,000) (20,000) (20,000) (20,000) (20,000) (20,000) (20,000) (20,000) (20,000) (20,000) (20,000) (20,000)
Total ‐ Ca Total ‐ Capital ‐ Renewal (20,000) (20,000) (20,000) (20,000) (20,000) (20,000) (20,000) (20,000) (20,000) (20,000) (20,000) (20,000) (20,000) (20,000) (20,000)
TOTAL BUS SHELTERS (20,000) (20,000) (20,000) (20,000) (20,000) (20,000) (20,000) (20,000) (20,000) (20,000) (20,000) (20,000) (20,000) (20,000) (20,000)
Page 57 of 77

Integrated Financial Plan 2019‐20 to 2033‐34
Draft Budget Forecast Forecast Forecast Forecast Forecast Forecast Forecast Forecast Forecast Forecast Forecast Forecast Forecast Forecast
2019‐20 2020‐21 2021‐22 2022‐23 2023‐24 2024‐25 2025‐26 2026‐27 2027‐28 2028‐29 2029‐30 2030‐31 2031‐32 2032‐33 2033‐34Capital Expenditure by Asset Class
Capital ‐ New (Expansion) EQUIPMENT
Purchase of Interactive Display Boards for BunburyPurc Expenditure ‐ (12,000) ‐ ‐ ‐ ‐ ‐ ‐ (12,000) ‐ ‐ ‐ ‐ ‐ ‐
Purchase of Multi‐Touch Hub for Literacy and LearningPurc Expenditure ‐ ‐ ‐ (15,000) ‐ ‐ ‐ ‐ ‐ ‐ ‐ ‐ ‐ ‐ ‐
Procure and install Radio Frequency Identification (RFID) and self loans technology at Bunbury and Withers LibrariesProc Expenditure ‐ ‐ ‐ ‐ ‐ (142,295) ‐ ‐ ‐ ‐ ‐ ‐ ‐ ‐ ‐
Total ‐ Ca Total ‐ Capital ‐ New (Expansion) ‐ (12,000) ‐ (15,000) ‐ (142,295) ‐ ‐ (12,000) ‐ ‐ ‐ ‐ ‐ ‐
Capital ‐ Renewal EQUIPMENT
Renew South West Sports Centre (SWSC) childcare and administration equipmentReneExpenditure (1,915) (10,270) (1,610) (11,315) (11,860) (11,550) (1,610) (12,960) (1,925) (1,030) (14,160) (2,100) ‐ ‐ ‐
Renew South West Sports Centre (SWSC) cafe equipmentReneExpenditure (3,380) ‐ ‐ (9,220) (4,430) ‐ (3,360) (11,070) (3,560) (4,410) ‐ ‐ ‐ ‐ ‐
Renew South West Sports Centre (SWSC) aquatics equipmentReneExpenditure (4,930) (16,620) (1,100) (6,370) (29,570) (20,780) (71,740) (15,700) (2,450) (35,800) (5,050) (1,440) ‐ ‐ ‐
Replacement of Shelving Trolleys for LibrariesRepl Expenditure (9,990) ‐ ‐ ‐ ‐ ‐ ‐ ‐ ‐ ‐ ‐ ‐ ‐ ‐ ‐
Replace sports equipmentRepl Expenditure (10,000) ‐ ‐ (10,000) ‐ ‐ (10,000) ‐ ‐ (10,000) ‐ ‐ (10,000) ‐ ‐
Support Bunbury Regional Entertainment Centre (BREC) through the purchase of equipmentSuppExpenditure (100,000) (100,000) (100,000) (100,000) (100,000) (100,000) (100,000) (100,000) (100,000) (100,000) (100,000) (100,000) (100,000) (100,000) (100,000)
Renew South West Sports Centre (SWSC) electrical equipmentReneExpenditure ‐ (3,190) (1,300) (6,740) (8,820) (4,420) ‐ (10,560) (12,250) (2,070) (1,210) (2,240) ‐ ‐ ‐
Installation of Interactive Visual Library Display Areas ‐ Bunbury LibraryInstaExpenditure ‐ (4,600) ‐ ‐ ‐ ‐ (4,600) ‐ ‐ ‐ ‐ (4,600) ‐ ‐ ‐
Replace Coin Billing Machine ‐ Withers LibraryRepl Expenditure ‐ (5,000) ‐ ‐ ‐ ‐ (5,000) ‐ ‐ ‐ ‐ (5,000) ‐ ‐ ‐
Renew South West Sports Centre (SWSC) stadium equipmentReneExpenditure ‐ ‐ (3,225) ‐ (17,590) ‐ ‐ ‐ ‐ (15,980) ‐ (1,650) ‐ ‐ ‐
Replace Asset Drainage CameraRepl Expenditure ‐ ‐ (30,000) ‐ ‐ ‐ ‐ ‐ ‐ ‐ ‐ ‐ (30,000) ‐ ‐
Replace Coin Billing Machine ‐ Bunbury LibraryRepl Expenditure ‐ ‐ ‐ (5,000) ‐ ‐ ‐ ‐ (5,000) ‐ ‐ ‐ ‐ (5,000) ‐
Replace Asset Data Collection and Engineering Surveying EquipmentRepl Expenditure ‐ ‐ ‐ (35,000) ‐ ‐ ‐ ‐ (35,000) ‐ ‐ ‐ ‐ (35,000) ‐
Total ‐ Ca Total ‐ Capital ‐ Renewal (130,215) (139,680) (137,235) (183,645) (172,270) (136,750) (196,310) (150,290) (160,185) (169,290) (120,420) (117,030) (140,000) (140,000) (100,000)
TOTAL EQUIPMENT (130,215) (151,680) (137,235) (198,645) (172,270) (279,045) (196,310) (150,290) (172,185) (169,290) (120,420) (117,030) (140,000) (140,000) (100,000)
Page 58 of 77

Integrated Financial Plan 2019‐20 to 2033‐34
Draft Budget Forecast Forecast Forecast Forecast Forecast Forecast Forecast Forecast Forecast Forecast Forecast Forecast Forecast Forecast
2019‐20 2020‐21 2021‐22 2022‐23 2023‐24 2024‐25 2025‐26 2026‐27 2027‐28 2028‐29 2029‐30 2030‐31 2031‐32 2032‐33 2033‐34Capital Expenditure by Asset Class
Capital ‐ New (Expansion) FURNITURE AND FITTINGS
Expand Bunbury Wildlife Park merchandise shelvingExpa Expenditure ‐ (10,000) ‐ ‐ ‐ ‐ ‐ ‐ ‐ ‐ ‐ ‐ ‐ ‐ ‐
Total ‐ Ca Total ‐ Capital ‐ New (Expansion) ‐ (10,000) ‐ ‐ ‐ ‐ ‐ ‐ ‐ ‐ ‐ ‐ ‐ ‐ ‐
Capital ‐ Renewal FURNITURE AND FITTINGS
Renew South West Sports Centre (SWSC) furnishingsReneExpenditure ‐ (6,655) (7,760) ‐ (9,965) (2,610) (16,960) (2,770) (6,275) (10,615) (13,990) (5,280) ‐ ‐ ‐
Renew South West Sports Centre (SWSC) fittingsReneExpenditure ‐ (22,880) (4,200) ‐ (1,490) ‐ (10,750) (1,660) (4,790) (1,540) (5,750) (8,020) ‐ ‐ ‐
Replace Cafe furniture at Bunbury Wildlife ParkRepl Expenditure ‐ ‐ (20,000) ‐ ‐ ‐ ‐ (20,000) ‐ ‐ ‐ ‐ (20,000) ‐ ‐
Replacement of Junior Book Box ‐ Withers LibraryRepl Expenditure ‐ ‐ ‐ ‐ ‐ ‐ (3,300) ‐ ‐ ‐ ‐ ‐ ‐ (3,300) ‐
Replace customer furnishings at Bunbury City LibraryRepl Expenditure ‐ ‐ ‐ ‐ ‐ ‐ (26,130) ‐ ‐ ‐ ‐ ‐ ‐ (26,130) ‐
Total ‐ Ca Total ‐ Capital ‐ Renewal ‐ (29,535) (31,960) ‐ (11,455) (2,610) (57,140) (24,430) (11,065) (12,155) (19,740) (13,300) (20,000) (29,430) ‐
TOTAL FURNITURE AND FITTINGS ‐ (39,535) (31,960) ‐ (11,455) (2,610) (57,140) (24,430) (11,065) (12,155) (19,740) (13,300) (20,000) (29,430) ‐
Page 59 of 77

Integrated Financial Plan 2019‐20 to 2033‐34
Draft Budget Forecast Forecast Forecast Forecast Forecast Forecast Forecast Forecast Forecast Forecast Forecast Forecast Forecast Forecast
2019‐20 2020‐21 2021‐22 2022‐23 2023‐24 2024‐25 2025‐26 2026‐27 2027‐28 2028‐29 2029‐30 2030‐31 2031‐32 2032‐33 2033‐34Capital Expenditure by Asset Class
Capital ‐ New (Expansion) IT EQUIPMENT
Install additional CCTV cameras at Regional Animal FacilityInstaExpenditure (8,000) ‐ ‐ ‐ ‐ ‐ ‐ ‐ ‐ ‐ ‐ ‐ ‐ ‐ ‐
Purchase of 3D Printer for LibrariesPurc Expenditure ‐ ‐ ‐ (5,000) ‐ ‐ ‐ ‐ ‐ ‐ ‐ ‐ ‐ ‐ ‐
Purchase of Laptop/Tablet Computers for Dispenser ServicePurc Expenditure ‐ ‐ ‐ ‐ ‐ (35,000) ‐ ‐ ‐ ‐ ‐ ‐ ‐ ‐ ‐
Total ‐ Ca Total ‐ Capital ‐ New (Expansion) (8,000) ‐ ‐ (5,000) ‐ (35,000) ‐ ‐ ‐ ‐ ‐ ‐ ‐ ‐ ‐
Capital ‐ Renewal IT EQUIPMENT
Replacement of networking equipmentRepl Expenditure (25,000) (25,000) (25,000) (25,000) (25,000) (25,000) (25,000) (25,000) (25,000) (25,000) (25,000) (25,000) (25,000) (25,000) (25,000)
Asset Replacement ‐ Corporate Printers and PhotocopiersAsse Expenditure (30,000) (30,000) (30,000) (30,000) (30,000) (30,000) (30,000) (30,000) (30,000) (30,000) (30,000) (30,000) (30,000) (30,000) (30,000)
Asset Replacement ‐ Fixed and mobile phones and devicesAsse Expenditure (46,200) (46,200) (46,200) (46,200) (46,200) (46,200) (46,200) (46,200) (46,200) (46,200) (46,200) (46,200) (46,200) (46,200) (46,200)
Asset Replacement ‐ Personal ComputersAsse Expenditure (100,000) (100,000) (100,000) (100,000) (100,000) (100,000) (100,000) (100,000) (100,000) (100,000) (100,000) (100,000) (100,000) (100,000) (100,000)
Replace and implement renewal of Library Management System (LMS)Repl Expenditure ‐ ‐ ‐ (100,000) ‐ ‐ ‐ ‐ (100,000) ‐ ‐ ‐ ‐ (100,000) ‐
Replace Council Chambers Audio Visual and Streaming EquipmentRepl Expenditure ‐ ‐ ‐ ‐ (60,000) ‐ ‐ ‐ ‐ (60,000) ‐ ‐ ‐ ‐ ‐
Total ‐ Ca Total ‐ Capital ‐ Renewal (201,200) (201,200) (201,200) (301,200) (261,200) (201,200) (201,200) (201,200) (301,200) (261,200) (201,200) (201,200) (201,200) (301,200) (201,200)
TOTAL IT EQUIPMENT (209,200) (201,200) (201,200) (306,200) (261,200) (236,200) (201,200) (201,200) (301,200) (261,200) (201,200) (201,200) (201,200) (301,200) (201,200)
Page 60 of 77

Integrated Financial Plan 2019‐20 to 2033‐34
Draft Budget Forecast Forecast Forecast Forecast Forecast Forecast Forecast Forecast Forecast Forecast Forecast Forecast Forecast Forecast
2019‐20 2020‐21 2021‐22 2022‐23 2023‐24 2024‐25 2025‐26 2026‐27 2027‐28 2028‐29 2029‐30 2030‐31 2031‐32 2032‐33 2033‐34Capital Expenditure by Asset Class
Capital ‐ New (Expansion) LIGHTING
Install hotspot street lightingInstaExpenditure ‐ (20,000) (20,000) (20,000) (20,000) (20,000) (20,000) (20,000) (20,000) (20,000) (20,000) (20,000) (20,000) (20,000) (20,000)
Total ‐ Ca Total ‐ Capital ‐ New (Expansion) ‐ (20,000) (20,000) (20,000) (20,000) (20,000) (20,000) (20,000) (20,000) (20,000) (20,000) (20,000) (20,000) (20,000) (20,000)
Capital ‐ Renewal LIGHTING
Renew decorative lighting (Lighting Up Bunbury)ReneExpenditure (10,000) ‐ ‐ ‐ ‐ ‐ ‐ ‐ ‐ ‐ ‐ ‐ ‐ ‐ ‐
Renew minor parks and reserves lightingReneExpenditure (10,000) (7,500) (5,000) (5,000) ‐ ‐ ‐ ‐ ‐ ‐ ‐ ‐ ‐ ‐ ‐
Renew City Facilities lightingReneExpenditure (15,000) (10,000) (10,000) (10,000) ‐ ‐ ‐ ‐ ‐ ‐ ‐ ‐ ‐ ‐ ‐
Replace Street LightingRepl Expenditure (15,000) (10,000) (25,000) (25,000) ‐ ‐ ‐ (180,000) (600,000) (600,000) (620,000) ‐ ‐ ‐ ‐
Renew Ocean Drive pathway and carpark lightingReneExpenditure (25,000) (25,000) ‐ ‐ ‐ ‐ ‐ ‐ ‐ ‐ ‐ ‐ ‐ ‐ ‐
Replace sportsground lightingRepl Expenditure ‐ ‐ ‐ ‐ ‐ (100,000) ‐ ‐ ‐ ‐ ‐ ‐ ‐ (1,000,000) ‐
Total ‐ Ca Total ‐ Capital ‐ Renewal (75,000) (52,500) (40,000) (40,000) ‐ (100,000) ‐ (180,000) (600,000) (600,000) (620,000) ‐ ‐ (1,000,000) ‐
TOTAL LIGHTING (75,000) (72,500) (60,000) (60,000) (20,000) (120,000) (20,000) (200,000) (620,000) (620,000) (640,000) (20,000) (20,000) (1,020,000) (20,000)
Page 61 of 77
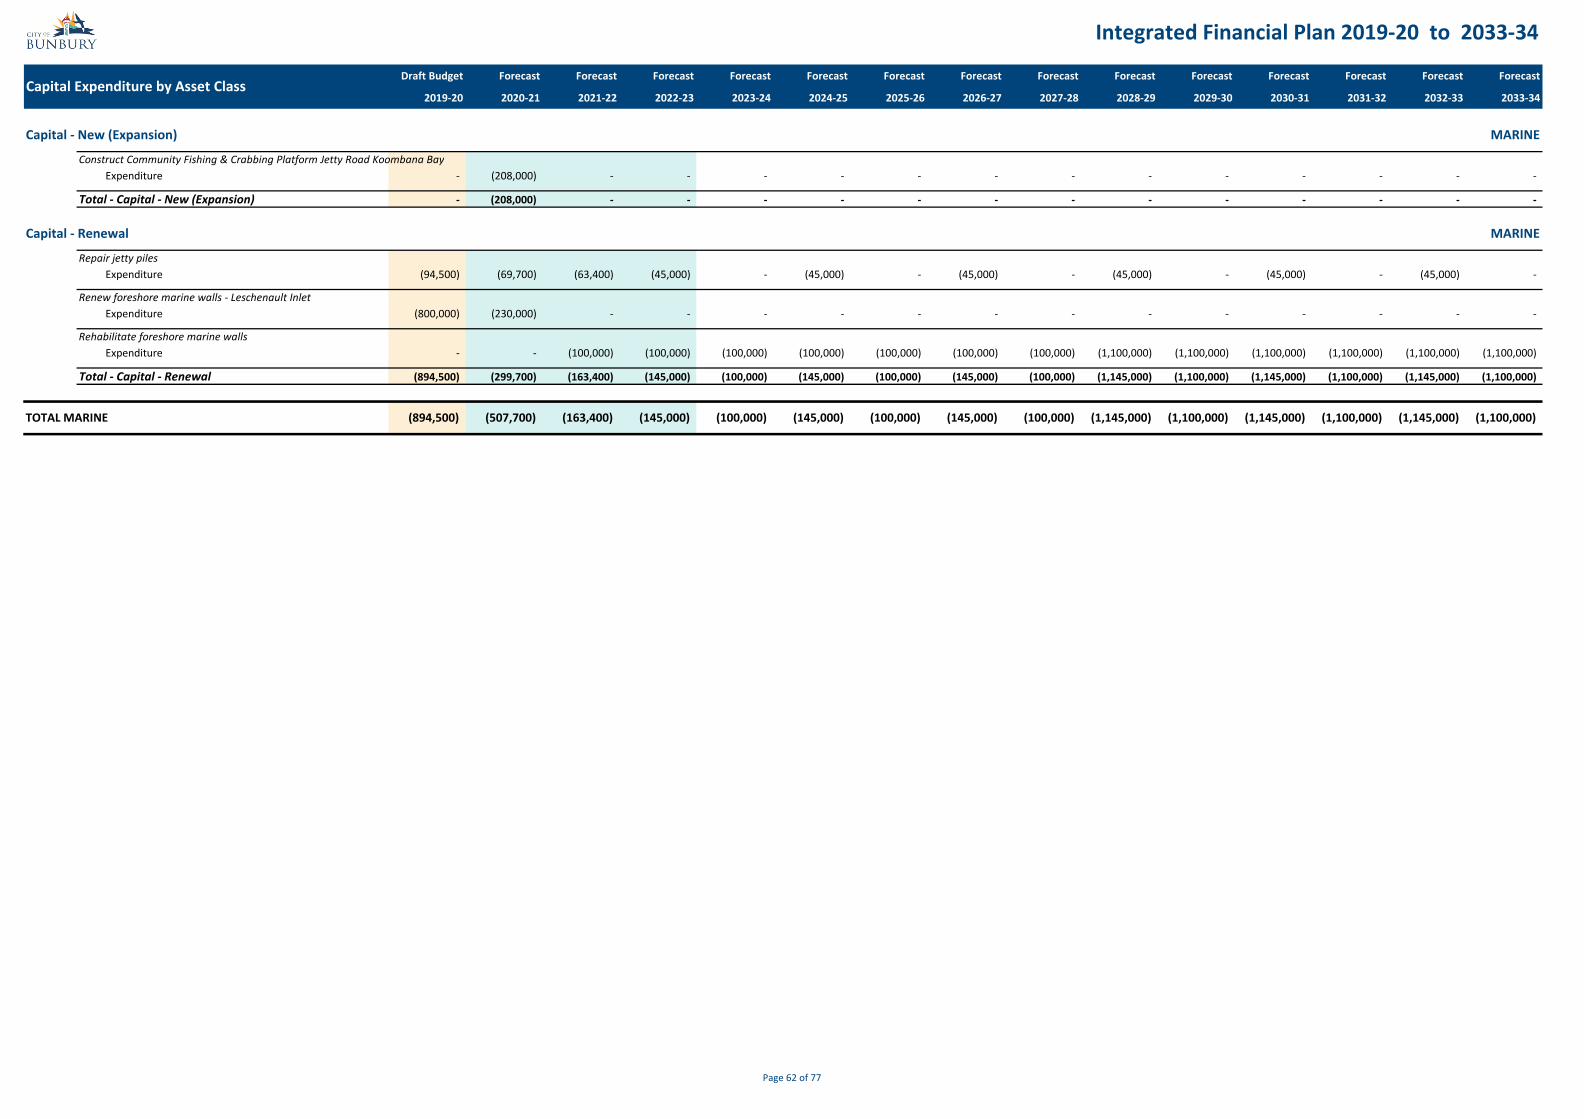
Integrated Financial Plan 2019‐20 to 2033‐34
Draft Budget Forecast Forecast Forecast Forecast Forecast Forecast Forecast Forecast Forecast Forecast Forecast Forecast Forecast Forecast
2019‐20 2020‐21 2021‐22 2022‐23 2023‐24 2024‐25 2025‐26 2026‐27 2027‐28 2028‐29 2029‐30 2030‐31 2031‐32 2032‐33 2033‐34Capital Expenditure by Asset Class
Capital ‐ New (Expansion) MARINE
Construct Community Fishing & Crabbing Platform Jetty Road Koombana BayConsExpenditure ‐ (208,000) ‐ ‐ ‐ ‐ ‐ ‐ ‐ ‐ ‐ ‐ ‐ ‐ ‐
Total ‐ Ca Total ‐ Capital ‐ New (Expansion) ‐ (208,000) ‐ ‐ ‐ ‐ ‐ ‐ ‐ ‐ ‐ ‐ ‐ ‐ ‐
Capital ‐ Renewal MARINE
Repair jetty pilesRepaExpenditure (94,500) (69,700) (63,400) (45,000) ‐ (45,000) ‐ (45,000) ‐ (45,000) ‐ (45,000) ‐ (45,000) ‐
Renew foreshore marine walls ‐ Leschenault InletReneExpenditure (800,000) (230,000) ‐ ‐ ‐ ‐ ‐ ‐ ‐ ‐ ‐ ‐ ‐ ‐ ‐
Rehabilitate foreshore marine wallsRehaExpenditure ‐ ‐ (100,000) (100,000) (100,000) (100,000) (100,000) (100,000) (100,000) (1,100,000) (1,100,000) (1,100,000) (1,100,000) (1,100,000) (1,100,000)
Total ‐ Ca Total ‐ Capital ‐ Renewal (894,500) (299,700) (163,400) (145,000) (100,000) (145,000) (100,000) (145,000) (100,000) (1,145,000) (1,100,000) (1,145,000) (1,100,000) (1,145,000) (1,100,000)
TOTAL MARINE (894,500) (507,700) (163,400) (145,000) (100,000) (145,000) (100,000) (145,000) (100,000) (1,145,000) (1,100,000) (1,145,000) (1,100,000) (1,145,000) (1,100,000)
Page 62 of 77

Integrated Financial Plan 2019‐20 to 2033‐34
Draft Budget Forecast Forecast Forecast Forecast Forecast Forecast Forecast Forecast Forecast Forecast Forecast Forecast Forecast Forecast
2019‐20 2020‐21 2021‐22 2022‐23 2023‐24 2024‐25 2025‐26 2026‐27 2027‐28 2028‐29 2029‐30 2030‐31 2031‐32 2032‐33 2033‐34Capital Expenditure by Asset Class
Capital ‐ New (Expansion) OPEN SPACE
Install drinking fountains in parks and on cyclewaysInstaExpenditure (12,000) (12,000) (12,000) (12,000) (12,000) (12,000) (12,000) (12,000) (12,000) (12,000) (12,000) (12,000) (12,000) (12,000) (12,000)
Install landscaping and irrigation systems at Boulters HeightsInstaExpenditure ‐ (50,000) ‐ ‐ ‐ ‐ ‐ ‐ ‐ ‐ ‐ ‐ ‐ ‐ ‐
Install Shade Sails in Public Open SpaceInstaExpenditure ‐ (50,000) ‐ (50,000) ‐ (50,000) ‐ (50,000) ‐ (50,000) ‐ (50,000) ‐ (50,000) ‐
Install landscaping and irrigation systems for Back Beach (Stage 3)InstaExpenditure ‐ ‐ (200,000) (50,000) ‐ ‐ ‐ ‐ ‐ ‐ ‐ ‐ ‐ ‐ ‐
Install new seating area at Bunbury Wildlife ParkInstaExpenditure ‐ ‐ ‐ (10,000) ‐ ‐ ‐ ‐ ‐ ‐ ‐ ‐ ‐ ‐ ‐
Install infrastructure (pipes/irrigation) for Bunbury waste water recycling projectInstaExpenditure ‐ ‐ ‐ ‐ ‐ ‐ ‐ ‐ ‐ ‐ ‐ (7,300,000) ‐ ‐ ‐
Total ‐ Ca Total ‐ Capital ‐ New (Expansion) (12,000) (112,000) (212,000) (122,000) (12,000) (62,000) (12,000) (62,000) (12,000) (62,000) (12,000) (7,362,000) (12,000) (62,000) (12,000)
Capital ‐ Renewal OPEN SPACE
Renew landscaping and irrigation systems at Bunbury Wildlife ParkReneExpenditure (10,000) (40,000) ‐ ‐ ‐ ‐ ‐ ‐ ‐ ‐ ‐ ‐ ‐ ‐ ‐
Renew landscaping and reticulation in main walkthrough aviary at Bunbury Wildlife ParkReneExpenditure (12,000) ‐ ‐ ‐ ‐ ‐ ‐ ‐ ‐ ‐ ‐ ‐ ‐ ‐ ‐
Replace bore pumpsRepl Expenditure (42,500) (85,000) (80,000) (80,000) (80,000) (80,000) (80,000) (80,000) (80,000) (80,000) (80,000) (80,000) (80,000) (80,000) (80,000)
Replace automatic reticulation systemsRepl Expenditure (50,000) (50,000) (150,000) (150,000) (150,000) (150,000) (150,000) (150,000) (150,000) (150,000) (150,000) (150,000) (150,000) (150,000) (150,000)
Replace playground equipmentRepl Expenditure (225,000) (275,000) (325,000) (375,000) (425,000) (425,000) (425,000) (425,000) (425,000) (425,000) (425,000) (425,000) (425,000) (425,000) (425,000)
Replace barbecuesRepl Expenditure ‐ (13,000) (13,000) (13,000) (13,000) (13,000) (13,000) (13,000) (13,000) (13,000) (13,000) (13,000) (13,000) (13,000) (13,000)
Renew open space furniture and equipmentReneExpenditure ‐ (100,000) (100,000) (100,000) (100,000) (100,000) (100,000) (100,000) (100,000) (100,000) (100,000) (100,000) (100,000) (100,000) (100,000)
Replace athletics track surfaceRepl Expenditure ‐ (1,000,000) ‐ ‐ ‐ ‐ ‐ ‐ ‐ ‐ ‐ (1,000,000) ‐ ‐ ‐
Renew barbecues at Bunbury Wildlife ParkReneExpenditure ‐ ‐ (5,000) ‐ ‐ ‐ ‐ (5,000) ‐ ‐ ‐ ‐ (5,000) ‐ ‐
Total ‐ Ca Total ‐ Capital ‐ Renewal (339,500) (1,563,000) (673,000) (718,000) (768,000) (768,000) (768,000) (773,000) (768,000) (768,000) (768,000) (1,768,000) (773,000) (768,000) (768,000)
Capital ‐ Upgrade OPEN SPACE
Upgrades to Payne Park to supplement iSports reticulation and ground worksUpgrExpenditure (75,000) ‐ ‐ ‐ ‐ ‐ ‐ ‐ ‐ ‐ ‐ ‐ ‐ ‐ ‐
Total ‐ Ca Total ‐ Capital ‐ Upgrade (75,000) ‐ ‐ ‐ ‐ ‐ ‐ ‐ ‐ ‐ ‐ ‐ ‐ ‐ ‐
TOTAL OPEN SPACE (426,500) (1,675,000) (885,000) (840,000) (780,000) (830,000) (780,000) (835,000) (780,000) (830,000) (780,000) (9,130,000) (785,000) (830,000) (780,000)
Page 63 of 77

Integrated Financial Plan 2019‐20 to 2033‐34
Draft Budget Forecast Forecast Forecast Forecast Forecast Forecast Forecast Forecast Forecast Forecast Forecast Forecast Forecast Forecast
2019‐20 2020‐21 2021‐22 2022‐23 2023‐24 2024‐25 2025‐26 2026‐27 2027‐28 2028‐29 2029‐30 2030‐31 2031‐32 2032‐33 2033‐34Capital Expenditure by Asset Class
Capital ‐ New (Expansion) OTHER ASSETS (MIXED ASSET CLASSES)
Construct Youth PrecinctConsExpenditure (500,000) (5,000,000) ‐ ‐ ‐ ‐ ‐ ‐ ‐ ‐ ‐ ‐ ‐ ‐ ‐
Hay Park Infrastructure RedevelopmentHay Expenditure ‐ ‐ ‐ ‐ (300,000) ‐ (2,000,000) ‐ ‐ (2,000,000) ‐ ‐ (500,000) ‐ ‐
Total ‐ Ca Total ‐ Capital ‐ New (Expansion) (500,000) (5,000,000) ‐ ‐ (300,000) ‐ (2,000,000) ‐ ‐ (2,000,000) ‐ ‐ (500,000) ‐ ‐
Capital ‐ Renewal OTHER ASSETS (MIXED ASSET CLASSES)
Improve City's Landscaping, Parks, Gardens and Entry StatementsImpr Expenditure (325,000) (325,000) ‐ ‐ ‐ ‐ ‐ ‐ ‐ ‐ ‐ ‐ ‐ ‐ ‐
Total ‐ Ca Total ‐ Capital ‐ Renewal (325,000) (325,000) ‐ ‐ ‐ ‐ ‐ ‐ ‐ ‐ ‐ ‐ ‐ ‐ ‐
TOTAL OTHER ASSETS (MIXED ASSET CLASSES) (825,000) (5,325,000) ‐ ‐ (300,000) ‐ (2,000,000) ‐ ‐ (2,000,000) ‐ ‐ (500,000) ‐ ‐
Page 64 of 77

Integrated Financial Plan 2019‐20 to 2033‐34
Draft Budget Forecast Forecast Forecast Forecast Forecast Forecast Forecast Forecast Forecast Forecast Forecast Forecast Forecast Forecast
2019‐20 2020‐21 2021‐22 2022‐23 2023‐24 2024‐25 2025‐26 2026‐27 2027‐28 2028‐29 2029‐30 2030‐31 2031‐32 2032‐33 2033‐34Capital Expenditure by Asset Class
Capital ‐ Renewal PARKING EQUIPMENT
Replace infringement issuing devicesRepl Expenditure (15,000) ‐ (15,000) ‐ ‐ (15,000) ‐ ‐ (15,000) ‐ ‐ (15,000) ‐ ‐ (15,000)
Replace existing parking ticket machinesRepl Expenditure ‐ ‐ (300,000) ‐ ‐ (300,000) ‐ ‐ (300,000) ‐ ‐ (300,000) ‐ ‐ (300,000)
Total ‐ Ca Total ‐ Capital ‐ Renewal (15,000) ‐ (315,000) ‐ ‐ (315,000) ‐ ‐ (315,000) ‐ ‐ (315,000) ‐ ‐ (315,000)
TOTAL PARKING EQUIPMENT (15,000) ‐ (315,000) ‐ ‐ (315,000) ‐ ‐ (315,000) ‐ ‐ (315,000) ‐ ‐ (315,000)
Page 65 of 77

Integrated Financial Plan 2019‐20 to 2033‐34
Draft Budget Forecast Forecast Forecast Forecast Forecast Forecast Forecast Forecast Forecast Forecast Forecast Forecast Forecast Forecast
2019‐20 2020‐21 2021‐22 2022‐23 2023‐24 2024‐25 2025‐26 2026‐27 2027‐28 2028‐29 2029‐30 2030‐31 2031‐32 2032‐33 2033‐34Capital Expenditure by Asset Class
Capital ‐ New (Expansion) PATHWAYS
Expand path network in Bunbury Wildlife Park to create/improve access to exhibitsExpa Expenditure (10,000) ‐ ‐ ‐ ‐ ‐ (10,000) ‐ ‐ ‐ ‐ (10,000) ‐ ‐ ‐
Expand cycleways (implement Bunbury Bike Plan)Expa Expenditure (200,000) (200,000) (200,000) (200,000) (200,000) (200,000) (200,000) (200,000) (200,000) (200,000) (200,000) (200,000) (200,000) (200,000) (200,000)
Expand path networkExpa Expenditure (320,000) (520,000) (520,000) (520,000) (520,000) (520,000) (520,000) (520,000) (520,000) (520,000) (520,000) (520,000) (520,000) (520,000) (520,000)
Construct Forrest Highway shared pathConsExpenditure (400,000) ‐ ‐ ‐ ‐ ‐ ‐ ‐ ‐ ‐ ‐ ‐ ‐ ‐ ‐
Construct new Footpath at Bob Howell's PlaygroundConsExpenditure ‐ ‐ ‐ ‐ (42,000) ‐ ‐ ‐ ‐ ‐ ‐ ‐ ‐ ‐ ‐
Construct permanent fixed concrete (or similar) ramp allowing access from Surf Life Saving ClubConsExpenditure ‐ ‐ ‐ ‐ (80,000) ‐ ‐ ‐ ‐ ‐ ‐ ‐ ‐ ‐ ‐
Total ‐ Ca Total ‐ Capital ‐ New (Expansion) (930,000) (720,000) (720,000) (720,000) (842,000) (720,000) (730,000) (720,000) (720,000) (720,000) (720,000) (730,000) (720,000) (720,000) (720,000)
Capital ‐ Renewal PATHWAYS
Renew and Upgrade PathsReneExpenditure (200,000) (100,000) (100,000) (200,000) (425,000) (500,000) (500,000) (500,000) (500,000) (500,000) (500,000) (500,000) (500,000) (500,000) (500,000)
Renew and upgrade Big Swamp shared pathReneExpenditure (500,000) (200,000) (200,000) ‐ ‐ ‐ ‐ ‐ ‐ ‐ ‐ ‐ ‐ ‐ ‐
Renew footpath and paving at Graham Bricknell Sound ShellReneExpenditure ‐ ‐ ‐ (100,000) ‐ ‐ ‐ ‐ ‐ ‐ ‐ ‐ ‐ ‐ ‐
Total ‐ Ca Total ‐ Capital ‐ Renewal (700,000) (300,000) (300,000) (300,000) (425,000) (500,000) (500,000) (500,000) (500,000) (500,000) (500,000) (500,000) (500,000) (500,000) (500,000)
Capital ‐ Upgrade PATHWAYS
Widen and renew footpath Strickland Street and George Street (corner)WideExpenditure ‐ ‐ (50,000) ‐ ‐ ‐ ‐ ‐ ‐ ‐ ‐ ‐ ‐ ‐ ‐
Upgrade paving Stephen St (Victoria St to Arthur St)UpgrExpenditure ‐ ‐ ‐ (250,000) ‐ ‐ ‐ ‐ ‐ ‐ ‐ ‐ ‐ ‐ ‐
Upgrade streetscape Victoria Street (Carey Street to Wollaston)UpgrExpenditure ‐ ‐ ‐ (550,000) ‐ ‐ ‐ ‐ ‐ ‐ ‐ ‐ ‐ ‐ ‐
Relocate kerbing to provide safer footpath facilities ‐ Stingray PassRelo Expenditure ‐ ‐ ‐ ‐ (20,000) ‐ ‐ ‐ ‐ ‐ ‐ ‐ ‐ ‐ ‐
Upgrade paving Carey St (Ocean Dr to Blair St)UpgrExpenditure ‐ ‐ ‐ ‐ ‐ (150,000) ‐ ‐ ‐ ‐ ‐ ‐ ‐ ‐ ‐
Upgrade streetscape Wittenoom St (Stirling St to Carey St)UpgrExpenditure ‐ ‐ ‐ ‐ ‐ ‐ ‐ (150,000) ‐ ‐ ‐ ‐ ‐ ‐ ‐
Upgrade paving Wellington St (Victoria St to Haley St)UpgrExpenditure ‐ ‐ ‐ ‐ ‐ ‐ ‐ ‐ (175,000) ‐ ‐ ‐ ‐ ‐ ‐
Total ‐ Ca Total ‐ Capital ‐ Upgrade ‐ ‐ (50,000) (800,000) (20,000) (150,000) ‐ (150,000) (175,000) ‐ ‐ ‐ ‐ ‐ ‐
TOTAL PATHWAYS (1,630,000) (1,020,000) (1,070,000) (1,820,000) (1,287,000) (1,370,000) (1,230,000) (1,370,000) (1,395,000) (1,220,000) (1,220,000) (1,230,000) (1,220,000) (1,220,000) (1,220,000)
Page 66 of 77

Integrated Financial Plan 2019‐20 to 2033‐34
Draft Budget Forecast Forecast Forecast Forecast Forecast Forecast Forecast Forecast Forecast Forecast Forecast Forecast Forecast Forecast
2019‐20 2020‐21 2021‐22 2022‐23 2023‐24 2024‐25 2025‐26 2026‐27 2027‐28 2028‐29 2029‐30 2030‐31 2031‐32 2032‐33 2033‐34Capital Expenditure by Asset Class
Capital ‐ Renewal PLANT AND VEHICLES
Replace corporate minor plantRepl Expenditure (30,000) (30,000) (30,000) (30,000) (30,000) (30,000) (30,000) (30,000) (30,000) (30,000) (30,000) (30,000) (30,000) (30,000) (30,000)
Renew South West Sports Centre (SWSC) plant and machineryReneExpenditure (190,000) (40,000) (45,000) (40,000) (45,000) (163,100) (99,860) (27,690) (127,610) (61,680) (42,350) (74,000) ‐ ‐ ‐
Replace waste vehicles and plantRepl Expenditure (323,378) (33,688) (314,362) (410,302) (2,376,269) (314,859) (464,677) (37,138) (446,150) (2,371,974) (277,224) (402,669) (46,017) (408,992) (2,686,833)
Replace corporate heavy plantRepl Expenditure (835,796) (390,262) (797,435) (380,618) (271,808) (264,843) (831,378) (696,585) (553,950) (593,635) (374,310) (84,967) (882,603) (357,638) (482,372)
Replace corporate vehiclesRepl Expenditure (841,616) (388,574) (223,919) (106,593) (399,555) (920,251) (401,336) (248,055) (106,593) (399,555) (863,996) (445,671) (223,919) (106,593) (520,027)
Total ‐ Ca Total ‐ Capital ‐ Renewal (2,220,790) (882,524) (1,410,716) (967,513) (3,122,632) (1,693,053) (1,827,251) (1,039,468) (1,264,303) (3,456,844) (1,587,880) (1,037,307) (1,182,539) (903,223) (3,719,232)
TOTAL PLANT AND VEHICLES (2,220,790) (882,524) (1,410,716) (967,513) (3,122,632) (1,693,053) (1,827,251) (1,039,468) (1,264,303) (3,456,844) (1,587,880) (1,037,307) (1,182,539) (903,223) (3,719,232)
Page 67 of 77

Integrated Financial Plan 2019‐20 to 2033‐34
Draft Budget Forecast Forecast Forecast Forecast Forecast Forecast Forecast Forecast Forecast Forecast Forecast Forecast Forecast Forecast
2019‐20 2020‐21 2021‐22 2022‐23 2023‐24 2024‐25 2025‐26 2026‐27 2027‐28 2028‐29 2029‐30 2030‐31 2031‐32 2032‐33 2033‐34Capital Expenditure by Asset Class
Capital ‐ Renewal REFUSE
Renew bins at Bunbury Wildlife ParkReneExpenditure (5,000) ‐ ‐ ‐ ‐ (5,000) ‐ ‐ ‐ ‐ (5,000) ‐ ‐ ‐ ‐
Renew 1,100 litre skip binsReneExpenditure (24,000) (24,000) (24,000) (24,000) (24,000) (24,000) (24,000) (24,000) (24,000) (24,000) (24,000) (24,000) (24,000) (24,000) (24,000)
Renew bin enclosuresReneExpenditure (27,000) (27,000) (27,000) (27,000) (27,000) (27,000) (27,000) (27,000) (27,000) (27,000) (27,000) (27,000) (27,000) (27,000) (27,000)
Replace bins ‐ Annual bin replacement programRepl Expenditure (43,500) (43,500) (45,000) (45,000) (46,500) (46,500) (48,000) (48,000) (49,500) (49,500) (51,000) (51,000) (52,500) (52,500) (54,000)
Total ‐ Ca Total ‐ Capital ‐ Renewal (99,500) (94,500) (96,000) (96,000) (97,500) (102,500) (99,000) (99,000) (100,500) (100,500) (107,000) (102,000) (103,500) (103,500) (105,000)
TOTAL REFUSE (99,500) (94,500) (96,000) (96,000) (97,500) (102,500) (99,000) (99,000) (100,500) (100,500) (107,000) (102,000) (103,500) (103,500) (105,000)
Page 68 of 77

Integrated Financial Plan 2019‐20 to 2033‐34
Draft Budget Forecast Forecast Forecast Forecast Forecast Forecast Forecast Forecast Forecast Forecast Forecast Forecast Forecast Forecast
2019‐20 2020‐21 2021‐22 2022‐23 2023‐24 2024‐25 2025‐26 2026‐27 2027‐28 2028‐29 2029‐30 2030‐31 2031‐32 2032‐33 2033‐34Capital Expenditure by Asset Class
Capital ‐ New (Expansion) ROADS
Extend bitumen driveway and construct visitor carpark at Regional Animal FacilityExte Expenditure (8,000) ‐ ‐ ‐ ‐ ‐ ‐ ‐ ‐ ‐ ‐ ‐ ‐ ‐ ‐
Traffic calming and minor intersection treatmentsTraff Expenditure (100,000) (100,000) (100,000) (100,000) (100,000) (100,000) (100,000) (100,000) (100,000) (100,000) (100,000) (100,000) (100,000) (100,000) (100,000)
Construct carpark at Kelly Park playgroundConsExpenditure ‐ (55,000) ‐ ‐ ‐ ‐ ‐ ‐ ‐ ‐ ‐ ‐ ‐ ‐ ‐
Construct Washington Avenue cycle lanes (Stage 3 ‐ Parade Road to Ocean Drive)ConsExpenditure ‐ (300,000) ‐ ‐ ‐ ‐ ‐ ‐ ‐ ‐ ‐ ‐ ‐ ‐ ‐
Install traffic calming devices Hastie St, South BunburyInstaExpenditure ‐ ‐ (80,000) ‐ ‐ ‐ ‐ ‐ ‐ ‐ ‐ ‐ ‐ ‐ ‐
Extend Bunbury Wildlife Park car parkExte Expenditure ‐ ‐ ‐ ‐ ‐ ‐ (175,000) ‐ ‐ ‐ ‐ ‐ ‐ ‐ ‐
Extend Brashaw St East BunburyExte Expenditure ‐ ‐ ‐ ‐ ‐ ‐ ‐ (100,000) ‐ ‐ ‐ ‐ ‐ ‐ ‐
Duplicate carriageway on Old Coast Rd Pelican PointDupl Expenditure ‐ ‐ ‐ ‐ ‐ ‐ ‐ ‐ ‐ (40,000) (750,000) (750,000) ‐ ‐ ‐
Total ‐ Ca Total ‐ Capital ‐ New (Expansion) (108,000) (455,000) (180,000) (100,000) (100,000) (100,000) (275,000) (200,000) (100,000) (140,000) (850,000) (850,000) (100,000) (100,000) (100,000)
Capital ‐ Renewal ROADS
Roads to Recovery reseals 2019‐20RoadExpenditure (235,000) ‐ ‐ ‐ ‐ ‐ ‐ ‐ ‐ ‐ ‐ ‐ ‐ ‐ ‐
Reseal Ocean DriveRese Expenditure ‐ (45,000) ‐ ‐ ‐ ‐ ‐ ‐ ‐ ‐ ‐ ‐ ‐ ‐ ‐
Reseal Spencer Street, South Bunbury (Beach Road to Clarke Street)Rese Expenditure ‐ (180,000) ‐ ‐ ‐ ‐ ‐ ‐ ‐ ‐ ‐ ‐ ‐ ‐ ‐
Reseal and repair pavement Sandridge Road, East Bunbury (King Rd to Eelup RAB)Rese Expenditure ‐ (300,000) (300,000) ‐ ‐ ‐ ‐ ‐ ‐ ‐ ‐ ‐ ‐ ‐ ‐
Reseal roads projects (yet to be determined) for Roads to RecoveryRese Expenditure ‐ (445,000) (445,000) (445,000) (445,000) (615,000) (615,000) (615,000) (615,000) (615,000) (615,000) (615,000) (615,000) (615,000) (615,000)
Renew pavement and drainage, and re‐seal Victoria StreetReneExpenditure ‐ (1,000,000) ‐ ‐ ‐ ‐ ‐ ‐ ‐ ‐ ‐ ‐ ‐ ‐ ‐
Reseal Tipping Street, Carey ParkRese Expenditure ‐ ‐ (60,000) ‐ ‐ ‐ ‐ ‐ ‐ ‐ ‐ ‐ ‐ ‐ ‐
Reseal Zoe St car parkRese Expenditure ‐ ‐ (75,000) ‐ ‐ ‐ ‐ ‐ ‐ ‐ ‐ ‐ ‐ ‐ ‐
Reseal and rekerb St Pauls Place and St Marks PlaceRese Expenditure ‐ ‐ (98,000) ‐ ‐ ‐ ‐ ‐ ‐ ‐ ‐ ‐ ‐ ‐ ‐
Reseal Airport bitumen taxiways and runwaysRese Expenditure ‐ ‐ (600,000) ‐ ‐ ‐ ‐ ‐ ‐ ‐ ‐ ‐ ‐ ‐ ‐
Renew roads as per Asset Management PlanReneExpenditure ‐ ‐ (600,000) (1,000,000) (2,200,000) (1,500,000) (2,450,000) (2,700,000) (2,450,000) (2,550,000) (2,450,000) (3,450,000) (3,450,000) (2,450,000) (2,450,000)
Reconstruct Nuytsia AvenueRecoExpenditure ‐ ‐ ‐ ‐ (200,000) (200,000) ‐ ‐ ‐ ‐ ‐ ‐ ‐ ‐ ‐
Total ‐ Ca Total ‐ Capital ‐ Renewal (235,000) (1,970,000) (2,178,000) (1,445,000) (2,845,000) (2,315,000) (3,065,000) (3,315,000) (3,065,000) (3,165,000) (3,065,000) (4,065,000) (4,065,000) (3,065,000) (3,065,000)
Page 69 of 77

Integrated Financial Plan 2019‐20 to 2033‐34
Draft Budget Forecast Forecast Forecast Forecast Forecast Forecast Forecast Forecast Forecast Forecast Forecast Forecast Forecast Forecast
2019‐20 2020‐21 2021‐22 2022‐23 2023‐24 2024‐25 2025‐26 2026‐27 2027‐28 2028‐29 2029‐30 2030‐31 2031‐32 2032‐33 2033‐34Capital Expenditure by Asset Class
Capital ‐ Upgrade ROADS
Widen Albert Road (to Hayes Street)WideExpenditure (20,000) (40,000) ‐ ‐ ‐ ‐ ‐ ‐ ‐ ‐ ‐ ‐ ‐ ‐ ‐
Improve traffic configuration Blair St, Bussell Hwy, Timperley Dve and Spencer St, South BunburyImpr Expenditure (60,000) ‐ (900,000) ‐ ‐ ‐ ‐ ‐ ‐ ‐ ‐ ‐ ‐ ‐ ‐
Upgrade Brittain Road / Bussell Highway / Parade Road roundaboutUpgrExpenditure (95,000) ‐ ‐ ‐ ‐ ‐ ‐ ‐ ‐ ‐ ‐ ‐ ‐ ‐ ‐
Upgrade kerb and profile of Victoria St (Elliot St to Clifton St)UpgrExpenditure (200,000) ‐ ‐ ‐ ‐ ‐ ‐ ‐ ‐ ‐ ‐ ‐ ‐ ‐ ‐
Realign and widen Ocean Drive, South Bunbury (Hastie St to Washington Ave)RealiExpenditure (750,000) (750,000) ‐ ‐ ‐ ‐ ‐ ‐ ‐ ‐ ‐ ‐ ‐ ‐ ‐
Reconstruct, widen and improve drainage on Estuary Drive, Pelican Point (St Andrews to Railway crossing)RecoExpenditure (750,000) (750,000) ‐ ‐ ‐ ‐ ‐ ‐ ‐ ‐ ‐ ‐ ‐ ‐ ‐
Realign and widen Koombana Drive EastRealiExpenditure (1,100,000) ‐ ‐ ‐ ‐ ‐ ‐ ‐ ‐ ‐ ‐ ‐ ‐ ‐ ‐
Reconstruct and widen Vittoria Road, Glen IrisRecoExpenditure ‐ (100,000) (100,000) ‐ ‐ ‐ ‐ ‐ ‐ ‐ ‐ ‐ ‐ ‐ ‐
Reseal and upgrade Harris Road including drainageRese Expenditure ‐ (300,000) ‐ ‐ ‐ ‐ ‐ ‐ ‐ ‐ ‐ ‐ ‐ ‐ ‐
Upgrade Forrest Avenue and Blair Street intersection and construct slip laneUpgrExpenditure ‐ (450,000) (750,000) ‐ ‐ ‐ ‐ ‐ ‐ ‐ ‐ ‐ ‐ ‐ ‐
Modify intersection geometry and install traffic control signals at South West Highway / Dodson RoadMod Expenditure ‐ (750,000) (750,000) ‐ ‐ ‐ ‐ ‐ ‐ ‐ ‐ ‐ ‐ ‐ ‐
Design roundabout Vittoria Rd and Erica Ent Glen Iris (Construct PR‐1895)DesigExpenditure ‐ ‐ (30,000) ‐ ‐ ‐ ‐ ‐ ‐ ‐ ‐ ‐ ‐ ‐ ‐
Upgrade intersection of Parade Rd and Westwood St, Withers (Withers Action Plan)UpgrExpenditure ‐ ‐ (150,000) ‐ ‐ ‐ ‐ ‐ ‐ ‐ ‐ ‐ ‐ ‐ ‐
Upgrade Spencer Street, Stirling Street & Arthur Street (dedicated turning lanes)UpgrExpenditure ‐ ‐ (450,000) (750,000) ‐ ‐ ‐ ‐ ‐ ‐ ‐ ‐ ‐ ‐ ‐
Modify intersection Haley Street, Prinsep Street and Carmody Street, Bunbury (Design PR‐1091)Mod Expenditure ‐ ‐ (600,000) (600,000) ‐ ‐ ‐ ‐ ‐ ‐ ‐ ‐ ‐ ‐ ‐
Improve intersection layout Washington Ave and Nalbarra Dve, UsherImpr Expenditure ‐ ‐ ‐ (80,000) ‐ ‐ ‐ ‐ ‐ ‐ ‐ ‐ ‐ ‐ ‐
Widen Parade Road (Crampton Avenue)WideExpenditure ‐ ‐ ‐ (396,000) ‐ ‐ ‐ ‐ ‐ ‐ ‐ ‐ ‐ ‐ ‐
Widen and improve alignment of Adam Road, South BunburyWideExpenditure ‐ ‐ ‐ ‐ (400,000) ‐ ‐ ‐ ‐ ‐ ‐ ‐ ‐ ‐ ‐
Construct roundabout Vittoria Road and Erica Entrance, Glen Iris (Design PR‐1234)ConsExpenditure ‐ ‐ ‐ ‐ (600,000) ‐ ‐ ‐ ‐ ‐ ‐ ‐ ‐ ‐ ‐
Upgrade Roads as per AMPUpgrExpenditure ‐ ‐ ‐ ‐ (725,000) (800,000) (800,000) (300,000) (800,000) (800,000) (800,000) (800,000) (1,550,000) (1,550,000) (1,550,000)
Relocate utilities and improve intersection geometry ‐ Underwood St, Carey Park, Kinkella Dve intersectionRelo Expenditure ‐ ‐ ‐ ‐ ‐ (300,000) ‐ ‐ ‐ ‐ ‐ ‐ ‐ ‐ ‐
Page 70 of 77

Integrated Financial Plan 2019‐20 to 2033‐34
Draft Budget Forecast Forecast Forecast Forecast Forecast Forecast Forecast Forecast Forecast Forecast Forecast Forecast Forecast Forecast
2019‐20 2020‐21 2021‐22 2022‐23 2023‐24 2024‐25 2025‐26 2026‐27 2027‐28 2028‐29 2029‐30 2030‐31 2031‐32 2032‐33 2033‐34Capital Expenditure by Asset Class
Upgrade kerb, profile and median Victoria St Bunbury (Between Carey & Clifton Sts)UpgrExpenditure ‐ ‐ ‐ ‐ ‐ (436,000) ‐ ‐ ‐ ‐ ‐ ‐ ‐ ‐ ‐
Install traffic control signals intersection of Hennessey Rd and Sandridge Rd, East BunburyInstaExpenditure ‐ ‐ ‐ ‐ ‐ ‐ (60,000) (300,000) ‐ ‐ ‐ ‐ ‐ ‐ ‐
Upgrade kerb and profile of Victoria St (between Stephen and Stirling Sts)UpgrExpenditure ‐ ‐ ‐ ‐ ‐ ‐ (100,000) ‐ ‐ ‐ ‐ ‐ ‐ ‐ ‐
Upgrade and widen King Road (Stage 1 ‐ Strickland St to Herbert Rd, Stage 2 ‐ Herbert Rd to Austral Pde)UpgrExpenditure ‐ ‐ ‐ ‐ ‐ ‐ ‐ (450,000) (550,000) ‐ ‐ ‐ ‐ ‐ ‐
Total ‐ Ca Total ‐ Capital ‐ Upgrade (2,975,000) (3,140,000) (3,730,000) (1,826,000) (1,725,000) (1,536,000) (960,000) (1,050,000) (1,350,000) (800,000) (800,000) (800,000) (1,550,000) (1,550,000) (1,550,000)
TOTAL ROADS (3,318,000) (5,565,000) (6,088,000) (3,371,000) (4,670,000) (3,951,000) (4,300,000) (4,565,000) (4,515,000) (4,105,000) (4,715,000) (5,715,000) (5,715,000) (4,715,000) (4,715,000)
Capital ‐ Upgrade ROADS
Page 71 of 77

Integrated Financial Plan 2019‐20 to 2033‐34
Draft Budget Forecast Forecast Forecast Forecast Forecast Forecast Forecast Forecast Forecast Forecast Forecast Forecast Forecast Forecast
2019‐20 2020‐21 2021‐22 2022‐23 2023‐24 2024‐25 2025‐26 2026‐27 2027‐28 2028‐29 2029‐30 2030‐31 2031‐32 2032‐33 2033‐34Capital Expenditure by Asset Class
Capital ‐ Renewal SIGNS
Replace signs and linemarkingRepl Expenditure (20,000) (10,000) (20,000) (75,000) (75,000) (75,000) (75,000) (75,000) (75,000) (75,000) (75,000) (80,000) (80,000) (80,000) (80,000)
Total ‐ Ca Total ‐ Capital ‐ Renewal (20,000) (10,000) (20,000) (75,000) (75,000) (75,000) (75,000) (75,000) (75,000) (75,000) (75,000) (80,000) (80,000) (80,000) (80,000)
TOTAL SIGNS (20,000) (10,000) (20,000) (75,000) (75,000) (75,000) (75,000) (75,000) (75,000) (75,000) (75,000) (80,000) (80,000) (80,000) (80,000)
Page 72 of 77

Integrated Financial Plan 2019‐20 to 2033‐34
Draft Budget Forecast Forecast Forecast Forecast Forecast Forecast Forecast Forecast Forecast Forecast Forecast Forecast Forecast Forecast
2019‐20 2020‐21 2021‐22 2022‐23 2023‐24 2024‐25 2025‐26 2026‐27 2027‐28 2028‐29 2029‐30 2030‐31 2031‐32 2032‐33 2033‐34Capital Expenditure by Asset Class
Capital ‐ New (Expansion) STORMWATER
Install Hayes Street Pump StationInstaExpenditure (60,000) (60,000) (600,000) ‐ ‐ ‐ ‐ ‐ ‐ ‐ ‐ ‐ ‐ ‐ ‐
Total ‐ Ca Total ‐ Capital ‐ New (Expansion) (60,000) (60,000) (600,000) ‐ ‐ ‐ ‐ ‐ ‐ ‐ ‐ ‐ ‐ ‐ ‐
Capital ‐ Renewal STORMWATER
Replace SCADA equipmentRepl Expenditure (25,000) (25,000) ‐ ‐ ‐ ‐ ‐ (25,000) (25,000) (25,000) (25,000) (25,000) (25,000) (25,000) (25,000)
Replace pump station generator, West RoadRepl Expenditure (50,000) ‐ ‐ ‐ ‐ ‐ ‐ ‐ ‐ ‐ ‐ ‐ ‐ ‐ ‐
Renew, resleeve and improve drainage networkReneExpenditure (240,000) ‐ (200,000) (500,000) (250,000) (250,000) (250,000) (100,000) (250,000) (200,000) (250,000) (250,000) (250,000) (250,000) (250,000)
Renew stormwater infrastructureReneExpenditure ‐ (440,000) ‐ (330,000) (250,000) (250,000) (300,000) (200,000) (300,000) (250,000) (300,000) (300,000) (300,000) (300,000) (300,000)
Rehabilitate Five Mile BrookRehaExpenditure ‐ ‐ ‐ (20,000) (100,000) (70,000) ‐ ‐ ‐ ‐ ‐ ‐ ‐ ‐ ‐
Resleeve main drain ‐ Clifton StResleExpenditure ‐ ‐ ‐ ‐ ‐ ‐ ‐ (250,000) ‐ ‐ ‐ ‐ ‐ ‐ ‐
Replace pumps, Queens Gardens pump stationRepl Expenditure ‐ ‐ ‐ ‐ ‐ ‐ ‐ ‐ ‐ (120,000) ‐ ‐ ‐ ‐ ‐
Total ‐ Ca Total ‐ Capital ‐ Renewal (315,000) (465,000) (200,000) (850,000) (600,000) (570,000) (550,000) (575,000) (575,000) (595,000) (575,000) (575,000) (575,000) (575,000) (575,000)
Capital ‐ Upgrade STORMWATER
Upgrade Dunstan St compensation basinUpgrExpenditure ‐ ‐ ‐ ‐ (194,500) ‐ ‐ ‐ ‐ ‐ ‐ ‐ ‐ ‐ ‐
Total ‐ Ca Total ‐ Capital ‐ Upgrade ‐ ‐ ‐ ‐ (194,500) ‐ ‐ ‐ ‐ ‐ ‐ ‐ ‐ ‐ ‐
TOTAL STORMWATER (375,000) (525,000) (800,000) (850,000) (794,500) (570,000) (550,000) (575,000) (575,000) (595,000) (575,000) (575,000) (575,000) (575,000) (575,000)
Page 73 of 77

Integrated Financial Plan 2019‐20 to 2033‐34
Draft Budget Forecast Forecast Forecast Forecast Forecast Forecast Forecast Forecast Forecast Forecast Forecast Forecast Forecast Forecast
2019‐20 2020‐21 2021‐22 2022‐23 2023‐24 2024‐25 2025‐26 2026‐27 2027‐28 2028‐29 2029‐30 2030‐31 2031‐32 2032‐33 2033‐34Capital Expenditure by Asset Class
Capital ‐ New (Expansion) STRUCTURES
Construct holding pens for livestock at the Regional Animal FacilityConsExpenditure (5,000) ‐ ‐ ‐ ‐ ‐ ‐ ‐ ‐ ‐ ‐ ‐ ‐ ‐ ‐
Construct additional outside dog pens at the Regional Animal FacilityConsExpenditure (8,000) ‐ ‐ ‐ ‐ ‐ ‐ ‐ ‐ ‐ ‐ ‐ ‐ ‐ ‐
Purchase of new Public ArtPurc Expenditure ‐ (25,000) (25,000) (25,000) (25,000) (25,000) (25,000) (25,000) (25,000) (25,000) (25,000) (25,000) (25,000) (25,000) (25,000)
Construct heritage interpretation, Bunbury Timber JettyConsExpenditure ‐ (142,246) ‐ ‐ ‐ ‐ ‐ ‐ ‐ ‐ ‐ ‐ ‐ ‐ ‐
Construct suitable enclosures for the Zoo and Aquarium Association Breeding ProgramConsExpenditure ‐ ‐ (5,000) ‐ ‐ ‐ ‐ ‐ ‐ ‐ ‐ ‐ ‐ ‐ ‐
Construct Bunbury Wildlife Park nocturnal houseConsExpenditure ‐ ‐ ‐ ‐ ‐ ‐ ‐ ‐ (200,000) ‐ ‐ ‐ ‐ ‐ ‐
Total ‐ Ca Total ‐ Capital ‐ New (Expansion) (13,000) (167,246) (30,000) (25,000) (25,000) (25,000) (25,000) (25,000) (225,000) (25,000) (25,000) (25,000) (25,000) (25,000) (25,000)
Capital ‐ Renewal STRUCTURES
Replace guard rails / retaining wallsRepl Expenditure (25,000) ‐ ‐ (25,000) ‐ ‐ ‐ ‐ ‐ ‐ ‐ ‐ ‐ ‐ ‐
Replace timber sheltersRepl Expenditure ‐ (11,000) (11,000) (11,000) (11,000) (11,000) (11,000) (11,000) (11,000) (11,000) (11,000) (11,000) (11,000) (11,000) (11,000)
Replace boardwalks and lookoutsRepl Expenditure ‐ (10,000) (275,000) (365,000) (10,000) ‐ ‐ (190,000) (710,000) (735,000) (385,000) (170,000) (250,000) (250,000) (250,000)
Re‐net Bunbury Wildlife Park walk‐in aviaryRe‐n Expenditure ‐ (40,000) ‐ ‐ ‐ ‐ ‐ ‐ ‐ ‐ ‐ ‐ ‐ ‐ ‐
Replace fencing at Bunbury AirportRepl Expenditure ‐ ‐ (20,000) ‐ ‐ ‐ (20,000) ‐ (20,000) ‐ (20,000) ‐ (20,000) ‐ (20,000)
Replace Bunbury Wildlife Park bird aviariesRepl Expenditure ‐ ‐ (20,000) ‐ ‐ ‐ (20,000) ‐ ‐ ‐ (20,000) ‐ ‐ ‐ (20,000)
Renew Bunbury Hockey Perimeter FencingReneExpenditure ‐ ‐ ‐ (50,000) ‐ ‐ ‐ ‐ ‐ ‐ ‐ ‐ ‐ ‐ ‐
Renew timber gazebos at the Bunbury Wildlife ParkReneExpenditure ‐ ‐ ‐ ‐ (10,000) ‐ ‐ ‐ ‐ (10,000) ‐ ‐ ‐ ‐ (10,000)
Replace crash barriersRepl Expenditure ‐ ‐ ‐ ‐ ‐ (5,000) ‐ ‐ ‐ ‐ ‐ (15,000) ‐ ‐ ‐
Re‐net the main walk through aviary at the Bunbury Wildlife ParkRe‐n Expenditure ‐ ‐ ‐ ‐ ‐ (60,000) ‐ ‐ ‐ ‐ ‐ ‐ ‐ ‐ ‐
Replace southern carpark retaining wall, Bunbury Library, Parkfield StreetRepl Expenditure ‐ ‐ ‐ ‐ ‐ ‐ ‐ (1,000,000) ‐ ‐ ‐ ‐ ‐ ‐ ‐
Replace perimeter fencing at Payne ParkRepl Expenditure ‐ ‐ ‐ ‐ ‐ ‐ ‐ ‐ (125,000) ‐ ‐ ‐ ‐ ‐ ‐
Replace fences and gatesRepl Expenditure ‐ ‐ ‐ ‐ ‐ ‐ ‐ ‐ ‐ ‐ (90,000) ‐ ‐ ‐ ‐
Total ‐ Ca Total ‐ Capital ‐ Renewal (25,000) (61,000) (326,000) (451,000) (31,000) (76,000) (51,000) (1,201,000) (866,000) (756,000) (526,000) (196,000) (281,000) (261,000) (311,000)
TOTAL STRUCTURES (38,000) (228,246) (356,000) (476,000) (56,000) (101,000) (76,000) (1,226,000) (1,091,000) (781,000) (551,000) (221,000) (306,000) (286,000) (336,000)
Page 74 of 77

Integrated Financial Plan 2019‐20 to 2033‐34
Draft Budget Forecast Forecast Forecast Forecast Forecast Forecast Forecast Forecast Forecast Forecast Forecast Forecast Forecast Forecast
2019‐20 2020‐21 2021‐22 2022‐23 2023‐24 2024‐25 2025‐26 2026‐27 2027‐28 2028‐29 2029‐30 2030‐31 2031‐32 2032‐33 2033‐34Capital Expenditure by Asset Class
Capital ‐ Renewal ASSET RENEWAL / FUTURE CAPITAL WORKS CAPACITY
Asset Renewal / Future Capital Works CapacityAsse Expenditure ‐ ‐ ‐ ‐ ‐ ‐ (250,000) (250,000) (250,000) (250,000) (2,250,000) (1,250,000) (1,250,000) (2,250,000) (1,250,000)
Total ‐ Ca Total ‐ Capital ‐ Renewal ‐ ‐ ‐ ‐ ‐ ‐ (250,000) (250,000) (250,000) (250,000) (2,250,000) (1,250,000) (1,250,000) (2,250,000) (1,250,000)
TOTAL ASSET RENEWAL / FUTURE CAPITAL WORKS CAPACITY ‐ ‐ ‐ ‐ ‐ ‐ (250,000) (250,000) (250,000) (250,000) (2,250,000) (1,250,000) (1,250,000) (2,250,000) (1,250,000)
Total ‐ Capital ‐ New (Expansion) (2,151,000) (6,804,246) (1,782,000) (1,027,000) (1,339,000) (1,324,295) (3,082,000) (1,047,000) (1,109,000) (2,987,000) (1,677,000) (9,307,000) (1,397,000) (947,000) (897,000)Total ‐ Capital ‐ Renewal (6,517,175) (8,715,700) (6,661,828) (6,594,935) (9,546,897) (8,096,221) (9,372,281) (11,578,043) (11,576,188) (13,989,208) (12,554,747) (12,434,637) (11,311,239) (12,161,650) (13,130,033)Total ‐ Capital ‐ Upgrade (3,520,000) (3,280,000) (3,910,000) (2,646,000) (1,959,500) (1,816,000) (980,000) (1,220,000) (1,545,000) (820,000) (820,000) (820,000) (1,570,000) (1,570,000) (1,570,000)
TOTAL EXPENDITURE ON ALL ASSET CLASSES (12,188,175) (18,799,946) (12,353,828) (10,267,935) (12,845,397) (11,236,516) (13,434,281) (13,845,043) (14,230,188) (17,796,208) (15,051,747) (22,561,637) (14,278,239) (14,678,650) (15,597,033)
Page 75 of 77

Integrated Financial Plan 2019‐20 to 2033‐34
Annual Budget A statutory requirement outlining the year’s financial estimates for Council’s core operating services and projects to be delivered. The budget is based on the adopted Integrated Financial Plan.
Asset Management Plan A “whole of life” plan for the appropriate acquisition, maintenance, renewal, replacement and disposal of assets that balances aspirations with affordability.
AssumptionsIt is impossible to predict all future events; therefore assumptions must be made regarding future operational and economic conditions and events. Assumptions are an important aspect of planning and budgeting as they are based on variable factors.
Asset Renewal Funding Gap The asset renewal funding gap is the difference between what is planned and what needs to be spent to maintain, upgrade and renew assets in the condition expected by the community.
Base OperatingIncorporates all the day‐to‐day costs of running the core services of Council. Base operating revenue is the income generated from rates, fees and charges, interest received, and grants and contributions not linked to a project. Base operating expenditure is the employee costs, materials and contracts, insurances, interest paid, depreciation and other miscellaneous expense items.
Capital ‐ New Capital expenditure incurred in the expansion or creation of a new asset that did not exist before.
Capital ‐ Renewal Asset Renewal is the replacement or refurbishment of an existing asset (or component) with a new asset (or component) capable of delivering the same level of service as the existing asset.
Capital ‐ Upgrade Asset Upgrade is capital works carried out on an existing asset to provide a higher level of service.
Cash ‐ Unrestricted Cash that is not tied to a particular use and can be used for any purpose.
Cash ‐ Restricted Cash that has an external or internal restriction placed upon it, e.g. by regulation, funding body or set aside in a reserve for a specific purpose. It is not available for any other use.
Consumer Price Index (CPI) The increase in the general price of goods and services in an economy over time.
Corporate Business Plan Details the services and projects the City will deliver over the next four‐years in line with the Strategic Community Plans’ key priority areas and objectives.
Deficit Where expenditure is greater than income the result is a deficit.
Depreciation Depreciation is recognising the decline in value of an asset over the estimated useful life, to take account of normal use, obsolescence or time. Note: This is a non‐cash expense.
Employee Costs All costs associate with the employment of a person such as salaries, wages, allowances, superannuation, employment expenses, relocation expenses, worker’s compensation insurance, training costs, safety expenses, medical examinations, fringe benefit tax, etc.
GLOSSARY OF TERMS
Page 76 of 77

Integrated Financial Plan 2019‐20 to 2033‐34
GLOSSARY OF TERMS
Equity Equity is the net worth of a local government measured as the difference between the total assets and total liabilities as reported in the Statement of Financial Position.
Financial Statements:Statement of Comprehensive Income A Statement that shows the extent to which operating expenditure was recovered from revenues during the financial year. It also identifies the costs of goods and services provided during a reporting period.
Statement of Financial Position Previously known as a Balance Sheet. Reports the assets, liabilities and equity of the local government as at a particular date. Provides a ‘snap‐shot’ of the overall financial position of the Council.
Statement of Cash Flows A statement that shows how changes in a local government’s expenses and income affect cash; and breaks the analysis down to operating, investing and financing activities.
Rate Setting Statement A statement that details budgeted expenditure and revenue and shows how much rate revenue is required to cover the budget deficit.
Infrastructure Infrastructure assets are physical assets intended to serve the community over a long time frame and maintained indefinitely by the continuing replacement and refurbishment of its components so that service level standards are met. This includes the major asset classes such as roads, drains, bridges, footpaths, and public buildings.
Integrated Financial Plan (IFP)The Integrated Financial Plan (IFP) provides the Bunbury community a plan to deliver the vision, goals and objectives of the Strategic Community Plan. It incorporates the requirements of the ‘Integrated Planning and Reporting Framework’ for local governments to have a Corporate Business Plan for the next four years and also a long term financial plan which covers the next fifteen years. The IFP demonstrates Council’s financial capacity to deliver services, provide facilities and manage assets that will sustain the Bunbury community into the future.
Projects (Operating or Capital) Identified projects (either operating or capital) that are additional expenditure to the base (core) expenditure budget. As this expenditure is not required for day‐to‐day operations the expenditure is considered discretionary and is subject to available funds and competition from other projects.
Reserves ‐ Cashed Backed An account established for the purpose of setting aside money for a specific purpose to be used in a future period.
Scenario Modelling Preparation of forecasts or estimates in the Integrated Financial Plan on optimistic, conservative and worst‐case scenarios to understand the impact of variations in factors or assumptions.
Sensitivity Analysis Determines those factors or assumptions that if varied have greater impacts on the Integrated Financial Plan.
Strategic Community Plan The Strategic Community Plan is the Council’s principal strategic and planning document. It is the guiding document for the Integrated Financial Plan. Community engagement to determine the vision and priorities is central to the Plan.
Source of Funds Shows how the council is going to pay for the expenditure. The source of funds available for council’s operations and projects include: Unrestricted cash, reserve funds, loan borrowings, grants, contributions and disposal of assets.
Surplus If the anticipated revenue exceeds its proposed spending for the year the budget is in a surplus for the year.
Work Force Plan A continuous process (not a one‐off activity) of shaping the workforce to ensure that it is capable of delivering organisational objectives now and in the future.
Page 77 of 77