lfpubweb.cityofdenton.com · City Manager’s Office 215 E. McKinney St., Denton, TX 76201 (940)...
152
City Manager’s Office 215 E. McKinney St., Denton, TX 76201 (940) 349-8307 OUR CORE VALUES Integrity Fiscal Responsibility Transparency Outstanding Customer Service MEMORANDUM DATE: March 30, 2018 TO: The Honorable Mayor Watts and Council Members FROM: Todd Hileman, City Manager SUBJECT: Friday Staff Report I. Council Schedule A. Meetings 1. Canceled - Council Luncheon Meeting, Monday, April 2, 2018. 2. Canceled - Committee on the Environment on Monday, April 2, 2018. 3. Traffic Safety Commission Meeting on Monday, April 2, 2018 at 5:30 p.m. in the City Council Work Session Room. 4. Committee on Citizen Engagement on Tuesday, April 3, 2018 at 10:30 a.m. City Hall Conference Room. 5. Work Session of the City Council on Tuesday, April 3, 2018 at 11:30 a.m. in the City Council Work Session Room, followed by a Regular Meeting at 6:30 p.m. in the Council Chambers. 6. Agenda Committee Meeting on Wednesday, April 4, 2018 at 3:30 p.m. in the City Manager’s Conference Room. B. Upcoming Events 1. Serve Denton Banquet, Saturday, April 14, 2018 at 6:30 p.m. at Embassy Suites by Hilton Denton Convention Center. 2. Denton Chamber of Commerce Luncheon/Leadership Denton Graduation Friday, April 20, 2018 at 11:30 a.m. at Embassy Suites by Hilton Denton Convention Center. 3. Employee Service Awards Banquet, Wednesday, April 25, 2018 at 11:30 a.m. at Embassy Suites by Hilton Denton Convention Center.
Transcript of lfpubweb.cityofdenton.com · City Manager’s Office 215 E. McKinney St., Denton, TX 76201 (940)...

City Manager’s Office 215 E. McKinney St., Denton, TX 76201 (940) 349-8307
OUR CORE VALUES
Integrity Fiscal Responsibility Transparency Outstanding Customer Service
MEMORANDUM
DATE: March 30, 2018
TO: The Honorable Mayor Watts and Council Members
FROM: Todd Hileman, City Manager
SUBJECT: Friday Staff Report
I. Council Schedule
A. Meetings
1. Canceled - Council Luncheon Meeting, Monday, April 2, 2018.
2. Canceled - Committee on the Environment on Monday, April 2, 2018.
3. Traffic Safety Commission Meeting on Monday, April 2, 2018 at 5:30 p.m. in
the City Council Work Session Room.
4. Committee on Citizen Engagement on Tuesday, April 3, 2018 at 10:30 a.m. City
Hall Conference Room.
5. Work Session of the City Council on Tuesday, April 3, 2018 at 11:30 a.m. in the
City Council Work Session Room, followed by a Regular Meeting at 6:30 p.m. in
the Council Chambers.
6. Agenda Committee Meeting on Wednesday, April 4, 2018 at 3:30 p.m. in the
City Manager’s Conference Room.
B. Upcoming Events
1. Serve Denton Banquet, Saturday, April 14, 2018 at 6:30 p.m. at Embassy Suites
by Hilton Denton Convention Center.
2. Denton Chamber of Commerce Luncheon/Leadership Denton Graduation Friday,
April 20, 2018 at 11:30 a.m. at Embassy Suites by Hilton Denton Convention
Center.
3. Employee Service Awards Banquet, Wednesday, April 25, 2018 at 11:30 a.m. at
Embassy Suites by Hilton Denton Convention Center.

II. General Information & Status Update A. Easter Holiday Closing – Certain City of Denton facilities will be closed on
Sunday, April 1, in observance of the Easter holiday.
Libraries - All libraries will be closed on Sunday, April 1 and will resume
regular hours on Monday, April 2.
Parks and Recreation - Denton Natatorium and North Lakes Driving
Range will be closed on Sunday, April 1 and will resume regular hours on
Monday, April 2.
Solid Waste and Recycling - Solid Waste and Recycling service will not
be impacted by the holiday.
Public Safety - Public safety personnel will be on duty during the holiday.
The Denton Police Department can be reached at their non-emergency
number which is (940) 349-8181, and in case of an emergency dial 911.
Utilities - Customer Service hours of operation are Monday through
Friday, 8 a.m. to 5 p.m. To report a utility service emergency during a
weekend or holiday, call utilities dispatch at (940) 349-7000.
Airport- Airport operations will not be impacted by the holiday.
B. DDC Update – On Wednesday, staff held a series of meetings with stakeholders
including the ad hoc Council Committee, Planning & Zoning Commission,
developers and businesses, and a general public open house in the evening to
present and review a draft of Module 2 of Administration & Procedures for the
Denton Development Code update. Feedback and input received during these
meetings has been tracked and will be compiled as staff and Clarion continue work
on the DDC update. Staff will be working on setting dates and refining the review
process for Module 3 Development Standards. More information will be
forthcoming.
Proposed Zoning Map Open House Events A proposed updated zoning map will be distributed and made available online at
www.DentonCode2030.com by April 12. Staff is preparing to host a series of
public open house events on the proposed zoning map. To get the word out, staff
will be mailing a postcard to all property owners in the City (attached) and will
also be using the City’s multiple communications channels. The dates, times, and
locations of the open houses are listed below:
Monday, April 23 from 6 to 8 p.m. at Fred Moore High School
Thursday, April 26 from 6 to 8 p.m. at LaGrone Advanced Technology
Complex
Wednesday, May 2 from 8 a.m. to 5 p.m. at Development Services Center
Thursday, May 3 from 8 a.m. to 5 p.m. at Development Services Center
Monday, May 7 from 6 to 8 p.m. at Embassy Suites by Hilton Denton
Convention Center
Thursday, May 10 from 6 to 8 p.m. at Sam Houston Elementary
Saturday, May 12 from 9 a.m. to noon at Denton Civic Center
There will be many additional opportunities for public review and input as the
Denton Development Code update continues to be reviewed through the spring
and early summer. Staff contact: Scott McDonald

C. Oak Gateway Area Plan Meeting Summary – On Thursday evening, the Oak
Gateway Area Plan Steering Committee held their fifth meeting. The meeting
began with an open discussion of the purpose and importance of the steering
committee; committee members expressed concerns and offered ideas to shape the
Committee’s work going forward. The majority of the meeting was building on
the success of the Community Workshop held last month, the Committee met to
discuss the results of the input and feedback received. Prior to this meeting the
Committee received all the input and feedback to review and be prepared to
participate in table exercises to summarize the big ideas communicated and to
begin drafting vision statement and guiding principles. The Committee
communicated their concerns with the size of the Area Plan and decided to focus
on the three subareas individually prior to developing the same for the overall Area
Plan. The consensus is the Committee would be able to better formulate the overall
vision and guiding principles after careful consideration of each subarea and
finding common themes.
Following the drafting of the vision statements, the Committee will finalize the
Plan’s guiding principles and will begin to draft initial recommendations with staff
and the consultants. The next Committee meeting is scheduled for late April. After
the draft vision, guiding principles, and initial recommendations are ready, the
City will host a Public Open House in late May to share the drafts with the public
and ask for their feedback.
Additionally, at the request of the Committee, there was a discussion regarding the
Bonnie Brae Widening Project, specifically near the intersection with Scripture
Street. The Committee members that were in attendance expressed their opinion
about the project. The general consensus was that the widening project would
create a physical boundary, which would divide the Rayzor Ranch development
from the neighborhoods to the east. They also felt that the preliminary design to
straighten Bonnie Brae at the Scripture intersection should not be determined
based on the standard speed for an arterial, and that the speed limit could be
lowered in this area to maintain safety on the street. Lastly, the Committee felt that
the existing homes on the east side of the street should not be demolished and the
additional right-of-way needed should be from the west where there are existing
parking lots or empty land. The Committee concluded that they would like to see
a different solution. Staff contact: Ron Menguita
D. IH-35E Phase 1B Update – TxDOT continues work on the Phase 1B project of IH-
35E. The following actions are tentatively planned to occur next week and the
following week; however dates are subject to change depending upon weather or
construction activities.
Nightly lane closures, 10 p.m. to 6 a.m., Monday April 2 to Thursday April
5, from Mayhill Road to Business 77.
Thursday night (April 5), northbound (NB) main lanes shift to previous
southbound (SB) main lanes.
Should NB lane shift not be facilitated Thursday, lane shift will take place
the following week.

NB main lanes and Brinker bridge construction activity is expected to
begin the week of April 9.
Loop 288 Bridge Demolition to begin April 13-15, full weekend closure of
Loop 288 intersection.
City staff will continue to work with TxDOT as construction moves forward and
closures are needed, to help distribute and push out information on closures and
construction work through our communication channels. Staff contact: Mark
Nelson
E. IH-35W Public Meeting – TxDOT has provided notice that they will hold a public
meeting for the purpose of soliciting public comments on the proposed
reconstruction and widening of IH-35W from the Denton/Tarrant County Line to
IH-35/IH-35E in Denton. The meeting will be held from 6 to 8 p.m., Thursday,
April 19 at Argyle Middle School, 6601 Canyon Falls Dr., Argyle, Texas 76226.
A copy of the notice received by the City is attached. In order to inform residents
and encourage their attendance at this public meeting, the City is planning to
highlight the meeting in social media posts during the week of April 9, notify
neighborhood associations, and add the event to the City’s event calendar on the
website. Staff contact: Mark Nelson
F. Bike/Ped Coordinator – The Bike/Ped coordinator position was transferred to the
Capital Projects Department in mid-January this year. Subsequently, this position
was advertised in February 2018 and since then the City has received 25 candidate
applications. Staff is currently conducting phone interviews to screen some
candidates. However, given the specialized nature of the position it has been
difficult to find a good candidate pool for in person interviews. The recruitment
will continue to be open in the hopes of finding more candidates to review.
In the meantime, the City has engaged the services on Kimley Horn Associates to
help staff fulfill the duties and responsibilities of the Bike/Ped Coordinator.
Additionally, Kathryn Welch (Management Analyst) in the Capital Projects
Department is helping the traffic division coordinate bike/ped related tasks and
activities with other departments as well as external entities. Staff contact: Pritam
Deshmukh
G. Traffic Engineer – The Traffic Engineer position was advertised in February 2018
and since then the City has received 9 applications from candidates in the last eight
weeks. As Traffic Engineering is a very specialized field within Civil Engineering,
the available pool of candidates is very small. Given the growth in the state and
the DFW region, the demand for traffic engineers is very high and very difficult
recruit to fill this position. From the current list of applicants staff has shortlisted
three candidates for phone interviews which will be conducted next week.
Additionally, staff is working with Human Resources to understand certain
nuances related to work visas. This will help us tap into a separate pool of
candidates that typically would not apply for a position at the City. Staff intends
to fill this position in the next four to six weeks. Staff contact: Pritam Deshmukh

H. McKinney Street Widening Project Status – The City of Denton contracted with
Huitt-Zollars in October of 2017 to prepare procurement documents for the hiring
of a design-build team. The procurement documents will include 30% construction
plans for the widening of McKinney Street from two lanes to four divided lanes
from Woodrow Lane on the west end to Grissom Street on the east end. The
procurement documents will also include Request for Qualifications (RFQ) and
Request for Proposal (RFP) packages for the design-build teams. Creation of the
30% plans is currently in progress with a draft package expected at the end of
April. The RFQ is on track to be issued at the end of July 2018 and the RFP at the
very beginning of 2019. Award of a contract to a design-build team is anticipated
to happen in July 2019. The McKinney Street project is being paid for by funds
provided as part of an Advance Funding Agreement with TxDOT using Regional
Toll Revenue money.
As part of the Advance Funding Agreement, the City of Denton is obligated to
begin construction of the project by the end of September of 2018 or funding could
be removed/cancelled. The City of Denton will meet the September 2018 deadline
by starting the construction phase sidewalk (the sidewalk to allow safe passage for
pedestrians during construction) east of Loop 288 to Ryan High School. This
component of the construction will include construction zone safety measures
including fences and signage. The construction phase sidewalk and safety
measures will begin at the end of May 2018 in time to be completed by the
beginning of the 2018-19 school year. Following completion of the construction
phase sidewalk, the relocation of utilities will begin in anticipation of the July 2019
construction start date. Staff contact: Todd Estes
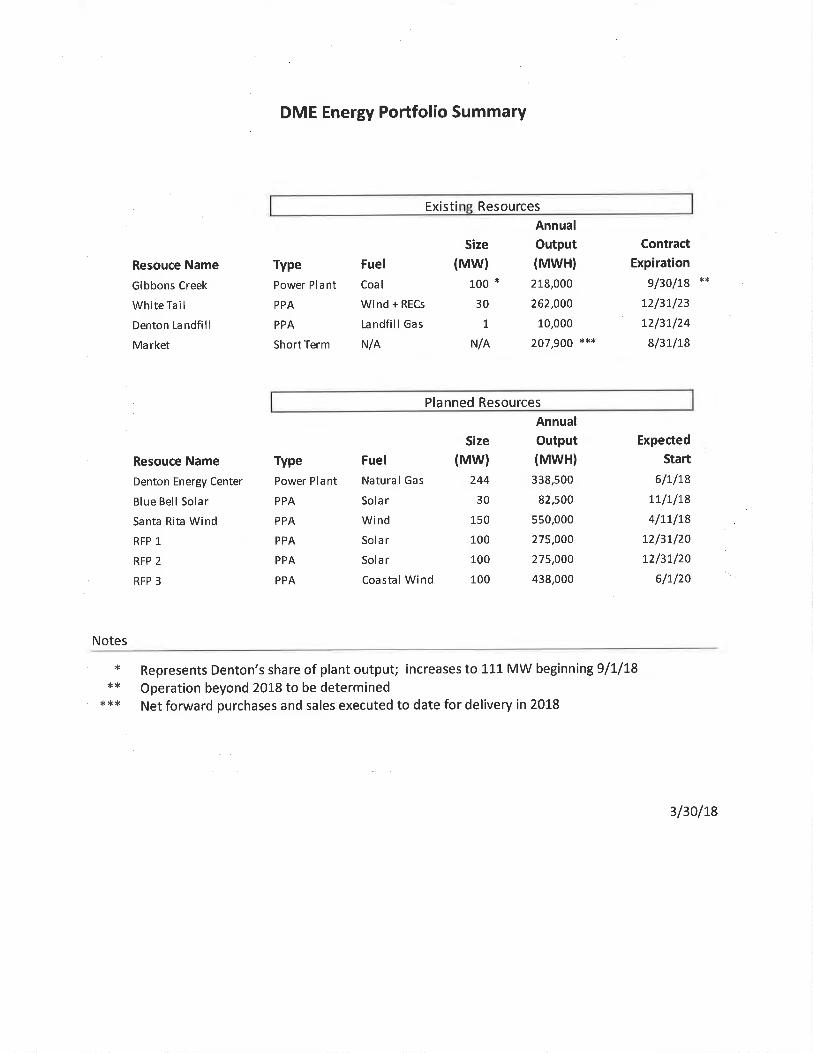
I. DME Power Supply Resources – Please see attached memo from DME General
Manager George Morrow with a summary of existing and planned DME power
supply resources. Staff contact: George Morrow
J. DEC Air Emissions Testing – The emission testing for the DEC will be overseen
by the Black and Veatch Air Quality Group (B&V). B&V has contracted with Air
Hygiene, Inc. of Broken Bow, Oklahoma to perform the stack testing. Air Hygiene
is accredited by the Texas Commission of Environmental Quality (TCEQ) to
perform the required tests.
To validate compliance with the DEC’s Standard Air Permit, stack testing must be
performed on all 12 of the plant’s engines. The TCEQ will be notified 30 days
prior to the testing. The TCEQ will have the option to witness the tests. The tests
must be performed with the engines running at 100% load. Plant staff will bring
the engines up to full load and then maintain the level for the duration of the test.
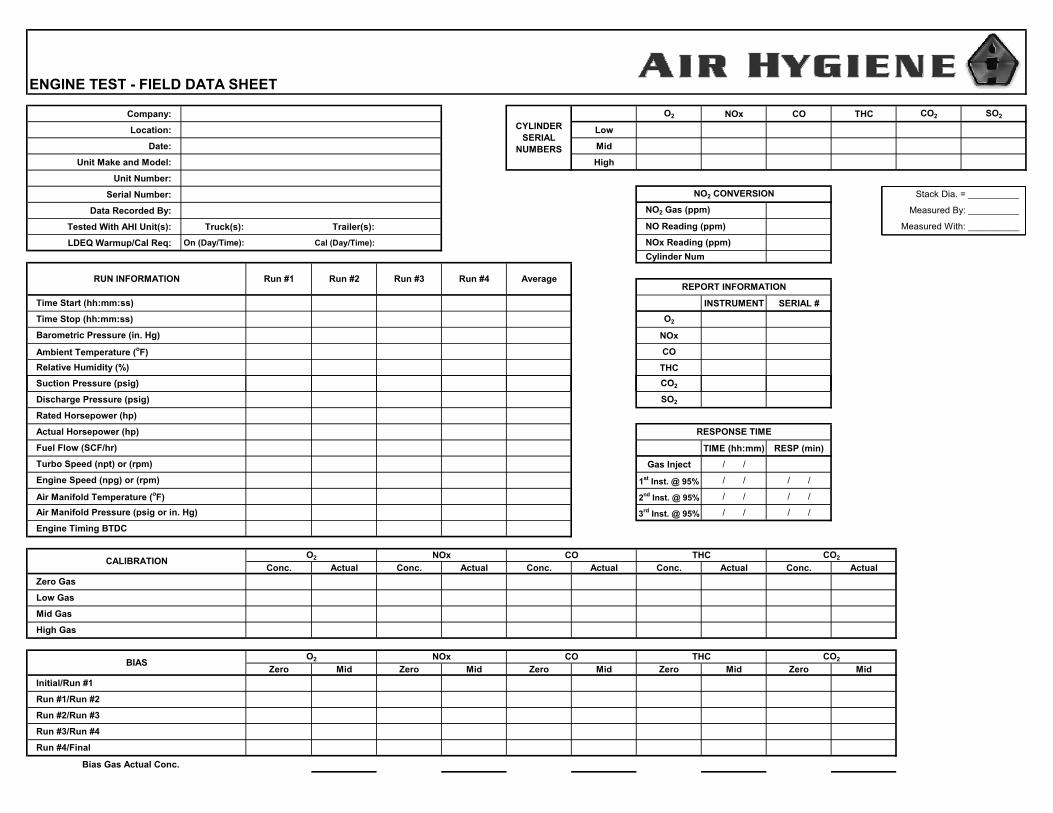
Air Hygiene will insert calibrated instruments into the sample ports (see image
below) and collect exhaust gas samples. Air Hygiene’s instruments will log the
data gathered during the test runs for further analysis. The plant’s emission rates
must be equal to or less than the standard permit levels for the plant to go
operational.

A report will be compiled by Air Hygiene and B&V documenting the test results
and submitted to the TCEQ on the City’s behalf. A full report of the results will
also be provided to Council once testing has been completed.
The DEC has the operation capability to operate at less than full load. To document
the engine’s emission’s levels at various loads, the above process will be
completed for 40%, 50% and 75% loads. All totaled the emission test plan will
entail 144 individual sample events. The additional test data will provide DME
with operational emission curves that will ensure the plant’s compliance with
TCEQ Standard Air Permit. A copy of the DEC air emissions testing protocol is
attached. Staff contact: George Morrow
K. Disposal of Surplus Property – At the City Council Work Session on August 8,
2017, staff presented information concerning prospective surplus city owned real
property tracts. Council directed staff to move forward with the first group of tracts
for disposal. An RFP was prepared and released on March 20, 2018. Below is an
overview of the tracts included in the RFP, with a more detailed summary attached.
TRACT # DCAD STREET ADDRESS CURRENT DISPOSITION DEED INFO ZONING ACREAGE SQ FT
1 76394 Maple ST - 100 Block
Paved, flat lot. Subject to
easements 2010-71488 DC-G 0.0494 2,152
2 33416 702 S Locust St
Vacant, flat lot. Subject to
reservation of new drainage
easement. In floodplain. 2010-71488 DC-G 0.376 16,405
3
35926
& 35928 2910 E University Dr
Two (2) easements to be
reserved at closing. Significant
portions of the Tracts are in
floodplain or floodway 2012-130856 NRMU 1.9126 83,313
4 205224 N Bell Ave
Subject to easements. Water
tower has been demolished,
footings remain in place. VOL 335, PG 370 NRMU-12 0.2376 10,350
5 161512 2100 E. Sherman Dr
Subject to easements. Vacant,
flat lot. The well has been
plugged. VOL 386, PG 462 NR-3 0.8231 35,854

Bids are due on April 19, 2018. Purchasing will evaluate and rank initial results
by April 30, 2018. It is anticipated that staff will bring an item for City Council
consideration to award bids at the May 22, 2018 at the City Council meeting. Staff
contact: Paul Williamson
L. Great American Cleanup – On Saturday, March 24, Keep Denton Beautiful hosted
its 30th Annual Great American Cleanup (GAC). A press release summarizing the
event is attached. Staff contact: Julie Anderson
III. Community Events
IV. Attachments A. Postcard - DDC Proposed Zoning Map Open House Events
B. TxDOT IH-35W Public Meeting Notice
C. Summary of Existing and Planned DME Power Supply Resources
D. DEC Air Emissions Testing Protocol
E. Great American Cleanup Press Release
V. Informal Staff Reports
A. 2018-035 Denco Area 9-1-1 Appointment to District Board of Managers
B. 2018-036 Emergency Response Framework
C. 2018-037 Cemetery Improvements
D. 2018-038 Small Cell Update
VI. Council Information
A. Council Requests for Information
B. Draft Agenda (April 10)
C. Council Calendar
D. Future Council Items
E. Street Construction Report

DENTON CODE 2030 — ZONING MAPDenton Code 2030 is the City’s ongoing effort to update, revise, and rewrite the Denton Development Code (DDC). The DDC sets the requirements for what, where, and how much can be built in Denton. With the recent adoption of the City’s comprehensive plan, Denton Plan 2030, now is the perfect time to work to align our development regulations with the vision, goals, and policies approved by the City Council. The update to the DDC will address a variety of issues raised in Denton Plan 2030, including updated design standards that address the layout, look, and feel of both new development and redevelopment.
The primary objectives are:• Improve the efficiency of the development review process• Remove unnecessary barriers to infill and redevelopment• Enhance the user experience by reorganizing and reformatting the DDC • Protect historic and established neighborhoods• Create a more predictable code and processes for developers and stakeholders
A new lineup of zoning districts is also being proposed, which consolidates, renames, eliminates, and creates new districts. An updated zoning map reflecting these districts will be proposed withthe revised DDC. While you may find yourself in a new zoning district, the current policies affecting single-family neighborhoods will not substantially change.
To learn more about the DDC update, including the proposed zoning districts, visit www.dentoncode2030.com.
WE WANT TO HEAR FROM YOU!See the back of this card
for information about our DDC publicopen houses.

WE WANT TO HEAR FROM YOU!We invite you to join us at one or more of our public open house events where you can learn more about the DDC and proposed zoning map, speak with City staff, and provide invaluable feedback.
Visit www.dentoncode2030.com to get information about the
different components of the DDC and how they are changing.
MONDAY, APRIL 236 to 8 p.m.Fred Moore High School815 Cross Timber St.
THURSDAY, APRIL 266 to 8 p.m.LaGrone Advanced Technology Complex1504 Long Rd.
WEDNESDAY, MAY 28 a.m. to 5 p.m.Development Services Center215 W. Hickory St.
THURSDAY, MAY 38 a.m. to 5 p.m.Development Services Center215 W. Hickory St.
MONDAY, MAY 76 to 8 p.m.Embassy Suites by HiltonDenton Convention Center3100 Town Center Trl.
THURSDAY, MAY 106 to 8 p.m.Sam Houston Elementary3100 Teasley Ln.
SATURDAY, MAY 129 a.m. to noonDenton Civic Center321 E. McKinney St.
Development Services Center215 W. Hickory St.Denton, Texas 76201
Produced by the City of Denton • ADA/EOE/ADEA • TDD (800) 735-2989 • www.cityofdenton.com


(918) 307-8865 or (888) 461-8778
www.airhygiene.com
Corporate Headquarters 1600 W Tacoma Street Broken Arrow, OK 74012
Remote Testing Offices Las Vegas, NV 89156 Ft. Worth, TX 76028 Humble, TX 77338 Shreveport, LA 71115 Miami, FL 33101 Pittsburgh, PA 15205
COMPLIANCE TESTING PROTOCOL
FOR
TWELVE WARTSILA 18V50SG RECIPROCATING INTERNAL
COMBUSTION ENGINES
PREPARED FOR CITY OF DENTON
AND BLACK & VEATCH
AT THE DENTON ENERGY CENTER PROJECT
DENTON, TEXAS
Texas Commission on Environmental Quality Standard Permit Registration No: 135651
March 21, 2018

Prepared By: _____________________________ rev - 0 Nathan Arthur, QSTI, Sr. Manager – Test Protocols
(918) 307-8865 or (888) 461-8778
www.airhygiene.com
Corporate Headquarters 1600 W Tacoma Street Broken Arrow, OK 74012
Remote Testing Offices Las Vegas, NV 89156 Ft. Worth, TX 76028 Humble, TX 77338 Shreveport, LA 71115 Miami, FL 33101 Pittsburgh, PA 15205
COMPLIANCE TESTING PROTOCOL
FOR
TWELVE WARTSILA 18V50SG RECIPROCATING INTERNAL
COMBUSTION ENGINES
PREPARED FOR CITY OF DENTON
AND BLACK & VEATCH
AT THE DENTON ENERGY CENTER PROJECT
DENTON, TEXAS
Texas Commission on Environmental Quality Standard Permit Registration No: 135651
March 21, 2018

(this page intentionally left blank)
i
Table of Contents
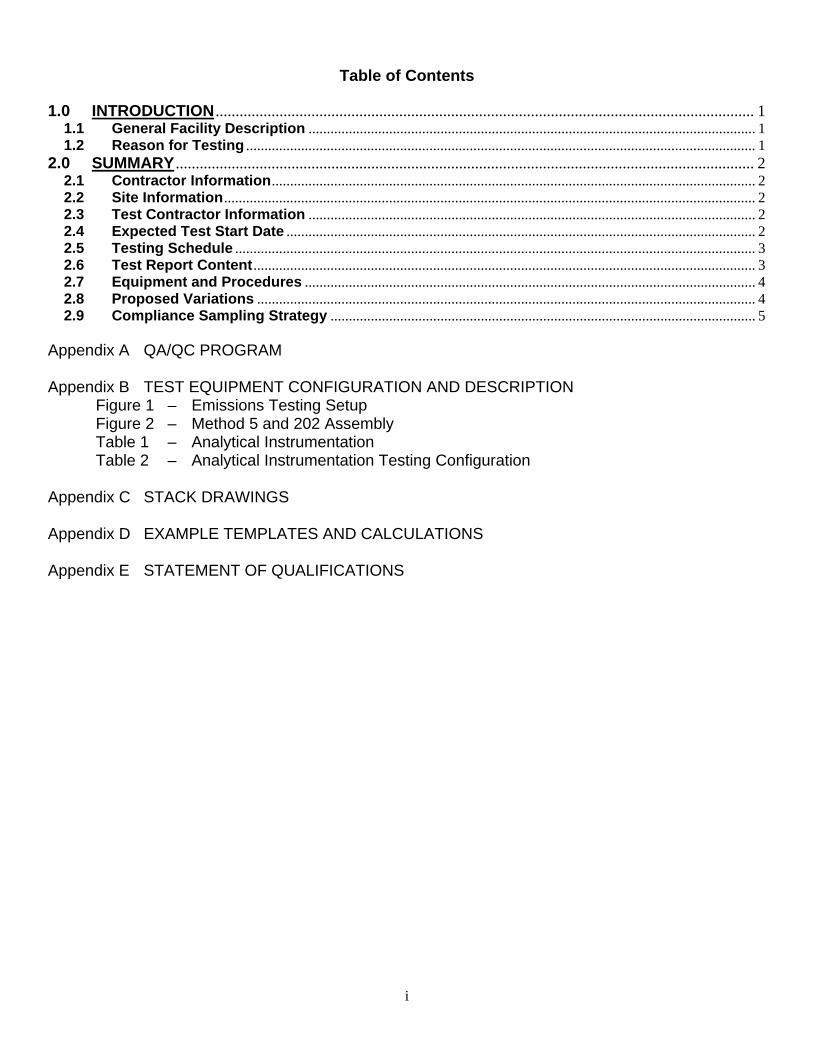
1.0 INTRODUCTION ....................................................................................................................................... 1 1.1 General Facility Description .......................................................................................................................... 1 1.2 Reason for Testing ........................................................................................................................................... 1
2.0 SUMMARY ................................................................................................................................................. 2 2.1 Contractor Information .................................................................................................................................... 2 2.2 Site Information ................................................................................................................................................. 2 2.3 Test Contractor Information .......................................................................................................................... 2 2.4 Expected Test Start Date ................................................................................................................................ 2 2.5 Testing Schedule .............................................................................................................................................. 3 2.6 Test Report Content ......................................................................................................................................... 3 2.7 Equipment and Procedures ........................................................................................................................... 4 2.8 Proposed Variations ........................................................................................................................................ 4 2.9 Compliance Sampling Strategy .................................................................................................................... 5
Appendix A QA/QC PROGRAM Appendix B TEST EQUIPMENT CONFIGURATION AND DESCRIPTION Figure 1 – Emissions Testing Setup Figure 2 – Method 5 and 202 Assembly Table 1 – Analytical Instrumentation Table 2 – Analytical Instrumentation Testing Configuration Appendix C STACK DRAWINGS Appendix D EXAMPLE TEMPLATES AND CALCULATIONS Appendix E STATEMENT OF QUALIFICATIONS

bv-18-denton.tx-start#2(TCEQ)-protocol-rev0b 1
1.0 INTRODUCTION
1.1 General Facility Description City of Denton (CD) owns and operates the Denton Energy Center Project located at 8499 Jim Christal Road in Denton, Texas. The plant consists of twelve natural gas-fired Wartsila 18V50SG engines, capable of producing a combined 255 MW of electricity. Each individual engine maximum rate horsepower (hp) is 25,761 hp. The engine stacks are vertical, circular and measure 5.3 feet (ft) (63.5 inches) in diameter at the test ports. The test ports are located approximately 32.69 ft (392.27 inches) downstream and approximately 7.42 ft (89 inches) upstream from the nearest disturbances. 1.2 Reason for Testing The units are subject to emission testing requirements set forth in the standards designated by the United States Environmental Protection Agency (EPA) Title 40, Code of Federal Regulations 40 CFR 60, Subpart JJJJ, and by the Texas Commission on Environmental Quality (TCEQ) Standard Permit (Registration No: 135651); and to the limits specified in Table 1.2. As such, the units will be tested for nitrogen oxides (NOx), carbon monoxide (CO), flow, moisture, volatile organic compounds (VOC), particulate matter (PM10/2.5), ammonia (NH3), carbon dioxide (CO₂), and oxygen (O₂) with the units operating at 100% Load.
TABLE 1.2 Emission Limits
Target Permit Limits NSPS Subpart JJJJ Limits
NOx 1.33 lb/hr 1.0 g/hp-hr or
82 ppmvd@15%O2
CO 4.96 lb/hr 2.0 g/hp-hr or
270 ppmvd@15%O2
VOC 2.07 lb/hr 0.7 g/hp-hr or
60 ppmvd@15%O2
PM10/2.5 3.17 lb/hr N/A
SO2 1 0.09 lb/hr N/A
NH3 3.17 lb/hr N/A 1. SO2 emission rate will be calculated using fuel analysis

bv-18-denton.tx-start#2(TCEQ)-protocol-rev0b 2
2.0 SUMMARY 2.1 Contractor Information
Company: Black & Veatch (BV) Contact Person: Paul Lee, P.E. Mailing Address: 4600 S. Syracuse Street, Suite 800 Denver, Colorado 80237 Office: (720) 834-4303 Email: [email protected]
2.2 Site Information
Site: Denton Energy Center Project Contact Person: Chris Lutrick City of Denton Site Address: 8499 Jim Christal Raod Denton, Texas 76207 Office: (940) 349-7152 Cell: (469) 203-9898 Email: [email protected] Latitude, Longitude: 33.221282, -97.216508
2.3 Test Contractor Information
Company: Air Hygiene International, Inc. Contact Person: Danny Parr, Director of Operations Mailing Address: 1600 W Tacoma Street Broken Arrow, Oklahoma 74012 Office: (918) 307-8865 Cell: (918) 809-8947 Fax: (918) 307-9131 E-mail: [email protected] Website: www.airhygiene.com AETB Certificate No: 3796.02 ISO/IEC Certificate No: 3796.01 NELAP Accreditation No: T104704523-14-1
2.4 Expected Test Start Date Testing is anticipated to begin on April 24, 2018. Notification of changes will be made by CD and BV, as necessary.
bv-18-denton.tx-start#2(TCEQ)-protocol-rev0b 3
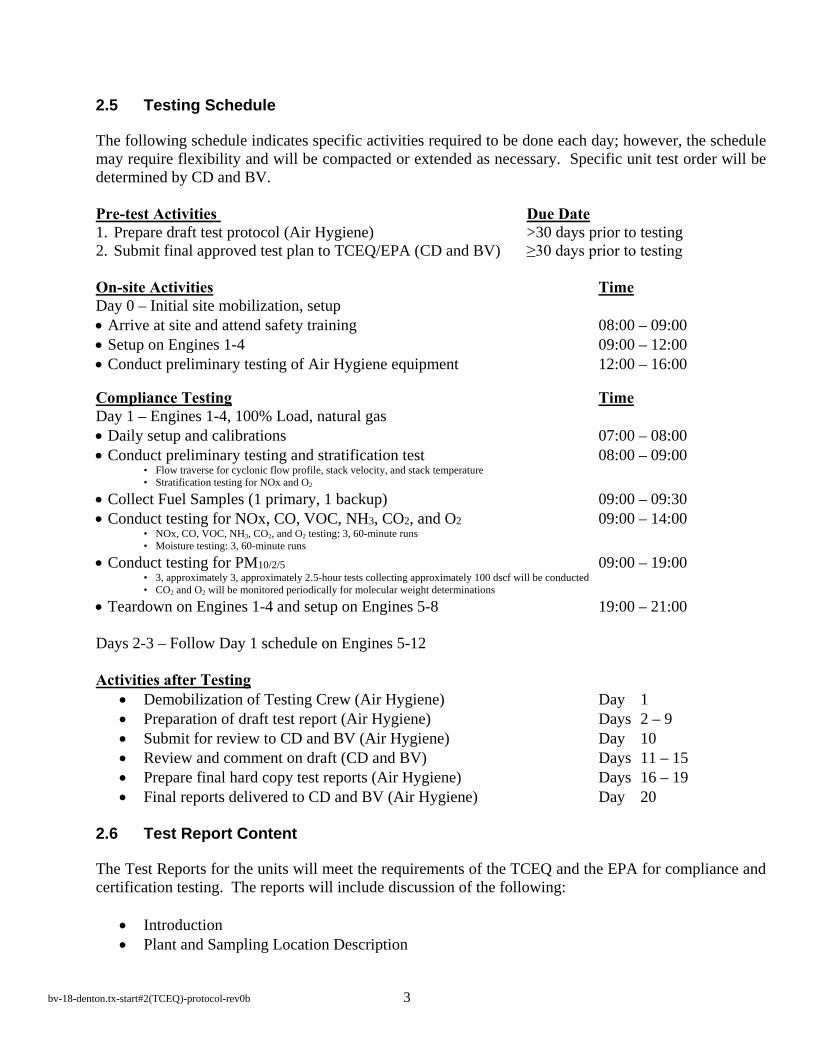
2.5 Testing Schedule The following schedule indicates specific activities required to be done each day; however, the schedule may require flexibility and will be compacted or extended as necessary. Specific unit test order will be determined by CD and BV. Pre-test Activities Due Date 1. Prepare draft test protocol (Air Hygiene) >30 days prior to testing 2. Submit final approved test plan to TCEQ/EPA (CD and BV) ≥30 days prior to testing On-site Activities Time Day 0 – Initial site mobilization, setup • Arrive at site and attend safety training 08:00 – 09:00 • Setup on Engines 1-4 09:00 – 12:00 • Conduct preliminary testing of Air Hygiene equipment 12:00 – 16:00 Compliance Testing Time Day 1 – Engines 1-4, 100% Load, natural gas • Daily setup and calibrations 07:00 – 08:00 • Conduct preliminary testing and stratification test 08:00 – 09:00
• Flow traverse for cyclonic flow profile, stack velocity, and stack temperature • Stratification testing for NOx and O2
• Collect Fuel Samples (1 primary, 1 backup) 09:00 – 09:30 • Conduct testing for NOx, CO, VOC, NH3, CO2, and O2 09:00 – 14:00
• NOx, CO, VOC, NH3, CO2, and O2 testing: 3, 60-minute runs • Moisture testing: 3, 60-minute runs
• Conduct testing for PM10/2/5 09:00 – 19:00 • 3, approximately 3, approximately 2.5-hour tests collecting approximately 100 dscf will be conducted • CO2 and O2 will be monitored periodically for molecular weight determinations
• Teardown on Engines 1-4 and setup on Engines 5-8 19:00 – 21:00 Days 2-3 – Follow Day 1 schedule on Engines 5-12 Activities after Testing
• Demobilization of Testing Crew (Air Hygiene) Day 1 • Preparation of draft test report (Air Hygiene) Days 2 – 9 • Submit for review to CD and BV (Air Hygiene) Day 10 • Review and comment on draft (CD and BV) Days 11 – 15 • Prepare final hard copy test reports (Air Hygiene) Days 16 – 19 • Final reports delivered to CD and BV (Air Hygiene) Day 20
2.6 Test Report Content
The Test Reports for the units will meet the requirements of the TCEQ and the EPA for compliance and certification testing. The reports will include discussion of the following:
• Introduction • Plant and Sampling Location Description

bv-18-denton.tx-start#2(TCEQ)-protocol-rev0b 4
• Summary and Discussion of Test Results Relative to Acceptance Criteria • Sampling and Analytical Procedures • QA/QC Activities • Test Results and Related Calculations • Stack and Testing Equipment Drawings • Raw Field Data and Calibration Data Sheets • Sampling Log and Chain-of-Custody Records • Audit Data Sheets
2.7 Equipment and Procedures Test methods and parameters to satisfy 40 Code of Federal Regulations (CFR) Part 60, Part 51, and Part 63 will include:
• 40 CFR 60, App A, EPA Method 1 for sample location • 40 CFR 60, App A, EPA Method 2 for sample exhaust flow • 40 CFR 60, App A, EPA Method 3A for oxygen (O2) and carbon dioxide (CO2) • 40 CFR 60, App A, EPA Method 4 for stack exhaust moisture • 40 CFR 60, App A, EPA Method 5 for particulate matter (PM) (front half filterables) • 40 CFR 60, App A, EPA Method 7E for nitrogen oxides (NOx) • 40 CFR 60, App A, EPA Method 10 for carbon monoxide (CO) • 40 CFR 60, App A, EPA Method 19 for stack exhaust FFactor including EPA’s FAQ and
derived stoichiometric stack exhaust flow calculation (see Appendix D) • 40 CFR 60, App A, EPA Method 18 and 25A for volatile organic compounds (VOCs) • 40 CFR 51, App M, EPA Method 202 for particulate matter (PM) (back half condensables) • 40 CFR 63, App A, EPA Method 320 for FTIR of ammonia (NH3) • ASTM 6667 for sulfur content of natural gas • ASTM 1945 for fuel analysis of natural gas
Based on equipment availability and additional test needs, test methods in place of 4, 7E, 10 may also include:
• 40 CFR 63, App A, EPA Method 320 for moisture, NOx, CO by FTIR Analyzer 2.8 Proposed Variations All moisture tests conducted utilizing Method 4, when it is not used per the Section 16.4 FFactor calculation technique, will be approximately 35-minutes in duration, rather than for the duration of the pollutant test run; which at a required flow rate near the maximum of 0.75 dry cubic feet per minute (e.g. ΔH@ of the console) will result in a minimum of 21 dry standard cubic feet of sample, as required by the method. The exception will be all moisture tests conducted utilizing Method 320, which will be approximately 60-minutes in duration, since the moisture and pollutant concentrations are measured by the same analyzer simultaneously. Regardless of method, all moisture tests will be conducted from a single point near the center of the stack, if accessible, or some other point as defined in the report, as moisture in this type of source tends to exist as a homogenous cloud, exhibiting no significant

bv-18-denton.tx-start#2(TCEQ)-protocol-rev0b 5
stratification as researched and supported by USEPA ALT-008 and ALT-0060. As needed, an unheated stainless steel hook may be utilized over the top of the stack and back down into the flow to accommodate the availability of sample ports and will be connected to the impinger train with unheated Teflon tubing, assuming that the impinger train is forced to be located at grade level due to test port and/or stack configuration conditions. Condensation that occurs in the probe and tubing combination will drain, via gravity, to the impinger train and will be assisted by field personnel, who will purposely drain the assembly into the impinger train at the conclusion of each test run. All particulate matter (PM) will be assumed as PM10/2/5 and EPA Method 5 will be used for front half filterables rather than EPA Method 201a. As such, in lieu of borosilicate glass nozzles and probe liners, Method 5/202 may utilize stainless steel nozzles and inconel liners to prevent breakage, particularly during port changes. PM10/2.5 testing will meet the 40 CFR 60.50Da(b).2.i requirement that each run be a minimum of two hours and collect at least 60 dry standard cubic feet of sample and is anticipated to be approximately 2.5 hours in duration and collect approximately 100 dry standard cubic feet of sample. 2.9 Compliance Sampling Strategy Testing will be conducted on the units for nitrogen oxides (NOx), carbon monoxide (CO), flow, moisture, volatile organic compounds (VOC), particulate matter (PM10/2.5), ammonia (NH3), carbon dioxide (CO₂), and oxygen (O₂) with the units operating at 100% Load. Prior to testing a stratification test for NOx and O2 will be performed to determine the sample point(s) for the remainder of the gas tests. Also, a preliminary flow traverse will be conducted to confirm the absence of cyclonic flow and record profiles for stack velocity and stack temperature. After the stratification and preliminary tests, testing for each engine will include:
• NOx – 3 test runs at 1 hour per run • CO – 3 test runs at 1 hour per run • VOCs – 3 test runs at 1 hour per run • NH3 – 3 test runs at 1 hour per run • O2 and CO2 – 3 test runs at 1 hour per run • PM10 – 3 test runs at approximately 2.5 hours per run • PM2.5 – 3 test runs at approximately 2.5 hours per run • Moisture and flow testing in conjunction with the above tests • O2 and CO2 monitored periodically for molecular weight determination
Information and data collected by CD and/or BV during the specific engine test period and required to be included in each of the engine reports shall include: engine speed (rpm), output power (hp), fuel flow (scfh), air manifold pressure (psi), air manifold temperature (oF), suction pressure (psi), discharge pressure (psi), and engine timing (oBTDC). Air Hygiene personnel will monitor and record ambient temperature (oF), relative humidity (%), and barometric pressure (in. Hg) at the start of each test run. Air Hygiene personnel will collect a fuel gas sample for each day of testing.

bv-18-denton.tx-start#2(TCEQ)-protocol-rev0b 6
Method 1, 2, and 4 – Exhaust Flow and Moisture Testing Flow rates will be monitored with S-type Pitot tubes and oil filled manometers. Total sample volumes will be measured with dry gas meters. The resulting Method 2 velocity heads will be combined with Method 3A (molecular weight) and Method 4 (moisture content) data to determine the stack gas volumetric flow rate. Method 3A, 7E, 10, 18/25A – Oxygen, Carbon Dioxide, Nitrogen Oxide, Carbon Monoxide, and VOC Testing Refer to Appendix B for additional details. VOC emission concentrations will be quantified in accordance with principles set forth in EPA Method 18 and 25A. A VIG 210 will be used for this purpose. The VIG 210 includes both a conventional total hydrocarbon (THC) analyzer and an automated gas chromatograph (GC) for determining VOCs. Two FIDs (flame ionization detectors) are used for the measurements: one for the THC channel and the other for the automated GC which can measure methane, ethane, and residual (VOCs). The THC sample is injected directly to the FID. This detector responds to all hydrocarbons in the sample. For VOC sampling, a heated gas sampling valve is used for direct injection of the gas on the GC column per Method 18, Section 8.2.2. The GC column separates hydrocarbon components based on their molecular configurations, weights, and boiling points. In this application, the analyzer uses the gas chromatograph column to separate methane and ethane from the heavier residual hydrocarbons (i.e. VOCs). Methane elutes from the sample first, it is immediately detected by the FID; ethane elutes from the column second and is detected. The flow in the column is reversed (back-flushed) and the residual components are recombined and detected by the FID (Method 25A) as residual VOCs. The sample time of the VOC is approximately four minutes, so each 60 minute test run corresponds to approximately 14 sample injections. EPA Method 7E bias and drift check criterion will be used to validate data instead of EPA Method 18 recovery studies as it is has more stringent and comprehensive quality assurance procedures. National Institute of Science and Technology (NIST) traceable propane calibration gas will be used to calibrate the VOC and the calibration procedure following EPA Method 25A. In this application, the target analyte is VOC (non methane, non ethane hydrocarbon); therefore, the methane and ethane concentrations will not be formally calibrated. Method 5/202 – Particulate Matter Testing The sample system used for the PM10/2.5 sampling will include a heated stainless steel probe sheath with a glass or inconel liner and glass or stainless steel nozzle. The nozzle and probe assembly will be inserted into a sample port of the stack to extract gas measurements from the emission stream through a filter and glass impinger train in an isokinetic fashion. Flow rates will be monitored with S-type Pitot tubes and oil filled manometers. Total sample volumes will be measured with dry gas meters. The resulting Method 2 velocity heads will be combined with Method 3A (molecular weight) and Method 4 (moisture content) data to determine the stack gas volumetric flow rate. These results will be combined with pollutant concentrations (i.e. parts per million) to determine emission rates (i.e. pounds per hour), as required. Per the requirements of the revised Method 202, the back half of the test train will include a condenser and dry impinger train configuration. Sample collection will include a nitrogen purge and

bv-18-denton.tx-start#2(TCEQ)-protocol-rev0b 7
hexane rinse. All samples will be analyzed off-site, by Air Hygiene’s lab, with summaries estimated one week after completion of testing. Method 320 – FTIR Testing (Ammonia) A MKS Instruments - MultiGas™ Fourier transform infrared (FTIR) spectrometer, or equivalent, will be used for ammonia analysis per EPA Method 320. The FTIR spectrometer spectral resolution is 0.5 cm-1. The system employs a silicon carbide infrared source at 1200 ºC, a helium neon reference laser, beam splitters, and potassium bromide (KBr) cell window, front-surface optical transfer mirrors, and multi-pass absorption cells. MCT detectors will be used and cooled with liquid nitrogen in order to maintain a constant temperature of 77 Kelvin. The approximately 5.11-meter multi-pass path cells incorporate aspheric, aberration-correcting mirrors to increase the optical throughput and the detection sensitivity. Transducers and thermocouples are connected directly to the insulated sample cells that provide the pressure and temperatures of the sample streams. During testing, the temperature of the absorption cells will be set at 191 ºC. Elevated temperature prevents gas condensation within the cell and minimizes analyte adhesion to the cell walls and mirrors. The volume of the absorption cell is 0.5 liters, so at a sample gas flow rate of 4.0 liters per minute, the sample gas in the cell is refreshed approximately four times each minute. Interferograms consisting of 56 co-added scans will be recorded continuously during the test periods, and will provide approximately 60-second average concentrations. All test results will be available in real-time, on-site, with summaries at the end of each test day.

APPENDIX A
QA/QC PROGRAM

QA/QC PROGRAM
AIR HYGIENE ensures the quality and validity of its emission measurement and reporting procedures through a rigorous quality assurance (QA) program. The program is developed and administered by an internal QA team and encompasses six major areas:
1. Field Qualifications 2. QA reviews of reports, laboratory work, and field testing; 3. Equipment calibration and maintenance; 4. Chain-of-custody; 5. Training; and 6. Knowledge of current test methods
Field Qualifications Air Hygiene personnel are required to gain and maintain competence with testing methods and techniques according to their job titles and the roles they play during field testing events. Qualifications for each job description include: Staff Technician - An entry level position with responsibility to test on the stack by performing duties that include: keep trucks and trailers stocked and clean, travel to and from job site, be the “hands of the test” on the stack; stay on a stack during the sample test, set up and tear down equipment on-site, perform maintenance on equipment in the shop and on-site. Test Technician or Specialist - Acts as the “hands of the test” on the stack by performing duties that include: stay on a stack during the sample test, migrate to the testing trailer and learn the different analyzers and testing methods used on site, set up and tear down testing equipment on site, learn the system for testing from Testing Managers and Project Managers, travel to and from job site; including driving responsibilities under DOT requirements, follow directions of Testing Managers and Project Managers, learn the proper way to conduct on-site test of stationary stacks Test Manager or Engineer - Directs and coordinates all aspects of a successful test by performing the following duties personally or through subordinate supervisors including: operating analyzers and consoles during testing along with QA/QC procedures, supervise set up and tear down of equipment on site, writing, reviewing, and revising final test reports, working with the client or state personnel while on the job site, managing pre-test checklists and onsite testing procedures, diagnose and repair any problems that may arise with the equipment, safely operate a man life and drive a truck with or without a trailer, act as crew leader in the field, write protocols and reports, maintain project log of services performed on the job, verify all equipment needed for a job was loaded on the trailer. Test Managers must hold as least one QSTI certificate. Project Manager - Directs and coordinates all aspects of a successful test by performing the following duties personally or through subordinate supervisors including: operating analyzers and consoles during testing along with QA/QC procedures, supervise set up and tear down of equipment on site, writing, reviewing, and revising final test reports, working with the client or state personnel while on the job site, managing pre-test checklists and onsite testing procedures, diagnose and repair any problems that may arise with the equipment, safely operate a man life and drive a truck with or without a trailer, act as crew leader in the field, write protocols and reports, maintain project log of services performed on the job, verify all equipment needed for a job was loaded on the trailer. Project Managers typically hold QSTI certificates in Groups 1 through 4. QA Reviews AIR HYGIENE’s review procedure includes a review of each source test report, along with laboratory and fieldwork by the QA Team. The most important review is the one that takes place before a test program begins. The QA Team works closely with technical division personnel to prepare and review test protocols. Test protocol review includes selection of appropriate test procedures, evaluation of interferences or other restrictions that might preclude use of standard test procedures, and evaluation and/or development of alternate procedures.

Equipment Calibration and Maintenance The equipment used to conduct the emission measurements is maintained according to the manufacturer’s instructions to ensure proper operation. In addition to the maintenance program, calibrations are carried out on each measurement device according to the schedule outlined by the Environmental Protection Agency. Quality control checks are also conducted in the field for each test program. Chain-of-Custody AIR HYGIENE maintains full chain-of-custody documentation on all samples and data sheets. In addition to normal documentation of changes between field sample custodians, laboratory personnel, and field test personnel, AIR HYGIENE documents every individual who handles any test component in the field (e.g., probe wash, impinger loading and recovery, filter loading and recovery, etc.). Samples are stored in a locked area to which only AIR HYGIENE personnel have access. Field data sheets are secured at AIR HYGIENE’s offices upon return from the field. Per standard Air Hygiene policy, laboratory samples will be discarded after 30 days of receipt of final report unless otherwise specified in writing. Training Personnel training is essential to ensure quality testing. AIR HYGIENE has formal and informal training programs, which include: 1. Attendance at EPA-sponsored training courses; 2. Enrollment in EPA correspondence courses; 3. A requirement for all technicians to read and understand Air Hygiene Incorporated’s QA manual; 4. In-house training and QA meetings on a regular basis; and 5. Maintenance of training records. Knowledge of Current Test Methods With the constant updating of standard test methods and the wide variety of emerging test procedures, it is essential that any qualified source tester keep abreast of new developments. AIR HYGIENE subscribes to services, which provide updates on EPA reference methods, rules, and regulations. Additionally, source test personnel regularly attend and present papers at testing and emission-related seminars and conferences.

COMBUSTION TESTING QUALITY ASSURANCE ACTIVITIES A number of quality assurance activities are undertaken before, during, and after each testing project. The following paragraphs detail the quality control techniques, which are rigorously followed during testing projects. Each instrument’s response will be checked and adjusted in the field prior to the collection of data via multi-point calibration. The instrument’s linearity will be checked by first adjusting its zero and span responses to zero nitrogen and an upscale calibration gas in the range of the expected concentrations. The instrument response will then be challenged with other calibration gases of known concentration and accepted as being linear if the response of the other calibration gases agrees within plus or minus 2 percent of range of the predicted values. After each test run, the analyzers will be checked for zero and span drift. This allowed each test run to be bracketed by calibrations and documents the precision of the data just collected. The criteria for acceptable data are that the instrument drift is no more than 3 percent of the full-scale response. Quality assurance worksheets will be prepared to document the multipoint calibration checks and zero to span checks performed during the tests. The sampling systems will be leak checked by demonstrating that a vacuum greater than 10 in Hg can be held for at least 1 minute with a decline of less than 1 in. Hg. A leak test will be conducted after the sample system is set up and before the system is dismantled. This test will be conducted to ensure that ambient air has not diluted the sample. Any leakage detected prior to the tests will be repaired and another leak check conducted before testing commences. The absence of leaks in the sampling system will also be verified by a sampling system bias check. The sampling system’s integrity will be tested by comparing the responses of the analyzers to the calibration gases introduced via two paths. The first path will be directly into the analyzer and the second path will be via the sample system at the sample probe. Any difference in the instrument responses by these two methods will be attributed to sampling system bias or leakage. The criteria for acceptance will be agreement within 5 percent of the span of the analyzer. The control gases used to calibrate the instruments will be analyzed and certified by the compressed gas vendors to ± 1% accuracy for all gases. EPA Protocol No. 1 will be used where applicable to assign the concentration values traceable to the National Institute of Standards and Technology (NIST), Standard Reference Materials. AIR HYGIENE maintains a large variety of calibration gases to allow the flexibility to accurately test emissions over a wide range of concentrations.

APPENDIX B
TEST EQUIPMENT CONFIGURATION AND DESCRIPTION

INSTRUMENT CONFIGURATION AND OPERATIONS FOR GAS ANALYSIS The sampling and analysis procedures to be used conform with the methods outlined in the Code of Federal Regulations, Title 40, Part 60, Appendix A, Methods 1, 2, 3A, 4, 5, 7E, 10, 18, 19, and 25A; 40 CFR 51, Appendix M, 202; and 40 CFR 63, Appendix A, Method 320. The sample system to be used for the real-time gas analyzer tests is configured per the following description. A stainless steel probe will be inserted near the center of the stack. The gas sample will be continuously pulled through the probe and transported via 3/8-inch heat-traced Teflon® tubing to a stainless steel, minimum-contact condenser designed to dry the sample and then through Teflon® tubing via a stainless steel/Teflon® diaphragm pump and into the sample manifold within the mobile laboratory. From the manifold, the sample is partitioned to the real-time gas analyzer through rotameters that control the flow rate of the sample. Exhaust samples are routed to the wet based analyzer prior to gas conditioning. The schematic (Figure 1) shows that the sample system is also equipped with a separate path through which a calibration gas could be delivered to the probe and back through the entire sampling system. This allows for convenient performance of system bias checks as required by the testing methods. All instruments are housed in an air-conditioned, trailer-mounted mobile laboratory. Gaseous calibration standards are provided in aluminum cylinders with the concentrations certified by the vendor according to EPA Protocol No. 1. This general schematic also illustrates the analyzers to be used for the tests (i.e., O2, CO). All data from the Reference Method continuous monitoring instruments are recorded on a Logic Beach Hyperlogger. The Hyperlogger retrieves calibrated emissions data from each instrument every second. An average value is recorded every 30 seconds. The stack gas analysis for O2 and CO2 concentrations will be performed in accordance with procedures set forth in EPA Method 3A. The O2 analyzer uses a paramagnetic cell detector and the CO2 analyzer uses a continuous nondispersive infrared analyzer. EPA Method 7e will be used to determine concentrations of NOx. A chemiluminescence analyzer will be used to provide the analysis. A NO2 in nitrogen certified gas cylinder will be used to verify at least a 90 percent NO2 conversion on the day of the test. Method 320, utilizing an FTIR may also be used for the analysis. CO emission concentrations will be quantified in accordance with procedures set forth in EPA Method 10 or 320. A continuous nondispersive infrared (NDIR) analyzer will be used for this purpose. Method 320, utilizing an FTIR may also be used for the analysis. VOC emission concentrations will be quantified in accordance with principles set forth in EPA Method 18. A VIG 210 will be used for this purpose. The VIG 210 includes both a conventional total hydrocarbon (THC) analyzer and an automated gas chromatograph (GC) for determining VOCs. Two FID (flame ionization detectors) are used for the measurements: one for the THC channel and the other for the automated GC which can measure methane, ethane, and residual (VOCs). The THC sample is injected directly to the FID. This detector responds to all hydrocarbons in the sample. NH3 emission concentrations will be quantified in accordance with principles set forth in EPA Method 320. A FTIR will be used for the analysis. Figure 2 represents the sample system used for the PM10/2.5 tests. A heated probe will be inserted into the sample ports of the stack to extract gas measurements from the emission stream through a filter, condenser and dry glass impinger train. Flow rates will be monitored with oil filled manometers and total sample volumes were measured with dry gas meters.

Figure 1EMISSIONS TESTING LAB
E:\SHARED\DRAWINGS\EMISSIONS TESTING LAB.PPT 04/18/08 DRAWING:08-001 TKG COPYRIGHT © 2011 AIR HYGIENE INTERNATIONAL, INC.
1600 W Tacoma StreetBroken Arrow, Oklahoma 74012
www.airhygiene.com(888) 461-8778
STA
CK
EXH
AU
ST
dual
line
hea
ted
sam
ple
umbi
lical
FLOW
CO
NTR
OL M
AN
IFOLD
GA
S C
ON
DIT
ION
ER
CA
LIB
RA
TIO
N/
BIA
S G
AS
BO
TTLE
S
HOT/WET ANALYZERS
DATARECORDER
VENT
Shown fully equipped. Some labs may not contain these features and others may contain additional features specific to certain scopes.
COLD/DRY ANALYZERS
O2, CO2, NOx, CO, SO2
THC, VOC GAS DILUTER
FTIR
TEST TRAILER EXTERIORTEST TRAILER INTERIOR
PR
OB
E
HE
ATE
D P
RO
BE
FI
LTE
R
Heated Teflon Tubing (pre-conditioned sample)
Unheated Teflon Tubing (conditioned sample)
Diluted Calibration Gas
Calibration Gas
Electronic Input/Output
LEG
END
CO
MP
UTE
R
PR
OC
ES
S IN
LET
OR
2N
DS
TAC
K
dual line heatedsam
ple umbilical
PR
OB
E
HE
ATE
D P
RO
BE
FILTE
R
VENT
MANIFOLD
COLD/DRYANALYZERS
HOT/WET
O2, CO2, NOx,CO, SO2
THC, VOC CO
ND
ITION
ER
MOBILESECONDARYANALYZERS
FIXEDPRIMARY
ANALYZERS

Figure 2RM5 / 202 ASSEMBLY
E:\SHARED\DRAWINGS\SAMPLING TRAIN.PPT 01/05/18 DRAWING:18-001 TKG COPYRIGHT © 2009 AIR HYGIENE INTERNATIONAL, INC.
1600 W Tacoma StreetBroken Arrow, Oklahoma 74012
www.airhygiene.com(888) 461-8778
Temperature Sensor
ProbeType S Pitot Tube
StackWall
TemperatureSensor
Nozzle
Type S PitotTube
TemperatureSensor
(here and multiple
locations)Liner
(glass)
ProbeSheath
(heated)
Impingers
GlassFilter
Holder
Hot Box
Heated Area
Split Cold Box
IceWaterBath
VacuumLine
VacuumGauge
MainValve
Air-TightPump
By-passValve
Dry GasMeter
Orifice
Oil-FillerManometer
Oil-FillerManometer
Wet Chemistry Assembly(photo)
View of Probe End(from the bottom)
VerticalCondenser
WithDropout
Recirc.pump
CPMFilter
Holder
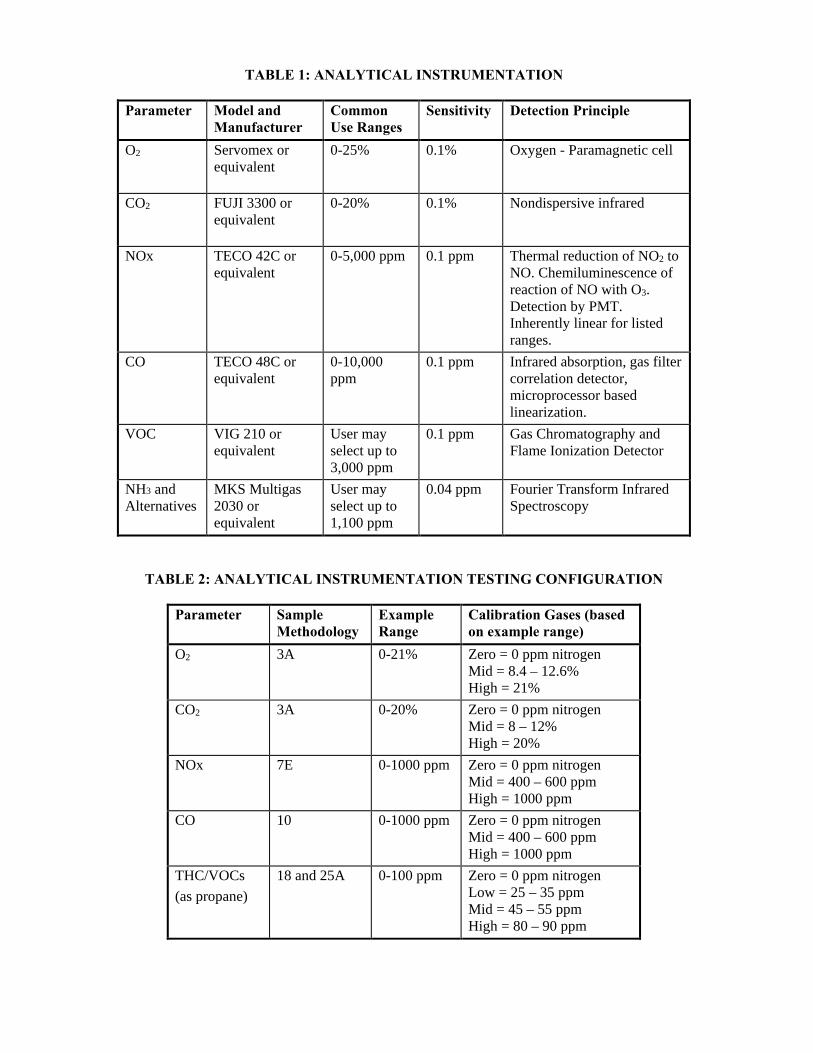
TABLE 1: ANALYTICAL INSTRUMENTATION
Parameter Model and Manufacturer
Common Use Ranges
Sensitivity Detection Principle
O2 Servomex or equivalent
0-25% 0.1% Oxygen - Paramagnetic cell
CO2 FUJI 3300 or equivalent
0-20% 0.1% Nondispersive infrared
NOx TECO 42C or equivalent
0-5,000 ppm 0.1 ppm Thermal reduction of NO2 to NO. Chemiluminescence of reaction of NO with O3. Detection by PMT. Inherently linear for listed ranges.
CO TECO 48C or equivalent
0-10,000 ppm
0.1 ppm Infrared absorption, gas filter correlation detector, microprocessor based linearization.
VOC VIG 210 or equivalent
User may select up to 3,000 ppm
0.1 ppm Gas Chromatography and Flame Ionization Detector
NH3 and Alternatives
MKS Multigas 2030 or equivalent
User may select up to 1,100 ppm
0.04 ppm Fourier Transform Infrared Spectroscopy
TABLE 2: ANALYTICAL INSTRUMENTATION TESTING CONFIGURATION
Parameter Sample Methodology
Example Range
Calibration Gases (based on example range)
O2 3A 0-21% Zero = 0 ppm nitrogen Mid = 8.4 – 12.6% High = 21%
CO2 3A 0-20% Zero = 0 ppm nitrogen Mid = 8 – 12% High = 20%
NOx 7E 0-1000 ppm Zero = 0 ppm nitrogen Mid = 400 – 600 ppm High = 1000 ppm
CO 10 0-1000 ppm Zero = 0 ppm nitrogen Mid = 400 – 600 ppm High = 1000 ppm
THC/VOCs (as propane)
18 and 25A 0-100 ppm Zero = 0 ppm nitrogen Low = 25 – 35 ppm Mid = 45 – 55 ppm High = 80 – 90 ppm

APPENDIX C
STACK DRAWINGS

(Lfw) 71.50 in.(Lnw) 8.00 in.*(D) 63.50 in. Lfw= in.(As) 21.99 ft2
*assume 8 in. reference (must be measured and verified in field)
(A) 89.00 in.(AD) 1.40 diameters(B) 392.27 in. Lnw= in.(BD) 6.18 diameters
Down (BD) Up (AD) Particulate VelocityStream Stream Points Points Criteria Points
2.00-4.99 0.50-1.24 24 16 RM 7E 8.1.2 12 RM1 pts5.00-5.99 1.25-1.49 20 16 Alt 7E 8.1.2 3 points6.00-6.99 1.50-1.74 16 12 A = ft.7.00-7.99 1.75-1.99 12 12 AD = dia.>= 8.00 >=2.00 8 or 122 8 or 122
20 1616 1220 16 Criteria Points B = ft.
1 Check Minimum Number of Points for the Upstream Part75/60 12 RM1 pts BD = dia. and Downstream conditions, then use the largest. 75 abrv (a) 3 points2 8 for Circular Stacks 12 to 24 inches 75 abrv (b) 6 points 12 for Circular Stacks over 24 inches
2 Ports by 10 Pts / port20 Pts Used 20 Required
% in. in.1 2.6% 1 5/8 9 5/82 8.2% 5 2/8 13 2/83 14.6% 9 2/8 17 2/8 49 6/84 22.6% 14 3/8 22 3/8 29 6/85 34.2% 21 6/8 29 6/8 22 3/86 65.8% 41 6/8 49 6/8 17 2/87 77.4% 49 1/8 57 1/8 13 2/88 85.4% 54 2/8 62 2/8 9 5/89 91.8% 58 2/8 66 2/8 57 1/810 97.4% 61 7/8 69 7/8 62 2/811 66 2/812 69 7/8131415161718192021222324
Location
D =Distance Upstream
Traverse Points
Number of Traverse Points RequiredDiameters to
Flow Disturbance
Diameter of Stack
Minimum Number of
Comp StratificationTraverse Points
6.2
2
71.5
in.63.5
8.0
7.4
# of Ports Used
Project #
Traverse Point Locations
Circular Stack or Duct Diameter
Distance from Disturbances to Port
Distance to Far Wall of Stack
Area of Stack
Distance Downstream
Distance to Near Wall of Stack
Denton, Texas
Diameters Downstream
Traverse Point
Number
Percent of Stack
Diameter
Distance from
Inside Wall
Distance Including Reference
Length
32.7
1.4
RATA StratificationTraverse Pts Required
METHOD 1 - ISOKINETIC TRAVERSE FOR A CIRCULAR SOURCE
2018bv-18-denton.tx-start#22
Company City of Denton Date
# of Ports AvailablePlant NameEquipment
Denton Energy Center ProjectWartsila 18V50SG
Number of Traverse Points UsedIsokinetic Traverse (Wet
Chemistry Testing)
Minimum Number of
Diameters Upstream
Minimum Number of1
Traverse PointsUpstream SpecDownstream Spec
Disturbance to
Upstream
Port
Disturbance to
Dow
nstream P
ortD
C
B
A
North
FLOW
bv-18-denton.tx-start#2-PMTrav

(Lfw) 71.50 in.(Lnw) 8.00 in.*(D) 63.50 in. Lfw= in.(As) 21.99 ft2
*assume 8 in. reference (must be measured and verified in field)
(A) 89.00 in.(AD) 1.40 diameters(B) 392.27 in. Lnw= in.(BD) 6.18 diameters
Down (BD) Up (AD) Particulate VelocityStream Stream Points Points Criteria Points
2.00-4.99 0.50-1.24 24 16 RM 7E 8.1.2 12 RM1 pts5.00-5.99 1.25-1.49 20 16 Alt 7E 8.1.2 3 points6.00-6.99 1.50-1.74 16 12 A = ft.7.00-7.99 1.75-1.99 12 12 AD = dia.>= 8.00 >=2.00 8 or 122 8 or 122
20 1616 1220 16 Criteria Points B = ft.
1 Check Minimum Number of Points for the Upstream Part75/60 12 RM1 pts BD = dia. and Downstream conditions, then use the largest. 75 abrv (a) 3 points2 8 for Circular Stacks 12 to 24 inches 75 abrv (b) 6 points 12 for Circular Stacks over 24 inches
2 Ports by 6 Pts / port12 Pts Used 12 Required
% in. in.1 4.4% 2 6/8 10 6/82 14.6% 9 2/8 17 2/83 29.6% 18 6/8 26 6/8 68 6/84 70.4% 44 6/8 52 6/8 62 2/85 85.4% 54 2/8 62 2/8 52 6/86 95.6% 60 6/8 68 6/8 26 6/87 17 2/88 10 6/89101112131415161718192021222324
Location
D =Distance Upstream
Traverse Points
Number of Traverse Points RequiredDiameters to
Flow Disturbance
Diameter of Stack
Minimum Number of
Comp StratificationTraverse Points
12 points
6.2
2
71.5
in.63.5
8.0
7.4
# of Ports Used
Project #
Traverse Point Locations
Circular Stack or Duct Diameter
Distance from Disturbances to Port
Distance to Far Wall of Stack
Area of Stack
Distance Downstream
Distance to Near Wall of Stack
Denton, Texas
Diameters Downstream
Traverse Point
Number
Percent of Stack
Diameter
Distance from
Inside Wall
Distance Including Reference
Length
32.7
1.4
RATA StratificationTraverse Pts Required
METHOD 1 - STRATIFICATION TEST FOR A CIRCULAR SOURCE
2018bv-18-denton.tx-start#22
Company City of Denton Date
# of Ports AvailablePlant NameEquipment
Denton Energy Center ProjectWartsila 18V50SG
Number of Traverse Points UsedStratification Traverse
(Compliance Test)
Minimum Number of
Diameters Upstream
Minimum Number of1
Traverse PointsUpstream SpecDownstream Spec
Disturbance to
Upstream
Port
Disturbance to
Dow
nstream P
ortD
C
B
A
North
FLOW
bv-18-denton.tx-start#2-Strat

APPENDIX D
EXAMPLE TEMPLATES AND CALCULATIONS
Company: O2 NOx CO THC CO2 SO2
Location: Low
Date: Mid
Unit Make and Model: High
Unit Number:
Serial Number:
Data Recorded By:
Tested With AHI Unit(s): Truck(s): Trailer(s):
LDEQ Warmup/Cal Req: On (Day/Time): Cal (Day/Time):
INSTRUMENT SERIAL #O2
NOx
CO
THCCOS ti P ( i )
Time Stop (hh:mm:ss)
Barometric Pressure (in. Hg)
Ambient Temperature (oF)Relative Humidity (%)
Run #4 AverageREPORT INFORMATION
Time Start (hh:mm:ss)
RUN INFORMATION Run #1 Run #2 Run #3
ENGINE TEST - FIELD DATA SHEET
CYLINDER SERIAL
NUMBERS
Cylinder Num
NO2 CONVERSION
NO2 Gas (ppm)
NO Reading (ppm)
NOx Reading (ppm)
Stack Dia. = __________
Measured By: __________
Measured With: __________
CO2
SO2
TIME (hh:mm) RESP (min)
Gas Inject / /
1st Inst. @ 95% / / / /
2nd Inst. @ 95% / / / /
3rd Inst. @ 95% / / / /
Conc. Actual Conc. Actual Conc. Actual Conc. Actual Conc. Actual
Zero Mid Zero Mid Zero Mid Zero Mid Zero Mid
Bi G A t l C
Run #1/Run #2
Run #2/Run #3
Run #3/Run #4
Run #4/Final
CO CO2
Initial/Run #1
High Gas
BIAS O2 NOx THC
Zero Gas
Low Gas
Mid Gas
O2
Air Manifold Pressure (psig or in. Hg)
Engine Timing BTDC
CALIBRATION CO2NOx CO THC
Fuel Flow (SCF/hr)
Turbo Speed (npt) or (rpm)
Engine Speed (npg) or (rpm)
Air Manifold Temperature (oF)
Suction Pressure (psig)
Discharge Pressure (psig)
Rated Horsepower (hp)
Actual Horsepower (hp) RESPONSE TIME
Bias Gas Actual Conc.

UNITS 1 2 3 4 5 6 7 8 9 10 11 12 13 14 15 16 17 18Start Time hh:mm:ss
End Time hh:mm:ss
Bar. Pressure in. Hg
Amb. Temp. °F
Rel. Humidity %
Spec. Humidity lb water / lb air
Comb. Inlet Pres. psig
NOx Water Inj. gpm
Total Fuel Flow SCFH
Heat Input MMBtu/hr
Power Output megawatts
Steam Rate lb/hr
Tester(s) / Test Unit(s):
Air Permit # :
Plant Name or Location:
Date:
Project Number:
Serial Number:
Manufacturer & Equipment:
Model:
RUN
Unit Number:
Test Load:
Comp&RATA&Eng-AHI v1.3

Client:Location:
Date:Project #:
Natural Gas - Fuel Analysis
Mole (%)Molecular1
Weight(lb/lb-mole)
LbsComponentper Lb-Mole
of Gas
Wt. % of Component
Ideal Gross1,3
Heating Value (Btu/ft3)
Fuel Heat Value [HHV] (Btu/SCF)
Ideal Net1,3
Heating Value (Btu/ft3)
Fuel Heat Value [LHV] (Btu/SCF)
Methane CH4
Ethane C2H6
Propane C3H8
iso-Butane iC4H10
n-Butane nC4H10
Iso-Pentane iC5H12
n-Pentane nC5H12
Hexanes C6H14
Heptanes C7H16
Octanes C8H18
Carbon Dioxide CO2
Nitrogen N2
Hydrogen Sulfide H2SOxygen O2
Helium HeHydrogen H2
dry drywet2,5 wet2,5
Component Wt%Molecular Weight of gas = lb/lb-mole carbonBtu per lb. of gas4 = gross (HHV) oxygenBtu per lb. of gas4 = net (LHV) hydrogenDensity of fuel gas2 = lb/cu. ft nitrogenWt % VOC in fuel gas = % heliumSpecific Gravity1 = sulfur
Total
F-Factor Calculation:F-Factor = 1,000,000*((3.64*%H)+(1.53*%C)+(0.57*%S)+(0.14*%N)-(0.46*%O))/GCVGCV = Gross Btu per lb. of gas (HHV)%H, %C, %S, %N, & %O are percent weight values calculated from fuel analysis and have units of (scf/lb)/%Density of natural gas based on specific gravity multiplied by density of air at 68 deg F and 14.696 psia.
References:1 ASTM D 35882 Civil Engineering Reference Manual, 7th ed. - Michael R. Lindeburg3 Mark's Standard Handbook for Mechanical Engineers, 10th ed. - Eugene A. Avallone, Theodore Baumeister III4 Introduction to Fluid Mechanics, 3rd ed. - William S. Janna5 GPA Reference Bulletin 181-86, revised 1986, reprinted 1995
Standardized to 68 deg F and 14.696 psia - EPA Standards
Characteristics of Fuel Gas
Totals
Gas Component
F-Factor (SCF dry exhaust per MMBtu [HHV]) =(Based on EPA RM-19) at 68 deg F and 14.696 psia
Comp&RATA&Eng-AHI v1.3

Calibration Date:Client:
NOx Span (ppm) =
Linearity =
CO Span (ppm) =
Linearity =
O2 Span (%) =
Linearity =
THC Range (ppm) =
Linearity =1-zero/high based on 2% of span,low/mid based on 5% of concentration
CO2 Span (%) =
Linearity =
InstrumentResponse
(ppm)
CalibrationError(%)
AbsoluteConc.(ppm)
Pass orFail (±2%,
�0.5%)
Pass orFail (±2%,
�0.5%)
AbsoluteConc.(ppm)
Pass orFail (±2%,�0.5ppm)
CertifiedConcentration
(ppm)
InstrumentResponse
(ppm)
CalibrationError(%)
EstimatedPoint(ppm)
Pass orFail
(±2,5%)1
CertifiedConcentration
(ppm)
FUJI 3300 (CO2 Analyzer)Certified
Concentration(ppm)
CertifiedConcentration
(ppm)
InstrumentResponse
(ppm)
CalibrationError(%)
THERMO 51 (THC Analyzer)
InstrumentResponse
(ppm)
CalibrationError(%)
AbsoluteConc.(ppm)
SERVOMEX 1400 (O2 Analyzer)
API 300 (CO Analyzer) Linearity Plot
THERMO 42H (NOx Analyzer) Linearity Plot
SERVOMEX 1400 (O2 Analyzer) Linearity Plot
THERMO 51 (THC Analyzer) Linearity Plot
FUJI 3300 (CO2 Analyzer) Linearity Plot
API 300 (CO Analyzer)
THERMO 42H (NOx Analyzer)Certified
Concentration(ppm)
InstrumentResponse
(ppm)
CalibrationError(%)
AbsoluteConc.(ppm)
Pass orFail (±2%,�0.5ppm)
0.00
0.20
0.40
0.60
0.80
1.00
1.20
0.00 0.20 0.40 0.60 0.80 1.00 1.20
Certified Concentrations (ppm)
Inst
rum
ent R
espo
nse
(ppm
)
0.00
0.20
0.40
0.60
0.80
1.00
1.20
0.00 0.20 0.40 0.60 0.80 1.00 1.20
Certified Concentrations (ppm)In
stru
men
t Res
pons
e (p
pm)
0.00
0.20
0.40
0.60
0.80
1.00
1.20
0.00 0.20 0.40 0.60 0.80 1.00 1.20
Certified Concentrations (%)
Inst
rum
ent R
espo
nse
(%)
0.00
0.20
0.40
0.60
0.80
1.00
1.20
0.00 0.20 0.40 0.60 0.80 1.00 1.20
Certified Concentrations (ppm)
Inst
rum
ent R
espo
nse
(ppm
)
0.00
0.20
0.40
0.60
0.80
1.00
1.20
0.00 0.20 0.40 0.60 0.80 1.00 1.20
Certified Concentrations (%)
Inst
rum
ent R
espo
nse
(%)
Comp&RATA&Eng-AHI v1.3

NOx Converter EfficiencyDate:
Analyzer:
Audit Gas: NO2 Concentration (Cv), ppmvdConverter Efficiency Calculations:
Analyzer Reading, NO Channel, ppmvdAnalyzer Reading, NOx Channel, ppmvdAnalyzer Reading, NO2 Channel (CDir(NO2)), ppmvdConverter Efficiency, %
ppmvd
ppmvd
Date/Time Elapsed Time NOx NO
mm/dd/yy hh:mm:ss Seconds ppmvd ppmvd
RM 7E, (08-15-06), 8.2.4.1 Introduce a concentration of 40 to 60 ppmv NO2 to the analyzer in direct calibration mode and record the NOx concentration displayed by the analyzer. ... Calculate the converter efficiency using Equation 7E-7 in Section 12.7. The specification for converter efficiency in Section 13.5 must be met. ... The NO 2 must be prepared according to the EPA Traceability Protocol and have an accuracy within 2.0 percent.
RM 7E, (08-15-06), 13.5 NO2 to NO Conversion Efficiency Test (as applicable). The NO2 to NO conversion efficiency, calculated according to Equation 7E-7 or Equation 7E-9, must be greater than or equal to 90 percent.
Eq. 7E-7 =1002 ����
�
��
V
DirNO C
CEff x 100 =
Comp&RATA&Eng-AHI v2.1

Fuel Data Weather DataFuel Fd factor SCF/MMBtu in. Hg
Fuel Heating Value (HHV) Btu/SCF % o F lb H2O / lb air
Unit DataUnit Load megawatts
Heat Input lb/MMBtuSteam Rate Steam lb/hr
Combustor Inlet Pres. psigNOx Control Water Injection gpm
Est. Stack Moisture %Stack Exhaust Flow (M2) SCFH
Stack Exhaust Flow (M19) SCFH
Date/Time Elapsed Time O2 NOx CO(mm/dd/yy hh:mm:ss) (seconds) (%) (ppmvd) (ppmvd)
RAW AVERAGE
O2 NOx CO
(%) (ppmvd) (ppmvd)Initial ZeroFinal ZeroAvg. Zero
Initial UpScaleFinal UpScaleAvg. UpScale
Upscale Cal Gas
O2 NOx CO
Concentration (ppm@ %O &ISO)Concentration (ppm@ %O )
Barometric Pressure Relative Humidity
Ambient Temperature Specific Humidity
Run - 1
Emission Rate (tons/year) at 8760 hr/yr
Emission Rate (g/hp*hr)
Serial Number:
Corrected Raw Average (ppm/% wet basis)
Bia
s
EMISSIONS DATA
Emission Rate (lb/MMBtu)
Emission Rate (lb/hr)
Corrected Raw Average (ppm/% dry basis)
Emission Rate (tons/day) at 24 hr/day
Comp&RATA&Eng-AHI v1.3

O2 NOx CO
Initial ZeroFinal Zero
Initial UpscaleFinal Upscale
O2 NOx CO
Initial ZeroFinal Zero
Initial UpscaleFinal Upscale
3% of Range (drift)5% of Range (bias)
Final Upscale BiasUpscale Drift
Alte
rnat
ive
Spe
cific
atio
n
Abs
Diff
Calibration Span
Initial Zero BiasFinal Zero Bias
Zero DriftInitial Upscale Bias
Avg. UpScaleSys Resp (Zero)
Sys Resp (Upscale)Upscale Cal Gas
Final ZeroAvg. Zero
Initial UpScaleFinal UpScale
DRIFT AND BIAS CHECKRun - 2
Raw AverageCorrected Average
Initial Zero
Alte
rnat
ive
Spe
cific
atio
n
Abs
Diff
Calibration Span3% of Range (drift)5% of Range (bias)
Zero DriftInitial Upscale BiasFinal Upscale Bias
Upscale Drift
Sys Resp (Upscale)Upscale Cal GasInitial Zero BiasFinal Zero Bias
Initial UpScaleFinal UpScaleAvg. UpScale
Sys Resp (Zero)
DRIFT AND BIAS CHECKRun - 1
Raw AverageCorrected Average
Initial ZeroFinal ZeroAvg. Zero
Comp&RATA&Eng-AHI v1.3

Company: Date:Location:
Stack Gas Flow Rate: Method 19
Test # BrakeHorsepower O2 Conc. (%) Fuel Heating Value
(Btu/SCF)F Factor-Dry Oxy.(DSCFex/MMBtu)
Fuel Flow(SCF/hr)
Stack Flow(SCF/hr)
123
Average
NOx Mass Emission Rate
Test # BrakeHorsepower
NOx Conc. (ppmvd) MW E (g/hp*hr) E (lb/hr) E (ton/yr) E (lb/MMBtu)
1 46.012 46.013 46.01
Average 46.01
CO Mass Emission Rate
Test # BrakeHorsepower
CO Conc. (ppmvd) MW E (g/hp*hr) E (lb/hr) E (ton/yr) E (lb/MMBtu)
1 28.002 28.003 28.00
Average 28.00
Engine Tested:
Fuel Flow (Btu/hp•hr) is based upon the worst case assumption of 8,500 Btu/hp•hr fuel usage when site data for fuel flow is not available.
EMISSION CALCULATIONS SUMMARY TABLES
Engine Serial #:
Comp&RATA&Eng-AHI v1.3

Test Period: Air Permit Number: Location: Unit Number: Date: Suction Pressure (psi): Project Number: Discharge Pressure (psi): Engine Manufacturer: Stack Exhaust Temperature (oF): Engine Model: Rated Horsepower (hp): Engine Serial Number: Brake Horsepower (bhp): Analyzer Manufacturers: TECO(NOx), API(CO), TECO(THC) Engine Fuel Flow (SCFH): Analyzer Model Numbers: 42H, 300, 51 Specific Gravity: Date Analyzers Calibrated: Fuel Heating Value [HHV] (Btu/SCF): Emission Test Results: Appendix A BSFC (Btu/hp*hr): Analyzer Data Plots: Appendix B Annual Hours Allowed to Operate: 8,760 Cal Gas Spec. Sheets: Appendix C Engine Speed (rpm): Quality Control Data Sheets: Appendix D Air Manifold Temp (°F): Chromatograph Report: Appendix E Air Manifold Pressure (psi):
Turbo Speed (rpm): Engine Ignition Timing (°BTDC):
Relative Humidity (%): Load Step: Torque (%):
Stack Test Results Permit Limits Passing NOx (avg. ppmvd) CO (avg. ppmvd) VOC (avg. ppmvd) NOx @15%O� O2 (avg. ppmvd) CO @15%O� O2 (avg. ppmvd) VOC @15%O� O2 (avg. ppmvd) NOx (avg. lb/hr) CO (avg. lb/hr) VOC (avg. lb/hr) NOx (avg. g/hp*hr) CO (avg. g/hp*hr) VOC (avg. g/hp*hr)
All testing conducted according to United States Environmental Protection Agency (EPA), Methods: 7e, 10 and 25a.
TABLE 2.1: ENGINE EMISSIONS REPORT
Tested By: Air Hygiene International, Inc.Pollutant (units)Emission Test Results
Ambient Temperature (oF): Barometric Pressure (in. Hg):
Comp&RATA&Eng-AHI v2.4
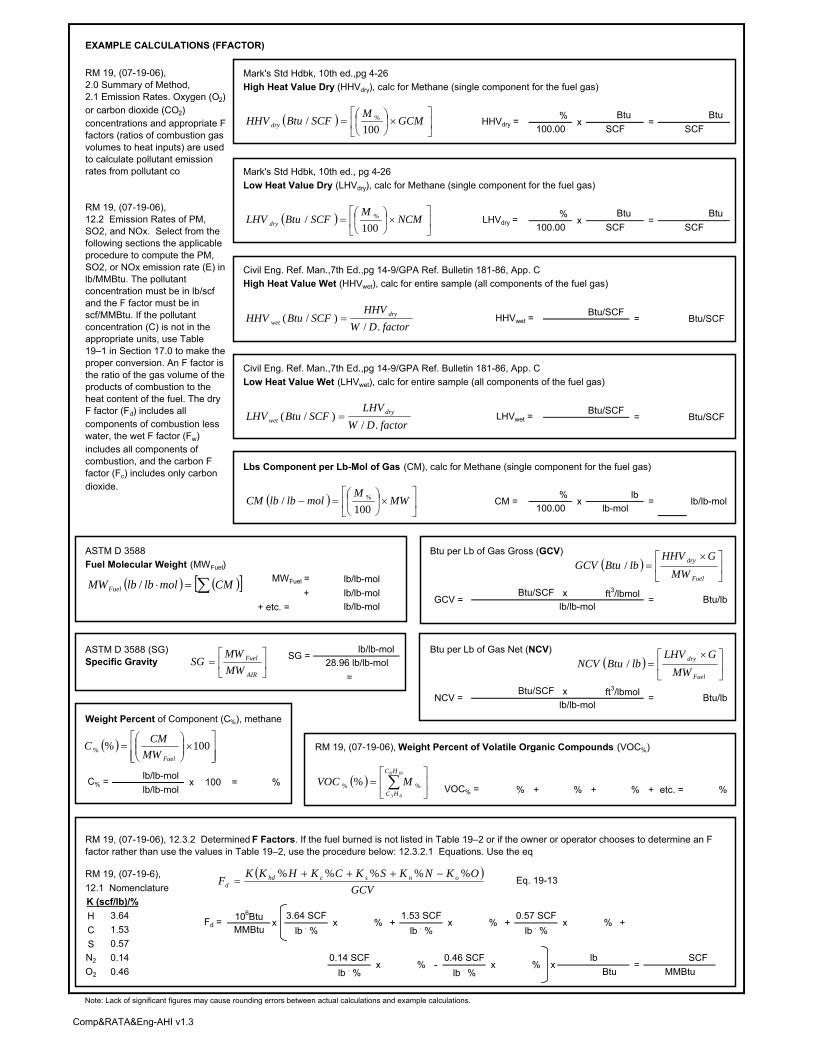
EXAMPLE CALCULATIONS (FFACTOR)
Mark's Std Hdbk, 10th ed.,pg 4-26High Heat Value Dry (HHVdry), calc for Methane (single component for the fuel gas)
%
Mark's Std Hdbk, 10th ed., pg 4-26Low Heat Value Dry (LHVdry), calc for Methane (single component for the fuel gas)
%
Civil Eng. Ref. Man.,7th Ed.,pg 14-9/GPA Ref. Bulletin 181-86, App. CHigh Heat Value Wet (HHVwet), calc for entire sample (all components of the fuel gas)
Btu/SCF
Civil Eng. Ref. Man.,7th Ed.,pg 14-9/GPA Ref. Bulletin 181-86, App. CLow Heat Value Wet (LHVwet), calc for entire sample (all components of the fuel gas)
Btu/SCF
Lbs Component per Lb-Mol of Gas (CM), calc for Methane (single component for the fuel gas)
% lb
ASTM D 3588 Btu per Lb of Gas Gross (GCV)Fuel Molecular Weight (MWFuel)
MWFuel = lb/lb-mol+ lb/lb-mol x
+ etc. =
lb/lb-mol Btu per Lb of Gas Net (NCV)
=x
Weight Percent of Component (C%), methane
RM 19, (07-19-06), Weight Percent of Volatile Organic Compounds (VOC%)
lb/lb-mollb/lb-mol VOC% = % + % + % + etc. = %
RM 19, (07-19-6),12.1 Nomenclature
HCSN2
O2
Note: Lack of significant figures may cause rounding errors between actual calculations and example calculations.
RM 19, (07-19-06), 2.0 Summary of Method, 2.1 Emission Rates. Oxygen (O2)or carbon dioxide (CO2)concentrations and appropriate F factors (ratios of combustion gas volumes to heat inputs) are used to calculate pollutant emission rates from pollutant co
ASTM D 3588 (SG)Specific Gravity
lb/lb-mol
28.96 lb/lb-mol
HHVwet =
GCV =
lb-mol
Btu/SCF
LHVwet =
%
x
-
RM 19, (07-19-06),12.2 Emission Rates of PM, SO2, and NOx. Select from the following sections the applicable procedure to compute the PM, SO2, or NOx emission rate (E) in lb/MMBtu. The pollutant concentration must be in lb/scf and the F factor must be in scf/MMBtu. If the pollutant concentration (C) is not in the appropriate units, use Table 19–1 in Section 17.0 to make the proper conversion. An F factor is the ratio of the gas volume of the products of combustion to the heat content of the fuel. The dry F factor (Fd) includes all components of combustion less water, the wet F factor (Fw)includes all components of combustion, and the carbon F factor (Fc) includes only carbon dioxide.
Eq. 19-13
1.53 SCF
CM = 100.00
lb/lb-mol
+0.57 SCF
x %xlb . %
% +
BtuSCF
HHVdry = x100.00 SCF
Btu=
LHVdry = x100.00
Btu=
SCF
Btu/SCF=
BtuSCF
Btu/SCF=
lb/lb-mol
= Btu/lb
=
C% =
= Btu/lblb/lb-mol
NCV = Btu/SCF
= %x 100
SG =
MMBtu lb . %
lb . %
lb . %
lb . %
x %
0.14 SCFx
SCFBtu MMBtu
3.64 SCF
lb=x x
0.46 SCF%
Fd = x106Btu
ft3/lbmol
ft3/lbmol
RM 19, (07-19-06), 12.3.2 Determined F Factors. If the fuel burned is not listed in Table 19–2 or if the owner or operator chooses to determine an F factor rather than use the values in Table 19–2, use the procedure below: 12.3.2.1 Equations. Use the eq
+
K (scf/lb)/%
1.53
0.46
3.64
0.140.57
� ��
���
�����
�� GCM
MSCFBtuHHV dry 100
/ %
� ��
���
����
�
�� NCMM
SCFBtuLHV dry 100/ %
� ��
���
����
�
��� MW
MmollblbCM
100/ %
� �� ���� CMmollblbMWFuel /
� ��
���
� ��
Fuel
dry
MWGHHV
lbBtuGCV /
� ��
���
� ��
Fuel
dry
MWGLHV
lbBtuNCV /
����
�
���
�����
�
�� 100%%
FuelMWCMC
��
���
��
AIR
Fuel
MWMW
SG
� ��
���
�� �
188
83
%% %HC
HCMVOC
factorDWHHV
SCFBtuHHV drywet ./
)/( �
factorDWLHV
SCFBtuLHV drywet ./
)/( �
�GCV
OKNKSKCKHKKF onschd
d%%%%% ����
�
Comp&RATA&Eng-AHI v1.3
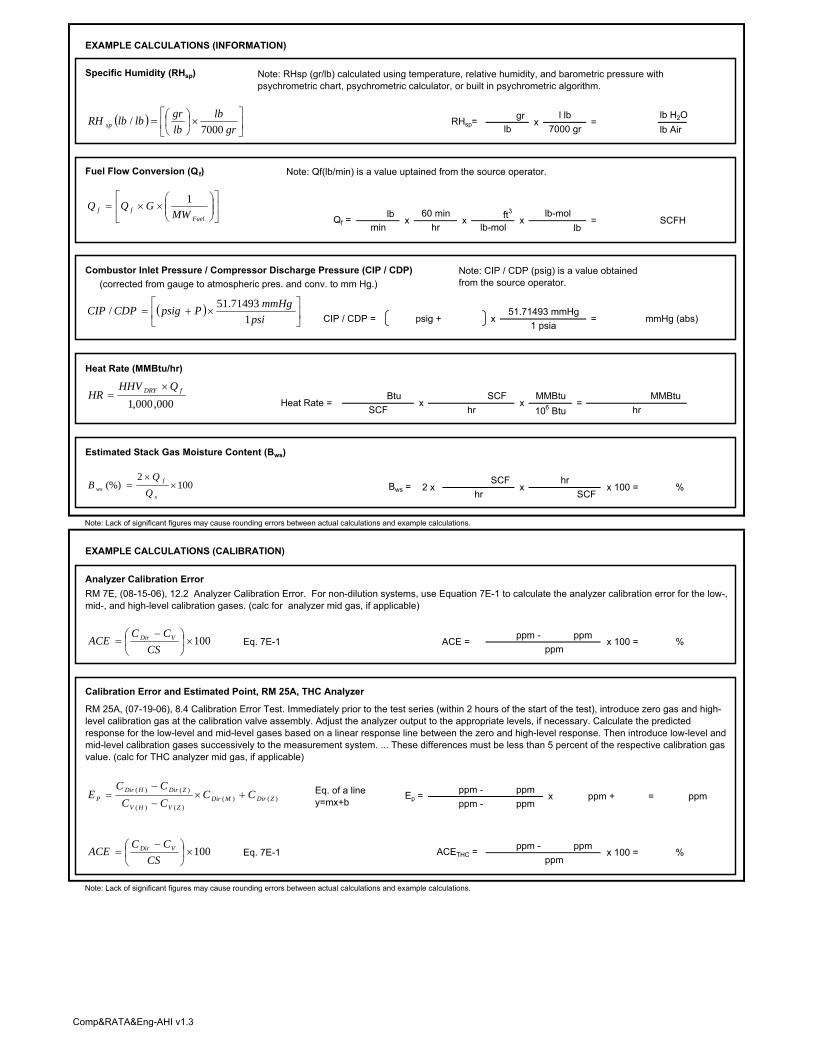
EXAMPLE CALCULATIONS (INFORMATION)
Specific Humidity (RHsp)
gr lb H2Olb Air
Fuel Flow Conversion (Qf) Note: Qf(lb/min) is a value uptained from the source operator.
lb ft3
lb
Combustor Inlet Pressure / Compressor Discharge Pressure (CIP / CDP)(corrected from gauge to atmospheric pres. and conv. to mm Hg.)
Heat Rate (MMBtu/hr)
Estimated Stack Gas Moisture Content (Bws)
Note: Lack of significant figures may cause rounding errors between actual calculations and example calculations.
EXAMPLE CALCULATIONS (CALIBRATION)
Analyzer Calibration Error
ppm - ppmppm
Calibration Error and Estimated Point, RM 25A, THC Analyzer
ppm - ppmppm - ppm
ppm - ppmppm
Note: Lack of significant figures may cause rounding errors between actual calculations and example calculations.
Note: RHsp (gr/lb) calculated using temperature, relative humidity, and barometric pressure with psychrometric chart, psychrometric calculator, or built in psychrometric algorithm.
CIP / CDP = mmHg (abs)51.71493 mmHg
=xMMBtu
hr 106 BtuHeat Rate =
Btux
SCFSCF
x xlb-mol
x
lb-mol
Note: CIP / CDP (psig) is a value obtained from the source operator.
1 psia
Qf = x60 min
min hr
psig +
RHsp=
%xhr
SCFBws = 2 x
SCFhr
x 100 =
=
= SCFH
hr
=
MMBtu
lbx
7000 grl lb
RM 7E, (08-15-06), 12.2 Analyzer Calibration Error. For non-dilution systems, use Equation 7E-1 to calculate the analyzer calibration error for the low-, mid-, and high-level calibration gases. (calc for analyzer mid gas, if applicable)
ACE = Eq. 7E-1
x 100 = %Eq. 7E-1
Eq. of a liney=mx+b
ACETHC =
Ep =
RM 25A, (07-19-06), 8.4 Calibration Error Test. Immediately prior to the test series (within 2 hours of the start of the test), introduce zero gas and high-level calibration gas at the calibration valve assembly. Adjust the analyzer output to the appropriate levels, if necessary. Calculate the predicted response for the low-level and mid-level gases based on a linear response line between the zero and high-level response. Then introduce low-level and mid-level calibration gases successively to the measurement system. ... These differences must be less than 5 percent of the respective calibration gas value. (calc for THC analyzer mid gas, if applicable)
ppm + = ppmx
%x 100 =100����
� �
�CS
CCACE VDir
100����
� �
�CS
CCACE VDir
)()()()(
)()(ZDirMDir
ZVHV
ZDirHDirP CC
CCCC
E ���
��
1002
(%) ��
�s
fws Q
QB
� ��
���
�����
��
grlb
lbgrlblbRH sp 7000
/
��
���
����
�
����
Fuelff MW
GQQ 1
000,000,1fDRY QHHV
HR�
�
� ��
���
����
psimmHgPpsigCDPCIP
151.71493/
Comp&RATA&Eng-AHI v1.3

EXAMPLE CALCULATIONS (BIAS, DRIFT, AND CORRECTED RAW AVERAGE)
System Bias
ppm - ppmppm
Drift Assessment
Eq. 7E-4 % - % %
Alternative Drift and Bias
Eq. Section 13.2 and 13.3 ppm - ppm ppm
Bias Adjusted Average
ppmppm - ppm
EXAMPLE CALCULATIONS (BSFC)Using HHV with Qf (SCFH)
Using LHV with Qf (Btu/hp*hr)
hp
Using LHV with Qf (SCFH) Using HHV with Qf (Btu/hp*hr)
Btu SCFhp
EXAMPLE CALCULATIONS (Emissions based on Table 29 values)
Emission Rate (lb/hr)Qf (Btu/hp*hr))
g lb
Emission Rate (g/hp-hr)Qf (Btu/hp*hr))
lb
gSCF %
Note: Lack of significant figures may cause rounding errors between actual calculations and example calculations.
SB / DAlt = |
Eq. 7E-5 ppm - ppm
RM 7E, (08-15-06), 12.3 System Bias. For non-dilution systems, use Equation 7E-2 to calculate the system bias separately for the low-level and upscale calibration gases. (calc for analyzer upscale gas, Run 1 initial bias, if applicable)
SB = Eq. 7E-2
=
| =
ppm xCGas =
| =
RM 7E, (08-15-06), 12.6 Effluent Gas Concentration. For each test run, calculate Cavg, the arithmetic average of all valid concentration values (e.g., 1-minute averages). Then adjust the value of Cavg for bias, using Equation 7E-5. (calc for analyzer, Run 1, if applicable)
RM 7E, (08-15-06), 12.5 Drift Assessment. Use Equation 7E-4 to separately calculate the low-level and upscale drift over each test run. (calc for analyzer upscale drift, Run 1, if applicable)
D = |
RM 7E, (08-15-06), 13.2 / 13.3 System Bias and Drift. Alternatively, the results are acceptable if |Cs – Cdir| is � 0.5 ppmv or if |Cs – Cv| is � 0.5 ppmv (as applicable). (calc for analyzer initial upscale, Run 1, if applicable)
%x 100 =
=Btu
hp*hrBtu
Btu
BtuscfBtu
x=SCF
BSFC =
hp*hr1
Btuhp*hr hp*hr
=Btu
hrBSFC =
N/A Btux
hp*hrBSFC =
SCF
E (lb/hr) =hp*hr
SCFhr
x1
=hp*hr
BSFC = xBtu
SCF
x453.6 g
lbhr
hp =x
E (g/hp-hr) = ppm x x1 MMBtu106 Btu
x453.6 g
Btuhp*hr
x1 parts
106 ppmx
20.9%lb-molx
hp*hr=
MMBtux
lbx
lb-molSCF
20.9% -
100����
� �
�CS
CCSB DirS
ifinal SBSBD ��
DirSAlt CCDSB ��/
� ���
�
��
���OM
MAOAvgGas CC
CCCC
fQhrhpBtuBSFC �� )/( bhpQHHV
hrhpBtuBSFC f��� )/(
bhpQLHV
hrhpBtuBSFC f��� )/(
LHVHHVQ
hrhpBtuBSFC f ��� )/(
x x
6.453)/( / bhpE
hrlbE hrhpg �� �
2%9.20
%9.206.45310
110
1)/( 66O
f CRAGMWFFactorQCRAhrhpgE
����������
Comp&RATA&Eng-AHI v1.3 App. A

EXAMPLE CALCULATIONS (RUNS)
Stack Exhaust Flow (QS) - RM19
%
NO2 Conversion Efficiency Correction
ppm - ppm%
Moisture Correction
ppmvw1 -
Diluent-Corrected Pollutant Concentration, O2 Based
%%
Diluent-Corrected Pollutant Concentration, CO2 Based
%%
Diluent-Corrected Pollutant Concentration, O2 Based with CO2 Measurements
%%
Eq. 20-2 Eq. 20-3SCF/MMBtu %
SCF/MMBtu
Diluent-Corrected Pollutant Concentration Corrected to ISO Conditions
(19x( lb/lb-0.00633)) 1.53
psig + KK
Note: Lack of significant figures may cause rounding errors between actual calculations and example calculations.
0.01933677 psi/mm Hg.2.718 x
288= ppm@% and ISOCISO = x
psix
psig + 14.69232 psi0.01933677 psi/mm Hg.
40CFR60.335(b)(1), Conversion for conc. at ISO Conditions (68°F, 1 atm). Calculate, as follows: (calc for @% with Run 1 data, if applicable)
%XCO2 =20.9% -
=
7.2 CO2 Correction Factor. If pollutant concentrations are to be corrected to percent O2 and CO2 concentration is measured in lieu of O2 concentration measurement, a CO2 correction factor is needed. Calculate the CO2 correction factor as follows: 7.2.1 Calculate the fuel specific Fo, as follows: 7.2.2. Calculate the CO2 correction factor for correcting measurement data to percent oxygen, as follows:
F0 =0.209 x
=
=
RM 20, (11-26-02), 7.3.2 Correction of Pollutant Concentration to Percent O₂ Using CO₂ Concentration. Calculate the O₂ corrected pollutant concentration, as follows: (calc for gas, Run 1, if applicable) [now contained in applicable Subpart]
Eq. 20-5 Cadj = ppm x
Cadj = ppm x =
Calculate the CO₂ corrected pollutant concentration, as follows: (calc for gas, Run 1, if applicable)
20.9% -=
20.9% -Eq. 20-4 Cadj = ppm x
RM 20, (11-26-02), 7.3.1 Correction of Pollutant Concentration Using O₂ Concentration. Calculate the O₂ corrected pollutant concentration, as follows: (calc for gas, Run 1, if applicable) [now contained in applicable Subpart]
1 - = ppmvwppmvd or inversely, CW = ppmvd xEq. 7E-10 CD = =
RM 7E, (02-27-14), 12.10 Moisture Correction. Use Equation 7E-10 if your measurements need to be corrected to a dry basis. (calc for analyzer, Run 1, if applicable) Note: Calculations may not match as Run 1 results are typically also bias adjusted
x 100 = ppmEq. 7E-8 NOxCorr = ppm +
RM 7E, (02-27-14), 12.8 NO2 - NO Conversion Efficiency Correction. If desired, calculate the total NOx concentration with a correction for converter efficiency using Equations 7E-8. (calc for non-bias corrected (raw) NOx gas, Run 1, if applicable)
SCFH106 Btu 20.9% -
xMMBtu
x20.90%
=Note: Equation presented in EPA Emission Measurement Center (EMC), Frequently Asked Questions (FAQ) for Method 19
BtuMMBtu hr SCF
QS =SCF
xSCF
x
Comp&RATA&Eng-AHI v20171120 App. A

EXAMPLE CALCULATIONS (RUNS)
Emissions Rate (lb/hr)
ppm lb
Emissions Rate (ton/year)
lb hr ton
Emissions Rate (lb/MMBtu)
Oxygen Based
SCF/MMBtu x lb20.9% - %
Carbon Dioxide Based
SCF/MMBtu x lb%
Conversion ConstantConvc for
lb lb
Sulfur Dioxide Rate (lb/MMBtu), 40CFR60, App. A, RM 19, Eq. 19-25 (11/20/03)
lb
Emissions Rate (g/hp-hr)Calculation for grams per horsepower-hour. Calculate, as follows: (calc for gas Run 1, if applicable)
lb gmw 1341.022 hp
lb ghp
Note: Lack of significant figures may cause rounding errors between actual calculations and example calculations.
=Btu/lb MMBtuwt%•MMBtu
2x10⁴ Btu
SCF
wt%
year
SO2 = 0.97 x
hr
=
xElb/hr =
Eg/hp-hr =
hr
RM 19, (07-19-06), 12.2 Emission Rates of PM, SO2, and NOx. Select from the following sections the applicable procedure to compute the PM, SO2, or NOx emission rate (E) in ng/J (lb/million Btu). (calc for gas Run 1, if applicable)
12.2.1 Oxygen-Based F Factor, Dry Basis. When measurements are on a dry basis for both O2 (%O2d) and pollutant (Cd) concentrations, use the following equation:
Eq. 19-1
=
lb•mole
Eq. 19-6
lb/ppm*ft3 x 20.9%
lbhr453.6 g
x
hp*hr
= ppm-ft3x
1x
MMBtu
lb•mole
=ppm x
Convc =106
hr
hp*hr=
lb
x1
x453.6 g
x
lb/ppm*ft3 x 100%
=
12.2.4 Carbon Dioxide-Based F Factor, Dry Basis. When measurements are on a dry basis for both CO2 (%CO2d) and pollutant (Cd) concentrations, use the following equation:
Elb/MMBtu =
Eg/hp-hr =
x
mwx
x2000 lb
106 ppm/part
year
Calculation for tons per year emission rate based on 8760 hours per year. Calculate, as follows: (calc for gas Run 1, if applicable)
ppm xElb/MMBtu = MMBtu
Eton/yr =ton
Calculation for pound per hour emission rate. Calculate, as follows: (calc for gas Run 1, if applicable)
lb/lb-mol=
SCF/lb-molSCFH x
GMWQC
E SGashrlb
��� 6/ 10
)2(/
%100
COGas
CdGasMMBtulb C
ConvFactorFCE ����
)2(/ %9.20
%9.20
OGas
CdGasMMBtulb C
ConvFactorFCE�
����
63
10)/( G
MW
ftppmlbConv c ��
2000/
/yearhrlb
yrton
hrEE
��
hpE
ormwE
E hrlbhrlbhrhpg
6.453022.1341
6.453 ///
���
��
GCVwtSKMMBtulbSO %)(97.0)/(2 ���
Comp&RATA&Eng-AHI v1.3

EXAMPLE CALCULATIONS (FTIR SPIKE)
Concentration to dilute by 90% (ppmvw)
Ideal matrix spike yield (ppmvw)
Minimum matrix spike yield (ppmvw) Maximum matrix spike yield (ppmvw)
ppmvw ppmvw
Note: Lack of significant figures may cause rounding errors between actual calculations and example calculations.
Yideal = =
ppmvw
ppmvw xlpmlpm
+
Yideal =
ppmvw x
ppmvw x 1.3 =
1 - ppmvwlpmlpm
AVGd = =ppmvw2
Yideal = ppmvw x 0.7 =
2r
dAVGAVG �
���
�
�����
��
�
���
sys
mr
sys
mdideal Q
QAVGQQAVGY 1
7.0min �� idealYY 3.1max �� idealYY
Comp&RATA&Eng-AHI v1.3

RM 7E, (08-15-06), 12.1 Nomenclature. The terms used in the equations are defined as follows:
ACE = Analyzer calibration error, percent of calibration span.BWS = Moisture content of sample gas as measured by Method 4 or other approved method, percent/100.CAvg = Average unadjusted gas concentration indicated by data recorder for the test run.CD = Pollutant concentration adjusted to dry conditions.CDir = Measured concentration of a calibration gas (low, mid, or high) when introduced in direct calibration mode. CGas = Average effluent gas concentration adjusted for bias.CM = Average of initial and final system calibration bias (or 2-point system calibration error) check responses for the upscale calibration gas.CMA = Actual concentration of the upscale calibration gas, ppmv.CO = Average of the initial and final system calibration bias (or 2-point system calibration error) check responses from the low-level (or zero) calibration gas.CS = Measured concentration of a calibration gas (low, mid, or high) when introduced in system calibration mode.CSS = Concentration of NOx measured in the spiked sample.CSpike = Concentration of NOx in the undiluted spike gas.CCalc = Calculated concentration of NOx in the spike gas diluted in the sample.CV = Manufacturer certified concentration of a calibration gas (low, mid, or high). CW = Pollutant concentration measured under moist sample conditions, wet basis.CS = Calibration span.D = Drift assessment, percent of calibration span.Ep = The predicted response for the low-level and mid-level gases based on a linear response line between the zero and high-level response.EffNO2 = NO2 to NO converter efficiency, percent.H = High calibration gas, designator.L = Low calibration gas, designator.M = Mid calibration gas, designator.NOFinal = The average NO concentration observed with the analyzer in the NO mode during the converter efficiency test in Section 16.2.2.NOxCorr = The NOx concentration corrected for the converter efficiency.NOxFinal = The final NOx concentration observed during the converter efficiency test in Section 16.2.2.NOxPeak = The highest NOx concentration observed during the converter efficiency test in Section 16.2.2.QSpike = Flow rate of spike gas introduced in system calibration mode, L/min.QTotal = Total sample flow rate during the spike test, L/min.R = Spike recovery, percent.SB = System bias, percent of calibration span.SBi = Pre-run system bias, percent of calibration span.SBf = Post-run system bias, percent of calibration span.SB / DAlt = Alternative absolute difference criteria to pass bias and/or drift checks.SCE = System calibration error, percent of calibration span.SCEi = Pre-run system calibration error, percent of calibration span.SCEfinal = Post-run system calibration error, percent of calibration span. Z = Zero calibration gas, designator.
40CFR60.355(b)(1), (09-20-06), Nomenclature. The terms used in the equations are defined as follows:
Pr = reference combustor inlet absolute pressure at 101.3 kilopascals ambient pressure, mm HgPo = observed combustor inlet absolute pressure at test, mm HgHo = observed humidity of ambient air, g H2O/g air
e = transcendental constant, 2.718Ta = ambient temperature, K
Small Engine and FTIR Nomenclature. The terms used in the equations are defined as follows:
bhp = brake horsepowerhp = horsepowerQsys = system flow (lpm)Qm = matrix spike flow (lpm)
Comp&RATA&Eng-AHI v1.3

RM 19, (07-29-06), 12.1 Nomenclature. The terms used in the equations are defined as follows:
AdjFactor = percent oxygen or carbon dioxide adjustment applied to a target polltantBwa = Moisture fraction of ambient air, percent.Btu = British thermal unit%C = Concentration of carbon from an ultimate analysis of fuel, weight percent.%CO2d,%CO2w = Concentration of carbon dioxide on a dry and wet basis, respectively, percent.CIP / CDP = Combustor inlet pressure / compressor discharge pressure (mm Hg); note, some manufactures reference as PCD.E = Pollutant emission rate, ng/J (lb/million Btu).Ea = Average pollutant rate for the specified performance test period, ng/J (lb/million Btu).Eao, Eai = Average pollutant rate of the control device, outlet and inlet, respectively, for the performance test period, ng/J (lb/million Btu).Ebi = Pollutant rate from the steam generating unit, ng/J (lb/million Btu).Ebo = Pollutant emission rate from the steam generating unit, ng/J (lb/million Btu).Eci = Pollutant rate in combined effluent, ng/J (lb/million Btu).Eco = Pollutant emission rate in combined effluent, ng/J (lb/million Btu).Ed = Average pollutant rate for each sampling period (e.g.,24-hr Method 6B sample or 24-hr fuel sample) or for each fuel lot (e.g., amount of fuel bunkered), ng/J (lb/million Btu).Edi = Average inlet SO2 rate for each sampling period d, ng/J (lb/million Btu).Eg = Pollutant rate from gas turbine, ng/J (lb/million Btu).Ega = Daily geometric average pollutant rate, ng/J (lbs/million Btu) or ppm corrected to 7 percent O 2.Ejo,Eji = Matched pair hourly arithmetic average pollutant rate, outlet and inlet, respectively, ng/J (lb/million Btu) or ppm corrected to 7 percent O 2.Eh = Hourly average pollutant, ng/J (lb/million Btu).Ehj = Hourly arithmetic average pollutant rate for hour "j," ng/J (lb/million Btu) or ppm corrected to 7 percent O 2.EXP = Natural logarithmic base (2.718) raised to the value enclosed by brackets.Fc = Ratio of the volume of carbon dioxide produced to the gross calorific value of the fuel from Method 19Fd, Fw, Fc = Volumes of combustion components per unit of heat content, scm/J (scf/million Btu).ft3 = cubic feetG = ideal gas conversion factor
(385.23 SCF/lb-mol at 68 deg F & 14.696 psia)GCM = gross Btu per SCF (constant, compound based)GCV = Gross calorific value of the fuel consistent with the ultimate analysis, kJ/kg (Btu/lb).GCVp, GCVr = Gross calorific value for the product and raw fuel lots, respectively, dry basis, kJ/kg (Btu/lb).%H = Concentration of hydrogen from an ultimate analysis of fuel, weight percent.Hb = Heat input rate to the steam generating unit from fuels fired in the steam generating unit, J/hr (million Btu/hr).Hg = Heat input rate to gas turbine from all fuels fired in the gas turbine, J/hr (million Btu/hr).%H2O = Concentration of water from an ultimate analysis of fuel, weight percent.Hr = Total numbers of hours in the performance test period (e.g., 720 hours for 30-day performance test period).K = volume of combustion component per pound of component (constant)K = Conversion factor, 10�5 (kJ/J)/(%) [106 Btu/million Btu].Kc = (9.57 scm/kg)/% [(1.53 scf/lb)/%].Kcc = (2.0 scm/kg)/% [(0.321 scf/lb)/%].Khd = (22.7 scm/kg)/% [(3.64 scf/lb)/%].Khw = (34.74 scm/kg)/% [(5.57 scf/lb)/%].Kn = (0.86 scm/kg)/% [(0.14 scf/lb)/%].Ko = (2.85 scm/kg)/% [(0.46 scf/lb)/%].Ks = (3.54 scm/kg)/% [(0.57 scf/lb)/%].Ksulfur = 2x10⁴ Btu/wt%-MMBtuKw = (1.30 scm/kg)/% [(0.21 scf/lb)/%].lb = poundln = Natural log of indicated value.Lp,Lr = Weight of the product and raw fuel lots, respectively, metric ton (ton).%N = Concentration of nitrogen from an ultimate analysis of fuel, weight percent.M% = mole percentmol = moleMW = molecular weight (lb/lb-mol)MWAIR = molecular weight of air ( lb/lb-mole)1
NCM = net Btu per SCF (constant based on compound)%O = Concentration of oxygen from an ultimate analysis of fuel, weight percent.%O2d, %O2w = Concentration of oxygen on a dry and wet basis, respectively, percent.PB = barometirc pressure, in HgPs = Potential SO2 emissions, percent.%S = Sulfur content of as-fired fuel lot, dry basis, weight percent.Se = Standard deviation of the hourly average pollutant rates for each performance test period, ng/J (lb/million Btu).%Sf = Concentration of sulfur from an ultimate analysis of fuel, weight percent.S(wt%) = weight percent of sulfur, per lab analysis by appropriate ASTM standard Si = Standard deviation of the hourly average inlet pollutant rates for each performance test period, ng/J (lb/million Btu).So = Standard deviation of the hourly average emission rates for each performance test period, ng/J (lb/million Btu).%Sp, %Sr = Sulfur content of the product and raw fuel lots respectively, dry basis, weight percent.SCF = standard cubic feetSH = specific humidity, pounds of water per pound of airt0.95 = Values shown in Table 19-3 for the indicated number of data points n.Tamb = ambient temperature, oFW/D Factor = = conv. at 14.696 psia and
68 deg F (ref. Civil Eng. Ref. Manual, 7th Ed.)XCO2=CO2 Correction factor, percent. Xk = Fraction of total heat input from each type of fuel k.
1.0236
28.9625
Comp&RATA&Eng-AHI v1.3

The following information supports the spreadsheets for this testing project.
Given Data:
High Heating Values (HHV) are used for the Fuel Heating Value, F-Factor, and Fuel Flow Data per EPA requirements.
Molecular Weight of NOx (lb/lb-mole) = 46.01 Conversion Constant for NOx =Molecular Weight of CO (lb/lb-mole) = 28.00 Conversion Constant for CO =
Molecular Weight of SO2 (lb/lb-mole) = 64.00 Conversion Constant for SO2 =Molecular Weight of THC (propane) (lb/lb-mole) = 44.00 Conversion Constant for THC =
Molecular Weight of VOC (methane) (lb/lb-mole) = 16.00 Conversion Constant for VOC (methane) =Molecular Weight of NH3 (lb/lb-mole) = 17.03 Conversion Constant for NH3 =
Molecular Weight of HCHO (lb/lb-mole) = 30.03 Conversion Constant for HCHO = NOTE: units are lb/ppm*ft3
Formulas:1. Corrected Raw Average (CGas), 40CFR60, App. A, RM 7E, Eq. 7E-5 (08/15/06)
4. Emission Concentration in lb/MMBtu (O 2 based)
2. Correction to % O2, 40CFR60, App. A, RM 20, Eq. 20-5 (11/26/02)
5. Emission Concentration in lb/MMBtu (CO 2 based)
3. Emission Rate in lb/hr
RATA SHEET CALCULATIONSd = Reference Method Data - CEMS DataSd = Standard Deviation n t n t n tCC = Confident Coefficient 2 12.706 7 2.447 12 2.201n = number of runs 3 4.303 8 2.365 13 2.179t0.025 = 2.5 percent confidence coefficent T-values 4 3.182 9 2.306 14 2.160RA = relative accuracy 5 2.776 10 2.262 15 2.145ARA = alternative relative accuracy 6 2.571 11 2.228 16 2.131BAF = Bias adjustment factor
1. Difference
4. Relative Accuracy
2. Standard Deviation
5. Alternative Relative Accuracy
5. Bias Adjustment Factor
3. Confident Coefficient
Calculations, Formulas, and Constants
40CFR60, App. A., RM 19, Table 19-1
Ideal Gas Conversion Factor = 385.23 SCF/lb-mol at 68 deg F & 14.696 psiaFuel Heating Value is based upon Air Hygiene's fuel gas calculation sheet. All calculations are based upon a correction to 68 deg F & 14.696 psia
0.00000007268390.0000001661345
0.0000000779534
ASTM D 3588
0.0000000442074
0.00000011421750.0000000415336
0.0000001194351
� ���
�
��
���OM
MAOAvgGas CC
CCCC
���
�
�
��
��)2(
)arg( %9.20%9.20
OGasetTGasadj C
AdjFactorCC
)2(/ %9.20
%9.20
OGas
CdGasMMBtulb C
ConvFactorFCE
����
�
)2(/
%100
COGas
CdGasMMBtulb C
ConvFactorFCE
����
GMWQC
E SGashrlb
��� 6/ 10
1
2
1
1
2
�
�����
�
�
�����
�
���
�
�
�
�
�� �
�
n
n
dd
S
n
iin
ii
d
��
�n
iidd
1
nS
tCC d�� 025.0
100��
�AVG
AVG
RMCCd
RA
100��
�AS
CCdARA AVG
���
�
���
AVG
AVG
CEMd
BAF 1
Comp&RATA&Eng-AHI v1.3

(mm/dd/yy)
°Fin Hg
indust. spec. scf≥ 2 min/point minutes
in
1 2 3 4 5 6(mm/dd/yy)
% or w/DBdscf/MMBtu
from ACS(Y)
(H@) in H₂O
from ACS(Cp)
from ACS(Dn) in
from ACSin
from listfrom ACSfrom ACS
Created with Isocalc-AHI v20170105
100180
Test Date
Fuel F-Factor
(SS, Glass …. ) Liner MaterialSample Case / Oven Number
Impinger Case Number
Load
Circular
Meter Box NumberMeter Calibration FactorOrifice Meter Coefficient
Testing Company Information
Pitot Tube CoefficientNozzle Number
Nozzle DiameterProbe NumberProbe Length
(918) 307-9131
AddressCity, State Zip
Project ManagerPhone Number
Fax Number
METHOD 5 (FRONT) AND 202 (BACK) SOURCE SAMPLING TITLE PAGE
Date for Preliminary Run
Company Name Air Hygiene International, Inc. (Tulsa, Oklahoma)
Test InformationProject #
Source InformationPlant Name
Sampling LocationFuel Type
Required Sample Vol.Run Duration
1600 W Tacoma StreetBroken Arrow, Oklahoma 74012
(918) 307-8865
Unit Number
Operator
Standard TemperatureStandard Pressure
6829.92
Pitot Identification
Number of Ports UsedPort Inside Diameter
Stack Shape
Base Run NumberNumber of Ports Available
Test Equipment InformationRun
Non-Console Manometer Used
Isocalc-AHI v20170202 Title Page

(Lfw) in(Lnw) in(D) in(As) ft²
(A) in(AD) diameters(B) in(BD) diameters
Down Up Particulate VelocityStream Stream Points Points
2.00-4.99 0.50-1.24 24 165.00-5.99 1.25-1.49 20 166.00-6.99 1.50-1.74 16 127.00-7.99 1.75-1.99 12 12>= 8.00 >=2.00 8 or 122 8 or 122
Ports by AcrossPts Used Required
Fraction Distance DistanceTraverse of from Including
Point Stack Inside ReferenceNumber Diameter Wall Length
in in123456789
101112131415161718192021222324252627282930
Stack Type
Ports Used
METHOD 1 - SAMPLE AND VELOCITY TRAVERSES FOR CIRCULAR SOURCES
Plant Name DateSampling Location
Project #
Circular
Stack Size Small (<24 inch diameter) Port ID (inches)
Circular Stack or Duct DiameterDistance to Far Wall of Stack
Operator Ports Available
Distance DownstreamDiameters Downstream
Number of Traverse Points RequiredDiameters to Minimum Number of1
Flow Disturbance Traverse Points
Distance to Near Wall of StackDiameter of Stack
Area of Stack
Distance from Port to DisturbancesDistance Upstream
Diameters Upstream
Traverse Point Locations
1 Check Minimum Number of Points for the Upstream
and Downstream conditions, then use the largest.2 8 for Circular Stacks 12 to 24 inches 12 for Circular Stacks over 24 inches
Upstream Spec Number of Traverse Points UsedDownstream Spec
Traverse Pts Required
Lnw
Lfw
D
B
A
Method 1 Trav
12 Point PM Trav (M201a ONLY)
Velocity
Isocalc-AHI v20170202 M1 - Circular

(Lfw) in(Lnw) in(L) in(W) in(De) in(As) ft²
(A) in(AD) diameters(B) in(BD) diameters
Down Up Particulate VelocityStream Stream Points Points
2.00-4.99 0.50-1.24 25 165.00-5.99 1.25-1.49 20 166.00-6.99 1.50-1.74 16 127.00-7.99 1.75-1.99 12 12>= 8.00 >=2.00 9 or 122 9 or 122 Ports by Across
Pts Used Required
Fraction Distance DistanceTraverse of from Including
Point Stack Inside ReferenceNumber Dimension Wall Length
in in123456789
101112131415161718192021222324252627282930
METHOD 1 - SAMPLE AND VELOCITY TRAVERSES FOR RECTANGULAR SOURCES
Plant Name DateSampling Location
Stack Size Port ID (inches)
Stack TypeOperator Ports Available
Rectangular Stacks or DuctsLength to Far Wall of Stack
Length to Near Wall of StackLength of StackWidth of Stack
Equivalent Stack Diam
Project # Ports Used
Number of Traverse Points RequiredDiameters to Minimum Number of1
Flow Disturbance Traverse Points
Number of Traverse Points Used
Area of Stack
Distance from Port to DisturbancesDistance Upstream
Diameters UpstreamDistance Downstream
Diameters Downstream
1 Check Minimum Number of Points for the Upstream
and Downstream conditions, then use the largest.2 9 for Rectangular Stacks 12 to 24 inches
12 for All Stacks over 24 inches
Upstream SpecDownstream Spec
Traverse Pts Required
Traverse Point Locations
Lnw
Lfw
W
B
A
Method 1 Trav
12 Point PM Trav (M201a ONLY)
Velocity
Isocalc-AHI v20170202 M1 - Rectangular

PreTest PostTest
(As) ft²(D) in Start End
Traverse Velocity Null Zero Deg Stack LocalPoint Head Angle Pressure Temp Velocity
(p) (Na) (0oa) (ts) (vs(l))
(Pb) in Hg in H₂O deg in H₂O °F ft/sec(Pstatic) in H₂O
(Ps) in Hg
(%CO2) %vd(%O2) %vd
(ppmCO) ppmvd(%N2) %vd(Bws) %(Md) lb/lb-mole(Mw) lb/lb-mole
(vs) ft/sec(Qsd) dscf/hr(Qsd) dscf/min(Qaw) acf/min(Qsw) ascf/hr
METHOD 2 - DETERMINATION OF STACK GAS VELOCITY AND VOLUMETRIC FLOW RATE
Plant Name Date
Project # Pitot Identification
Sampling Location Stack Type CircularOperator Ports Available
Stack Dimensions Velocity Traverse Data
Diameter of StackRun Number V1
Pitot Leak Check Pitot Coefficient
Absolute Stack PressureAlarms Exist - Enter Static Pressure (see below)!!!
Stack Gas CompositionEstimated CompositionComposition Data:
Area of StackRun Time
PressuresBarometric Pressure
Static Pressure
Carbon Dioxide Concentration
= Square roots of p
Avg Stack Dry Std Flow RateAvg Stack Wet Flow Rate
Avg Stack Wet Std Flow Rate
Stack Cross Section Schematic
Average
Stack Dry Molecular WeightStack Wet Molecular Weight
ResultsAvg Stack Gas Velocity
Avg Stack Dry Std Flow Rate
Oxygen ConcentrationCarbon Monoxide Concentration
Nitrogen ConcentrationStack Moisture Content
Standard deviation of null angles =
40 CFR 60, Method 2G, Section 8.11.1 (but applies to all Method 2 type static pressure measurements): If a Type S probe is used for this measurement, position the probe at or between any traverse point(s) and rotate the probe until a null differential pressure reading is obtained. Disconnect the tubing from one of the pressure ports; read and record the ∆P. For pressure devices with one-directional scales, if a deflection in the positive direction is noted with the negative side disconnected, then the static pressure is positive. Likewise, if a deflection in the positive direction is noted with the positive side disconnected, then the static pressure is negative.
Isocalc-AHI v20170202 M2 - Run (1)
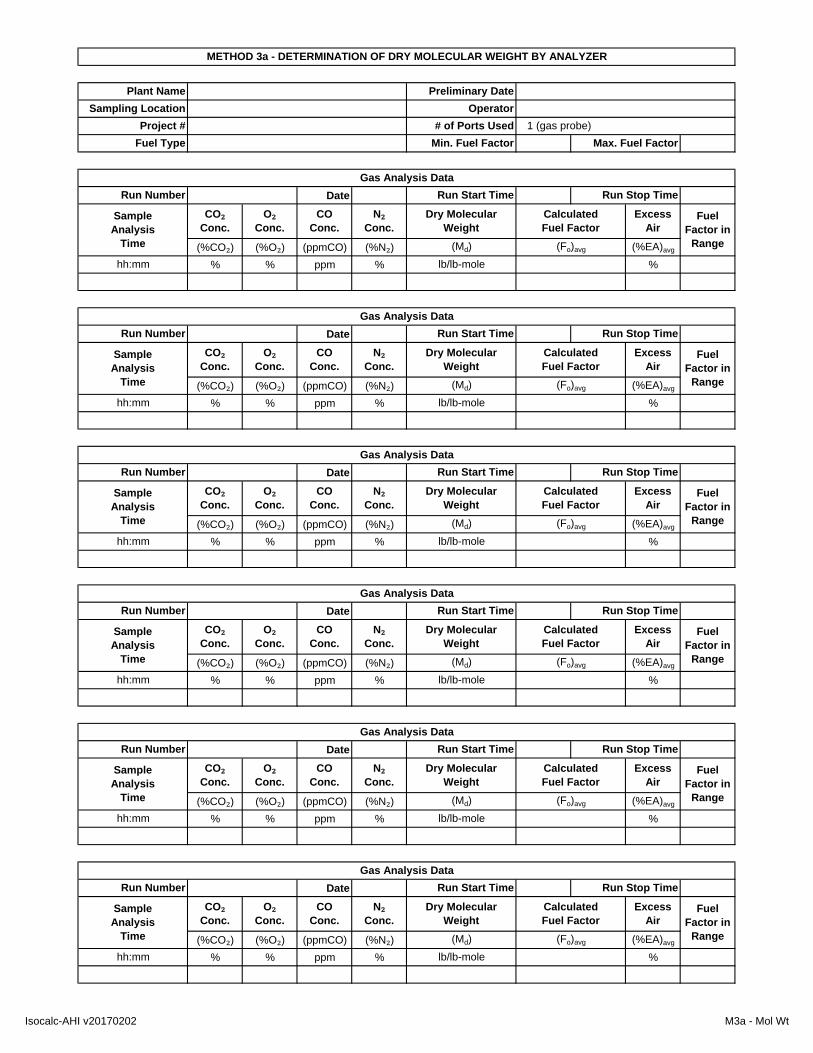
Date
(%CO₂) (%O₂) (ppmCO) (%N₂) (%EA)avg
% % ppm % %
Date
(%CO₂) (%O₂) (ppmCO) (%N₂) (%EA)avg
% % ppm % %
Date
(%CO₂) (%O₂) (ppmCO) (%N₂) (%EA)avg
% % ppm % %
Date
(%CO₂) (%O₂) (ppmCO) (%N₂) (%EA)avg
% % ppm % %
Date
(%CO₂) (%O₂) (ppmCO) (%N₂) (%EA)avg
% % ppm % %
Date
(%CO₂) (%O₂) (ppmCO) (%N₂) (%EA)avg
% % ppm % %
Run Start Time Run Stop TimeGas Analysis Data
Fuel Type Min. Fuel Factor Max. Fuel Factor
METHOD 3a - DETERMINATION OF DRY MOLECULAR WEIGHT BY ANALYZER
Sampling LocationProject #
Operator# of Ports Used 1 (gas probe)
Plant Name Preliminary Date
Run Number
Run Number Run Start Time Run Stop TimeGas Analysis Data
Dry Molecular Weight
(Md)
N₂ Conc.
CO₂ Conc.
O₂ Conc.
COConc.
Excess Air
Fuel Factor in
Range
hh:mm
CalculatedFuel Factor
(Fo)avg
SampleAnalysis
Time
lb/lb-mole
SampleAnalysis
Time
CO₂ Conc.
O₂ Conc.
COConc.
N₂ Conc.
Dry Molecular Weight
CalculatedFuel Factor
Excess Air
Fuel Factor in
Range(Md) (Fo)avg
Gas Analysis DataRun Number Run Start Time
hh:mm lb/lb-mole
Run Stop Time
Dry Molecular Weight
CalculatedFuel Factor
Excess Air
Fuel Factor in
Range(Md) (Fo)avg
SampleAnalysis
Time
CO₂ Conc.
O₂ Conc.
COConc.
N₂ Conc.
Gas Analysis DataRun Number Run Start Time
hh:mm lb/lb-mole
Run Stop Time
Dry Molecular Weight
CalculatedFuel Factor
Excess Air
Fuel Factor in
Range(Md) (Fo)avg
SampleAnalysis
Time
CO₂ Conc.
O₂ Conc.
COConc.
N₂ Conc.
Gas Analysis DataRun Number Run Start Time
hh:mm lb/lb-mole
Run Stop Time
Dry Molecular Weight
CalculatedFuel Factor
Excess Air
Fuel Factor in
Range(Md) (Fo)avg
SampleAnalysis
Time
CO₂ Conc.
O₂ Conc.
COConc.
N₂ Conc.
Gas Analysis DataRun Number Run Start Time
hh:mm lb/lb-mole
Run Stop Time
Excess Air
Fuel Factor in
Range(Md) (Fo)avg
SampleAnalysis
Time
CO₂ Conc.
O₂ Conc.
COConc.
hh:mm lb/lb-mole
N₂ Conc.
Dry Molecular Weight
CalculatedFuel Factor
Isocalc-AHI v20170202 M3a - Mol Wt

Standard Result Difference Pass/Fail(g) (g) (g) (± 0.5 g)500500500500500500
Date Start Time Stop Time(Y)
(Vm) dcf (Pb) in Hg(ts)avg °F (Pstatic) in H₂O(tm)avg °F (H)avg in H₂O
Impinger 1 Impinger 2 Impinger 3 Impinger 4 Impinger 5 Impinger 6 Impinger 7 Impinger 8(g) (g) (g) (g)
Contents Dry Dry DI Water Sil GelFinal Value (Vf),(Wf)
Initial Value (Vi),(Wi)
Net Value (Vn),(Wn)
(Wt) g (Vwsg(std)) scf(Vm(std)) dscf (Bws(svp)) %(Bws(calc)) % (Bws) %
Date Start Time Stop Time(Y)
(Vm) dcf (Pb) in Hg(ts)avg °F (Pstatic) in H₂O(tm)avg °F (H)avg in H₂O
Impinger 1 Impinger 2 Impinger 3 Impinger 4 Impinger 5 Impinger 6 Impinger 7 Impinger 8(g) (g) (g) (g)
Contents Dry Dry DI Water Sil GelFinal Value (Vf),(Wf)
Sampling LocationProject #
OperatorPorts Used
METHOD 4 - DETERMINATION OF MOISTURE CONTENT IN STACK GASES
Plant Name Preliminary Date
Total Meter Volume Barometric PressureAverage Stack Temp Stack Static PressureAverage Meter Temp Avg Orifice Pressure
Moisture Content DataRun Number
Meter Box Number Meter Cal Factor
Meter Box Number Meter Cal FactorTotal Meter Volume Barometric Pressure
Moisture Content DataRun Number
Std Meter Volume Sat. Moisture ContentCalc Moisture Content Final Moisture Content
ResultsTotal Weight Water Vol Weighed
ResultsTotal Weight Water Vol Weighed
Std Meter Volume Sat. Moisture Content
Average Stack Temp Stack Static PressureAverage Meter Temp Avg Orifice Pressure
Meter Box Number Meter Cal FactorTotal Meter Volume Barometric Pressure
Calc Moisture Content Final Moisture Content
Moisture Content DataRun Number
Average Stack Temp Stack Static PressureAverage Meter Temp Avg Orifice Pressure
DateScale Number
Scale Daily Calibration
Preliminary DateTest Day 1Test Day 2Test Day 3Test Day 4Test Day 5
Isocalc-AHI v20170202 M4 - Moisture
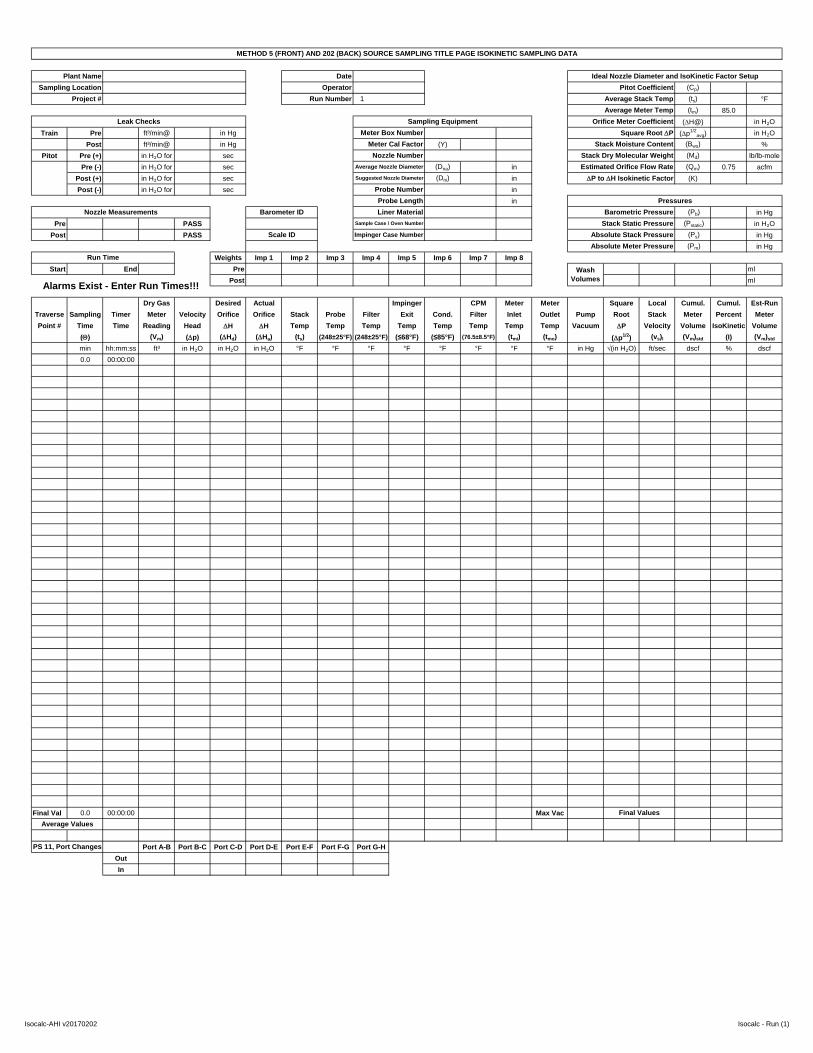
(Cp)(ts) °F(tm) 85.0
(H@) in H₂OTrain Pre ft³/min@ in Hg (p1/2
avg) in H₂OPost ft³/min@ in Hg (Y) (Bws) %
Pitot Pre (+) in H₂O for sec (Md) lb/lb-molePre (-) in H₂O for sec (Dna) in (Qm) 0.75 acfm
Post (+) in H₂O for sec (Dni) in (K)Post (-) in H₂O for sec in
in (Pb) in Hg
Pre PASS (Pstatic) in H₂OPost PASS (Ps) in Hg
(Pm) in HgWeights Imp 1 Imp 2 Imp 3 Imp 4 Imp 5 Imp 6 Imp 7 Imp 8
Start End Pre mlPost ml
Dry Gas Desired Actual Impinger CPM Meter Meter Square Local Cumul. Cumul. Est-RunTraverse Sampling Timer Meter Velocity Orifice Orifice Stack Probe Filter Exit Cond. Filter Inlet Outlet Pump Root Stack Meter Percent MeterPoint # Time Time Reading Head H H Temp Temp Temp Temp Temp Temp Temp Temp Vacuum P Velocity Volume IsoKinetic Volume
() (Vm) (p) (Hd) (Ha) (ts) (248±25°F) (248±25°F) (≤68°F) (≤85°F) (76.5±8.5°F) (tmi) (tmo) (p1/2) (vs)l (Vm)std (I) (Vm)std
min hh:mm:ss ft³ in H₂O in H₂O in H₂O °F °F °F °F °F °F °F °F in Hg √(in H₂O) ft/sec dscf % dscf0.0 00:00:00
Final Val 0.0 00:00:00 Max Vac
Port A-B Port B-C Port C-D Port D-E Port E-F Port F-G Port G-HOutIn
Wash Volumes
Alarms Exist - Enter Run Times!!!
Final ValuesAverage Values
Absolute Meter Pressure
PS 11, Port Changes
Run Time
Nozzle Measurements Barometric PressureStack Static Pressure
Barometer ID
Scale ID Absolute Stack Pressure
Stack Dry Molecular WeightEstimated Orifice Flow Rate
Orifice Meter Coefficient
P to H Isokinetic Factor
Pressures
Project # Run Number Average Stack TempSampling Location Operator Pitot Coefficient
METHOD 5 (FRONT) AND 202 (BACK) SOURCE SAMPLING TITLE PAGE ISOKINETIC SAMPLING DATA
Plant Name Date Ideal Nozzle Diameter and IsoKinetic Factor Setup
1
Leak ChecksSquare Root P
Stack Moisture Content
Average Meter Temp
Nozzle NumberAverage Nozzle Diameter
Suggested Nozzle Diameter
Probe NumberProbe LengthLiner Material
Sample Case / Oven Number
Impinger Case Number
Sampling EquipmentMeter Box Number
Meter Cal Factor
Isocalc-AHI v20170202 Isocalc - Run (1)

1 2 3 4 5 6(hh:mm)(hh:mm)
(mm/dd/yy)
(mm/dd/yy)
(hh:mm)
NO
(Wf) g(Wi) g(Wn) g
(Wf) g(Wi) g(Wn) g
(Wlc) g(Vlc) ml
Total Water CollectedTotal Weight
CPM Filter
Impinger 4 - Silica Gel WeightFinal Weight
Initial WeightNet Weight
Comments
Final WeightInitial Weight
Net Weight
Comments
Moisture Content DataImpingers 1, 2, and 3 - Liquid Weight
Train Prepared By
Relinquished Time
PM Filter
Train Recovered ByRecovery Date
Relinquished ByReceived By
Relinquished Date
Sample BoxAlarms Exist - Collect Sample Blanks and complete Chain of
Custody!!!
Equipment Identification NumbersImpinger Case Sample Blank Taken
SAMPLE RECOVERY AND INTEGRITY DATA SHEET
Plant Name DateSampling Location Operator
Project #
Run History DataRun Number
Run Start TimeRun Stop Time
Total Volume
Isocalc-AHI v20170202 Recovery
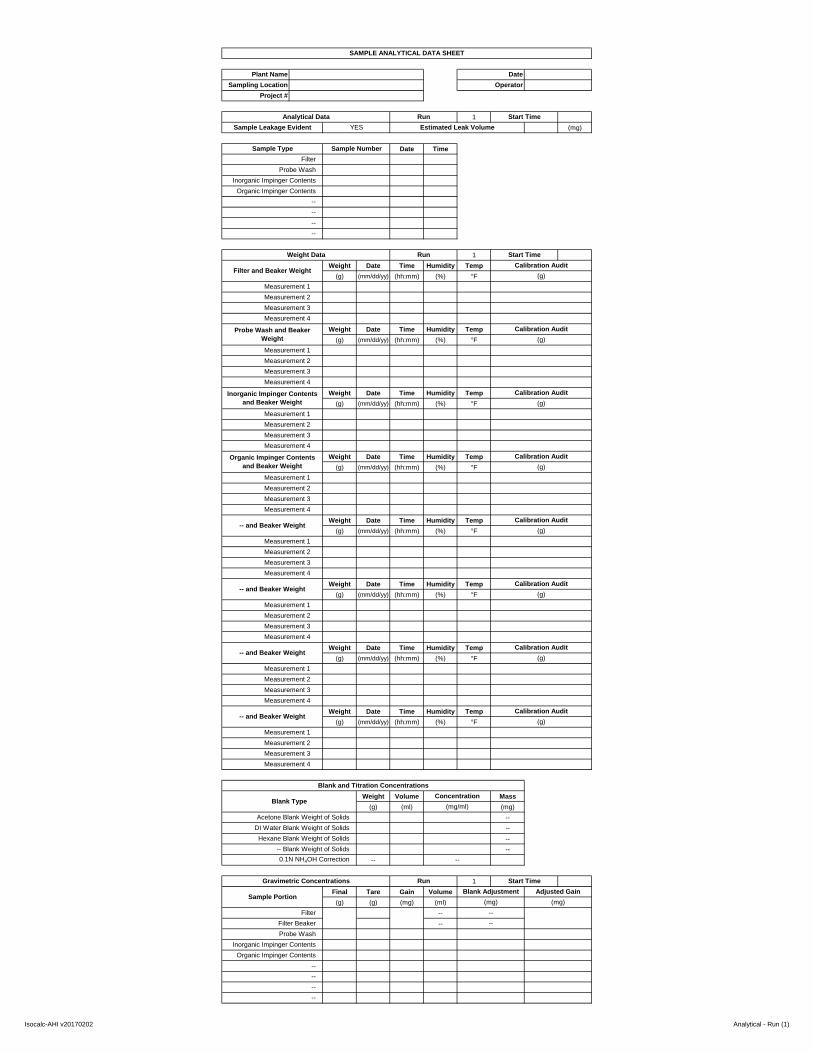
1(mg)
Date Time
1Weight Date Time Humidity Temp
(g) (mm/dd/yy) (hh:mm) (%) °F
Weight Date Time Humidity Temp(g) (mm/dd/yy) (hh:mm) (%) °F
Weight Date Time Humidity Temp(g) (mm/dd/yy) (hh:mm) (%) °F
Weight Date Time Humidity Temp(g) (mm/dd/yy) (hh:mm) (%) °F
Weight Date Time Humidity Temp(g) (mm/dd/yy) (hh:mm) (%) °F
Weight Date Time Humidity Temp(g) (mm/dd/yy) (hh:mm) (%) °F
Weight Date Time Humidity Temp(g) (mm/dd/yy) (hh:mm) (%) °F
Weight Date Time Humidity Temp(g) (mm/dd/yy) (hh:mm) (%) °F
Weight Volume Mass(g) (ml) (mg)
--------
--
1Final Tare Gain Volume(g) (g) (mg) (ml)
----
Adjusted Gain(mg)
Blank Adjustment(mg)
Run Start Time
Calibration Audit(g)
Calibration Audit(g)
Blank and Titration Concentrations
Blank TypeConcentration
(mg/ml)
-- and Beaker Weight
Measurement 1Measurement 2Measurement 3Measurement 4
-- and Beaker Weight
Measurement 1Measurement 2
Calibration Audit(g)
(g)Calibration Audit
Calibration Audit(g)
Calibration Audit(g)
Calibration Audit(g)
Run Start Time
Operator
YESStart TimeRun
Estimated Leak Volume
--
Calibration Audit(g)
--------
Filter BeakerProbe Wash
Inorganic Impinger ContentsOrganic Impinger Contents
----
0.1N NH4OH Correction --
Gravimetric Concentrations
Sample Portion
Filter
Hexane Blank Weight of Solids-- Blank Weight of Solids
Acetone Blank Weight of SolidsDI Water Blank Weight of Solids
Measurement 3Measurement 4
-- and Beaker Weight
Measurement 1Measurement 2Measurement 3Measurement 4
-- and Beaker Weight
Measurement 1Measurement 2Measurement 3Measurement 4
Organic Impinger Contents and Beaker Weight
Measurement 1Measurement 2Measurement 3Measurement 4
Inorganic Impinger Contents and Beaker Weight
Measurement 1Measurement 2Measurement 3Measurement 4
Probe Wash and Beaker Weight
Measurement 1Measurement 2Measurement 3Measurement 4
Filter and Beaker Weight
Measurement 1Measurement 2Measurement 3Measurement 4
--
Weight Data
Organic Impinger Contents----
FilterProbe Wash
Inorganic Impinger Contents
Analytical DataSample Leakage Evident
Sample Type Sample Number
Sampling LocationProject #
Plant Name Date
SAMPLE ANALYTICAL DATA SHEET
Isocalc-AHI v20170202 Analytical - Run (1)

FB0.00 (mg)
Date Time
FBWeight Date Time Humidity Temp
(g) (mm/dd/yy) (hh:mm) (%) °F
Weight Date Time Humidity Temp(g) (mm/dd/yy) (hh:mm) (%) °F
Final Tare Gain(g) (g) (mg) (mg)
Actual Gain
SAMPLE ANALYTICAL DATA SHEET
Plant Name DateSampling Location Operator
Analytical Data Run Start Time
Project #
Inorganic Impinger ContentsOrganic Impinger Contents
Sample Type Sample Number
Sample Leakage Evident NO Estimated Leak Volume
Weight Data Run Start Time
Inorganic Impinger Contents and Beaker Weight
Calibration Audit(g)
Measurement 3Measurement 4
Measurement 1Measurement 2
Measurement 2Measurement 3
Organic Impinger Contents and Beaker Weight
Calibration Audit(g)
Measurement 1
Inorganic Impinger Contents
Sample Portion
Gravimetric Concentrations
Measurement 4
Organic Impinger Contents
Isocalc-AHI v20170202 Analytical - FB

Average Units Limitshh:mmhh:mm
mm/dd/yy
inAverage Units Limits
ft³ft³ft³
min°F°F
in Hgin H₂Oin Hg
in H₂Oin Hg
√(in H₂O)Average Units Limits
ggmlscfdscf
dscm%%%
Average Units Limits%%
ppm%
lb/lb-molelb/lb-mole
dscf/MMBtu
%Average Units Limits
METHOD 5 (FRONT) AND 202 (BACK) - RESULTS
Initial Meter VolumeFinal Meter VolumeTotal Meter Volume
Stack Test Data
Run Start TimeRun Stop Time
Test DateMeter Calibration Factor
Pitot Tube Coefficient
Project #
Historical Data
Plant NameSampling Location
Average Nozzle Diameter
Absolute Stack PressureAverage Orifice Pressure Drop
Absolute Meter PressureAvg Square Root Pitot Pressure
Moisture Content Data
Total Sampling TimeAverage Meter TemperatureAverage Stack Temperature
Barometric PressureStack Static Pressure
Calculated Stack MoistureSaturated Stack Moisture
Reported Stack Moisture Content
Carbon Dioxide ContentGas Analysis Data
Impinger Water Weight GainSilica Gel Weight Gain
Total Water Volume CollectedStandard Water Vapor Volume
Standard Meter VolumeStandard Metric Meter Volume
Calculated Fuel FactorFuel F-Factor
Percent Excess AirVolumetric Flow Rate Data
Oxygen ContentCarbon Monoxide Content
Nitrogen ContentStack Dry Molecular WeightStack Wet Molecular Weight
Isocalc-AHI v20170202 Results

METHOD 5 (FRONT) AND 202 (BACK) - RESULTS
Project #
Plant NameSampling Location
ft/secft²
acfmwkscfhdscfh
%Average Units Limits
mlmg
Average Units Limitsmg --
g/dscf --gr/dscf --kg/hr --lb/hr --tpy --
lb/MMBtu --
Average Stack Gas Velocity
Emission Rate Data
Stack Cross-Sectional AreaActual Stack Flow Rate
Wet Standard Stack Flow RateDry Standard Stack Flow Rate
Percent of Isokinetic Rate
Total PM/PM₁₀ Mass
Total PM/PM₁₀ Concentration
Total PM/PM₁₀ Emission Rate
NH₄OH CorrectionNH₄OH Correction
Gravimetric Analysis
Isocalc-AHI v20170202 Results

EXAMPLE CALCULATIONS (Reference Method 1 - Circular Stack)
Diameter of Stack (in.) Area of Stack (ft2)
nwfw LLinD −=.)(2
2
122)( ⎟
⎠⎞
⎜⎝⎛
××=
DftAs π
in. 2
in.Stack Diameters Downstream
Stack Diameters Upstreamin.
ft22 x 12in./ft
As (ft2) =
BD (dia.) = = diameters
D (in.) = in. - in. =
3.14 x ( )2 =
nwfw LLinD −=.)(2
2
122)( ⎟
⎠⎞
⎜⎝⎛
××=
DftAs π
DBdiaBD =.)(
DAdiaAD =.)(
in.in.in.
EXAMPLE CALCULATIONS (Reference Method 1 - Rectangular Stack)
L th f St k (i ) E i l t Di t f St k (i )
AD (dia.) = = diameters
BD (dia.) diameters
nwfw LLinD −=.)(2
2
122)( ⎟
⎠⎞
⎜⎝⎛
××=
DftAs π
DBdiaBD =.)(
DAdiaAD =.)(
Length of Stack (in.) Equivalent Diameter of Stack (in.)
in. 2 x in.in.
Area of Stack (ft2)Stack Diameters Downstream
in.in. +
De (in.) = in. x
=L (in.) = in. - in. =
nwfw LLinD −=.)(2
2
122)( ⎟
⎠⎞
⎜⎝⎛
××=
DftAs π
DBdiaBD =.)(
DAdiaAD =.)(
WLWLinDe +
××=
2.)(nwfw LLinL −=.)(
lwftA ×=)( 2 Stack Diameters Downstream
in.in.
Stack Diameters Upstream
12 12ft2
BD (dia.) = = diametersAs (ft
2) = ft x ft =
nwfw LLinD −=.)(2
2
122)( ⎟
⎠⎞
⎜⎝⎛
××=
DftAs π
DBdiaBD =.)(
DAdiaAD =.)(
WLWLinDe +
××=
2.)(nwfw LLinL −=.)(
eD D
BdiaB =.)(lwftAs ×=)( 2
Stack Diameters Upstream
in.in.
Note: Lack of significant figures may cause rounding errors between actual calculations and example calculations.
AD (dia.) = = diameters
nwfw LLinD −=.)(2
2
122)( ⎟
⎠⎞
⎜⎝⎛
××=
DftAs π
DBdiaBD =.)(
DAdiaAD =.)(
WLWLinDe +
××=
2.)(nwfw LLinL −=.)(
eD D
BdiaB =.)(
eD D
AdiaA =.)(
lwftAs ×=)( 2
Note: Lack of significant figures may cause rounding errors between actual calculations and example calculations.
nwfw LLinD −=.)(2
2
122)( ⎟
⎠⎞
⎜⎝⎛
××=
DftAs π
DBdiaBD =.)(
DAdiaAD =.)(
WLWLinDe +
××=
2.)(nwfw LLinL −=.)(
eD D
BdiaB =.)(
eD D
AdiaA =.)(
lwftAs ×=)( 2
Isocalc-AHI v5.1 Calculations

Carbon Monoxide Concentration (%)
EXAMPLE CALCULATIONS (Reference Method 3a) [Values from Run 1 test]
000,10% ppmCOCO =
Isocalc-AHI v5.1 Calculations
Nitrogen Concentration (%)
/ 10,000 % = %
%CO (%) =ppm
=
%N2 (%) = 100 - % - % -
%10,000 ppm/%
COOCON %%%100% 222 −−−=
000,10% ppmCOCO =
Stack Dry Molecular Weight (lb/lb-mole)
lb
100
100 lb l
Md (lb/lb-mol) = (44 lb/lb-mol
x
x
% ) +
32 lb/lb-mol%) + (
28 lb/lb-mol100
x [ +10 000
( ] ) =
COOCON %%%100% 222 −−−=
∑ ⎟⎟⎠
⎞⎜⎜⎝
⎛×=− component
MWmollblbM comp
d %100
)/(
000,10% ppmCOCO =
Stack Wet Molecular Weight (lb/lb-mole)
lb % % lb
100 lb-mol%) (
100[
18 lb
10,000( ] )
COOCON %%%100% 222 −−−=
∑ ⎟⎟⎠
⎞⎜⎜⎝
⎛×=− component
MWmollblbM comp
d %100
)/(
⎥⎦
⎤⎢⎣
⎡ ×+⎥⎦
⎤⎢⎣
⎡⎟⎠
⎞⎜⎝
⎛ −×=−100100
1)/(2
WSOH
WSdS
BMW
BMmollblbM
000,10% ppmCOCO =
lb % % lb
Average Calculated Fuel Factor (Fo)
MS (lb/lb-mol) = { x (1 - lb-mol 100
18 lbx } =
lb-mol 100 lb-mol) } + {
COOCON %%%100% 222 −−−=
∑ ⎟⎟⎠
⎞⎜⎜⎝
⎛×=− component
MWmollblbM comp
d %100
)/(
⎥⎦
⎤⎢⎣
⎡ ×+⎥⎦
⎤⎢⎣
⎡⎟⎠
⎞⎜⎝
⎛ −×=−100100
1)/(2
WSOH
WSdS
BMW
BMmollblbM
000,10% ppmCOCO =
( ) ( )( )[ ]( ) ( )avgavg
avgavgavgo COCO
COOF
%%%5.0%9.20
2
2)( +
×−−=
%)% + %
Average Excess Air (%)
=Fo(avg) = 20.9% - % - (0.5 x
COOCON %%%100% 222 −−−=
∑ ⎟⎟⎠
⎞⎜⎜⎝
⎛×=− component
MWmollblbM comp
d %100
)/(
⎥⎦
⎤⎢⎣
⎡ ×+⎥⎦
⎤⎢⎣
⎡⎟⎠
⎞⎜⎝
⎛ −×=−100100
1)/(2
WSOH
WSdS
BMW
BMmollblbM
000,10% ppmCOCO =
( ) ( )( )[ ]( ) ( )avgavg
avgavgavgo COCO
COOF
%%%5.0%9.20
2
2)( +
×−−=
( ) ( )( )[ ]( )( ) ( ) ( )( )[ ]avgavgavg
avgavgavg COON
COOEA
%5.0%264.0%5.0%100
(%)%22
2
×−−×
×−×=
% ) }
Note: Lack of significant figures may cause rounding errors between actual calculations and example calculations.
% - (0.5 x%(%EA)AVG =
% - (0.5 x( 0.264 x %) - {
=100 x {
%)}
COOCON %%%100% 222 −−−=
∑ ⎟⎟⎠
⎞⎜⎜⎝
⎛×=− component
MWmollblbM comp
d %100
)/(
⎥⎦
⎤⎢⎣
⎡ ×+⎥⎦
⎤⎢⎣
⎡⎟⎠
⎞⎜⎝
⎛ −×=−100100
1)/(2
WSOH
WSdS
BMW
BMmollblbM
000,10% ppmCOCO =
( ) ( )( )[ ]( ) ( )avgavg
avgavgavgo COCO
COOF
%%%5.0%9.20
2
2)( +
×−−=
( ) ( )( )[ ]( )( ) ( ) ( )( )[ ]avgavgavg
avgavgavg COON
COOEA
%5.0%264.0%5.0%100
(%)%22
2
×−−×
×−×=
Isocalc-AHI v5.1 Calculations

Absolute Stack Pressure (in. Hg)
EXAMPLE CALCULATIONS (Reference Method 2) [Values from Run 1 test]
6.13).( static
bSP
PHginP +=
Isocalc-AHI v5.1 Calculations
Average Stack Gas Velocity (ft/sec)
in. H2O= in. Hg
13.6 in. H2O/in. HgPs (in. Hg) = in. Hg +
6.13).( static
bSP
PHginP +=
( ) ( )ss
uavgsavgpps MP
TtpCKftv
×
+×Δ××=sec)/(
vsl (ft/sec) =
ft
Average Stack Dry Standard Flow Rate (dscfh)
(sec
+ 460 oR=
sec (oR)(in. H2O) in. Hg x lb/lb-molx x)1/2 x in.H2O
1/285.49 ft (lb/lb-mol)(in. Hg)0.84
6.13).( static
bSP
PHginP +=
sstdssws
d
PTAvB
dscfhQ××××⎟
⎠⎞
⎜⎝⎛ −××
= 10016060
)(
( ) ( )ss
uavgsavgpps MP
TtpCKftv
×
+×Δ××=sec)/(
% ft
+ 460 oR 29.92 in. Hg hr68.00 + 460 oR
xin. Hg
x x
dscf
ft2sec
Qsd (dscf/hr) =3600 sec
x (1 - ) xhr 100
=
6.13).( static
bSP
PHginP +=
stdus
sstdssws
sd PTt
PTAvB
dscfhQ×+
××××⎟⎠⎞
⎜⎝⎛ −××
=)(
10016060
)(
( ) ( )ss
uavgsavgpps MP
TtpCKftv
×
+×Δ××=sec)/(
Average Stack Wet Flow Rate (acfm)
ft
Average Stack Wet Standard Flow Rate (ascfh)
ft2acf
min60 sec
x xmin sec
Qaw (acf/min) = =
6.13).( static
bSP
PHginP +=
stdus
sstdssws
sd PTt
PTAvB
dscfhQ×+
××××⎟⎠⎞
⎜⎝⎛ −××
=)(
10016060
)(
ssaw AvacfmQ ××= 60)(
( ) ( )ss
uavgsavgpps MP
TtpCKftv
×
+×Δ××=sec)/(
Average Stack Wet Standard Flow Rate (ascfh)
ascf
acfx
hr min68 00 + 460 oR in Hg
Qsw (ascf/hr) =60 min
x
6.13).( static
bSP
PHginP +=
stdus
sstdssws
sd PTt
PTAvB
dscfhQ×+
××××⎟⎠⎞
⎜⎝⎛ −××
=)(
10016060
)(
ssaw AvacfmQ ××= 60)(
stdus
sstdawsw PTt
PTQascfhQ×+
×××=
)(60)(
( ) ( )ss
uavgsavgpps MP
TtpCKftv
×
+×Δ××=sec)/(
Note: Lack of significant figures may cause rounding errors between actual calculations and example calculations.
ascfhr
=+ 460 oR 29.92 in. Hg
68.00 + 460 Rx
in. Hg
6.13).( static
bSP
PHginP +=
stdus
sstdssws
sd PTt
PTAvB
dscfhQ×+
××××⎟⎠⎞
⎜⎝⎛ −××
=)(
10016060
)(
ssaw AvacfmQ ××= 60)(
stdus
sstdawsw PTt
PTQascfhQ×+
×××=
)(60)(
( ) ( )ss
uavgsavgpps MP
TtpCKftv
×
+×Δ××=sec)/(
Isocalc-AHI v5.1 Calculations

Water Volume Weighed (scf)
EXAMPLE CALCULATIONS (Reference Method 4) [Values from Run 1 test]
5)( )( KWscfV tstdwsg ×=
Isocalc-AHI v5.1 Calculations
0.04715 ft3/g = scf
Standard Meter Volume (dscf)
Vwsg(std) = g x
( ) uavgm
avgbm
stdm Tt
HPVYK
dscfV+
⎟⎟⎠
⎞⎜⎜⎝
⎛ Δ+×××
=6.13
)(1
)(
5)( )( KWscfV tstdwsg ×=
oR
oF + oR
Calculated Moisture Content (%)
in. Hg +dscfin. Hg 13.6 in. H2O / in. Hg
460
in. H2OVm(std) =
17.65x x )dcf x (
=
( ) uavgm
avgbm
stdm Tt
HPVYK
dscfV+
⎟⎟⎠
⎞⎜⎜⎝
⎛ Δ+×××
=6.13
)(1
)(
)(100(%) stdwsgVB ×
5)( )( KWscfV tstdwsg ×=
Saturated Moisture Content (%)
%dscf + dscf
Bws(calc) = 100 xdscf
=
( ) uavgm
avgbm
stdm Tt
HPVYK
dscfV+
⎟⎟⎠
⎞⎜⎜⎝
⎛ Δ+×××
=6.13
)(1
)(
)()(
)()( 100(%)
stdmstdwsg
stdwsgcalcws VV
VB
+×=
5)( )( KWscfV tstdwsg ×=
Saturated Moisture Content (%)
10 oF + 390 863144 )(6.691 -
( ) uavgm
avgbm
stdm Tt
HPVYK
dscfV+
⎟⎟⎠
⎞⎜⎜⎝
⎛ Δ+×××
=6.13
)(1
)(
)()(
)()( 100(%)
stdmstdwsg
stdwsgcalcws VV
VB
+×=
100
6.13
10100(%)86.390
3144691.6
)(
)(
≤+
×=+
−
staticb
t
svpws PPB
avgs
5)( )( KWscfV tstdwsg ×=
10
Note: Lack of significant figures may cause rounding errors between actual calculations and example calculations.
%F + 390.86
in. Hg +in. H2O
13.6 in. H2O / in. Hg
Bws(svp) = 100 x ≤ 100 =
( ) uavgm
avgbm
stdm Tt
HPVYK
dscfV+
⎟⎟⎠
⎞⎜⎜⎝
⎛ Δ+×××
=6.13
)(1
)(
)()(
)()( 100(%)
stdmstdwsg
stdwsgcalcws VV
VB
+×=
100
6.13
10100(%)86.390
3144691.6
)(
)(
≤+
×=+
−
staticb
t
svpws PPB
avgs
5)( )( KWscfV tstdwsg ×=
Isocalc-AHI v5.1 Calculations

Desired Orifice (in. H2O) (first point) Absolute Meter Pressure (in. Hg)
x
EXAMPLE CALCULATIONS (Isokinetic Sampling) [Values from Run 1 test]
Pm (in. Hg) = in Hg +in. H2O
= in HgΔHd (in. H2O) =
6.13@).( HPHginP bm
Δ+=
pKOHinH d Δ×=Δ ).( 2
Isocalc-AHI v5.1 Calculations
Recommended Nozzle Diameter (in.)
in. H2OPm (in. Hg) = in. Hg + = in. Hg
13.6 in. H2O/in. Hgin. H2O =
6.13@).( HPHginP bm
Δ+=
pKOHinH d Δ×=Δ ).( 2
( ) ( )⎥⎥⎥⎥
⎦
⎤
⎢⎢⎢⎢
⎣
⎡
Δ×
⎟⎠⎞
⎜⎝⎛ ×+⎟
⎠⎞
⎜⎝⎛ −×
×+×⎟⎟⎟⎟
⎠
⎞
⎜⎜⎜⎜
⎝
⎛
−
−×
×+××
=avgs
wswsd
usws
wm
pum
mmnni pP
BBM
TtB
B
CTtPQC
inD 10018
1001
1001
1001
.)(
%
%) x
acf•in. Hg3/4•lb1/2 100oF + 460oR x 0.84
1 -100
in. HgDni (in.) =
0.03575 (lb-mole•oR•in. H2O)1/2•min•in.2x 0.75 acf x
x (1 -
0.00
6.13@).( HPHginP bm
Δ+=
pKOHinH d Δ×=Δ ).( 2
( ) ( )⎥⎥⎥⎥
⎦
⎤
⎢⎢⎢⎢
⎣
⎡
Δ×
⎟⎠⎞
⎜⎝⎛ ×+⎟
⎠⎞
⎜⎝⎛ −×
×+×⎟⎟⎟⎟
⎠
⎞
⎜⎜⎜⎜
⎝
⎛
−
−×
×+××
=avgs
wswsd
usws
wm
pum
mmnni pP
BBM
TtB
B
CTtPQC
inD 10018
1001
1001
1001
.)(
lb % %
ΔP t ΔH I ki ti F t
1001 -
in.lb-mole 100 lb-mol
in. Hg x in. H2O
)+(18 lb
xx (=
)( oF + 460oR ) x
6.13@).( HPHginP bm
Δ+=
pKOHinH d Δ×=Δ ).( 2
wswmwmd
BBBM⎞⎛⎟
⎞⎜⎛ −⎥
⎤⎢⎡
⎟⎠⎞
⎜⎝⎛ ×+⎟
⎠⎞
⎜⎝⎛ −×
2
1181
( ) ( )⎥⎥⎥⎥
⎦
⎤
⎢⎢⎢⎢
⎣
⎡
Δ×
⎟⎠⎞
⎜⎝⎛ ×+⎟
⎠⎞
⎜⎝⎛ −×
×+×⎟⎟⎟⎟
⎠
⎞
⎜⎜⎜⎜
⎝
⎛
−
−×
×+××
=avgs
wswsd
usws
wm
pum
mmnni pP
BBM
TtB
B
CTtPQC
inD 10018
1001
1001
1001
.)(
ΔP to ΔH Isokinetic Factor
%oF + 460oR
% oF + 460oR0 00
1 -
)2 x ) x100
K =849.8
x 0.84 2 x in. H2O xin H O•in 4
4 x (
6.13@).( HPHginP bm
Δ+=
pKOHinH d Δ×=Δ ).( 2
m
s
u
um
wm
ws
wswsd
wmwmd
napk PP
TtsTt
B
B
BBM
BBMDHCCK ×⎟⎟
⎠
⎞⎜⎜⎝
⎛++
×⎟⎟⎟⎟
⎠
⎞
⎜⎜⎜⎜
⎝
⎛
−
−×
⎥⎥⎥⎥
⎦
⎤
⎢⎢⎢⎢
⎣
⎡
⎟⎠⎞
⎜⎝⎛ ×+⎟
⎠⎞
⎜⎝⎛ −×
⎟⎠⎞
⎜⎝⎛ ×+⎟
⎠⎞
⎜⎝⎛ −×
××Δ××=
2
42
1001
1001
10018
1001
10018
1001
@
( ) ( )⎥⎥⎥⎥
⎦
⎤
⎢⎢⎢⎢
⎣
⎡
Δ×
⎟⎠⎞
⎜⎝⎛ ×+⎟
⎠⎞
⎜⎝⎛ −×
×+×⎟⎟⎟⎟
⎠
⎞
⎜⎜⎜⎜
⎝
⎛
−
−×
×+××
=avgs
wswsd
usws
wm
pum
mmnni pP
BBM
TtB
B
CTtPQC
inD 10018
1001
1001
1001
.)(
%
lb % %in. Hg
lb % % in. Hg
18 lbx ( 1 -
0.00)+(
oF + 460oR100
=x ( 1 - )+(
18 lbx
lb/mole 100 lb-mol 100
1 -0.00
x0.00
xlb/mole 100 lb-mol 100
)in. H2O•in.4
(
()
)
6.13@).( HPHginP bm
Δ+=
pKOHinH d Δ×=Δ ).( 2
m
s
u
um
wm
ws
wswsd
wmwmd
napk PP
TtsTt
B
B
BBM
BBMDHCCK ×⎟⎟
⎠
⎞⎜⎜⎝
⎛++
×⎟⎟⎟⎟
⎠
⎞
⎜⎜⎜⎜
⎝
⎛
−
−×
⎥⎥⎥⎥
⎦
⎤
⎢⎢⎢⎢
⎣
⎡
⎟⎠⎞
⎜⎝⎛ ×+⎟
⎠⎞
⎜⎝⎛ −×
⎟⎠⎞
⎜⎝⎛ ×+⎟
⎠⎞
⎜⎝⎛ −×
××Δ××=
2
42
1001
1001
10018
1001
10018
1001
@
( ) ( )⎥⎥⎥⎥
⎦
⎤
⎢⎢⎢⎢
⎣
⎡
Δ×
⎟⎠⎞
⎜⎝⎛ ×+⎟
⎠⎞
⎜⎝⎛ −×
×+×⎟⎟⎟⎟
⎠
⎞
⎜⎜⎜⎜
⎝
⎛
−
−×
×+××
=avgs
wswsd
usws
wm
pum
mmnni pP
BBM
TtB
B
CTtPQC
inD 10018
1001
1001
1001
.)(
Cumulative Percent Isokinetic (%) (first point)
dscfsec•oR
I (%) =0.0945 min•in. Hg
x ( oF + 460 oR) x
6.13@).( HPHginP bm
Δ+=
pKOHinH d Δ×=Δ ).( 2
m
s
u
um
wm
ws
wswsd
wmwmd
napk PP
TtsTt
B
B
BBM
BBMDHCCK ×⎟⎟
⎠
⎞⎜⎜⎝
⎛++
×⎟⎟⎟⎟
⎠
⎞
⎜⎜⎜⎜
⎝
⎛
−
−×
⎥⎥⎥⎥
⎦
⎤
⎢⎢⎢⎢
⎣
⎡
⎟⎠⎞
⎜⎝⎛ ×+⎟
⎠⎞
⎜⎝⎛ −×
⎟⎠⎞
⎜⎝⎛ ×+⎟
⎠⎞
⎜⎝⎛ −×
××Δ××=
2
42
1001
1001
10018
1001
10018
1001
@
( ) ( )⎥⎥⎥⎥
⎦
⎤
⎢⎢⎢⎢
⎣
⎡
Δ×
⎟⎠⎞
⎜⎝⎛ ×+⎟
⎠⎞
⎜⎝⎛ −×
×+×⎟⎟⎟⎟
⎠
⎞
⎜⎜⎜⎜
⎝
⎛
−
−×
×+××
=avgs
wswsd
usws
wm
pum
mmnni pP
BBM
TtB
B
CTtPQC
inD 10018
1001
1001
1001
.)(
( )( )( ) ⎟
⎠⎞
⎜⎝⎛ −×⎟
⎟⎠
⎞⎜⎜⎝
⎛⎟⎠⎞
⎜⎝⎛ ×××××Θ
×+×=
1001
121
2
(%)2
)(
)(4
wsnasavgls
stdmuavgs
BDPv
VTtKI
π
ft in. %
Note: Lack of significant figures may cause rounding errors between actual calculations and example calculations.
%min x x in. Hg x 3.14 x ( x
ft.1 -
sec 2 12 in.
sec• R
)=
100)2 x (
6.13@).( HPHginP bm
Δ+=
pKOHinH d Δ×=Δ ).( 2
m
s
u
um
wm
ws
wswsd
wmwmd
napk PP
TtsTt
B
B
BBM
BBMDHCCK ×⎟⎟
⎠
⎞⎜⎜⎝
⎛++
×⎟⎟⎟⎟
⎠
⎞
⎜⎜⎜⎜
⎝
⎛
−
−×
⎥⎥⎥⎥
⎦
⎤
⎢⎢⎢⎢
⎣
⎡
⎟⎠⎞
⎜⎝⎛ ×+⎟
⎠⎞
⎜⎝⎛ −×
⎟⎠⎞
⎜⎝⎛ ×+⎟
⎠⎞
⎜⎝⎛ −×
××Δ××=
2
42
1001
1001
10018
1001
10018
1001
@
( ) ( )⎥⎥⎥⎥
⎦
⎤
⎢⎢⎢⎢
⎣
⎡
Δ×
⎟⎠⎞
⎜⎝⎛ ×+⎟
⎠⎞
⎜⎝⎛ −×
×+×⎟⎟⎟⎟
⎠
⎞
⎜⎜⎜⎜
⎝
⎛
−
−×
×+××
=avgs
wswsd
usws
wm
pum
mmnni pP
BBM
TtB
B
CTtPQC
inD 10018
1001
1001
1001
.)(
( )( )( ) ⎟
⎠⎞
⎜⎝⎛ −×⎟
⎟⎠
⎞⎜⎜⎝
⎛⎟⎠⎞
⎜⎝⎛ ×××××Θ
×+×=
1001
121
2
(%)2
)(
)(4
wsnasavgls
stdmuavgs
BDPv
VTtKI
π
Isocalc-AHI v5.1 Calculations

g mg
Blank Concentration [Acetone Blank Weight of Solids] (mg/ml)
Cx (mg/ml) = x1000 mg
=
EXAMPLE CALCULATIONS (Gravimetric Analysis) [Values from Run 1 test]
x
xx v
wmlmgC ×=
1000)/(
Isocalc-AHI v5.1 Calculations
ml
ml x mg/ml = mg
Cx (mg/ml) = xg
=ml
Blank Adjustment [Acetone Blank Weight of Solids and Nozzle Wash PM>10] (mg)
Wx (mg) = < Sample Gain
x
xx v
wmlmgC ×=
1000)/(
xxx CvmgW ×=)(
-g
g g ) = mg
Sample Gain [Nozzle Wash PM>10] (mg)
mx (mg) =1000 mg
x (
x
xx v
wmlmgC ×=
1000)/(
xxx CvmgW ×=)(
( ) 1000)( ×−= txfxx mmmgm
mg - mg = mg
0 1N NH OH Correction (mg)
Adjusted Sample Gain [Nozzle Wash PM>10] (mg)
mxadj (mg) =
x
xx v
wmlmgC ×=
1000)/(
xxx CvmgW ×=)(
( ) 1000)( ×−= txfxx mmmgm
xxxadj Wmmgm −=)(
NVmgm ××0317)(0.1N NH4OH Correction (mg)
ml x 0.1 N = mg
Note: Lack of significant figures may cause rounding errors between actual calculations and example calculations.
mc (mg) = 17.03 x
x
xx v
wmlmgC ×=
1000)/(
xxx CvmgW ×=)(
( ) 1000)( ×−= txfxx mmmgm
xxxadj Wmmgm −=)(
NVmgm tc ××= 03.17)(
Isocalc-AHI v5.1 Calculations

• %CO = carbon monoxide concentration (%)• %CO2 = carbon dioxide concentration (%)• %N2 = nitrogen concentration (%)• %O2 = oxygen concentration (%)
Nomenclature
•
• (%EA)avg = average excess air (%)• (Fo)avg = average calculated fuel factor
%O2,wet = Oxygen content of gas stream, % by volume of wet gas. (Note: The oxygen percentage used in Method 201A, Equation 3 is on a wet gas basis. That means that since oxygen is typically measured on a dry gas basis, the measured percent O2 must be multiplied by the quantity (1 - Bws) to convert to the actual volume fraction. Therefore, %O2,wet = (1 - Bws) * %O2, dry)
•
• µ = Gas viscosity, micropoise•
• 17.03 = mg/milliequivalents for ammonium ion
[(Δp)0.5]avg = Average of square roots of the velocity pressures measured during the preliminary traverse, inches W.C.
12.0 = Constant calculated as 60 percent of 20.5 square inch cross-sectional area of combined cyclone head, square inches
•
•
• A = distance upstream (in.)
22.4 = liters of ideal gas per mol of substance at 0oC and 1 atm (ref. Civil Engineering Reference Manual, 7th ed. - Michael R. Lindeburg)
5.02 x 104 = constant derived from the molecular weight and correcting standard temperature and pressure (ref. Bay Area Air Quality Management District, Source Test Procedure ST-1B, Ammonia Integrated Sampling, Adopted January 20, 1982, Regulation 7-303)
• AD = stack diameters upstream (dia.)• An = Area of nozzle, square feet• As = area of stack (ft2)• B = distance downstream (in.)• BD = stack diameters downstream (dia.)• bf = Average blockage factor calculated in Equation 26, dimensionless• Bwm = meter moisture content (%)• Bws = stack moisture content (%)•
• C1 = -150.3162 (micropoise)• C2 = 18.0614 (micropoise/K0.5) = 13.4622 (micropoise/R0.5)
C = Cunningham correction factor for particle diameter, Dp, and calculated using the actual stack gas temperature, dimensionless
• C3 = 1.19183 × 10⁶ (micropoise/K2) = 3.86153 × 10⁶ (micropoise/R2)• C4 = 0.591123 (micropoise)• C5 = 91.9723 (micropoise)• C6 = 4.91705 × 10⁻⁵ (micropoise/K2) = 1.51761 × 10⁻⁵ (micropoise/R2)• Ca = Acetone blank concentration, mg/mg• Cb = Concentration of NH3 ion in the back half of train (breakthrough)• Cf = Concentration of NH3 ion in the front half of train (main catch)• CfPM10 = Conc. of filterable PM10, gr/dscf• CfPM2.5 = Conc. of filterable PM2.5, gr/dscf• Ck = K Factor Constant, 849.8
Isocalc-AHI v5.1 Nomenclature

Nomenclature
• Cn = nozzle diameter constant, 0.03575• Cp' = Coefficient for the pitot used in the preliminary traverse, dimensionless• Cp = Pitot coefficient for the combined cyclone pitot, dimensionless• Ccpm = Concentration of the condensable PM in the stack gas, dry basis, corrected to standard
•
• D50 = Particle cut diameter, micrometers• D50(N+1) = D50 value for cyclone IV calculated during the N+1 iterative step, micrometers• D50-1 = Re-calculated particle cut diameters based on re-estimated Cr, micrometers
Cr = Re-estimated Cunningham correction factor for particle diameter equivalent to the actual cut size diameter and calculated using the actual stack gas temperature, dimensionless
conditions, milligrams/dry standard cubic foot.
•
• D50N = D50 value for cyclone IV calculated during the Nth iterative step, micrometers•
• De = equivalent stack diameter (in.)
D50LL = Cut diameter for cyclone I corresponding to the 2.25 micrometer cut diameter for cyclone IV, micrometer
D50T = Cyclone I cut diameter corresponding to the middle of the overlap zone shown in Method 201A, Figure 10 of Section 17, micrometers
• ΔH@ = ΔH @ 0.75 scfm (in. H2O)• ΔHavg = average orifice pressure (in. H2O)• Dn = Inner diameter of sampling nozzle mounted on Cyclone I, inches• Dna = actual nozzle diameter (in.)• Dp = Physical particle size, micrometers• Δp = velocity head (in. H2O)• Δp1 = velocity head at first current traverse point (in. H2O)• Δp'
1 = velocity head at first preliminary traverse point (in. H2O)• Δpavg = average pitot tube differential pressure (in. H2O)• Δpn = velocity head at subsequent current traverse point (in. H2O)• ΔpRM2 = method 2 velocity head (in. H2O)• Ds = diameter of stack (in.)• Fd = fuel f-factor (dscf/MMBtu)• fO2 = stack gas fraction of O2, by volume, dry basis• I = Percent isokinetic sampling, dimensionless• K1 = standard volume correction, 17.65oR/in. Hg• K4 = isokinetic conversion constant, 0.0945min•in.Hg/sec•oR• K5 = water mass to std water vapor, 0.04715 ft3/g• Kp = 85.49, ((ft/sec)/(pounds/mole -oR))• L = length of stack (in.)• Lfw = distance to far wall of stack (in.)• Lnw = distance to near wall of stack (in.) [reference]• m#x = weight measurements (g)• M1 = Milligrams of PM collected on the filter, less than or equal to 2.5 micrometers•
•
M2 = Milligrams of PM recovered from Container #2 (acetone blank corrected), greater than 10 micrometers
M3 = Milligrams of PM recovered from Container #3 (acetone blank corrected), less than or equal to 10 and greater than 2.5 micrometers
Isocalc-AHI v5.1 Nomenclature

Nomenclature
•
• ma = Mass of residue of acetone after evaporation, mg• mc = Mass of the NH4+ added to sample to form ammonium sulfate, mg
M4 = Milligrams of PM recovered from Container #4 (acetone blank corrected), less than or equal to 2.5 micrometers
• mcpm = Mass of the total condensable PM, mg• Md = Molecular weight of dry gas, pounds/pound mole• mfb = Mass of total CPM in field train recovery blank, mg• mfx = final weight, avg of last two measurements (g)• mg = Milligram• mg/L = Milligram per liter• mi = Mass of inorganic CPM, mg• mib = Mass of inorganic CPM in field train recovery blank, mg• Mn = total particulates (mg)• mo = Mass of organic CPM, mg• mob = Mass of organic CPM in field train blank, mg• mr = Mass of dried sample from inorganic fraction, mg• mtx = tare weight (g)• MW = molecular weight (lb/lb-mole)• Mw = Molecular weight of wet gas, pounds/pound mole• N = Normality of ammonium hydroxide titrant• Na = null angle (deg.)• Nre = Reynolds number, dimensionless• Ntp = Number of iterative steps or total traverse points• Pb = Pbar = barometric pressure (in. Hg)• Pbar = barometric pressure (in. Hg)• ppmCO = carbon monoxide concentration (ppm)• ppmv = Parts per million by volume• ppmw = Parts per million by weight• Ps = absolute stack pressure (in. Hg)• Pstatic = static pressure (in. H2O)• Pstd = standard pressure, 29.92 in. Hg• Θ = total sampling time (min)• Qaw = average stack wet flow rate (ascf/min)• QI = Sampling rate for cyclone I to achieve specified D50
• Qm = estimated orifice flow rate, 0.750 acfm, else Vm/Q from previous run• Qs = Sampling rate for cyclone I to achieve specified D50
• Qs(std) = total cyclone flow rate at standard conditions (dscf/min)• Qsd = dry standard stack flow rate (dscfm)• QsST = Dry gas sampling rate through the sampling assembly, dscfm• Qsw = wet standard stack flow rate (ascfm)• Rmax = Nozzle/stack velocity ratio parameter, dimensionless• Rmin = Nozzle/stack velocity ratio parameter, dimensionless• t1 = Sampling time at point 1, min• tm = average gas meter temperature (oF)
Isocalc-AHI v5.1 Nomenclature
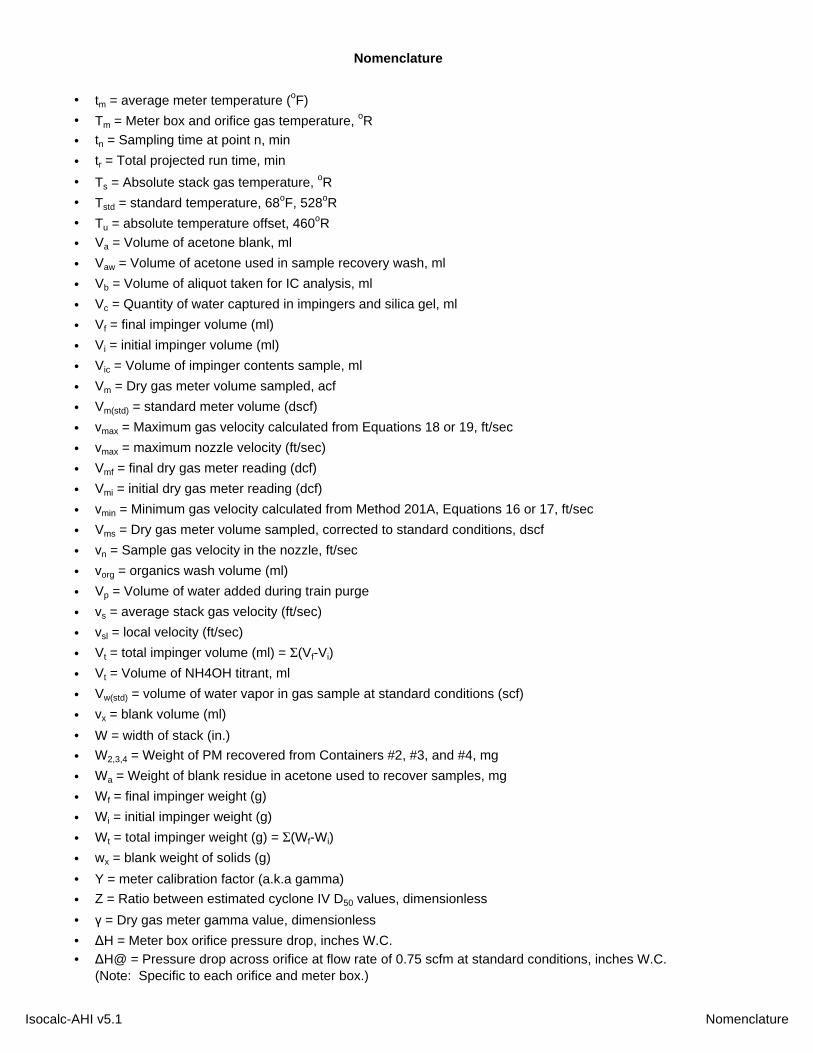
Nomenclature
• tm = average meter temperature (oF)• Tm = Meter box and orifice gas temperature, oR• tn = Sampling time at point n, min• tr = Total projected run time, min• Ts = Absolute stack gas temperature, oR• Tstd = standard temperature, 68oF, 528oR• Tu = absolute temperature offset, 460oR• Va = Volume of acetone blank, ml• Vaw = Volume of acetone used in sample recovery wash, ml• Vb = Volume of aliquot taken for IC analysis, ml• Vc = Quantity of water captured in impingers and silica gel, ml• Vf = final impinger volume (ml)• Vi = initial impinger volume (ml)• Vic = Volume of impinger contents sample, ml• Vm = Dry gas meter volume sampled, acf• Vm(std) = standard meter volume (dscf)( )
• vmax = Maximum gas velocity calculated from Equations 18 or 19, ft/sec• vmax = maximum nozzle velocity (ft/sec)• Vmf = final dry gas meter reading (dcf)• Vmi = initial dry gas meter reading (dcf)• vmin = Minimum gas velocity calculated from Method 201A, Equations 16 or 17, ft/sec• Vms = Dry gas meter volume sampled, corrected to standard conditions, dscf• vn = Sample gas velocity in the nozzle, ft/sec• vorg = organics wash volume (ml)• Vp = Volume of water added during train purge• vs = average stack gas velocity (ft/sec)• vsl = local velocity (ft/sec)• Vt = total impinger volume (ml) = Σ(Vf-Vi)• Vt = Volume of NH4OH titrant, ml• Vw(std) = volume of water vapor in gas sample at standard conditions (scf)• vx = blank volume (ml)• W = width of stack (in.)• W2,3,4 = Weight of PM recovered from Containers #2, #3, and #4, mg• Wa = Weight of blank residue in acetone used to recover samples, mg• Wf = final impinger weight (g)• Wi = initial impinger weight (g)• Wt = total impinger weight (g) = Σ(Wf-Wi)• wx = blank weight of solids (g)• Y = meter calibration factor (a.k.a gamma)• Z = Ratio between estimated cyclone IV D50 values, dimensionless• γ = Dry gas meter gamma value, dimensionless• ΔH = Meter box orifice pressure drop, inches W.C.• ΔH@ = Pressure drop across orifice at flow rate of 0.75 scfm at standard conditions, inches W.C.
(Note: Specific to each orifice and meter box.)
Isocalc-AHI v5.1 Nomenclature

Nomenclature
• Δp1 = Velocity pressure measured at point 1, inches W.C.• Δpavg = Average velocity pressure, inches W.C.• Δpm = Observed velocity pressure using S-type pitot tube in preliminary traverse, inches W.C.• Δpmax = Maximum velocity pressure, inches W.C.• Δpmin = Minimum velocity pressure, inches W.C.• Δpn = Velocity pressure measured at point n during the test run, inches W.C.• Δps = Velocity pressure calculated in Method 201a, Equation 25, inches W.C.• Δps1 = Velocity pressure adjusted for combined cyclone pitot tube, inches W.C.• Δps2 = Velocity pressure corrected for blockage, inches W.C.• θ = Total run time, min• ρa = Density of acetone, mg/ml (see label on bottle)• Σn = total number of sampling points
Isocalc-AHI v5.1 Nomenclature
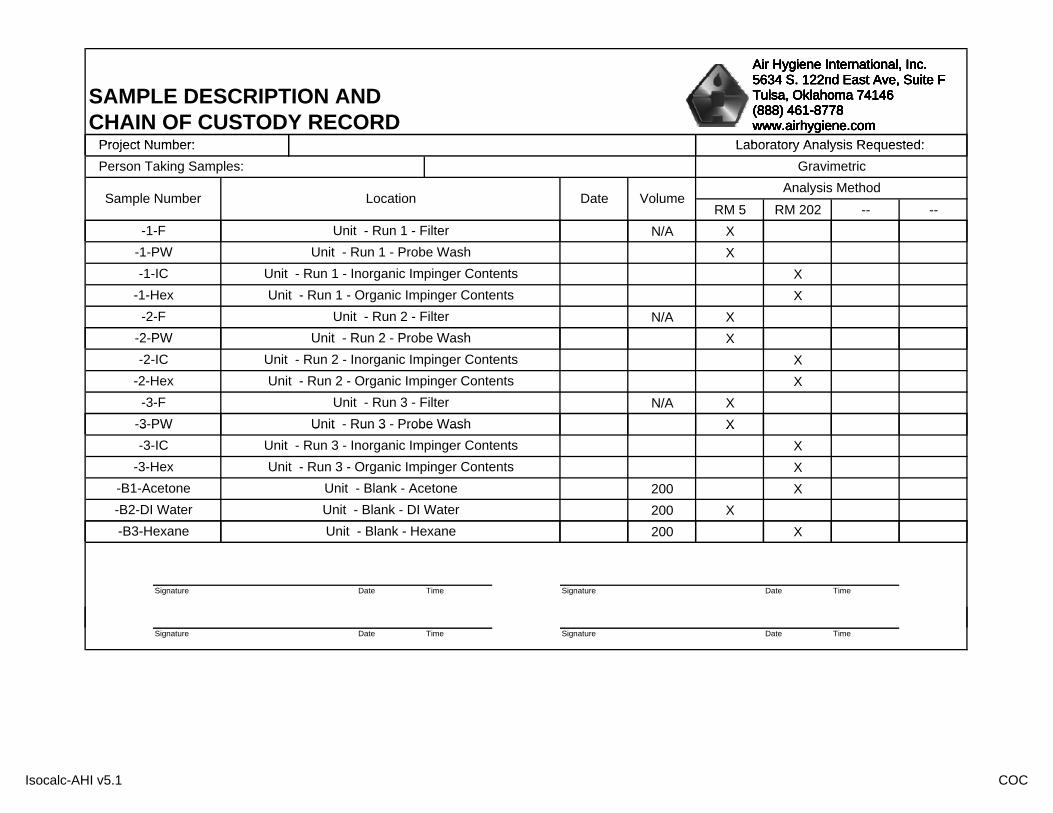
SAMPLE DESCRIPTION ANDCHAIN OF CUSTODY RECORD
Project Number: Laboratory Analysis Requested:
Air Hygiene International, Inc.5634 S. 122nd East Ave, Suite FTulsa, Oklahoma 74146(888) 461-8778www.airhygiene.com
RM 5 RM 202 -- --N/A X
Project Number: Laboratory Analysis Requested:
-1-F Unit - Run 1 - Filter
Person Taking Samples: Gravimetric
Sample Number Location Date VolumeAnalysis Method
Air Hygiene International, Inc.5634 S. 122nd East Ave, Suite FTulsa, Oklahoma 74146(888) 461-8778www.airhygiene.com
XXX
N/A XX
-1-PW Unit - Run 1 - Probe Wash
-1-Hex Unit - Run 1 - Organic Impinger Contents-1-IC Unit - Run 1 - Inorganic Impinger Contents
-2-F Unit - Run 2 - Filter2 PW U it R 2 P b W h
Air Hygiene International, Inc.5634 S. 122nd East Ave, Suite FTulsa, Oklahoma 74146(888) 461-8778www.airhygiene.com
XXX
N/A XX
Unit - Run 3 - Filter
-2-PW Unit - Run 2 - Probe Wash-2-IC Unit - Run 2 - Inorganic Impinger Contents
-2-Hex Unit - Run 2 - Organic Impinger Contents-3-F
-3-PW Unit - Run 3 - Probe Wash
Air Hygiene International, Inc.5634 S. 122nd East Ave, Suite FTulsa, Oklahoma 74146(888) 461-8778www.airhygiene.com
XXX
200 X200 X
-3-IC Unit - Run 3 - Inorganic Impinger Contents-3-Hex Unit - Run 3 - Organic Impinger Contents
3 PW Unit Run 3 Probe Wash
-B1-Acetone Unit - Blank - Acetone-B2-DI Water Unit - Blank - DI Water
Air Hygiene International, Inc.5634 S. 122nd East Ave, Suite FTulsa, Oklahoma 74146(888) 461-8778www.airhygiene.com
200 X
Signature Date Time Signature Date Time
-B3-Hexane Unit - Blank - Hexane
Air Hygiene International, Inc.5634 S. 122nd East Ave, Suite FTulsa, Oklahoma 74146(888) 461-8778www.airhygiene.com
Signature Date Time Signature Date Time
Air Hygiene International, Inc.5634 S. 122nd East Ave, Suite FTulsa, Oklahoma 74146(888) 461-8778www.airhygiene.com
Isocalc-AHI v5.1 COC

Unit Load Component Run Date Start Stop Time SyncPreliminaries V1Particulates 1Particulates 2Particulates 3
TABLE A.1: EMISSIONS TESTING SCHEDULE
Isocalc-AHI v5.1 Table A.1Isocalc-AHI v5.1 Table A.1

APPENDIX E
STATEMENT OF QUALIFICATIONS

STATEMENT OF QUALIFICATIONS
AIR EMISSION TESTING SERVICES January, 2018
INTRODUCTIONAIR HYGIENE INTERNATIONAL, INC. (AIR HYGIENE) is a professional air emission testing services firm operating from corporate headquarters in Broken Arrow, Oklahoma for 20 years. Additional field offices with ready for field use testing labs are strategically located in Las Vegas, Nevada; Austin and Ft. Worth, Texas; Shreveport, Louisiana; Chicago, Illinois; and Pittsburgh, Pennsylvania to serve all fifty (50) United States, Mexico, and Canada. AIR HYGIENE specializes in air emission testing services for combustion sources burning multiple fuels with multiple control devices and supporting equipment.
AIR HYGIENE testing laboratories are equipped with the following capabilities: 1. State-of-the-Art air emission analyzers, computers, and data-logging software!2. Dual racks for multiple source testing simultaneously or multiple points on a single source (in/out SCR, etc.)!3. NIST traceable gases for the most accurate calibration. Ranges as low as five (5) ppm!4. PM10, NH3, mercury (Hg), sulfuric acid mist (H2SO4), SO3, and formaldehyde sampling equipment!5. VOC testing with on-board gas chromatograph to remove methane and ethane!6. On-board printers to provide hard copies of testing information on-site!7. Networking capabilities to provide real-time emission data directly into the control room!
AIR HYGIENE is known for providing professional services which include the following: • Superior cost effective services to our clients!• Educated work force trained to utilize the latest in revolutionary technology!• Meeting our client’s needs whether it is 24 hour a day testing or short notice mobilization!• Using great equipment that is maintained and dependable!• Understanding the unique start-up and operational needs associated with combustion sources!• Experience working with state and federal regulations and agencies in all 50 states!
OUR MISSIONOur mission is to provide innovative, practical, top-quality services allowing our clients to increase operating efficiency, save money, and comply with federal and state requirements. We believe our first responsibility is to the client. In providing our unique services, the owners of AIR HYGIENE demand ethical conduct from each employee of the company. The character and integrity of AIR HYGIENE employees allows our clients to feel confident in the air testing services of AIR HYGIENE. Through a long-term commitment to this mission, AIR HYGIENE is known as a company committed to improving our clients’ operations.
AIR HYGIENE E’MISSION Statement: AIR HYGIENE’s core philosophy of “Second-to-None (2-2-0)”, demands extra mile customer service anchored on dignified character and family-oriented principles to deliver unmatched quality stack testing, worth paying for every time. We utilize revolutionary technology and AIR HYGIENE UNIVERSITY to create the best educated work force to define the future of stack testing.

TESTING EXPERIENCE AIR HYGIENE has twenty-six (26) QSTI certified personnel on staff and more than two hundred (200) years of combined testing experience. We have completed over 25,000 emission tests and our testing services history includes interaction with all 50 state agencies and EPA regional offices. AIR HYGIENE testing personnel are rigorously trained through our very own AIR HYGIENE UNIVERSITY on EPA reference test methods from 40 CFR Part 51, 60, 63, and 75 along with ASTM methods. All testing personnel are instructed and tested on test responsibilities and must complete a “Demonstration of Capability” test per the AIR HYGIENE Quality Assurance Manual and the AIR HYGIENE Emission Testing Standard OperatingProcedures Handbook.
AIR HYGIENE has completed testing on over 500 power plants including in excess of 2,500 combustion turbines and 100 coal fired boilers 250,000 megawatts (MW). Let us add your project to our list of satisfied customers!
TESTING SUCCESS STORIES AIR HYGIENE personnel have performed thousands of testing projects which have yielded significant benefits for our clients. The following project descriptions briefly discuss some of these emission testing projects.
Conducted Mercury (Hg), PM, selected metals, HCl, Chlorine, and gas testingto verify status with the industrial boiler MACT on six coal fired units at three (3)locations.
Conducted inlet/outlet baghouse emission testing for Mercury (Hg) todetermine control efficiency using Ontario-Hyrdo testing methodology.
Conducted numerous projects optimizing SCR performance by conducting inlet& outlet SCR analysis for NH3, NOx, flow, and Oxygen. Used information toassist with flow optimization and AIG tuning.
Conducted federal and state required compliance testing for NOx, CO, PM-10(front & back-half), SO2, VOC, Ammonia, Formaldehyde, Opacity, RATAtesting (NOx and CO) for new and updated power plants with both simple andcombined cycle turbines firing natural gas and fuel oil.
Conducted dry low NOx burner tuning and performance testing for variousmodels of GE, Siemens Westinghouse, Mitsubishi, Pratt & Whitney, and ABBcombustion turbines to verify manufacturer’s emission guarantees for clients inpreparation for compliance testing.
Performed power plant emission testing for natural gas & fuel oil firedcombustion turbines. Tests included federal required testing per 40 CFR Part75, state air permit requirements, RATA testing, and emission testing to verifymanufacturer’s guarantees during electric/heat output performance testing.
TESTING LOCATIONS AIR HYGIENE bases mobilization charges on the distance from your site to the closest of seven (7) regional starting points covering all 50 United States. These include Broken Arrow, Las Vegas, Austin, Ft. Worth, Shreveport, Chicago and Pittsburgh.
Each start point is located such that the AIR HYGIENE test teams can mobilize to your site within 24 hours at affordable costs to ensure we are price competitive to any U.S. location.

QUALITY ASSURANCE PROGRAM SUMMARY AIR HYGIENE has received interim accreditation from the Source Testing Accreditation Council (STAC) per ASTM D7036 as an Air Emission Testing Body (AETB). Air Hygiene also maintains current accreditation from LDEQ, CARB, SCAQMD, and PADEP.
AIR HYGIENE has twenty-six (26) Qualified Stack Testing Individuals (QSTI) on staff providing testing leadership for every testing project; including a PhD Chemical Engineer who is ACS Certified managing in house laboratory operations and specialty remote wet chemistry projects.
AIR HYGIENE ensures the quality and validity of its emission measurement and reporting procedures through a rigorous quality assurance (QA) program. The program is developed and administered by an internal QA team and encompasses five major areas:
1. QA reviews of reports, laboratory work, and field testing;2. Equipment calibration and maintenance;3. Chain-of-custody;4. Training; and5. Knowledge of current test methods.
QA Reviews
AIR HYGIENE’S review procedure includes review of each source test report, along with laboratory and fieldwork, by the QA Team. The most important review is the one that takes place before a test program begins. The QA Team works closely with technical division personnel to prepare and review test protocols. Test protocol review includes selection of appropriate test procedures, evaluation of interferences or other restrictions that might preclude use of standard test procedures, and evaluation and/or development of alternate procedures.
Equipment Calibration and Maintenance
The equipment used to conduct the emission measurements is maintained according to the manufacturer’s instructions to ensure proper operation. In addition to the maintenance program, calibrations are carried out on each measurement device according to the schedule outlined by the Environmental Protection Agency. Quality control checks are also conducted in the field for each test program. Finally, AIR HYGIENE participates in a PT gas program by analyzing blind gases semi-annually to ensure continued quality.
Chain-of-Custody
AIR HYGIENE maintains full chain-of-custody documentation on all samples and data sheets. In addition to normal documentation of changes between field sample custodians, laboratory personnel, and field test personnel, AIR HYGIENE documents every individual who handles any test component in the field (e.g., probe wash, impinger loading and recovery, filter loading and recovery, etc.). Samples are stored in a locked area to which only AIR HYGIENE personnel have access. Field data sheets are secured at AIR HYGIENE’S offices upon return from the field.
Training
Training available to both employees and customers through our very own AIR HYGIENE UNIVERSITY is essential to ensure quality testing. Constantly striving to be recognized globally as the worldwide leader in Stack Testing Training, AIR HYGIENE UNIVERSITY has developed a baseline foundation and curriculum using a unique indoor training facility, practice stack, and over 16 years of real-world field testing experience. AIR HYGIENE UNIVERSITY’S classwork combines customized training modules focusing on presentation, testing, resource utilization, and hands-on experience and the knowledge from each module can be combined to provide a final capstone, a Demonstration of Competency in the subject matter of interest. Participants are prepared to pass the Qualified Individual examinations and obtain Federal certifications and have the ability to apply new and refreshed knowledge about each test method to everyday work practices.
Knowledge of Current Test Methods
With the constant updating of standard test methods and the wide variety of emerging test procedures, it is essential that any qualified source tester keep abreast of new developments. AIR HYGIENE subscribes to services, which provide updates on EPA reference methods, rules, and regulations. Additionally, source test personnel regularly attend and present papers at testing and emission-related seminars and conferences.

TESTING QUALITY ASSURANCE ACTIVITIES
A number of quality assurance activities are undertaken before, during, and after turbine testing projects. This section describes each of those activities.
Each instrument’s response is checked and adjusted in the field prior to the collection of data via multi-point calibration. The instrument’s linearity is checked by first adjusting its zero and span responses to zero nitrogen and an upscale calibration gas in the range of the expected concentrations. The instrument response is then challenged with other calibration gases of known concentration and accepted as being linear if the response of the other calibration gases agreed within ± two percent of range of the predicted values.
NO2 to NO conversion is checked via direct connect with an EPA Protocol certified concentration of NO2 in a balance of nitrogen. Conversion is verified to be above 90 percent.
Instruments are both factory- tested and periodically field challenged with interference gases to verify the instruments have less than a two percent interference from CO2, SO2, CO, NO, and O2.
After each test run, the analyzers are checked for zero and span drift. This allows each test run to be bracketed by calibrations and documents the precision of the data collected. The criterion for acceptable data is that the instrument drift is no more than three percent of the full-scale response. Quality assurance worksheets summarize all multipoint calibration linearity checks and the zero to span checks performed during the tests are included in the test report.
The sampling systems is leak checked by demonstrating that a vacuum greater than 10 in. Hg can be held for at least one minute with a decline of less than 1 in. Hg. A leak test is conducted after the sample system is set up and before the system is dismantled. This test is conducted to ensure that ambient air does not dilute the sample. Any leakage detected prior to the tests is repaired and another leak check conducted before testing will commence.
The absence of leaks in the sampling system is also verified by a sampling system bias check. The sampling system’s integrity is tested by comparing the responses of the analyzers to the responses of the calibration gases introduced via two paths. The first path is directly into the analyzers and the second path includes the complete sample system with injection at the sample probe. Any difference in the instrument responses by these two methods is attributed to sampling system bias or leakage. The criterion for acceptance is agreement within five percent of the span of the analyzer.
The control gases used to calibrate the instruments are analyzed and certified by the compressed gas vendors to ± one percent accuracy for all gases. EPA Protocol No.1 is used, where applicable, to assign the concentration values traceable to the National Institute of Standards and Technology (NIST), Standard Reference Materials (SRM). The gas calibration sheets as prepared by the vendor are included in the test report.

Air Hygiene Project Manager
ITO Team
Test Engineers
Test Technicians
Testing Managers
Staff Technicians
PhD Chemical Engineer
EMISSION TESTING TEAM Air Hygiene International, Inc. (AIR HYGIENE) intends to exceed your expectations on every project. From project management to field-testing teams, we’re committed to working hard on your behalf. The job descriptions and flow chart below outline AIR HYGIENE’s client management strategy for your testing services.
From the initial request through receipt of the purchase order, the Inquisition to Order (ITO) team strives to inform every client of the benefits gained by using AIR HYGIENE for their emission testing project. The ITO team includes representatives from the sales, marketing, operations, and contracts divisions. In addition, several support staff assist to ensure the ITO team provides the support for client needs as requested by a client or project manager.
Project Managers are the primary contact for clients and ultimately responsible for every emission testing project. AIR HYGIENE’s Project Managers include seventeen (17) QSTI certified testing experts with experienceranging from those with a masters level, toprofessional engineers to industry expertswith over 25,000 testing projectscompleted. Each project is assigned a Project Manager based primarily upon geographic location, industry experience, contact history, and availability. The Project Manager prepares the testing strategy and organization for the project. This includes preparation of testing protocol; coordination with state agencies, client representatives, and any interested third parties. The site testing and report preparation are executed under the direction of the Project Manager from start to finish.
Testing Managers have completed Air Hygiene’s rigorous demonstration of capability training program and are capable of operating all testing equipment and performing all test methods required for your testing project. Testing Managers assist Project Managers by leading the field testing when required, preparing draft reports, calibrating equipment, and overseeing the testing team on-site. AIR HYGIENE’s staff includes seven (7) QSTI certified testing managers.
Test Engineers have significant background and understanding of emission testing or related services. Test Engineers prepare pre-test drawings for port location, ensure on-site logistics for electrical and mechanical/structural needs, and conduct on-site testing as directed by the Project Manager and/or Testing Manager. Test Engineers often have special understanding of process and/or regulations applicable to specific testing jobs, which provide great value to both the client and Project Manager in testing strategies. AIR HYGIENE’s staff includes two (2) QSTI certified testing managers.
Test Technicians experience ranges from new hire with technical degree and experience to technicians who have performed 500 emission tests. All test technicians have a basic understanding of emission training and are involved in daily training and under supervision to continue to develop testing skills. Each has testing experience with AIR HYGIENE equipment along with a variety of industries and source equipment. Test Technicians may operate isokinetic sampling trains or gas analyzers on-site under the direction of the Project Manager and assist with preparation of field reports and quality assurance procedures.
Staff Technicians are entry-level personnel who have performed fewer than 500 emission tests. Staff Technicians perform pre-test equipment preparation, on-site test preparation, and testing assistance under the direction of Project Manager and/or Testing Manager. Staff Technicians connect sampling probes to ports, raise and lower equipment to and from sampling platform, and other support activities under the direction of the Project Manager and/or Testing Manager.
PhD Chemical Engineer/Lab Manager our in house, ACS Certified Lab Manager manages in house laboratory operations and is available for specialty remote wet chemistry projects on site to provide added expertise and accuracy.

For t
he ty
pes o
f tes
ts to
whi
ch th
is ac
cred
itatio
n ap
plie
s, pl
ease
refe
r to
the
labo
rato
ry’s
Env
ironm
enta
l Sco
pe o
f Acc
redi
tatio
n.
Acc
redi
ted
Labo
rato
ryA
2LA
has
acc
red
ited
AIR
HYG
IEN
E IN
TERN
ATIO
NA
L, IN
C.
Brok
en A
rrow
, OK
for t
echn
ical
com
pete
nce
in th
e fie
ld o
f
Envi
ronm
enta
l Tes
ting
This
lab
ora
tory
is a
ccre
dite
d in
acc
ord
anc
e w
ith th
e re
cogn
ized
Inte
rnat
iona
l Sta
nda
rd IS
O/IE
C 1
7025
:200
5
Gen
era
l req
uire
men
ts fo
r the
com
pete
nce
of te
stin
g a
nd c
alib
ratio
n la
bora
torie
s . T
his l
abor
ator
y al
so m
eets
the
R219
–
Spec
ific
Requ
irem
ents
– T
NI F
ield
Sam
plin
g an
d M
easu
rem
ent O
rgan
izatio
n A
ccre
dita
tion
Prog
ram
. Thi
s acc
red
itatio
n d
emon
stra
tes t
echn
ical
com
pete
nce
for a
def
ined
scop
e an
d th
e op
erat
ion
of a
labo
rato
ry q
ualit
y m
anag
emen
t sy
stem
(ref
er to
join
t ISO
-ILA
C-IA
F C
omm
uniq
ué d
ated
8 J
anua
ry 2
009 )
.
Pres
ente
d th
is 10
th d
ay o
f Oct
ober
201
7
_
____
____
____
____
____
__
Pr
esid
ent a
nd C
EO
Fo
r the
Acc
red
itatio
n C
ounc
il
Cer
tific
ate
Num
ber 3
796.
01
V
alid
to A
ugus
t 31,
201
9

Accr
edit
ed A
ir E
mis
sion
Tes
ting
Bod
yA
2LA
ha
s acc
redi
ted
AIR
HY
GIE
NE
IN
TE
RN
AT
ION
AL
, IN
C.
In
reco
gniti
on o
f the
succ
essf
ul c
ompl
etio
n of
the
join
t A2L
A a
nd S
tack
Tes
ting
Acc
red
itatio
n C
ounc
il (ST
AC
) ev
alua
tion
proc
ess,
this
labo
rato
ry is
acc
red
ited
to p
erfo
rm te
stin
g ac
tiviti
es in
com
plia
nce
with
A
STM
D70
36:2
004
- Sta
ndar
d P
ract
ice
for C
ompe
tenc
e of
Air
Emiss
ion
Test
ing
Bod
ies.
Pres
ente
d th
is 10
th d
ay o
f Oct
ober
201
7
__
____
____
____
____
____
_ Pr
esid
ent a
nd C
EO
For t
he A
ccre
dita
tion
Cou
ncil
Cer
tific
ate
Num
ber 3
796.
02
Val
id to
Aug
ust 3
1, 2
019
This
acc
redi
tatio
n pr
ogra
m is
not
incl
uded
und
er th
e A2
LA IL
AC M
utua
l Rec
ogni
tion
Arra
ngem
ent.
Am
eric
an
Ass
oc
iati
on
fo
r La
bo
rato
ry A
cc
red
ita
tio
n


This page intentionally left blank End of document

Contact: Autumn Natalie
KDB Event & Outreach Coordinator
Phone: (940) 349-8711 | Fax: (940) 349-8396
Email: [email protected]
FOR IMMEDIATE RELEASE
Keep Denton Beautiful Announces Great American Cleanup Results Volunteers clean up thousands of pounds of litter from Denton community
March 29, 2018 - Denton, TX – On Saturday, March 24, nonprofit organization Keep Denton Beautiful, Inc. (KDB) hosted its 30th
Annual Great American Cleanup (GAC), a community-wide litter cleanup effort. A total of 2,236 volunteers participated including
local families, Boy and Girl Scout troops, school and university organizations, City leaders, and others. Nearly NINE AND A HALF
TONS of litter (989.5 bags of trash and 274.5 bags of recycling) were cleaned from 100 linear miles of roadway around
Denton, plus more than a dozen parks, trails, and school campuses. Volunteer participants contributed a collective 4,548 hours
of volunteer time, worth an estimated $109,789.
Volunteers were recognized for their work at the post-cleanup Volunteer Party at Quakertown Park from 11 a.m. to 1 p.m., which
included live music from local bluegrass band, Tallgrass; free lunch for volunteers courtesy of Leila’s Food Truck and Milpa
Kitchen & Cantina; educational activities; bounce houses; and awards. The following groups received awards for their volunteer
efforts:
Most Bags Collected: Robson Ranch Softball Association with 78 bags of trash and recycling
Largest Volunteer Group: Sonlight Enrichment Program with 48 total volunteers
Oddest Item Found: Coserv Volunteer Crew for their “getaway bag” consisting of a wig, a fake beard, and glasses
Denton Mayor Chris Watts attended the Volunteer Party to give a special thank you to volunteers.
“This is the 30th year of this event; what a tradition! It’s important to keep our city clean,” said Mayor Watts to a crowd of GAC
volunteers. “A clean city means we are more vibrant and have a better quality of life.”
GAC is part of a nationwide effort with Keep America Beautiful, and Denton is one of more than 20,000 communities that
participate each spring. Sites are selected citywide, and include roadways, streams and shorelines, and public areas such as parks.
KDB tracks litter rates in the community throughout the year to help target areas that are most in need of cleanup. Community
members can participate in these tracking efforts, or make recommendations for sites to be included in future cleanups, by
emailing [email protected] or by calling (940) 349-8737.
This year’s Great American Cleanup was made possible through community contributions and sponsorships, including
generous support from the City of Denton (COD) Solid Waste & Recycling Department; COD Watershed Protection; Denton
Municipal Electric; COD Parks & Recreation Department; Fulton Supply & Recycling; Rayzor Ranch Town Center, the Denton
Record-Chronicle; Pan Ector Industries; Leila’s Food Truck; Milpa Kitchen & Cantina; with additional support from Beth Marie’s
Old Fashioned Ice Cream, Fuzzy’s Taco Shop, Kroger, Recycled Books, Seven Mile Café, Sleeping Lizzards, Starbucks (Rayzor
Ranch), Steve’s Wine Bar, and Thai Square.
Keep Denton Beautiful, Inc. is a nonprofit organization that offers community improvement opportunities and environmental
education programs for the benefit of Denton neighborhoods, businesses, and residents of all ages. The mission of KDB is to
engage our community in creating a clean and beautiful Denton. For more information, visit www.kdb.org.
###

Date: March 30, 2018 No. 2018-035
INFORMAL STAFF REPORT
TO MAYOR AND CITY COUNCIL
SUBJECT:
Denco Area 9-1-1 Appointment to District Board of Managers DISCUSSION:
The City has received a request (attached) from Mark Payne, Executive Director for Denco Area 9-1-1 District, for nominations of individuals to serve on the Denco Board of Managers. The Denco Area 9-1-1 District was created in 1987, and is governed by a board of managers appointed by the County, participating cities, and the Denton County Fire Chief's Association. Board members serve staggered two-year terms and are eligible for reappointment. A list of the current Board Members is attached to the memorandum. Each year, the term of one of the two members appointed by participating municipalities expires. This year, Mr. Jim Carter’s second term expires on September 30, 2018. Members are eligible for consecutive terms. Mr. Carter has expressed his desire to serve a third term. A copy of his resume is attached. Nominations must reach Denco on or before June 15, 2018. If you have a nominee for consideration by City Council, please contact me by May 19, 2018, and it will be considered at the June 5, 2018, Council Meeting. On June 16, 2018, Denco will send copies of nominations to each city for consideration, requesting the city to vote for one of the nominees. Requests for votes from Council will occur at an August 2018 Council meeting. If you have any questions, please contact me. ATTACHMENTS
Memorandum from Denco Area 9-1-1 District List of current Board Members Mr. Jim Carter’s Resume
STAFF CONTACT:
Antonio Puente, Jr. Director of Finance (940) 349-7283 [email protected]


JIMCARTER6101LongPrairieRoad, Suite744-110 ( 817) 239-7791FlowerMound, Texas 75028 [email protected]
EDUCATIONCollegeDegree: UniversityofGeorgia, B.B.A. Finance
GeorgiaTech, UniversityofTennessee, UniversityofMichigan, PostGraduate: TexasWomen’sUniversity, AmericanManagementAssociation
PROFESSIONALEXPERIENCEDepartmentHead, Finance GeneralMotorsCorporation
SeniorVice-President Frito-Lay, Inc., InternationalandDomesticDevelopment
President, C.E.O MercantileCorporationResponsiblefor3Banks, developed2,000primecommercialacres inFortWorthadjacenttoI-35W
Current: Principal JamesP. Carter & Associates – Consultant & MediatorTobusinessandgovernmentalentities
ProfessionalLicenses TexasRealEstateLicense, CertifiedMediator
PUBLICSERVICEEXPERIENCEMayor TrophyClub, Texas – 14yearsMunicipalCourtJudge TrophyClub, Texas – 12yearsCountyCommissioner DentonCounty, Texas – 8yearsVicePresident TexasAssociationofCountiesPresident DentonCountyEmergencyServicesDistrict #1
FireandEmergencyMedicalover56squaremilesServing5municipalities: (Argyle, Bartonville, CopperCanyon, CorralCityandNorthlake); LantanaFreshwaterSupplyDistricts #6and #7andruralareasofDentonCounty
TexasStateBoardMember SAFE-D – TrainsEmergencyServicesDistrictCommissioners
BoardMemberDenco911 Emergencytelecommunicationssystemthatassistsitsmemberjurisdictionsinrespondingtopolice, fireandmedicalemergencycalls.

COMMUNITYANDCHARITYSERVICESBaylorHealthcareSystem Trustee – 10YearsUniversityofNorthTexas President’sCouncilTexasStudentHousingCorp Chairman – 20Years, providingResidentialScholarshipsat
UNT, A&M, UTAustinBoyScoutsofAmerica LonghornCouncil, DistrictChairmanFirstBaptistChurch, TrophyClub Chairman, StewardshipCommitteeAmericanHeartAssociation BoardofDirectors, CelebrityWaiter
BUSINESSORGANIZATIONSNorthTexasCouncilofGovernments TransportationBoardFortWorthChamberofCommerce Chairman, NorthAreaChamber
AnnualGolfTournamentEconomicDevelopmentCouncilGovernmentalAffairsCommittee
TexasAllianceforGrowth LegislativeCommitteeGreaterFortWorthArea
NortheastLeadershipForum BoardofDirectors, ChairmanMayorsForum, ChairmanLegislativeCommittee
MetroportPartnership FoundingMemberandChairmanNorthwestCommunityPartners FoundingMember, ChairmanBoardofDirectorsIndustrialDeveloperAssociation DeveloperRepresentative
Honors: Who’sWhointheSouthandSouthwest, Who’sWhoinU.S. Executives

Date: March 30, 2018 Report No.2018-036
INFORMAL STAFF REPORT TO MAYOR AND CITY COUNCIL
SUBJECT: City’s Emergency Response Framework
EXECUTIVE SUMMARY: The purpose of this report is to provide City Council with details regarding the Emergency
Response Framework.
DISCUSSION: Emergency Management Plan Framework
The State Disaster Act requires jurisdictions to prepare Emergency Management Plans (EMPs)
that follow the Texas Division of Emergency Management (TDEM) planning standards. The
purpose of these plans is to reduce vulnerability of the communities’ damage, injury, and loss
resulting from natural or man-made catastrophes. There are basic, intermediate, and advanced
level plans that cover mitigation, preparedness, response, and recovery. The City of Denton
maintains an advanced level plan, which enables the City to be eligible for homeland security
and other federal preparedness grants. The EMP is updated on a five year cycle. The current
version is dated July 2014, and is undergoing revisions for renewal submission to TDEM late
summer or early fall of 2018. Additionally, the EMP is supplemented by companion documents
including the Technology Services’ Business Continuity Plan, Local Mitigation Strategy,
Emergency Operations Center Standard Operating Framework, and departmental response
procedures.
Emergency Operations Center
The City’s Emergency Operations Center (EOC) is located at Central Fire Station. The EOC is
the physical location designed to support emergency response, business continuity, and crisis
communications activities. The City’s Executive Staff and/or the Incident Management Team
meet at the EOC, as needed for table top planning exercises. During activation the EOC is used
to manage preparations for an impending event, or an ongoing incident. By gathering the
decision makers together in a central location and supplying them with the most current
information, better decisions can be made.
Activating the EOC The City has four emergency alert levels. The Emergency Management Coordinator will issue
the alerts to the City’s Emergency Response Teams: High Water Group, Swift Water Rescue
Team, and/or Incident Management Team, as conditions warrant through the Hiplink messaging
system.
Level 4 is activated when the forecast is predicting possible severe storms threatening the City of
Denton in the next 24 hours. Potential technological emergencies may necessitate the issuance of

Date: March 30, 2018 Report No.2018-036
a Level 4 Alert as a precaution including a suspicious explosive device, planned civil
protest/potential unrest, small-scale hazardous material incident, etc. Additional weather
conditions include: tornado watch, flash flood watch, severe thunderstorm watch, and winter
storm watch.
Level 3 is activated when a situation has escalated to hazardous conditions such as active flash
flooding, sustained high winds, tornado, large grass fires, major hazardous material incident, etc.
Additionally, hurricane shelter operations are included in this level along with: tornado warning,
flash flood warning, and severe thunderstorm warning.
Level 2 occurs when a major disaster event with extensive damage to the city such as from a
large tornado, wide-scale flash flooding, a significant hazardous materials incident, or other
substantial natural or technological disasters. Shelter operations where City of Denton recreation
center(s) are used as shelter sites following an evacuation, would typically be a Level 2 Alert
requiring a significant amount of City resources and coordination of activities by Incident
Management Team.
Level 1 is activated when a catastrophic disaster is impacting or imminent for the City of
Denton. This severe situation will necessitate use of all or a vast majority of available City
personnel and resources over an extended period of time. Mutual-aid assistance may be needed
from other communities, state, and federal agencies. Examples include a direct hit from an EF4
or EF5 tornado with mass casualties and numerous fatalities, hazardous materials release
involving a substance immediately dangerous to life and health requiring mass evacuation and
shelter operations, massive flash flooding impacting a significant portion of the city, domestic
terrorism incident, and other large-scale events that will overwhelm local response capabilities.
STAFF CONTACT:
Michael Penaluna, Emergency Management Coordinator
(940) 349-8836

Date: March 30, 2018 Report No. 2018-037
INFORMAL STAFF REPORT TO MAYOR AND CITY COUNCIL
SUBJECT: Update on repairs to fencing, headstones and a mausoleum at Oakwood and IOOF Cemeteries. BACKGROUND: Cemetery Fencing Project - Funding in the amount of $180,000 was approved in the 2005 CIP for the replacement of existing chain link fences at both IOOF and Oakwood Cemeteries. When fence permits were applied for, staff was notified that a historical Certificate of Appropriateness would be required to replace the fences. Staff was also informed that the chain link fences envisioned in the 2005 CIP would not be an acceptable replacement. Teague, Nall, and Perkins was hired to design the replacement fences. Their staff facilitated presentations with the Historical Landmark Commission and Denton County Historian, Peggy Riddle resulting in the design of a fence to meet the specifications noted by the Historic Landmark Commission. A Certificate of Appropriateness (COA13-0012) was applied for on May 31, 2013 and awarded on July 08, 2013 to Oakwood Cemetery stipulating that the existing chain link fence would need to be replaced with decorative iron fence with stone columns that matched the existing WPA era stone walls in the central business district. A decorative ornamental fence was not required for IOOF Cemetery, but since it is a gateway to the City, a similar decorative fence was planned to be installed. Chain link fence will remain in some non-focal areas of IOOF.
On May 2, 2017, City Council requested funding from the General Fund balance be appropriated to allow an expansion of fencing at the cemeteries.
On May 9, 2017, City Council approved ID 17-579 to amend the FY2017 Budget and Annual Program of Services adjusting the General Fund in the amount of $375,000 for the purpose of funding fencing improvements at City cemeteries.
On December 12, 2017, City Council accepted competitive proposals and awarded a best value public works contract for the construction of IOOF and Oakwood Cemetery fences to Rockstar Welding, LLC in the not-to-exceed amount of $442,873.20.
On December 21, 2017, a Notice to Proceed was provided to Rockstar Welding, LLC. to commence work on the IOOF (Exhibit A) and Oakwood Cemetery (Exhibit B) fencing on or before January 2, 2018. Work is being conducted under permit 1709-0336 for Oakwood and 1709-0338 for IOOF. The project is to be completed within 134 calendar days preceding a period of 15 days of mobilization upon issuance of the Notice to Proceed. The contract completion date is June 1, 2018. Additional alternatives selected in this bid call for the contractor to remove the existing chain link fence in the areas where the new fence is scheduled to be installed. As of March 21, 2018, Oakwood Cemetery is in the process receiving 2,560 linear feet of

Date: March 30, 2018 Report No. 2018-037
ornamental fencing (Exhibit C) with ball point finials and 14 stone columns as well as an arched entryway sign spanning the entry drive. The following portions of the project are complete:
Demolition of existing fence is complete. Concrete mow strip with integral fence posts on is complete on Sycamore Street,
Bradshaw Street, and Prairie Street. Concrete mow strip for chain link fence between Oakwood Cemetery and Fred Moore
Park is complete. Ornamental Iron fence panels are 30% complete on the south side of Prairie Street.
(Existing chain link to remain on the west perimeter between Trinity Industries and St. Emanuel Baptist Church.
Ornamental fence column piers, bases, and CMU supports are complete. Rock façade is pending.
Arched entry structural support piers have been poured and certified by D&S Engineering. Pouring of the 14 foot concrete structural supports and erection of the ornamental entry are pending. Structural cages have been prefabricated on site for the concrete arched entry.
Also, as of March 21, 2018, IOOF Cemetery is in the process of receiving 1,960 linear feet of ornamental fencing (Exhibit D) with ball point finials and 14 stone columns as well as an arched entryway sign spanning the entry drive. The following portions of the project are complete:
Removal of existing fence wire mesh is complete. Posts remain until work transitions to this property to minimize pedestrian hazards.
Demolition of unused asphalt paved area and steel guardrail is complete. Additional hauling demolition material is still required.
Arched entry structural support piers have been poured and certified by D&S Engineering. Pouring of the 14 foot concrete structural supports and erection of the ornamental entry are pending. Structural cages have been prefabricated on site for the concrete arched entry.
The contract calls for work to take place at IOOF for only the length of Carroll and Eagle Streets. The existing chain link fence will remain and additional repairs will be considered for future projects (Exhibit E).
Monument Repairs Project – At City Council’s request, staff presented a scope of work on April 4, 2017, that included an assessment of Oakwood and IOOF cemeteries, GIS mapping, and monument restoration. Staff was given direction to proceed with monument restoration, prioritizing those most in need of repair. Supplemental packages were approved as part of the budget process in FY2017 for a total of $152,596. This funding was used to complete both Phase I and II of the monument repairs. A total of 249 headstones at the cemeteries have been repaired. Repairs consist of remounting, resetting the foundations and reconstructing damaged headstones along with repairing one mausoleum. Below is a breakdown on total costs associated with the repairs. Examples of the repairs can be seen on Exhibits F and G.

Date: March 30, 2018 Report No. 2018-037
Phase I - $48,113.50 (67 monuments repaired) Phase II - $104,310.50 (182 monuments repaired)
A Phase III of emergency monument repairs is estimated to cost $24,677. This would complete repairs to an additional 43 monuments at IOOF Cemetery. At the conclusion of Phase III, all emergency headstone repairs would be completed. Additional mausoleum, lawn crypt, and fencing repairs will still be needed.
Due to the fact that bid received for the cemetery fence replacement was under initial estimates, a balance of $49,106.24 remains. With this remaining balance, Phase III of the monument repairs and any fencing improvement priorities will be completed to improve the overall safety and beautification of the properties.
ATTACHMENT(S): Exhibit A - IOOF Cemetery Fence Repair Map Exhibit B – Oakwood Cemetery Fence Repair Map Exhibit C – Oakwood Cemetery Fence Project Update Exhibit D – IOOF Cemetery Fence Project Update Exhibit E – IOOF Cemetery Existing Chain Link Fence Exhibit F – Oakwood Cemetery Monument Repairs Update Exhibit G – IOOF Cemetery Monument Repairs Update STAFF CONTACT: Gary Packan Director of Parks and Recreation [email protected]

IOOF CEMETERY FENCE REPAIR MAP EXHIBIT A
Decorative Fence
Existing Chain Link Fence

OAKWOOD CEMETERY
FENCE REPAIR MAP EXHIBIT B
Decorative Fence
Replacing Chain Link Fence
Existing Chain
Link Fence

OAKWOOD CEMETERY
FENCE PROJECT UPDATE
EXHIBIT C

IOOF CEMETERY FENCE PROJECT
UPDATE
EXHIBIT D

IOOF CEMETERY EXISTING
CHAIN LINK FENCE TO REMAIN
EXHIBIT E

OAKWOOD CEMETERY
MONUMENT REPAIRS
EXHIBIT F
BEFORE
AFTER

IOOF CEMETERY
MONUMENT REPAIRS
EXHIBIT G
BEFORE
AFTER
Date: March 30, 2018 Report No. 2018-038
INFORMAL STAFF REPORT TO MAYOR AND CITY COUNCIL
SUBJECT: Update on Small Cellular Antennas EXECUTIVE SUMMARY: Council Member Briggs recently requested an update on the City of Denton’s effort in the small cellular antenna (small cell) technology implementation. BACKGROUND: According to the cellular industry, small cellular antennas (small cell or small nodes) are necessary as consumers continue to migrate towards solely using cellular communications in their homes and businesses. The industry also claims that additional network coverage is necessary due to public demand. This is also the technology strategy the cellular industry is using at is begins deploying the new 5G technology. The cellular industry lobbied for small cell technology legislation during the 85th Legislative Session. As a result, the Texas Legislature passed and Governor Abbott signed into law, Senate Bill 1004 (codified as Texas Local Government Code, Chapter 284). The law was made effective statewide on September 1, 2017. The new law mandated that Texas cities follow certain requirements and methodologies to permit wireless companies to install small cellular nodes on new and existing utility poles within the City’s right-of-way. The law has eroded the City’s ability to manage its right-of-way by establishing the maximum fees cities can charge, the timing in which permits must be reviewed and approved, and prohibited the ability to deny requests or place moratoriums on additional device installations. In anticipation of the law going into effect, the City Council approved on August, 22, 2017, ordinance numbers 2017-042, 2017-043 (repealed by 2017-277), 2017-244, and 2017-245, that locally codified the implementation of Chapter 284 of the Texas Local Government Code. To this end, city staff within the CMO, City Attorney’s Office, Public Works Inspection, and DME have established processes, procedures, and criteria manuals to properly and safely implement the requirements of the law. To date, AT&T, Verizon Wireless, and Mobilitie have inquired and met with City staff about the City’s permitting processes. A few applications have been submitted for review but have been rejected because of missing elements required by state law or did not comply with the City’s ordinances. As a result, no permits have been issued at this time. Staff continues to work with the cellular providers to assist them through the application process. As additional background material, the AIS, PowerPoint, and associated ordinances adopted on August 22, 2017, is included below.

Date: March 30, 2018 Report No. 2018-038
ATTACHMENT(S):
1. AIS - Small Cellular Antenna/Node dated August 22, 2017 2. PowerPoint presentation – Small Cell dated August 22, 2017
STAFF CONTACT: Mario Canizares, City Manager’s Office 940-349-8235 [email protected]

City of Denton
_____________________________________________________________________________________
AGENDA INFORMATION SHEET DEPARTMENT: City Manager’s Office CM/ DCM/ ACM: Mario Canizares DATE: August 22, 2017 SUBJECT Consider adoption of an ordinance of the City of Denton adopting and approving a design manual in accordance with Chapter. 284, Deployment of Network Nodes in Public Right-of-Way, Tex. Local Gov’t code; and providing an effective date. BACKGROUND In the 85th Legislative Session, the Texas Legislature passed and Governor Abbott signed into law, Senate Bill 1004 (small cellular antennas or nodes). The new law goes into effect statewide on September 1, 2017. It is also a m andate for cities on the requirements and methodology to allow wireless telecommunication companies to install small cellular nodes on new and existing utility poles within the City’s right-of-way. The new law erodes the City’s ability to manage its right-of-way by establishing the maximum fees cities can charge, the timing in which permits must be reviewed and approved, and prohibits the ability to deny requests or place moratoriums on additional device installations. According to the cellular industry the nodes are necessary as consumers continue to migrate towards solely using cellular communications in their homes and businesses. To that end, the need for additional coverage is necessary due to public demand. This is also a strategy for the telecom industry as it begins to rollout the new 5G technology. Based on the impending timing of the new law, cities across the state are working to establish the requisite ordinances, design m anuals, application form s, and in ternal review processes to be in com pliance by September 1. The following are highlights of the new law:
Mandates that network nodes and their support poles to be installed in the City’s right-of-way o Includes the use of existing utility poles, tra ffic signal poles, and the installa tion of new
poles o Restricts the installation of nodes on existing decorative poles o Allows for some restrictions in historic and design districts (i.e. install decorative poles,
reasonable design and concealment restrictions) o Sets height at a 55-foot maximum
Establishes permit requirements
o Generally required for a node, support pole, and transfer facility o Up to 30 network nodes are allowed per permit
City Hall 215 E. McKinney Street
Denton, Texas www.cityofdenton.com

o Prohibits cities from issuing permits for routine maintenance, replacing or upgrading the existing node
Establishes time line (shot clock) on City’s permit approval process and Telecom’s installation o Network node permit request: 30 days for the City to determine completeness; 60 days to
approve or deny, and if not acted upon in this timeframe the permit is granted
o Node support pole perm it: 30 days for the City to determ ine completeness; 150 days to approve or deny, and if not acted upon in this timeframe the permit is granted
o Transfer facility: 10 days for the City to de termine completeness; 21 days to approve or
deny, and if not acted upon in this timeframe the permit is granted
o If a perm it is denied f or being incom plete the applicant m ay resubmit a com pleted application within 30 days; the City has 90 days to act on resubmitted applications
Establishes the fee structure: Network Nodes: o Application fee: $500 for up to five network nodes, $250 for each addition network node
on a permit o Annual node site rental rate: $250 per node site, annual CPI adjustment is allowed Node Support Poles:
o Application fee: $1,000 each pole o Annual pole rental rate: $250 per pole site
Defines the restriction of node and pole installations by zoning districts
o Municipal parks that meet certain criteria o Residential areas that meet certain criteria o Historical districts that meet certain criteria o Design districts that meet certain criteria
Allows for cities to establish a design manual
o The adopted design m anual would establish th e City’s design guidelines regarding the aesthetics of the nodes, the support poles, the nodes enclosure, and the camouflaging of the electrical supply
Several City departments have been working together over the last several weeks to determine the best course of action. Based on the recommendations of staff a series of ordinances have been drafted to guide the implementation of this new legislation. This includes the fee ordinance, design manual and its enabling ordinance, service pole license agreement, and municipality owned utility license agreement and its enabling ordinance. OPTIONS This new law is an unfunded m andate established by th e Texas Legislature and is set to go into effect September 1, 2017. Unfortunately, there are minimal options available to consider. RECOMMENDATION Consider approval of several ordinance related to SB 1004:
Fee ordinance, Design manual and its enabling ordinance; Service pole license agreement;

Municipality owned utility license agreement and its enabling ordinance ESTIMATED SCHEDULE OF PROJECT Not applicable for this item PRIOR ACTION/REVIEW (Council, Boards, Commissions) The information related to SB 1004 has been discussed and reviewed in work session for input with the following City Boards and Commissions:
Planning & Zoning Commission: August 9, 2017 Public Utility Board: August 14, 2017 Historical Landmark Committee: August 14, 2017
FISCAL INFORMATION At this early stage of the implementation for Senate Bill 1004 it is difficult to calculate the fiscal impact to the City. The fees are set by the new state law. The revenues generated and expenditures incurred are all contingent on the number of applications made by the cellular provider. BID INFORMATION Not applicable for this item. STRATEGIC PLAN RELATIONSHIP The City of Denton’s Strategic Plan is an action-oriented road map that will help the City achieve its vision. The foundation for the plan is the five long-term Ke y Focus Areas (KFA): Organizational Excellence; Public Infrastructure; Econom ic Development; Safe, Livable, and Fam ily-Friendly Community; and Sustainability and Environmental Stewardship. While individual items may support multiple KFAs, this specific City Council agenda item contributes most directly to the following KFA and goal: Related Key Focus Area: Public Infrastructure Related Goal: 1.1 Manage financial resources in a responsible manner EXHIBITS 1. Agenda Information Sheet 2. Ordinance & Design manual 3. SB 1004 legislation 4. PowerPoint presentation Respectf ully submitted:
Mario Canizares Assistan t City Manager

Presentation regarding the Implementation of Senate Bill 1004 (Small Cellular Antennas)
Denton City Council
August 22, 2017
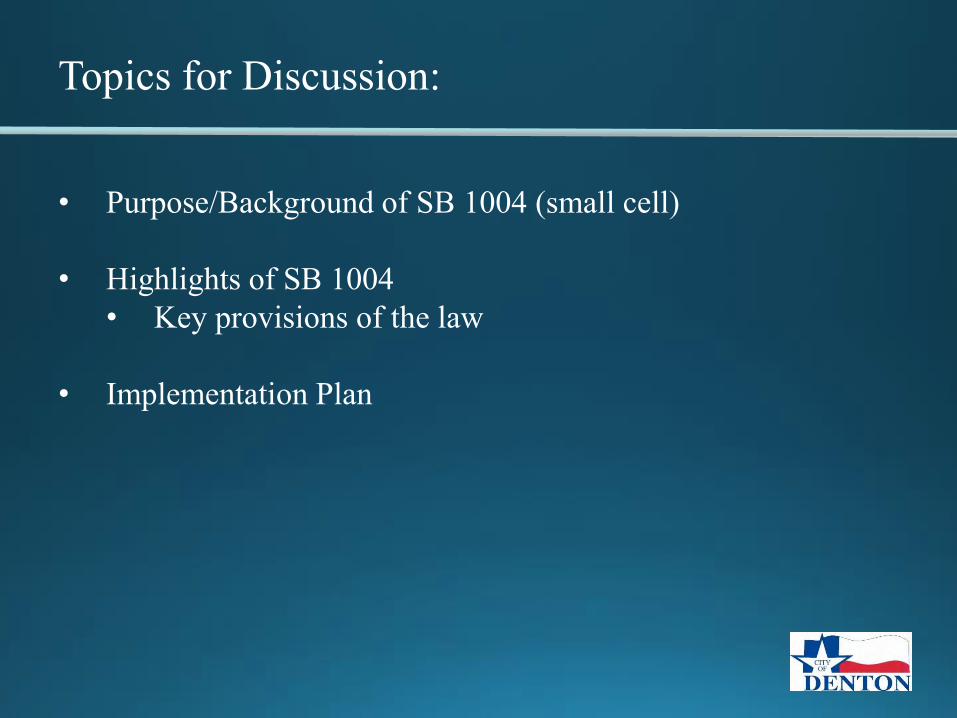
Topics for Discussion:
• Purpose/Background of SB 1004 (small cell)
• Highlights of SB 1004• Key provisions of the law
• Implementation Plan

Purpose/Background – Senate Bill 1004
• Authored by Senator Hancock in the 85th Legislative Session• Signed by Governor Abbott in early June• Establishes Chapter 284 of the Local Gov’t Code• Goes into effect on September 1, 2017
• Allows the cellular industry to install small antennas/nodes within the City’s rights-of-way

Purpose/Background – Senate Bill 1004
• Its purpose was to:• Increase cellular network coverage across the state
• Update state law regarding new technologies• Meet customer demand• Easier rollout of new 5G technology and beyond
• Requires compliance by all cities• One size fits all approach• Baseline approval processes, timelines, and fees• Including certain design elements

Purpose/Background – Senate Bill 1004
What does a small cell node look like?

Purpose/Background – Senate Bill 1004
Examples of what a small cell node looks like:

Purpose/Background – Senate Bill 1004
Examples of what a small cell node looks like:

Purpose/Background – Senate Bill 1004
Who are players in this field?

Highlights of SB 1004
Key Provisions of SB 1004; Chapter 284 LGC
• Mandates that small cell nodes and poles to be installed in the City’s rights-of-way• Includes use of existing utility and traffic poles
• Establishes City permit requirements
• Establishes time line (shot clock) for City approval
• Establishes maximum fee structure the City can charge

Highlights of SB 1004
Key Provisions of SB 1004; Chapter 284 LGCPermit shot clock requirements:
Company files application
City deadline to review for completeness
If complete, City’s deadline to approve or
deny application
Node (cell/antenna) Day 1 Maximum of 30 daysDay 31
Maximum of 60 daysDay 61
Transport facility Day 1 Maximum of 10 daysDay 11
Maximum of 21 daysDay 22
New Pole Day 1 Maximum of 30 daysDay 31
Maximum of 150 daysDay 151
Fee structure:• $500 for up to 5 network nodes; $250 for each additional node• Annual node site rental: $250 per node• $1,000 for a new pole; $250 annual pole rental• Monthly rental: $28 for each network transfer facility
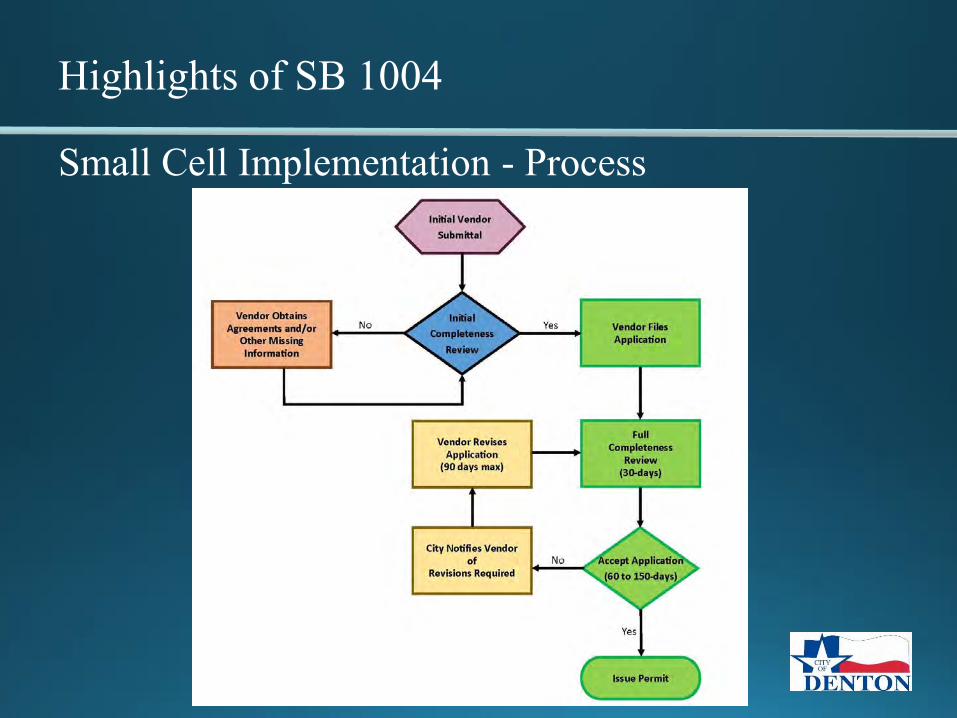
Highlights of SB 1004
Small Cell Implementation - Process

Highlights of SB 1004
Key Provisions of SB 1004; Chapter 284 LGC
• Defines zoning restrictions of node and pole installations• Municipal parks• Residential areas• Historical and Design districts
• Allows for certain design elements• Maximum size of node; pole height• Allows for enclosures and camouflaging of nodes and
support infrastructure

Highlights of SB 1004
Key Provisions of SB 1004; Chapter 284 LGC
Design elements:

City’s Implementation Plan
• Meetings with cell providers to understand their plans
• Drafting new ordinances
• Drafting design standards
• Drafting license and application forms
• Staff attending information sessions at NCTCOG
• Receiving/sharing information with other cities

City’s Implementation Plan
• Sent Informal Staff Report to City Council on July 28, 2017
• Presented to:• Planning & Zoning Commission: August 9• Public Utility Board: August 14• Historic Landmark Commission: August 14
• Seeking approval of ordinance by City Council: August 22
• Post information on City website: August 23
• Begin receiving applications: September 1
Recommendation
That the City Council approve the following ordinances to implement Senate Bill 1004
• Design Manual Ordinance
• Fee Ordinance
• Service Pole Agreement Ordinance
• MOU Pole Attachment Ordinance
In Conclusion
• SB 1004 goes into effect September 1, 2017• Is very favorable to the cellular industry
• Requires that cities approve small cell deployments in the city’s right-of-way
• All cities in Texas are affected• It’s one size fits all• This is a work in progress
• It directs the processes/methodology/pricing for cities
• Provides very limited options for regulating

Thank you
Any Questions?

Revision Date 3/30/18
Council Requests for Information Request Request Date Staff Responsible Status
1. Information on cost determination for curb rate vs drop-off rate at landfill
6/5/17 Cox An RFP for a cost of service study is being prepared; the project is expected to last a few months into spring 2018.
2. Survey and report of how other municipalities and school districts fund their School Resource Officers, as well as analysis of calls to school and efficiency
7/25/17 Howell A consultant is working on an efficiency analysis of the Aquatics Center. An MOU for increased SRO funding from DISD is on April 3 agenda.
3. Work session on special events/parades and permitting processes required
1/9/18 Howell/Kuechler A brief update was included in the Friday Jan. 12 report, and a work session is planned for April 10.
4. Identify options for partnership with Parks Foundation 2/20/18 Langley Parks Foundation Board is considering options.
5. Work session on DCTA (discuss City Council goals for DCTA)
2/20/18 Nelson A work session is tentatively scheduled for April 10.
6. Work session on Tree Code 2/20/18 McDonald A work session is tentatively scheduled for April 10.
7. Change ordinances to show Council Member votes 2/20/18 Walters A minor ordinance amendment will be presented at the April 10 work session. The item will then appear on the April 17 consent agenda for consideration.
8. Work session on HOT funds and potential uses (historic preservation, public art, cultural district, etc)
2/27/18 Puente HOT Funds Committee meeting on April 26; scheduled a Council work session after.
9. Work session on small cell infrastructure 3/20/18 Canizares An ISR is provided in the Friday March 30 report.
10. Update on DEC air permit testing 3/20/18 Morrow/Banks An update is provided in the Friday March 30 report.
11. Staff report on gun sales near schools, any zoning requirements
3/20/18 McDonald/Howell/ Leal
A report will be provided in the Friday April 6 report.
12. Staff report summarizing emergency response plan – how does it work?
3/20/18 Paulsgrove/Howell An ISR is provided in the Friday March 30 report.
13. Request for a city-wide speed limit analysis 3/20/18 Estes/Deshmukh 14. Work session on plan for downtown and homelessness 3/20/18 Kuechler

Request Request Date Staff Responsible Status
15. Information on when splash park will open 3/20/18 Behrens An update was provided in the Friday March 23 report. Tentative opening and event date of May 12.
16. Work session on water plan 3/20/18 Banks A work session will be scheduled in later April or May.
17. Request for following items to be included in Joint DISD meeting and have broad postings: 1) Policy discussion of programs with Denton PD 2) DISD’s plans for future construction, bonds, land purchases, etc, 3) School safety and SRO program, and 4) DISD Recycling/waste practices– styrofoam usage
3/27/18 Hileman/Kuechler Staff will work with Denton ISD and Legal to draft a broad agenda for joint luncheon meeting on May 7.
18. ISR on percentage of recyclables sent to China and information on buyers of our recyclables
3/27/18 Cox/Barnett An ISR is being prepared on this item and next two items.
19. Update on recycling options being explored for multi-family properties
3/27/18 Cox/Barnett
20. Report on styrofoam disposal and volumes 3/27/18 Cox/Barnett 21. Inquiry for parking in downtown and potential DATCU
property on Mulberry 3/27/18 Booth
22. Work session with a broad posting to discuss Red Light Camera program, contract, traffic signal management, and intersection safety
3/27/18 Deshmukh/Fletcher A work session is tentatively scheduled for April 24.
23. Update on McKinney St project and TxDOT fund restrictions
3/27/18 Estes/Nelson An update is provided in the Friday March 30 report.
24. Update on hiring a Bike & Pedestrian Coordinator 3/27/18 Deshmukh An update is provided in the Friday March 30 report.
25. Include a copy of wastewater/drainage fee ordinance in Friday report
3/27/18 Banks
26. Inquiry on intersection timing at Hickory and Carroll , short for pedestrian crossing?
3/27/18 Deshmukh An update will be provided in the Friday April 6 report.
27. Include a printed copy of the new proposed zoning map in Friday report
3/27/18 McDonald
28. DDC - Request for outreach & collaboration with residents impacted, including neighborhood planning for a new historic register in CM Briggs’ district
3/27/18 McDonald

City Council
City of Denton
Meeting Agenda
City Hall
215 E. McKinney St.
Denton, Texas 76201
www.cityofdenton.com
Work Session Room12:00 PMTuesday, April 10, 2018
After determining that a quorum is present, the City Council of the City of Denton, Texas will convene in a
Work Session on Tuesday, April 10, 2018 at 12:00 p.m. in the Council Work Session Room at City Hall, 215
E. McKinney Street, Denton, Texas at which the following items will be considered:
1. Citizen Comments on Consent Agenda Items
This section of the agenda allows citizens to speak on Consent Agenda Items only. Each speaker will be
given a total of three (3) minutes to address any items he/she wishes that are listed on the Consent Agenda.
A Request to Speak Card should be completed and returned to the City Secretary before Council considers
this item.
3. Work Session Reports
Receive a report, hold a discussion, and give staff direction regarding the City’s guidelines
for public improvement districts.
ID 18-150A.
Receive a report, hold a discussion, and give staff direction regarding the City of Denton’s
special event processes, application requirements, common issues, and recommendations
for potential solutions.
ID 18-275B.
Receive a report, hold a discussion, and give staff direction regarding the potential sale of
the Hwy 77 property and reviewing site options.
ID 18-299C.
Receive a report, hold a discussion, and give staff direction regarding a policy and
application process to review housing tax credit requests.
ID 18-532D.
Receive a report, hold a discussion, and give staff direction regarding the Tree Code
policy.
ID 18-552E.
Receive a report, hold a discussion, and give staff direction regarding future direction for
Denton County Transportation Authority.
ID 18-554F.
Presentation from staff on consideration of an ordinance amending the Council Rules of
Procedure with regards to future ordinances/resolutions (approved or denied) to contain
Councilmembers names and how they voted.
ID 18-561G.
NOTE: The City Council reserves the right to adjourn into a Closed Meeting on any item on its Open Meeting
agenda consistent with Chapter 551 of the Texas Government Code, as amended, or as otherwise allowed by
law.
Following the completion of the Work Session, the City Council will convene in a Special Called Meeting to
consider the following items.
1. CONSENT AGENDA
Page 1 Printed on 3/30/2018

April 10, 2018City Council Meeting Agenda
Each of these items is recommended by the Staff and approval thereof will be strictly on the basis of the
Staff recommendations. Approval of the Consent Agenda authorizes the City Manager or his designee to
implement each item in accordance with the Staff recommendations. The City Council has received
background information and has had an opportunity to raise questions regarding these items prior to
consideration.
Listed below are bids, purchase orders, contracts, and other items to be approved under the Consent
Agenda (Agenda Items A – B). This listing is provided on the Consent Agenda to allow Council Members
to discuss or withdraw an item prior to approval of the Consent Agenda. If no items are pulled, Consent
Agenda Items A – B below will be approved with one motion. If items are pulled for separate discussion,
they may be considered as the first items following approval of the Consent Agenda.
Conduct the second of two readings and consider adoption of an ordinance of the City of
Denton for a voluntary annexation of approximately 0.30 acres of land generally located
on the east side of Old Alton Road, south of the intersection of Old Alton Road and
Teasley Lane by the City of Denton, Texas.
A17-0006dA.
Consider adoption of an ordinance of the City of Denton, Texas approving and
authorizing the City Manager to execute an Interlocal Cooperation Agreement between
the City of Denton and Denton County to construct and install a bike lane on Hercules
from Sherman to Locust.
ID 18-339B.
2. ITEMS FOR INDIVIDUAL CONSIDERATION
Consider adoption of an ordinance of the City of Denton, Texas amending the Fiscal Year
2017-18 Budget and Annual Program of Services of the City of Denton to allow for
increases to: (A) the General Fund of $951,800 for the purpose of funding police facility
and park improvement projects, (B) the Park Development Trust Fund of $288,000 for
the purpose of funding park property enhancements, and (C) the Capital Improvement
Program of $8,263,619 for the purpose of funding drainage, police facility, streets and
parks capital projects; declaring a municipal purpose; providing a severability clause;
providing an open meetings clause; and providing for an effective date.
ID 18-559A.
3. CONCLUDING ITEMS
A. Under Section 551.042 of the Texas Open Meetings Act, respond to inquiries from the City Council
or the public with specific factual information or recitation of policy, or accept a proposal to place the
matter on the agenda for an upcoming meeting AND Under Section 551.0415 of the Texas Open
Meetings Act, provide reports about items of community interest regarding which no action will be taken,
to include: expressions of thanks, congratulations, or condolence; information regarding holiday schedules;
an honorary or salutary recognition of a public official, public employee, or other citizen; a reminder about
an upcoming event organized or sponsored by the governing body; information regarding a social,
ceremonial, or community event organized or sponsored by an entity other than the governing body that
was attended or is scheduled to be attended by a member of the governing body or an official or employee
of the municipality; or an announcement involving an imminent threat to the public health and safety of
people in the municipality that has arisen after the posting of the agenda.
C E R T I F I C A T E
Page 2 Printed on 3/30/2018
April 10, 2018City Council Meeting Agenda
I certify that the above notice of meeting was posted on the bulletin board at the City Hall of the City of
Denton, Texas, on the ________day of ___________________, 2018 at ________o'clock (a.m.) (p.m.)
__________________________________________CITY SECRETARY
NOTE: THE CITY OF DENTON CITY COUNCIL WORK SESSION ROOM IS ACCESSIBLE IN
ACCORDANCE WITH THE AMERICANS WITH DISABILITIES ACT. THE CITY WILL PROVIDE
SIGN LANGUAGE INTERPRETERS FOR THE HEARING IMPAIRED IF REQUESTED AT LEAST 48
HOURS IN ADVANCE OF THE SCHEDULED MEETING. PLEASE CALL THE CITY
SECRETARY'S OFFICE AT 349-8309 OR USE TELECOMMUNICATIONS DEVICES FOR THE
DEAF (TDD) BY CALLING 1-800-RELAY-TX SO THAT A SIGN LANGUAGE INTERPRETER CAN
BE SCHEDULED THROUGH THE CITY SECRETARY’S OFFICE.
Page 3 Printed on 3/30/2018
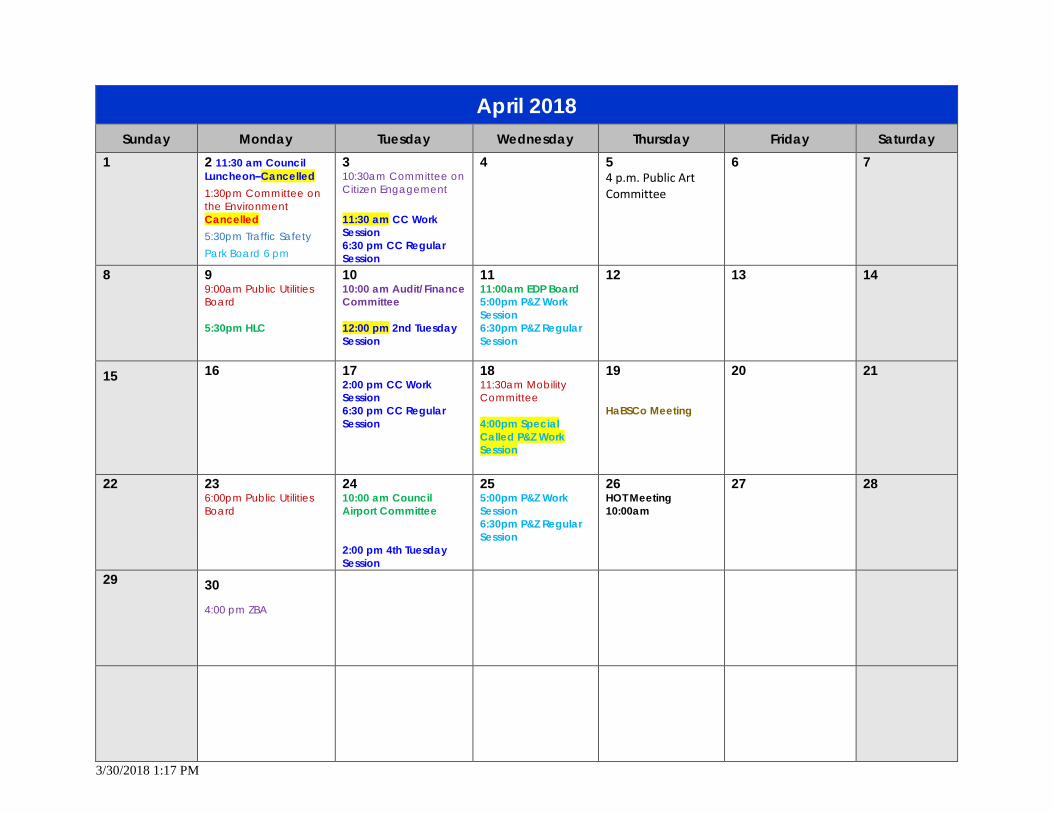
3/30/2018 1:17 PM
April 2018 Sunday Monday Tuesday Wednesday Thursday Friday Saturday
1 2 11:30 am Council Luncheon–Cancelled 1:30pm Committee on the Environment Cancelled 5:30pm Traffic Safety Park Board 6 pm
3 10:30am Committee on Citizen Engagement 11:30 am CC Work Session 6:30 pm CC Regular Session
4 5 4 p.m. Public Art Committee
6 7
8 9 9:00am Public Utilities Board 5:30pm HLC
10 10:00 am Audit/Finance Committee 12:00 pm 2nd Tuesday Session
11 11:00am EDP Board 5:00pm P&Z Work Session 6:30pm P&Z Regular Session
12 13 14
15 16 17 2:00 pm CC Work Session 6:30 pm CC Regular Session
18 11:30am Mobility Committee 4:00pm Special Called P&Z Work Session
19 HaBSCo Meeting
20 21
22 23 6:00pm Public Utilities Board
24 10:00 am Council Airport Committee 2:00 pm 4th Tuesday Session
25 5:00pm P&Z Work Session 6:30pm P&Z Regular Session
26 HOT Meeting 10:00am
27 28
29 30
4:00 pm ZBA

3/30/2018 1:17 PM
May 2018 Sunday Monday Tuesday Wednesday Thursday Friday Saturday
1 2:00 pm CC Work Session 6:30 pm CC Regular Session
2 3 4 p.m. Public Art Committee
4 5
6 7 9:00am Public Utilities Board (revisit the time) 11:30 am Joint Council/DISD Luncheon Meeting 1:30pm Committee on the Environment 5:30pm Traffic Safety Park Board TOUR 5 pm Commission
8 2:00 pm 2nd Tuesday Session
9 11:00am EDP Board 5:00pm P&Z Work Session 6:30pm P&Z Regular Session
10 11 12
13 14 5:30pm HLC
15 Election Meeting
16 17 HaBSCo Meeting
18 19
20 21 6:00pm Public Utilities Board 4:00 pm ZBA
22 2:00 pm CC Work Session 6:30 pm CC Regular Session
23 5:00pm P&Z Work Session 6:30pm P&Z Regular Session
24 25 26
27 28 Memorial Day - City Holiday
29 No Council Meeting
30 31
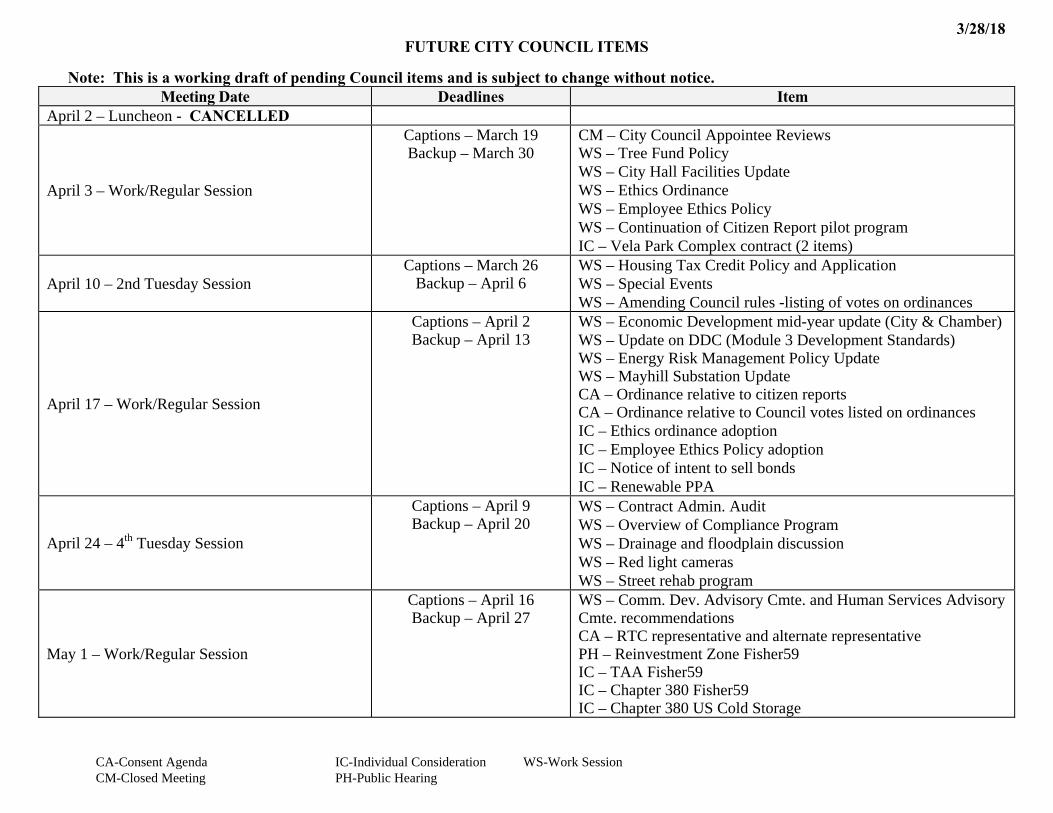
CA-Consent Agenda IC-Individual Consideration WS-Work Session CM-Closed Meeting PH-Public Hearing
3/28/18 FUTURE CITY COUNCIL ITEMS
Note: This is a working draft of pending Council items and is subject to change without notice.
Meeting Date Deadlines ItemApril 2 – Luncheon - CANCELLED
April 3 – Work/Regular Session
Captions – March 19 Backup – March 30
CM – City Council Appointee Reviews WS – Tree Fund Policy WS – City Hall Facilities Update WS – Ethics Ordinance WS – Employee Ethics Policy WS – Continuation of Citizen Report pilot program IC – Vela Park Complex contract (2 items)
April 10 – 2nd Tuesday Session Captions – March 26
Backup – April 6 WS – Housing Tax Credit Policy and Application WS – Special Events WS – Amending Council rules -listing of votes on ordinances
April 17 – Work/Regular Session
Captions – April 2 Backup – April 13
WS – Economic Development mid-year update (City & Chamber) WS – Update on DDC (Module 3 Development Standards) WS – Energy Risk Management Policy Update WS – Mayhill Substation Update CA – Ordinance relative to citizen reports CA – Ordinance relative to Council votes listed on ordinances IC – Ethics ordinance adoption IC – Employee Ethics Policy adoption IC – Notice of intent to sell bonds IC – Renewable PPA
April 24 – 4th Tuesday Session
Captions – April 9 Backup – April 20
WS – Contract Admin. Audit WS – Overview of Compliance Program WS – Drainage and floodplain discussion WS – Red light cameras WS – Street rehab program
May 1 – Work/Regular Session
Captions – April 16 Backup – April 27
WS – Comm. Dev. Advisory Cmte. and Human Services Advisory Cmte. recommendations CA – RTC representative and alternate representative PH – Reinvestment Zone Fisher59 IC – TAA Fisher59 IC – Chapter 380 Fisher59 IC – Chapter 380 US Cold Storage

CA-Consent Agenda IC-Individual Consideration WS-Work Session CM-Closed Meeting PH-Public Hearing
Meeting Date Deadlines Item
May 7 – Luncheon Captions – April 23 Backup – May 3
Joint Meeting with DISD
May 8 – 2nd Tuesday Session Captions – April 23 Backup – May 4
May 15 – Election Meeting Captions – April 30 Backup – May 11 Installation of CC Members Only
May 22 – Work/Regular Session Captions – May 7 Backup – May 18
May 29 – No Meeting Memorial Day holiday observed- City Offices closed 5/28
June 4 – Luncheon Captions – May 21 Backup – May 31
WS – Department Budget Presentations WS – Teen Council update
June 5 – Work/Regular Session Captions – May 21 Backup – June 1
WS – Preliminary Budget Discussion WS – Department Budget Presentations IC – Comm. Dev. 2018/19 Action Plan
June 12 – 2nd Tuesday Session Captions – May 25 Backup – June 8
USCM, Boston, 6/8-6/11 WS – Department Budget Presentations
June 19 – Work/Regular Session Captions – June 4 Backup – June 15
TCMA, Galveston, 6/21-24 WS – Department Budget Presentations
June 26 – 4th Tuesday Session Captions – June 11 Backup – June 22
WS – Department Budget Presentations
July 2 – No Luncheon July 3 – No Meeting July 4th holiday observed – City Offices closed July 10 – No Meeting
July 17 – Work/Regular Session Captions – July 2 Backup – July 13
WS – 2nd Preliminary Budget Discussion WS – Department Budget Presentations IC – EDP Board nominating committee
July 24 – 4th Tuesday Session Captions – July 9 Backup July 20
WS – Department Budget Presentations WS – Chamber ED contract
July 31 – No Meeting
August 2 – Budget Workshop Captions – July 16 Backup – July 27
August 6 – Luncheon Captions – July 23 Backup – August 2
WS – Department Budget Presentations
August 7 – Work/Regular Session Captions – July 23 Backup – August 3
WS – Department Budget Presentations WS – Budget Workshop
August 14 – 2nd Tuesday Session Captions – July 30 Backup – August 10
WS – Budget Workshop

CA-Consent Agenda IC-Individual Consideration WS-Work Session CM-Closed Meeting PH-Public Hearing
Meeting Date Deadlines Item
August 21 – Work/Regular Session Captions – August 6 Backup – August 17
WS – Budget Workshop IC – Chamber ED contract
August 28 – 4th Tuesday Session Captions – August 13 Backup – August 24
WS – Budget Workshop PH – 1st Public Hearing on the Tax Rate
September 3 – No Luncheon Labor Day holiday September 4 – No Meeting
September 11–Special Called Work/Regular Session
Captions – August 27 Backup – September 7
WS – Budget Workshop PH – 2nd Public Hearing on the Tax Rate PH – Public Hearing on the Budget
September 18 – Work/Regular Session Captions – August 31 Backup – September 14
WS – Budget Workshop IC – Adoption of Budget
September 25 – 4th Tuesday Session Captions – September 10 Backup – September 21
October 1 – Luncheon Captions – September 17 Backup – September 27
October 2 – No Meeting National Night Out
October 9 – 2nd Tuesday Meeting Captions – September 24 Backup – October 5
TML, Fort Worth, 10/9-10/12
October 16 – Work/Regular Session Captions – October 1 Backup – October 12
October 23 – 4th Tuesday Session Captions – October 8 Backup – October 19
WS – Stoke annual report
October 30 – No Meeting
November 5 – Luncheon Captions – October 22 Backup – November 1
November 6 – Work/Regular Session Captions – October 22 Backup – November 2
NLC, Los Angeles, 11/7-11/10 IC – Stoke contract renewal
November 13 – 2nd Tuesday Session Captions – October 29 Backup – November 9
November 20 – No Meeting Thanksgiving Holiday observed–City Offices Closed 11/22-23
November 27 – 4th Tuesday Session Captions – November 12 Backup – November 21 Tentative-Based on Need
December 3 – Luncheon Captions – November 19 Backup – November 29
December 4 – Work/Regular Session Captions – November 19 Backup – November 30
December 11 – 2nd Tuesday Session Captions – November 26 Backup – December 7

CA-Consent Agenda IC-Individual Consideration WS-Work Session CM-Closed Meeting PH-Public Hearing
Meeting Date Deadlines Item
December 18 – Work/Regular Session Captions – December 3 Backup – December 14 Tentative-Based on Need
December 25 – No Meeting Christmas Holiday observed–City Offices Closed 12/24-25

Street/Intersection From To
Proposed Date of
Construction
Proposed Date
of Completion Brief Description of Construction Department Letters
Other
Communication
Department
Contact:
Auburn Dr. Georgetown Bowling Green 2/19/18 4/30/18Mill/Overlay (Temporary Road
Closures Possible)Streets 1/31/18 Door Hangers (940) 349-7160
Ave. A Maple Eagle 3/19/18 4/30/18 UNT 2018 Residence Hall Project Engineering 940-349-8910
Ave. C Eagle Ave C 2/20/18 3/29/18 Electric Construction Engineering (940) 349-8910
Bell St. Bell Prairie 4/5/18 4/6/18Manhole Installation
(Temporary Lane Closures)Wastewater (940) 349-7300
Belhaven St. Georgetown Bowling Green 2/19/18 4/30/18Mill/Overlay (Temporary Road
Closures Possible)Streets 1/31/18 Door Hangers (940) 349-7160
Bonnie Brae St. Multiple Multiple 7/1/17 7/31/19 Street Widening Engineering (940) 349-8910
Bonnie Brae St. Hwy 380 Intersection 3/14/18 TBD Commercial Driveway ConstructionBuilding
Inspections(940) 349-8360
Brandywine Cir. Briarwood Dead End 2/20/18 4/9/18Street Reconstruction (Temporary
Lane Closures)Streets 2/16/18 Door Hangers (940) 349-7160
Brandywine St. Briarwood Brandywine Cr. 2/20/18 4/9/18Street Reconstruction (Temporary
Lane Closures)Streets 2/16/18 Door Hangers (940) 349-7160
Brinker Rd. Medpark Loop 288 2/12/18 4/27/18Concrete Panel Repairs (Temporary
Lane Closures Possible)Streets N/A (940) 349-7160
Canterbury Ct. Hollyhill I-35 4/9/18 6/15/18Drainage Improvements (Temporary
Lane Closures Possible)Engineering (940) 349-8910
Construction Projects ReportWeek of Apr 02-08, 2018
CURRENT PROJECTS See Yellow Highlighted for Major Closures

Street/Intersection From To
Proposed Date of
Construction
Proposed Date
of Completion Brief Description of Construction Department Letters
Other
Communication
Department
Contact:
CURRENT PROJECTS See Yellow Highlighted for Major ClosuresCountry Home/Eagle
WingClear River Cul V Sac 4/9/18 5/14/18
Concrete Panel Repairs
No DetoursStreets (940) 349-7160
Egan St. Amarillo Malone 2/5/18 5/7/18Mill/Overlay (Temporary Road
Closures Possible)Streets 1/24/18 Door Hangers (940) 349-7160
Fordham Ln. Amherst Bowling Green 2/19/18 4/30/18Mill/Overlay (Temporary Road
Closures Possible)Streets 2/14/18 Door Hangers (940) 349-7160
Hickory St. Bonnie Brae N Texas 1/2/18 5/11/18Street Reconstruction (Temporary
Lane Closures)Streets 2/7/18
Door Hangers,
Public Meetings(940) 349-7160
Holiday Park Phase 2 Manhattan Kings Row 11/10/17 12/1/18 Wastewater Main Construction Wastewater 11/16/18 Door Hangers (940) 349-8489
Holiday Park Phase 2 Yellowstone Sherman 3/6/18 TBD Water Main Construction Water 2/28/18 Door Hangers (940) 349-7181
Linden Dr. Malone Ponder 3/19/18 4/27/18 Curb and Gutter Repairs Streets No Door Hangers (940) 349-7160
McKinney St. Bolivar Cedar 11/14/17 4/29/18 Parking Lot Reconstruction Engineering 11/2/17 (940) 349-8910
Mayhill Rd. US 380 Edwards 9/1/17 2/1/20Street Reconstruction (Temporary
Road Closures Possible)Engineering
1/3/18,
1/24/18Door Hangers (940) 349-8910
Mockingbird Ln. McKinney Paisley 10/23/17 4/6/18Street Reconstruction (Temporary
Road Closures Possible)Streets 10/10/17
Public Meeting,
Door Hangers(940) 349-7160
Potomac Pkwy. Shiloh Shenandoah 2/12/18 4/6/18Street Panel Repair (Temporary Lane
Closures Possible)Streets 2/6/18 Door Hangers (940) 349-7160
Prominence Pkwy. Mayhill Atlanta 1/31/18 8/31/18Water and Wastewater Crossing
(Road Closure)Engineering 1/24/18 (940) 349-8910
Riney Rd. N Elm Solana 9/29/17 7/29/18Road Removal and Replacement
(Road Closure)Engineering Yes (940) 349-8910
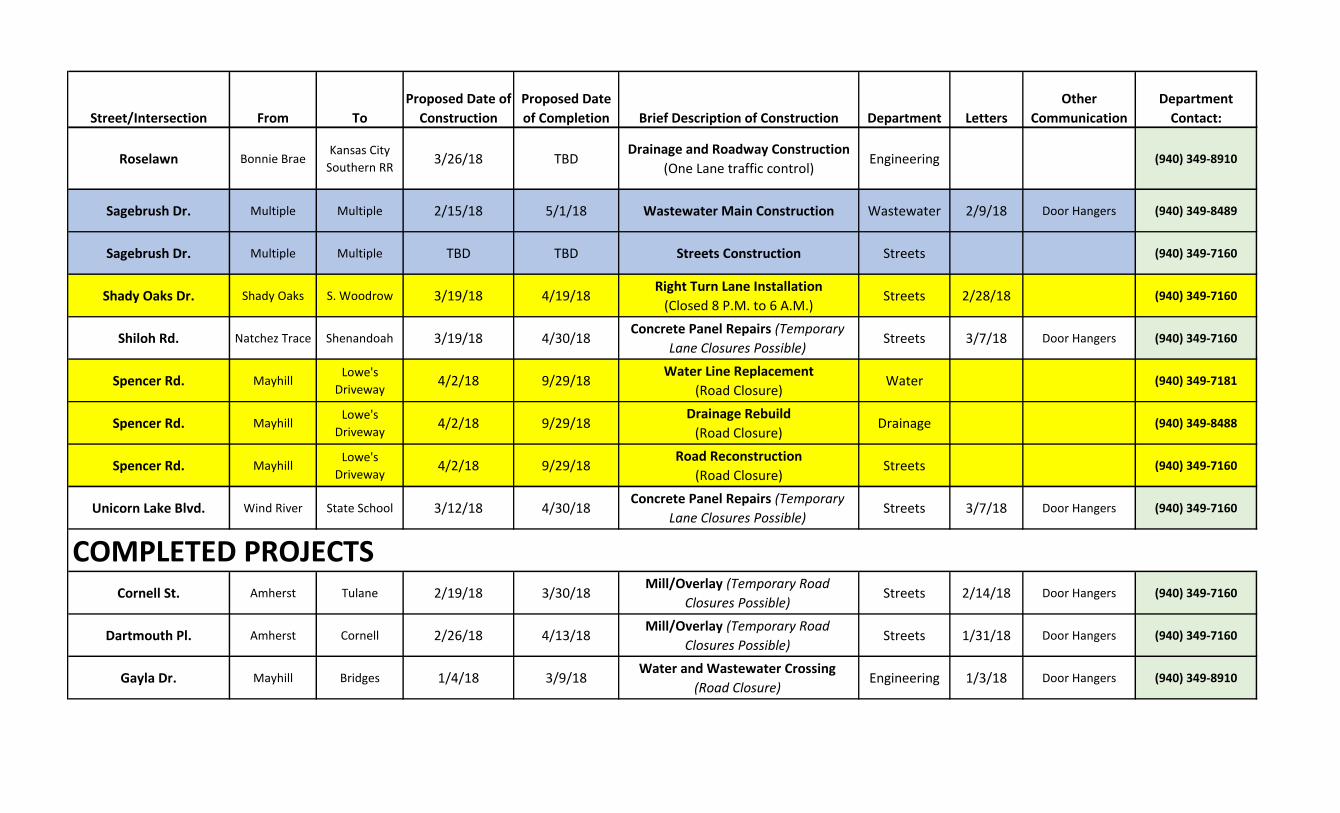
Street/Intersection From To
Proposed Date of
Construction
Proposed Date
of Completion Brief Description of Construction Department Letters
Other
Communication
Department
Contact:
CURRENT PROJECTS See Yellow Highlighted for Major ClosuresRoselawn Bonnie BraeKansas City
Southern RR3/26/18 TBD
Drainage and Roadway Construction
(One Lane traffic control)Engineering (940) 349-8910
Sagebrush Dr. Multiple Multiple 2/15/18 5/1/18 Wastewater Main Construction Wastewater 2/9/18 Door Hangers (940) 349-8489
Sagebrush Dr. Multiple Multiple TBD TBD Streets Construction Streets (940) 349-7160
Shady Oaks Dr. Shady Oaks S. Woodrow 3/19/18 4/19/18Right Turn Lane Installation
(Closed 8 P.M. to 6 A.M.)Streets 2/28/18 (940) 349-7160
Shiloh Rd. Natchez Trace Shenandoah 3/19/18 4/30/18Concrete Panel Repairs (Temporary
Lane Closures Possible)Streets 3/7/18 Door Hangers (940) 349-7160
Spencer Rd. MayhillLowe's
Driveway4/2/18 9/29/18
Water Line Replacement
(Road Closure)Water (940) 349-7181
Spencer Rd. MayhillLowe's
Driveway4/2/18 9/29/18
Drainage Rebuild
(Road Closure)Drainage (940) 349-8488
Spencer Rd. MayhillLowe's
Driveway4/2/18 9/29/18
Road Reconstruction
(Road Closure)Streets (940) 349-7160
Unicorn Lake Blvd. Wind River State School 3/12/18 4/30/18Concrete Panel Repairs (Temporary
Lane Closures Possible)Streets 3/7/18 Door Hangers (940) 349-7160
Cornell St. Amherst Tulane 2/19/18 3/30/18Mill/Overlay (Temporary Road
Closures Possible)Streets 2/14/18 Door Hangers (940) 349-7160
Dartmouth Pl. Amherst Cornell 2/26/18 4/13/18Mill/Overlay (Temporary Road
Closures Possible)Streets 1/31/18 Door Hangers (940) 349-7160
Gayla Dr. Mayhill Bridges 1/4/18 3/9/18Water and Wastewater Crossing
(Road Closure)Engineering 1/3/18 Door Hangers (940) 349-8910
COMPLETED PROJECTS

Street/Intersection From To
Proposed Date of
Construction
Proposed Date
of Completion Brief Description of Construction Department Letters
Other
Communication
Department
Contact:
CURRENT PROJECTS See Yellow Highlighted for Major ClosuresGober St. Linden Cordell 1/24/18 3/30/18Mill/Overlay (Temporary Road
Closures Possible)Streets 1/9/18 Door Hangers (940) 349-7160
Grace Temple Ave. Fulton Ponder 2/5/18 3/30/18Mill/Overlay (Temporary Road
Closures Possible)Streets 1/31/18 Door Hangers (940) 349-7160
Hickory Creek Rd. Teasley Riverpass 3/12/18 3/30/18 Base Failure Repairs Streets N/A (940) 349-7160
La Mirada/Zilda Way Manten Ponder 3/12/18 4/2/18Sidewalk Repairs (Temporary Lane
Closures Possible)Streets No Door Hangers (940) 349-7160
Londonderry Ln. Teasley Westminster 2/1/18 3/9/18Drainage Improvements (Temporary
Lane Closures Possible)Drainage 10/16/17 (940) 349-7116
Lookout Ln. Windsor Westward 1/29/18 3/26/18Sidewalk Repairs (Temporary Lane
Closures Possible)Streets No Door Hangers (940) 349-7160
Malone St. Auburn Dead End 2/14/18 3/30/18Mill/Overlay (Temporary Road
Closures Possible)Streets 1/31/18 Door Hangers (940) 349-7160
Paisley Ln. Frame Ruddell 12/20/17 3/16/18 Water Main Construction Water 11/15/17 Door Hangers (940) 349-7181
Windriver Dr. Loon Lake Teasley 1/22/18 3/30/18Sidewalk Repairs (Temporary Lane
Closures Possible)Streets
HOA
1/11/18(940) 349-7160
Cape Town Desert Willow Bishop Pine Summer 2018 TBDStreet Panel Repair
(No detours)Streets (940) 349-7160
Fulton St. TBD TBD Water, Wastewater, and Streets Multiple
Hettie St. TBD TBD Water, Wastewater, and Streets Multiple
Hinkle Dr. TBD TBDWater, Wastewater, Drainage, and
StreetsMultiple
UPCOMING PROJECTS

Street/Intersection From To
Proposed Date of
Construction
Proposed Date
of Completion Brief Description of Construction Department Letters
Other
Communication
Department
Contact:
CURRENT PROJECTS See Yellow Highlighted for Major ClosuresLondonderry Ln. Teasley Westminster 9/1/18 TBDStreet Improvements (Temporary
Lane Closures Possible)Streets (940) 349-7160
Malone St. Crescent Westminster Summer 2018 Water Main Construction Water (940) 349-7181
PEC 4 - Engineering In Design Installing Underground Box Culvert Engineering (940) 349-8910
Smith-Johnson Summer 2018Water, Wastewater, Drainage, and
StreetsEngineering (940) 349-8910
Thomas St. TBD TBD Water, Wastewater, and Streets Multiple
Welch St. Mulberry Chestnut TBD TBD UNT 2018 CVAD Project Engineering 3/19/18 3/30/2018 (940) 349-8910
Wayne St. TBD TBD Water, Wastewater, and Streets Multiple
Windsor Dr. TBD TBDWater, Wastewater, Drainage, and
StreetsEngineering (940) 349-8910