Citizen Survey 2015 - Dundee · 8.12 Internet access ... This report represents and discusses the...
346
Prepared by: Prepared for: Research Resource 17b Main Street Cambuslang G72 7EX Dundee City Council 21 City Square Dundee DD1 3BY Contact: Lorna Shaw Contact: Jill Brash Tel: 0141 641 6410 E-mail: [email protected] Tel : 01382 433224 E-mail: [email protected] Citizen Survey 2015 Research Report November 2015
Transcript of Citizen Survey 2015 - Dundee · 8.12 Internet access ... This report represents and discusses the...

North
Prepared by: Prepared for:
Research Resource 17b Main Street Cambuslang G72 7EX
Dundee City Council 21 City Square Dundee DD1 3BY
Contact: Lorna Shaw Contact: Jill Brash
Tel: 0141 641 6410 E-mail: [email protected]
Tel : 01382 433224 E-mail: [email protected]
Citizen Survey 2015 Research Report
November 2015

Dundee City Council
Citizen Survey 2015 Contents EXECUTIVE SUMMARY ................................................................................................................... 4 1. INTRODUCTION, BACKGROUND AND OBJECTIVES .............................................................. 7
1.1 Introduction .......................................................................................................................... 7 1.2 Objectives ............................................................................................................................ 7 1.3 Methodology ........................................................................................................................ 7 1.4 Interviewing and quality control ............................................................................................ 8 1.5 Data analysis ....................................................................................................................... 8 1.6 Presentation and Interpretation of Results ........................................................................... 9 1.7 Report structure ................................................................................................................... 9
2. THE HOME AND NEIGHBOURHOOD ..................................................................................... 10 2.1 Length of stay in neighbourhood (Q3) ................................................................................ 10 2.2 Best aspects of neighbourhood (Q1) ................................................................................. 11 2.3 Worst aspects of neighbourhood (Q2) ............................................................................... 13 2.4 Change in the neighbourhood (Q4/5) ................................................................................. 14 2.5 Length of stay in house (Q7) .............................................................................................. 17 2.6 Tenure (Q8) ....................................................................................................................... 17 2.7 Satisfaction with the home (Q9) ......................................................................................... 18
3. LOCAL AREA AND SERVICES ................................................................................................ 19 3.1 Satisfaction with and ease of accessing local services (Q10/11)........................................ 19 3.2 Satisfaction with neighbourhood as a place to live in (Q6) ................................................. 23 3.3 Neighbourhood quality of life (Q13) ................................................................................... 24 3.4 Dundee quality of life (Q14) ............................................................................................... 25 3.5 Providing voluntary/ unpaid help (Q16/17) ......................................................................... 25 3.6 Community activities (Q14/15) .......................................................................................... 26 3.7 Cultural activities and events (Q18) ................................................................................... 28 3.8 Reasons for not taking part in community activities, organisations or events (Q19) ........... 29 3.9 Influencing decisions (Q20a/b) .......................................................................................... 29
4. HEALTH ................................................................................................................................... 31 4.1 Registered with GP or health centre/ dentist (Q21) ............................................................ 31 4.2 Rating of health overall (Q22) ............................................................................................ 32 4.3 Moderate physical activity (Q23) ........................................................................................ 33 4.4 Smoking habit (Q24) .......................................................................................................... 34 4.5 Alcohol consumption (Q25) ................................................................................................ 35 4.6 Statements about mental wellbeing (Q26) ......................................................................... 36 4.7 Being treated fairly (Q27) ................................................................................................... 39 4.8 Support network (Q28) ...................................................................................................... 40
5. EDUCATION ............................................................................................................................ 41 5.2 Type of qualification (Q30) ................................................................................................. 42
6. COMMUNITY SAFETY ............................................................................................................. 43 6.1 Safety in the neighbourhood (Q31) .................................................................................... 43 6.2 Safety during the day and at night (Q32) .......................................................................... 44 6.3 Change in the level of crime (Q33/34) ............................................................................... 45 6.4 Factors which contribute to crime level (Q35) .................................................................... 47 6.5 Extent to which fear of crime prevents them from taking part in everyday activities (Q36) . 48
7. MONEY MATTERS .................................................................................................................. 49 Research Resource Dundee City Council 2

7.1 Bank or building society account and Contents Insurance (Q37/38) .................................. 49 7.2 Total value of savings (Q39) .............................................................................................. 50 7.3 Financial difficulties (Q40 ................................................................................................... 51 7.4 Financial management (Q41) ............................................................................................ 52
8. CONTACTING YOUR COUNCIL .............................................................................................. 53 8.1 Reason for contact (Q42) .................................................................................................. 53 8.2 Method of contact (Q47) .................................................................................................... 53 8.3 Satisfaction with responding to complaints (Q43) .............................................................. 53 8.4 Satisfaction with responding to information requests (Q44) ............................................... 54 8.5 Satisfaction with responding to service requests (Q45) ...................................................... 54 8.6 Experience of contacting the Council (Q46) ....................................................................... 55 8.7 Satisfaction with telephone contact (Q48) .......................................................................... 55 8.8 Satisfaction with office contact (Q49) ................................................................................. 56 8.9 Satisfaction with written/ email contact (Q50)..................................................................... 56 8.10 Satisfaction with visiting the website (Q51/52) ................................................................... 56 8.11 Amount of information provided about the Council and its services (Q53) ......................... 57 8.12 Internet access (Q54) ........................................................................................................ 57 8.13 Vulnerable Adults (Q55) .................................................................................................... 58
9. VIEWS ABOUT THE COUNCIL ................................................................................................ 59 9.1 Statements about the Council - most important (Q56) ...................................................... 59 9.2 Agreement with statements about the Council (Q57) ......................................................... 61
10. HOUSEHOLD DETAILS ........................................................................................................... 63 10.1 Number of adults/ children (Q58) ....................................................................................... 63 10.2 Ages of children (Q59) ....................................................................................................... 63 10.3 Access to personal transport (Q61) ................................................................................... 63 10.4 Ethnicity (Q65) ................................................................................................................... 64 10.5 Health and disability status (Q62/63) ................................................................................. 65 10.6 Religion (Q64) ................................................................................................................... 65 10.7 Income (Q66) ..................................................................................................................... 66
Appendix 1 ....................................................................................................................................... 67 West End ..................................................................................................................................... 68 Maryfield ...................................................................................................................................... 88 The Ferry ................................................................................................................................... 108 Coldside ..................................................................................................................................... 128 Lochee ....................................................................................................................................... 148 East End .................................................................................................................................... 168 North East .................................................................................................................................. 188 Strathmartine ............................................................................................................................. 208 Ardler, St Mary and Kirkton ........................................................................................................ 228 Beechwood, Lochee, Menzieshill and Charleston ...................................................................... 248 Coldside and Maryfield............................................................................................................... 268 Fintry, Whitfield and Mill O Mains ............................................................................................... 288 Mid Craigie, Linlathen and Douglas ........................................................................................... 308
Appendix 2 ..................................................................................................................................... 328 Appendix 3 ..................................................................................................................................... 344
Research Resource Dundee City Council 3

EXECUTIVE SUMMARY INTRODUCTION
This report represents and discusses the findings to emerge from Dundee City Council’s Citizen Survey 2015. This survey has also been carried out for a number of years previously, most recently in 2014. The specific research objectives of the 2015 Citizen Survey were as follows. To establish the public’s views on general and specific aspects of life in Dundee, including:
o The home and neighbourhood o Health o Education and employment o Community safety o Financial issues.
To establish levels of satisfaction with public services To establish the customer experience when contacting the Council To strengthen the evidence base which will support and inform the development of Dundee’s
Single Outcome Agreement. A total of 1817 interviews were carried out with a representative sample of Dundee residents. The sample structure was designed to replicate the sampling methodology and structure utilised in the previous survey. This involved a disproportionate sampling methodology where: 800 interviews were completed with the general population of Dundee (100 in each of the 8
wards) 1,000 interviews were carried out within community regeneration areas (200 in each of the 5
regeneration areas) The following summarises the key findings under each of the research themes, noting significant changes that have been seen over the last 3 years of surveys since 2012. Subsequent chapters of the report analyse this in further detail.
KEY FINDINGS
The best aspects of living in the neighbourhood have remained consistent over the last 4 years with the neighbourhood being quiet and peaceful and the neighbours being the top two reasons provided. Similarly, the majority of respondents, as has been the case over the last 4 years, believed that there has been no change in the neighbourhood.
With regard to the local area and services, satisfaction has remained consistently high, maintaining satisfaction levels in the high 90%’s with the exception of local youth facilities (83%).
When thinking about the accessibility of local services, again, the level of accessibility of universal services such as the fire service, local health service, local shops, police service and refuse collection have remained consistently high with almost all respondents stating they find it easy to access these. At the other end of the scale, accessibility of services falls, as may be expected, when it comes to services which are not universal such as the community warden service, social care and social work services and local youth facilities. Access to local phone boxes, social care/ social work services, local youth facilities, local schools and community wardens have seen a decrease since 2014.
Satisfaction with the neighbourhood in terms of the physical environment has remained fairly consistent since 2012.
Research Resource Dundee City Council 4

Quality of life in the neighbourhood has remained consistently high, maintaining the overall satisfaction levels since 2012. However, the proportion of respondents who were very satisfied with the quality of life in their neighbourhood has decreased from 73% in 2014 to 61% in 2015. This trend was also seen in the question which asked respondents about the quality of life in Dundee with 72% of respondents being very satisfied in 2014 to 62% in 2015.
When asked about their participation profile, the levels of volunteering has decreased from 9% in 2014 to 8% in 2015.
40% of respondents felt that they could influence decisions affecting their local area. The proportion of respondents who felt they could influence decisions affecting their local area has increased by 3 percentage points since the 2012 survey.
In relation to health, whilst there has been a marginal variance in self-reported health over the last 3 years, this variation has not been statistically significant, with the underlying trend since 2012 rising only 2 percentage points.
The proportion of respondents who stated that they have never smoked has been subject to marginal variance since 2012, however the trend has seen no significant change since 2012.
Feelings of safety in the neighbourhood have remained fairly consistent, with respondents most likely to feel safe walking alone in their neighbourhood during the day, and in their home at night. The results have not changed significantly when compared to those reported in 2012, varying by no more than 3 percentage points. In terms of walking alone at night, the proportion of respondents stating that they feel safe has increased by 11 percentage points since the 2012 survey.
The vast majority of respondents were of the opinion that the amount of crime has remained the same over the last year. This has decreased from 73% in 2012 to 70% in 2015.
In terms of financial profile, the proportion of respondents who have a bank or building society account has not seen any significant change since 2012, with the vast majority of respondents having a bank or building society account. However, there has been a significant increase in the proportion of respondents reporting that they have home contents insurance (rising from 70% in 2012 to 78% in 2015).
When considering financial management, the proportion of respondents who said their household is managing quite well or very well has increased significantly from 42% in 2012 to 56% in 2015 (this question was introduced in 2012). The biggest financial concerns for respondents were the cost of food and domestic energy bills. However the proportion of respondents stating that they were having difficulty in affording these has continued to decrease from 2012 to 2015.
In relation to the method of contact used when respondents are contacting the Council over the last year, the majority have contacted the Council by telephone over the four year period.
Satisfaction with the contact has increased in relation to complaints where there has been a significant increase in satisfaction rising from 40% in 2012 to 70% in 2015. However, satisfaction with the response to service requests has remained consistent with the findings from 2012, while satisfaction with information requests has decreased from 91% in 2012 to 89% in 2014.
When asked to consider their priorities for the Council, there has been some variance in relation to the extent to which they are priorities. However, three out of four of the top priorities reported in 2015 have remained consistent since 2012; providing an efficient service, providing services which are value for money and providing a good quality service. Tackling important issues for the future of the area and ensuring sustainable use of resources and care for the
Research Resource Dundee City Council 5

environment have both seen an increase in priority since 2012 (increased by 15 and 7 percentage points respectively). On the other hand, having friendly, polite, helpful, well informed employees and promoting its services well have both decreased in priority (decreased by 12 and 5 percentage points respectively).
Research Resource Dundee City Council 6

1. INTRODUCTION, BACKGROUND AND OBJECTIVES
1.1 Introduction
This report represents and discusses the findings to emerge from Dundee City Council’s Citizen Survey 2015 which was undertaken by Research Resource. This survey has also been carried out for a number of years previously, most recently in 2014.
1.2 Objectives
The specific research objectives of the 2015 Citizen Survey were as follows. To establish the public’s views on general and specific aspects of life in Dundee, including:
o The home and neighbourhood o Health o Education and employment o Community safety o Financial issues.
To establish levels of satisfaction with public services To establish the customer experience when contacting the Council To strengthen the evidence base which will support and inform the development of Dundee’s
Single Outcome Agreement.
1.3 Methodology A total of 1817 interviews were carried out with a representative sample of Dundee residents. The sample structure was designed to replicate the sampling methodology and structure utilised in the previous survey. This involved a disproportionate sampling methodology where: 800 interviews were completed with the general population of Dundee (A target of 100 in each
of the 8 wards) 1,000 interviews were carried out within community regeneration areas (200 in each of the 5
regeneration areas)
The “disproportionate” sampling approach was used previously and involves delivering the same number of interviews in each Ward or regeneration area, regardless of the actual population size of the area. This ensures the data for each Ward or regeneration area can be directly compared (with the same level of accuracy). The “disproportionate” aspect is eliminated in the results by applying appropriate statistical reweighting to balance survey data to be reflective of the entire population. Within each area, a random sample was drawn to ensure coverage across each area. Interviewing was scheduled over day time, evening and weekends to ensure all segments of the working and non working population had the opportunity to participate.
Research Resource Dundee City Council 7

The table below illustrates the final number of interviews achieved, by Ward, and the margin of error associated with the data collected:
Electoral Ward Sample Base 2015 Survey
Population (adults aged 16+
years)
Confidence Interval (at 95%)
Dundee City West End 101 18657 +/- 9.7% Dundee City - Maryfield 202 14499 +/- 6.9% Dundee City - The Ferry 100 16380 +/- 9.8% Dundee City - Coldside 200 17651 +/- 6.9% Dundee City - Lochee 302 15751 +/- 5.6%
Dundee City - East End 301 13243 +/- 5.6% Dundee City - North East 310 11954 +/- 5.5% Dundee City - Strathmartine 301 15429 +/- 5.6% Total Dundee 1817 123564 +/- 2.3%
The 2015 questionnaire was developed from the 2014 survey questionnaire. The 2014 questionnaire was revised and just one amendment was agreed at Q10/11, Community Centre/ Library being merged into one code as this is how the statistics are reported in the SOA.
1.4 Interviewing and quality control
All interviewing was undertaken by Research Resource’s highly trained and experienced field force, all of whom are highly experienced in undertaking customer and resident surveys for Local Authorities. Interviewing took place between the 5th October and the 6th November. All interviews were completed in accordance with our ISO20252 accredited policies and procedures and in accordance with the Market Research Society Code of Conduct. Upon completion of interviews, completed questionnaires are manually edited, checking for quality and consistency of interviews. As a further validation, 10% of each interviewers quota of interviews are checked through ‘back checking’ which involves re contacting the participant by telephone and verifying key details about the interview and ensuring that interviewers were polite, pleasant and showed identification.
1.5 Data analysis
A SNAP database was designed to conduct the data processing and analysis. SNAP Data Entry software was used to enter the data which ensures accuracy of response and reduces data entry operator error. Once the data was entered, appropriate range and logic checks were applied and open-ended questions were coded. Data tables were then produced for each of the different levels of reports required (overall Dundee level, for wards, and for regeneration areas). Due to the fact that the sample was designed on a disproportionate basis within wards, to ensure the data was representative at both Dundee and ward level, weighting figures were used during the data analysis. The data was weighted by age, gender and ward. The profile figures used in the weighting calculations were based upon Scotland’s Census 2011. In particular this was carried out in order to ensure that the results on a ward basis were proportionately represented in the results in relation to the proportion of the Dundee population who live in that ward.
Research Resource Dundee City Council 8

1.6 Presentation and Interpretation of Results This report details the findings of the survey for the Dundee Council area overall and includes some comparisons between different groups where appropriate and statistically significant. To allow for more in depth analysis at Ward and regeneration area level, separate top line reports have also been prepared for each of the multi-member ward and regeneration areas and are available under a separate cover of Appendix 2. In reading these reports, a number of points should be noted: The findings are based upon a sample of residents, rather than the whole population of Dundee
being interviewed, therefore, all results are subject to sampling tolerances. At the overall Dundee level the margin of error associated with the results is +/-2.3%. This is a body of data which should be considered robust and Dundee City Council and Dundee Partnership should have confidence in.
Results have been compared to the previous 2011, 2012 ,2013 and 2014 Dundee Citizen Surveys as appropriate, but in comparing results, it should be noted that:
o Not all differences between the 2011, 2012, 2013 and 2014 surveys will be statistically significant.
o The demographics of the area may have changed in this period. When reporting the data in this document, in general, percentages in tables have been rounded to the nearest whole number. Responses greater than 0% but less than 0.5% are shown as 0% and responses between 0.5% and less than 1% are rounded to 1%. Columns may not add to 100% because of rounding or where multiple responses to a question are possible. The total number of participants to each question is shown either as 'Base' or 'n=xxx' in the tables or charts. Where the base or 'n' is less than the total number of participants, this is because participants may be 'routed' past some questions if they are not applicable. The percentages reported are weighted percentages.
1.7 Report structure This document details the key findings to emerge from the survey. The structure of the report is as follows: CHAPTER 2. THE HOME AND NEIGHBOURHOOD CHAPTER 3. LOCAL AREA AND SERVICES CHAPTER 4. HEALTH CHAPTER 5. EDUCATION CHAPTER 6. COMMUNITY SAFETY CHAPTER 7. MONEY MATTERS CHAPTER 8. CONTACTING YOUR COUNCIL CHAPTER 9. VIEWS ABOUT THE COUNCIL CHAPTER 10. HOUSEHOLD DETAILS
Research Resource Dundee City Council 9

2. THE HOME AND NEIGHBOURHOOD
2.1 Length of stay in neighbourhood (Q3)
The majority of participants to the survey had lived in their neighbourhood for a significant period of time with half of participants stating they have lived in their current neighbourhood for more than 10 years. Compared to the previous year, the proportion of respondents stating that they have lived in their current neighbourhood for more than 10 years has fallen from 58% in 2014 to 50%.
Perhaps unsurprisingly, older participants were the most likely to have lived in their neighborhood for a greater period of time, with 90% of participants aged 65 and over having lived in their neighbourhood for more than 10 years. Significantly more participants who lived in Strathmartine (62%) had lived in their neighbourhood for more than 10 years than those who lived in West End where 32% had lived in their neighbourhood for more than 10 years.
Research Resource Dundee City Council 10

2.2 Best aspects of neighbourhood (Q1)
When asked, unprompted what they like best about their neighbourhood, the top two reasons were as was the case in 2012, 2013 and 2014, were:
Quiet/ peaceful (49%) Neighbours (27%)
Analysis by age shows that: Those aged 16-34 were the least likely to state that the best thing about living in their
neighbourhood was that it was quiet or peaceful (44%). Participants aged 55-64 were the most likely (57%).
The proportion of participants citing neighbours as the best thing about living in their neighbourhood increased with age, i.e.22% of participants aged 16-34 compared to 24% of participants aged 34-54, 30% aged 55-64 and 38% aged 65 and over.
Younger respondents were most likely to say the best thing about living in their neighbourhood was that it was a convenient location (26%), those aged 65 and over were the least likely to say this (10%).
Research Resource Dundee City Council 11

The neighbourhood being close to shops and amenities was cited more by those aged 35-54 (15%) than those aged 55-64 (9%).
Analysis by tenure reveals that: Participants that own their own home (31%) or rent their home from a registered social landlord
(34%) were the most likely to cite neighbours as being the best thing about living in their neighbourhood than those who rent from a private landlord (12%).
Owners were also significantly more likely to say their neighbourhood is quiet or peaceful (54%) than tenants who lived in private rented accommodation (40%).
More respondents who lived in private rented accommodation said the best thing about their neighbourhood was that it was a convenient location (37%). This is significantly higher than those who lived in housing rented from a registered social landlord (10%) or housing rented from the Council (14%).
Being close to the shops/ quality of shops and amenities was cited by more respondents who were Council tenants (19%) than those who owned their home (8%).
The biggest differences when analysed were as follows: Those who lived in East End (20%), Maryfield (18%) and Coldside (18%) were the most likely
to have commented on living close to shops or the quality of shops and amenities than those who lived in the West End (7%), The Ferry (7%) and the North East (9%).
Significantly more respondents who lived in the Ferry (30%) commented that the area was a pleasant or nice area to live than those who lived in Maryfield (13%) and the East End (13%).
Respondents who lived Strathmartine (56%) and the West End (59%) were more likely to say their neighbourhood was quiet or peaceful than those who lived in Maryfield (36%) and Lochee (40%).
Maryfield (36%) and the West End (32%) respondents were more likely to say their neighbourhood was a convenient location than those who lived in The Ferry (10%) and Strathmartine (9%).
Those who lived in the most deprived neighbourhoods were less likely to say the best thing about their neighbourhood was that it was a pleasant or nice area (14%) than residents who lived in all other areas (22%).
Research Resource Dundee City Council 12

2.3 Worst aspects of neighbourhood (Q2)
In terms of the worst aspects of the neighbourhood, the majority or participants stated that there was ‘nothing’ that they did not like about their neighbourhood (75%) which is consistent with the findings from 2014 (74%). The most popular responses given for those who were able to provide examples of what they disliked about their neighbourhood included, drug problems (3%) and anti-social neighbours (4%) and difficult or poor parking (3%).
Those who lived in the most deprived areas were less likely to have said there was nothing they disliked about their neighbourhood (72%) than participants who lived in all other areas (77%). Those who were aged 65 and over (79%), lived in the Ferry (82%), owned their home (78%) or rented from a private landlord (77%) were most likely to say that there was nothing they disliked about their neighbourhood.
Research Resource Dundee City Council 13
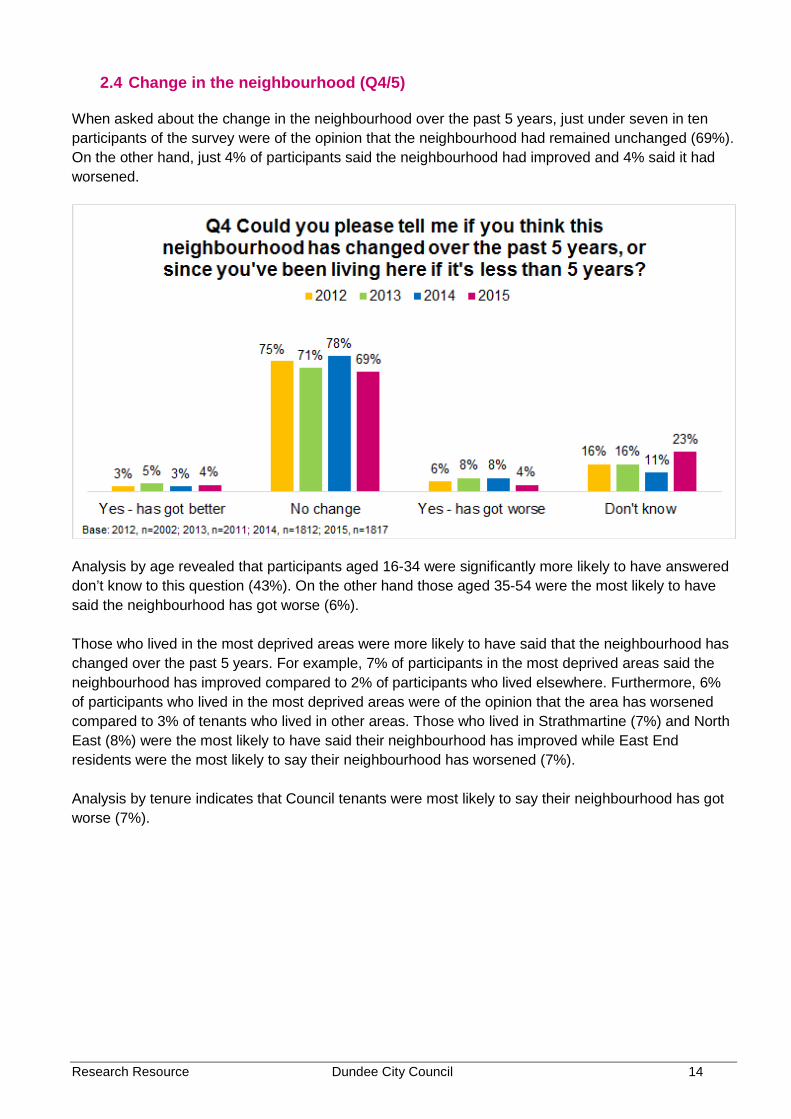
2.4 Change in the neighbourhood (Q4/5)
When asked about the change in the neighbourhood over the past 5 years, just under seven in ten participants of the survey were of the opinion that the neighbourhood had remained unchanged (69%). On the other hand, just 4% of participants said the neighbourhood had improved and 4% said it had worsened.
Analysis by age revealed that participants aged 16-34 were significantly more likely to have answered don’t know to this question (43%). On the other hand those aged 35-54 were the most likely to have said the neighbourhood has got worse (6%). Those who lived in the most deprived areas were more likely to have said that the neighbourhood has changed over the past 5 years. For example, 7% of participants in the most deprived areas said the neighbourhood has improved compared to 2% of participants who lived elsewhere. Furthermore, 6% of participants who lived in the most deprived areas were of the opinion that the area has worsened compared to 3% of tenants who lived in other areas. Those who lived in Strathmartine (7%) and North East (8%) were the most likely to have said their neighbourhood has improved while East End residents were the most likely to say their neighbourhood has worsened (7%). Analysis by tenure indicates that Council tenants were most likely to say their neighbourhood has got worse (7%).
Research Resource Dundee City Council 14

Where participants believed the neighbourhood had improved, they were asked the main reasons for feeling this way. Care should be taken when reading these percentages due to the small number of participants who stated they believed the neighbourhood had improved. The main reasons given are illustrated in the chart below and were: Quieter/ more peaceful (46%) Friendliness of people/ neighbours (14%) Cleaner/ tidier (12%)
In 2014 the top two reasons for feeling that the neighbourhood has improved were due to housing improvements and the neighbourhood being quieter or more peaceful. This was followed by the neighbourhood being cleaner or tidier.
Research Resource Dundee City Council 15

Those who stated their neighbourhood had worsened over the past 5 years were asked to explain why they felt this way. Care should be taken when reading these percentages due to the small number of participants who stated that they believed their neighbourhood to have worsened. The main reasons given were: Drug problems (43%) Undesirable people moving in (26%) Too many private lets (12%)
The problem of drugs has been the main reason for stating that the neighbourhood has worsened since 2012.
Research Resource Dundee City Council 16

2.5 Length of stay in house (Q7)
Turning now to the home, just under half of participants (46%) had lived in their home for over 10 years. This is less than 2014 where 53% had lived in their home for more than ten years.
As age increases the length of stay in the current home also increases for example, 11% of respondents aged 16-34 had lived in their current home for more than 10 years compared to 89% of respondents aged 65 and over.
2.6 Tenure (Q8)
In relation to the tenure profile, over half of participants (51%) were owner occupiers, 19% rented from the Council, 12% rented from a Housing Association and 19% rented from a private landlord. These figures are consistent with the 2014 results.
Research Resource Dundee City Council 17

2.7 Satisfaction with the home (Q9)
The vast majority of participants said the general condition of their home was very or fairly good (96%). The remaining 4% said the general condition of their home was average. The results are consistent with the findings from 2014.
The proportion of participants who were of the opinion that their home was “very good” was highest amongst those who owned their home (68%) and was lowest amongst those who lived in a privately rented property (39%). Participants who lived in North East were the most likely to be of the opinion that the condition of their home is ‘very good’ (81%). On the other hand those who live in West End were least likely to feel this way (13%).
Research Resource Dundee City Council 18
3. LOCAL AREA AND SERVICES
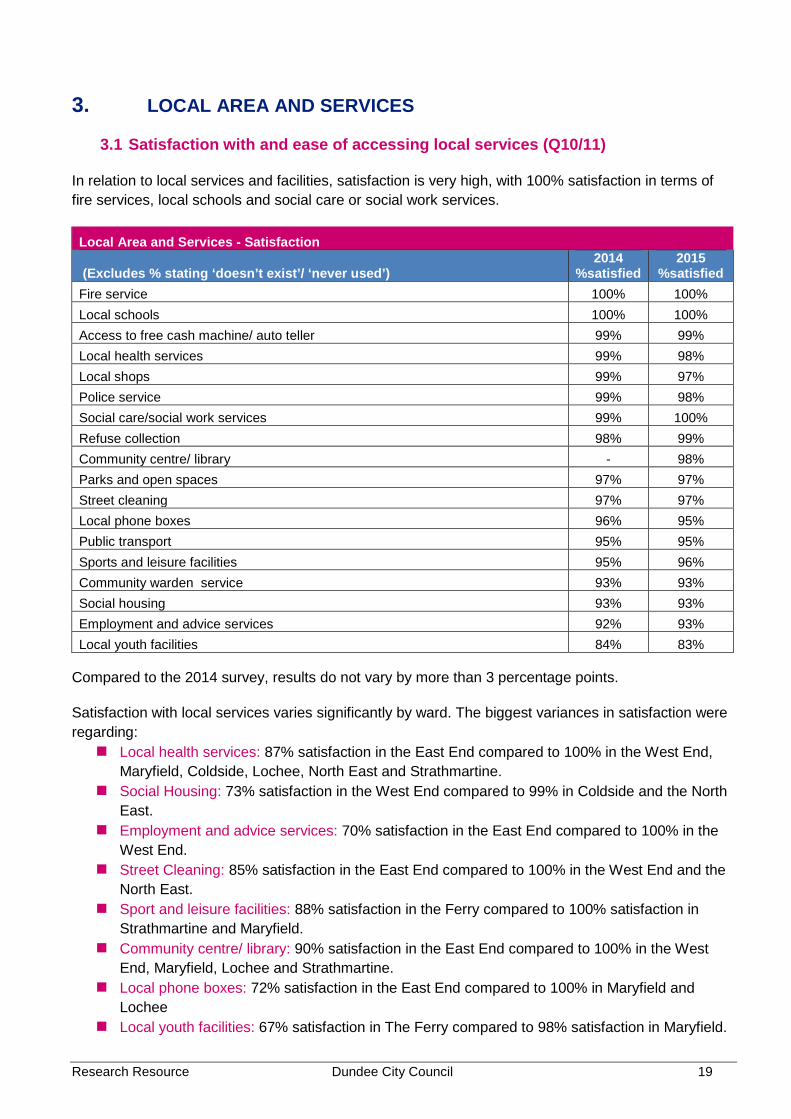
3.1 Satisfaction with and ease of accessing local services (Q10/11)
In relation to local services and facilities, satisfaction is very high, with 100% satisfaction in terms of fire services, local schools and social care or social work services.
Local Area and Services - Satisfaction
(Excludes % stating ‘doesn’t exist’/ ‘never used’) 2014
%satisfied 2015
%satisfied Fire service 100% 100% Local schools 100% 100% Access to free cash machine/ auto teller 99% 99% Local health services 99% 98% Local shops 99% 97% Police service 99% 98% Social care/social work services 99% 100% Refuse collection 98% 99% Community centre/ library - 98% Parks and open spaces 97% 97% Street cleaning 97% 97% Local phone boxes 96% 95% Public transport 95% 95% Sports and leisure facilities 95% 96% Community warden service 93% 93% Social housing 93% 93% Employment and advice services 92% 93% Local youth facilities 84% 83%
Compared to the 2014 survey, results do not vary by more than 3 percentage points.
Satisfaction with local services varies significantly by ward. The biggest variances in satisfaction were regarding: Local health services: 87% satisfaction in the East End compared to 100% in the West End,
Maryfield, Coldside, Lochee, North East and Strathmartine. Social Housing: 73% satisfaction in the West End compared to 99% in Coldside and the North
East. Employment and advice services: 70% satisfaction in the East End compared to 100% in the
West End. Street Cleaning: 85% satisfaction in the East End compared to 100% in the West End and the
North East. Sport and leisure facilities: 88% satisfaction in the Ferry compared to 100% satisfaction in
Strathmartine and Maryfield. Community centre/ library: 90% satisfaction in the East End compared to 100% in the West
End, Maryfield, Lochee and Strathmartine. Local phone boxes: 72% satisfaction in the East End compared to 100% in Maryfield and
Lochee Local youth facilities: 67% satisfaction in The Ferry compared to 98% satisfaction in Maryfield.
Research Resource Dundee City Council 19

Local shops: 87% satisfaction in the East End compared to 100% satisfaction in Maryfield and The Ferry.
Community warden service: 65% satisfaction in the West End compared to 98% satisfaction in Coldside and the East End.
Analysis by age reveals the following variances in satisfaction: Social Housing: Those aged 16-34 were the least likely to be satisfied (85%) compared to
those aged 35-54 (96%), 55-64 (95%) and 65 and over (100%). Local youth facilities: Those aged 35-54 were the least likely to be satisfied (76%) compared to
those aged 16-34 (81%), 55-64 (95%) and those aged 65 plus (91%). Community warden service: Those aged 55-64 were the least likely to be satisfied (88%)
compared to those aged 16-34 (90%), 35-54 (95%) and those aged 65 and over (98%). The biggest difference when analysed by tenure are as follows: Social housing: 60% of respondents who rented their home from a private landlord were
satisfied with social housing compared to 99% of respondents who rented their home from the Council and a registered social landlord.
Employment and advice services: 86% of respondents who rented their home from the Council were satisfied with the employment and advice services compared to 98% of respondents who owned their home.
Public Transport: 88% of respondents who rented their home from the local authority were satisfied with public transport compared to 97% of respondents who owned their home.
Community warden service: 88% of respondents who rented their home from a private landlord were satisfied with the community warden service compared to 96% of respondents who rented their home from the Council.
Research Resource Dundee City Council 20

In relation to accessibility, participants were asked how easy it was to access a range of local facilities and services. Where participants stated that they did not use a facility or where a facility was not available these respondents were included in the analysis. As shown in the table below respondents were most likely to consider, local health services , refuse collection (99%), the fire service, the police service, local shops and street cleaning (98%) to be easy to access. On the other hand services which were less likely to be easy to access included the community warden service (32%), social care/ social work services (33%), local youth facilities (35%) and local phone boxes (37%). On the other hand access to free cash/ auto teller, employment and advice services, local phone boxes, local schools, local youth facilities and social care/ social work services have seen a decrease since 2014. Local Area and services – ease of access
(Includes % stating ‘doesn’t exist’/ ‘never used’)
Ease of access to facilities and services (very/ fairly easy) 2012 2013 2014 2015
Access to free cash/ auto teller 89% 83% 97% 92%
Community Centre/ library - - - 92%
Community Warden Service 44% 43% 35% 32% Employment and advice services 53% 35% 48% 43%
Fire service 89% 97% 98% 98%
Local Health services 95% 97% 98% 99%
Local phone boxes 54% 38% 49% 37%
Local Schools 96% 70% 82% 67%
Local shops 96% 96% 98% 98%
Local youth facilities 58% 42% 46% 35%
Parks and open spaces 95% 95% 95% 94%
Police service 89% 97% 98% 98%
Public transport 94% 93% 95% 94%
Refuse collection 98% 96% 98% 99%
Social care/social work services 46% 30% 44% 33% Social housing 50% 41% 48% 47%
Sports and leisure facilities 81% 70% 78% 77%
Street cleaning 96% 89% 97% 98%
Research Resource Dundee City Council 21

Satisfaction with aspects of the neighbourhood (Q12) Satisfaction with different aspects of the neighbourhood is high, and above 90% for all aspects with the exception of the condition of road, pavements and street lighting where 81% were satisfied. The highest levels of satisfaction were in regards to: The built environment (99%) Cleanliness of the area around your home (98%) The natural environment (98%)
The results do not vary significantly when compared to the 2014 results.
Analysis by area shows that satisfaction varies most in terms of the following: Cleanliness of streets: 100% of those who lived in Maryfield were satisfied with this compared
to 87% of participants who lived in the East End. Shopping facilities: 89% satisfaction in the North East compared to 100% satisfaction in the
West End, The Ferry and Strathmartine. Condition of roads, pavements and street lighting: 71% satisfaction in Lochee compared to
88% satisfaction in the West End.
Research Resource Dundee City Council 22

3.2 Satisfaction with neighbourhood as a place to live in (Q6)
Participants were then asked to rate how satisfied they were with their neighbourhood as a place to live. 97% of respondents said their neighbourhood was a very or fairly good place to live. This is consistent with the 2014 results where 96% of participants rated their neighbourhood as a very or fairly good place to live.
Analysis by area revealed that participants who lived in The Ferry (100%) and the West End (100%) were the most satisfied with their neighbourhood. Those who lived in Lochee were the least satisfied (93%).
Analysis by tenure did not reveal any significant differences in satisfaction.
Research Resource Dundee City Council 23

3.3 Neighbourhood quality of life (Q13)
In terms of quality of life, overall satisfaction is high with almost all participants stating they were very or fairly satisfied with their quality of life in their neighbourhood (99%), compared to 1% who were dissatisfied. Overall satisfaction with the quality of life in the neighbourhood has remained consistent with the 2014 survey results.
Analysis by area reveals that participants from Strathmartine were most likely to say they were very satisfied with the quality of life of their neighbourhood (82%). On the other hand, West End residents were least likely to be very satisfied (27%). Overall, how satisfied are you with the quality of life in this neighbourhood?
West End Mary-field
The Ferry Coldside Lochee
East End
North East
Strath-martine
Base 99 200 100 197 302 297 310 301 Very satisfied 27% 71% 46% 73% 69% 51% 77% 82%
Satisfied 73% 29% 54% 26% 26% 46% 22% 16%
Dissatisfied - - - 1% 4% 2% - 2%
Very dissatisfied - - - - - - - -
Research Resource Dundee City Council 24

3.4 Dundee quality of life (Q14)
Overall satisfaction with the quality of life in Dundee is high, with all respondents (100%) stating they were very or fairly satisfied. The proportion of respondents who stated very satisfied has decreased 10 percentage points from 72% in 2014 to 62% in 2015.
3.5 Providing voluntary/ unpaid help (Q16/17)
Just under 1 in 10 respondents (8%) said they had undertaken some form of work or activity on a voluntary basis in the last 12 months. The level of volunteering was greatest within the following groups:
35-54 (9%) Owned their home (10%) Live in Coldside (11%) Have children in the household (11%)
Conversely, the incidence of volunteering was lowest in the following groups: 16-34 (6%) Rented their home from a private landlord (5%), a RSL (5%) or local authority (4%) Lived in the West End (3%) Have no children (6%)
Research Resource Dundee City Council 25
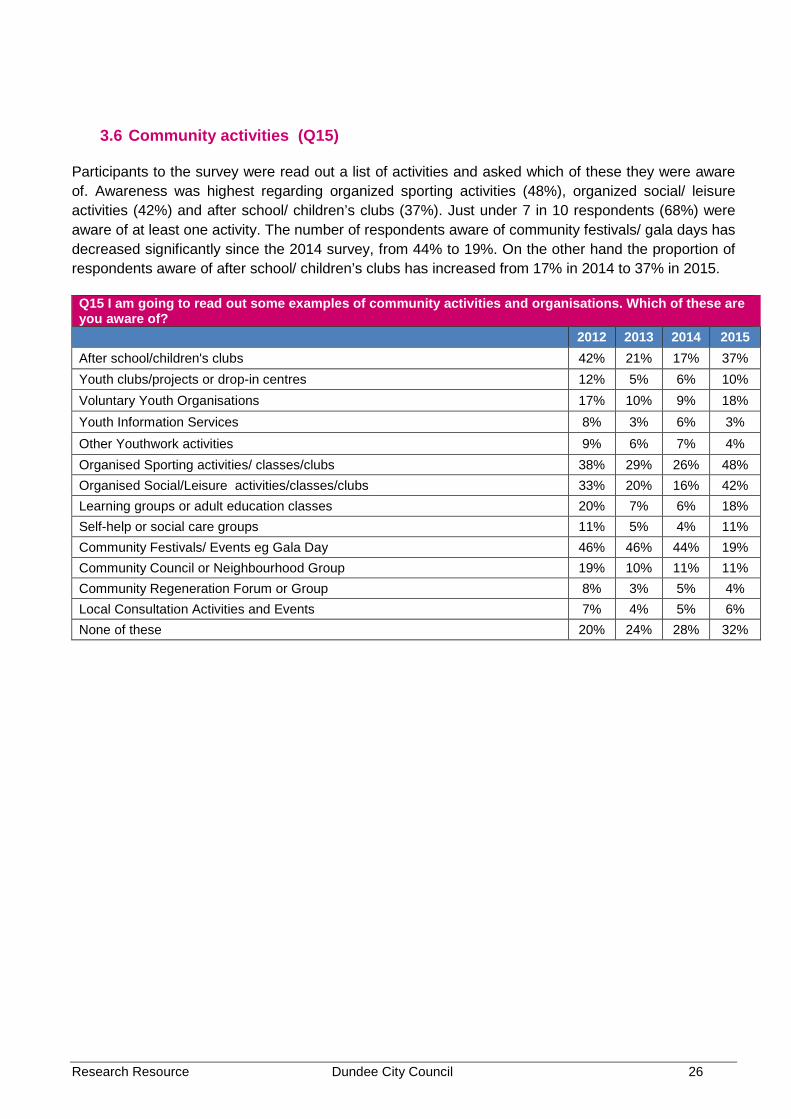
3.6 Community activities (Q15)
Participants to the survey were read out a list of activities and asked which of these they were aware of. Awareness was highest regarding organized sporting activities (48%), organized social/ leisure activities (42%) and after school/ children’s clubs (37%). Just under 7 in 10 respondents (68%) were aware of at least one activity. The number of respondents aware of community festivals/ gala days has decreased significantly since the 2014 survey, from 44% to 19%. On the other hand the proportion of respondents aware of after school/ children’s clubs has increased from 17% in 2014 to 37% in 2015.
Q15 I am going to read out some examples of community activities and organisations. Which of these are you aware of? 2012 2013 2014 2015 After school/children's clubs 42% 21% 17% 37% Youth clubs/projects or drop-in centres 12% 5% 6% 10% Voluntary Youth Organisations 17% 10% 9% 18% Youth Information Services 8% 3% 6% 3% Other Youthwork activities 9% 6% 7% 4% Organised Sporting activities/ classes/clubs 38% 29% 26% 48% Organised Social/Leisure activities/classes/clubs 33% 20% 16% 42% Learning groups or adult education classes 20% 7% 6% 18% Self-help or social care groups 11% 5% 4% 11% Community Festivals/ Events eg Gala Day 46% 46% 44% 19% Community Council or Neighbourhood Group 19% 10% 11% 11% Community Regeneration Forum or Group 8% 3% 5% 4% Local Consultation Activities and Events 7% 4% 5% 6% None of these 20% 24% 28% 32%
Research Resource Dundee City Council 26

Following on from this, participants were asked how often they or a member of their household had taken part in each of these activities. The table below shows the proportion of participants who said they or a household member takes part in these activities on a daily or weekly basis. The most popular activities were organised sporting activities (64%), after school/ children’s clubs (58%) and organised social/ leisure clubs (34%). In 2014 organised sporting activities was also the activity most likely to be undertaken on a daily or weekly basis. Q15 Community/ voluntary activities participation profile (% daily/ weekly)
2012 2013 2014 2015 Organised Sporting activities/ classes/clubs 16% 42% 64% 64% After school/children's clubs 7% 22% 60% 58% Organised Social/Leisure activities/classes/clubs 11% 35% 33% 34% Voluntary Youth Organisations 5% 20% 8% 29% Youth clubs/projects or drop-in centres 3% 32% 9% 8% Learning groups or adult education classes 3% 12% 3% 3% Other Youthwork activities 3% 12% 8% 2% Self-help or social care groups 2% 10% 4% 1% Community Council or Neighbourhood Representative Structure 0% 2% 6% 0% Youth Information Services 1% 4% 2% 0% Community Festivals and Events 1% - 1% 0% Community Regeneration Forum 0% 1% 0% 0%
Local Consultation Activities or Events 0% 2% 0% -
Research Resource Dundee City Council 27

3.7 Cultural activities and events (Q18) Participants were shown a list of cultural activities and events such as films, exhibitions, plays, museums and classes and asked whether they had taken part in or visited any of these activities in Dundee in the last 12 months. The vast majority of participants (81%) said they had taken part or visited at least one of these activities or events in the last 12 months. This has increased since the 2014 survey where 73% of respondents said they had taken part or visited any of these activities in Dundee. The most popular activities were attending the cinema (56%) and visiting the library (37%). Those who were most likely to have attended these events: Were aged 16-34 (91%) Had children in their household (86%) Rented their home from a private landlord (92%) Lived in the Ferry (88%)
Those who were least likely to have participated in cultural activities or events: Were aged 65 and over (65%) Had no children in the household (79%) Rented their home from a registered social landlord (69%) Lived in Lochee (65%)
Q18 In the last 12 months have you been to any of these events or places in Dundee? (2015) Activity % Cinema 56% Library, including mobile or online 37% Theatre e.g. pantomime, musical or play 25%
Live music event e.g. traditional music, rock concert, jazz event 24%
Museum 23% None 19% Gallery 15% Culturally specific festival e.g. mela/ Feis/ local Gala days 6% Historical place e.g. castle, stately home and grounds, battle or archaeology site 6% Dance show/ event e.g. ballet 3% Exhibition including art, photography or crafts 2% Street arts (art in everyday surroundings like streets, parks or shopping centre) 1% Book festival or reading group 1% Classical music performance or opera 1% Archive or records office 1%
Research Resource Dundee City Council 28

3.8 Reasons for not taking part in community activities, organisations or events (Q19)
Those who had not taken part in any community activities or organisations were asked to provide reasons why this was the case. Over half of respondents (55%) who did not take part in any community activities or organisations said they were simply not interested, 18% said they found it difficult to find the time and 17% said their health was not good enough.
Q19 If you have not taken part in any community activities or organisations, can you tell me why this is? % Not really interested 55% It's difficult to find the time 18%
Health isn't good enough 17%
Never occurred to me 11% It costs too much 8% I wouldn't enjoy it 1% I don't know enough about it 1% I don't have anyone to go with 1% I might feel uncomfortable or out of place 0% Other 1%
3.9 Influencing decisions (Q20a/b)
Participants were asked the extent to which they felt that they had an influence over decisions which affect their neighbourhood. 4 in 10 respondents (40%) agreed that they could influence decisions that affect their local area compared to 37% who disagreed and 23% who neither agreed nor disagreed. The overall level of agreement for this question has decreased since the 2014 survey from 53% in 2014 to 40% in 2015. The proportion of respondents who disagreed has increased significantly from 5% in 2014 to 37% in 2015 and the proportion of respondents who neither agreed nor disagreed has decreased from 42% in 2014 to 23% in 2015.
Research Resource Dundee City Council 29

Those who lived in The Ferry and Strathmartine were significantly more likely to agree that they can influence decisions (59%) than participants from the North East who were least likely to agree (42%). Half of respondents (50%) were in agreement that people in their local community can influence decisions affecting the local area compared to 26% who disagreed and 23% who neither agreed nor disagreed. The proportion of respondents who neither agreed nor disagreed with this statement has decreased since 2014 (from 36% in 2014 to 23% in 2015) and the proportion who disagreed has increased significantly from 3% in 2014 to 26% in 2015. The proportion of respondents who disagreed with this statement is at its highest level to date compared to 2014 (3%), 2013 (11%) and 2012 (19%).
Research Resource Dundee City Council 30
4. HEALTH
4.1 Registered with GP or health centre/ dentist (Q21)
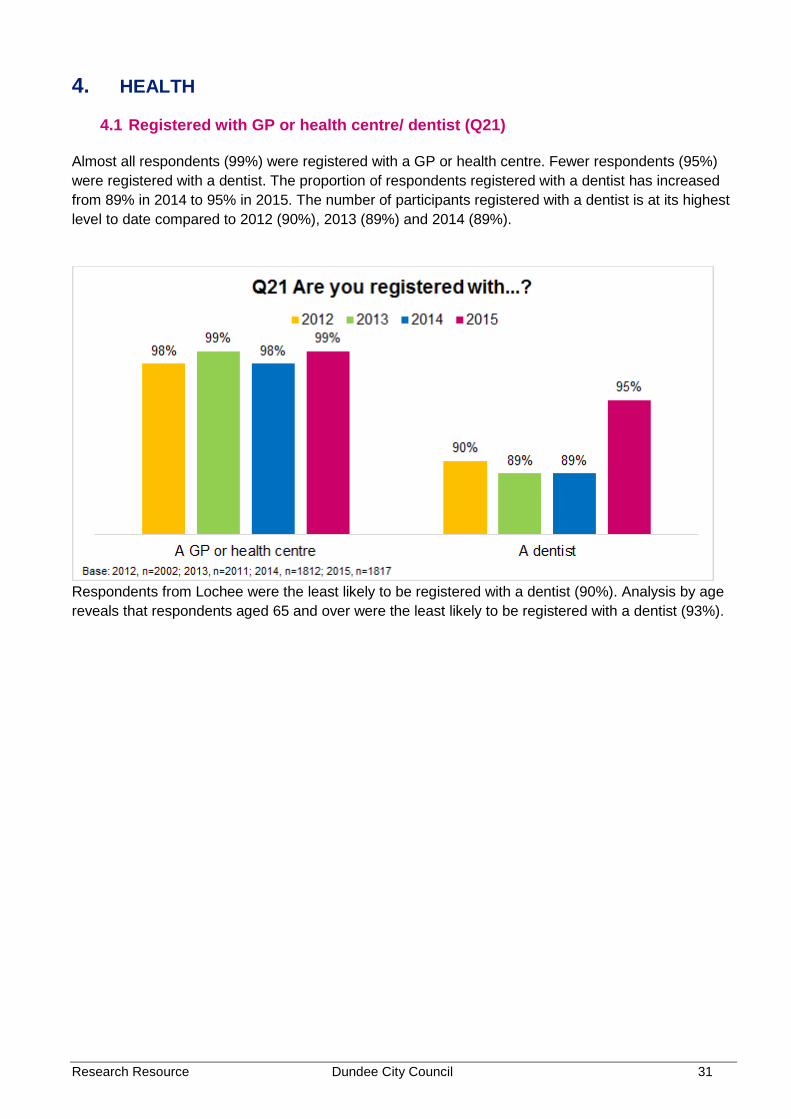
Almost all respondents (99%) were registered with a GP or health centre. Fewer respondents (95%) were registered with a dentist. The proportion of respondents registered with a dentist has increased from 89% in 2014 to 95% in 2015. The number of participants registered with a dentist is at its highest level to date compared to 2012 (90%), 2013 (89%) and 2014 (89%).
Respondents from Lochee were the least likely to be registered with a dentist (90%). Analysis by age reveals that respondents aged 65 and over were the least likely to be registered with a dentist (93%).
Research Resource Dundee City Council 31

4.2 Rating of health overall (Q22)
84% of respondents rated their health good or very good compared to 12% who said it was fair and 5% who said it was very or fairly poor. The proportion of tenants rating their health good or very good has continued to rise and is at the highest level to date, compared to 2014 (83%),2013 (82%) and 2012 (77%).
As shown below, participants rating of health decreases dramatically as age increases.
Analysis by ward reveals that those who lived in The Ferry (70%) were least likely to have rated their health as good or very good and those who lived in the North East (88%) and Strathmartine (89%) were the most likely.
Research Resource Dundee City Council 32
4.3 Moderate physical activity (Q23)
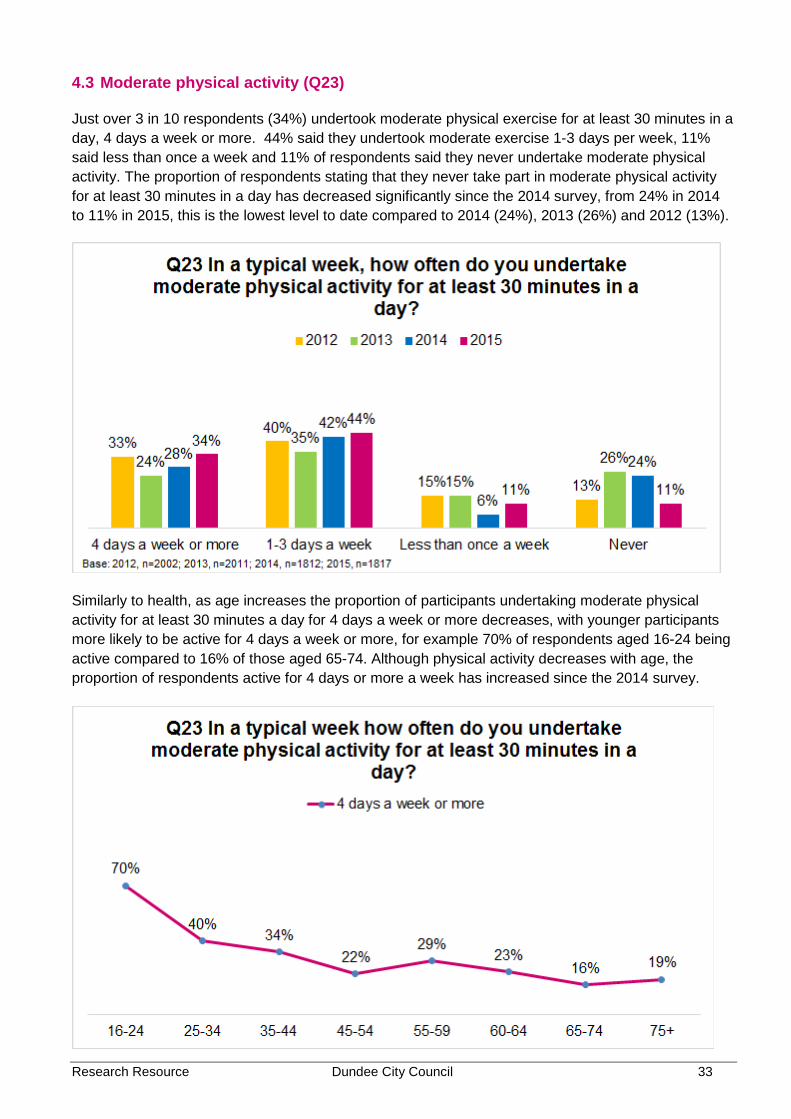
Just over 3 in 10 respondents (34%) undertook moderate physical exercise for at least 30 minutes in a day, 4 days a week or more. 44% said they undertook moderate exercise 1-3 days per week, 11% said less than once a week and 11% of respondents said they never undertake moderate physical activity. The proportion of respondents stating that they never take part in moderate physical activity for at least 30 minutes in a day has decreased significantly since the 2014 survey, from 24% in 2014 to 11% in 2015, this is the lowest level to date compared to 2014 (24%), 2013 (26%) and 2012 (13%).
Similarly to health, as age increases the proportion of participants undertaking moderate physical activity for at least 30 minutes a day for 4 days a week or more decreases, with younger participants more likely to be active for 4 days a week or more, for example 70% of respondents aged 16-24 being active compared to 16% of those aged 65-74. Although physical activity decreases with age, the proportion of respondents active for 4 days or more a week has increased since the 2014 survey.
Research Resource Dundee City Council 33

Respondents who lived in the most deprived areas were the least likely to undertake physical activity 4 days a week or more (19%) than respondents from other areas (46%).
4.4 Smoking habit (Q24)
Just under 3 in 10 respondents (25%) said that they currently smoke, 25% said that they used to smoke and over half (51%) said they have never smoked. The results are consistent with the 2014 survey.
Those who lived in the most deprived areas (30%) were more likely to currently smoke that those who lived in other areas (20%). Furthermore those who lived in the East End (31%) and Strathmartine (30%) were the most likely to smoke, while those in The Ferry were the least likely (16%). Analysis by age reveals that 32% of respondents aged 35-54 currently smoke compared to just 12% of respondents who were aged 65 and over. Males were more likely to smoke (31%) than females (19%).
Research Resource Dundee City Council 34

4.5 Alcohol consumption (Q25)
Participants were asked about their alcohol consumption. 3 in 10 respondents (30%) said that they drink the recommended alcohol allowance (8 units for men/ 6 for women) or more at least once a week. On the other hand 36% of participants said they never drink the recommended alcohol allowance. The proportion of respondents stating they never drink the recommended allowance has remained consistent with the 2014 survey results.
Analysis by age reveals that participants aged 65 and over were the most likely to say that they never drink the recommended alcohol allowance (53%), while respondents aged 35-54 were least likely to say this (30%). Furthermore, females were more likely to have said they do not drink over the recommended allowance (43%) than males (28%). Those who live in the most deprived areas were less likely to consume more than the recommended alcohol allowance at least once a week (23%) than all other respondents (35%). The Ferry respondents were most likely to consume more than the recommended alcohol allowance at least once a week (52%), while those who lived in Lochee were most likely to have said they never consume more than the recommended allowance (50%).
Research Resource Dundee City Council 35

4.6 Statements about mental wellbeing (Q26) The Warwick-Edinburgh Mental Well-being Scale (WEMWBS) was developed by researchers at the Universities of Warwick and Edinburgh to enable the measurement of mental wellbeing of adults in the UK. WEMWBS is a 14 item scale of mental well-being covering subjective well-being and psychological functioning, in which all items are worded positively and address aspects of positive mental health. The question used is shown below:
Below are some statements about feelings and thoughts. Please tick the box that best describes your experience of each over the last 2 weeks
STATEMENTS None of the time
Rarely Some of the time Often
All of the time
I've been feeling optimistic about the future 1 2 3 4 5 I've been feeling useful 1 2 3 4 5 I've been feeling relaxed 1 2 3 4 5 I've been feeling interested in other people 1 2 3 4 5 I’ve had energy to spare 1 2 3 4 5 I’ve been dealing well with problems 1 2 3 4 5 I’ve been thinking clearly 1 2 3 4 5 I’ve been feeling good about myself 1 2 3 4 5 I’ve been feeling close to other people 1 2 3 4 5 I’ve been feeling confident 1 2 3 4 5 I’ve been able to make up my own mind about things
1 2 3 4 5
I’ve been feeling loved 1 2 3 4 5 I’ve been interested in new things 1 2 3 4 5 I’ve been feeling cheerful 1 2 3 4 5 The scale is scored by summing responses to each item answered on a 1 to 5 Likert scale. The minimum scale score is 14 (if each of the items is scored 1 ‘none of the time’) and the maximum score is 70 (if each of the items is scored 5 ‘all of the time’).
Research Resource Dundee City Council 36

For Dundee as a whole, the mean score for WEMWBS is 53.3. The mean score for Dundee in 2014 was 56.8, in 2013 was 57.1 and in 2012 was 52.2. The chart below shows the mean WEMWBS scores for each ward. This reveals that participants living in Maryfield (55.8), Lochee (55.3) and Strathmartine (55.4) had a higher than average WEMWBS score while participants living in the West end (49.9) and The Ferry (49.8) had a lower than average WEMWBS score.
Analysis by age indicates that in general, the WEMWBS score decreases with age from 54.7 for respondents aged 16 to 24 to 49.2 for those aged 75 and over.
Research Resource Dundee City Council 37

The chart below shows the mean WEMWBS score analysed by the participant’s self-assessment of their own health. Those who said their health was very good had a significantly higher score (56.1) than those who rated their health very poor (46.0).
With regards to financial management, those who said they were managing very well financially had a higher WEMWBS score (54.5) than participants who said they were in deep financial didn’t manage very well (51.0).
Research Resource Dundee City Council 38
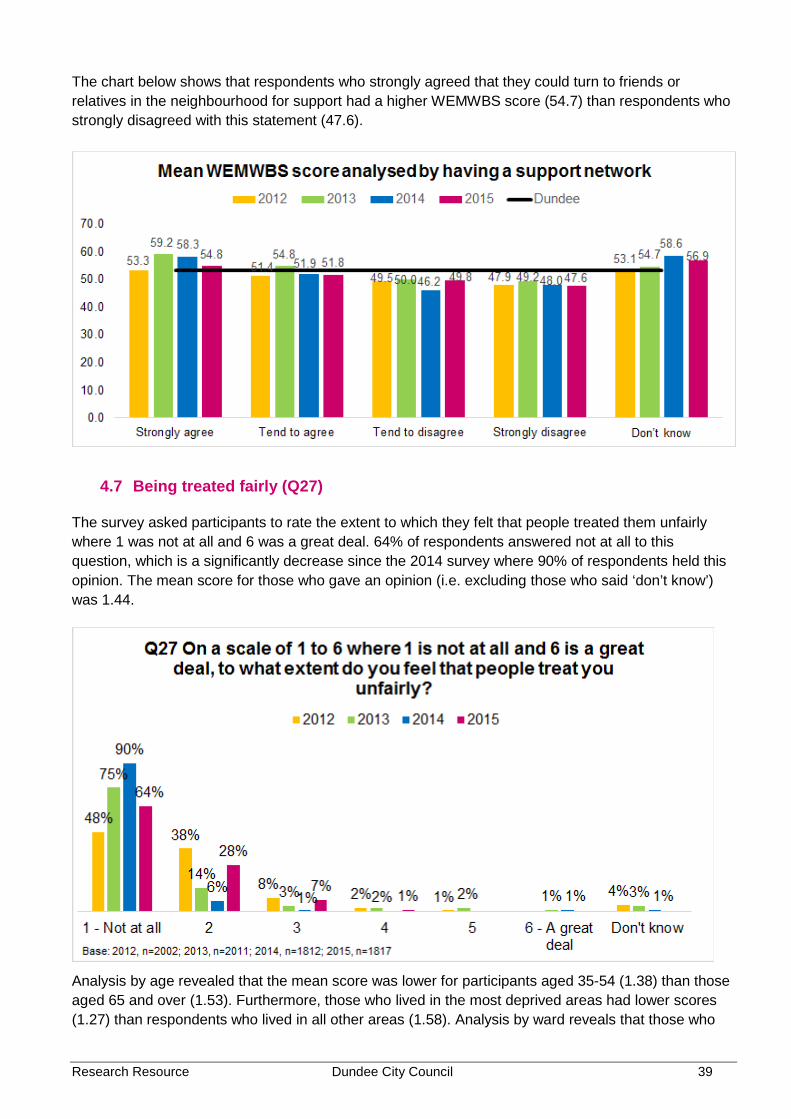
The chart below shows that respondents who strongly agreed that they could turn to friends or relatives in the neighbourhood for support had a higher WEMWBS score (54.7) than respondents who strongly disagreed with this statement (47.6).
4.7 Being treated fairly (Q27)
The survey asked participants to rate the extent to which they felt that people treated them unfairly where 1 was not at all and 6 was a great deal. 64% of respondents answered not at all to this question, which is a significantly decrease since the 2014 survey where 90% of respondents held this opinion. The mean score for those who gave an opinion (i.e. excluding those who said ‘don’t know’) was 1.44.
Analysis by age revealed that the mean score was lower for participants aged 35-54 (1.38) than those aged 65 and over (1.53). Furthermore, those who lived in the most deprived areas had lower scores (1.27) than respondents who lived in all other areas (1.58). Analysis by ward reveals that those who
Research Resource Dundee City Council 39

lived in The Ferry had the highest scores (2.06), while respondents who lived in Strathmartine had the lowest score (1.17).
4.8 Support network (Q28)
92% of participants agreed that they could turn to friends or relatives in the neighbourhood for support, compared to 4% who disagreed and 4% who answered don’t know. The proportion of tenants who agreed strongly with this statement has seen a significant decrease since the 2014 survey from 75% to 45%.
Females were more likely to strongly agree with this statement (49%) than males (45%). Analysis by age indicates that as age increases, the proportion of respondents who strongly agreed with this statement also increases from 42% for those aged 16 to 34 to 50% for respondents aged 65 and over, those aged 55-64 (54%) were the most likely to strongly agree with this statement. Analysis by ward reveals that those who lived in the West End (18%) were the least likely to strongly agree with this statement. On the other hand, respondents residing in Strathmartine (70%) and in the Lochee (63%) were most likely to strongly agree. Furthermore, those who lived in the most deprived areas were more likely to strongly agree (61%) than those who lived in all other areas (36%).
Research Resource Dundee City Council 40

5. EDUCATION
5.1 Currently undertaking education or training (Q29) 12% of participants said they were currently taking part in some form of education or class which is consistent with the 2014 results (12%) with the most popular form of education being a university based course.
The results to this question have not varied significantly when compared to previous years.
Perhaps unsurprisingly, younger respondents aged 16 to 34 were most likely to be taking part in some form of education or training (27%), while those aged 65 and over were least likely (1%). Analysis by tenure reveals that those who lived in private rented accommodation were significantly more likely than all other participants to be in some form of education or training (33%).
Research Resource Dundee City Council 41

Those who lived in the most deprived areas were significantly less likely to be in education or training (5%) than participants who lived in all other areas (17%). Furthermore, analysis by ward revealed that those who lived in the West End were most likely to be in education or training (40%), while those who lived in Lochee (3%), Strathmartine (4%), the North East (4%) and the East End (3%) were least likely.
5.2 Type of qualification (Q30)
Those who said they were undertaking some form of training were asked to specify the type of qualification this would lead to. Only 5% said that this would not lead to a qualification, 61% said this would lead to a qualification at degree level or above and 35% said it would lead to another qualification. Compared to 2014, the proportion of those stating their training would lead to a degree level or above qualification has decreased from 75% to 61%.
Younger participants aged 16 to 34 were the most likely to have said that the training will lead to a qualification at degree level or above (77%). The single respondent aged 55-64 said their training would lead to a qualification at degree level or above.
Research Resource Dundee City Council 42

6. COMMUNITY SAFETY
6.1 Safety in the neighbourhood (Q31)
Almost all participants (99%) said their neighbourhood was a very or fairly safe place to live, compared to 1% who said it was a bit unsafe. The results are consistent with the 2014 survey where 98% of respondents said their neighbourhood was very or fairly safe.
Respondents who lived in the most deprived areas were less likely to say their neighbourhood was a very safe place to live (75%) than all other respondents (85%). Analysis by ward indicates that those who lived in the North East (95%) were most likely to feel very safe. On the other hand participants who lived in the East End were least likely to feel this way (61%).
Research Resource Dundee City Council 43

6.2 Safety during the day and at night (Q32)
Participants were asked how safe they felt in different circumstances:
100% felt very safe or fairly safe when walking alone in their neighbourhood during the day (99% in 2014).
100% felt very safe or fairly safe alone in their home during the day (99% in 2014). 83% felt very safe or fairly safe when walking alone in their neighbourhood after dark (84% in
2014) 100% felt very safe or fairly safe alone in their home at night (100% in 2014).
Research Resource Dundee City Council 44
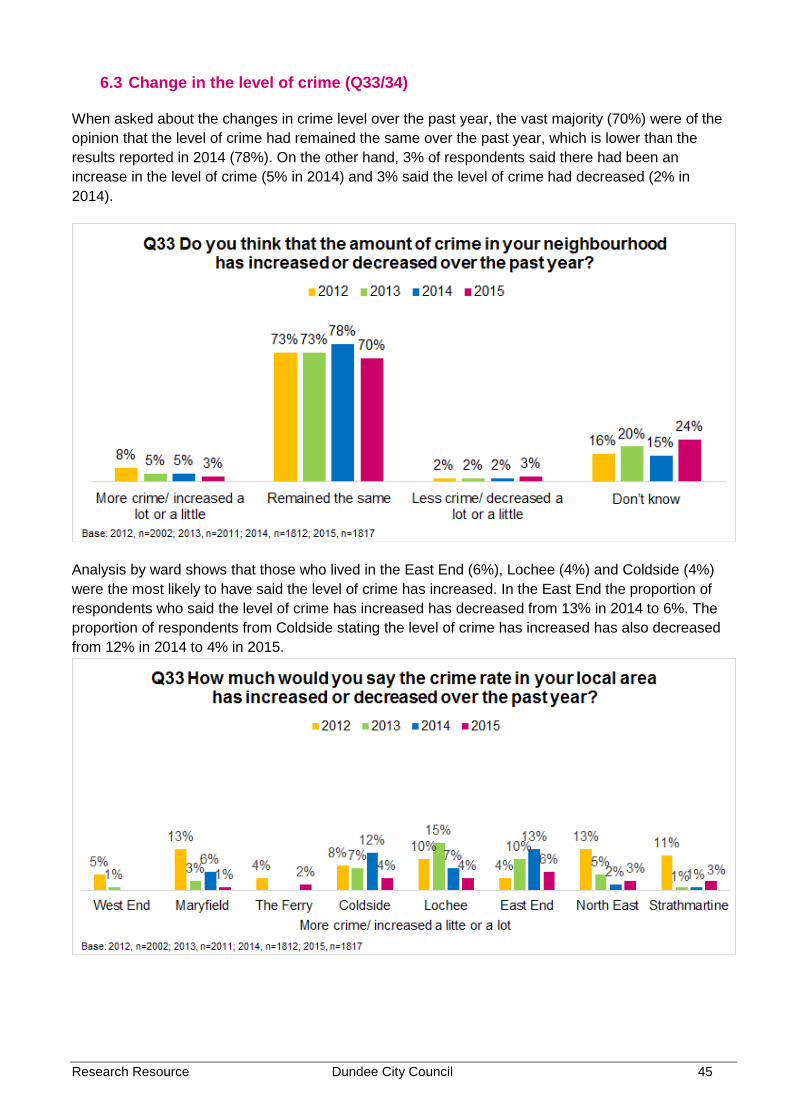
6.3 Change in the level of crime (Q33/34)
When asked about the changes in crime level over the past year, the vast majority (70%) were of the opinion that the level of crime had remained the same over the past year, which is lower than the results reported in 2014 (78%). On the other hand, 3% of respondents said there had been an increase in the level of crime (5% in 2014) and 3% said the level of crime had decreased (2% in 2014).
Analysis by ward shows that those who lived in the East End (6%), Lochee (4%) and Coldside (4%) were the most likely to have said the level of crime has increased. In the East End the proportion of respondents who said the level of crime has increased has decreased from 13% in 2014 to 6%. The proportion of respondents from Coldside stating the level of crime has increased has also decreased from 12% in 2014 to 4% in 2015.
Research Resource Dundee City Council 45

The North East has the highest proportion of respondents who were of the opinion that the level of crime in their area has decreased.
Those who said that the level of crime in their neighbourhood had increased were asked about the factors which have influenced their opinion. The main factor which appears to have influenced opinion is word of mouth with 87% of participants stating that talking to people in their area has been the biggest influence on their opinion. This was also the most common answer given in 2013 and 2014. Q33 If you feel crime has increased in your neighbourhood, what has influenced your opinion? Base: 2013, n=135; 2014, n= ; 2015, n=62 2013 2014 2015 Talking to people in the area 75% 51% 87%
Media - television, radio, paper 34% 22% 14%
Personal experience of crime 7% 27% 12%
Experience of family or friends 11% 20% 5%
Social media internet sites e.g. Facebook, Twitter 2% 0% 3%
Other 1% 0% 2%
Internet sites 0% 0% 1%
Police or Council publications 5% 43% 1%
Research Resource Dundee City Council 46

6.4 Factors which contribute to crime level (Q35) Participants were asked what they identified as being the main factor which contributes most to the level of crime in the neighbourhood. The most popular responses to this question were: Alcohol/ Drugs (34%) Gangs/ youths (4%)
These were also the most popular responses given in 2013 and 2014. Just over 3 in 10 respondents (34%) were unable to answer this question, 3% said nothing contributes to the level of crime in their neighbourhood and 17% said they lived in a good neighbourhood where they do not have a lot of trouble.
What, in your opinion, is the main factor which contributes most to the level of crime in your neighbourhood? Base: 2013, n=2011; 2014, n=1812; 2015, n=1817 2013 2014 2015 Alcohol/ Drugs 36% 54% 34%
Don't know 38% 30% 34%
This is a good area/ neighbourhood/ quiet/ no trouble 18% 16% 17%
Nothing 3% 4% 3%
Gangs/ youths 3% 2% 4%
Unemployment 4% 2% 3%
Anti social behaviour 0% 1% 0%
Boredom/ nothing to do/ lack of facilities 2% 1% 3%
Lack of money/ poverty 1% 1% 3%
Crime e.g. Break ins/ burglary/ vandalism 1% 0% 2%
Lack of discipline/ parental control 1% 0% 0%
Lack of policing/ wardens 0% 0% 1% New people/ undesirables moving into area/ not knowing who your neighbours are 1% 0% 0%
Opportunists/ some people can't help themselves 1% 0% 2%
Driving offences/ speeding/ motorbikes 0% - 0%
Immigrants 0% - 0%
Prostitution 0% - 0%
Other 1% 2% 2%
Research Resource Dundee City Council 47

6.5 Extent to which fear of crime prevents them from taking part in everyday activities (Q36)
The vast majority (91%) of respondents said that the fear of crime does not prevent them at all from taking part in everyday activities. 7% said it prevents them a little, and 1% said it prevented them quite a lot or a great deal. The results are consistent with the 2014 results.
Analysis by ward indicates that those who live in the West End (78%) were least likely to say that the fear of crime does not prevent them at all from taking part in everyday activities, than those living in Maryfield (98%) and the North East (98%). Participants who lived in private rented accommodation (94%) were more likely to have said the fear of crime does not prevent them at all than those who rented their home from a registered social landlord (84%). Those who lived in the most deprived areas (93%) were marginally more likely to say the fear of crime does not affect them at all than respondents from other areas (90%).
Research Resource Dundee City Council 48
7. MONEY MATTERS
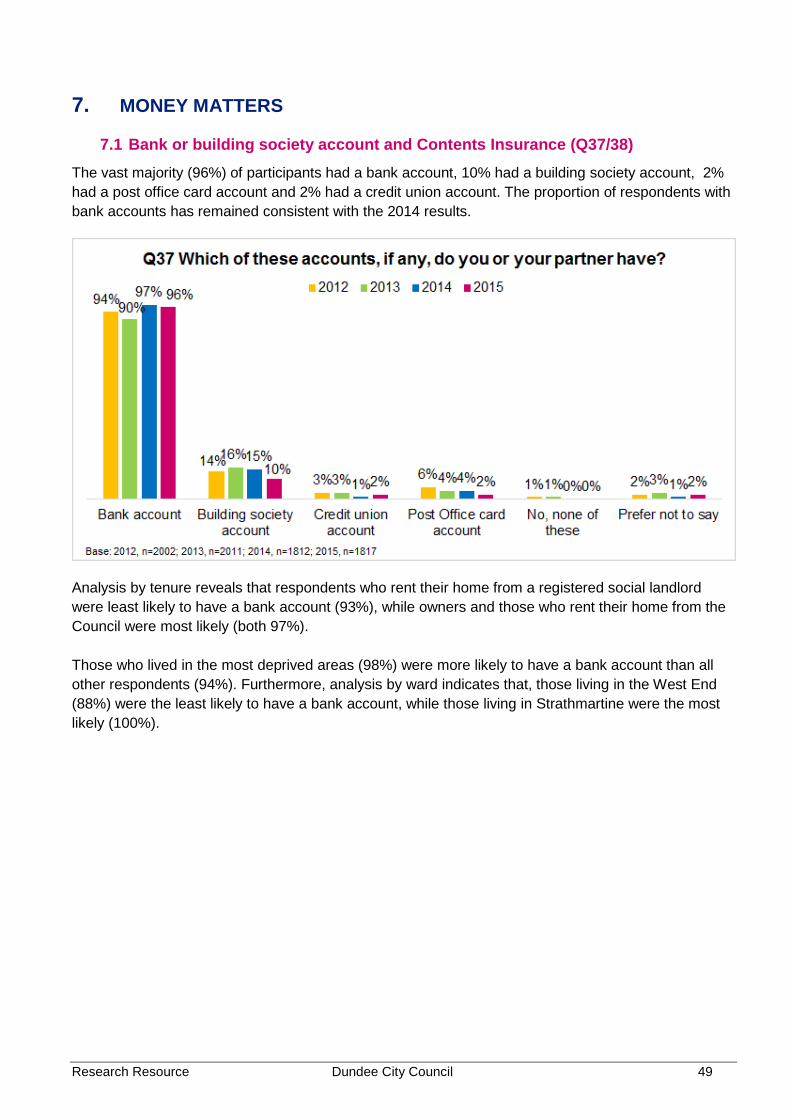
7.1 Bank or building society account and Contents Insurance (Q37/38) The vast majority (96%) of participants had a bank account, 10% had a building society account, 2% had a post office card account and 2% had a credit union account. The proportion of respondents with bank accounts has remained consistent with the 2014 results.
Analysis by tenure reveals that respondents who rent their home from a registered social landlord were least likely to have a bank account (93%), while owners and those who rent their home from the Council were most likely (both 97%). Those who lived in the most deprived areas (98%) were more likely to have a bank account than all other respondents (94%). Furthermore, analysis by ward indicates that, those living in the West End (88%) were the least likely to have a bank account, while those living in Strathmartine were the most likely (100%). Research Resource Dundee City Council 49

Just under 8 in 10 respondents said they had contents insurance (78%). This has increased significantly since the 2014 results from 63% to 78%. The proportion of respondents stating they have contents insurance is at its highest level to date compared to 63% in 2014, 70% in 2013 and 70% in 2012.
7.2 Total value of savings (Q39) Participants were asked about any savings or investments that they had. 31% of participants said they had investments or savings. The proportion of respondents who had savings or investments has increased significantly from 12% in 2014 to 31%. This is the highest proportion of respondents with savings to date, compared to 12% in 2014, 15% in 2013 and 20% in 2012.
Younger participants were more likely to have no savings (39%) and those aged 65 and over were less likely (9%).
Research Resource Dundee City Council 50

Perhaps unsurprisingly, those who owned their home (39%) were more likely to have savings than those who rented their home from the Council (18%). Participants who lived in the most deprived areas were less likely to have savings (26%) than participants who lived in other areas (35%). Analysis by ward reveals that participants who lived in Maryfield (44%) were most likely to have savings while those who lived in the Ferry were least likely (16%).
7.3 Financial difficulties (Q40) Just under 8 in 10 respondents (77%) said they were not experiencing any financial difficulty, 17% said they were experiencing difficulty with the cost of domestic bills and 5% were struggling to afford the cost of food. The results show that Dundee residents are less likely to be experiencing financial difficulties than in previous years, for example the proportion of respondents who are not having difficulty with any of these issues has continued to increase since 2012.
Analysis by age reveals that in general, those aged 65 and over were least likely to be experiencing financial difficulties with the following issues while younger respondents aged 16 to 34 were most likely. For example, Cost of food: 11% of respondents aged 16-34 said they were experiencing difficulty affording
this compared to 1% of respondents aged 65 and over. Domestic energy bills: 26% of respondents aged 16-34 said they were experiencing difficulty
affording this compared to 9% of respondents aged 65 and over.
Analysis of the most deprived areas reveals that they too are more likely to be struggling to afford the cost of food and domestic energy bills:
Cost of food: 7% of respondents living in the most deprived areas said they were experiencing difficulty affording this compared to 4% of respondents living in all other areas.
Domestic energy bills: 20% of respondents living in the most deprived areas said they were experiencing difficulty affording this compared to 15% of respondents living in all other areas.
Research Resource Dundee City Council 51

7.4 Financial management (Q41) The survey asked the extent to which participants were managing financially. Just under 6 in 10 respondents (56%) said they were managing very or quite well, 39% said they get by all right and 4% said they were not managing very well. The proportion of respondents who said their household is managing very or quite well has increased significantly since the 2014 survey (46%). The proportion of respondents stating they manage very well has also increased from 9% in 2014 to 13% in 2015.
As age increases, the proportion of respondents who said they were managing very well also increases, for example from 7% for respondents aged 16 to 34 to 18% for those aged 65 and over. Participants who owned their home were most likely to have said they were managing very well financially (19%) compared to 5% of respondents who rent their home from the Council and 5% for RSL tenants. Those who lived in the most deprived areas were more likely to have said they were managing very or quite well financially (60%) than those who lived in all other areas (53%). This has changed significantly since the 2014 survey where respondents who lived in the most deprived areas were less likely to say they were managing well financially compared to those living in all other areas. Analysis by ward indicates that those who lived in Coldside were most likely to have said they were managing very well financially (29%). On the other hand, 10% of Maryfield respondents said they were not managing very well.
Research Resource Dundee City Council 52

8. CONTACTING YOUR COUNCIL
8.1 Reason for contact (Q42)
Compared to the 2014 survey there has been an increase in the percentage of participants who had contacted the Council, increasing from 32% in 2014 to 46% in 2015. Of those who made contact, 7% had contacted to make a complaint, 31% were looking for information, 61% were requesting a service and 1% made contact to make a suggestion.
8.2 Method of contact (Q47) The majority of respondents (79%) contacted the Council by telephone. This was also the most popular method in 2012, 2013 and 2014, with the proportion of respondents contacting the Council by telephone decreasing significantly from 2014 (91%). The proportion of participants who have made personal visits to the Council’s office has increased from 6% in 2014 to 9% in 2015. Furthermore the proportion of respondents visiting the Council’s website has increased from 1% in 2014 to 6% in 2015. Was your most recent contact …. Base: 2012, n=667; 2013, n=730; 2014, n=608; 2015, n=818 2012 2013 2014 2015 By a telephone call to the Council 84% 73% 91% 79% By a personal visit to a Council office 8% 11% 6% 9% By visiting the Council's website 5% 15% 1% 6% By a letter 2% 0.30% 1% 1% By e-mail 1% 0.30% 1% 5%
8.3 Satisfaction with responding to complaints (Q43)
Those who contacted the Council to make a complaint were asked how satisfied they were that the Council responded to their complaint. More respondents were satisfied (70%) than dissatisfied (23%) with the Council in this respect. The proportion of respondents who were satisfied has remained consistent with the 2014 results.
Research Resource Dundee City Council 53

8.4 Satisfaction with responding to information requests (Q44) Those who contacted the Council looking for information were asked how satisfied they were with the response that they received. 89% said they were very or satisfied with this contact to seek information compared to 2% who were dissatisfied. Overall satisfaction has seen an increase from 84% in 2014 to 89% in 2015.
8.5 Satisfaction with responding to service requests (Q45) Those who contacted the Council to request a service were asked how satisfied they were with this contact. 97% said they were very satisfied or satisfied with the contact to receive a service compared to 2% who were dissatisfied. Overall satisfaction has not changed significantly since the 2014 survey. However, the proportion of respondents who were very satisfied has decreased from 57% in 2014 to 54% in 2015.
Research Resource Dundee City Council 54

8.6 Experience of contacting the Council (Q46) More than nine in ten participants said they got what they needed when they contacted the Council (91%). This is slightly more than the 2014 survey where 86% said they got what they needed on the most recent occasion. Analysis by contact method revealed that those who contacted the Council by email (94%), by telephone (93%) or by letter (93%) were most likely to say they got what the needed on the most recent contact. On the other hand, 24% of participants who contacted the Council using their website said they had to contact the Council about the same issue again. Please note the base numbers for some of the contact types are very low, in particular contact by letter and by email. On your most recent contact with the Council, did you...? (analysed by contact method)
Overall By a letter
By a telephone call to the Council
By a personal visit to a Council office
By e-mail
By visiting
the Council's website
Base 818 6 680 55 25 52 Get what you need at that contact 91% 93% 93% 81% 94% 76% Have to contact the Council again about the same issue 9% 7% 7% 19% 6% 24%
The table below reveals that those who contacted the Council to make a complaint (64%) were least likely to have said they got what they needed at that contact. Those who contacted to make a suggestion were the most likely to have said they got what they needed at that contact (100%). Again please note the low base numbers to this question, particularly with regards to the number of participants who contacted the Council to make a suggestion. On your most recent contact with the Council, did you...? (analysed by nature of contact)
Overall Make a complaint
Seek information
Request a service
Make a suggestion
Base 818 59 216 531 12 Get what you need at that contact 91% 64% 90% 94% 100% Have to contact the Council again about the same issue 9% 36% 10% 6% -
8.7 Satisfaction with telephone contact (Q48)
Participants who contacted the Council by telephone were asked to rate the Council’s telephone system. Satisfaction levels ranged from 94% in terms of how quickly the phone was answered and the outcome of the contact to 99% in terms of the overall helpfulness of the staff member who dealt with the call. Satisfaction levels are consistent with those reported in the 2014 survey. How satisfied or dissatisfied were you with your recent contact with the Council by telephone in terms of the following: Telephone contact % satisfied (Base: 2012, n=550; 2013, n=561; 2014, n=537; 2015, n=680) 2012 2013 2014 2015
How easy it was for you to find the right number to call 98% 99% 98% 98%
How quickly the phone was answered 99% 98% 98% 94%
How easy it was to get through to someone who could help 98% 96% 98% 98% Overall helpfulness/ friendliness/courtesy of the staff you dealt with 98% 96% 96% 99%
How well the staff understood what you wanted 97% 96% 96% 98% The outcome of your contact 91% 92% 91% 94%
Research Resource Dundee City Council 55

8.8 Satisfaction with office contact (Q49) Satisfaction with office visits was high with 100% satisfaction in terms of how easy it was to get to the office. Satisfaction was lowest in terms of the outcome of the contact (78%), however this indicator has seen an increase from the 2014 survey where 67% were satisfied. The suitability of the office has seen a decrease in satisfaction from 100% in 2014 to 87% in 2015. How satisfied or dissatisfied were you with your recent contact when visiting a Council office in terms of the following? Personal visit % satisfied (Base: 2012, n=55; 2013, n=79; 2014, n=51; 2015,n=55) 2012 2013 2014 2015
How easy it was to get to the office 97% 100% 96% 100% The suitability of the office e.g. waiting areas, privacy, access for disabled people etc 96% 100% 100% 87%
Overall helpfulness/ friendliness/courtesy of the staff you dealt with 91% 96% 95% 96%
How well the staff understood what you wanted 89% 94% 88% 92% The outcome of your contact 71% 75% 67% 78%
8.9 Satisfaction with written/ email contact (Q50)
31 participants had contacted the Council by letter or email. 94% of participants said they were satisfied with the extent to which the first reply they received answered their query and the outcome of their contact, while 93% were satisfied with how quickly they received a reply to their email or letter. Please note that due to the small base numbers to this question, the results compared to previous years are not statistically significant. How would you rate your most recent contact with the Council in terms of the following? Base: 2012, n=22; 2013, n=6; 2014, n=14; 2015, n=31 2012 2013 2014 2015 How quickly you received a reply to your e-mail/ letter 95% 79% 72% 93% The extent to which the first reply you received answered your query 91% 79% 72% 94%
The outcome of your contact 86% 79% 65% 94%
8.10 Satisfaction with visiting the website (Q51/52)
Just over 4 in 10 participants (42%) said they had used the Council’s website. This is significantly more than was reported in 2014 (24%). Have you ever used the Council's website? Base: 2012, n=1968; 2013, n=2011; 2014, n=1812; 2015, n=1817 2012 2013 2014 2015
Yes 18% 28% 24% 42% Those who had visited the website were asked to rate how satisfied they were with obtaining information and the amount of information that was available. 98% were satisfied with how easily they managed to find the information they wanted and 97% were satisfied with the amount of information provided on the website. How would you rate the website in terms of the following? (% satisfied) Base:2012, n=457; 2013, n=465; 2014, n=468; 2015, n=778 2012 2013 2014 2015 How easily you managed to find the information you wanted 94% 99% 99% 98% The amount of information provided on the website 92% 100% 98% 97%
Research Resource Dundee City Council 56

8.11 Amount of information provided about the Council and its services (Q53) 8 in 10 participants (85%) were of the opinion that they received enough information about the Council and the services it provides. This is marginally less than 2014 where 90% said they received enough information. Generally, do you feel that you receive enough information about the Council and the services it provides? Base: 2012, n=2002; 2013, n=2011; 2014, n=1812; 2015, n=1817 2012 2013 2014 2015
Yes 89 % 93% 90% 85%
8.12 Internet access (Q54) Over eight in ten participants (84%) said that they access the internet in some way with 77% stating they have internet access at home, 54% stating they access the internet via a mobile phone, 29% having internet access at work and 7% stating they access the internet through public access. Compared to the 2014 results there has been an increase in the proportion of participants who had internet access, increasing from 76% in 2014 to 84% in 2015. Do you or your household access the internet in any of the following ways… Base: 2012, n=2002; 2013, n=2011; 2014, n=1812; 2015, n=1817 2012 2013 2014 2015
Internet access at home 57% 64% 71% 77% Internet access via a mobile phone 18% 27% 32% 54% Internet access at work 10% 11% 7% 29% Internet access through public access e.g. at library 5% 4% 2% 7% Access the internet in some other way 4% 5% 1% 3% None of these - I do not access the internet 32% 29% 26% 16%
Analysis by age reveals that the proportion of participants who had any internet access decreases with age, for example from 100% of those aged 16-24 to 24% of those aged 75 and over. Compared to the 2014 survey the proportion of older participants accessing the internet in some way has increased significantly for example 6% of participants aged 75 and over stated the had access to the internet in some way in 2014 compared to 24% of participants in 2015.
In terms of geography, participants who lived in the West End were the most likely to have access to and use the internet (93%) and those who lived in Lochee were the least likely (76%).
Research Resource Dundee City Council 57

8.13 Vulnerable Adults (Q55) Participants were asked for their opinions on a couple of statements regarding vulnerable adults.35% were aware that the Council have procedures in place to respond to situations where vulnerable adults might be at risk of harm, which is significantly less than what was reported in 2014 (68%). Just under six in ten participants (57%) said they would know who to contact if they had concerns that a vulnerable adult was at risk of being abused, which is a significant decrease since the 2014 results (85%) and the lowest to date. Vulnerable adults (% stating yes) Base: 2013, n=2011; 2014, n=1812, 2015, n=1817 2013 2014 2015 Do you know that the Council have procedures in place to respond to situations where vulnerable adults might be at risk of harm? 58% 68% 35%
Would you know who to contact if you had concerns that a vulnerable adult was at risk of being abused? 71% 85% 57%
Analysis by age reveals that participants aged 35-54 were most likely to be aware of the Council’s procedures in place to respond to situations where vulnerable adults might be at risk of harm (41%). This age group was also the most likely to know who to contact should they have any concerns about a vulnerable adult (64%). Those who lived in accommodation rented from a private landlord were the least likely to be aware of the Council’s procedures to respond to situations (19%). This group was also the least likely to know who to contact should they have any concerns about a vulnerable adult (42%). Council tenants were the most likely to be aware of the Councils procedures to respond to situations where vulnerable adults may be at risk of harm (40%) and they were the most likely to know who to contact if they have any concerns about a vulnerable adult (66%). In terms of area, those who live in the most deprived areas (42%) were more likely to be aware of the Council’s procedures than those who live in all other areas (29%). Participants living in the most deprived areas were also significantly more likely to know who to contact if they had concerns about a vulnerable adult (66%) than those from all other areas (49%).
Research Resource Dundee City Council 58

9. VIEWS ABOUT THE COUNCIL
9.1 Statements about the Council - most important (Q56)
Participants were asked to select from a list of statements about their local council which three they considered most important. This revealed that the following were considered to be most important for survey participants: Providing an efficient service (49%) Providing good quality service (49%) Providing services which are value for money (48%)
The proportion of participants who said that providing good quality service was a priority has seen an increase of 12 percentage points since 2014. I am going to read out a list of statements about your local Council and would like you to tell me which 3 are of the most importance to you. Base: 2012, n=2002; 2013, n=2011; 2014, n=1912; 2015, n=1817 2012 2013 2014 2015 Providing an efficient service 37% 52% 56% 49% Providing services which are value for money 51% 50% 52% 48% Tackling important issues for the future of the area 30% 32% 48% 45% Offering a good range of services 39% 47% 44% 42% Providing good quality services 40% 60% 37% 49% Listening to complaints 11% 14% 20% 16% Ensuring sustainable use of resources and care for the environment 11% 9% 17% 18% Communicating well with the public 7% 9% 12% 7% Having friendly, polite, helpful, well informed employees 29% 18% 9% 17% Promoting its services well 14% 5% 4% 9%
The table below shows the top priority for each area. Providing a good quality service was the top priority for those who lived in the West End and the Ferry. Participants residing in the North East, Strathmartine, and Maryfield selected tackling important issues for the future of the area as their top priority, while participants from Coldside and Lochee selected providing services which are value for money as their top priority. Those who lived in the East End rated both tackling important issues for the future of the area and providing services which are value for money as their top priority. Top priority per ward Ward Priority % West End Providing good quality services 73%
North East Tackling important issues for the future of the area 56%
Strathmartine Tackling important issues for the future of the area 58%
The Ferry Providing good quality services 75%
East End Tackling important issues for the future of the area 57%
Providing services which are value for money 57% Coldside Providing services which are value for money 56% Lochee Providing services which are value for money 50%
Maryfield Tackling important issues for the future of the area 56%
Research Resource Dundee City Council 59

Analysis by age reveals that Providing an efficient service was more important for those aged 55-64 (54%) than those aged
35-54 (46%) and 65 and over (46%). Providing services which are value for money was significantly more important for those aged
65 and over (56%) than those aged 16-34 (43%) Tackling important issues for the future of the area was more important for those aged 16-34
(49%) than those aged 65 and over (40%) The main differences by tenure were: Providing services which are value for money: Most important for respondents who rent their
home from the Council (55%) and least important for private rented tenants. Providing good quality services: Most important for home owners (53%) and least important for
Council tenants (38%) Offering a good range of services: Most important for respondents who lived in private rented
accommodation (47%) and least important for tenants of RSL (36%).
Research Resource Dundee City Council 60

9.2 Agreement with statements about the Council (Q57) Following on from this, participants were asked to state the extent to which they agreed or disagreed with various statements about the Council. Participants were most likely to agree with the following statements: Offers a good range of services (77%) Provides an efficient service (67%) Provides good quality services (67%)
The level of agreement with offers a good range of services has increased by 8 percentage points since the 2014 survey. As well as an increase in levels of agreement a number of statements have also seen a decrease since the 2014 survey. The largest decreases can be seen in terms of: Tackles important issues for the future of the area (decreased by 7 percentage points) Provides services which are value for money (decreased by 6 percentage points) Listens to complaints (decreased by 8 percentage points)
Agreement with statements about your local Council (% agree) Base: 2012, n=2002; 2013, n=2011; 2014, n=1812; 2015, n=1817 2012 2013 2014 2015 Offers a good range of services 77% 84% 69% 77%
Provides an efficient service 66% 81% 66% 67%
Provides good quality services 73% 79% 66% 67%
Has friendly, polite, helpful, well informed employees 63% 69% 63% 64%
Ensures sustainable use of resources and care for the environment 56% 60% 62% 51%
Provides services which are value for money 57% 72% 62% 56%
Tackles important issues for the future of the area 55% 61% 62% 55%
Promotes its services well 55% 60% 60% 52%
Communicates well with the public 52% 61% 59% 60%
Listens to complaints 46% 58% 57% 49% Participants aged 16 to 34 were the least likely to agree with all statements. The proportion of participants who agreed with these statements varied most significantly in terms of the following: Provides an efficient service: 60% of 16 to 34 year olds in agreement compared to 79% of
those aged 65 and over. Ensures sustainable use of resources and care for the environment: 42% of 16 to 34 year olds
in agreement compared to 61% of those aged 55-64. Provides good quality services: 59% of 16 to 34 year olds in agreement compared to 77% of
those aged 65 and over.
The results vary significantly by those who lived in the most deprived areas. The biggest differences can be seen with regards to the following statements: Offers a good range of services: 69% of respondents who live in the most deprived areas
agreed with this statement compared to 83% for all other respondents. Tackles important issues for the future of the area: 61% of respondents who live in the most
deprived areas agreed with this statement compared to 51% for all other respondents. Promotes its services well: 57% of respondents who live in the most deprived areas agreed
with this statement compared to 48% for all other respondents. Ensures sustainable use of resources and care for the environment: 56% of respondents who
live in the most deprived areas agreed with this statement compared to 47% for all other respondents.
Research Resource Dundee City Council 61

Participants who rented their home from a private landlord were the least likely to agree with all statements. The largest differences can be seen with regards to the following statements: Listens to complaints: The level of agreement ranged from 32% for those living in private
rented accommodation to 64% for Council tenants. Tackles important issues for the future of the area: The level of agreement ranged from
35% for those living in private rented accommodation to 65% for Council tenants. Has friendly, polite, helpful, well informed employees: The level of agreement ranged from
47% for those living in private rented accommodation to 76% for Council tenants.
Research Resource Dundee City Council 62
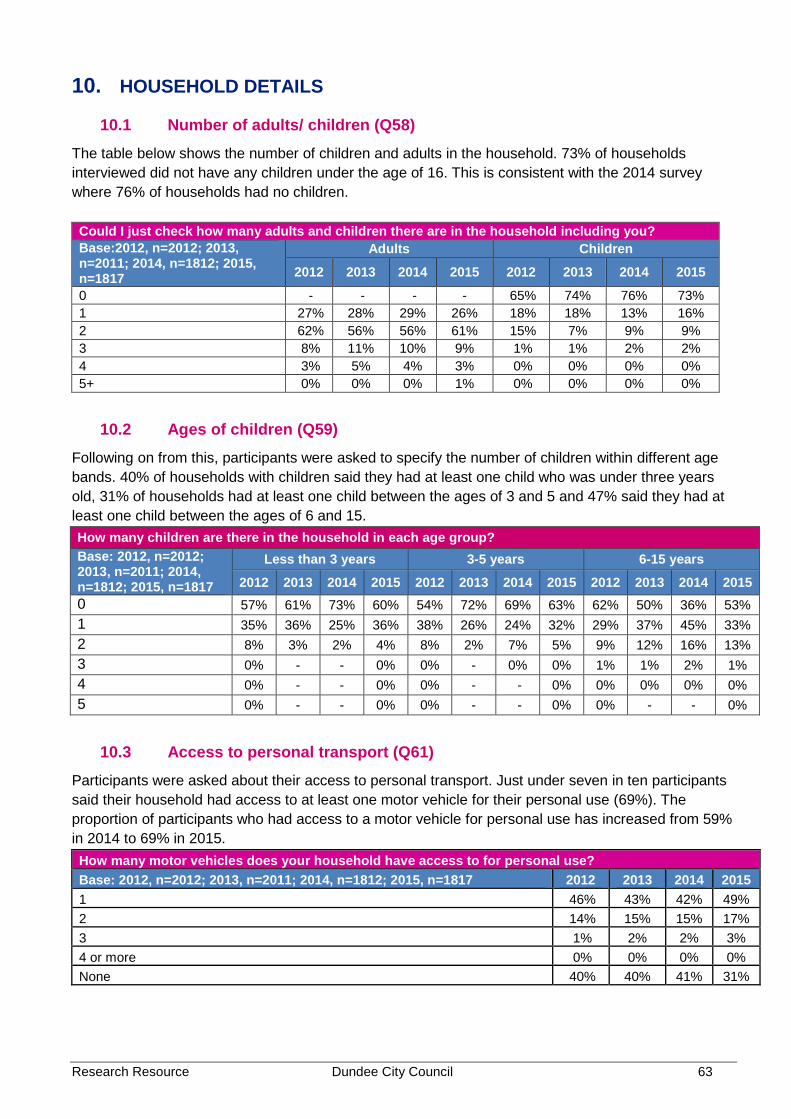
10. HOUSEHOLD DETAILS
10.1 Number of adults/ children (Q58)
The table below shows the number of children and adults in the household. 73% of households interviewed did not have any children under the age of 16. This is consistent with the 2014 survey where 76% of households had no children. Could I just check how many adults and children there are in the household including you? Base:2012, n=2012; 2013, n=2011; 2014, n=1812; 2015, n=1817
Adults Children
2012 2013 2014 2015 2012 2013 2014 2015
0 - - - - 65% 74% 76% 73% 1 27% 28% 29% 26% 18% 18% 13% 16% 2 62% 56% 56% 61% 15% 7% 9% 9% 3 8% 11% 10% 9% 1% 1% 2% 2% 4 3% 5% 4% 3% 0% 0% 0% 0% 5+ 0% 0% 0% 1% 0% 0% 0% 0%
10.2 Ages of children (Q59)
Following on from this, participants were asked to specify the number of children within different age bands. 40% of households with children said they had at least one child who was under three years old, 31% of households had at least one child between the ages of 3 and 5 and 47% said they had at least one child between the ages of 6 and 15. How many children are there in the household in each age group? Base: 2012, n=2012; 2013, n=2011; 2014, n=1812; 2015, n=1817
Less than 3 years 3-5 years 6-15 years
2012 2013 2014 2015 2012 2013 2014 2015 2012 2013 2014 2015 0 57% 61% 73% 60% 54% 72% 69% 63% 62% 50% 36% 53% 1 35% 36% 25% 36% 38% 26% 24% 32% 29% 37% 45% 33% 2 8% 3% 2% 4% 8% 2% 7% 5% 9% 12% 16% 13% 3 0% - - 0% 0% - 0% 0% 1% 1% 2% 1% 4 0% - - 0% 0% - - 0% 0% 0% 0% 0% 5 0% - - 0% 0% - - 0% 0% - - 0%
10.3 Access to personal transport (Q61)
Participants were asked about their access to personal transport. Just under seven in ten participants said their household had access to at least one motor vehicle for their personal use (69%). The proportion of participants who had access to a motor vehicle for personal use has increased from 59% in 2014 to 69% in 2015. How many motor vehicles does your household have access to for personal use? Base: 2012, n=2012; 2013, n=2011; 2014, n=1812; 2015, n=1817 2012 2013 2014 2015 1 46% 43% 42% 49% 2 14% 15% 15% 17% 3 1% 2% 2% 3% 4 or more 0% 0% 0% 0% None 40% 40% 41% 31%
Research Resource Dundee City Council 63

10.4 Ethnicity (Q65) In terms of ethnicity, 85% of participants were Scottish. The proportion of participants stating they were Scottish has decreased from the 2014 results where 93% of respondents said they were Scottish. Which of the groups on this card do you consider you belong to? Base: 2012, n=2002; 2013, n=2011; 2015, n=1817 2012 2013 2014 2015 Scottish 96.4% 94.6% 93.2% 85.0% Other British 1.6% 1.6% 2.5% 6.0% Irish 0.3% 0.3% 0.4% 0.0% Gypsy/ Traveller 0.0% 0.1% - 0.0% Polish 0.6% 1.4% 1.4% 3.0% Any other white ethnic group 0.5% 0.5% 1.1% 1.0% Any mixed or multiple ethnic groups 0.0% 0.0% 0.1% 0.0% Pakistani, Pakistani Scottish or Pakistani British 0.2% 0.5% 0.2% 1.0% Indian, Indian Scottish or Indian British 0.0% 0.2% 0.1% 0.0% Bangladeshi, Bangladeshi Scottish or Bangladeshi British 0.0% 0.1% 0.0% 0.0% Chinese, Chinese Scottish ior Chinese British 0.0% 0.1% 0.1% 0.0% Other 0.1% 0.3% 0.3% 1.0% African, African Scottish or African British 0.1% 0.2% 0.1% 0.0% Caribbean, Caribbean Scottish ior Caribbean British 0.0% 0.0% 0.1% 0.0% Black, Black Scottish or Black British 0.1% 0.0% - 0.0% Other 0.0% 0.0% - 0.0% Arab 0.0% 0.0% 0.0% 1.0% Any other background 0.0% 0.1% - 0.0% Refused 0.0% 0.0% 0.2% 0.0% Don't know 0.0% 0.0% 0.2% 0.0%
Research Resource Dundee City Council 64

10.5 Health and disability status (Q62/63) 17% of households had at least one member who had some form of long term health problem or disability which is less than in 2014 (18%). The majority said this was regarding a mobility or physical disability (75%). What is the nature of the disability? Base: 2012, n=429; 2013, n=487; 2014, n=351; 2015, n=286 2012 2013 2014 2015 Mobility/ physical disabilities 78% 85% 67% 75% Mental health condition 9% 6% 14% 10% Difficulties with sight 3% 4% 1% 4% Difficulties with hearing 1% 3% 5% 2% Developmental disorder (eg Autistic Spectrum Disorder or Asperger's syndrome) 1% 1% 0% 2%
Learning difficulties (eg dyslexia) 1% 1% 2% 1% Learning disability (eg Down’s Syndrome) 0% - 1% 0% Other condition 14% 6% 11% 14% Refused - 2% 3% 1%
10.6 Religion (Q64)
In terms of religion, 28% were Church of Scotland and 13% Roman Catholic. A further 53% said they did not belong to any religion. What is your religion? Base: 2012, n=2002; 2013, n=2011; 2014, n=1812; 2015, n=1817 2012 2013 2014 2015 None 49% 58% 62% 53% Church of Scotland 30% 23% 19% 28% Roman Catholic 18% 16% 16% 13% Other Christian 1% 1% 1% 2% Muslim 0% 1% 0% 3% Hindu 0% 0% 0% 0% Buddhist 0% 0% 0% 0% Another religion 0% 1% 1% 1% Would rather not say 2% 0% 1% 0%
Research Resource Dundee City Council 65

10.7 Income (Q66) The table below shows the weekly and annual income for households. 46% of participants refused to answer this question and 10% were unsure. Which group the annual household falls. Please use net income from all sources ie after deductions of income tax, national insurance and other compulsory deductions. Please take into account any money you may have from employment, including bonuses, overtime, pensions, state pensions, welfare benefits and interest from savings Base: 2012, n=2002; 2013, n=2011; 2014, n=1812; 2015, n=1817 2012 2013 2014 2015 Less than £100 per week / £5,299 per year 2% 2% 2% 1% £100-199 per week / £5,300 - £10,399 per year 6% 8% 7% 5% £200-299 per week / £10,400-£15,599 per year 8% 7% 6% 8% £300-399 per week / £15,600-£20,799 per year 7% 5% 8% 6% £400-£499 per week / £20,800 - £25,999 per year 3% 6% 6% 8% £500-£599 per week / £26,000 - £31,199 per year 2% 5% 3% 6% £600 or more per week / £31,200 or more per year 6% 7% 8% 10% Don't Know 22% 13% 10% 10% Would rather not say 45% 46% 51% 46%
Research Resource Dundee City Council 66

Appendix 1
Multi Member Ward and CRA Analysis
Research Resource Dundee City Council 67

West End
CITIZENS' SURVEY 2015 SQ1 Community Regeneration area: 0% Ardler, St Mary's and Kirkton 1% Beechwood, Lochee, Menziehill and Charleston 0% Coldside and Maryfield 0% Fintry, Whitfield and Mill O Mains 0% Mid Craigie, Linlathen and Douglas 99% None SQ2 Ward
100% West End
0% Maryfield 0% The Ferry 0% Coldside 0% Lochee 0% East End 0% North East 0% Strathmartine
Research Resource Dundee City Council 68

Q1 What do you like best about living in this neighbourhood? 0% Close to beach/ coast 1% Quality of housing 7% Close to shops/ quality of shops/ amenities 0% Always lived here/ familiar with/ know area 21% Pleasant/ nice area 16% Friendly people/ neighbours/ family and friends 59% Quiet/ peaceful 32% Convenient location 7% Central location 3% Other 0% None/ nothing 0% Don't know 0% Lots for kids to do 0% Lots of green/ open spaces/ countryside/ nice views 4% Safe 0% Good public transport 0% Everything 4% It's ok/ fine/ I like it here/ no problems Q2 What do you like least about living in this neighbourhood? 0% Littering/ dirty/ dog fouling 7% Difficult/ poor parking 0% Drug problems 0% Lack of facilities for youths/ children 8% ASB/ neighbours/ noisy 0% Youths/ gangs causing trouble 0% Poor shops 0% Vandalism 2% Other 80% None/ nothing 0% Lack of security 0% Don't know 2% Speeding cars/ traffic 0% Lack of transport/ poor public transport 2% Area going downhill/ untidy/ rundown 0% Roads/ pavements/ winter gritting/ snow clearing 0% Bin uplifts/ refuse collection 1% Too many private lets/ undesirables moving into the area 0% Too many stairs/ hills 0% Not much for people to do in general Q3 How long have you lived in this neighbourhood? 23% Up to one year 17% 1-2 years 22% 3-5 years 5% 6-10 years 27% Over 10 years 5% Always lived there 0% Don't know
Research Resource Dundee City Council 69

Q4 Could you please tell me if you think this neighbourhood has changed over the past 5 years, or since you've been living here if it's less than 5 years?
1% Yes - has got better 2% Yes - has got worse 57% No change 40% Don't know Q5better In what ways do you think it has changed? (GOT BETTER) 0% Access to parks/ open spaces 0% Better facilities/ amenities 0% Less vandalism 0% Housing improvements - new houses 0% Improved schools 100% Cleaner/ tidier/ less litter 0% Improved shops 0% Fewer drug problems 0% Friendliness of people/ neighbours 0% Quieter/ more peaceful 0% Other 0% Not sure 0% Less people hanging around street 0% Less crime 0% More young families in the area Q5worse Q5 In what ways do you think it has changed? (GOT WORSE) 0% Lack of parks/ open spaces 0% Overgrown gardens/ uncut grass 0% Poorer shops 0% More vandalism 0% Undesirable people moving in 0% Lack of facilities for youths/ children 0% ASB/ neighbours/ noisy 0% People/ neighbours less friendly 0% Youths/ gangs causing problems 0% Drug/ alcohol problems 45% Other 0% Not sure 0% More crime 0% People don't care about area 0% Too many private lets 0% Litter problems/ area is dirty 55% Area is rundown/ going downhill 0% More houses being built 0% Parking 0% Condition of roads/ pavements 0% More traffic/ motorbikes/ roads unsafe
Research Resource Dundee City Council 70

Q6 Thinking now about the neighbourhood you live in, how would you rate it as a place to live?
39% Very good 60% Fairly good 0% Fairly poor 0% Very poor 1% No opinion Q7 How long have you lived in this house/ flat? 24% Up to one year 16% 1-2 years 26% 3-5 years 4% 6-10 years 28% Over 10 years 1% Always lived here 0% Don't know Q8 Please tell me which of the descriptions on this card best describes your house/ flat? 9% Rented from the Council 14% Rented from a housing association 38% Rented from a private landlord 32% Owned by you (not ex Council) 8% Owned by you (ex Council) 0% Other (please specify) Q9 Overall, how do you rate the general condition of this (your) house/ flat? 13% Very good 75% Fairly good 11% Average 0% Fairly poor 0% Very poor 1% Don't know
Research Resource Dundee City Council 71
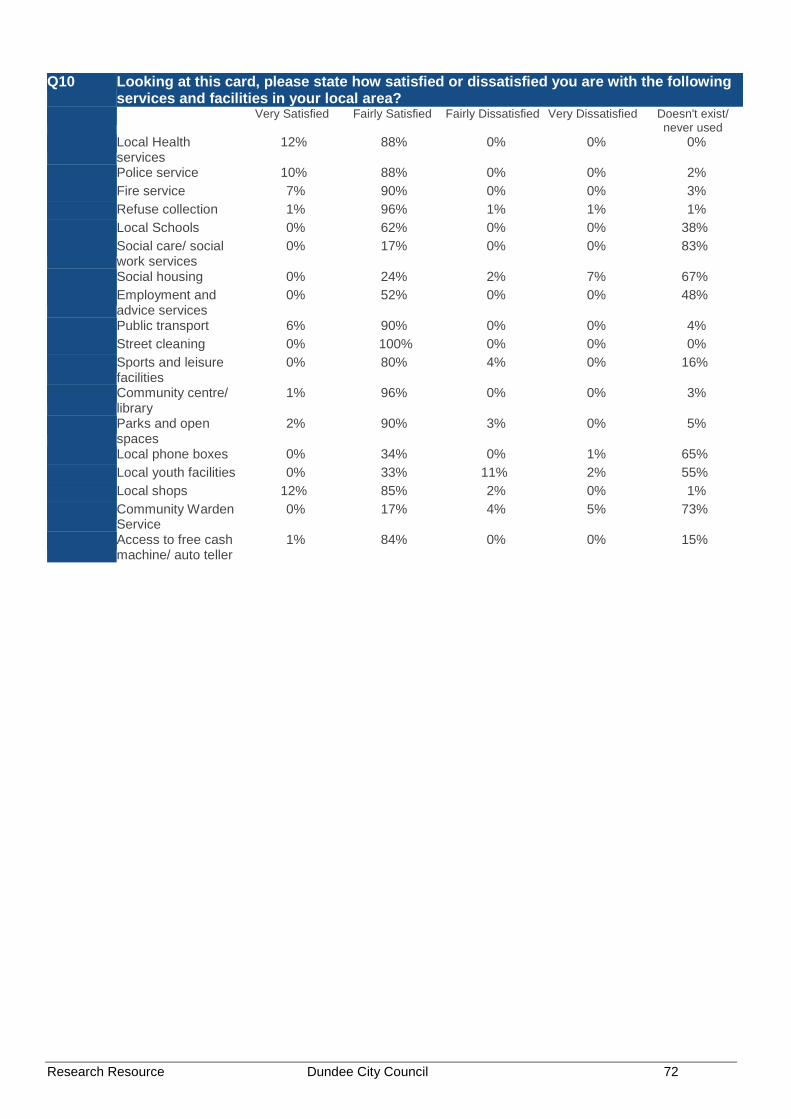
Q10 Looking at this card, please state how satisfied or dissatisfied you are with the following services and facilities in your local area?
Very Satisfied Fairly Satisfied Fairly Dissatisfied Very Dissatisfied Doesn't exist/ never used
Local Health services
12% 88% 0% 0% 0%
Police service 10% 88% 0% 0% 2% Fire service 7% 90% 0% 0% 3% Refuse collection 1% 96% 1% 1% 1% Local Schools 0% 62% 0% 0% 38% Social care/ social
work services 0% 17% 0% 0% 83%
Social housing 0% 24% 2% 7% 67% Employment and
advice services 0% 52% 0% 0% 48%
Public transport 6% 90% 0% 0% 4% Street cleaning 0% 100% 0% 0% 0% Sports and leisure
facilities 0% 80% 4% 0% 16%
Community centre/ library
1% 96% 0% 0% 3%
Parks and open spaces
2% 90% 3% 0% 5%
Local phone boxes 0% 34% 0% 1% 65% Local youth facilities 0% 33% 11% 2% 55% Local shops 12% 85% 2% 0% 1% Community Warden
Service 0% 17% 4% 5% 73%
Access to free cash machine/ auto teller
1% 84% 0% 0% 15%
Research Resource Dundee City Council 72

Q11 And, looking at this card, how easy is it for you to access those services and facilities in your local area?
Very easy Fairly easy Fairly difficult Very difficult Doesn't exist/ never used
Local Health services
3% 97% 0% 0% 0%
Police service 4% 95% 0% 0% 1% Fire service 4% 96% 0% 0% 0% Refuse collection 2% 95% 2% 0% 1% Local Schools 3% 62% 0% 0% 35% Social care/ social
work services 1% 23% 0% 0% 76%
Social housing 1% 21% 3% 7% 68% Employment and
advice services 1% 52% 0% 0% 47%
Public transport 7% 89% 0% 0% 4% Street cleaning 1% 99% 0% 0% 0% Sports and leisure
facilities 1% 78% 3% 0% 18%
Community centre/ library
1% 95% 0% 0% 4%
Parks and open spaces
4% 90% 1% 0% 5%
Local phone boxes 1% 35% 0% 1% 63% Local youth facilities 1% 34% 6% 3% 56% Local shops 10% 89% 1% 0% 0% Community Warden
Service 1% 16% 3% 6% 73%
Access to free cash machine/ auto teller
4% 81% 0% 0% 15%
Q12 Looking at this card, how satisfied are you with the following in this neighbourhood? Very satisfied Fairly satisfied Fairly dissatisfied Very dissatisfied Don't know Children's Play areas 2% 56% 7% 0% 35% Cleanliness of
Streets 0% 99% 1% 0% 0%
Shopping Facilities 3% 97% 0% 0% 0% Condition of roads,
pavements and street lighting
0% 88% 12% 0% 0%
Quality and maintenance of open spaces
0% 97% 3% 0% 0%
Cleanliness of the area around your home
1% 98% 1% 0% 0%
The built environment (e.g. buildings, heritage etc)
1% 99% 0% 0% 0%
The natural environment (e.g. parks, open spaces, countryside etc)
1% 95% 2% 0% 2%
Research Resource Dundee City Council 73

Q13 Overall, how satisfied are you with the quality of life in this neighbourhood? 27% Very satisfied 73% Satisfied 0% Dissatisfied 0% Very dissatisfied Q14 Overall, how satisfied are you with the quality of life in Dundee? 26% Very satisfied 74% Satisfied 0% Dissatisfied 0% Very dissatisfied Q15 Can you tell me firstly, if you are aware of any of these in this area? 9% After school/ children's club 3% Youth clubs/ projects or drop-in centres 11% Voluntary Youth Organisations 0% Youth Information Services 4% Other Youthwork activities 17% Organised Sporting activities/ classes/ clubs 15% Organised Social/ Leisure activities/ classes/ clubs 4% Learning groups or adult education classes 1% Self-help or social care groups 2% Community Festivals/ Events e.g. Gala Day 1% Community Council or Neighbourhood Group 1% Community Regeneration Forum or Group 2% Local Consultation Activities or Events 66% None
Research Resource Dundee City Council 74

Q15 And then, if you are aware, how often do you, or anyone living in your home, take part in activities like these?
Daily Weekly Monthly Seldom Never After school/
children's clubs 0% 43% 0% 12% 44%
Youth clubs/ projects or drop-in centres
0% 0% 0% 0% 100%
Voluntary Youth Organisations
27% 44% 0% 0% 29%
Youth Information Services
0% 0% 0% 0% 0%
Other Youthwork activities
0% 75% 0% 0% 25%
Organised Sporting activities/ classes/ clubs
12% 57% 0% 7% 24%
Organised Social/ Leisure activities/ classes/ clubs
0% 50% 0% 8% 42%
Learning groups or adult education classes
0% 26% 49% 0% 25%
Self-help or social care groups
0% 100% 0% 0% 0%
Community Festivals/ Events e.g. Gala Day
0% 0% 0% 100% 0%
Community Council or Neighbourhood Group
0% 0% 0% 0% 100%
Community Regeneration Forum or Group
0% 0% 0% 100% 0%
Local Consultation Activities or Events
0% 42% 0% 58% 0%
Q16 Q16 Thinking back over the last 12 months, have you given up any time to help any clubs,
charities, campaigns or organisations. I mean in an unpaid capacity. 3% Yes 97% No
Research Resource Dundee City Council 75
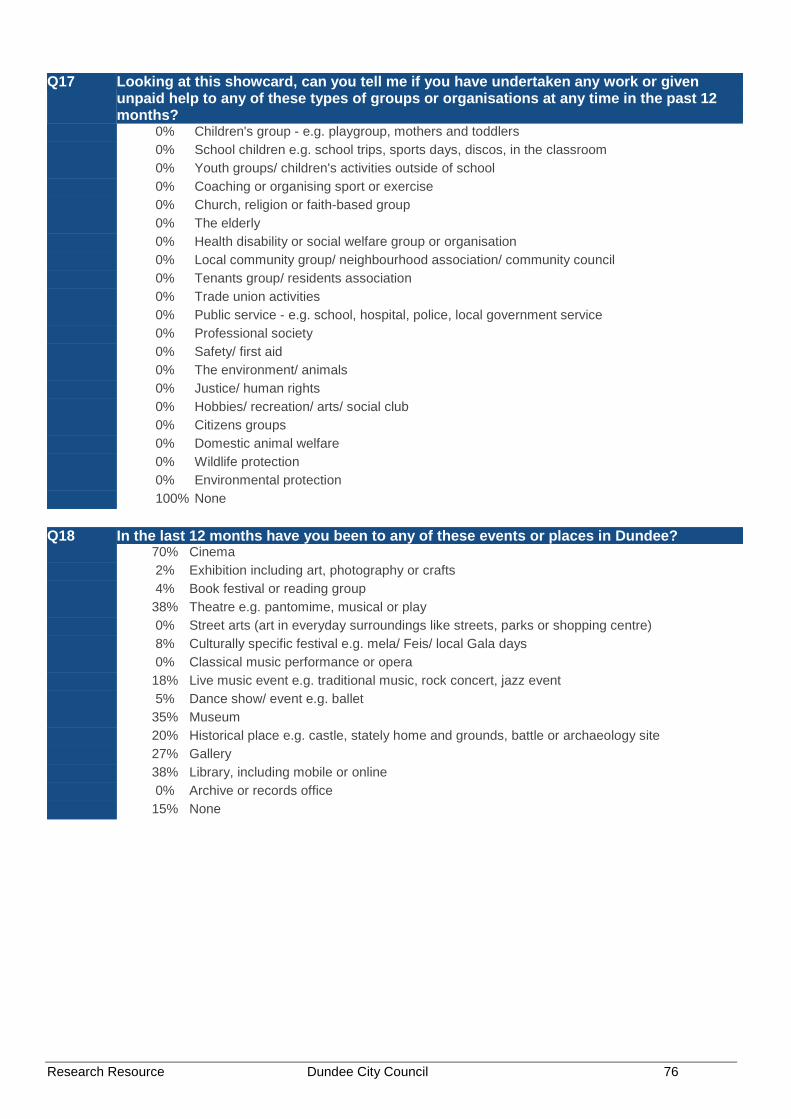
Q17 Looking at this showcard, can you tell me if you have undertaken any work or given unpaid help to any of these types of groups or organisations at any time in the past 12 months?
0% Children's group - e.g. playgroup, mothers and toddlers 0% School children e.g. school trips, sports days, discos, in the classroom 0% Youth groups/ children's activities outside of school 0% Coaching or organising sport or exercise 0% Church, religion or faith-based group 0% The elderly 0% Health disability or social welfare group or organisation 0% Local community group/ neighbourhood association/ community council 0% Tenants group/ residents association 0% Trade union activities 0% Public service - e.g. school, hospital, police, local government service 0% Professional society 0% Safety/ first aid 0% The environment/ animals 0% Justice/ human rights 0% Hobbies/ recreation/ arts/ social club 0% Citizens groups 0% Domestic animal welfare 0% Wildlife protection 0% Environmental protection 100% None Q18 In the last 12 months have you been to any of these events or places in Dundee? 70% Cinema 2% Exhibition including art, photography or crafts 4% Book festival or reading group 38% Theatre e.g. pantomime, musical or play 0% Street arts (art in everyday surroundings like streets, parks or shopping centre) 8% Culturally specific festival e.g. mela/ Feis/ local Gala days 0% Classical music performance or opera 18% Live music event e.g. traditional music, rock concert, jazz event 5% Dance show/ event e.g. ballet 35% Museum 20% Historical place e.g. castle, stately home and grounds, battle or archaeology site 27% Gallery 38% Library, including mobile or online 0% Archive or records office 15% None
Research Resource Dundee City Council 76

Q19 If you have not taken part in any community activities or organisations, can you tell me why this is?
16% It costs too much 0% I don't know enough about it 0% Never occurred to me 52% Not really interested 0% I don't have anyone to go with 0% I wouldn't enjoy it 0% Not enough facilities close to where I live 7% Health isn't good enough 0% I might feel uncomfortable or out of place 0% Lack of transport/ I can't easily get to it 0% Poor access to venues (e.g. no disabled ramps) 0% Not enough information on what is available 0% Didn't enjoy it last time 25% It's difficult to find the time 0% I would feel unsafe going to/ from the activity/ event 0% I would feel unsafe at the activity/ event 0% Other Q20 Please tell me to what extent you agree or disagree with the following statements? Strongly agree Tend to agree Neither agree
nor disagree Tend to disagree
Strongly disagree
No opinion
I can influence decisions affecting my local area
0% 37% 16% 31% 0% 17%
People in my community can influence decisions affecting my local area
0% 49% 8% 27% 0% 17%
Q21 First of all could you tell me whether you are registered with.... a GP or health centre? 99% Yes 1% No 0% Don't know Q21 First of all could you tell me whether you are registered with.... a dentist? 94% Yes 6% No 0% Don't know Q22 How good is your health overall? 31% Very good 56% Good 10% Fair 3% Poor 0% Very poor 0% Don't know
Research Resource Dundee City Council 77

Q23 In a typical week, how often do you undertake moderate physical activity for at least 30 minutes in a day?
83% 4 days a week or more 14% 1-3 days a week 1% Less than once a week 2% Never Q24 Are you, or have you ever been, a smoker? 21% Currently smoke 22% Used to smoke 57% Never smoked Q25 How often do you have (8 for men/ 6 for women) or more alcoholic drinks on one
occasion? 2% Daily or almost daily 47% Weekly 13% Monthly 12% Less than monthly 26% Never 0% Don't know Q26 Please say which option best describes your experience over the last 2 weeks. None of the time Rarely Some of the time Often All of the time I've been feeling
optimistic about the future
0% 5% 39% 50% 7%
I've been feeling useful
0% 6% 35% 56% 3%
I've been feeling relaxed
0% 4% 60% 35% 1%
I've been feeling interested in other people
0% 2% 50% 47% 1%
I've had energy to spare
0% 9% 65% 26% 0%
I've been dealing well with problems
0% 1% 47% 49% 3%
I've been thinking clearly
0% 0% 19% 68% 14%
I've been feeling good about myself
0% 1% 58% 35% 6%
I've been feeling close to other people
0% 3% 33% 62% 2%
I've been feeling confident
0% 5% 45% 38% 12%
I've been able to make up my mind about things
0% 0% 26% 58% 16%
I've been feeling loved
0% 2% 36% 42% 21%
I've been interested in new things
0% 6% 57% 36% 1%
I've been feeling cheerful
0% 1% 38% 57% 4%
Research Resource Dundee City Council 78

Q27 On a scale of 1 to 6 where 1 is not at all and 6 is a great deal, to what extent do you feel that people treat you unfairly?
42% 1 - Not at all 41% 2 14% 3 3% 4 0% 5 0% 6 - A great deal 0% Don't know Q28 To what extent do you agree with the statement "I could turn to friends/ relatives in this
neighbourhood for support? 18% Strongly agree 74% Tend to agree 8% Tend to disagree 0% Strongly disagree 1% Don't know Q29 Are you currently taking part in any of these forms of education/ classes of training? 61% None 4% On the job training 0% An FE college course 33% A university based course 2% Distance learning/ Open University 0% School 0% Adult education or evening class 0% Help with reading, writing or use of numbers 0% Other Q30 What type of qualification, if any, will this lead to. Would it lead to... 5% No qualification 84% A qualification at degree level or above 13% Another qualification Q31 Taking everything into account how safe do you feel your neighbourhood is as a place to
live? 72% Very safe 28% Fairly safe 0% A bit unsafe 0% Very unsafe 0% Don't know Q32 How safe do you feel when... Very safe Fairly safe A bit unsafe Very unsafe Don't know Alone in your home
during the day 100% 0% 0% 0% 0%
Alone in your home at night
100% 0% 0% 0% 0%
Walking alone in your neighbourhood during the day
76% 24% 0% 0% 0%
Walking alone in your neighbourhood after dark
21% 55% 15% 0% 9%
Research Resource Dundee City Council 79

Q33 Do you think that the amount of crime in your neighbourhood has increased or decreased
over the past year? 0% Decreased a lot 1% Decreased a little 50% Remained the same 0% Increased a little 0% Increased a lot 49% Don't know Q34 If you feel crime has increased in your neighbourhood, what has influenced your option? 0% Personal experience of crime 0% Experience of family or friends 0% Talking to people in the area 0% Media - television, radio, paper 0% Social media internet sites e.g. Facebook, Twitter 0% Internet sites 0% Police or Council publications 0% Other Q35 What, in your opinion, is the main factor which contributes most to the level of crime in
your neighbourhood? 4% Boredom/ nothing to do/ lack of facilities 28% Don't know 0% Driving offences/ speeding/ motorbikes 0% Immigrants 35% Alcohol/ Drugs 0% Nothing 12% Lack of money/ poverty 7% Unemployment 0% Prostitution 1% New people/ undesirables moving into area/ not knowing who your neighbours are 0% Anti social behaviour 1% Crime e.g. Break ins/ burglary/ vandalism 11% This is a good area/ neighbourhood/ quiet/ no trouble 0% Lack of discipline/ parental control 9% Opportunists/ some people can't help themselves 0% Lack of policing/ wardens 6% Other 1% Gangs/ youths Q36 To what extent, if it all, does a fear of crime prevent you from taking part in your every day
activities? 78% Not at all 19% A little 4% Quite a lot 0% A great deal 0% Don't know
Research Resource Dundee City Council 80

Q37 Which of these accounts, if any, do you or your partner have? 88% Bank account 2% Building society account 0% Credit union account 3% Post Office card account 0% No, none of these 10% Prefer not to say Q38 Do you have insurance for the contents of your house such as for furniture, electrical
goods etc? 68% Yes 22% No 4% Prefer not to say 7% Don't know Q39 Think about the total value of any savings or investments you have, at the moment do
you (or your partner) have total savings or investments worth £1,000 or more in any combination of the places mentioned on this card, do you have less than £1,000 in savings or investments or do you have no savings or investments at all?
16% No savings 4% Less than £1,000 30% £1,000 or more 3% Don't know 47% Prefer not to say Q40 Are you currently experiencing, or within the last year have you had any difficulties with
the following? 0% Mortgage or rent payments 0% Changes to benefits 0% Council tax payments 0% Loan or credit card payments 5% Cost of food 22% Cost of domestic energy bills 1% Vehicle fuel prices 71% None of the above 7% Prefer not to say Q41 Taking everything together, which of these phrases on this card best describes how you
and your household are managing financially these days? 1% Manage very well 30% Manage quite well 65% Get by all right 5% Don't manage very well 0% Have some deep financial difficulties 0% Are in deep financial trouble 0% Refused 0% Don't know
Research Resource Dundee City Council 81

Q42 When you last contacted Dundee City Council, was this contact to ...? 4% Make a complaint 24% Seek information 18% Request a service 1% Make a suggestion 53% Have never contacted with Council Q43 Overall, how satisfied were you that the Council responded reasonably to your
complaint? 0% Very satisfied 75% Satisfied 0% Neither satisfied nor dissatisfied 25% Dissatisfied 0% Very dissatisfied Q44 Overall, how satisfied were you with this contact to seek information? 0% Very satisfied 96% Satisfied 0% Neither satisfied nor dissatisfied 4% Dissatisfied 0% Very dissatisfied Q45 Overall, how satisfied were you with this contact to request a service? 0% Very satisfied 90% Satisfied 0% Neither satisfied nor dissatisfied 10% Dissatisfied 0% Very dissatisfied Q46 On your most recent contact with the Council, did you.... 92% Get what you need at that contact 8% Have to contact the Council again about the same issue Q47 Was your most recent contact .... 4% By a letter 55% By a telephone call to the Council 27% By a personal visit to a Council office 15% By e-mail 0% By visiting the Council's website
Research Resource Dundee City Council 82

Q48 How satisfied or dissatisfied were you with your recent contact with the Council by telephone in terms of the following?
Very satisfied Fairly satisfied Neither nor Fairly dissatisfied
Very dissatisfied
Don't know
How easy it was for you to find the right number to call
0% 96% 4% 0% 0% 0%
How quickly the phone was answered
0% 73% 27% 0% 0% 0%
How easy it was to get through to someone who could help
4% 89% 4% 3% 0% 0%
Overall helpfulness/ friendliness/ courtesy of the staff you dealt with
4% 92% 4% 0% 0% 0%
How well the staff understood what you wanted
4% 96% 0% 0% 0% 0%
The outcome of your contact
4% 84% 0% 8% 4% 0%
Q49 How satisfied or dissatisfied were you with your recent contact when visiting a Council
office in terms of the following? Very satisfied Fairly satisfied Neither nor Fairly
dissatisfied Very
dissatisfied Don't know
How easy it was to get to the office
0% 100% 0% 0% 0% 0%
The suitability of the office e.g. waiting areas, privacy, access for disabled people etc
0% 70% 23% 7% 0% 0%
Overall helpfulness/ friendliness/ courtesy of the staff you dealt with
0% 93% 7% 0% 0% 0%
How well the staff understood what you wanted
0% 85% 8% 7% 0% 0%
The outcome of your contact
15% 61% 8% 15% 0% 0%
Q50 How satisfied or dissatisfied were you with your most recent cpntact with the Council by
email/ letter in terms of the following? Very satisfied Fairly satisfied Neither nor Fairly
dissatisfied Very
dissatisfied Don't know
How quickly you received a reply to your email/ letter
0% 89% 11% 0% 0% 0%
The extent to which the first reply you received answered your query
0% 100% 0% 0% 0% 0%
The outcome of your contact
0% 100% 0% 0% 0% 0%
Research Resource Dundee City Council 83

Q51 Have you ever used the Council's website? 42% Yes 58% No Q52 How satisfied or dissatisfied would you say you are with the website in terms of the
following? Very
satisfied Fairly
satisfied Neither nor Fairly
dissatisfied Very
dissatisfied Don't know Not
applicable How easily you
managed to find the information you wanted
21% 69% 5% 5% 0% 0% 0%
The amount of information provided on the website
21% 67% 7% 5% 0% 0% 0%
Q53 Generally, do you feel that you receive enough information about the Council and the
services it provides? 66% Yes 34% No Q54 Do you access, and use, the internet in any of the following ways... 87% Internet access at home 81% Internet access via a mobile phone 57% Internet access at work 31% Internet access through public access e.g. at library 0% Access the internet in some other way 7% None of these - I do not access the internet Q55 Do you know that the Council have procedures in place to respond to situations where
vulnerable adults might be at risk of harm? 20% Yes 80% No Q55 Would you know who to contact if you had concerns that a vulnerable adult was at risk of
being abused? 28% Yes 72% No Q56 I am going to read out a list of statements about your local Council and would like you to
tell me which 3 are of the most importance to you. Dundee City Council/ Angus Council... 44% Offering a good range of services 57% Providing an efficient service 37% Providing services which are value for money 73% Providing good quality services 11% Having friendly, polite, helpful, well informed employees 10% Promoting its services well 27% Tackling important issues for the future of the area 0% Listening to complaints 5% Communicating well with the public 36% Ensuring sustainable use of resources and care for the environment 0% Don't know
Research Resource Dundee City Council 84

Q57 I am going to read out the same list of statements again about your local Council. I would like you to tell me whether you agree or disagree with each of these statements. Dundee City Council/ Angus Council....
Agree Neither nor Disagree Don't know Offers a good range
of services 88% 12% 0% 0%
Provides an efficient service
50% 48% 2% 0%
Provides services which are value for money
35% 63% 2% 0%
Provides good quality services
47% 53% 0% 0%
Has friendly, polite, helpful, well informed employees
77% 23% 0% 0%
Promotes its services well
29% 71% 0% 0%
Tackles important issues for the future of the area
28% 71% 1% 0%
Listens to complaints 43% 54% 3% 0% Communicates well
with the public 56% 42% 2% 0%
Ensures sustainable use of resources and care for the environment
26% 73% 1% 0%
Q58 Could I just check how many adults, aged 16 or over, are there in the household including
you? And how many children? 30% 1 45% 2 9% 3 8% 4 7% 5 Q58 Could I just check how many adults, aged 16 or over, are there in the household including
you? And how many children? 79% 0 15% 1 4% 2 2% 3 0% 4 0% 5+ Q59 How many children are there in the household in each group? 0 1 2 3 4 5+ Less than 3 years 67% 28% 4% 0% 0% 0% 3-5years 54% 41% 5% 0% 0% 0% 6-15 years 55% 40% 5% 0% 0% 0% Q60 Gender of respondent: 48% Male 52% Female
Research Resource Dundee City Council 85

Q60 Age of respondent: 35% 16-24 24% 25-34 8% 35-44 8% 45-54 9% 55-59 4% 60-64 10% 65-74 3% 75+ 0% Refused HHCOMP HOUSEHOLD COMPOSITION 17% Single adult under 60 6% Single adult 60+ 22% Two adults under 60 10% Two adults aged 60+ 1% Two adults at least one over 60 7% Single adult with at least one child 13% Two adults and at least one child 23% Three or more adults with no children 1% Other Q61 How many motor vehicles does your household have access to for personal use? (this
includes motorbikes, mopeds, cars, vans etc) 35% 1 16% 2 6% 3 1% 4 or more 43% None Q62 Do you or any member of your household have a disability? 15% Yes 85% No Q63 What is the nature of the disability? 19% Mental health condition 74% Mobility/ physical disabilities 0% Learning difficulties (e.g. dyslexia) 0% Difficulties with sight 0% Learning disability (e.g. Downs Syndrome) 7% Developmental disorder (e.g. Autistic Spectrum Disorder or Asperger's syndrome) 0% Difficulties with hearing 12% Other condition (please write in) 0% Don't know 0% Refused
Research Resource Dundee City Council 86

Q64 Can you please look at this card and specify what is your religion? 50% None 21% Church of Scotland 11% Roman Catholic 2% Other Christian 2% Buddhist 1% Hindu 0% Jewish 12% Muslim 0% Sikh 2% Another religion (please specify) 0% Would rather not say Q65 Which of these groups on this card do you consider you belong to? 66% Scottish 9% Other British 1% Irish 0% Gypsy/ Traveller 0% Polish 4% Any other white ethnic group 1% Any mixed or multiple ethnic groups 4% Pakistani, Pakistani Scottish or Pakistani British 1% Indian, Indian Scottish or Indian British 2% Bangladeshi, Bangladeshi Scottish or Bangladeshi British 2% Chinese, Chinese Scottish ior Chinese British 6% Other 0% African, African Scottish or African British 0% Caribbean, Caribbean Scottish ior Caribbean British 1% Black, Black Scottish or Black British 1% Other 3% Arab 0% Any other background 0% Refused 0% Don't know Q66 Would you mind looking at the card and tell me which group your overall annual
household income falls. Please use net income from all sources i.e. after deductions of income tax. national insurance, and other compulsory deductions. Please take into account any money you may have from employment, including bonuses, overtime, pensions, state pensions, welfare benefits and interest from savings.
0% Less than £100 per week/ £5,199 per year 9% £100-199 per week / £5,200 - £10,399 per year 7% £200-299 per week / £10,400 - £15, 599 per year 3% £300-399 per week / £15,600 - £20,199 per year 3% £400-499 per week / £20,800 - £25,999 per year 1% £500-599 per week / £26,000 - £31,199 per year 8% £600 or more per week/ £31,200 or more per year 12% Don't know 56% Would rather not say
Research Resource Dundee City Council 87

Maryfield
CITIZENS' SURVEY 2015 SQ1 Community Regeneration area: 0% Ardler, St Mary's and Kirkton 0% Beechwood, Lochee, Menziehill and Charleston 53% Coldside and Maryfield 0% Fintry, Whitfield and Mill O Mains 0% Mid Craigie, Linlathen and Douglas 47% None SQ2 Ward 0% West End 100% Maryfield 0% The Ferry 0% Coldside 0% Lochee 0% East End 0% North East 0% Strathmartine
Research Resource Dundee City Council 88

Q1 What do you like best about living in this neighbourhood? 0% Close to beach/ coast 1% Quality of housing 18% Close to shops/ quality of shops/ amenities 3% Always lived here/ familiar with/ know area 13% Pleasant/ nice area 28% Friendly people/ neighbours/ family and friends 36% Quiet/ peaceful 36% Convenient location 8% Central location 2% Other 0% None/ nothing 1% Don't know 0% Lots for kids to do 6% Lots of green/ open spaces/ countryside/ nice views 0% Safe 3% Good public transport 0% Everything 8% It's ok/ fine/ I like it here/ no problems Q2 What do you like least about living in this neighbourhood? 2% Littering/ dirty/ dog fouling 7% Difficult/ poor parking 2% Drug problems 1% Lack of facilities for youths/ children 2% ASB/ neighbours/ noisy 0% Youths/ gangs causing trouble 1% Poor shops 0% Vandalism 5% Other 75% None/ nothing 1% Lack of security 3% Don't know 0% Speeding cars/ traffic 2% Lack of transport/ poor public transport 1% Area going downhill/ untidy/ rundown 1% Roads/ pavements/ winter gritting/ snow clearing 1% Bin uplifts/ refuse collection 0% Too many private lets/ undesirables moving into the area 0% Too many stairs/ hills 0% Not much for people to do in general Q3 How long have you lived in this neighbourhood? 9% Up to one year 30% 1-2 years 20% 3-5 years 8% 6-10 years 26% Over 10 years 8% Always lived there 0% Don't know
Research Resource Dundee City Council 89

Q4 Could you please tell me if you think this neighbourhood has changed over the past 5 years, or since you've been living here if it's less than 5 years?
2% Yes - has got better 2% Yes - has got worse 70% No change 27% Don't know Q5better In what ways do you think it has changed? (GOT BETTER) 26% Access to parks/ open spaces 26% Better facilities/ amenities 0% Less vandalism 0% Housing improvements - new houses 0% Improved schools 0% Cleaner/ tidier/ less litter 0% Improved shops 0% Fewer drug problems 0% Friendliness of people/ neighbours 74% Quieter/ more peaceful 26% Other 0% Not sure 0% Less people hanging around street 0% Less crime 0% More young families in the area Q5worse Q5 In what ways do you think it has changed? (GOT WORSE) 0% Lack of parks/ open spaces 0% Overgrown gardens/ uncut grass 0% Poorer shops 0% More vandalism 23% Undesirable people moving in 0% Lack of facilities for youths/ children 0% ASB/ neighbours/ noisy 23% People/ neighbours less friendly 0% Youths/ gangs causing problems 29% Drug/ alcohol problems 55% Other 0% Not sure 0% More crime 0% People don't care about area 0% Too many private lets 29% Litter problems/ area is dirty 0% Area is rundown/ going downhill 0% More houses being built 49% Parking 0% Condition of roads/ pavements 0% More traffic/ motorbikes/ roads unsafe
Research Resource Dundee City Council 90

Q6 Thinking now about the neighbourhood you live in, how would you rate it as a place to live?
76% Very good 23% Fairly good 1% Fairly poor 0% Very poor 0% No opinion Q7 How long have you lived in this house/ flat? 10% Up to one year 31% 1-2 years 23% 3-5 years 8% 6-10 years 24% Over 10 years 5% Always lived here 0% Don't know Q8 Please tell me which of the descriptions on this card best describes your house/ flat? 10% Rented from the Council 15% Rented from a housing association 37% Rented from a private landlord 30% Owned by you (not ex Council) 8% Owned by you (ex Council) 0% Other (please specify) Q9 Overall, how do you rate the general condition of this (your) house/ flat? 72% Very good 24% Fairly good 3% Average 0% Fairly poor 0% Very poor 0% Don't know
Research Resource Dundee City Council 91

Q10 Looking at this card, please state how satisfied or dissatisfied you are with the following services and facilities in your local area?
Very Satisfied Fairly Satisfied Fairly Dissatisfied Very Dissatisfied Doesn't exist/ never used
Local Health services
80% 20% 0% 0% 1%
Police service 64% 23% 0% 0% 13% Fire service 65% 22% 0% 0% 13% Refuse collection 72% 26% 1% 0% 1% Local Schools 41% 23% 0% 0% 36% Social care/ social
work services 16% 12% 0% 0% 71%
Social housing 28% 16% 2% 4% 51% Employment and
advice services 14% 23% 5% 0% 58%
Public transport 70% 15% 7% 1% 7% Street cleaning 58% 41% 0% 0% 1% Sports and leisure
facilities 66% 18% 1% 0% 15%
Community centre/ library
68% 19% 0% 0% 13%
Parks and open spaces
84% 15% 1% 0% 1%
Local phone boxes 24% 22% 0% 0% 54% Local youth facilities 11% 22% 1% 0% 66% Local shops 88% 8% 0% 0% 4% Community Warden
Service 10% 15% 1% 0% 74%
Access to free cash machine/ auto teller
82% 12% 0% 0% 5%
Research Resource Dundee City Council 92

Q11 And, looking at this card, how easy is it for you to access those services and facilities in your local area?
Very easy Fairly easy Fairly difficult Very difficult Doesn't exist/ never used
Local Health services
71% 29% 0% 0% 1%
Police service 74% 23% 0% 0% 3% Fire service 75% 22% 0% 0% 3% Refuse collection 71% 27% 0% 0% 2% Local Schools 42% 16% 0% 0% 42% Social care/ social
work services 28% 12% 0% 0% 60%
Social housing 33% 13% 2% 2% 50% Employment and
advice services 25% 17% 1% 0% 57%
Public transport 72% 22% 2% 0% 4% Street cleaning 58% 40% 0% 0% 2% Sports and leisure
facilities 60% 20% 0% 0% 19%
Community centre/ library
67% 22% 0% 0% 11%
Parks and open spaces
65% 16% 11% 4% 3%
Local phone boxes 28% 17% 2% 3% 50% Local youth facilities 18% 13% 1% 0% 69% Local shops 89% 6% 1% 0% 4% Community Warden
Service 12% 14% 1% 0% 73%
Access to free cash machine/ auto teller
79% 14% 1% 0% 6%
Q12 Looking at this card, how satisfied are you with the following in this neighbourhood? Very satisfied Fairly satisfied Fairly dissatisfied Very dissatisfied Don't know Children's Play areas 16% 32% 4% 1% 48% Cleanliness of
Streets 46% 53% 0% 0% 1%
Shopping Facilities 78% 17% 2% 1% 2% Condition of roads,
pavements and street lighting
37% 41% 21% 1% 1%
Quality and maintenance of open spaces
52% 46% 1% 0% 1%
Cleanliness of the area around your home
53% 46% 1% 0% 1%
The built environment (e.g. buildings, heritage etc)
64% 36% 0% 0% 1%
The natural environment (e.g. parks, open spaces, countryside etc)
65% 34% 0% 0% 1%
Research Resource Dundee City Council 93

Q13 Overall, how satisfied are you with the quality of life in this neighbourhood? 71% Very satisfied 29% Satisfied 0% Dissatisfied 0% Very dissatisfied Q14 Overall, how satisfied are you with the quality of life in Dundee? 78% Very satisfied 22% Satisfied 0% Dissatisfied 0% Very dissatisfied Q15 Can you tell me firstly, if you are aware of any of these in this area? 39% After school/ children's club 14% Youth clubs/ projects or drop-in centres 13% Voluntary Youth Organisations 2% Youth Information Services 1% Other Youthwork activities 52% Organised Sporting activities/ classes/ clubs 48% Organised Social/ Leisure activities/ classes/ clubs 24% Learning groups or adult education classes 19% Self-help or social care groups 24% Community Festivals/ Events e.g. Gala Day 11% Community Council or Neighbourhood Group 1% Community Regeneration Forum or Group 3% Local Consultation Activities or Events 34% None
Research Resource Dundee City Council 94

Q15 And then, if you are aware, how often do you, or anyone living in your home, take part in activities like these?
Daily Weekly Monthly Seldom Never After school/
children's clubs 4% 12% 0% 10% 74%
Youth clubs/ projects or drop-in centres
0% 0% 0% 4% 96%
Voluntary Youth Organisations
0% 11% 0% 0% 89%
Youth Information Services
0% 0% 0% 0% 100%
Other Youthwork activities
0% 0% 0% 0% 100%
Organised Sporting activities/ classes/ clubs
0% 50% 3% 11% 37%
Organised Social/ Leisure activities/ classes/ clubs
0% 34% 5% 8% 53%
Learning groups or adult education classes
0% 8% 0% 0% 92%
Self-help or social care groups
0% 2% 0% 0% 98%
Community Festivals/ Events e.g. Gala Day
0% 0% 0% 61% 39%
Community Council or Neighbourhood Group
0% 5% 0% 0% 95%
Community Regeneration Forum or Group
0% 0% 0% 0% 100%
Local Consultation Activities or Events
0% 0% 0% 58% 42%
Q16 Q16 Thinking back over the last 12 months, have you given up any time to help any clubs,
charities, campaigns or organisations. I mean in an unpaid capacity. 10% Yes 90% No
Research Resource Dundee City Council 95

Q17 Looking at this showcard, can you tell me if you have undertaken any work or given unpaid help to any of these types of groups or organisations at any time in the past 12 months?
1% Children's group - e.g. playgroup, mothers and toddlers 1% School children e.g. school trips, sports days, discos, in the classroom 0% Youth groups/ children's activities outside of school 0% Coaching or organising sport or exercise 2% Church, religion or faith-based group 1% The elderly 0% Health disability or social welfare group or organisation 0% Local community group/ neighbourhood association/ community council 0% Tenants group/ residents association 0% Trade union activities 0% Public service - e.g. school, hospital, police, local government service 0% Professional society 0% Safety/ first aid 0% The environment/ animals 0% Justice/ human rights 0% Hobbies/ recreation/ arts/ social club 0% Citizens groups 0% Domestic animal welfare 0% Wildlife protection 0% Environmental protection 96% None Q18 In the last 12 months have you been to any of these events or places in Dundee? 61% Cinema 2% Exhibition including art, photography or crafts 1% Book festival or reading group 13% Theatre e.g. pantomime, musical or play 1% Street arts (art in everyday surroundings like streets, parks or shopping centre) 1% Culturally specific festival e.g. mela/ Feis/ local Gala days 1% Classical music performance or opera 27% Live music event e.g. traditional music, rock concert, jazz event 4% Dance show/ event e.g. ballet 20% Museum 0% Historical place e.g. castle, stately home and grounds, battle or archaeology site 12% Gallery 38% Library, including mobile or online 1% Archive or records office 13% None
Research Resource Dundee City Council 96

Q19 If you have not taken part in any community activities or organisations, can you tell me why this is?
0% It costs too much 0% I don't know enough about it 7% Never occurred to me 47% Not really interested 0% I don't have anyone to go with 4% I wouldn't enjoy it 0% Not enough facilities close to where I live 24% Health isn't good enough 0% I might feel uncomfortable or out of place 0% Lack of transport/ I can't easily get to it 0% Poor access to venues (e.g. no disabled ramps) 0% Not enough information on what is available 0% Didn't enjoy it last time 42% It's difficult to find the time 0% I would feel unsafe going to/ from the activity/ event 0% I would feel unsafe at the activity/ event 0% Other Q20 Please tell me to what extent you agree or disagree with the following statements? Strongly agree Tend to agree Neither agree
nor disagree Tend to disagree
Strongly disagree
No opinion
I can influence decisions affecting my local area
2% 23% 28% 17% 3% 26%
People in my community can influence decisions affecting my local area
4% 28% 32% 7% 2% 27%
Q21 First of all could you tell me whether you are registered with.... a GP or health centre? 99% Yes 1% No 0% Don't know Q21 First of all could you tell me whether you are registered with.... a dentist? 94% Yes 5% No 1% Don't know Q22 How good is your health overall? 57% Very good 28% Good 10% Fair 3% Poor 1% Very poor 0% Don't know
Research Resource Dundee City Council 97

Q23 In a typical week, how often do you undertake moderate physical activity for at least 30 minutes in a day?
20% 4 days a week or more 54% 1-3 days a week 12% Less than once a week 15% Never Q24 Are you, or have you ever been, a smoker? 24% Currently smoke 22% Used to smoke 54% Never smoked Q25 How often do you have (8 for men/ 6 for women) or more alcoholic drinks on one
occasion? 3% Daily or almost daily 22% Weekly 11% Monthly 23% Less than monthly 41% Never 0% Don't know Q26 Please say which option best describes your experience over the last 2 weeks. None of the time Rarely Some of the time Often All of the time I've been feeling
optimistic about the future
0% 2% 31% 59% 8%
I've been feeling useful
0% 0% 17% 75% 8%
I've been feeling relaxed
0% 0% 31% 66% 2%
I've been feeling interested in other people
0% 0% 31% 64% 5%
I've had energy to spare
0% 3% 35% 57% 4%
I've been dealing well with problems
0% 0% 10% 65% 24%
I've been thinking clearly
0% 0% 9% 63% 28%
I've been feeling good about myself
0% 0% 14% 65% 20%
I've been feeling close to other people
0% 0% 10% 58% 32%
I've been feeling confident
0% 0% 10% 65% 25%
I've been able to make up my mind about things
0% 0% 7% 52% 40%
I've been feeling loved
0% 0% 9% 58% 33%
I've been interested in new things
0% 3% 19% 70% 8%
I've been feeling cheerful
0% 0% 10% 82% 8%
Research Resource Dundee City Council 98

Q27 On a scale of 1 to 6 where 1 is not at all and 6 is a great deal, to what extent do you feel that people treat you unfairly?
78% 1 - Not at all 21% 2 1% 3 0% 4 0% 5 0% 6 - A great deal 0% Don't know Q28 To what extent do you agree with the statement "I could turn to friends/ relatives in this
neighbourhood for support? 52% Strongly agree 37% Tend to agree 1% Tend to disagree 0% Strongly disagree 11% Don't know Q29 Are you currently taking part in any of these forms of education/ classes of training? 91% None 2% On the job training 0% An FE college course 6% A university based course 0% Distance learning/ Open University 0% School 1% Adult education or evening class 0% Help with reading, writing or use of numbers 1% Other Q30 What type of qualification, if any, will this lead to. Would it lead to... 17% No qualification 65% A qualification at degree level or above 17% Another qualification Q31 Taking everything into account how safe do you feel your neighbourhood is as a place to
live? 80% Very safe 20% Fairly safe 0% A bit unsafe 0% Very unsafe 0% Don't know Q32 How safe do you feel when... Very safe Fairly safe A bit unsafe Very unsafe Don't know Alone in your home
during the day 97% 3% 0% 0% 0%
Alone in your home at night
97% 3% 0% 0% 0%
Walking alone in your neighbourhood during the day
95% 5% 0% 0% 0%
Walking alone in your neighbourhood after dark
57% 34% 3% 0% 6%
Research Resource Dundee City Council 99
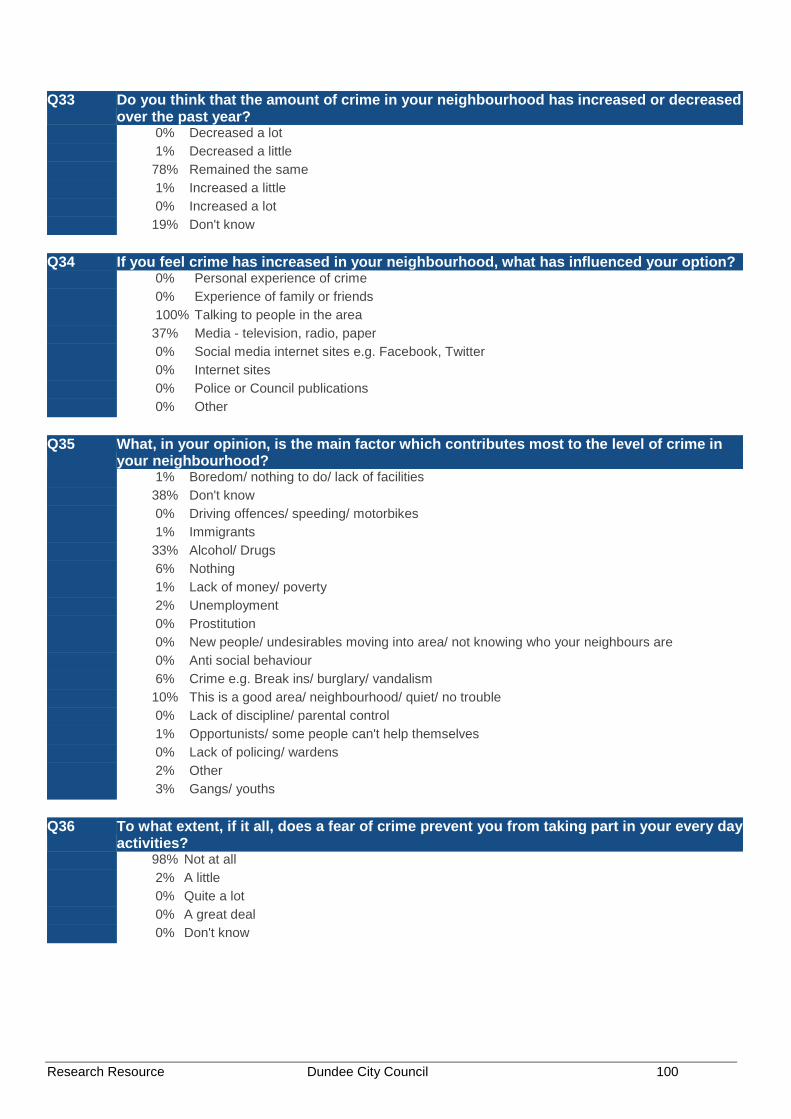
Q33 Do you think that the amount of crime in your neighbourhood has increased or decreased
over the past year? 0% Decreased a lot 1% Decreased a little 78% Remained the same 1% Increased a little 0% Increased a lot 19% Don't know Q34 If you feel crime has increased in your neighbourhood, what has influenced your option? 0% Personal experience of crime 0% Experience of family or friends 100% Talking to people in the area 37% Media - television, radio, paper 0% Social media internet sites e.g. Facebook, Twitter 0% Internet sites 0% Police or Council publications 0% Other Q35 What, in your opinion, is the main factor which contributes most to the level of crime in
your neighbourhood? 1% Boredom/ nothing to do/ lack of facilities 38% Don't know 0% Driving offences/ speeding/ motorbikes 1% Immigrants 33% Alcohol/ Drugs 6% Nothing 1% Lack of money/ poverty 2% Unemployment 0% Prostitution 0% New people/ undesirables moving into area/ not knowing who your neighbours are 0% Anti social behaviour 6% Crime e.g. Break ins/ burglary/ vandalism 10% This is a good area/ neighbourhood/ quiet/ no trouble 0% Lack of discipline/ parental control 1% Opportunists/ some people can't help themselves 0% Lack of policing/ wardens 2% Other 3% Gangs/ youths Q36 To what extent, if it all, does a fear of crime prevent you from taking part in your every day
activities? 98% Not at all 2% A little 0% Quite a lot 0% A great deal 0% Don't know
Research Resource Dundee City Council 100

Q37 Which of these accounts, if any, do you or your partner have? 96% Bank account 21% Building society account 4% Credit union account 1% Post Office card account 0% No, none of these 0% Prefer not to say Q38 Do you have insurance for the contents of your house such as for furniture, electrical
goods etc? 76% Yes 21% No 0% Prefer not to say 3% Don't know Q39 Think about the total value of any savings or investments you have, at the moment do
you (or your partner) have total savings or investments worth £1,000 or more in any combination of the places mentioned on this card, do you have less than £1,000 in savings or investments or do you have no savings or investments at all?
29% No savings 10% Less than £1,000 34% £1,000 or more 2% Don't know 25% Prefer not to say Q40 Are you currently experiencing, or within the last year have you had any difficulties with
the following? 8% Mortgage or rent payments 6% Changes to benefits 3% Council tax payments 5% Loan or credit card payments 12% Cost of food 20% Cost of domestic energy bills 1% Vehicle fuel prices 74% None of the above 2% Prefer not to say Q41 Taking everything together, which of these phrases on this card best describes how you
and your household are managing financially these days? 23% Manage very well 45% Manage quite well 22% Get by all right 5% Don't manage very well 5% Have some deep financial difficulties 0% Are in deep financial trouble 0% Refused 0% Don't know
Research Resource Dundee City Council 101

Q42 When you last contacted Dundee City Council, was this contact to ...? 2% Make a complaint 13% Seek information 18% Request a service 2% Make a suggestion 65% Have never contacted with Council Q43 Overall, how satisfied were you that the Council responded reasonably to your
complaint? 62% Very satisfied 17% Satisfied 0% Neither satisfied nor dissatisfied 21% Dissatisfied 0% Very dissatisfied Q44 Overall, how satisfied were you with this contact to seek information? 37% Very satisfied 32% Satisfied 32% Neither satisfied nor dissatisfied 0% Dissatisfied 0% Very dissatisfied Q45 Overall, how satisfied were you with this contact to request a service? 75% Very satisfied 25% Satisfied 0% Neither satisfied nor dissatisfied 0% Dissatisfied 0% Very dissatisfied Q46 On your most recent contact with the Council, did you.... 89% Get what you need at that contact 11% Have to contact the Council again about the same issue Q47 Was your most recent contact .... 0% By a letter 71% By a telephone call to the Council 7% By a personal visit to a Council office 1% By e-mail 20% By visiting the Council's website
Research Resource Dundee City Council 102

Q48 How satisfied or dissatisfied were you with your recent contact with the Council by telephone in terms of the following?
Very satisfied Fairly satisfied Neither nor Fairly dissatisfied
Very dissatisfied
Don't know
How easy it was for you to find the right number to call
92% 8% 0% 0% 0% 0%
How quickly the phone was answered
91% 9% 0% 0% 0% 0%
How easy it was to get through to someone who could help
92% 8% 0% 0% 0% 0%
Overall helpfulness/ friendliness/ courtesy of the staff you dealt with
92% 8% 0% 0% 0% 0%
How well the staff understood what you wanted
92% 8% 0% 0% 0% 0%
The outcome of your contact
91% 6% 2% 0% 2% 0%
Q49 How satisfied or dissatisfied were you with your recent contact when visiting a Council
office in terms of the following? Very satisfied Fairly satisfied Neither nor Fairly
dissatisfied Very
dissatisfied Don't know
How easy it was to get to the office
100% 0% 0% 0% 0% 0%
The suitability of the office e.g. waiting areas, privacy, access for disabled people etc
80% 20% 0% 0% 0% 0%
Overall helpfulness/ friendliness/ courtesy of the staff you dealt with
80% 20% 0% 0% 0% 0%
How well the staff understood what you wanted
80% 20% 0% 0% 0% 0%
The outcome of your contact
21% 20% 39% 20% 0% 0%
Q50 How satisfied or dissatisfied were you with your most recent cpntact with the Council by
email/ letter in terms of the following? Very satisfied Fairly satisfied Neither nor Fairly
dissatisfied Very
dissatisfied Don't know
How quickly you received a reply to your email/ letter
100% 0% 0% 0% 0% 0%
The extent to which the first reply you received answered your query
100% 0% 0% 0% 0% 0%
The outcome of your contact
100% 0% 0% 0% 0% 0%
Research Resource Dundee City Council 103

Q51 Have you ever used the Council's website? 41% Yes 59% No Q52 How satisfied or dissatisfied would you say you are with the website in terms of the
following? Very
satisfied Fairly
satisfied Neither nor Fairly
dissatisfied Very
dissatisfied Don't know Not
applicable How easily you
managed to find the information you wanted
66% 34% 0% 0% 0% 0% 0%
The amount of information provided on the website
66% 34% 0% 0% 0% 0% 0%
Q53 Generally, do you feel that you receive enough information about the Council and the
services it provides? 83% Yes 17% No Q54 Do you access, and use, the internet in any of the following ways... 68% Internet access at home 55% Internet access via a mobile phone 31% Internet access at work 6% Internet access through public access e.g. at library 7% Access the internet in some other way 15% None of these - I do not access the internet Q55 Do you know that the Council have procedures in place to respond to situations where
vulnerable adults might be at risk of harm? 42% Yes 58% No Q55 Would you know who to contact if you had concerns that a vulnerable adult was at risk of
being abused? 66% Yes 34% No Q56 I am going to read out a list of statements about your local Council and would like you to
tell me which 3 are of the most importance to you. Dundee City Council/ Angus Council... 47% Offering a good range of services 33% Providing an efficient service 37% Providing services which are value for money 45% Providing good quality services 19% Having friendly, polite, helpful, well informed employees 11% Promoting its services well 56% Tackling important issues for the future of the area 28% Listening to complaints 8% Communicating well with the public 15% Ensuring sustainable use of resources and care for the environment 0% Don't know
Research Resource Dundee City Council 104

Q57 I am going to read out the same list of statements again about your local Council. I would like you to tell me whether you agree or disagree with each of these statements. Dundee City Council/ Angus Council....
Agree Neither nor Disagree Don't know Offers a good range
of services 65% 35% 0% 0%
Provides an efficient service
64% 36% 0% 0%
Provides services which are value for money
55% 44% 1% 0%
Provides good quality services
64% 36% 0% 0%
Has friendly, polite, helpful, well informed employees
51% 49% 0% 0%
Promotes its services well
50% 48% 2% 0%
Tackles important issues for the future of the area
58% 41% 1% 0%
Listens to complaints 45% 55% 0% 0% Communicates well
with the public 57% 42% 1% 0%
Ensures sustainable use of resources and care for the environment
54% 46% 0% 0%
Q58 Could I just check how many adults, aged 16 or over, are there in the household including
you? And how many children? 33% 1 63% 2 5% 3 0% 4 0% 5 Q58 Could I just check how many adults, aged 16 or over, are there in the household including
you? And how many children? 75% 0 18% 1 7% 2 1% 3 0% 4 0% 5+ Q59 How many children are there in the household in each group? 0 1 2 3 4 5+ Less than 3 years 51% 47% 2% 0% 0% 0% 3-5years 64% 34% 2% 0% 0% 0% 6-15 years 65% 27% 8% 0% 0% 0% Q60 Gender of respondent: 51% Male 49% Female
Research Resource Dundee City Council 105

Q60 Age of respondent: 11% 16-24 38% 25-34 13% 35-44 14% 45-54 6% 55-59 4% 60-64 9% 65-74 5% 75+ 0% Refused HHCOMP HOUSEHOLD COMPOSITION 19% Single adult under 60 9% Single adult 60+ 33% Two adults under 60 8% Two adults aged 60+ 2% Two adults at least one over 60 5% Single adult with at least one child 19% Two adults and at least one child 3% Three or more adults with no children 1% Other Q61 How many motor vehicles does your household have access to for personal use? (this
includes motorbikes, mopeds, cars, vans etc) 51% 1 11% 2 0% 3 0% 4 or more 38% None Q62 Do you or any member of your household have a disability? 16% Yes 84% No Q63 What is the nature of the disability? 3% Mental health condition 67% Mobility/ physical disabilities 3% Learning difficulties (e.g. dyslexia) 9% Difficulties with sight 0% Learning disability (e.g. Downs Syndrome) 0% Developmental disorder (e.g. Autistic Spectrum Disorder or Asperger's syndrome) 9% Difficulties with hearing 14% Other condition (please write in) 0% Don't know 0% Refused
Research Resource Dundee City Council 106

Q64 Can you please look at this card and specify what is your religion? 59% None 24% Church of Scotland 13% Roman Catholic 2% Other Christian 0% Buddhist 1% Hindu 0% Jewish 2% Muslim 0% Sikh 0% Another religion (please specify) 0% Would rather not say Q65 Which of these groups on this card do you consider you belong to? 89% Scottish 3% Other British 0% Irish 0% Gypsy/ Traveller 4% Polish 1% Any other white ethnic group 0% Any mixed or multiple ethnic groups 0% Pakistani, Pakistani Scottish or Pakistani British 1% Indian, Indian Scottish or Indian British 0% Bangladeshi, Bangladeshi Scottish or Bangladeshi British 1% Chinese, Chinese Scottish ior Chinese British 0% Other 0% African, African Scottish or African British 0% Caribbean, Caribbean Scottish ior Caribbean British 0% Black, Black Scottish or Black British 0% Other 1% Arab 0% Any other background 0% Refused 0% Don't know Q66 Would you mind looking at the card and tell me which group your overall annual
household income falls. Please use net income from all sources i.e. after deductions of income tax. national insurance, and other compulsory deductions. Please take into account any money you may have from employment, including bonuses, overtime, pensions, state pensions, welfare benefits and interest from savings.
3% Less than £100 per week/ £5,199 per year 8% £100-199 per week / £5,200 - £10,399 per year 13% £200-299 per week / £10,400 - £15, 599 per year 6% £300-399 per week / £15,600 - £20,199 per year 6% £400-499 per week / £20,800 - £25,999 per year 8% £500-599 per week / £26,000 - £31,199 per year 18% £600 or more per week/ £31,200 or more per year 9% Don't know 31% Would rather not say
Research Resource Dundee City Council 107

The Ferry
CITIZENS' SURVEY 2015 SQ1 Community Regeneration area: 0% Ardler, St Mary's and Kirkton 0% Beechwood, Lochee, Menziehill and Charleston 0% Coldside and Maryfield 0% Fintry, Whitfield and Mill O Mains 0% Mid Craigie, Linlathen and Douglas 100% None SQ2 Ward 0% West End 0% Maryfield 100% The Ferry 0% Coldside 0% Lochee 0% East End 0% North East 0% Strathmartine
Research Resource Dundee City Council 108

Q1 What do you like best about living in this neighbourhood? 7% Close to beach/ coast 0% Quality of housing 7% Close to shops/ quality of shops/ amenities 6% Always lived here/ familiar with/ know area 30% Pleasant/ nice area 25% Friendly people/ neighbours/ family and friends 47% Quiet/ peaceful 10% Convenient location 1% Central location 2% Other 1% None/ nothing 0% Don't know 0% Lots for kids to do 2% Lots of green/ open spaces/ countryside/ nice views 2% Safe 1% Good public transport 2% Everything 16% It's ok/ fine/ I like it here/ no problems Q2 What do you like least about living in this neighbourhood? 5% Littering/ dirty/ dog fouling 2% Difficult/ poor parking 0% Drug problems 0% Lack of facilities for youths/ children 3% ASB/ neighbours/ noisy 0% Youths/ gangs causing trouble 0% Poor shops 0% Vandalism 4% Other 82% None/ nothing 0% Lack of security 1% Don't know 3% Speeding cars/ traffic 0% Lack of transport/ poor public transport 1% Area going downhill/ untidy/ rundown 0% Roads/ pavements/ winter gritting/ snow clearing 1% Bin uplifts/ refuse collection 0% Too many private lets/ undesirables moving into the area 0% Too many stairs/ hills 0% Not much for people to do in general Q3 How long have you lived in this neighbourhood? 11% Up to one year 4% 1-2 years 13% 3-5 years 11% 6-10 years 55% Over 10 years 6% Always lived there 0% Don't know
Research Resource Dundee City Council 109

Q4 Could you please tell me if you think this neighbourhood has changed over the past 5 years, or since you've been living here if it's less than 5 years?
1% Yes - has got better 5% Yes - has got worse 75% No change 19% Don't know Q5better In what ways do you think it has changed? (GOT BETTER) 0% Access to parks/ open spaces 0% Better facilities/ amenities 0% Less vandalism 0% Housing improvements - new houses 0% Improved schools 0% Cleaner/ tidier/ less litter 0% Improved shops 0% Fewer drug problems 0% Friendliness of people/ neighbours 100% Quieter/ more peaceful 0% Other 0% Not sure 0% Less people hanging around street 0% Less crime 0% More young families in the area Q5worse Q5 In what ways do you think it has changed? (GOT WORSE) 0% Lack of parks/ open spaces 0% Overgrown gardens/ uncut grass 0% Poorer shops 0% More vandalism 44% Undesirable people moving in 0% Lack of facilities for youths/ children 19% ASB/ neighbours/ noisy 0% People/ neighbours less friendly 0% Youths/ gangs causing problems 25% Drug/ alcohol problems 0% Other 0% Not sure 0% More crime 0% People don't care about area 37% Too many private lets 19% Litter problems/ area is dirty 0% Area is rundown/ going downhill 0% More houses being built 0% Parking 0% Condition of roads/ pavements 19% More traffic/ motorbikes/ roads unsafe
Research Resource Dundee City Council 110
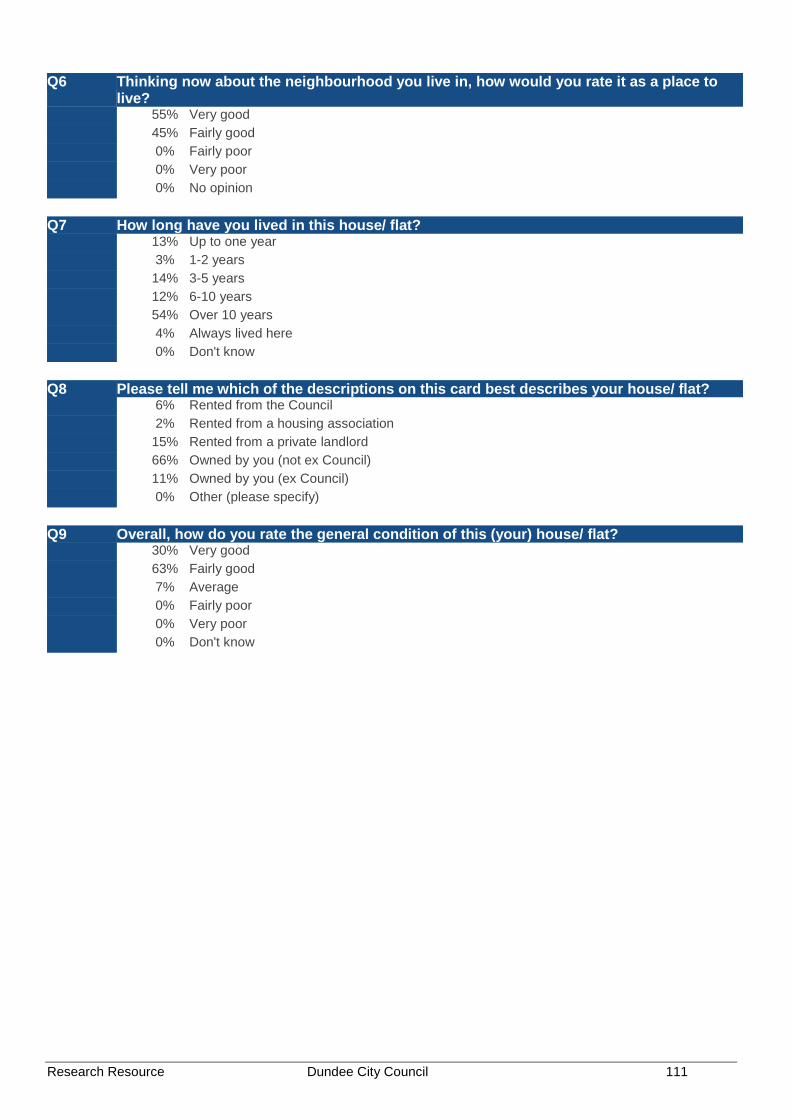
Q6 Thinking now about the neighbourhood you live in, how would you rate it as a place to live?
55% Very good 45% Fairly good 0% Fairly poor 0% Very poor 0% No opinion Q7 How long have you lived in this house/ flat? 13% Up to one year 3% 1-2 years 14% 3-5 years 12% 6-10 years 54% Over 10 years 4% Always lived here 0% Don't know Q8 Please tell me which of the descriptions on this card best describes your house/ flat? 6% Rented from the Council 2% Rented from a housing association 15% Rented from a private landlord 66% Owned by you (not ex Council) 11% Owned by you (ex Council) 0% Other (please specify) Q9 Overall, how do you rate the general condition of this (your) house/ flat? 30% Very good 63% Fairly good 7% Average 0% Fairly poor 0% Very poor 0% Don't know
Research Resource Dundee City Council 111

Q10 Looking at this card, please state how satisfied or dissatisfied you are with the following services and facilities in your local area?
Very Satisfied Fairly Satisfied Fairly Dissatisfied Very Dissatisfied Doesn't exist/ never used
Local Health services
3% 94% 3% 0% 0%
Police service 1% 92% 7% 0% 0% Fire service 1% 99% 0% 0% 0% Refuse collection 1% 98% 1% 0% 0% Local Schools 3% 60% 0% 0% 38% Social care/ social
work services 0% 36% 0% 0% 64%
Social housing 0% 24% 2% 3% 71% Employment and
advice services 0% 49% 2% 0% 49%
Public transport 8% 91% 1% 0% 0% Street cleaning 2% 97% 1% 0% 0% Sports and leisure
facilities 0% 78% 9% 1% 11%
Community centre/ library
4% 93% 2% 0% 1%
Parks and open spaces
21% 78% 1% 0% 0%
Local phone boxes 0% 14% 1% 1% 84% Local youth facilities 0% 35% 13% 4% 48% Local shops 10% 90% 0% 0% 0% Community Warden
Service 0% 14% 1% 0% 85%
Access to free cash machine/ auto teller
7% 84% 0% 0% 10%
Research Resource Dundee City Council 112

Q11 And, looking at this card, how easy is it for you to access those services and facilities in your local area?
Very easy Fairly easy Fairly difficult Very difficult Doesn't exist/ never used
Local Health services
3% 97% 0% 0% 0%
Police service 2% 97% 0% 1% 0% Fire service 2% 98% 0% 0% 0% Refuse collection 2% 97% 0% 0% 1% Local Schools 1% 63% 0% 0% 36% Social care/ social
work services 0% 34% 0% 0% 66%
Social housing 0% 21% 1% 2% 76% Employment and
advice services 0% 45% 1% 0% 54%
Public transport 8% 89% 1% 0% 2% Street cleaning 1% 98% 0% 0% 1% Sports and leisure
facilities 1% 77% 7% 0% 16%
Community centre/ library
5% 88% 2% 0% 5%
Parks and open spaces
18% 80% 0% 0% 2%
Local phone boxes 0% 11% 0% 0% 89% Local youth facilities 1% 29% 11% 3% 56% Local shops 4% 95% 0% 0% 1% Community Warden
Service 0% 15% 0% 0% 85%
Access to free cash machine/ auto teller
6% 83% 0% 0% 11%
Q12 Looking at this card, how satisfied are you with the following in this neighbourhood? Very satisfied Fairly satisfied Fairly dissatisfied Very dissatisfied Don't know Children's Play areas 3% 76% 4% 0% 17% Cleanliness of
Streets 2% 97% 1% 0% 0%
Shopping Facilities 7% 93% 0% 0% 0% Condition of roads,
pavements and street lighting
0% 87% 13% 0% 0%
Quality and maintenance of open spaces
8% 92% 0% 0% 0%
Cleanliness of the area around your home
3% 97% 0% 0% 0%
The built environment (e.g. buildings, heritage etc)
2% 98% 0% 0% 0%
The natural environment (e.g. parks, open spaces, countryside etc)
5% 95% 0% 0% 0%
Research Resource Dundee City Council 113

Q13 Overall, how satisfied are you with the quality of life in this neighbourhood? 46% Very satisfied 54% Satisfied 0% Dissatisfied 0% Very dissatisfied Q14 Overall, how satisfied are you with the quality of life in Dundee? 27% Very satisfied 73% Satisfied 0% Dissatisfied 0% Very dissatisfied Q15 Can you tell me firstly, if you are aware of any of these in this area? 20% After school/ children's club 11% Youth clubs/ projects or drop-in centres 4% Voluntary Youth Organisations 3% Youth Information Services 5% Other Youthwork activities 31% Organised Sporting activities/ classes/ clubs 39% Organised Social/ Leisure activities/ classes/ clubs 6% Learning groups or adult education classes 1% Self-help or social care groups 7% Community Festivals/ Events e.g. Gala Day 0% Community Council or Neighbourhood Group 0% Community Regeneration Forum or Group 2% Local Consultation Activities or Events 45% None
Research Resource Dundee City Council 114

Q15 And then, if you are aware, how often do you, or anyone living in your home, take part in activities like these?
Daily Weekly Monthly Seldom Never After school/
children's clubs 0% 28% 0% 0% 72%
Youth clubs/ projects or drop-in centres
0% 25% 0% 10% 65%
Voluntary Youth Organisations
0% 0% 0% 0% 100%
Youth Information Services
0% 36% 0% 0% 64%
Other Youthwork activities
0% 19% 0% 0% 81%
Organised Sporting activities/ classes/ clubs
0% 39% 0% 10% 51%
Organised Social/ Leisure activities/ classes/ clubs
0% 45% 3% 11% 41%
Learning groups or adult education classes
0% 31% 0% 0% 69%
Self-help or social care groups
0% 0% 0% 0% 100%
Community Festivals/ Events e.g. Gala Day
0% 0% 0% 87% 13%
Community Council or Neighbourhood Group
0% 0% 0% 0% 0%
Community Regeneration Forum or Group
0% 0% 0% 0% 0%
Local Consultation Activities or Events
0% 0% 0% 0% 100%
Q16 Q16 Thinking back over the last 12 months, have you given up any time to help any clubs,
charities, campaigns or organisations. I mean in an unpaid capacity. 8% Yes 92% No
Research Resource Dundee City Council 115

Q17 Looking at this showcard, can you tell me if you have undertaken any work or given unpaid help to any of these types of groups or organisations at any time in the past 12 months?
0% Children's group - e.g. playgroup, mothers and toddlers 0% School children e.g. school trips, sports days, discos, in the classroom 0% Youth groups/ children's activities outside of school 0% Coaching or organising sport or exercise 0% Church, religion or faith-based group 0% The elderly 0% Health disability or social welfare group or organisation 0% Local community group/ neighbourhood association/ community council 0% Tenants group/ residents association 0% Trade union activities 0% Public service - e.g. school, hospital, police, local government service 0% Professional society 0% Safety/ first aid 0% The environment/ animals 0% Justice/ human rights 0% Hobbies/ recreation/ arts/ social club 0% Citizens groups 0% Domestic animal welfare 0% Wildlife protection 0% Environmental protection 100% None Q18 In the last 12 months have you been to any of these events or places in Dundee? 55% Cinema 5% Exhibition including art, photography or crafts 2% Book festival or reading group 50% Theatre e.g. pantomime, musical or play 4% Street arts (art in everyday surroundings like streets, parks or shopping centre) 30% Culturally specific festival e.g. mela/ Feis/ local Gala days 7% Classical music performance or opera 17% Live music event e.g. traditional music, rock concert, jazz event 6% Dance show/ event e.g. ballet 31% Museum 16% Historical place e.g. castle, stately home and grounds, battle or archaeology site 30% Gallery 20% Library, including mobile or online 1% Archive or records office 13% None
Research Resource Dundee City Council 116
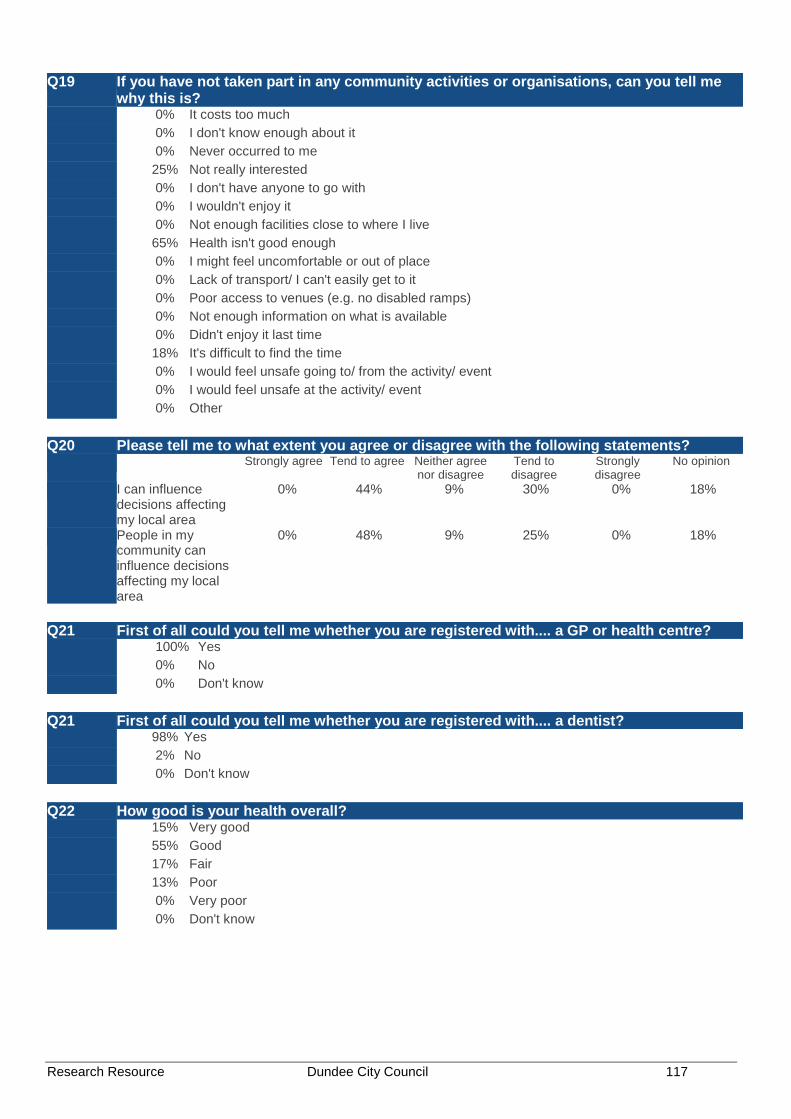
Q19 If you have not taken part in any community activities or organisations, can you tell me why this is?
0% It costs too much 0% I don't know enough about it 0% Never occurred to me 25% Not really interested 0% I don't have anyone to go with 0% I wouldn't enjoy it 0% Not enough facilities close to where I live 65% Health isn't good enough 0% I might feel uncomfortable or out of place 0% Lack of transport/ I can't easily get to it 0% Poor access to venues (e.g. no disabled ramps) 0% Not enough information on what is available 0% Didn't enjoy it last time 18% It's difficult to find the time 0% I would feel unsafe going to/ from the activity/ event 0% I would feel unsafe at the activity/ event 0% Other Q20 Please tell me to what extent you agree or disagree with the following statements? Strongly agree Tend to agree Neither agree
nor disagree Tend to disagree
Strongly disagree
No opinion
I can influence decisions affecting my local area
0% 44% 9% 30% 0% 18%
People in my community can influence decisions affecting my local area
0% 48% 9% 25% 0% 18%
Q21 First of all could you tell me whether you are registered with.... a GP or health centre? 100% Yes 0% No 0% Don't know Q21 First of all could you tell me whether you are registered with.... a dentist? 98% Yes 2% No 0% Don't know Q22 How good is your health overall? 15% Very good 55% Good 17% Fair 13% Poor 0% Very poor 0% Don't know
Research Resource Dundee City Council 117

Q23 In a typical week, how often do you undertake moderate physical activity for at least 30 minutes in a day?
55% 4 days a week or more 22% 1-3 days a week 10% Less than once a week 13% Never Q24 Are you, or have you ever been, a smoker? 16% Currently smoke 28% Used to smoke 56% Never smoked Q25 How often do you have (8 for men/ 6 for women) or more alcoholic drinks on one
occasion? 11% Daily or almost daily 41% Weekly 14% Monthly 15% Less than monthly 19% Never 0% Don't know Q26 Please say which option best describes your experience over the last 2 weeks. None of the time Rarely Some of the time Often All of the time I've been feeling
optimistic about the future
0% 7% 38% 54% 0%
I've been feeling useful
0% 7% 39% 53% 0%
I've been feeling relaxed
0% 9% 57% 35% 0%
I've been feeling interested in other people
0% 2% 37% 59% 3%
I've had energy to spare
0% 23% 58% 18% 1%
I've been dealing well with problems
0% 0% 44% 52% 4%
I've been thinking clearly
0% 0% 26% 63% 11%
I've been feeling good about myself
0% 0% 64% 32% 4%
I've been feeling close to other people
0% 1% 21% 69% 9%
I've been feeling confident
0% 8% 37% 49% 6%
I've been able to make up my mind about things
0% 0% 21% 58% 21%
I've been feeling loved
0% 1% 35% 38% 26%
I've been interested in new things
0% 10% 46% 43% 0%
I've been feeling cheerful
0% 0% 55% 39% 5%
Research Resource Dundee City Council 118

Q27 On a scale of 1 to 6 where 1 is not at all and 6 is a great deal, to what extent do you feel that people treat you unfairly?
17% 1 - Not at all 60% 2 23% 3 0% 4 0% 5 0% 6 - A great deal 0% Don't know Q28 To what extent do you agree with the statement "I could turn to friends/ relatives in this
neighbourhood for support? 23% Strongly agree 66% Tend to agree 8% Tend to disagree 3% Strongly disagree 0% Don't know Q29 Are you currently taking part in any of these forms of education/ classes of training? 86% None 11% On the job training 1% An FE college course 0% A university based course 1% Distance learning/ Open University 1% School 0% Adult education or evening class 0% Help with reading, writing or use of numbers 0% Other Q30 What type of qualification, if any, will this lead to. Would it lead to... 0% No qualification 20% A qualification at degree level or above 80% Another qualification Q31 Taking everything into account how safe do you feel your neighbourhood is as a place to
live? 85% Very safe 15% Fairly safe 0% A bit unsafe 0% Very unsafe 0% Don't know Q32 How safe do you feel when... Very safe Fairly safe A bit unsafe Very unsafe Don't know Alone in your home
during the day 99% 1% 0% 0% 0%
Alone in your home at night
99% 1% 0% 0% 0%
Walking alone in your neighbourhood during the day
80% 20% 0% 0% 0%
Walking alone in your neighbourhood after dark
31% 50% 3% 0% 16%
Research Resource Dundee City Council 119

Q33 Do you think that the amount of crime in your neighbourhood has increased or decreased
over the past year? 0% Decreased a lot 0% Decreased a little 74% Remained the same 2% Increased a little 0% Increased a lot 24% Don't know Q34 If you feel crime has increased in your neighbourhood, what has influenced your option? 0% Personal experience of crime 0% Experience of family or friends 100% Talking to people in the area 41% Media - television, radio, paper 0% Social media internet sites e.g. Facebook, Twitter 0% Internet sites 0% Police or Council publications 0% Other Q35 What, in your opinion, is the main factor which contributes most to the level of crime in
your neighbourhood? 7% Boredom/ nothing to do/ lack of facilities 16% Don't know 0% Driving offences/ speeding/ motorbikes 1% Immigrants 35% Alcohol/ Drugs 0% Nothing 4% Lack of money/ poverty 6% Unemployment 0% Prostitution 0% New people/ undesirables moving into area/ not knowing who your neighbours are 0% Anti social behaviour 0% Crime e.g. Break ins/ burglary/ vandalism 34% This is a good area/ neighbourhood/ quiet/ no trouble 0% Lack of discipline/ parental control 3% Opportunists/ some people can't help themselves 3% Lack of policing/ wardens 2% Other 9% Gangs/ youths Q36 To what extent, if it all, does a fear of crime prevent you from taking part in your every day
activities? 88% Not at all 11% A little 0% Quite a lot 0% A great deal 1% Don't know
Research Resource Dundee City Council 120
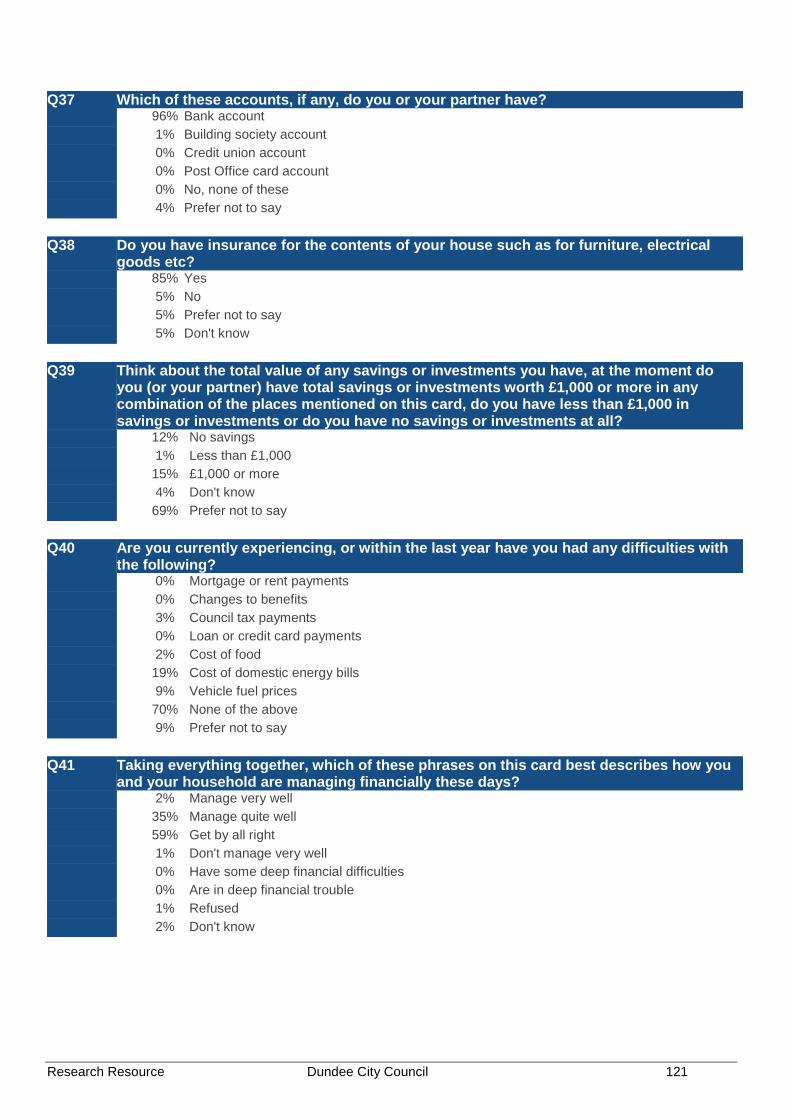
Q37 Which of these accounts, if any, do you or your partner have? 96% Bank account 1% Building society account 0% Credit union account 0% Post Office card account 0% No, none of these 4% Prefer not to say Q38 Do you have insurance for the contents of your house such as for furniture, electrical
goods etc? 85% Yes 5% No 5% Prefer not to say 5% Don't know Q39 Think about the total value of any savings or investments you have, at the moment do
you (or your partner) have total savings or investments worth £1,000 or more in any combination of the places mentioned on this card, do you have less than £1,000 in savings or investments or do you have no savings or investments at all?
12% No savings 1% Less than £1,000 15% £1,000 or more 4% Don't know 69% Prefer not to say Q40 Are you currently experiencing, or within the last year have you had any difficulties with
the following? 0% Mortgage or rent payments 0% Changes to benefits 3% Council tax payments 0% Loan or credit card payments 2% Cost of food 19% Cost of domestic energy bills 9% Vehicle fuel prices 70% None of the above 9% Prefer not to say Q41 Taking everything together, which of these phrases on this card best describes how you
and your household are managing financially these days? 2% Manage very well 35% Manage quite well 59% Get by all right 1% Don't manage very well 0% Have some deep financial difficulties 0% Are in deep financial trouble 1% Refused 2% Don't know
Research Resource Dundee City Council 121

Q42 When you last contacted Dundee City Council, was this contact to ...? 3% Make a complaint 17% Seek information 33% Request a service 0% Make a suggestion 47% Have never contacted with Council Q43 Overall, how satisfied were you that the Council responded reasonably to your
complaint? 30% Very satisfied 39% Satisfied 30% Neither satisfied nor dissatisfied 0% Dissatisfied 0% Very dissatisfied Q44 Overall, how satisfied were you with this contact to seek information? 0% Very satisfied 95% Satisfied 5% Neither satisfied nor dissatisfied 0% Dissatisfied 0% Very dissatisfied Q45 Overall, how satisfied were you with this contact to request a service? 0% Very satisfied 97% Satisfied 0% Neither satisfied nor dissatisfied 3% Dissatisfied 0% Very dissatisfied Q46 On your most recent contact with the Council, did you.... 93% Get what you need at that contact 7% Have to contact the Council again about the same issue Q47 Was your most recent contact .... 2% By a letter 79% By a telephone call to the Council 12% By a personal visit to a Council office 6% By e-mail 2% By visiting the Council's website
Research Resource Dundee City Council 122

Q48 How satisfied or dissatisfied were you with your recent contact with the Council by telephone in terms of the following?
Very satisfied Fairly satisfied Neither nor Fairly dissatisfied
Very dissatisfied
Don't know
How easy it was for you to find the right number to call
0% 98% 0% 2% 0% 0%
How quickly the phone was answered
0% 88% 7% 4% 0% 0%
How easy it was to get through to someone who could help
0% 100% 0% 0% 0% 0%
Overall helpfulness/ friendliness/ courtesy of the staff you dealt with
0% 100% 0% 0% 0% 0%
How well the staff understood what you wanted
0% 98% 0% 0% 0% 2%
The outcome of your contact
7% 88% 0% 2% 0% 2%
Q49 How satisfied or dissatisfied were you with your recent contact when visiting a Council
office in terms of the following? Very satisfied Fairly satisfied Neither nor Fairly
dissatisfied Very
dissatisfied Don't know
How easy it was to get to the office
0% 100% 0% 0% 0% 0%
The suitability of the office e.g. waiting areas, privacy, access for disabled people etc
0% 100% 0% 0% 0% 0%
Overall helpfulness/ friendliness/ courtesy of the staff you dealt with
0% 100% 0% 0% 0% 0%
How well the staff understood what you wanted
0% 100% 0% 0% 0% 0%
The outcome of your contact
0% 72% 0% 0% 14% 14%
Q50 How satisfied or dissatisfied were you with your most recent cpntact with the Council by
email/ letter in terms of the following? Very satisfied Fairly satisfied Neither nor Fairly
dissatisfied Very
dissatisfied Don't know
How quickly you received a reply to your email/ letter
0% 100% 0% 0% 0% 0%
The extent to which the first reply you received answered your query
0% 100% 0% 0% 0% 0%
The outcome of your contact
0% 100% 0% 0% 0% 0%
Research Resource Dundee City Council 123

Q51 Have you ever used the Council's website? 42% Yes 58% No Q52 How satisfied or dissatisfied would you say you are with the website in terms of the
following? Very
satisfied Fairly
satisfied Neither nor Fairly
dissatisfied Very
dissatisfied Don't know Not
applicable How easily you
managed to find the information you wanted
17% 81% 0% 2% 0% 0% 0%
The amount of information provided on the website
17% 81% 0% 2% 0% 0% 0%
Q53 Generally, do you feel that you receive enough information about the Council and the
services it provides? 85% Yes 15% No Q54 Do you access, and use, the internet in any of the following ways... 86% Internet access at home 59% Internet access via a mobile phone 36% Internet access at work 1% Internet access through public access e.g. at library 2% Access the internet in some other way 13% None of these - I do not access the internet Q55 Do you know that the Council have procedures in place to respond to situations where
vulnerable adults might be at risk of harm? 19% Yes 81% No Q55 Would you know who to contact if you had concerns that a vulnerable adult was at risk of
being abused? 26% Yes 74% No Q56 I am going to read out a list of statements about your local Council and would like you to
tell me which 3 are of the most importance to you. Dundee City Council/ Angus Council... 39% Offering a good range of services 63% Providing an efficient service 54% Providing services which are value for money 75% Providing good quality services 11% Having friendly, polite, helpful, well informed employees 3% Promoting its services well 16% Tackling important issues for the future of the area 4% Listening to complaints 8% Communicating well with the public 27% Ensuring sustainable use of resources and care for the environment 0% Don't know
Research Resource Dundee City Council 124

Q57 I am going to read out the same list of statements again about your local Council. I would like you to tell me whether you agree or disagree with each of these statements. Dundee City Council/ Angus Council....
Agree Neither nor Disagree Don't know Offers a good range
of services 88% 12% 0% 0%
Provides an efficient service
66% 34% 0% 0%
Provides services which are value for money
49% 42% 10% 0%
Provides good quality services
65% 34% 1% 0%
Has friendly, polite, helpful, well informed employees
64% 36% 0% 0%
Promotes its services well
40% 59% 1% 0%
Tackles important issues for the future of the area
36% 62% 2% 0%
Listens to complaints 34% 63% 3% 0% Communicates well
with the public 53% 42% 5% 0%
Ensures sustainable use of resources and care for the environment
29% 70% 1% 0%
Q58 Could I just check how many adults, aged 16 or over, are there in the household including
you? And how many children? 16% 1 66% 2 10% 3 6% 4 1% 5 Q58 Could I just check how many adults, aged 16 or over, are there in the household including
you? And how many children? 78% 0 13% 1 9% 2 1% 3 0% 4 0% 5+ Q59 How many children are there in the household in each group? 0 1 2 3 4 5+ Less than 3 years 64% 36% 0% 0% 0% 0% 3-5years 73% 27% 0% 0% 0% 0% 6-15 years 36% 44% 20% 0% 0% 0% Q60 Gender of respondent: 46% Male 54% Female
Research Resource Dundee City Council 125

Q60 Age of respondent: 13% 16-24 7% 25-34 14% 35-44 11% 45-54 13% 55-59 11% 60-64 19% 65-74 10% 75+ 0% Refused HHCOMP HOUSEHOLD COMPOSITION 6% Single adult under 60 8% Single adult 60+ 17% Two adults under 60 25% Two adults aged 60+ 9% Two adults at least one over 60 2% Single adult with at least one child 14% Two adults and at least one child 12% Three or more adults with no children 6% Other Q61 How many motor vehicles does your household have access to for personal use? (this
includes motorbikes, mopeds, cars, vans etc) 39% 1 30% 2 8% 3 0% 4 or more 23% None Q62 Do you or any member of your household have a disability? 32% Yes 68% No Q63 What is the nature of the disability? 9% Mental health condition 69% Mobility/ physical disabilities 0% Learning difficulties (e.g. dyslexia) 6% Difficulties with sight 0% Learning disability (e.g. Downs Syndrome) 3% Developmental disorder (e.g. Autistic Spectrum Disorder or Asperger's syndrome) 0% Difficulties with hearing 24% Other condition (please write in) 0% Don't know 3% Refused
Research Resource Dundee City Council 126

Q64 Can you please look at this card and specify what is your religion? 38% None 45% Church of Scotland 12% Roman Catholic 3% Other Christian 0% Buddhist 0% Hindu 0% Jewish 2% Muslim 0% Sikh 1% Another religion (please specify) 0% Would rather not say Q65 Which of these groups on this card do you consider you belong to? 79% Scottish 14% Other British 0% Irish 0% Gypsy/ Traveller 1% Polish 2% Any other white ethnic group 0% Any mixed or multiple ethnic groups 2% Pakistani, Pakistani Scottish or Pakistani British 0% Indian, Indian Scottish or Indian British 0% Bangladeshi, Bangladeshi Scottish or Bangladeshi British 0% Chinese, Chinese Scottish ior Chinese British 0% Other 0% African, African Scottish or African British 0% Caribbean, Caribbean Scottish ior Caribbean British 0% Black, Black Scottish or Black British 1% Other 1% Arab 0% Any other background 0% Refused 0% Don't know Q66 Would you mind looking at the card and tell me which group your overall annual
household income falls. Please use net income from all sources i.e. after deductions of income tax. national insurance, and other compulsory deductions. Please take into account any money you may have from employment, including bonuses, overtime, pensions, state pensions, welfare benefits and interest from savings.
0% Less than £100 per week/ £5,199 per year 2% £100-199 per week / £5,200 - £10,399 per year 7% £200-299 per week / £10,400 - £15, 599 per year 5% £300-399 per week / £15,600 - £20,199 per year 8% £400-499 per week / £20,800 - £25,999 per year 1% £500-599 per week / £26,000 - £31,199 per year 11% £600 or more per week/ £31,200 or more per year 15% Don't know 50% Would rather not say
Research Resource Dundee City Council 127

Coldside
CITIZENS' SURVEY 2015 SQ1 Community Regeneration area: 0% Ardler, St Mary's and Kirkton 0% Beechwood, Lochee, Menziehill and Charleston 56% Coldside and Maryfield 0% Fintry, Whitfield and Mill O Mains 0% Mid Craigie, Linlathen and Douglas 44% None SQ2 Ward 0% West End 0% Maryfield 0% The Ferry 100% Coldside 0% Lochee 0% East End 0% North East 0% Strathmartine
Research Resource Dundee City Council 128

Q1 What do you like best about living in this neighbourhood? 0% Close to beach/ coast 1% Quality of housing 18% Close to shops/ quality of shops/ amenities 2% Always lived here/ familiar with/ know area 14% Pleasant/ nice area 27% Friendly people/ neighbours/ family and friends 42% Quiet/ peaceful 26% Convenient location 3% Central location 5% Other 1% None/ nothing 2% Don't know 0% Lots for kids to do 2% Lots of green/ open spaces/ countryside/ nice views 9% Safe 4% Good public transport 1% Everything 13% It's ok/ fine/ I like it here/ no problems Q2 What do you like least about living in this neighbourhood? 2% Littering/ dirty/ dog fouling 2% Difficult/ poor parking 4% Drug problems 2% Lack of facilities for youths/ children 1% ASB/ neighbours/ noisy 0% Youths/ gangs causing trouble 0% Poor shops 0% Vandalism 4% Other 71% None/ nothing 0% Lack of security 7% Don't know 2% Speeding cars/ traffic 1% Lack of transport/ poor public transport 4% Area going downhill/ untidy/ rundown 1% Roads/ pavements/ winter gritting/ snow clearing 0% Bin uplifts/ refuse collection 4% Too many private lets/ undesirables moving into the area 0% Too many stairs/ hills 1% Not much for people to do in general Q3 How long have you lived in this neighbourhood? 7% Up to one year 13% 1-2 years 22% 3-5 years 12% 6-10 years 38% Over 10 years 8% Always lived there 0% Don't know
Research Resource Dundee City Council 129

Q4 Could you please tell me if you think this neighbourhood has changed over the past 5 years, or since you've been living here if it's less than 5 years?
4% Yes - has got better 4% Yes - has got worse 68% No change 24% Don't know Q5better In what ways do you think it has changed? (GOT BETTER) 0% Access to parks/ open spaces 0% Better facilities/ amenities 0% Less vandalism 0% Housing improvements - new houses 0% Improved schools 0% Cleaner/ tidier/ less litter 0% Improved shops 0% Fewer drug problems 23% Friendliness of people/ neighbours 92% Quieter/ more peaceful 0% Other 0% Not sure 0% Less people hanging around street 0% Less crime 0% More young families in the area Q5worse Q5 In what ways do you think it has changed? (GOT WORSE) 0% Lack of parks/ open spaces 0% Overgrown gardens/ uncut grass 0% Poorer shops 0% More vandalism 47% Undesirable people moving in 0% Lack of facilities for youths/ children 13% ASB/ neighbours/ noisy 0% People/ neighbours less friendly 0% Youths/ gangs causing problems 74% Drug/ alcohol problems 0% Other 0% Not sure 0% More crime 0% People don't care about area 13% Too many private lets 0% Litter problems/ area is dirty 0% Area is rundown/ going downhill 0% More houses being built 0% Parking 0% Condition of roads/ pavements 0% More traffic/ motorbikes/ roads unsafe
Research Resource Dundee City Council 130

Q6 Thinking now about the neighbourhood you live in, how would you rate it as a place to live?
76% Very good 22% Fairly good 3% Fairly poor 0% Very poor 0% No opinion Q7 How long have you lived in this house/ flat? 8% Up to one year 15% 1-2 years 23% 3-5 years 13% 6-10 years 36% Over 10 years 6% Always lived here 0% Don't know Q8 Please tell me which of the descriptions on this card best describes your house/ flat? 25% Rented from the Council 9% Rented from a housing association 22% Rented from a private landlord 31% Owned by you (not ex Council) 12% Owned by you (ex Council) 0% Other (please specify) Q9 Overall, how do you rate the general condition of this (your) house/ flat? 75% Very good 24% Fairly good 1% Average 0% Fairly poor 0% Very poor 0% Don't know
Research Resource Dundee City Council 131

Q10 Looking at this card, please state how satisfied or dissatisfied you are with the following services and facilities in your local area?
Very Satisfied Fairly Satisfied Fairly Dissatisfied Very Dissatisfied Doesn't exist/ never used
Local Health services
83% 15% 0% 0% 2%
Police service 75% 15% 0% 0% 10% Fire service 74% 15% 0% 0% 11% Refuse collection 68% 31% 1% 0% 1% Local Schools 62% 12% 0% 0% 26% Social care/ social
work services 15% 8% 0% 0% 77%
Social housing 28% 26% 1% 0% 46% Employment and
advice services 21% 16% 2% 0% 60%
Public transport 75% 12% 6% 0% 6% Street cleaning 47% 51% 1% 0% 1% Sports and leisure
facilities 63% 17% 4% 0% 16%
Community centre/ library
72% 14% 2% 0% 12%
Parks and open spaces
78% 17% 2% 1% 2%
Local phone boxes 26% 13% 0% 0% 62% Local youth facilities 21% 17% 6% 0% 56% Local shops 87% 12% 2% 0% 0% Community Warden
Service 16% 11% 0% 1% 73%
Access to free cash machine/ auto teller
82% 10% 1% 1% 6%
Research Resource Dundee City Council 132
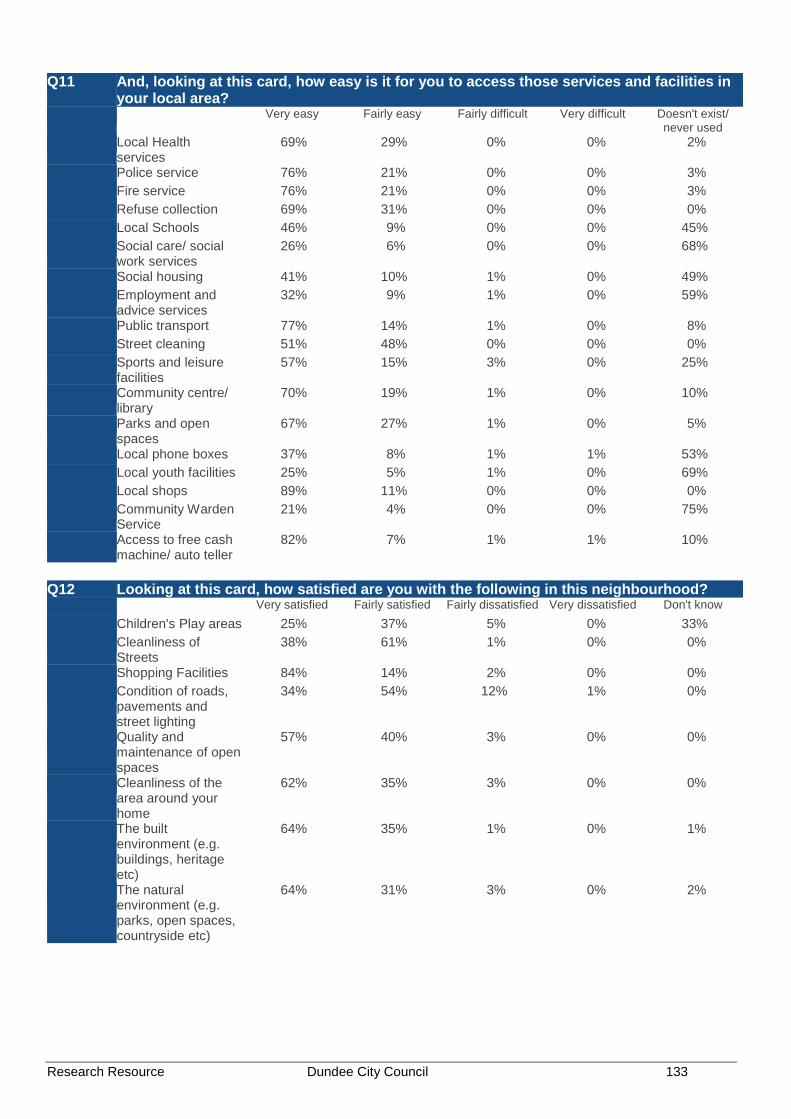
Q11 And, looking at this card, how easy is it for you to access those services and facilities in your local area?
Very easy Fairly easy Fairly difficult Very difficult Doesn't exist/ never used
Local Health services
69% 29% 0% 0% 2%
Police service 76% 21% 0% 0% 3% Fire service 76% 21% 0% 0% 3% Refuse collection 69% 31% 0% 0% 0% Local Schools 46% 9% 0% 0% 45% Social care/ social
work services 26% 6% 0% 0% 68%
Social housing 41% 10% 1% 0% 49% Employment and
advice services 32% 9% 1% 0% 59%
Public transport 77% 14% 1% 0% 8% Street cleaning 51% 48% 0% 0% 0% Sports and leisure
facilities 57% 15% 3% 0% 25%
Community centre/ library
70% 19% 1% 0% 10%
Parks and open spaces
67% 27% 1% 0% 5%
Local phone boxes 37% 8% 1% 1% 53% Local youth facilities 25% 5% 1% 0% 69% Local shops 89% 11% 0% 0% 0% Community Warden
Service 21% 4% 0% 0% 75%
Access to free cash machine/ auto teller
82% 7% 1% 1% 10%
Q12 Looking at this card, how satisfied are you with the following in this neighbourhood? Very satisfied Fairly satisfied Fairly dissatisfied Very dissatisfied Don't know Children's Play areas 25% 37% 5% 0% 33% Cleanliness of
Streets 38% 61% 1% 0% 0%
Shopping Facilities 84% 14% 2% 0% 0% Condition of roads,
pavements and street lighting
34% 54% 12% 1% 0%
Quality and maintenance of open spaces
57% 40% 3% 0% 0%
Cleanliness of the area around your home
62% 35% 3% 0% 0%
The built environment (e.g. buildings, heritage etc)
64% 35% 1% 0% 1%
The natural environment (e.g. parks, open spaces, countryside etc)
64% 31% 3% 0% 2%
Research Resource Dundee City Council 133

Q13 Overall, how satisfied are you with the quality of life in this neighbourhood? 73% Very satisfied 26% Satisfied 1% Dissatisfied 0% Very dissatisfied Q14 Overall, how satisfied are you with the quality of life in Dundee? 82% Very satisfied 17% Satisfied 1% Dissatisfied 0% Very dissatisfied Q15 Can you tell me firstly, if you are aware of any of these in this area? 45% After school/ children's club 8% Youth clubs/ projects or drop-in centres 23% Voluntary Youth Organisations 1% Youth Information Services 2% Other Youthwork activities 61% Organised Sporting activities/ classes/ clubs 54% Organised Social/ Leisure activities/ classes/ clubs 23% Learning groups or adult education classes 20% Self-help or social care groups 17% Community Festivals/ Events e.g. Gala Day 16% Community Council or Neighbourhood Group 4% Community Regeneration Forum or Group 8% Local Consultation Activities or Events 25% None
Research Resource Dundee City Council 134

Q15 And then, if you are aware, how often do you, or anyone living in your home, take part in activities like these?
Daily Weekly Monthly Seldom Never After school/
children's clubs 1% 14% 0% 12% 74%
Youth clubs/ projects or drop-in centres
0% 14% 0% 19% 67%
Voluntary Youth Organisations
0% 12% 0% 2% 85%
Youth Information Services
0% 52% 0% 0% 48%
Other Youthwork activities
0% 0% 0% 0% 100%
Organised Sporting activities/ classes/ clubs
0% 47% 4% 9% 40%
Organised Social/ Leisure activities/ classes/ clubs
0% 40% 5% 12% 43%
Learning groups or adult education classes
0% 1% 0% 2% 96%
Self-help or social care groups
0% 4% 0% 0% 96%
Community Festivals/ Events e.g. Gala Day
0% 0% 0% 72% 28%
Community Council or Neighbourhood Group
0% 0% 0% 3% 97%
Community Regeneration Forum or Group
0% 0% 0% 0% 100%
Local Consultation Activities or Events
0% 6% 0% 65% 29%
Q16 Q16 Thinking back over the last 12 months, have you given up any time to help any clubs,
charities, campaigns or organisations. I mean in an unpaid capacity. 11% Yes 89% No
Research Resource Dundee City Council 135

Q17 Looking at this showcard, can you tell me if you have undertaken any work or given unpaid help to any of these types of groups or organisations at any time in the past 12 months?
1% Children's group - e.g. playgroup, mothers and toddlers 0% School children e.g. school trips, sports days, discos, in the classroom 0% Youth groups/ children's activities outside of school 0% Coaching or organising sport or exercise 2% Church, religion or faith-based group 1% The elderly 0% Health disability or social welfare group or organisation 0% Local community group/ neighbourhood association/ community council 0% Tenants group/ residents association 0% Trade union activities 0% Public service - e.g. school, hospital, police, local government service 0% Professional society 0% Safety/ first aid 0% The environment/ animals 0% Justice/ human rights 1% Hobbies/ recreation/ arts/ social club 0% Citizens groups 0% Domestic animal welfare 0% Wildlife protection 0% Environmental protection 96% None Q18 In the last 12 months have you been to any of these events or places in Dundee? 55% Cinema 3% Exhibition including art, photography or crafts 1% Book festival or reading group 24% Theatre e.g. pantomime, musical or play 1% Street arts (art in everyday surroundings like streets, parks or shopping centre) 1% Culturally specific festival e.g. mela/ Feis/ local Gala days 1% Classical music performance or opera 24% Live music event e.g. traditional music, rock concert, jazz event 2% Dance show/ event e.g. ballet 17% Museum 2% Historical place e.g. castle, stately home and grounds, battle or archaeology site 11% Gallery 45% Library, including mobile or online 1% Archive or records office 19% None
Research Resource Dundee City Council 136
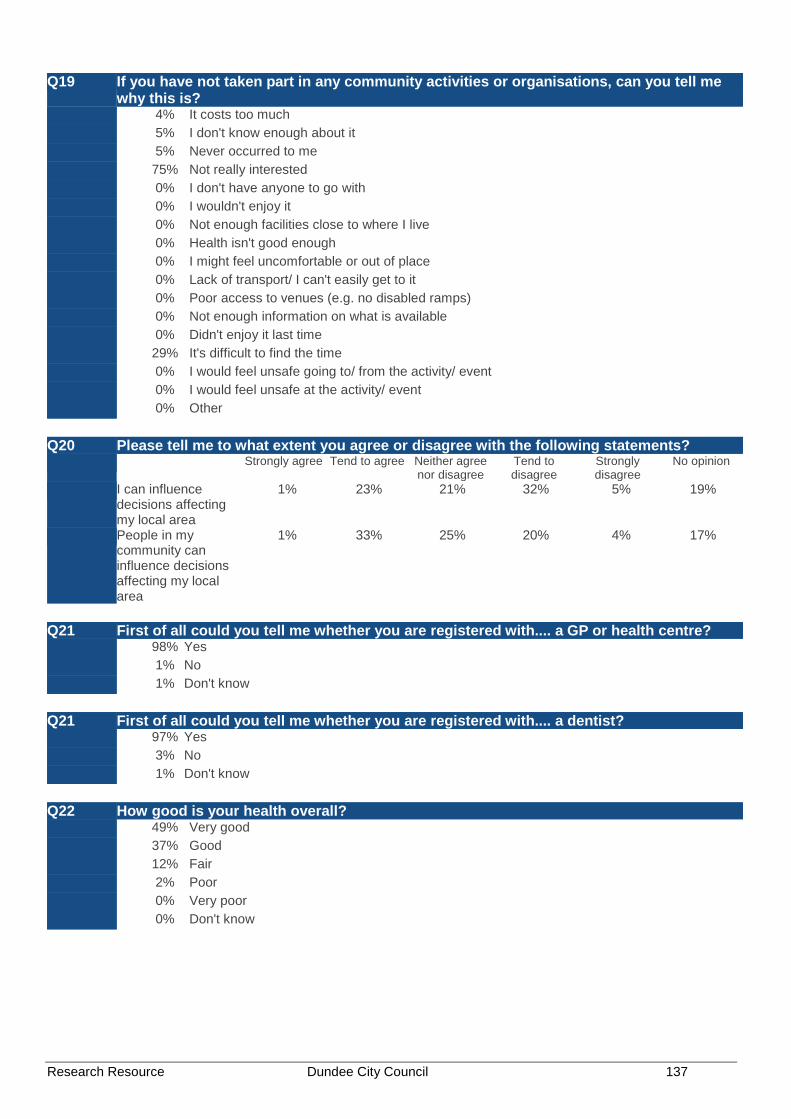
Q19 If you have not taken part in any community activities or organisations, can you tell me why this is?
4% It costs too much 5% I don't know enough about it 5% Never occurred to me 75% Not really interested 0% I don't have anyone to go with 0% I wouldn't enjoy it 0% Not enough facilities close to where I live 0% Health isn't good enough 0% I might feel uncomfortable or out of place 0% Lack of transport/ I can't easily get to it 0% Poor access to venues (e.g. no disabled ramps) 0% Not enough information on what is available 0% Didn't enjoy it last time 29% It's difficult to find the time 0% I would feel unsafe going to/ from the activity/ event 0% I would feel unsafe at the activity/ event 0% Other Q20 Please tell me to what extent you agree or disagree with the following statements? Strongly agree Tend to agree Neither agree
nor disagree Tend to disagree
Strongly disagree
No opinion
I can influence decisions affecting my local area
1% 23% 21% 32% 5% 19%
People in my community can influence decisions affecting my local area
1% 33% 25% 20% 4% 17%
Q21 First of all could you tell me whether you are registered with.... a GP or health centre? 98% Yes 1% No 1% Don't know Q21 First of all could you tell me whether you are registered with.... a dentist? 97% Yes 3% No 1% Don't know Q22 How good is your health overall? 49% Very good 37% Good 12% Fair 2% Poor 0% Very poor 0% Don't know
Research Resource Dundee City Council 137

Q23 In a typical week, how often do you undertake moderate physical activity for at least 30 minutes in a day?
21% 4 days a week or more 51% 1-3 days a week 17% Less than once a week 11% Never Q24 Are you, or have you ever been, a smoker? 27% Currently smoke 21% Used to smoke 52% Never smoked Q25 How often do you have (8 for men/ 6 for women) or more alcoholic drinks on one
occasion? 1% Daily or almost daily 25% Weekly 17% Monthly 29% Less than monthly 28% Never 0% Don't know Q26 Please say which option best describes your experience over the last 2 weeks. None of the time Rarely Some of the time Often All of the time I've been feeling
optimistic about the future
0% 4% 32% 57% 8%
I've been feeling useful
0% 1% 27% 70% 3%
I've been feeling relaxed
0% 1% 36% 61% 2%
I've been feeling interested in other people
0% 2% 30% 63% 5%
I've had energy to spare
0% 1% 37% 57% 4%
I've been dealing well with problems
0% 0% 14% 67% 19%
I've been thinking clearly
0% 0% 13% 66% 22%
I've been feeling good about myself
0% 1% 34% 50% 16%
I've been feeling close to other people
0% 0% 14% 60% 26%
I've been feeling confident
0% 0% 13% 69% 18%
I've been able to make up my mind about things
0% 0% 10% 59% 32%
I've been feeling loved
0% 0% 13% 63% 24%
I've been interested in new things
0% 1% 21% 72% 5%
I've been feeling cheerful
0% 0% 15% 82% 4%
Research Resource Dundee City Council 138

Q27 On a scale of 1 to 6 where 1 is not at all and 6 is a great deal, to what extent do you feel that people treat you unfairly?
71% 1 - Not at all 26% 2 4% 3 0% 4 0% 5 0% 6 - A great deal 0% Don't know Q28 To what extent do you agree with the statement "I could turn to friends/ relatives in this
neighbourhood for support? 57% Strongly agree 37% Tend to agree 2% Tend to disagree 0% Strongly disagree 4% Don't know Q29 Are you currently taking part in any of these forms of education/ classes of training? 91% None 1% On the job training 3% An FE college course 5% A university based course 0% Distance learning/ Open University 1% School 1% Adult education or evening class 0% Help with reading, writing or use of numbers 0% Other Q30 What type of qualification, if any, will this lead to. Would it lead to... 6% No qualification 54% A qualification at degree level or above 40% Another qualification Q31 Taking everything into account how safe do you feel your neighbourhood is as a place to
live? 82% Very safe 18% Fairly safe 0% A bit unsafe 0% Very unsafe 0% Don't know Q32 How safe do you feel when... Very safe Fairly safe A bit unsafe Very unsafe Don't know Alone in your home
during the day 93% 7% 0% 0% 0%
Alone in your home at night
92% 8% 0% 0% 0%
Walking alone in your neighbourhood during the day
92% 8% 0% 0% 0%
Walking alone in your neighbourhood after dark
55% 26% 6% 0% 12%
Research Resource Dundee City Council 139

Q33 Do you think that the amount of crime in your neighbourhood has increased or decreased
over the past year? 0% Decreased a lot 4% Decreased a little 69% Remained the same 4% Increased a little 0% Increased a lot 23% Don't know Q34 If you feel crime has increased in your neighbourhood, what has influenced your option? 0% Personal experience of crime 0% Experience of family or friends 100% Talking to people in the area 0% Media - television, radio, paper 0% Social media internet sites e.g. Facebook, Twitter 0% Internet sites 0% Police or Council publications 0% Other Q35 What, in your opinion, is the main factor which contributes most to the level of crime in
your neighbourhood? 3% Boredom/ nothing to do/ lack of facilities 45% Don't know 0% Driving offences/ speeding/ motorbikes 0% Immigrants 30% Alcohol/ Drugs 4% Nothing 0% Lack of money/ poverty 1% Unemployment 0% Prostitution 0% New people/ undesirables moving into area/ not knowing who your neighbours are 0% Anti social behaviour 2% Crime e.g. Break ins/ burglary/ vandalism 13% This is a good area/ neighbourhood/ quiet/ no trouble 0% Lack of discipline/ parental control 0% Opportunists/ some people can't help themselves 0% Lack of policing/ wardens 2% Other 3% Gangs/ youths Q36 To what extent, if it all, does a fear of crime prevent you from taking part in your every day
activities? 95% Not at all 5% A little 0% Quite a lot 0% A great deal 0% Don't know
Research Resource Dundee City Council 140

Q37 Which of these accounts, if any, do you or your partner have? 96% Bank account 18% Building society account 3% Credit union account 1% Post Office card account 0% No, none of these 1% Prefer not to say Q38 Do you have insurance for the contents of your house such as for furniture, electrical
goods etc? 75% Yes 19% No 4% Prefer not to say 3% Don't know Q39 Think about the total value of any savings or investments you have, at the moment do
you (or your partner) have total savings or investments worth £1,000 or more in any combination of the places mentioned on this card, do you have less than £1,000 in savings or investments or do you have no savings or investments at all?
20% No savings 11% Less than £1,000 27% £1,000 or more 2% Don't know 41% Prefer not to say Q40 Are you currently experiencing, or within the last year have you had any difficulties with
the following? 3% Mortgage or rent payments 1% Changes to benefits 0% Council tax payments 2% Loan or credit card payments 6% Cost of food 16% Cost of domestic energy bills 1% Vehicle fuel prices 78% None of the above 4% Prefer not to say Q41 Taking everything together, which of these phrases on this card best describes how you
and your household are managing financially these days? 29% Manage very well 44% Manage quite well 24% Get by all right 2% Don't manage very well 1% Have some deep financial difficulties 0% Are in deep financial trouble 0% Refused 0% Don't know
Research Resource Dundee City Council 141

Q42 When you last contacted Dundee City Council, was this contact to ...? 2% Make a complaint 15% Seek information 28% Request a service 1% Make a suggestion 55% Have never contacted with Council Q43 Overall, how satisfied were you that the Council responded reasonably to your
complaint? 100% Very satisfied 0% Satisfied 0% Neither satisfied nor dissatisfied 0% Dissatisfied 0% Very dissatisfied Q44 Overall, how satisfied were you with this contact to seek information? 52% Very satisfied 41% Satisfied 7% Neither satisfied nor dissatisfied 0% Dissatisfied 0% Very dissatisfied Q45 Overall, how satisfied were you with this contact to request a service? 71% Very satisfied 27% Satisfied 0% Neither satisfied nor dissatisfied 2% Dissatisfied 0% Very dissatisfied Q46 On your most recent contact with the Council, did you.... 85% Get what you need at that contact 15% Have to contact the Council again about the same issue Q47 Was your most recent contact .... 0% By a letter 88% By a telephone call to the Council 4% By a personal visit to a Council office 1% By e-mail 8% By visiting the Council's website
Research Resource Dundee City Council 142

Q48 How satisfied or dissatisfied were you with your recent contact with the Council by telephone in terms of the following?
Very satisfied Fairly satisfied Neither nor Fairly dissatisfied
Very dissatisfied
Don't know
How easy it was for you to find the right number to call
86% 14% 0% 0% 0% 0%
How quickly the phone was answered
86% 14% 0% 0% 0% 0%
How easy it was to get through to someone who could help
86% 14% 0% 0% 0% 0%
Overall helpfulness/ friendliness/ courtesy of the staff you dealt with
86% 14% 0% 0% 0% 0%
How well the staff understood what you wanted
86% 14% 0% 0% 0% 0%
The outcome of your contact
83% 11% 4% 2% 0% 0%
Q49 How satisfied or dissatisfied were you with your recent contact when visiting a Council
office in terms of the following? Very satisfied Fairly satisfied Neither nor Fairly
dissatisfied Very
dissatisfied Don't know
How easy it was to get to the office
100% 0% 0% 0% 0% 0%
The suitability of the office e.g. waiting areas, privacy, access for disabled people etc
100% 0% 0% 0% 0% 0%
Overall helpfulness/ friendliness/ courtesy of the staff you dealt with
100% 0% 0% 0% 0% 0%
How well the staff understood what you wanted
100% 0% 0% 0% 0% 0%
The outcome of your contact
68% 32% 0% 0% 0% 0%
Q50 How satisfied or dissatisfied were you with your most recent cpntact with the Council by
email/ letter in terms of the following? Very satisfied Fairly satisfied Neither nor Fairly
dissatisfied Very
dissatisfied Don't know
How quickly you received a reply to your email/ letter
0% 100% 0% 0% 0% 0%
The extent to which the first reply you received answered your query
100% 0% 0% 0% 0% 0%
The outcome of your contact
100% 0% 0% 0% 0% 0%
Research Resource Dundee City Council 143

Q51 Have you ever used the Council's website? 36% Yes 64% No Q52 How satisfied or dissatisfied would you say you are with the website in terms of the
following? Very
satisfied Fairly
satisfied Neither nor Fairly
dissatisfied Very
dissatisfied Don't know Not
applicable How easily you
managed to find the information you wanted
64% 36% 0% 0% 0% 0% 0%
The amount of information provided on the website
64% 36% 0% 0% 0% 0% 0%
Q53 Generally, do you feel that you receive enough information about the Council and the
services it provides? 89% Yes 11% No Q54 Do you access, and use, the internet in any of the following ways... 70% Internet access at home 45% Internet access via a mobile phone 27% Internet access at work 4% Internet access through public access e.g. at library 2% Access the internet in some other way 22% None of these - I do not access the internet Q55 Do you know that the Council have procedures in place to respond to situations where
vulnerable adults might be at risk of harm? 39% Yes 61% No Q55 Would you know who to contact if you had concerns that a vulnerable adult was at risk of
being abused? 65% Yes 35% No Q56 I am going to read out a list of statements about your local Council and would like you to
tell me which 3 are of the most importance to you. Dundee City Council/ Angus Council... 53% Offering a good range of services 45% Providing an efficient service 56% Providing services which are value for money 44% Providing good quality services 19% Having friendly, polite, helpful, well informed employees 10% Promoting its services well 47% Tackling important issues for the future of the area 17% Listening to complaints 6% Communicating well with the public 5% Ensuring sustainable use of resources and care for the environment 0% Don't know
Research Resource Dundee City Council 144

Q57 I am going to read out the same list of statements again about your local Council. I would like you to tell me whether you agree or disagree with each of these statements. Dundee City Council/ Angus Council....
Agree Neither nor Disagree Don't know Offers a good range
of services 78% 21% 1% 0%
Provides an efficient service
74% 26% 0% 0%
Provides services which are value for money
64% 35% 1% 0%
Provides good quality services
75% 24% 1% 0%
Has friendly, polite, helpful, well informed employees
65% 34% 1% 0%
Promotes its services well
60% 37% 3% 0%
Tackles important issues for the future of the area
70% 27% 3% 0%
Listens to complaints 57% 41% 3% 0% Communicates well
with the public 64% 33% 2% 0%
Ensures sustainable use of resources and care for the environment
57% 40% 3% 0%
Q58 Could I just check how many adults, aged 16 or over, are there in the household including
you? And how many children? 25% 1 63% 2 10% 3 2% 4 0% 5 Q58 Could I just check how many adults, aged 16 or over, are there in the household including
you? And how many children? 70% 0 22% 1 6% 2 2% 3 0% 4 0% 5+ Q59 How many children are there in the household in each group? 0 1 2 3 4 5+ Less than 3 years 60% 39% 1% 0% 0% 0% 3-5years 78% 21% 2% 0% 0% 0% 6-15 years 51% 34% 14% 2% 0% 0% Q60 Gender of respondent: 46% Male 54% Female
Research Resource Dundee City Council 145

Q60 Age of respondent: 14% 16-24 27% 25-34 11% 35-44 11% 45-54 7% 55-59 7% 60-64 16% 65-74 7% 75+ 0% Refused HHCOMP HOUSEHOLD COMPOSITION 13% Single adult under 60 8% Single adult 60+ 17% Two adults under 60 20% Two adults aged 60+ 4% Two adults at least one over 60 4% Single adult with at least one child 22% Two adults and at least one child 8% Three or more adults with no children 4% Other Q61 How many motor vehicles does your household have access to for personal use? (this
includes motorbikes, mopeds, cars, vans etc) 53% 1 12% 2 2% 3 0% 4 or more 32% None Q62 Do you or any member of your household have a disability? 12% Yes 88% No Q63 What is the nature of the disability? 14% Mental health condition 82% Mobility/ physical disabilities 0% Learning difficulties (e.g. dyslexia) 0% Difficulties with sight 0% Learning disability (e.g. Downs Syndrome) 0% Developmental disorder (e.g. Autistic Spectrum Disorder or Asperger's syndrome) 0% Difficulties with hearing 7% Other condition (please write in) 0% Don't know 0% Refused
Research Resource Dundee City Council 146

Q64 Can you please look at this card and specify what is your religion? 56% None 25% Church of Scotland 15% Roman Catholic 1% Other Christian 0% Buddhist 0% Hindu 0% Jewish 2% Muslim 0% Sikh 1% Another religion (please specify) 1% Would rather not say Q65 Which of these groups on this card do you consider you belong to? 85% Scottish 6% Other British 1% Irish 0% Gypsy/ Traveller 4% Polish 2% Any other white ethnic group 0% Any mixed or multiple ethnic groups 1% Pakistani, Pakistani Scottish or Pakistani British 1% Indian, Indian Scottish or Indian British 0% Bangladeshi, Bangladeshi Scottish or Bangladeshi British 1% Chinese, Chinese Scottish ior Chinese British 0% Other 0% African, African Scottish or African British 0% Caribbean, Caribbean Scottish ior Caribbean British 0% Black, Black Scottish or Black British 0% Other 0% Arab 0% Any other background 0% Refused 0% Don't know Q66 Would you mind looking at the card and tell me which group your overall annual
household income falls. Please use net income from all sources i.e. after deductions of income tax. national insurance, and other compulsory deductions. Please take into account any money you may have from employment, including bonuses, overtime, pensions, state pensions, welfare benefits and interest from savings.
1% Less than £100 per week/ £5,199 per year 6% £100-199 per week / £5,200 - £10,399 per year 6% £200-299 per week / £10,400 - £15, 599 per year 6% £300-399 per week / £15,600 - £20,199 per year 10% £400-499 per week / £20,800 - £25,999 per year 7% £500-599 per week / £26,000 - £31,199 per year 12% £600 or more per week/ £31,200 or more per year 12% Don't know 39% Would rather not say
Research Resource Dundee City Council 147

Lochee
CITIZENS' SURVEY 2015 SQ1 Community Regeneration area: 0% Ardler, St Mary's and Kirkton 67% Beechwood, Lochee, Menziehill and Charleston 0% Coldside and Maryfield 0% Fintry, Whitfield and Mill O Mains 0% Mid Craigie, Linlathen and Douglas 32% None SQ2 Ward 0% West End 0% Maryfield 0% The Ferry 0% Coldside 100% Lochee 0% East End 0% North East 0% Strathmartine
Research Resource Dundee City Council 148

Q1 What do you like best about living in this neighbourhood? 0% Close to beach/ coast 2% Quality of housing 12% Close to shops/ quality of shops/ amenities 7% Always lived here/ familiar with/ know area 16% Pleasant/ nice area 30% Friendly people/ neighbours/ family and friends 40% Quiet/ peaceful 13% Convenient location 1% Central location 3% Other 4% None/ nothing 6% Don't know 1% Lots for kids to do 1% Lots of green/ open spaces/ countryside/ nice views 2% Safe 2% Good public transport 1% Everything 15% It's ok/ fine/ I like it here/ no problems Q2 What do you like least about living in this neighbourhood? 0% Littering/ dirty/ dog fouling 2% Difficult/ poor parking 6% Drug problems 0% Lack of facilities for youths/ children 3% ASB/ neighbours/ noisy 2% Youths/ gangs causing trouble 0% Poor shops 2% Vandalism 5% Other 65% None/ nothing 0% Lack of security 9% Don't know 0% Speeding cars/ traffic 2% Lack of transport/ poor public transport 5% Area going downhill/ untidy/ rundown 0% Roads/ pavements/ winter gritting/ snow clearing 1% Bin uplifts/ refuse collection 2% Too many private lets/ undesirables moving into the area 0% Too many stairs/ hills 1% Not much for people to do in general Q3 How long have you lived in this neighbourhood? 3% Up to one year 8% 1-2 years 17% 3-5 years 10% 6-10 years 38% Over 10 years 23% Always lived there 0% Don't know
Research Resource Dundee City Council 149

Q4 Could you please tell me if you think this neighbourhood has changed over the past 5 years, or since you've been living here if it's less than 5 years?
5% Yes - has got better 6% Yes - has got worse 73% No change 17% Don't know Q5better In what ways do you think it has changed? (GOT BETTER) 0% Access to parks/ open spaces 14% Better facilities/ amenities 0% Less vandalism 21% Housing improvements - new houses 0% Improved schools 7% Cleaner/ tidier/ less litter 13% Improved shops 20% Fewer drug problems 6% Friendliness of people/ neighbours 19% Quieter/ more peaceful 47% Other 0% Not sure 0% Less people hanging around street 0% Less crime 0% More young families in the area Q5worse Q5 In what ways do you think it has changed? (GOT WORSE) 0% Lack of parks/ open spaces 0% Overgrown gardens/ uncut grass 0% Poorer shops 0% More vandalism 23% Undesirable people moving in 0% Lack of facilities for youths/ children 12% ASB/ neighbours/ noisy 0% People/ neighbours less friendly 17% Youths/ gangs causing problems 30% Drug/ alcohol problems 7% Other 0% Not sure 6% More crime 0% People don't care about area 6% Too many private lets 24% Litter problems/ area is dirty 12% Area is rundown/ going downhill 0% More houses being built 6% Parking 7% Condition of roads/ pavements 0% More traffic/ motorbikes/ roads unsafe
Research Resource Dundee City Council 150

Q6 Thinking now about the neighbourhood you live in, how would you rate it as a place to live?
63% Very good 30% Fairly good 5% Fairly poor 1% Very poor 0% No opinion Q7 How long have you lived in this house/ flat? 6% Up to one year 10% 1-2 years 20% 3-5 years 12% 6-10 years 49% Over 10 years 3% Always lived here 0% Don't know Q8 Please tell me which of the descriptions on this card best describes your house/ flat? 35% Rented from the Council 7% Rented from a housing association 11% Rented from a private landlord 15% Owned by you (not ex Council) 32% Owned by you (ex Council) 0% Other (please specify) Q9 Overall, how do you rate the general condition of this (your) house/ flat? 69% Very good 29% Fairly good 2% Average 0% Fairly poor 0% Very poor 0% Don't know
Research Resource Dundee City Council 151

Q10 Looking at this card, please state how satisfied or dissatisfied you are with the following services and facilities in your local area?
Very Satisfied Fairly Satisfied Fairly Dissatisfied Very Dissatisfied Doesn't exist/ never used
Local Health services
81% 19% 0% 0% 0%
Police service 65% 26% 1% 0% 8% Fire service 65% 26% 0% 0% 8% Refuse collection 66% 31% 2% 0% 0% Local Schools 56% 21% 1% 0% 22% Social care/ social
work services 18% 11% 0% 0% 71%
Social housing 41% 25% 2% 2% 30% Employment and
advice services 14% 28% 1% 0% 56%
Public transport 56% 24% 6% 4% 11% Street cleaning 39% 55% 4% 1% 0% Sports and leisure
facilities 49% 34% 1% 1% 15%
Community centre/ library
59% 27% 0% 0% 14%
Parks and open spaces
77% 18% 1% 0% 4%
Local phone boxes 28% 15% 1% 0% 55% Local youth facilities 11% 24% 3% 3% 60% Local shops 79% 19% 1% 0% 1% Community Warden
Service 21% 18% 2% 0% 60%
Access to free cash machine/ auto teller
81% 18% 1% 0% 0%
Research Resource Dundee City Council 152

Q11 And, looking at this card, how easy is it for you to access those services and facilities in your local area?
Very easy Fairly easy Fairly difficult Very difficult Doesn't exist/ never used
Local Health services
63% 36% 1% 0% 0%
Police service 69% 31% 0% 0% 0% Fire service 70% 30% 0% 0% 0% Refuse collection 67% 33% 0% 0% 0% Local Schools 54% 23% 0% 0% 24% Social care/ social
work services 36% 11% 0% 0% 54%
Social housing 50% 17% 1% 1% 31% Employment and
advice services 35% 13% 0% 0% 52%
Public transport 71% 22% 2% 0% 6% Street cleaning 49% 49% 0% 0% 2% Sports and leisure
facilities 51% 24% 2% 0% 23%
Community centre/ library
67% 26% 0% 0% 7%
Parks and open spaces
68% 29% 0% 0% 2%
Local phone boxes 41% 9% 1% 2% 48% Local youth facilities 29% 12% 0% 0% 59% Local shops 86% 13% 0% 0% 1% Community Warden
Service 34% 18% 1% 1% 47%
Access to free cash machine/ auto teller
86% 13% 0% 0% 1%
Q12 Looking at this card, how satisfied are you with the following in this neighbourhood? Very satisfied Fairly satisfied Fairly dissatisfied Very dissatisfied Don't know Children's Play areas 18% 46% 5% 2% 29% Cleanliness of
Streets 32% 62% 5% 1% 0%
Shopping Facilities 70% 29% 1% 0% 0% Condition of roads,
pavements and street lighting
28% 43% 27% 2% 0%
Quality and maintenance of open spaces
37% 61% 2% 0% 0%
Cleanliness of the area around your home
37% 57% 5% 1% 0%
The built environment (e.g. buildings, heritage etc)
44% 55% 1% 0% 0%
The natural environment (e.g. parks, open spaces, countryside etc)
49% 50% 1% 0% 0%
Research Resource Dundee City Council 153

Q13 Overall, how satisfied are you with the quality of life in this neighbourhood? 69% Very satisfied 26% Satisfied 4% Dissatisfied 0% Very dissatisfied Q14 Overall, how satisfied are you with the quality of life in Dundee? 73% Very satisfied 26% Satisfied 2% Dissatisfied 0% Very dissatisfied Q15 Can you tell me firstly, if you are aware of any of these in this area? 44% After school/ children's club 11% Youth clubs/ projects or drop-in centres 19% Voluntary Youth Organisations 3% Youth Information Services 2% Other Youthwork activities 55% Organised Sporting activities/ classes/ clubs 51% Organised Social/ Leisure activities/ classes/ clubs 25% Learning groups or adult education classes 15% Self-help or social care groups 37% Community Festivals/ Events e.g. Gala Day 21% Community Council or Neighbourhood Group 13% Community Regeneration Forum or Group 10% Local Consultation Activities or Events 16% None
Research Resource Dundee City Council 154

Q15 And then, if you are aware, how often do you, or anyone living in your home, take part in activities like these?
Daily Weekly Monthly Seldom Never After school/
children's clubs 2% 5% 0% 11% 82%
Youth clubs/ projects or drop-in centres
3% 3% 0% 0% 94%
Voluntary Youth Organisations
0% 7% 0% 0% 93%
Youth Information Services
0% 0% 0% 0% 100%
Other Youthwork activities
0% 0% 0% 0% 100%
Organised Sporting activities/ classes/ clubs
1% 34% 1% 4% 60%
Organised Social/ Leisure activities/ classes/ clubs
0% 29% 1% 5% 65%
Learning groups or adult education classes
0% 1% 0% 0% 99%
Self-help or social care groups
0% 0% 0% 0% 100%
Community Festivals/ Events e.g. Gala Day
0% 0% 0% 39% 61%
Community Council or Neighbourhood Group
0% 3% 0% 2% 95%
Community Regeneration Forum or Group
0% 0% 0% 0% 100%
Local Consultation Activities or Events
0% 0% 0% 6% 94%
Q16 Q16 Thinking back over the last 12 months, have you given up any time to help any clubs,
charities, campaigns or organisations. I mean in an unpaid capacity. 7% Yes 93% No
Research Resource Dundee City Council 155

Q17 Looking at this showcard, can you tell me if you have undertaken any work or given unpaid help to any of these types of groups or organisations at any time in the past 12 months?
1% Children's group - e.g. playgroup, mothers and toddlers 1% School children e.g. school trips, sports days, discos, in the classroom 0% Youth groups/ children's activities outside of school 0% Coaching or organising sport or exercise 0% Church, religion or faith-based group 0% The elderly 0% Health disability or social welfare group or organisation 0% Local community group/ neighbourhood association/ community council 0% Tenants group/ residents association 0% Trade union activities 0% Public service - e.g. school, hospital, police, local government service 0% Professional society 0% Safety/ first aid 0% The environment/ animals 0% Justice/ human rights 0% Hobbies/ recreation/ arts/ social club 0% Citizens groups 0% Domestic animal welfare 0% Wildlife protection 0% Environmental protection 97% None Q18 In the last 12 months have you been to any of these events or places in Dundee? 41% Cinema 1% Exhibition including art, photography or crafts 0% Book festival or reading group 11% Theatre e.g. pantomime, musical or play 2% Street arts (art in everyday surroundings like streets, parks or shopping centre) 1% Culturally specific festival e.g. mela/ Feis/ local Gala days 0% Classical music performance or opera 28% Live music event e.g. traditional music, rock concert, jazz event 1% Dance show/ event e.g. ballet 17% Museum 1% Historical place e.g. castle, stately home and grounds, battle or archaeology site 9% Gallery 30% Library, including mobile or online 0% Archive or records office 35% None
Research Resource Dundee City Council 156

Q19 If you have not taken part in any community activities or organisations, can you tell me why this is?
14% It costs too much 1% I don't know enough about it 20% Never occurred to me 55% Not really interested 1% I don't have anyone to go with 0% I wouldn't enjoy it 0% Not enough facilities close to where I live 16% Health isn't good enough 0% I might feel uncomfortable or out of place 0% Lack of transport/ I can't easily get to it 0% Poor access to venues (e.g. no disabled ramps) 0% Not enough information on what is available 0% Didn't enjoy it last time 9% It's difficult to find the time 0% I would feel unsafe going to/ from the activity/ event 0% I would feel unsafe at the activity/ event 2% Other Q20 Please tell me to what extent you agree or disagree with the following statements? Strongly agree Tend to agree Neither agree
nor disagree Tend to disagree
Strongly disagree
No opinion
I can influence decisions affecting my local area
2% 26% 17% 24% 10% 21%
People in my community can influence decisions affecting my local area
2% 34% 22% 11% 5% 27%
Q21 First of all could you tell me whether you are registered with.... a GP or health centre? 99% Yes 0% No 1% Don't know Q21 First of all could you tell me whether you are registered with.... a dentist? 91% Yes 9% No 0% Don't know Q22 How good is your health overall? 57% Very good 23% Good 13% Fair 6% Poor 1% Very poor 0% Don't know
Research Resource Dundee City Council 157

Q23 In a typical week, how often do you undertake moderate physical activity for at least 30 minutes in a day?
19% 4 days a week or more 50% 1-3 days a week 10% Less than once a week 21% Never Q24 Are you, or have you ever been, a smoker? 24% Currently smoke 26% Used to smoke 50% Never smoked Q25 How often do you have (8 for men/ 6 for women) or more alcoholic drinks on one
occasion? 1% Daily or almost daily 17% Weekly 13% Monthly 18% Less than monthly 50% Never 0% Don't know Q26 Please say which option best describes your experience over the last 2 weeks. None of the time Rarely Some of the time Often All of the time I've been feeling
optimistic about the future
0% 4% 38% 49% 9%
I've been feeling useful
0% 1% 25% 62% 12%
I've been feeling relaxed
0% 0% 32% 61% 6%
I've been feeling interested in other people
0% 1% 36% 54% 9%
I've had energy to spare
0% 6% 34% 53% 7%
I've been dealing well with problems
0% 0% 16% 57% 27%
I've been thinking clearly
0% 0% 14% 56% 30%
I've been feeling good about myself
0% 0% 17% 61% 22%
I've been feeling close to other people
0% 1% 11% 56% 32%
I've been feeling confident
0% 0% 14% 59% 27%
I've been able to make up my mind about things
0% 0% 11% 53% 36%
I've been feeling loved
0% 1% 14% 56% 29%
I've been interested in new things
0% 4% 24% 59% 13%
I've been feeling cheerful
0% 0% 14% 74% 12%
Research Resource Dundee City Council 158

Q27 On a scale of 1 to 6 where 1 is not at all and 6 is a great deal, to what extent do you feel that people treat you unfairly?
84% 1 - Not at all 14% 2 2% 3 1% 4 0% 5 0% 6 - A great deal 0% Don't know Q28 To what extent do you agree with the statement "I could turn to friends/ relatives in this
neighbourhood for support? 63% Strongly agree 31% Tend to agree 2% Tend to disagree 1% Strongly disagree 3% Don't know Q29 Are you currently taking part in any of these forms of education/ classes of training? 97% None 1% On the job training 2% An FE college course 0% A university based course 0% Distance learning/ Open University 0% School 0% Adult education or evening class 0% Help with reading, writing or use of numbers 0% Other Q30 What type of qualification, if any, will this lead to. Would it lead to... 21% No qualification 45% A qualification at degree level or above 34% Another qualification Q31 Taking everything into account how safe do you feel your neighbourhood is as a place to
live? 83% Very safe 15% Fairly safe 2% A bit unsafe 0% Very unsafe 0% Don't know Q32 How safe do you feel when... Very safe Fairly safe A bit unsafe Very unsafe Don't know Alone in your home
during the day 93% 7% 0% 0% 0%
Alone in your home at night
90% 9% 1% 0% 0%
Walking alone in your neighbourhood during the day
91% 9% 0% 0% 0%
Walking alone in your neighbourhood after dark
52% 31% 9% 1% 8%
Research Resource Dundee City Council 159

Q33 Do you think that the amount of crime in your neighbourhood has increased or decreased
over the past year? 0% Decreased a lot 4% Decreased a little 74% Remained the same 2% Increased a little 2% Increased a lot 18% Don't know Q34 If you feel crime has increased in your neighbourhood, what has influenced your option? 31% Personal experience of crime 8% Experience of family or friends 54% Talking to people in the area 15% Media - television, radio, paper 0% Social media internet sites e.g. Facebook, Twitter 0% Internet sites 7% Police or Council publications 8% Other Q35 What, in your opinion, is the main factor which contributes most to the level of crime in
your neighbourhood? 3% Boredom/ nothing to do/ lack of facilities 39% Don't know 0% Driving offences/ speeding/ motorbikes 0% Immigrants 43% Alcohol/ Drugs 2% Nothing 0% Lack of money/ poverty 1% Unemployment 0% Prostitution 0% New people/ undesirables moving into area/ not knowing who your neighbours are 0% Anti social behaviour 2% Crime e.g. Break ins/ burglary/ vandalism 9% This is a good area/ neighbourhood/ quiet/ no trouble 0% Lack of discipline/ parental control 0% Opportunists/ some people can't help themselves 0% Lack of policing/ wardens 1% Other 8% Gangs/ youths Q36 To what extent, if it all, does a fear of crime prevent you from taking part in your every day
activities? 94% Not at all 5% A little 1% Quite a lot 0% A great deal 0% Don't know
Research Resource Dundee City Council 160

Q37 Which of these accounts, if any, do you or your partner have? 98% Bank account 9% Building society account 5% Credit union account 4% Post Office card account 0% No, none of these 0% Prefer not to say Q38 Do you have insurance for the contents of your house such as for furniture, electrical
goods etc? 73% Yes 23% No 3% Prefer not to say 1% Don't know Q39 Think about the total value of any savings or investments you have, at the moment do
you (or your partner) have total savings or investments worth £1,000 or more in any combination of the places mentioned on this card, do you have less than £1,000 in savings or investments or do you have no savings or investments at all?
28% No savings 8% Less than £1,000 21% £1,000 or more 3% Don't know 40% Prefer not to say Q40 Are you currently experiencing, or within the last year have you had any difficulties with
the following? 3% Mortgage or rent payments 4% Changes to benefits 3% Council tax payments 2% Loan or credit card payments 3% Cost of food 14% Cost of domestic energy bills 1% Vehicle fuel prices 79% None of the above 2% Prefer not to say Q41 Taking everything together, which of these phrases on this card best describes how you
and your household are managing financially these days? 11% Manage very well 50% Manage quite well 34% Get by all right 1% Don't manage very well 3% Have some deep financial difficulties 0% Are in deep financial trouble 0% Refused 1% Don't know
Research Resource Dundee City Council 161

Q42 When you last contacted Dundee City Council, was this contact to ...? 4% Make a complaint 9% Seek information 32% Request a service 0% Make a suggestion 55% Have never contacted with Council Q43 Overall, how satisfied were you that the Council responded reasonably to your
complaint? 0% Very satisfied 42% Satisfied 17% Neither satisfied nor dissatisfied 32% Dissatisfied 9% Very dissatisfied Q44 Overall, how satisfied were you with this contact to seek information? 45% Very satisfied 32% Satisfied 19% Neither satisfied nor dissatisfied 0% Dissatisfied 3% Very dissatisfied Q45 Overall, how satisfied were you with this contact to request a service? 90% Very satisfied 9% Satisfied 0% Neither satisfied nor dissatisfied 1% Dissatisfied 0% Very dissatisfied Q46 On your most recent contact with the Council, did you.... 90% Get what you need at that contact 10% Have to contact the Council again about the same issue Q47 Was your most recent contact .... 1% By a letter 89% By a telephone call to the Council 4% By a personal visit to a Council office 1% By e-mail 5% By visiting the Council's website
Research Resource Dundee City Council 162

Q48 How satisfied or dissatisfied were you with your recent contact with the Council by telephone in terms of the following?
Very satisfied Fairly satisfied Neither nor Fairly dissatisfied
Very dissatisfied
Don't know
How easy it was for you to find the right number to call
88% 12% 0% 0% 0% 1%
How quickly the phone was answered
88% 12% 0% 0% 0% 1%
How easy it was to get through to someone who could help
86% 12% 0% 1% 0% 1%
Overall helpfulness/ friendliness/ courtesy of the staff you dealt with
84% 13% 2% 0% 0% 1%
How well the staff understood what you wanted
84% 10% 3% 2% 0% 1%
The outcome of your contact
83% 8% 2% 4% 4% 0%
Q49 How satisfied or dissatisfied were you with your recent contact when visiting a Council
office in terms of the following? Very satisfied Fairly satisfied Neither nor Fairly
dissatisfied Very
dissatisfied Don't know
How easy it was to get to the office
82% 18% 0% 0% 0% 0%
The suitability of the office e.g. waiting areas, privacy, access for disabled people etc
82% 18% 0% 0% 0% 0%
Overall helpfulness/ friendliness/ courtesy of the staff you dealt with
82% 18% 0% 0% 0% 0%
How well the staff understood what you wanted
82% 18% 0% 0% 0% 0%
The outcome of your contact
82% 18% 0% 0% 0% 0%
Q50 How satisfied or dissatisfied were you with your most recent cpntact with the Council by
email/ letter in terms of the following? Very satisfied Fairly satisfied Neither nor Fairly
dissatisfied Very
dissatisfied Don't know
How quickly you received a reply to your email/ letter
50% 0% 0% 50% 0% 0%
The extent to which the first reply you received answered your query
0% 0% 0% 50% 50% 0%
The outcome of your contact
0% 50% 0% 0% 50% 0%
Research Resource Dundee City Council 163

Q51 Have you ever used the Council's website? 29% Yes 71% No Q52 How satisfied or dissatisfied would you say you are with the website in terms of the
following? Very
satisfied Fairly
satisfied Neither nor Fairly
dissatisfied Very
dissatisfied Don't know Not
applicable How easily you
managed to find the information you wanted
51% 48% 1% 0% 0% 0% 0%
The amount of information provided on the website
51% 46% 2% 0% 0% 0% 0%
Q53 Generally, do you feel that you receive enough information about the Council and the
services it provides? 91% Yes 9% No Q54 Do you access, and use, the internet in any of the following ways... 72% Internet access at home 48% Internet access via a mobile phone 15% Internet access at work 2% Internet access through public access e.g. at library 2% Access the internet in some other way 24% None of these - I do not access the internet Q55 Do you know that the Council have procedures in place to respond to situations where
vulnerable adults might be at risk of harm? 51% Yes 49% No Q55 Would you know who to contact if you had concerns that a vulnerable adult was at risk of
being abused? 71% Yes 29% No Q56 I am going to read out a list of statements about your local Council and would like you to
tell me which 3 are of the most importance to you. Dundee City Council/ Angus Council... 41% Offering a good range of services 41% Providing an efficient service 50% Providing services which are value for money 41% Providing good quality services 19% Having friendly, polite, helpful, well informed employees 10% Promoting its services well 49% Tackling important issues for the future of the area 26% Listening to complaints 6% Communicating well with the public 16% Ensuring sustainable use of resources and care for the environment 0% Don't know
Research Resource Dundee City Council 164

Q57 I am going to read out the same list of statements again about your local Council. I would like you to tell me whether you agree or disagree with each of these statements. Dundee City Council/ Angus Council....
Agree Neither nor Disagree Don't know Offers a good range
of services 75% 25% 0% 0%
Provides an efficient service
72% 27% 1% 0%
Provides services which are value for money
63% 35% 1% 0%
Provides good quality services
72% 28% 0% 0%
Has friendly, polite, helpful, well informed employees
60% 39% 0% 0%
Promotes its services well
60% 38% 2% 0%
Tackles important issues for the future of the area
63% 35% 2% 0%
Listens to complaints 49% 49% 1% 0% Communicates well
with the public 60% 39% 1% 0%
Ensures sustainable use of resources and care for the environment
61% 39% 1% 0%
Q58 Could I just check how many adults, aged 16 or over, are there in the household including
you? And how many children? 30% 1 60% 2 8% 3 2% 4 0% 5 Q58 Could I just check how many adults, aged 16 or over, are there in the household including
you? And how many children? 70% 0 14% 1 14% 2 1% 3 0% 4 0% 5+ Q59 How many children are there in the household in each group? 0 1 2 3 4 5+ Less than 3 years 56% 39% 5% 0% 0% 0% 3-5years 62% 31% 7% 0% 0% 0% 6-15 years 53% 28% 19% 0% 0% 0% Q60 Gender of respondent: 46% Male 54% Female
Research Resource Dundee City Council 165

Q60 Age of respondent: 9% 16-24 22% 25-34 17% 35-44 15% 45-54 8% 55-59 7% 60-64 12% 65-74 11% 75+ 0% Refused HHCOMP HOUSEHOLD COMPOSITION 10% Single adult under 60 14% Single adult 60+ 22% Two adults under 60 12% Two adults aged 60+ 4% Two adults at least one over 60 6% Single adult with at least one child 22% Two adults and at least one child 8% Three or more adults with no children 2% Other Q61 How many motor vehicles does your household have access to for personal use? (this
includes motorbikes, mopeds, cars, vans etc) 49% 1 12% 2 0% 3 0% 4 or more 38% None Q62 Do you or any member of your household have a disability? 17% Yes 83% No Q63 What is the nature of the disability? 16% Mental health condition 80% Mobility/ physical disabilities 0% Learning difficulties (e.g. dyslexia) 4% Difficulties with sight 2% Learning disability (e.g. Downs Syndrome) 2% Developmental disorder (e.g. Autistic Spectrum Disorder or Asperger's syndrome) 2% Difficulties with hearing 4% Other condition (please write in) 0% Don't know 0% Refused
Research Resource Dundee City Council 166

Q64 Can you please look at this card and specify what is your religion? 56% None 24% Church of Scotland 17% Roman Catholic 2% Other Christian 0% Buddhist 0% Hindu 0% Jewish 0% Muslim 0% Sikh 0% Another religion (please specify) 0% Would rather not say Q65 Which of these groups on this card do you consider you belong to? 93% Scottish 1% Other British 0% Irish 0% Gypsy/ Traveller 4% Polish 1% Any other white ethnic group 0% Any mixed or multiple ethnic groups 0% Pakistani, Pakistani Scottish or Pakistani British 1% Indian, Indian Scottish or Indian British 0% Bangladeshi, Bangladeshi Scottish or Bangladeshi British 0% Chinese, Chinese Scottish ior Chinese British 0% Other 0% African, African Scottish or African British 0% Caribbean, Caribbean Scottish ior Caribbean British 0% Black, Black Scottish or Black British 0% Other 0% Arab 0% Any other background 0% Refused 0% Don't know Q66 Would you mind looking at the card and tell me which group your overall annual
household income falls. Please use net income from all sources i.e. after deductions of income tax. national insurance, and other compulsory deductions. Please take into account any money you may have from employment, including bonuses, overtime, pensions, state pensions, welfare benefits and interest from savings.
1% Less than £100 per week/ £5,199 per year 5% £100-199 per week / £5,200 - £10,399 per year 8% £200-299 per week / £10,400 - £15, 599 per year 8% £300-399 per week / £15,600 - £20,199 per year 10% £400-499 per week / £20,800 - £25,999 per year 7% £500-599 per week / £26,000 - £31,199 per year 6% £600 or more per week/ £31,200 or more per year 10% Don't know 44% Would rather not say
Research Resource Dundee City Council 167

East End
CITIZENS' SURVEY 2015 SQ1 Community Regeneration area: 0% Ardler, St Mary's and Kirkton 0% Beechwood, Lochee, Menziehill and Charleston 0% Coldside and Maryfield 0% Fintry, Whitfield and Mill O Mains 82% Mid Craigie, Linlathen and Douglas 17% None SQ2 Ward 0% West End 0% Maryfield 0% The Ferry 0% Coldside 0% Lochee 100% East End 0% North East 0% Strathmartine
Research Resource Dundee City Council 168

Q1 What do you like best about living in this neighbourhood? 0% Close to beach/ coast 0% Quality of housing 20% Close to shops/ quality of shops/ amenities 3% Always lived here/ familiar with/ know area 13% Pleasant/ nice area 25% Friendly people/ neighbours/ family and friends 57% Quiet/ peaceful 11% Convenient location 0% Central location 3% Other 3% None/ nothing 0% Don't know 1% Lots for kids to do 0% Lots of green/ open spaces/ countryside/ nice views 6% Safe 8% Good public transport 1% Everything 14% It's ok/ fine/ I like it here/ no problems Q2 What do you like least about living in this neighbourhood? 2% Littering/ dirty/ dog fouling 5% Difficult/ poor parking 6% Drug problems 0% Lack of facilities for youths/ children 7% ASB/ neighbours/ noisy 3% Youths/ gangs causing trouble 1% Poor shops 0% Vandalism 3% Other 72% None/ nothing 1% Lack of security 0% Don't know 3% Speeding cars/ traffic 1% Lack of transport/ poor public transport 3% Area going downhill/ untidy/ rundown 0% Roads/ pavements/ winter gritting/ snow clearing 1% Bin uplifts/ refuse collection 3% Too many private lets/ undesirables moving into the area 0% Too many stairs/ hills 0% Not much for people to do in general Q3 How long have you lived in this neighbourhood? 6% Up to one year 7% 1-2 years 16% 3-5 years 13% 6-10 years 51% Over 10 years 7% Always lived there 0% Don't know
Research Resource Dundee City Council 169

Q4 Could you please tell me if you think this neighbourhood has changed over the past 5 years, or since you've been living here if it's less than 5 years?
7% Yes - has got better 7% Yes - has got worse 68% No change 18% Don't know Q5better In what ways do you think it has changed? (GOT BETTER) 0% Access to parks/ open spaces 0% Better facilities/ amenities 4% Less vandalism 0% Housing improvements - new houses 0% Improved schools 9% Cleaner/ tidier/ less litter 0% Improved shops 4% Fewer drug problems 41% Friendliness of people/ neighbours 41% Quieter/ more peaceful 0% Other 0% Not sure 0% Less people hanging around street 0% Less crime 0% More young families in the area Q5worse Q5 In what ways do you think it has changed? (GOT WORSE) 0% Lack of parks/ open spaces 0% Overgrown gardens/ uncut grass 0% Poorer shops 0% More vandalism 19% Undesirable people moving in 0% Lack of facilities for youths/ children 19% ASB/ neighbours/ noisy 0% People/ neighbours less friendly 0% Youths/ gangs causing problems 66% Drug/ alcohol problems 0% Other 0% Not sure 0% More crime 5% People don't care about area 5% Too many private lets 0% Litter problems/ area is dirty 5% Area is rundown/ going downhill 0% More houses being built 9% Parking 0% Condition of roads/ pavements 0% More traffic/ motorbikes/ roads unsafe
Research Resource Dundee City Council 170

Q6 Thinking now about the neighbourhood you live in, how would you rate it as a place to live?
51% Very good 43% Fairly good 4% Fairly poor 2% Very poor 0% No opinion Q7 How long have you lived in this house/ flat? 6% Up to one year 8% 1-2 years 17% 3-5 years 14% 6-10 years 52% Over 10 years 2% Always lived here 0% Don't know Q8 Please tell me which of the descriptions on this card best describes your house/ flat? 38% Rented from the Council 7% Rented from a housing association 7% Rented from a private landlord 21% Owned by you (not ex Council) 27% Owned by you (ex Council) 0% Other (please specify) Q9 Overall, how do you rate the general condition of this (your) house/ flat? 52% Very good 38% Fairly good 9% Average 1% Fairly poor 0% Very poor 0% Don't know
Research Resource Dundee City Council 171

Q10 Looking at this card, please state how satisfied or dissatisfied you are with the following services and facilities in your local area?
Very Satisfied Fairly Satisfied Fairly Dissatisfied Very Dissatisfied Doesn't exist/ never used
Local Health services
44% 43% 10% 3% 0%
Police service 39% 44% 4% 1% 12% Fire service 41% 43% 0% 0% 15% Refuse collection 47% 52% 1% 0% 1% Local Schools 42% 26% 0% 0% 31% Social care/ social
work services 6% 29% 0% 0% 65%
Social housing 29% 45% 1% 1% 25% Employment and
advice services 0% 25% 5% 6% 63%
Public transport 53% 33% 8% 1% 5% Street cleaning 4% 81% 15% 0% 0% Sports and leisure
facilities 43% 30% 3% 2% 22%
Community centre/ library
36% 43% 8% 0% 13%
Parks and open spaces
47% 41% 9% 1% 2%
Local phone boxes 0% 18% 1% 6% 75% Local youth facilities 10% 31% 1% 1% 56% Local shops 53% 39% 7% 0% 1% Community Warden
Service 6% 43% 1% 0% 50%
Access to free cash machine/ auto teller
50% 41% 4% 0% 5%
Research Resource Dundee City Council 172

Q11 And, looking at this card, how easy is it for you to access those services and facilities in your local area?
Very easy Fairly easy Fairly difficult Very difficult Doesn't exist/ never used
Local Health services
20% 80% 0% 0% 0%
Police service 31% 65% 0% 0% 4% Fire service 31% 64% 0% 0% 5% Refuse collection 34% 65% 0% 0% 0% Local Schools 19% 49% 0% 0% 32% Social care/ social
work services 8% 25% 0% 0% 67%
Social housing 32% 37% 0% 0% 31% Employment and
advice services 6% 28% 1% 0% 65%
Public transport 49% 41% 5% 0% 5% Street cleaning 11% 84% 4% 0% 1% Sports and leisure
facilities 13% 53% 2% 0% 33%
Community centre/ library
14% 64% 8% 0% 13%
Parks and open spaces
19% 75% 3% 0% 4%
Local phone boxes 6% 20% 0% 0% 74% Local youth facilities 6% 27% 1% 0% 66% Local shops 56% 41% 2% 0% 1% Community Warden
Service 8% 38% 1% 0% 53%
Access to free cash machine/ auto teller
54% 37% 4% 0% 5%
Q12 Looking at this card, how satisfied are you with the following in this neighbourhood? Very satisfied Fairly satisfied Fairly dissatisfied Very dissatisfied Don't know Children's Play areas 3% 75% 3% 0% 19% Cleanliness of
Streets 3% 84% 13% 0% 0%
Shopping Facilities 43% 50% 7% 0% 0% Condition of roads,
pavements and street lighting
1% 74% 24% 0% 0%
Quality and maintenance of open spaces
10% 81% 9% 0% 0%
Cleanliness of the area around your home
12% 83% 6% 0% 0%
The built environment (e.g. buildings, heritage etc)
18% 75% 5% 0% 1%
The natural environment (e.g. parks, open spaces, countryside etc)
19% 72% 6% 1% 1%
Research Resource Dundee City Council 173

Q13 Overall, how satisfied are you with the quality of life in this neighbourhood? 51% Very satisfied 46% Satisfied 2% Dissatisfied 0% Very dissatisfied Q14 Overall, how satisfied are you with the quality of life in Dundee? 54% Very satisfied 45% Satisfied 1% Dissatisfied 0% Very dissatisfied Q15 Can you tell me firstly, if you are aware of any of these in this area? 56% After school/ children's club 16% Youth clubs/ projects or drop-in centres 31% Voluntary Youth Organisations 10% Youth Information Services 13% Other Youthwork activities 60% Organised Sporting activities/ classes/ clubs 52% Organised Social/ Leisure activities/ classes/ clubs 34% Learning groups or adult education classes 20% Self-help or social care groups 17% Community Festivals/ Events e.g. Gala Day 7% Community Council or Neighbourhood Group 2% Community Regeneration Forum or Group 6% Local Consultation Activities or Events 12% None
Research Resource Dundee City Council 174

Q15 And then, if you are aware, how often do you, or anyone living in your home, take part in activities like these?
Daily Weekly Monthly Seldom Never After school/
children's clubs 8% 10% 0% 0% 82%
Youth clubs/ projects or drop-in centres
4% 8% 0% 0% 88%
Voluntary Youth Organisations
0% 16% 2% 1% 81%
Youth Information Services
0% 0% 0% 0% 100%
Other Youthwork activities
0% 20% 3% 3% 74%
Organised Sporting activities/ classes/ clubs
0% 45% 1% 1% 54%
Organised Social/ Leisure activities/ classes/ clubs
1% 33% 0% 1% 65%
Learning groups or adult education classes
0% 13% 3% 0% 84%
Self-help or social care groups
0% 10% 2% 2% 86%
Community Festivals/ Events e.g. Gala Day
0% 0% 0% 67% 33%
Community Council or Neighbourhood Group
0% 5% 0% 0% 95%
Community Regeneration Forum or Group
0% 0% 0% 0% 100%
Local Consultation Activities or Events
0% 11% 5% 16% 68%
Q16 Q16 Thinking back over the last 12 months, have you given up any time to help any clubs,
charities, campaigns or organisations. I mean in an unpaid capacity. 7% Yes 93% No
Research Resource Dundee City Council 175

Q17 Looking at this showcard, can you tell me if you have undertaken any work or given unpaid help to any of these types of groups or organisations at any time in the past 12 months?
0% Children's group - e.g. playgroup, mothers and toddlers 0% School children e.g. school trips, sports days, discos, in the classroom 0% Youth groups/ children's activities outside of school 0% Coaching or organising sport or exercise 0% Church, religion or faith-based group 0% The elderly 0% Health disability or social welfare group or organisation 0% Local community group/ neighbourhood association/ community council 0% Tenants group/ residents association 0% Trade union activities 0% Public service - e.g. school, hospital, police, local government service 0% Professional society 0% Safety/ first aid 0% The environment/ animals 0% Justice/ human rights 0% Hobbies/ recreation/ arts/ social club 0% Citizens groups 0% Domestic animal welfare 0% Wildlife protection 0% Environmental protection 100% None Q18 In the last 12 months have you been to any of these events or places in Dundee? 56% Cinema 4% Exhibition including art, photography or crafts 1% Book festival or reading group 20% Theatre e.g. pantomime, musical or play 1% Street arts (art in everyday surroundings like streets, parks or shopping centre) 6% Culturally specific festival e.g. mela/ Feis/ local Gala days 2% Classical music performance or opera 25% Live music event e.g. traditional music, rock concert, jazz event 2% Dance show/ event e.g. ballet 24% Museum 2% Historical place e.g. castle, stately home and grounds, battle or archaeology site 11% Gallery 37% Library, including mobile or online 0% Archive or records office 20% None
Research Resource Dundee City Council 176

Q19 If you have not taken part in any community activities or organisations, can you tell me why this is?
12% It costs too much 2% I don't know enough about it 0% Never occurred to me 67% Not really interested 0% I don't have anyone to go with 7% I wouldn't enjoy it 0% Not enough facilities close to where I live 9% Health isn't good enough 2% I might feel uncomfortable or out of place 0% Lack of transport/ I can't easily get to it 0% Poor access to venues (e.g. no disabled ramps) 0% Not enough information on what is available 0% Didn't enjoy it last time 2% It's difficult to find the time 0% I would feel unsafe going to/ from the activity/ event 0% I would feel unsafe at the activity/ event 0% Other Q20 Please tell me to what extent you agree or disagree with the following statements? Strongly agree Tend to agree Neither agree
nor disagree Tend to disagree
Strongly disagree
No opinion
I can influence decisions affecting my local area
0% 34% 27% 26% 4% 10%
People in my community can influence decisions affecting my local area
0% 38% 25% 23% 4% 11%
Q21 First of all could you tell me whether you are registered with.... a GP or health centre? 99% Yes 0% No 0% Don't know Q21 First of all could you tell me whether you are registered with.... a dentist? 98% Yes 2% No 0% Don't know Q22 How good is your health overall? 40% Very good 44% Good 11% Fair 4% Poor 0% Very poor 0% Don't know
Research Resource Dundee City Council 177
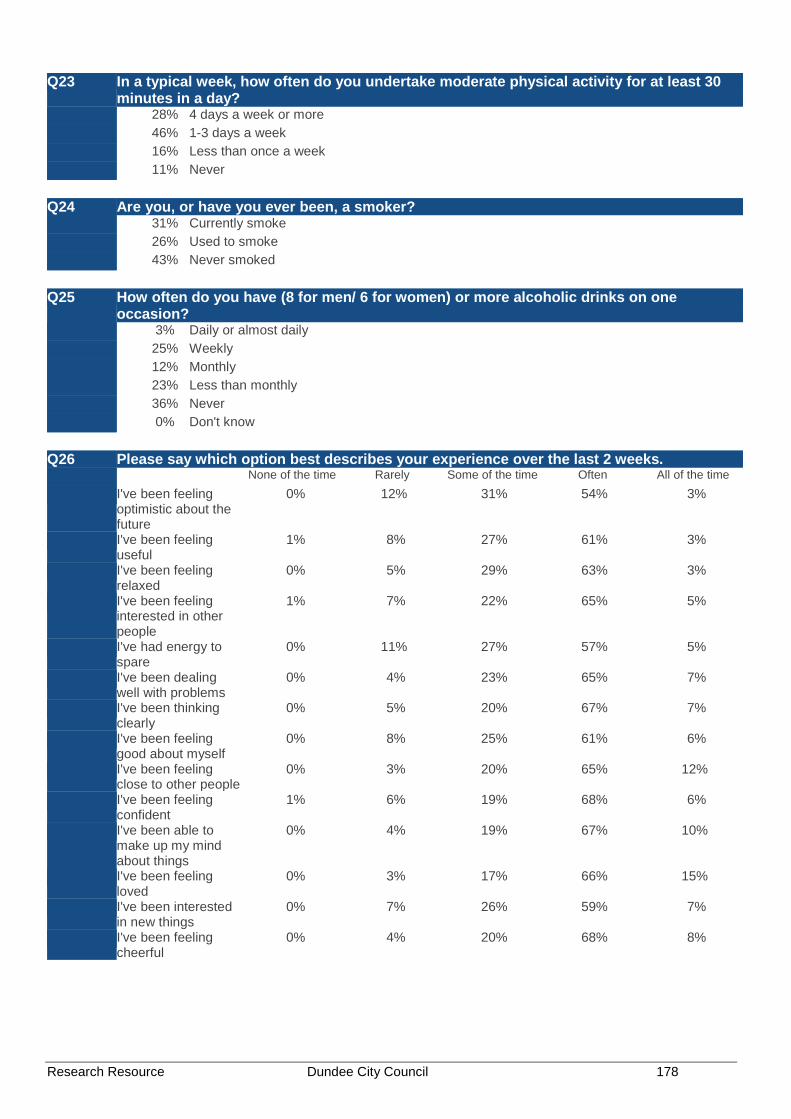
Q23 In a typical week, how often do you undertake moderate physical activity for at least 30 minutes in a day?
28% 4 days a week or more 46% 1-3 days a week 16% Less than once a week 11% Never Q24 Are you, or have you ever been, a smoker? 31% Currently smoke 26% Used to smoke 43% Never smoked Q25 How often do you have (8 for men/ 6 for women) or more alcoholic drinks on one
occasion? 3% Daily or almost daily 25% Weekly 12% Monthly 23% Less than monthly 36% Never 0% Don't know Q26 Please say which option best describes your experience over the last 2 weeks. None of the time Rarely Some of the time Often All of the time I've been feeling
optimistic about the future
0% 12% 31% 54% 3%
I've been feeling useful
1% 8% 27% 61% 3%
I've been feeling relaxed
0% 5% 29% 63% 3%
I've been feeling interested in other people
1% 7% 22% 65% 5%
I've had energy to spare
0% 11% 27% 57% 5%
I've been dealing well with problems
0% 4% 23% 65% 7%
I've been thinking clearly
0% 5% 20% 67% 7%
I've been feeling good about myself
0% 8% 25% 61% 6%
I've been feeling close to other people
0% 3% 20% 65% 12%
I've been feeling confident
1% 6% 19% 68% 6%
I've been able to make up my mind about things
0% 4% 19% 67% 10%
I've been feeling loved
0% 3% 17% 66% 15%
I've been interested in new things
0% 7% 26% 59% 7%
I've been feeling cheerful
0% 4% 20% 68% 8%
Research Resource Dundee City Council 178

Q27 On a scale of 1 to 6 where 1 is not at all and 6 is a great deal, to what extent do you feel that people treat you unfairly?
71% 1 - Not at all 19% 2 5% 3 2% 4 1% 5 1% 6 - A great deal 0% Don't know Q28 To what extent do you agree with the statement "I could turn to friends/ relatives in this
neighbourhood for support? 43% Strongly agree 46% Tend to agree 2% Tend to disagree 7% Strongly disagree 2% Don't know Q29 Are you currently taking part in any of these forms of education/ classes of training? 97% None 2% On the job training 0% An FE college course 0% A university based course 0% Distance learning/ Open University 0% School 0% Adult education or evening class 0% Help with reading, writing or use of numbers 0% Other Q30 What type of qualification, if any, will this lead to. Would it lead to... 0% No qualification 11% A qualification at degree level or above 89% Another qualification Q31 Taking everything into account how safe do you feel your neighbourhood is as a place to
live? 61% Very safe 36% Fairly safe 2% A bit unsafe 1% Very unsafe 1% Don't know Q32 How safe do you feel when... Very safe Fairly safe A bit unsafe Very unsafe Don't know Alone in your home
during the day 80% 19% 1% 0% 0%
Alone in your home at night
78% 20% 2% 0% 0%
Walking alone in your neighbourhood during the day
69% 29% 1% 0% 0%
Walking alone in your neighbourhood after dark
32% 43% 11% 2% 12%
Research Resource Dundee City Council 179

Q33 Do you think that the amount of crime in your neighbourhood has increased or decreased
over the past year? 1% Decreased a lot 4% Decreased a little 64% Remained the same 4% Increased a little 1% Increased a lot 26% Don't know Q34 If you feel crime has increased in your neighbourhood, what has influenced your option? 23% Personal experience of crime 13% Experience of family or friends 89% Talking to people in the area 18% Media - television, radio, paper 0% Social media internet sites e.g. Facebook, Twitter 0% Internet sites 0% Police or Council publications 0% Other Q35 What, in your opinion, is the main factor which contributes most to the level of crime in
your neighbourhood? 4% Boredom/ nothing to do/ lack of facilities 23% Don't know 0% Driving offences/ speeding/ motorbikes 0% Immigrants 43% Alcohol/ Drugs 0% Nothing 4% Lack of money/ poverty 6% Unemployment 0% Prostitution 2% New people/ undesirables moving into area/ not knowing who your neighbours are 0% Anti social behaviour 0% Crime e.g. Break ins/ burglary/ vandalism 21% This is a good area/ neighbourhood/ quiet/ no trouble 1% Lack of discipline/ parental control 2% Opportunists/ some people can't help themselves 1% Lack of policing/ wardens 1% Other 2% Gangs/ youths Q36 To what extent, if it all, does a fear of crime prevent you from taking part in your every day
activities? 88% Not at all 9% A little 2% Quite a lot 0% A great deal 0% Don't know
Research Resource Dundee City Council 180

Q37 Which of these accounts, if any, do you or your partner have? 98% Bank account 13% Building society account 0% Credit union account 4% Post Office card account 0% No, none of these 1% Prefer not to say Q38 Do you have insurance for the contents of your house such as for furniture, electrical
goods etc? 86% Yes 13% No 0% Prefer not to say 1% Don't know Q39 Think about the total value of any savings or investments you have, at the moment do
you (or your partner) have total savings or investments worth £1,000 or more in any combination of the places mentioned on this card, do you have less than £1,000 in savings or investments or do you have no savings or investments at all?
27% No savings 2% Less than £1,000 15% £1,000 or more 1% Don't know 54% Prefer not to say Q40 Are you currently experiencing, or within the last year have you had any difficulties with
the following? 0% Mortgage or rent payments 1% Changes to benefits 7% Council tax payments 7% Loan or credit card payments 9% Cost of food 25% Cost of domestic energy bills 2% Vehicle fuel prices 72% None of the above 3% Prefer not to say Q41 Taking everything together, which of these phrases on this card best describes how you
and your household are managing financially these days? 6% Manage very well 46% Manage quite well 39% Get by all right 9% Don't manage very well 0% Have some deep financial difficulties 0% Are in deep financial trouble 0% Refused 1% Don't know
Research Resource Dundee City Council 181

Q42 When you last contacted Dundee City Council, was this contact to ...? 5% Make a complaint 13% Seek information 43% Request a service 0% Make a suggestion 39% Have never contacted with Council Q43 Overall, how satisfied were you that the Council responded reasonably to your
complaint? 0% Very satisfied 64% Satisfied 0% Neither satisfied nor dissatisfied 36% Dissatisfied 0% Very dissatisfied Q44 Overall, how satisfied were you with this contact to seek information? 31% Very satisfied 62% Satisfied 5% Neither satisfied nor dissatisfied 2% Dissatisfied 0% Very dissatisfied Q45 Overall, how satisfied were you with this contact to request a service? 45% Very satisfied 52% Satisfied 2% Neither satisfied nor dissatisfied 1% Dissatisfied 0% Very dissatisfied Q46 On your most recent contact with the Council, did you.... 90% Get what you need at that contact 10% Have to contact the Council again about the same issue Q47 Was your most recent contact .... 1% By a letter 87% By a telephone call to the Council 8% By a personal visit to a Council office 4% By e-mail 1% By visiting the Council's website
Research Resource Dundee City Council 182

Q48 How satisfied or dissatisfied were you with your recent contact with the Council by telephone in terms of the following?
Very satisfied Fairly satisfied Neither nor Fairly dissatisfied
Very dissatisfied
Don't know
How easy it was for you to find the right number to call
39% 57% 3% 1% 0% 0%
How quickly the phone was answered
39% 57% 3% 1% 0% 0%
How easy it was to get through to someone who could help
39% 56% 3% 1% 0% 0%
Overall helpfulness/ friendliness/ courtesy of the staff you dealt with
40% 57% 2% 1% 0% 0%
How well the staff understood what you wanted
40% 57% 2% 1% 0% 0%
The outcome of your contact
42% 51% 3% 1% 2% 1%
Q49 How satisfied or dissatisfied were you with your recent contact when visiting a Council
office in terms of the following? Very satisfied Fairly satisfied Neither nor Fairly
dissatisfied Very
dissatisfied Don't know
How easy it was to get to the office
8% 92% 0% 0% 0% 0%
The suitability of the office e.g. waiting areas, privacy, access for disabled people etc
8% 92% 0% 0% 0% 0%
Overall helpfulness/ friendliness/ courtesy of the staff you dealt with
8% 85% 7% 0% 0% 0%
How well the staff understood what you wanted
8% 85% 0% 7% 0% 0%
The outcome of your contact
22% 43% 7% 14% 7% 7%
Q50 How satisfied or dissatisfied were you with your most recent cpntact with the Council by
email/ letter in terms of the following? Very satisfied Fairly satisfied Neither nor Fairly
dissatisfied Very
dissatisfied Don't know
How quickly you received a reply to your email/ letter
37% 63% 0% 0% 0% 0%
The extent to which the first reply you received answered your query
37% 50% 0% 13% 0% 0%
The outcome of your contact
37% 37% 0% 26% 0% 0%
Research Resource Dundee City Council 183

Q51 Have you ever used the Council's website? 45% Yes 55% No Q52 How satisfied or dissatisfied would you say you are with the website in terms of the
following? Very
satisfied Fairly
satisfied Neither nor Fairly
dissatisfied Very
dissatisfied Don't know Not
applicable How easily you
managed to find the information you wanted
27% 71% 1% 1% 0% 0% 0%
The amount of information provided on the website
27% 71% 1% 1% 0% 0% 0%
Q53 Generally, do you feel that you receive enough information about the Council and the
services it provides? 90% Yes 10% No Q54 Do you access, and use, the internet in any of the following ways... 76% Internet access at home 46% Internet access via a mobile phone 16% Internet access at work 0% Internet access through public access e.g. at library 2% Access the internet in some other way 22% None of these - I do not access the internet Q55 Do you know that the Council have procedures in place to respond to situations where
vulnerable adults might be at risk of harm? 34% Yes 66% No Q55 Would you know who to contact if you had concerns that a vulnerable adult was at risk of
being abused? 71% Yes 29% No Q56 I am going to read out a list of statements about your local Council and would like you to
tell me which 3 are of the most importance to you. Dundee City Council/ Angus Council... 33% Offering a good range of services 46% Providing an efficient service 57% Providing services which are value for money 31% Providing good quality services 21% Having friendly, polite, helpful, well informed employees 7% Promoting its services well 57% Tackling important issues for the future of the area 17% Listening to complaints 9% Communicating well with the public 21% Ensuring sustainable use of resources and care for the environment 0% Don't know
Research Resource Dundee City Council 184

Q57 I am going to read out the same list of statements again about your local Council. I would like you to tell me whether you agree or disagree with each of these statements. Dundee City Council/ Angus Council....
Agree Neither nor Disagree Don't know Offers a good range
of services 57% 40% 3% 0%
Provides an efficient service
58% 38% 3% 0%
Provides services which are value for money
54% 34% 12% 0%
Provides good quality services
62% 34% 5% 0%
Has friendly, polite, helpful, well informed employees
54% 37% 9% 0%
Promotes its services well
59% 38% 3% 0%
Tackles important issues for the future of the area
54% 34% 12% 0%
Listens to complaints 51% 43% 6% 0% Communicates well
with the public 58% 35% 7% 0%
Ensures sustainable use of resources and care for the environment
56% 36% 9% 0%
Q58 Could I just check how many adults, aged 16 or over, are there in the household including
you? And how many children? 33% 1 57% 2 8% 3 1% 4 0% 5 Q58 Could I just check how many adults, aged 16 or over, are there in the household including
you? And how many children? 75% 0 14% 1 7% 2 2% 3 0% 4 1% 5+ Q59 How many children are there in the household in each group? 0 1 2 3 4 5+ Less than 3 years 60% 35% 5% 0% 0% 0% 3-5years 63% 29% 8% 0% 0% 0% 6-15 years 47% 38% 12% 1% 0% 1% Q60 Gender of respondent: 45% Male 55% Female
Research Resource Dundee City Council 185

Q60 Age of respondent: 7% 16-24 23% 25-34 14% 35-44 15% 45-54 12% 55-59 7% 60-64 17% 65-74 6% 75+ 0% Refused HHCOMP HOUSEHOLD COMPOSITION 16% Single adult under 60 12% Single adult 60+ 20% Two adults under 60 15% Two adults aged 60+ 4% Two adults at least one over 60 6% Single adult with at least one child 18% Two adults and at least one child 9% Three or more adults with no children 1% Other Q61 How many motor vehicles does your household have access to for personal use? (this
includes motorbikes, mopeds, cars, vans etc) 47% 1 14% 2 2% 3 0% 4 or more 37% None Q62 Do you or any member of your household have a disability? 18% Yes 82% No Q63 What is the nature of the disability? 7% Mental health condition 76% Mobility/ physical disabilities 2% Learning difficulties (e.g. dyslexia) 2% Difficulties with sight 0% Learning disability (e.g. Downs Syndrome) 0% Developmental disorder (e.g. Autistic Spectrum Disorder or Asperger's syndrome) 2% Difficulties with hearing 16% Other condition (please write in) 0% Don't know 0% Refused
Research Resource Dundee City Council 186
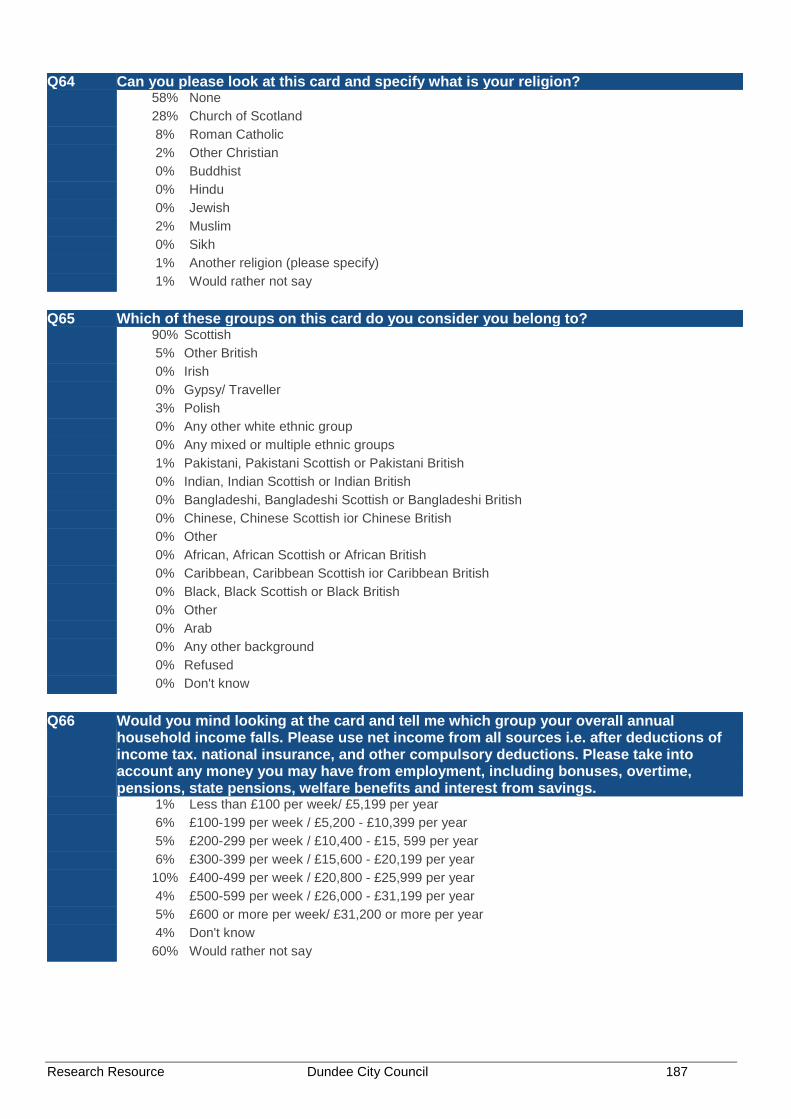
Q64 Can you please look at this card and specify what is your religion? 58% None 28% Church of Scotland 8% Roman Catholic 2% Other Christian 0% Buddhist 0% Hindu 0% Jewish 2% Muslim 0% Sikh 1% Another religion (please specify) 1% Would rather not say Q65 Which of these groups on this card do you consider you belong to? 90% Scottish 5% Other British 0% Irish 0% Gypsy/ Traveller 3% Polish 0% Any other white ethnic group 0% Any mixed or multiple ethnic groups 1% Pakistani, Pakistani Scottish or Pakistani British 0% Indian, Indian Scottish or Indian British 0% Bangladeshi, Bangladeshi Scottish or Bangladeshi British 0% Chinese, Chinese Scottish ior Chinese British 0% Other 0% African, African Scottish or African British 0% Caribbean, Caribbean Scottish ior Caribbean British 0% Black, Black Scottish or Black British 0% Other 0% Arab 0% Any other background 0% Refused 0% Don't know Q66 Would you mind looking at the card and tell me which group your overall annual
household income falls. Please use net income from all sources i.e. after deductions of income tax. national insurance, and other compulsory deductions. Please take into account any money you may have from employment, including bonuses, overtime, pensions, state pensions, welfare benefits and interest from savings.
1% Less than £100 per week/ £5,199 per year 6% £100-199 per week / £5,200 - £10,399 per year 5% £200-299 per week / £10,400 - £15, 599 per year 6% £300-399 per week / £15,600 - £20,199 per year 10% £400-499 per week / £20,800 - £25,999 per year 4% £500-599 per week / £26,000 - £31,199 per year 5% £600 or more per week/ £31,200 or more per year 4% Don't know 60% Would rather not say
Research Resource Dundee City Council 187
North East
CITIZENS' SURVEY 2015 SQ1 Community Regeneration area: 0% Ardler, St Mary's and Kirkton 1% Beechwood, Lochee, Menziehill and Charleston 0% Coldside and Maryfield 49% Fintry, Whitfield and Mill O Mains 0% Mid Craigie, Linlathen and Douglas 50% None SQ2 Ward 0% West End 0% Maryfield 0% The Ferry 0% Coldside 0% Lochee 0% East End 100% North East 0% Strathmartine
Research Resource Dundee City Council 188

Q1 What do you like best about living in this neighbourhood? 0% Close to beach/ coast 1% Quality of housing 9% Close to shops/ quality of shops/ amenities 4% Always lived here/ familiar with/ know area 19% Pleasant/ nice area 35% Friendly people/ neighbours/ family and friends 52% Quiet/ peaceful 12% Convenient location 2% Central location 4% Other 0% None/ nothing 3% Don't know 2% Lots for kids to do 4% Lots of green/ open spaces/ countryside/ nice views 7% Safe 3% Good public transport 0% Everything 11% It's ok/ fine/ I like it here/ no problems Q2 What do you like least about living in this neighbourhood? 2% Littering/ dirty/ dog fouling 1% Difficult/ poor parking 3% Drug problems 2% Lack of facilities for youths/ children 3% ASB/ neighbours/ noisy 1% Youths/ gangs causing trouble 3% Poor shops 1% Vandalism 3% Other 73% None/ nothing 0% Lack of security 8% Don't know 1% Speeding cars/ traffic 1% Lack of transport/ poor public transport 0% Area going downhill/ untidy/ rundown 1% Roads/ pavements/ winter gritting/ snow clearing 0% Bin uplifts/ refuse collection 1% Too many private lets/ undesirables moving into the area 0% Too many stairs/ hills 1% Not much for people to do in general Q3 How long have you lived in this neighbourhood? 5% Up to one year 10% 1-2 years 18% 3-5 years 19% 6-10 years 35% Over 10 years 13% Always lived there 0% Don't know
Research Resource Dundee City Council 189

Q4 Could you please tell me if you think this neighbourhood has changed over the past 5 years, or since you've been living here if it's less than 5 years?
8% Yes - has got better 3% Yes - has got worse 69% No change 20% Don't know Q5better In what ways do you think it has changed? (GOT BETTER) 8% Access to parks/ open spaces 8% Better facilities/ amenities 0% Less vandalism 20% Housing improvements - new houses 0% Improved schools 4% Cleaner/ tidier/ less litter 0% Improved shops 8% Fewer drug problems 8% Friendliness of people/ neighbours 36% Quieter/ more peaceful 16% Other 4% Not sure 4% Less people hanging around street 0% Less crime 0% More young families in the area Q5worse Q5 In what ways do you think it has changed? (GOT WORSE) 0% Lack of parks/ open spaces 0% Overgrown gardens/ uncut grass 11% Poorer shops 0% More vandalism 22% Undesirable people moving in 11% Lack of facilities for youths/ children 0% ASB/ neighbours/ noisy 0% People/ neighbours less friendly 22% Youths/ gangs causing problems 34% Drug/ alcohol problems 11% Other 0% Not sure 0% More crime 0% People don't care about area 11% Too many private lets 0% Litter problems/ area is dirty 0% Area is rundown/ going downhill 0% More houses being built 0% Parking 0% Condition of roads/ pavements 0% More traffic/ motorbikes/ roads unsafe
Research Resource Dundee City Council 190

Q6 Thinking now about the neighbourhood you live in, how would you rate it as a place to live?
79% Very good 20% Fairly good 1% Fairly poor 0% Very poor 0% No opinion Q7 How long have you lived in this house/ flat? 5% Up to one year 11% 1-2 years 21% 3-5 years 19% 6-10 years 37% Over 10 years 7% Always lived here 0% Don't know Q8 Please tell me which of the descriptions on this card best describes your house/ flat? 13% Rented from the Council 29% Rented from a housing association 7% Rented from a private landlord 34% Owned by you (not ex Council) 17% Owned by you (ex Council) 0% Other (please specify) Q9 Overall, how do you rate the general condition of this (your) house/ flat? 81% Very good 18% Fairly good 0% Average 0% Fairly poor 0% Very poor 0% Don't know
Research Resource Dundee City Council 191

Q10 Looking at this card, please state how satisfied or dissatisfied you are with the following services and facilities in your local area?
Very Satisfied Fairly Satisfied Fairly Dissatisfied Very Dissatisfied Doesn't exist/ never used
Local Health services
83% 16% 0% 0% 0%
Police service 74% 19% 0% 0% 7% Fire service 72% 19% 0% 0% 9% Refuse collection 82% 17% 0% 0% 1% Local Schools 68% 12% 0% 0% 19% Social care/ social
work services 13% 7% 0% 0% 79%
Social housing 40% 24% 1% 0% 36% Employment and
advice services 19% 17% 1% 0% 64%
Public transport 72% 19% 2% 1% 7% Street cleaning 61% 38% 1% 0% 1% Sports and leisure
facilities 65% 18% 2% 1% 14%
Community centre/ library
68% 22% 0% 0% 9%
Parks and open spaces
88% 9% 2% 0% 1%
Local phone boxes 24% 5% 1% 1% 70% Local youth facilities 22% 22% 5% 2% 48% Local shops 70% 17% 10% 2% 0% Community Warden
Service 21% 21% 1% 0% 57%
Access to free cash machine/ auto teller
71% 24% 3% 0% 2%
Research Resource Dundee City Council 192

Q11 And, looking at this card, how easy is it for you to access those services and facilities in your local area?
Very easy Fairly easy Fairly difficult Very difficult Doesn't exist/ never used
Local Health services
64% 36% 1% 0% 0%
Police service 67% 31% 0% 0% 1% Fire service 68% 30% 0% 0% 1% Refuse collection 72% 28% 0% 0% 0% Local Schools 53% 23% 0% 0% 24% Social care/ social
work services 24% 6% 0% 0% 70%
Social housing 45% 14% 0% 0% 41% Employment and
advice services 35% 6% 0% 0% 59%
Public transport 68% 29% 0% 0% 3% Street cleaning 60% 38% 0% 0% 1% Sports and leisure
facilities 57% 25% 2% 1% 15%
Community centre/ library
71% 25% 0% 0% 4%
Parks and open spaces
79% 18% 1% 0% 1%
Local phone boxes 32% 8% 2% 3% 56% Local youth facilities 27% 16% 2% 1% 54% Local shops 69% 26% 1% 0% 3% Community Warden
Service 24% 21% 1% 1% 53%
Access to free cash machine/ auto teller
67% 28% 2% 0% 3%
Q12 Looking at this card, how satisfied are you with the following in this neighbourhood? Very satisfied Fairly satisfied Fairly dissatisfied Very dissatisfied Don't know Children's Play areas 28% 44% 5% 2% 21% Cleanliness of
Streets 41% 58% 2% 0% 0%
Shopping Facilities 63% 26% 10% 2% 0% Condition of roads,
pavements and street lighting
33% 52% 15% 0% 0%
Quality and maintenance of open spaces
57% 43% 0% 0% 0%
Cleanliness of the area around your home
54% 45% 1% 0% 0%
The built environment (e.g. buildings, heritage etc)
63% 37% 0% 0% 0%
The natural environment (e.g. parks, open spaces, countryside etc)
70% 29% 1% 0% 0%
Research Resource Dundee City Council 193

Q13 Overall, how satisfied are you with the quality of life in this neighbourhood? 77% Very satisfied 22% Satisfied 0% Dissatisfied 0% Very dissatisfied Q14 Overall, how satisfied are you with the quality of life in Dundee? 83% Very satisfied 17% Satisfied 0% Dissatisfied 0% Very dissatisfied Q15 Can you tell me firstly, if you are aware of any of these in this area? 49% After school/ children's club 9% Youth clubs/ projects or drop-in centres 20% Voluntary Youth Organisations 3% Youth Information Services 4% Other Youthwork activities 57% Organised Sporting activities/ classes/ clubs 40% Organised Social/ Leisure activities/ classes/ clubs 19% Learning groups or adult education classes 8% Self-help or social care groups 21% Community Festivals/ Events e.g. Gala Day 16% Community Council or Neighbourhood Group 5% Community Regeneration Forum or Group 6% Local Consultation Activities or Events 23% None
Research Resource Dundee City Council 194

Q15 And then, if you are aware, how often do you, or anyone living in your home, take part in activities like these?
Daily Weekly Monthly Seldom Never After school/
children's clubs 0% 18% 0% 11% 71%
Youth clubs/ projects or drop-in centres
0% 15% 0% 0% 85%
Voluntary Youth Organisations
0% 19% 0% 0% 81%
Youth Information Services
0% 11% 0% 0% 89%
Other Youthwork activities
0% 36% 0% 9% 55%
Organised Sporting activities/ classes/ clubs
0% 53% 1% 8% 38%
Organised Social/ Leisure activities/ classes/ clubs
0% 40% 1% 10% 50%
Learning groups or adult education classes
0% 2% 0% 2% 97%
Self-help or social care groups
0% 0% 0% 0% 100%
Community Festivals/ Events e.g. Gala Day
0% 0% 2% 80% 19%
Community Council or Neighbourhood Group
0% 2% 0% 2% 96%
Community Regeneration Forum or Group
0% 0% 0% 0% 100%
Local Consultation Activities or Events
0% 0% 0% 23% 77%
Q16 Q16 Thinking back over the last 12 months, have you given up any time to help any clubs,
charities, campaigns or organisations. I mean in an unpaid capacity. 8% Yes 92% No
Research Resource Dundee City Council 195

Q17 Looking at this showcard, can you tell me if you have undertaken any work or given unpaid help to any of these types of groups or organisations at any time in the past 12 months?
0% Children's group - e.g. playgroup, mothers and toddlers 1% School children e.g. school trips, sports days, discos, in the classroom 0% Youth groups/ children's activities outside of school 0% Coaching or organising sport or exercise 1% Church, religion or faith-based group 0% The elderly 0% Health disability or social welfare group or organisation 0% Local community group/ neighbourhood association/ community council 0% Tenants group/ residents association 0% Trade union activities 0% Public service - e.g. school, hospital, police, local government service 0% Professional society 0% Safety/ first aid 0% The environment/ animals 0% Justice/ human rights 0% Hobbies/ recreation/ arts/ social club 0% Citizens groups 0% Domestic animal welfare 0% Wildlife protection 0% Environmental protection 98% None Q18 In the last 12 months have you been to any of these events or places in Dundee? 57% Cinema 1% Exhibition including art, photography or crafts 1% Book festival or reading group 18% Theatre e.g. pantomime, musical or play 2% Street arts (art in everyday surroundings like streets, parks or shopping centre) 1% Culturally specific festival e.g. mela/ Feis/ local Gala days 0% Classical music performance or opera 24% Live music event e.g. traditional music, rock concert, jazz event 3% Dance show/ event e.g. ballet 19% Museum 2% Historical place e.g. castle, stately home and grounds, battle or archaeology site 7% Gallery 45% Library, including mobile or online 0% Archive or records office 19% None
Research Resource Dundee City Council 196

Q19 If you have not taken part in any community activities or organisations, can you tell me why this is?
0% It costs too much 0% I don't know enough about it 22% Never occurred to me 51% Not really interested 4% I don't have anyone to go with 0% I wouldn't enjoy it 0% Not enough facilities close to where I live 11% Health isn't good enough 0% I might feel uncomfortable or out of place 0% Lack of transport/ I can't easily get to it 0% Poor access to venues (e.g. no disabled ramps) 0% Not enough information on what is available 0% Didn't enjoy it last time 27% It's difficult to find the time 0% I would feel unsafe going to/ from the activity/ event 0% I would feel unsafe at the activity/ event 0% Other Q20 Please tell me to what extent you agree or disagree with the following statements? Strongly agree Tend to agree Neither agree
nor disagree Tend to disagree
Strongly disagree
No opinion
I can influence decisions affecting my local area
2% 27% 20% 33% 3% 16%
People in my community can influence decisions affecting my local area
2% 32% 20% 26% 1% 19%
Q21 First of all could you tell me whether you are registered with.... a GP or health centre? 99% Yes 1% No 0% Don't know Q21 First of all could you tell me whether you are registered with.... a dentist? 95% Yes 4% No 1% Don't know Q22 How good is your health overall? 58% Very good 29% Good 10% Fair 3% Poor 0% Very poor 0% Don't know
Research Resource Dundee City Council 197

Q23 In a typical week, how often do you undertake moderate physical activity for at least 30 minutes in a day?
19% 4 days a week or more 58% 1-3 days a week 14% Less than once a week 9% Never Q24 Are you, or have you ever been, a smoker? 26% Currently smoke 25% Used to smoke 49% Never smoked Q25 How often do you have (8 for men/ 6 for women) or more alcoholic drinks on one
occasion? 0% Daily or almost daily 18% Weekly 9% Monthly 26% Less than monthly 47% Never 0% Don't know Q26 Please say which option best describes your experience over the last 2 weeks. None of the time Rarely Some of the time Often All of the time I've been feeling
optimistic about the future
1% 3% 33% 55% 9%
I've been feeling useful
0% 1% 32% 63% 5%
I've been feeling relaxed
0% 0% 38% 59% 2%
I've been feeling interested in other people
0% 2% 36% 59% 3%
I've had energy to spare
0% 3% 41% 53% 3%
I've been dealing well with problems
0% 0% 13% 64% 23%
I've been thinking clearly
0% 0% 11% 68% 21%
I've been feeling good about myself
0% 1% 18% 67% 14%
I've been feeling close to other people
0% 0% 10% 65% 25%
I've been feeling confident
0% 0% 9% 70% 20%
I've been able to make up my mind about things
0% 0% 8% 64% 28%
I've been feeling loved
0% 0% 10% 64% 26%
I've been interested in new things
0% 2% 25% 66% 6%
I've been feeling cheerful
0% 0% 14% 78% 7%
Research Resource Dundee City Council 198

Q27 On a scale of 1 to 6 where 1 is not at all and 6 is a great deal, to what extent do you feel that people treat you unfairly?
81% 1 - Not at all 17% 2 1% 3 0% 4 0% 5 0% 6 - A great deal 1% Don't know Q28 To what extent do you agree with the statement "I could turn to friends/ relatives in this
neighbourhood for support? 62% Strongly agree 31% Tend to agree 1% Tend to disagree 0% Strongly disagree 5% Don't know Q29 Are you currently taking part in any of these forms of education/ classes of training? 96% None 1% On the job training 1% An FE college course 0% A university based course 0% Distance learning/ Open University 1% School 0% Adult education or evening class 0% Help with reading, writing or use of numbers 0% Other Q30 What type of qualification, if any, will this lead to. Would it lead to... 0% No qualification 9% A qualification at degree level or above 91% Another qualification Q31 Taking everything into account how safe do you feel your neighbourhood is as a place to
live? 95% Very safe 5% Fairly safe 0% A bit unsafe 0% Very unsafe 0% Don't know Q32 How safe do you feel when... Very safe Fairly safe A bit unsafe Very unsafe Don't know Alone in your home
during the day 97% 3% 0% 0% 0%
Alone in your home at night
97% 3% 0% 0% 0%
Walking alone in your neighbourhood during the day
97% 3% 0% 0% 0%
Walking alone in your neighbourhood after dark
63% 28% 4% 1% 5%
Research Resource Dundee City Council 199

Q33 Do you think that the amount of crime in your neighbourhood has increased or decreased
over the past year? 0% Decreased a lot 6% Decreased a little 76% Remained the same 3% Increased a little 0% Increased a lot 16% Don't know Q34 If you feel crime has increased in your neighbourhood, what has influenced your option? 0% Personal experience of crime 10% Experience of family or friends 100% Talking to people in the area 10% Media - television, radio, paper 30% Social media internet sites e.g. Facebook, Twitter 10% Internet sites 0% Police or Council publications 0% Other Q35 What, in your opinion, is the main factor which contributes most to the level of crime in
your neighbourhood? 3% Boredom/ nothing to do/ lack of facilities 49% Don't know 0% Driving offences/ speeding/ motorbikes 0% Immigrants 27% Alcohol/ Drugs 4% Nothing 0% Lack of money/ poverty 1% Unemployment 0% Prostitution 0% New people/ undesirables moving into area/ not knowing who your neighbours are 0% Anti social behaviour 2% Crime e.g. Break ins/ burglary/ vandalism 13% This is a good area/ neighbourhood/ quiet/ no trouble 0% Lack of discipline/ parental control 0% Opportunists/ some people can't help themselves 0% Lack of policing/ wardens 0% Other 4% Gangs/ youths Q36 To what extent, if it all, does a fear of crime prevent you from taking part in your every day
activities? 98% Not at all 2% A little 0% Quite a lot 0% A great deal 0% Don't know
Research Resource Dundee City Council 200

Q37 Which of these accounts, if any, do you or your partner have? 98% Bank account 7% Building society account 4% Credit union account 0% Post Office card account 0% No, none of these 0% Prefer not to say Q38 Do you have insurance for the contents of your house such as for furniture, electrical
goods etc? 82% Yes 14% No 2% Prefer not to say 2% Don't know Q39 Think about the total value of any savings or investments you have, at the moment do
you (or your partner) have total savings or investments worth £1,000 or more in any combination of the places mentioned on this card, do you have less than £1,000 in savings or investments or do you have no savings or investments at all?
27% No savings 10% Less than £1,000 25% £1,000 or more 1% Don't know 38% Prefer not to say Q40 Are you currently experiencing, or within the last year have you had any difficulties with
the following? 1% Mortgage or rent payments 1% Changes to benefits 1% Council tax payments 0% Loan or credit card payments 2% Cost of food 13% Cost of domestic energy bills 1% Vehicle fuel prices 83% None of the above 2% Prefer not to say Q41 Taking everything together, which of these phrases on this card best describes how you
and your household are managing financially these days? 20% Manage very well 49% Manage quite well 30% Get by all right 0% Don't manage very well 0% Have some deep financial difficulties 0% Are in deep financial trouble 0% Refused 0% Don't know
Research Resource Dundee City Council 201

Q42 When you last contacted Dundee City Council, was this contact to ...? 2% Make a complaint 5% Seek information 26% Request a service 1% Make a suggestion 65% Have never contacted with Council Q43 Overall, how satisfied were you that the Council responded reasonably to your
complaint? 51% Very satisfied 32% Satisfied 17% Neither satisfied nor dissatisfied 0% Dissatisfied 0% Very dissatisfied Q44 Overall, how satisfied were you with this contact to seek information? 62% Very satisfied 38% Satisfied 0% Neither satisfied nor dissatisfied 0% Dissatisfied 0% Very dissatisfied Q45 Overall, how satisfied were you with this contact to request a service? 88% Very satisfied 11% Satisfied 1% Neither satisfied nor dissatisfied 0% Dissatisfied 0% Very dissatisfied Q46 On your most recent contact with the Council, did you.... 96% Get what you need at that contact 4% Have to contact the Council again about the same issue Q47 Was your most recent contact .... 0% By a letter 90% By a telephone call to the Council 3% By a personal visit to a Council office 2% By e-mail 6% By visiting the Council's website
Research Resource Dundee City Council 202

Q48 How satisfied or dissatisfied were you with your recent contact with the Council by telephone in terms of the following?
Very satisfied Fairly satisfied Neither nor Fairly dissatisfied
Very dissatisfied
Don't know
How easy it was for you to find the right number to call
91% 9% 0% 0% 0% 0%
How quickly the phone was answered
89% 11% 0% 0% 0% 0%
How easy it was to get through to someone who could help
85% 15% 0% 0% 0% 0%
Overall helpfulness/ friendliness/ courtesy of the staff you dealt with
86% 14% 0% 0% 0% 0%
How well the staff understood what you wanted
87% 13% 0% 0% 0% 0%
The outcome of your contact
86% 11% 2% 1% 0% 0%
Q49 How satisfied or dissatisfied were you with your recent contact when visiting a Council
office in terms of the following? Very satisfied Fairly satisfied Neither nor Fairly
dissatisfied Very
dissatisfied Don't know
How easy it was to get to the office
100% 0% 0% 0% 0% 0%
The suitability of the office e.g. waiting areas, privacy, access for disabled people etc
100% 0% 0% 0% 0% 0%
Overall helpfulness/ friendliness/ courtesy of the staff you dealt with
100% 0% 0% 0% 0% 0%
How well the staff understood what you wanted
100% 0% 0% 0% 0% 0%
The outcome of your contact
67% 33% 0% 0% 0% 0%
Q50 How satisfied or dissatisfied were you with your most recent cpntact with the Council by
email/ letter in terms of the following? Very satisfied Fairly satisfied Neither nor Fairly
dissatisfied Very
dissatisfied Don't know
How quickly you received a reply to your email/ letter
100% 0% 0% 0% 0% 0%
The extent to which the first reply you received answered your query
51% 49% 0% 0% 0% 0%
The outcome of your contact
51% 49% 0% 0% 0% 0%
Research Resource Dundee City Council 203

Q51 Have you ever used the Council's website? 50% Yes 50% No Q52 How satisfied or dissatisfied would you say you are with the website in terms of the
following? Very
satisfied Fairly
satisfied Neither nor Fairly
dissatisfied Very
dissatisfied Don't know Not
applicable How easily you
managed to find the information you wanted
48% 52% 0% 0% 0% 0% 0%
The amount of information provided on the website
49% 51% 0% 0% 0% 0% 0%
Q53 Generally, do you feel that you receive enough information about the Council and the
services it provides? 88% Yes 12% No Q54 Do you access, and use, the internet in any of the following ways... 77% Internet access at home 45% Internet access via a mobile phone 19% Internet access at work 3% Internet access through public access e.g. at library 5% Access the internet in some other way 12% None of these - I do not access the internet Q55 Do you know that the Council have procedures in place to respond to situations where
vulnerable adults might be at risk of harm? 37% Yes 63% No Q55 Would you know who to contact if you had concerns that a vulnerable adult was at risk of
being abused? 76% Yes 24% No Q56 I am going to read out a list of statements about your local Council and would like you to
tell me which 3 are of the most importance to you. Dundee City Council/ Angus Council... 40% Offering a good range of services 45% Providing an efficient service 46% Providing services which are value for money 38% Providing good quality services 23% Having friendly, polite, helpful, well informed employees 10% Promoting its services well 56% Tackling important issues for the future of the area 18% Listening to complaints 12% Communicating well with the public 10% Ensuring sustainable use of resources and care for the environment 0% Don't know
Research Resource Dundee City Council 204

Q57 I am going to read out the same list of statements again about your local Council. I would like you to tell me whether you agree or disagree with each of these statements. Dundee City Council/ Angus Council....
Agree Neither nor Disagree Don't know Offers a good range
of services 79% 20% 0% 0%
Provides an efficient service
75% 25% 0% 0%
Provides services which are value for money
64% 35% 1% 0%
Provides good quality services
76% 24% 0% 0%
Has friendly, polite, helpful, well informed employees
66% 34% 0% 0%
Promotes its services well
60% 38% 2% 0%
Tackles important issues for the future of the area
70% 29% 2% 0%
Listens to complaints 58% 41% 1% 0% Communicates well
with the public 65% 34% 1% 0%
Ensures sustainable use of resources and care for the environment
67% 31% 2% 0%
Q58 Could I just check how many adults, aged 16 or over, are there in the household including
you? And how many children? 21% 1 67% 2 10% 3 2% 4 0% 5 Q58 Could I just check how many adults, aged 16 or over, are there in the household including
you? And how many children? 61% 0 19% 1 17% 2 3% 3 0% 4 0% 5+ Q59 How many children are there in the household in each group? 0 1 2 3 4 5+ Less than 3 years 71% 26% 3% 0% 0% 0% 3-5years 53% 37% 10% 0% 0% 0% 6-15 years 49% 34% 15% 2% 0% 0% Q60 Gender of respondent: 47% Male 53% Female
Research Resource Dundee City Council 205

Q60 Age of respondent: 8% 16-24 24% 25-34 13% 35-44 17% 45-54 13% 55-59 10% 60-64 13% 65-74 2% 75+ 0% Refused HHCOMP HOUSEHOLD COMPOSITION 8% Single adult under 60 6% Single adult 60+ 18% Two adults under 60 15% Two adults aged 60+ 6% Two adults at least one over 60 6% Single adult with at least one child 28% Two adults and at least one child 7% Three or more adults with no children 5% Other Q61 How many motor vehicles does your household have access to for personal use? (this
includes motorbikes, mopeds, cars, vans etc) 54% 1 22% 2 2% 3 0% 4 or more 22% None Q62 Do you or any member of your household have a disability? 12% Yes 88% No Q63 What is the nature of the disability? 0% Mental health condition 81% Mobility/ physical disabilities 0% Learning difficulties (e.g. dyslexia) 0% Difficulties with sight 0% Learning disability (e.g. Downs Syndrome) 0% Developmental disorder (e.g. Autistic Spectrum Disorder or Asperger's syndrome) 8% Difficulties with hearing 19% Other condition (please write in) 0% Don't know 0% Refused
Research Resource Dundee City Council 206

Q64 Can you please look at this card and specify what is your religion? 56% None 26% Church of Scotland 15% Roman Catholic 2% Other Christian 0% Buddhist 0% Hindu 0% Jewish 0% Muslim 0% Sikh 0% Another religion (please specify) 1% Would rather not say Q65 Which of these groups on this card do you consider you belong to? 94% Scottish 1% Other British 0% Irish 0% Gypsy/ Traveller 4% Polish 0% Any other white ethnic group 0% Any mixed or multiple ethnic groups 0% Pakistani, Pakistani Scottish or Pakistani British 0% Indian, Indian Scottish or Indian British 0% Bangladeshi, Bangladeshi Scottish or Bangladeshi British 0% Chinese, Chinese Scottish ior Chinese British 0% Other 0% African, African Scottish or African British 0% Caribbean, Caribbean Scottish ior Caribbean British 0% Black, Black Scottish or Black British 0% Other 0% Arab 0% Any other background 0% Refused 0% Don't know Q66 Would you mind looking at the card and tell me which group your overall annual
household income falls. Please use net income from all sources i.e. after deductions of income tax. national insurance, and other compulsory deductions. Please take into account any money you may have from employment, including bonuses, overtime, pensions, state pensions, welfare benefits and interest from savings.
1% Less than £100 per week/ £5,199 per year 3% £100-199 per week / £5,200 - £10,399 per year 12% £200-299 per week / £10,400 - £15, 599 per year 9% £300-399 per week / £15,600 - £20,199 per year 11% £400-499 per week / £20,800 - £25,999 per year 9% £500-599 per week / £26,000 - £31,199 per year 10% £600 or more per week/ £31,200 or more per year 8% Don't know 38% Would rather not say
Research Resource Dundee City Council 207

Strathmartine
CITIZENS' SURVEY 2015 SQ1 Community Regeneration area: 65% Ardler, St Mary's and Kirkton 0% Beechwood, Lochee, Menziehill and Charleston 0% Coldside and Maryfield 0% Fintry, Whitfield and Mill O Mains 0% Mid Craigie, Linlathen and Douglas 35% None SQ2 Ward 0% West End 0% Maryfield 0% The Ferry 0% Coldside 0% Lochee 0% East End 0% North East 100% Strathmartine
Research Resource Dundee City Council 208

Q1 What do you like best about living in this neighbourhood? 0% Close to beach/ coast 0% Quality of housing 11% Close to shops/ quality of shops/ amenities 7% Always lived here/ familiar with/ know area 19% Pleasant/ nice area 33% Friendly people/ neighbours/ family and friends 56% Quiet/ peaceful 9% Convenient location 0% Central location 3% Other 1% None/ nothing 1% Don't know 0% Lots for kids to do 1% Lots of green/ open spaces/ countryside/ nice views 5% Safe 2% Good public transport 0% Everything 14% It's ok/ fine/ I like it here/ no problems Q2 What do you like least about living in this neighbourhood? 2% Littering/ dirty/ dog fouling 0% Difficult/ poor parking 4% Drug problems 2% Lack of facilities for youths/ children 2% ASB/ neighbours/ noisy 1% Youths/ gangs causing trouble 0% Poor shops 0% Vandalism 2% Other 77% None/ nothing 0% Lack of security 7% Don't know 3% Speeding cars/ traffic 0% Lack of transport/ poor public transport 2% Area going downhill/ untidy/ rundown 0% Roads/ pavements/ winter gritting/ snow clearing 0% Bin uplifts/ refuse collection 2% Too many private lets/ undesirables moving into the area 0% Too many stairs/ hills 0% Not much for people to do in general Q3 How long have you lived in this neighbourhood? 2% Up to one year 7% 1-2 years 15% 3-5 years 14% 6-10 years 47% Over 10 years 15% Always lived there 0% Don't know
Research Resource Dundee City Council 209

Q4 Could you please tell me if you think this neighbourhood has changed over the past 5 years, or since you've been living here if it's less than 5 years?
7% Yes - has got better 4% Yes - has got worse 74% No change 15% Don't know Q5better In what ways do you think it has changed? (GOT BETTER) 0% Access to parks/ open spaces 0% Better facilities/ amenities 0% Less vandalism 4% Housing improvements - new houses 0% Improved schools 22% Cleaner/ tidier/ less litter 0% Improved shops 9% Fewer drug problems 4% Friendliness of people/ neighbours 46% Quieter/ more peaceful 9% Other 0% Not sure 4% Less people hanging around street 14% Less crime 0% More young families in the area Q5worse Q5 In what ways do you think it has changed? (GOT WORSE) 0% Lack of parks/ open spaces 0% Overgrown gardens/ uncut grass 0% Poorer shops 0% More vandalism 16% Undesirable people moving in 0% Lack of facilities for youths/ children 0% ASB/ neighbours/ noisy 0% People/ neighbours less friendly 15% Youths/ gangs causing problems 54% Drug/ alcohol problems 8% Other 0% Not sure 8% More crime 0% People don't care about area 8% Too many private lets 23% Litter problems/ area is dirty 16% Area is rundown/ going downhill 0% More houses being built 0% Parking 0% Condition of roads/ pavements 31% More traffic/ motorbikes/ roads unsafe
Research Resource Dundee City Council 210

Q6 Thinking now about the neighbourhood you live in, how would you rate it as a place to live?
79% Very good 17% Fairly good 3% Fairly poor 0% Very poor 0% No opinion Q7 How long have you lived in this house/ flat? 3% Up to one year 8% 1-2 years 15% 3-5 years 14% 6-10 years 54% Over 10 years 6% Always lived here 0% Don't know Q8 Please tell me which of the descriptions on this card best describes your house/ flat? 17% Rented from the Council 13% Rented from a housing association 6% Rented from a private landlord 21% Owned by you (not ex Council) 43% Owned by you (ex Council) 0% Other (please specify) Q9 Overall, how do you rate the general condition of this (your) house/ flat? 80% Very good 20% Fairly good 0% Average 0% Fairly poor 0% Very poor 0% Don't know
Research Resource Dundee City Council 211

Q10 Looking at this card, please state how satisfied or dissatisfied you are with the following services and facilities in your local area?
Very Satisfied Fairly Satisfied Fairly Dissatisfied Very Dissatisfied Doesn't exist/ never used
Local Health services
81% 19% 0% 0% 0%
Police service 73% 16% 1% 0% 10% Fire service 72% 17% 0% 0% 11% Refuse collection 79% 19% 0% 0% 1% Local Schools 67% 16% 0% 0% 16% Social care/ social
work services 12% 13% 0% 0% 75%
Social housing 26% 29% 1% 1% 43% Employment and
advice services 14% 19% 2% 0% 66%
Public transport 70% 17% 3% 0% 10% Street cleaning 52% 45% 3% 1% 0% Sports and leisure
facilities 64% 21% 0% 0% 15%
Community centre/ library
72% 17% 0% 0% 12%
Parks and open spaces
85% 11% 3% 0% 2%
Local phone boxes 20% 8% 0% 0% 72% Local youth facilities 13% 29% 7% 0% 51% Local shops 82% 17% 1% 0% 0% Community Warden
Service 12% 25% 1% 0% 62%
Access to free cash machine/ auto teller
80% 18% 0% 0% 2%
Research Resource Dundee City Council 212

Q11 And, looking at this card, how easy is it for you to access those services and facilities in your local area?
Very easy Fairly easy Fairly difficult Very difficult Doesn't exist/ never used
Local Health services
60% 39% 1% 0% 0%
Police service 68% 31% 0% 0% 2% Fire service 68% 31% 0% 0% 2% Refuse collection 68% 31% 0% 0% 1% Local Schools 42% 31% 0% 0% 27% Social care/ social
work services 22% 7% 0% 0% 71%
Social housing 35% 17% 1% 1% 46% Employment and
advice services 27% 10% 0% 0% 63%
Public transport 60% 36% 0% 0% 4% Street cleaning 56% 42% 0% 0% 2% Sports and leisure
facilities 50% 31% 0% 0% 19%
Community centre/ library
61% 35% 0% 0% 4%
Parks and open spaces
60% 38% 0% 0% 1%
Local phone boxes 37% 7% 0% 1% 55% Local youth facilities 25% 14% 1% 0% 59% Local shops 75% 25% 0% 0% 0% Community Warden
Service 21% 16% 2% 0% 61%
Access to free cash machine/ auto teller
83% 15% 0% 0% 2%
Q12 Looking at this card, how satisfied are you with the following in this neighbourhood? Very satisfied Fairly satisfied Fairly dissatisfied Very dissatisfied Don't know Children's Play areas 23% 52% 7% 0% 18% Cleanliness of
Streets 42% 57% 1% 0% 0%
Shopping Facilities 72% 28% 0% 0% 0% Condition of roads,
pavements and street lighting
27% 51% 20% 1% 0%
Quality and maintenance of open spaces
53% 44% 3% 0% 0%
Cleanliness of the area around your home
56% 41% 2% 1% 0%
The built environment (e.g. buildings, heritage etc)
63% 37% 0% 0% 0%
The natural environment (e.g. parks, open spaces, countryside etc)
66% 32% 0% 2% 0%
Research Resource Dundee City Council 213

Q13 Overall, how satisfied are you with the quality of life in this neighbourhood? 82% Very satisfied 16% Satisfied 2% Dissatisfied 0% Very dissatisfied Q14 Overall, how satisfied are you with the quality of life in Dundee? 87% Very satisfied 13% Satisfied 0% Dissatisfied 0% Very dissatisfied Q15 Can you tell me firstly, if you are aware of any of these in this area? 47% After school/ children's club 9% Youth clubs/ projects or drop-in centres 24% Voluntary Youth Organisations 3% Youth Information Services 5% Other Youthwork activities 57% Organised Sporting activities/ classes/ clubs 48% Organised Social/ Leisure activities/ classes/ clubs 11% Learning groups or adult education classes 5% Self-help or social care groups 35% Community Festivals/ Events e.g. Gala Day 17% Community Council or Neighbourhood Group 10% Community Regeneration Forum or Group 9% Local Consultation Activities or Events 22% None
Research Resource Dundee City Council 214
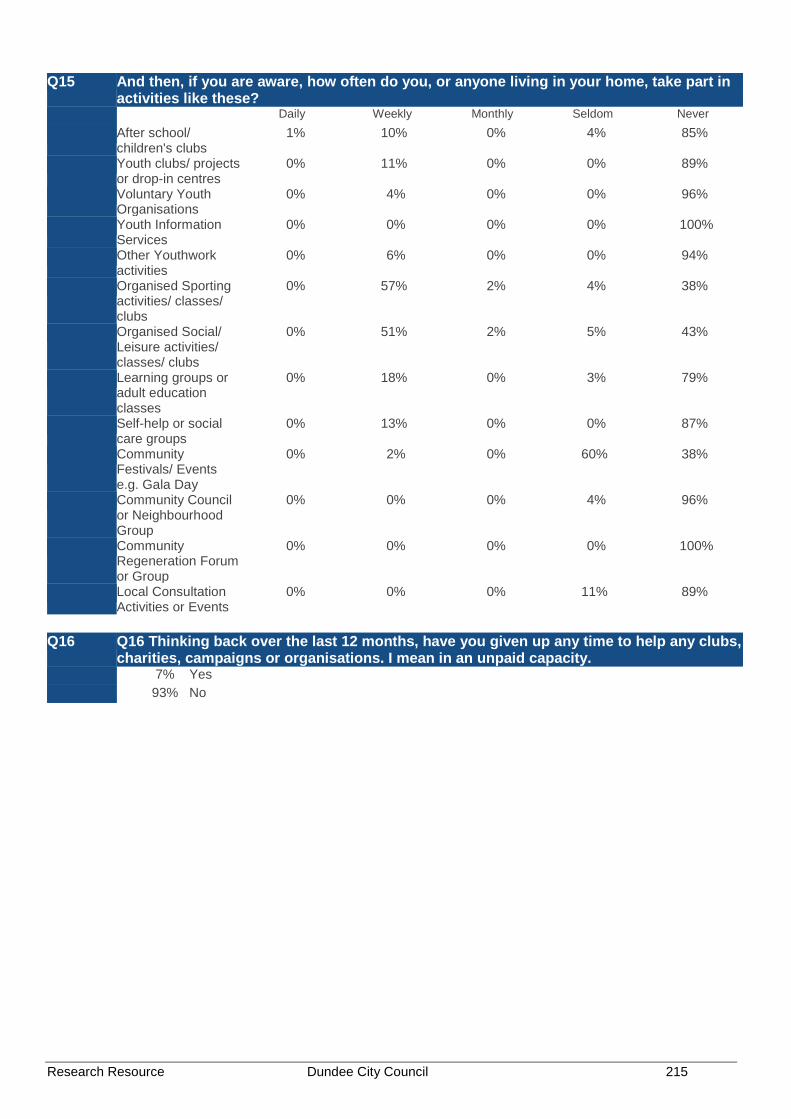
Q15 And then, if you are aware, how often do you, or anyone living in your home, take part in activities like these?
Daily Weekly Monthly Seldom Never After school/
children's clubs 1% 10% 0% 4% 85%
Youth clubs/ projects or drop-in centres
0% 11% 0% 0% 89%
Voluntary Youth Organisations
0% 4% 0% 0% 96%
Youth Information Services
0% 0% 0% 0% 100%
Other Youthwork activities
0% 6% 0% 0% 94%
Organised Sporting activities/ classes/ clubs
0% 57% 2% 4% 38%
Organised Social/ Leisure activities/ classes/ clubs
0% 51% 2% 5% 43%
Learning groups or adult education classes
0% 18% 0% 3% 79%
Self-help or social care groups
0% 13% 0% 0% 87%
Community Festivals/ Events e.g. Gala Day
0% 2% 0% 60% 38%
Community Council or Neighbourhood Group
0% 0% 0% 4% 96%
Community Regeneration Forum or Group
0% 0% 0% 0% 100%
Local Consultation Activities or Events
0% 0% 0% 11% 89%
Q16 Q16 Thinking back over the last 12 months, have you given up any time to help any clubs,
charities, campaigns or organisations. I mean in an unpaid capacity. 7% Yes 93% No
Research Resource Dundee City Council 215

Q17 Looking at this showcard, can you tell me if you have undertaken any work or given unpaid help to any of these types of groups or organisations at any time in the past 12 months?
1% Children's group - e.g. playgroup, mothers and toddlers 1% School children e.g. school trips, sports days, discos, in the classroom 0% Youth groups/ children's activities outside of school 0% Coaching or organising sport or exercise 1% Church, religion or faith-based group 1% The elderly 0% Health disability or social welfare group or organisation 0% Local community group/ neighbourhood association/ community council 0% Tenants group/ residents association 0% Trade union activities 0% Public service - e.g. school, hospital, police, local government service 0% Professional society 0% Safety/ first aid 0% The environment/ animals 0% Justice/ human rights 0% Hobbies/ recreation/ arts/ social club 0% Citizens groups 0% Domestic animal welfare 0% Wildlife protection 0% Environmental protection 96% None Q18 In the last 12 months have you been to any of these events or places in Dundee? 48% Cinema 1% Exhibition including art, photography or crafts 0% Book festival or reading group 21% Theatre e.g. pantomime, musical or play 1% Street arts (art in everyday surroundings like streets, parks or shopping centre) 0% Culturally specific festival e.g. mela/ Feis/ local Gala days 0% Classical music performance or opera 28% Live music event e.g. traditional music, rock concert, jazz event 3% Dance show/ event e.g. ballet 19% Museum 4% Historical place e.g. castle, stately home and grounds, battle or archaeology site 7% Gallery 49% Library, including mobile or online 2% Archive or records office 18% None
Research Resource Dundee City Council 216

Q19 If you have not taken part in any community activities or organisations, can you tell me why this is?
2% It costs too much 0% I don't know enough about it 27% Never occurred to me 66% Not really interested 0% I don't have anyone to go with 0% I wouldn't enjoy it 0% Not enough facilities close to where I live 5% Health isn't good enough 0% I might feel uncomfortable or out of place 0% Lack of transport/ I can't easily get to it 0% Poor access to venues (e.g. no disabled ramps) 0% Not enough information on what is available 0% Didn't enjoy it last time 7% It's difficult to find the time 0% I would feel unsafe going to/ from the activity/ event 0% I would feel unsafe at the activity/ event 0% Other Q20 Please tell me to what extent you agree or disagree with the following statements? Strongly agree Tend to agree Neither agree
nor disagree Tend to disagree
Strongly disagree
No opinion
I can influence decisions affecting my local area
3% 39% 14% 17% 7% 21%
People in my community can influence decisions affecting my local area
3% 44% 15% 12% 6% 21%
Q21 First of all could you tell me whether you are registered with.... a GP or health centre? 100% Yes 0% No 0% Don't know Q21 First of all could you tell me whether you are registered with.... a dentist? 96% Yes 4% No 1% Don't know Q22 How good is your health overall? 60% Very good 28% Good 9% Fair 2% Poor 0% Very poor 0% Don't know
Research Resource Dundee City Council 217

Q23 In a typical week, how often do you undertake moderate physical activity for at least 30 minutes in a day?
11% 4 days a week or more 66% 1-3 days a week 11% Less than once a week 11% Never Q24 Are you, or have you ever been, a smoker? 30% Currently smoke 28% Used to smoke 42% Never smoked Q25 How often do you have (8 for men/ 6 for women) or more alcoholic drinks on one
occasion? 0% Daily or almost daily 15% Weekly 15% Monthly 25% Less than monthly 45% Never 0% Don't know Q26 Please say which option best describes your experience over the last 2 weeks. None of the time Rarely Some of the time Often All of the time I've been feeling
optimistic about the future
0% 0% 31% 58% 10%
I've been feeling useful
0% 0% 23% 68% 9%
I've been feeling relaxed
0% 1% 26% 70% 3%
I've been feeling interested in other people
0% 0% 26% 71% 3%
I've had energy to spare
0% 1% 31% 66% 2%
I've been dealing well with problems
0% 0% 13% 66% 21%
I've been thinking clearly
0% 0% 16% 61% 23%
I've been feeling good about myself
0% 1% 20% 58% 21%
I've been feeling close to other people
0% 0% 13% 61% 26%
I've been feeling confident
0% 0% 12% 65% 24%
I've been able to make up my mind about things
0% 0% 12% 56% 32%
I've been feeling loved
0% 0% 10% 63% 28%
I've been interested in new things
0% 0% 22% 72% 6%
I've been feeling cheerful
0% 1% 11% 83% 6%
Research Resource Dundee City Council 218

Q27 On a scale of 1 to 6 where 1 is not at all and 6 is a great deal, to what extent do you feel that people treat you unfairly?
83% 1 - Not at all 17% 2 0% 3 0% 4 0% 5 0% 6 - A great deal 0% Don't know Q28 To what extent do you agree with the statement "I could turn to friends/ relatives in this
neighbourhood for support? 70% Strongly agree 24% Tend to agree 0% Tend to disagree 0% Strongly disagree 5% Don't know Q29 Are you currently taking part in any of these forms of education/ classes of training? 96% None 1% On the job training 1% An FE college course 0% A university based course 0% Distance learning/ Open University 1% School 1% Adult education or evening class 0% Help with reading, writing or use of numbers 0% Other Q30 What type of qualification, if any, will this lead to. Would it lead to... 0% No qualification 23% A qualification at degree level or above 77% Another qualification Q31 Taking everything into account how safe do you feel your neighbourhood is as a place to
live? 88% Very safe 11% Fairly safe 1% A bit unsafe 0% Very unsafe 0% Don't know Q32 How safe do you feel when... Very safe Fairly safe A bit unsafe Very unsafe Don't know Alone in your home
during the day 94% 6% 0% 0% 0%
Alone in your home at night
93% 6% 0% 0% 0%
Walking alone in your neighbourhood during the day
93% 7% 0% 0% 0%
Walking alone in your neighbourhood after dark
64% 22% 7% 2% 5%
Research Resource Dundee City Council 219

Q33 Do you think that the amount of crime in your neighbourhood has increased or decreased
over the past year? 1% Decreased a lot 4% Decreased a little 77% Remained the same 3% Increased a little 1% Increased a lot 14% Don't know Q34 If you feel crime has increased in your neighbourhood, what has influenced your option? 9% Personal experience of crime 0% Experience of family or friends 91% Talking to people in the area 0% Media - television, radio, paper 0% Social media internet sites e.g. Facebook, Twitter 0% Internet sites 0% Police or Council publications 0% Other Q35 What, in your opinion, is the main factor which contributes most to the level of crime in
your neighbourhood? 2% Boredom/ nothing to do/ lack of facilities 37% Don't know 0% Driving offences/ speeding/ motorbikes 0% Immigrants 24% Alcohol/ Drugs 12% Nothing 0% Lack of money/ poverty 0% Unemployment 0% Prostitution 0% New people/ undesirables moving into area/ not knowing who your neighbours are 0% Anti social behaviour 1% Crime e.g. Break ins/ burglary/ vandalism 22% This is a good area/ neighbourhood/ quiet/ no trouble 1% Lack of discipline/ parental control 1% Opportunists/ some people can't help themselves 0% Lack of policing/ wardens 3% Other 3% Gangs/ youths Q36 To what extent, if it all, does a fear of crime prevent you from taking part in your every day
activities? 96% Not at all 4% A little 0% Quite a lot 0% A great deal 0% Don't know
Research Resource Dundee City Council 220

Q37 Which of these accounts, if any, do you or your partner have?
100% Bank account
13% Building society account 5% Credit union account 1% Post Office card account 0% No, none of these 0% Prefer not to say Q38 Do you have insurance for the contents of your house such as for furniture, electrical
goods etc? 88% Yes 8% No 2% Prefer not to say 2% Don't know Q39 Think about the total value of any savings or investments you have, at the moment do
you (or your partner) have total savings or investments worth £1,000 or more in any combination of the places mentioned on this card, do you have less than £1,000 in savings or investments or do you have no savings or investments at all?
18% No savings 6% Less than £1,000 28% £1,000 or more 2% Don't know 46% Prefer not to say Q40 Are you currently experiencing, or within the last year have you had any difficulties with
the following? 2% Mortgage or rent payments 1% Changes to benefits 1% Council tax payments 1% Loan or credit card payments 2% Cost of food 7% Cost of domestic energy bills 2% Vehicle fuel prices 89% None of the above 1% Prefer not to say Q41 Taking everything together, which of these phrases on this card best describes how you
and your household are managing financially these days? 13% Manage very well 52% Manage quite well 33% Get by all right 2% Don't manage very well 1% Have some deep financial difficulties 0% Are in deep financial trouble 0% Refused 0% Don't know
Research Resource Dundee City Council 221

Q42 When you last contacted Dundee City Council, was this contact to ...? 4% Make a complaint 11% Seek information 27% Request a service 0% Make a suggestion 57% Have never contacted with Council Q43 Overall, how satisfied were you that the Council responded reasonably to your
complaint? 33% Very satisfied 42% Satisfied 0% Neither satisfied nor dissatisfied 17% Dissatisfied 8% Very dissatisfied Q44 Overall, how satisfied were you with this contact to seek information? 57% Very satisfied 26% Satisfied 11% Neither satisfied nor dissatisfied 6% Dissatisfied 0% Very dissatisfied Q45 Overall, how satisfied were you with this contact to request a service? 82% Very satisfied 18% Satisfied 0% Neither satisfied nor dissatisfied 0% Dissatisfied 0% Very dissatisfied Q46 On your most recent contact with the Council, did you.... 91% Get what you need at that contact 9% Have to contact the Council again about the same issue Q47 Was your most recent contact .... 1% By a letter 83% By a telephone call to the Council 3% By a personal visit to a Council office 2% By e-mail 11% By visiting the Council's website
Research Resource Dundee City Council 222
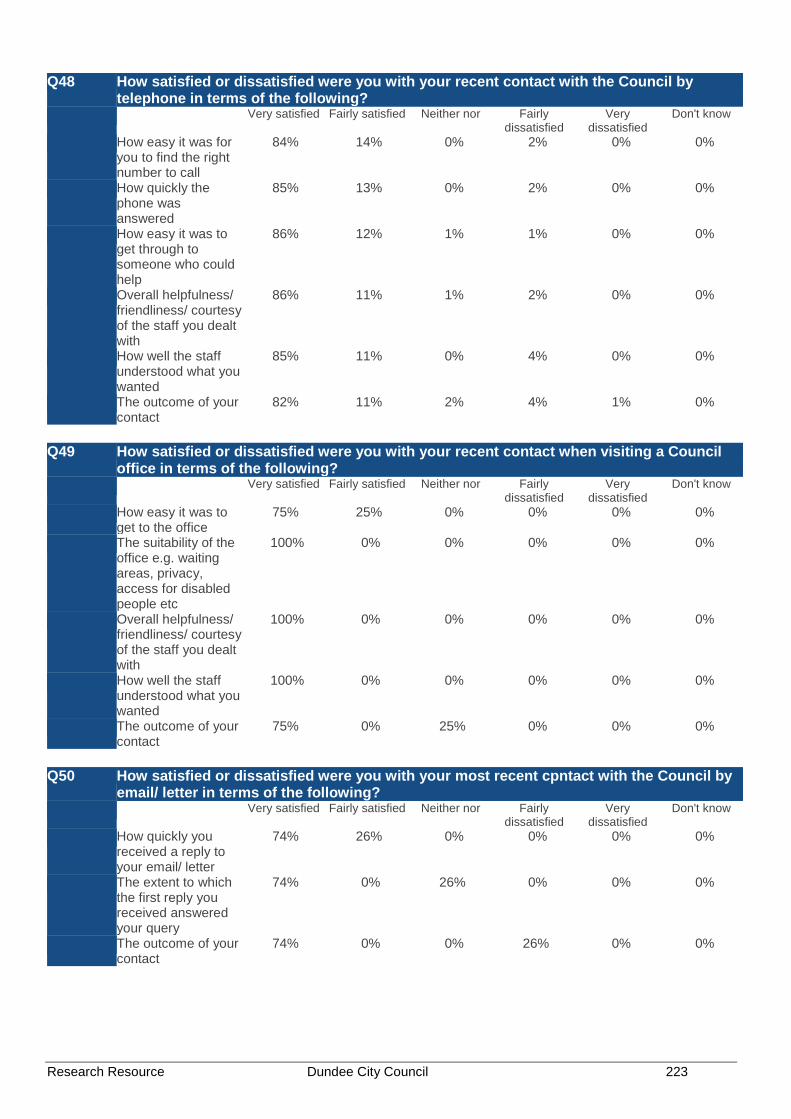
Q48 How satisfied or dissatisfied were you with your recent contact with the Council by telephone in terms of the following?
Very satisfied Fairly satisfied Neither nor Fairly dissatisfied
Very dissatisfied
Don't know
How easy it was for you to find the right number to call
84% 14% 0% 2% 0% 0%
How quickly the phone was answered
85% 13% 0% 2% 0% 0%
How easy it was to get through to someone who could help
86% 12% 1% 1% 0% 0%
Overall helpfulness/ friendliness/ courtesy of the staff you dealt with
86% 11% 1% 2% 0% 0%
How well the staff understood what you wanted
85% 11% 0% 4% 0% 0%
The outcome of your contact
82% 11% 2% 4% 1% 0%
Q49 How satisfied or dissatisfied were you with your recent contact when visiting a Council
office in terms of the following? Very satisfied Fairly satisfied Neither nor Fairly
dissatisfied Very
dissatisfied Don't know
How easy it was to get to the office
75% 25% 0% 0% 0% 0%
The suitability of the office e.g. waiting areas, privacy, access for disabled people etc
100% 0% 0% 0% 0% 0%
Overall helpfulness/ friendliness/ courtesy of the staff you dealt with
100% 0% 0% 0% 0% 0%
How well the staff understood what you wanted
100% 0% 0% 0% 0% 0%
The outcome of your contact
75% 0% 25% 0% 0% 0%
Q50 How satisfied or dissatisfied were you with your most recent cpntact with the Council by
email/ letter in terms of the following? Very satisfied Fairly satisfied Neither nor Fairly
dissatisfied Very
dissatisfied Don't know
How quickly you received a reply to your email/ letter
74% 26% 0% 0% 0% 0%
The extent to which the first reply you received answered your query
74% 0% 26% 0% 0% 0%
The outcome of your contact
74% 0% 0% 26% 0% 0%
Research Resource Dundee City Council 223

Q51 Have you ever used the Council's website? 53% Yes 47% No Q52 How satisfied or dissatisfied would you say you are with the website in terms of the
following? Very
satisfied Fairly
satisfied Neither nor Fairly
dissatisfied Very
dissatisfied Don't know Not
applicable How easily you
managed to find the information you wanted
48% 51% 0% 1% 0% 0% 0%
The amount of information provided on the website
49% 50% 0% 1% 0% 0% 0%
Q53 Generally, do you feel that you receive enough information about the Council and the
services it provides? 92% Yes 8% No Q54 Do you access, and use, the internet in any of the following ways... 79% Internet access at home 46% Internet access via a mobile phone 21% Internet access at work 0% Internet access through public access e.g. at library 1% Access the internet in some other way 17% None of these - I do not access the internet Q55 Do you know that the Council have procedures in place to respond to situations where
vulnerable adults might be at risk of harm? 39% Yes 61% No Q55 Would you know who to contact if you had concerns that a vulnerable adult was at risk of
being abused? 65% Yes 35% No Q56 I am going to read out a list of statements about your local Council and would like you to
tell me which 3 are of the most importance to you. Dundee City Council/ Angus Council... 38% Offering a good range of services 53% Providing an efficient service 47% Providing services which are value for money 31% Providing good quality services 20% Having friendly, polite, helpful, well informed employees 10% Promoting its services well 58% Tackling important issues for the future of the area 25% Listening to complaints 6% Communicating well with the public 8% Ensuring sustainable use of resources and care for the environment 1% Don't know
Research Resource Dundee City Council 224

Q57 I am going to read out the same list of statements again about your local Council. I would like you to tell me whether you agree or disagree with each of these statements. Dundee City Council/ Angus Council....
Agree Neither nor Disagree Don't know Offers a good range
of services 79% 21% 0% 0%
Provides an efficient service
79% 21% 0% 0%
Provides services which are value for money
73% 26% 1% 0%
Provides good quality services
78% 22% 0% 0%
Has friendly, polite, helpful, well informed employees
68% 32% 0% 0%
Promotes its services well
69% 31% 0% 0%
Tackles important issues for the future of the area
72% 26% 3% 0%
Listens to complaints 61% 36% 2% 0% Communicates well
with the public 68% 31% 1% 0%
Ensures sustainable use of resources and care for the environment
68% 32% 0% 0%
Q58 Could I just check how many adults, aged 16 or over, are there in the household including
you? And how many children? 16% 1 72% 2 10% 3 3% 4 0% 5 Q58 Could I just check how many adults, aged 16 or over, are there in the household including
you? And how many children? 70% 0 15% 1 12% 2 2% 3 0% 4 0% 5+ Q59 How many children are there in the household in each group? 0 1 2 3 4 5+ Less than 3 years 50% 42% 9% 0% 0% 0% 3-5years 55% 40% 5% 0% 0% 0% 6-15 years 64% 25% 9% 2% 0% 0% Q60 Gender of respondent: 46% Male 54% Female
Research Resource Dundee City Council 225
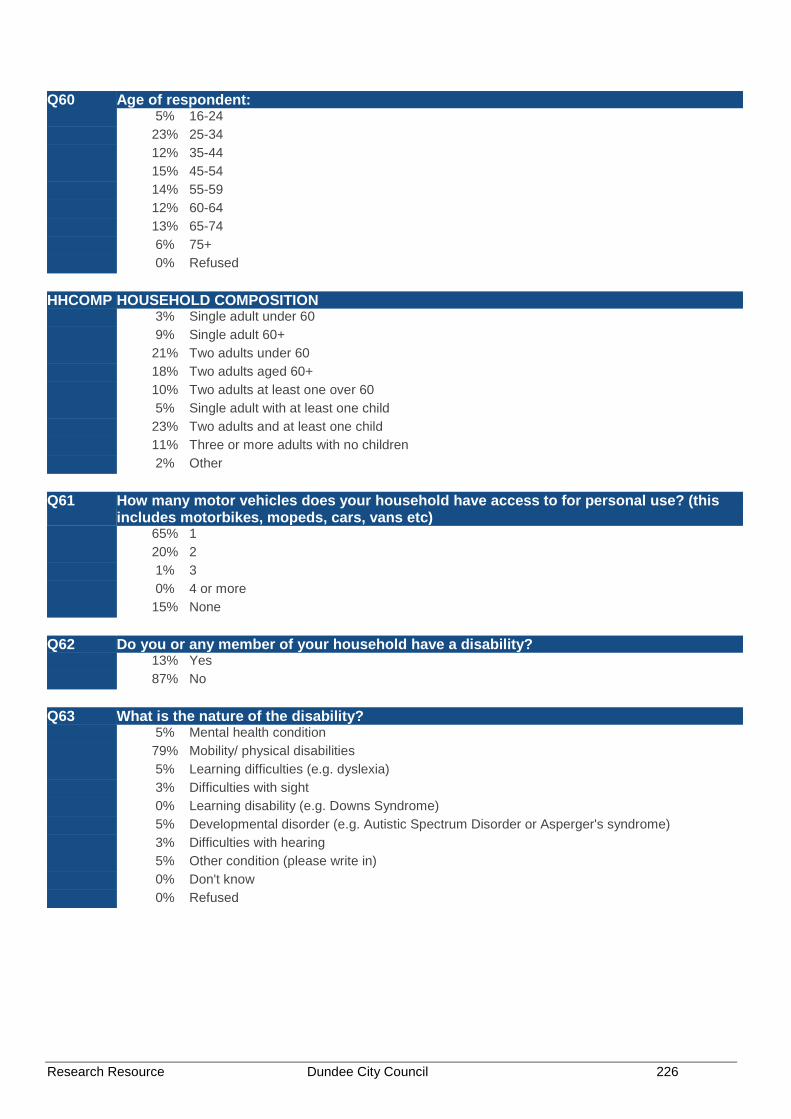
Q60 Age of respondent: 5% 16-24 23% 25-34 12% 35-44 15% 45-54 14% 55-59 12% 60-64 13% 65-74 6% 75+ 0% Refused HHCOMP HOUSEHOLD COMPOSITION 3% Single adult under 60 9% Single adult 60+ 21% Two adults under 60 18% Two adults aged 60+ 10% Two adults at least one over 60 5% Single adult with at least one child 23% Two adults and at least one child 11% Three or more adults with no children 2% Other Q61 How many motor vehicles does your household have access to for personal use? (this
includes motorbikes, mopeds, cars, vans etc) 65% 1 20% 2 1% 3 0% 4 or more 15% None Q62 Do you or any member of your household have a disability? 13% Yes 87% No Q63 What is the nature of the disability? 5% Mental health condition 79% Mobility/ physical disabilities 5% Learning difficulties (e.g. dyslexia) 3% Difficulties with sight 0% Learning disability (e.g. Downs Syndrome) 5% Developmental disorder (e.g. Autistic Spectrum Disorder or Asperger's syndrome) 3% Difficulties with hearing 5% Other condition (please write in) 0% Don't know 0% Refused
Research Resource Dundee City Council 226

Q64 Can you please look at this card and specify what is your religion? 55% None 28% Church of Scotland 17% Roman Catholic 0% Other Christian 0% Buddhist 0% Hindu 0% Jewish 0% Muslim 0% Sikh 0% Another religion (please specify) 0% Would rather not say Q65 Which of these groups on this card do you consider you belong to? 91% Scottish 4% Other British 0% Irish 0% Gypsy/ Traveller 4% Polish 0% Any other white ethnic group 0% Any mixed or multiple ethnic groups 0% Pakistani, Pakistani Scottish or Pakistani British 0% Indian, Indian Scottish or Indian British 0% Bangladeshi, Bangladeshi Scottish or Bangladeshi British 0% Chinese, Chinese Scottish ior Chinese British 0% Other 0% African, African Scottish or African British 0% Caribbean, Caribbean Scottish ior Caribbean British 0% Black, Black Scottish or Black British 0% Other 0% Arab 0% Any other background 0% Refused 0% Don't know Q66 Would you mind looking at the card and tell me which group your overall annual
household income falls. Please use net income from all sources i.e. after deductions of income tax. national insurance, and other compulsory deductions. Please take into account any money you may have from employment, including bonuses, overtime, pensions, state pensions, welfare benefits and interest from savings.
0% Less than £100 per week/ £5,199 per year 4% £100-199 per week / £5,200 - £10,399 per year 7% £200-299 per week / £10,400 - £15, 599 per year 6% £300-399 per week / £15,600 - £20,199 per year 10% £400-499 per week / £20,800 - £25,999 per year 12% £500-599 per week / £26,000 - £31,199 per year 12% £600 or more per week/ £31,200 or more per year 5% Don't know 45% Would rather not say
Research Resource Dundee City Council 227

Ardler, St Mary and Kirkton
CITIZENS' SURVEY 2015 SQ1 Community Regeneration area:
100% Ardler, St Mary's and Kirkton
0% Beechwood, Lochee, Menziehill and Charleston 0% Coldside and Maryfield 0% Fintry, Whitfield and Mill O Mains 0% Mid Craigie, Linlathen and Douglas 0% None SQ2 Ward 0% West End 0% Maryfield 0% The Ferry 0% Coldside 0% Lochee 0% East End 0% North East 100% Strathmartine
Research Resource Dundee City Council 228

Q1 What do you like best about living in this neighbourhood? 0% Close to beach/ coast 1% Quality of housing 14% Close to shops/ quality of shops/ amenities 10% Always lived here/ familiar with/ know area 14% Pleasant/ nice area 31% Friendly people/ neighbours/ family and friends 48% Quiet/ peaceful 10% Convenient location 0% Central location 4% Other 2% None/ nothing 2% Don't know 0% Lots for kids to do 1% Lots of green/ open spaces/ countryside/ nice views 3% Safe 2% Good public transport 1% Everything 15% It's ok/ fine/ I like it here/ no problems Q2 What do you like least about living in this neighbourhood? 2% Littering/ dirty/ dog fouling 0% Difficult/ poor parking 5% Drug problems 2% Lack of facilities for youths/ children 2% ASB/ neighbours/ noisy 1% Youths/ gangs causing trouble 0% Poor shops 0% Vandalism 3% Other 74% None/ nothing 0% Lack of security 5% Don't know 5% Speeding cars/ traffic 0% Lack of transport/ poor public transport 3% Area going downhill/ untidy/ rundown 0% Roads/ pavements/ winter gritting/ snow clearing 1% Bin uplifts/ refuse collection 3% Too many private lets/ undesirables moving into the area 0% Too many stairs/ hills 1% Not much for people to do in general Q3 How long have you lived in this neighbourhood? 1% Up to one year 10% 1-2 years 13% 3-5 years 10% 6-10 years 47% Over 10 years 19% Always lived there 0% Don't know
Research Resource Dundee City Council 229

Q4 Could you please tell me if you think this neighbourhood has changed over the past 5 years, or since you've been living here if it's less than 5 years?
10% Yes - has got better 6% Yes - has got worse 70% No change 14% Don't know Q5better In what ways do you think it has changed? (GOT BETTER) 0% Access to parks/ open spaces 0% Better facilities/ amenities 0% Less vandalism 5% Housing improvements - new houses 0% Improved schools 15% Cleaner/ tidier/ less litter 0% Improved shops 11% Fewer drug problems 5% Friendliness of people/ neighbours 48% Quieter/ more peaceful 11% Other 0% Not sure 5% Less people hanging around street 16% Less crime 0% More young families in the area Q5worse Q5 In what ways do you think it has changed? (GOT WORSE) 0% Lack of parks/ open spaces 0% Overgrown gardens/ uncut grass 0% Poorer shops 0% More vandalism 8% Undesirable people moving in 0% Lack of facilities for youths/ children 0% ASB/ neighbours/ noisy 0% People/ neighbours less friendly 16% Youths/ gangs causing problems 59% Drug/ alcohol problems 8% Other 0% Not sure 9% More crime 0% People don't care about area 8% Too many private lets 25% Litter problems/ area is dirty 17% Area is rundown/ going downhill 0% More houses being built 0% Parking 0% Condition of roads/ pavements 33% More traffic/ motorbikes/ roads unsafe
Research Resource Dundee City Council 230

Q6 Thinking now about the neighbourhood you live in, how would you rate it as a place to live?
77% Very good 18% Fairly good 5% Fairly poor 0% Very poor 0% No opinion Q7 How long have you lived in this house/ flat? 2% Up to one year 11% 1-2 years 13% 3-5 years 10% 6-10 years 58% Over 10 years 5% Always lived here 0% Don't know Q8 Please tell me which of the descriptions on this card best describes your house/ flat? 18% Rented from the Council 15% Rented from a housing association 8% Rented from a private landlord 10% Owned by you (not ex Council) 50% Owned by you (ex Council) 0% Other (please specify) Q9 Overall, how do you rate the general condition of this (your) house/ flat? 80% Very good 20% Fairly good 0% Average 0% Fairly poor 0% Very poor 0% Don't know
Research Resource Dundee City Council 231

Q10 Looking at this card, please state how satisfied or dissatisfied you are with the following services and facilities in your local area?
Very Satisfied Fairly Satisfied Fairly Dissatisfied Very Dissatisfied Doesn't exist/ never used
Local Health services
75% 25% 0% 0% 0%
Police service 67% 20% 1% 1% 12% Fire service 67% 21% 0% 0% 12% Refuse collection 74% 25% 0% 0% 1% Local Schools 70% 19% 0% 0% 11% Social care/ social
work services 11% 16% 0% 0% 73%
Social housing 26% 33% 1% 1% 39% Employment and
advice services 15% 23% 3% 0% 59%
Public transport 66% 21% 3% 1% 9% Street cleaning 45% 50% 3% 1% 1% Sports and leisure
facilities 70% 23% 0% 0% 7%
Community centre/ library
64% 21% 0% 0% 15%
Parks and open spaces
81% 13% 4% 1% 3%
Local phone boxes 19% 12% 0% 0% 69% Local youth facilities 12% 36% 11% 0% 41% Local shops 87% 11% 2% 0% 0% Community Warden
Service 12% 35% 2% 0% 52%
Access to free cash machine/ auto teller
81% 18% 1% 0% 1%
Research Resource Dundee City Council 232

Q11 And, looking at this card, how easy is it for you to access those services and facilities in your local area?
Very easy Fairly easy Fairly difficult Very difficult Doesn't exist/ never used
Local Health services
55% 44% 2% 0% 0%
Police service 60% 37% 0% 0% 3% Fire service 60% 37% 0% 0% 3% Refuse collection 62% 37% 0% 0% 2% Local Schools 42% 35% 0% 0% 22% Social care/ social
work services 25% 4% 0% 0% 71%
Social housing 40% 14% 0% 1% 44% Employment and
advice services 33% 6% 0% 0% 61%
Public transport 60% 39% 0% 0% 1% Street cleaning 54% 45% 0% 0% 1% Sports and leisure
facilities 56% 29% 0% 0% 15%
Community centre/ library
60% 36% 0% 0% 4%
Parks and open spaces
60% 40% 0% 0% 1%
Local phone boxes 38% 5% 0% 0% 57% Local youth facilities 30% 13% 2% 0% 55% Local shops 83% 17% 0% 0% 0% Community Warden
Service 27% 21% 3% 0% 50%
Access to free cash machine/ auto teller
90% 9% 1% 0% 1%
Q12 Looking at this card, how satisfied are you with the following in this neighbourhood? Very satisfied Fairly satisfied Fairly dissatisfied Very dissatisfied Don't know Children's Play areas 22% 55% 9% 1% 14% Cleanliness of
Streets 34% 65% 1% 0% 0%
Shopping Facilities 78% 22% 1% 0% 0% Condition of roads,
pavements and street lighting
30% 45% 25% 1% 0%
Quality and maintenance of open spaces
44% 51% 5% 0% 0%
Cleanliness of the area around your home
50% 46% 3% 1% 0%
The built environment (e.g. buildings, heritage etc)
57% 43% 0% 0% 0%
The natural environment (e.g. parks, open spaces, countryside etc)
60% 38% 0% 3% 0%
Research Resource Dundee City Council 233

Q13 Overall, how satisfied are you with the quality of life in this neighbourhood? 80% Very satisfied 17% Satisfied 3% Dissatisfied 0% Very dissatisfied Q14 Overall, how satisfied are you with the quality of life in Dundee? 87% Very satisfied 12% Satisfied 0% Dissatisfied 0% Very dissatisfied Q15 Can you tell me firstly, if you are aware of any of these in this area? 51% After school/ children's club 11% Youth clubs/ projects or drop-in centres 24% Voluntary Youth Organisations 5% Youth Information Services 7% Other Youthwork activities 63% Organised Sporting activities/ classes/ clubs 51% Organised Social/ Leisure activities/ classes/ clubs 10% Learning groups or adult education classes 4% Self-help or social care groups 48% Community Festivals/ Events e.g. Gala Day 22% Community Council or Neighbourhood Group 15% Community Regeneration Forum or Group 14% Local Consultation Activities or Events 17% None
Research Resource Dundee City Council 234

Q15 And then, if you are aware, how often do you, or anyone living in your home, take part in activities like these?
Daily Weekly Monthly Seldom Never After school/
children's clubs 2% 10% 0% 4% 84%
Youth clubs/ projects or drop-in centres
0% 9% 0% 0% 91%
Voluntary Youth Organisations
0% 4% 0% 0% 96%
Youth Information Services
0% 0% 0% 0% 100%
Other Youthwork activities
0% 7% 0% 0% 93%
Organised Sporting activities/ classes/ clubs
0% 57% 2% 5% 36%
Organised Social/ Leisure activities/ classes/ clubs
0% 48% 3% 5% 45%
Learning groups or adult education classes
0% 21% 0% 5% 74%
Self-help or social care groups
0% 11% 0% 0% 89%
Community Festivals/ Events e.g. Gala Day
0% 2% 0% 60% 38%
Community Council or Neighbourhood Group
0% 0% 0% 5% 95%
Community Regeneration Forum or Group
0% 0% 0% 0% 100%
Local Consultation Activities or Events
0% 0% 0% 11% 89%
Q16 Q16 Thinking back over the last 12 months, have you given up any time to help any clubs,
charities, campaigns or organisations. I mean in an unpaid capacity. 8% Yes 92% No
Research Resource Dundee City Council 235

Q17 Looking at this showcard, can you tell me if you have undertaken any work or given unpaid help to any of these types of groups or organisations at any time in the past 12 months?
1% Children's group - e.g. playgroup, mothers and toddlers 1% School children e.g. school trips, sports days, discos, in the classroom 0% Youth groups/ children's activities outside of school 0% Coaching or organising sport or exercise 1% Church, religion or faith-based group 1% The elderly 0% Health disability or social welfare group or organisation 1% Local community group/ neighbourhood association/ community council 0% Tenants group/ residents association 0% Trade union activities 0% Public service - e.g. school, hospital, police, local government service 0% Professional society 0% Safety/ first aid 0% The environment/ animals 0% Justice/ human rights 0% Hobbies/ recreation/ arts/ social club 0% Citizens groups 0% Domestic animal welfare 0% Wildlife protection 0% Environmental protection 97% None Q18 In the last 12 months have you been to any of these events or places in Dundee? 48% Cinema 1% Exhibition including art, photography or crafts 0% Book festival or reading group 19% Theatre e.g. pantomime, musical or play 1% Street arts (art in everyday surroundings like streets, parks or shopping centre) 0% Culturally specific festival e.g. mela/ Feis/ local Gala days 0% Classical music performance or opera 38% Live music event e.g. traditional music, rock concert, jazz event 4% Dance show/ event e.g. ballet 18% Museum 5% Historical place e.g. castle, stately home and grounds, battle or archaeology site 7% Gallery 49% Library, including mobile or online 1% Archive or records office 20% None
Research Resource Dundee City Council 236

Q19 If you have not taken part in any community activities or organisations, can you tell me why this is?
3% It costs too much 0% I don't know enough about it 7% Never occurred to me 82% Not really interested 0% I don't have anyone to go with 0% I wouldn't enjoy it 0% Not enough facilities close to where I live 3% Health isn't good enough 0% I might feel uncomfortable or out of place 0% Lack of transport/ I can't easily get to it 0% Poor access to venues (e.g. no disabled ramps) 0% Not enough information on what is available 0% Didn't enjoy it last time 7% It's difficult to find the time 0% I would feel unsafe going to/ from the activity/ event 0% I would feel unsafe at the activity/ event 0% Other Q20 Please tell me to what extent you agree or disagree with the following statements? Strongly agree Tend to agree Neither agree
nor disagree Tend to disagree
Strongly disagree
No opinion
I can influence decisions affecting my local area
3% 41% 13% 13% 9% 20%
People in my community can influence decisions affecting my local area
4% 46% 13% 11% 9% 17%
Q21 First of all could you tell me whether you are registered with.... a GP or health centre?
100% Yes
0% No 0% Don't know Q21 First of all could you tell me whether you are registered with.... a dentist? 96% Yes 4% No 0% Don't know Q22 How good is your health overall? 70% Very good 23% Good 4% Fair 2% Poor 0% Very poor 0% Don't know
Research Resource Dundee City Council 237

Q23 In a typical week, how often do you undertake moderate physical activity for at least 30 minutes in a day?
10% 4 days a week or more 77% 1-3 days a week 5% Less than once a week 8% Never Q24 Are you, or have you ever been, a smoker? 36% Currently smoke 25% Used to smoke 40% Never smoked Q25 How often do you have (8 for men/ 6 for women) or more alcoholic drinks on one
occasion? 0% Daily or almost daily 14% Weekly 17% Monthly 30% Less than monthly 39% Never 0% Don't know Q26 Please say which option best describes your experience over the last 2 weeks. None of the time Rarely Some of the time Often All of the time I've been feeling
optimistic about the future
0% 0% 26% 60% 14%
I've been feeling useful
0% 0% 18% 70% 12%
I've been feeling relaxed
0% 1% 27% 67% 4%
I've been feeling interested in other people
0% 0% 24% 74% 3%
I've had energy to spare
0% 2% 27% 69% 3%
I've been dealing well with problems
0% 0% 11% 62% 27%
I've been thinking clearly
0% 0% 11% 58% 31%
I've been feeling good about myself
0% 0% 13% 56% 31%
I've been feeling close to other people
0% 0% 11% 56% 33%
I've been feeling confident
0% 0% 9% 59% 32%
I've been able to make up my mind about things
0% 0% 11% 51% 38%
I've been feeling loved
0% 0% 9% 61% 30%
I've been interested in new things
0% 0% 21% 72% 7%
I've been feeling cheerful
0% 0% 9% 84% 6%
Research Resource Dundee City Council 238

Q27 On a scale of 1 to 6 where 1 is not at all and 6 is a great deal, to what extent do you feel that people treat you unfairly?
86% 1 - Not at all 14% 2 0% 3 0% 4 0% 5 0% 6 - A great deal 0% Don't know Q28 To what extent do you agree with the statement "I could turn to friends/ relatives in this
neighbourhood for support? 79% Strongly agree 16% Tend to agree 0% Tend to disagree 0% Strongly disagree 6% Don't know Q29 Are you currently taking part in any of these forms of education/ classes of training? 94% None 2% On the job training 1% An FE college course 0% A university based course 0% Distance learning/ Open University 1% School 2% Adult education or evening class 0% Help with reading, writing or use of numbers 0% Other Q30 What type of qualification, if any, will this lead to. Would it lead to... 0% No qualification 23% A qualification at degree level or above 77% Another qualification Q31 Taking everything into account how safe do you feel your neighbourhood is as a place to
live? 86% Very safe 13% Fairly safe 2% A bit unsafe 0% Very unsafe 0% Don't know Q32 How safe do you feel when... Very safe Fairly safe A bit unsafe Very unsafe Don't know Alone in your home
during the day 92% 8% 1% 0% 0%
Alone in your home at night
91% 8% 1% 0% 0%
Walking alone in your neighbourhood during the day
89% 10% 1% 0% 0%
Walking alone in your neighbourhood after dark
71% 22% 2% 2% 4%
Research Resource Dundee City Council 239

Q33 Do you think that the amount of crime in your neighbourhood has increased or decreased
over the past year? 1% Decreased a lot 6% Decreased a little 75% Remained the same 3% Increased a little 1% Increased a lot 13% Don't know Q34 If you feel crime has increased in your neighbourhood, what has influenced your option? 0% Personal experience of crime 0% Experience of family or friends 100% Talking to people in the area 0% Media - television, radio, paper 0% Social media internet sites e.g. Facebook, Twitter 0% Internet sites 0% Police or Council publications 0% Other Q35 What, in your opinion, is the main factor which contributes most to the level of crime in
your neighbourhood? 1% Boredom/ nothing to do/ lack of facilities 40% Don't know 0% Driving offences/ speeding/ motorbikes 0% Immigrants 30% Alcohol/ Drugs 3% Nothing 0% Lack of money/ poverty 0% Unemployment 0% Prostitution 0% New people/ undesirables moving into area/ not knowing who your neighbours are 0% Anti social behaviour 0% Crime e.g. Break ins/ burglary/ vandalism 23% This is a good area/ neighbourhood/ quiet/ no trouble 2% Lack of discipline/ parental control 2% Opportunists/ some people can't help themselves 1% Lack of policing/ wardens 4% Other 4% Gangs/ youths Q36 To what extent, if it all, does a fear of crime prevent you from taking part in your every day
activities? 94% Not at all 5% A little 1% Quite a lot 0% A great deal 0% Don't know
Research Resource Dundee City Council 240

Q37 Which of these accounts, if any, do you or your partner have?
100% Bank account
18% Building society account 8% Credit union account 1% Post Office card account 0% No, none of these 0% Prefer not to say Q38 Do you have insurance for the contents of your house such as for furniture, electrical
goods etc? 83% Yes 12% No 1% Prefer not to say 3% Don't know Q39 Think about the total value of any savings or investments you have, at the moment do
you (or your partner) have total savings or investments worth £1,000 or more in any combination of the places mentioned on this card, do you have less than £1,000 in savings or investments or do you have no savings or investments at all?
22% No savings 8% Less than £1,000 19% £1,000 or more 2% Don't know 48% Prefer not to say Q40 Are you currently experiencing, or within the last year have you had any difficulties with
the following? 2% Mortgage or rent payments 1% Changes to benefits 1% Council tax payments 1% Loan or credit card payments 2% Cost of food 8% Cost of domestic energy bills 3% Vehicle fuel prices 87% None of the above 2% Prefer not to say Q41 Taking everything together, which of these phrases on this card best describes how you
and your household are managing financially these days? 10% Manage very well 54% Manage quite well 33% Get by all right 2% Don't manage very well 1% Have some deep financial difficulties 0% Are in deep financial trouble 0% Refused 0% Don't know
Research Resource Dundee City Council 241

Q42 When you last contacted Dundee City Council, was this contact to ...? 5% Make a complaint 13% Seek information 25% Request a service 0% Make a suggestion 57% Have never contacted with Council Q43 Overall, how satisfied were you that the Council responded reasonably to your
complaint? 32% Very satisfied 45% Satisfied 0% Neither satisfied nor dissatisfied 23% Dissatisfied 0% Very dissatisfied Q44 Overall, how satisfied were you with this contact to seek information? 42% Very satisfied 35% Satisfied 15% Neither satisfied nor dissatisfied 8% Dissatisfied 0% Very dissatisfied Q45 Overall, how satisfied were you with this contact to request a service? 72% Very satisfied 28% Satisfied 0% Neither satisfied nor dissatisfied 0% Dissatisfied 0% Very dissatisfied Q46 On your most recent contact with the Council, did you.... 90% Get what you need at that contact 10% Have to contact the Council again about the same issue Q47 Was your most recent contact .... 1% By a letter 76% By a telephone call to the Council 4% By a personal visit to a Council office 2% By e-mail 16% By visiting the Council's website
Research Resource Dundee City Council 242

Q48 How satisfied or dissatisfied were you with your recent contact with the Council by telephone in terms of the following?
Very satisfied Fairly satisfied Neither nor Fairly dissatisfied
Very dissatisfied
Don't know
How easy it was for you to find the right number to call
80% 19% 0% 2% 0% 0%
How quickly the phone was answered
83% 16% 0% 2% 0% 0%
How easy it was to get through to someone who could help
83% 16% 0% 2% 0% 0%
Overall helpfulness/ friendliness/ courtesy of the staff you dealt with
83% 14% 0% 3% 0% 0%
How well the staff understood what you wanted
81% 14% 0% 5% 0% 0%
The outcome of your contact
77% 15% 3% 3% 2% 0%
Q49 How satisfied or dissatisfied were you with your recent contact when visiting a Council
office in terms of the following? Very satisfied Fairly satisfied Neither nor Fairly
dissatisfied Very
dissatisfied Don't know
How easy it was to get to the office
75% 25% 0% 0% 0% 0%
The suitability of the office e.g. waiting areas, privacy, access for disabled people etc
100% 0% 0% 0% 0% 0%
Overall helpfulness/ friendliness/ courtesy of the staff you dealt with
100% 0% 0% 0% 0% 0%
How well the staff understood what you wanted
100% 0% 0% 0% 0% 0%
The outcome of your contact
75% 0% 25% 0% 0% 0%
Q50 How satisfied or dissatisfied were you with your most recent cpntact with the Council by
email/ letter in terms of the following? Very satisfied Fairly satisfied Neither nor Fairly
dissatisfied Very
dissatisfied Don't know
How quickly you received a reply to your email/ letter
65% 35% 0% 0% 0% 0%
The extent to which the first reply you received answered your query
65% 0% 35% 0% 0% 0%
The outcome of your contact
65% 0% 0% 35% 0% 0%
Research Resource Dundee City Council 243

Q51 Have you ever used the Council's website? 59% Yes 41% No Q52 How satisfied or dissatisfied would you say you are with the website in terms of the
following? Very
satisfied Fairly
satisfied Neither nor Fairly
dissatisfied Very
dissatisfied Don't know Not
applicable How easily you
managed to find the information you wanted
42% 57% 0% 1% 0% 0% 0%
The amount of information provided on the website
43% 56% 0% 1% 0% 0% 0%
Q53 Generally, do you feel that you receive enough information about the Council and the
services it provides? 91% Yes 9% No Q54 Do you access, and use, the internet in any of the following ways... 86% Internet access at home 58% Internet access via a mobile phone 19% Internet access at work 0% Internet access through public access e.g. at library 1% Access the internet in some other way 10% None of these - I do not access the internet Q55 Do you know that the Council have procedures in place to respond to situations where
vulnerable adults might be at risk of harm? 40% Yes 60% No Q55 Would you know who to contact if you had concerns that a vulnerable adult was at risk of
being abused? 62% Yes 38% No Q56 I am going to read out a list of statements about your local Council and would like you to
tell me which 3 are of the most importance to you. Dundee City Council/ Angus Council... 37% Offering a good range of services 57% Providing an efficient service 37% Providing services which are value for money 35% Providing good quality services 9% Having friendly, polite, helpful, well informed employees 9% Promoting its services well 67% Tackling important issues for the future of the area 31% Listening to complaints 2% Communicating well with the public 10% Ensuring sustainable use of resources and care for the environment 2% Don't know
Research Resource Dundee City Council 244

Q57 I am going to read out the same list of statements again about your local Council. I would like you to tell me whether you agree or disagree with each of these statements. Dundee City Council/ Angus Council....
Agree Neither nor Disagree Don't know Offers a good range
of services 72% 28% 1% 0%
Provides an efficient service
72% 28% 0% 0%
Provides services which are value for money
69% 30% 2% 0%
Provides good quality services
71% 29% 0% 0%
Has friendly, polite, helpful, well informed employees
63% 37% 0% 0%
Promotes its services well
61% 39% 1% 0%
Tackles important issues for the future of the area
63% 33% 4% 0%
Listens to complaints 58% 38% 4% 0% Communicates well
with the public 63% 36% 1% 0%
Ensures sustainable use of resources and care for the environment
58% 42% 0% 0%
Q58 Could I just check how many adults, aged 16 or over, are there in the household including
you? And how many children? 10% 1 75% 2 12% 3 4% 4 0% 5 Q58 Could I just check how many adults, aged 16 or over, are there in the household including
you? And how many children? 65% 0 16% 1 15% 2 3% 3 0% 4 0% 5+ Q59 How many children are there in the household in each group? 0 1 2 3 4 5+ Less than 3 years 46% 42% 11% 0% 0% 0% 3-5years 54% 40% 6% 0% 0% 0% 6-15 years 68% 22% 7% 3% 0% 0% Q60 Gender of respondent: 48% Male 52% Female
Research Resource Dundee City Council 245

Q60 Age of respondent: 7% 16-24 25% 25-34 14% 35-44 17% 45-54 13% 55-59 11% 60-64 9% 65-74 3% 75+ 0% Refused HHCOMP HOUSEHOLD COMPOSITION 3% Single adult under 60 2% Single adult 60+ 22% Two adults under 60 16% Two adults aged 60+ 10% Two adults at least one over 60 5% Single adult with at least one child 27% Two adults and at least one child 13% Three or more adults with no children 2% Other Q61 How many motor vehicles does your household have access to for personal use? (this
includes motorbikes, mopeds, cars, vans etc) 72% 1 14% 2 0% 3 0% 4 or more 14% None Q62 Do you or any member of your household have a disability? 6% Yes 94% No Q63 What is the nature of the disability? 9% Mental health condition 65% Mobility/ physical disabilities 9% Learning difficulties (e.g. dyslexia) 9% Difficulties with sight 0% Learning disability (e.g. Downs Syndrome) 0% Developmental disorder (e.g. Autistic Spectrum Disorder or Asperger's syndrome) 0% Difficulties with hearing 9% Other condition (please write in) 0% Don't know 0% Refused
Research Resource Dundee City Council 246

Q64 Can you please look at this card and specify what is your religion? 57% None 24% Church of Scotland 18% Roman Catholic 0% Other Christian 0% Buddhist 0% Hindu 0% Jewish 0% Muslim 0% Sikh 0% Another religion (please specify) 0% Would rather not say Q65 Which of these groups on this card do you consider you belong to? 91% Scottish 3% Other British 0% Irish 0% Gypsy/ Traveller 6% Polish 0% Any other white ethnic group 0% Any mixed or multiple ethnic groups 0% Pakistani, Pakistani Scottish or Pakistani British 0% Indian, Indian Scottish or Indian British 0% Bangladeshi, Bangladeshi Scottish or Bangladeshi British 0% Chinese, Chinese Scottish ior Chinese British 0% Other 0% African, African Scottish or African British 0% Caribbean, Caribbean Scottish ior Caribbean British 0% Black, Black Scottish or Black British 0% Other 0% Arab 0% Any other background 0% Refused 0% Don't know Q66 Would you mind looking at the card and tell me which group your overall annual
household income falls. Please use net income from all sources i.e. after deductions of income tax. national insurance, and other compulsory deductions. Please take into account any money you may have from employment, including bonuses, overtime, pensions, state pensions, welfare benefits and interest from savings.
0% Less than £100 per week/ £5,199 per year 3% £100-199 per week / £5,200 - £10,399 per year 3% £200-299 per week / £10,400 - £15, 599 per year 6% £300-399 per week / £15,600 - £20,199 per year 12% £400-499 per week / £20,800 - £25,999 per year 15% £500-599 per week / £26,000 - £31,199 per year 11% £600 or more per week/ £31,200 or more per year 6% Don't know 44% Would rather not say
Research Resource Dundee City Council 247

Beechwood, Lochee, Menzieshill and Charleston
CITIZENS' SURVEY 2015 SQ1 Community Regeneration area: 0% Ardler, St Mary's and Kirkton 100% Beechwood, Lochee, Menziehill and Charleston 0% Coldside and Maryfield 0% Fintry, Whitfield and Mill O Mains 0% Mid Craigie, Linlathen and Douglas 0% None SQ2 Ward 2% West End 0% Maryfield 0% The Ferry 0% Coldside 97% Lochee 0% East End 1% North East 0% Strathmartine
Research Resource Dundee City Council 248

Q1 What do you like best about living in this neighbourhood? 0% Close to beach/ coast 1% Quality of housing 13% Close to shops/ quality of shops/ amenities 7% Always lived here/ familiar with/ know area 16% Pleasant/ nice area 32% Friendly people/ neighbours/ family and friends 36% Quiet/ peaceful 11% Convenient location 1% Central location 2% Other 4% None/ nothing 5% Don't know 2% Lots for kids to do 0% Lots of green/ open spaces/ countryside/ nice views 1% Safe 2% Good public transport 1% Everything 18% It's ok/ fine/ I like it here/ no problems Q2 What do you like least about living in this neighbourhood? 0% Littering/ dirty/ dog fouling 2% Difficult/ poor parking 7% Drug problems 0% Lack of facilities for youths/ children 4% ASB/ neighbours/ noisy 2% Youths/ gangs causing trouble 0% Poor shops 3% Vandalism 6% Other 67% None/ nothing 0% Lack of security 7% Don't know 1% Speeding cars/ traffic 0% Lack of transport/ poor public transport 5% Area going downhill/ untidy/ rundown 0% Roads/ pavements/ winter gritting/ snow clearing 0% Bin uplifts/ refuse collection 1% Too many private lets/ undesirables moving into the area 0% Too many stairs/ hills 1% Not much for people to do in general Q3 How long have you lived in this neighbourhood? 4% Up to one year 11% 1-2 years 15% 3-5 years 10% 6-10 years 31% Over 10 years 28% Always lived there 0% Don't know
Research Resource Dundee City Council 249

Q4 Could you please tell me if you think this neighbourhood has changed over the past 5 years, or since you've been living here if it's less than 5 years?
5% Yes - has got better 9% Yes - has got worse 69% No change 18% Don't know Q5better In what ways do you think it has changed? (GOT BETTER) 0% Access to parks/ open spaces 11% Better facilities/ amenities 0% Less vandalism 31% Housing improvements - new houses 0% Improved schools 10% Cleaner/ tidier/ less litter 0% Improved shops 30% Fewer drug problems 0% Friendliness of people/ neighbours 29% Quieter/ more peaceful 40% Other 0% Not sure 0% Less people hanging around street 0% Less crime 0% More young families in the area Q5worse Q5 In what ways do you think it has changed? (GOT WORSE) 0% Lack of parks/ open spaces 0% Overgrown gardens/ uncut grass 0% Poorer shops 0% More vandalism 22% Undesirable people moving in 0% Lack of facilities for youths/ children 6% ASB/ neighbours/ noisy 0% People/ neighbours less friendly 16% Youths/ gangs causing problems 22% Drug/ alcohol problems 6% Other 0% Not sure 5% More crime 0% People don't care about area 0% Too many private lets 17% Litter problems/ area is dirty 34% Area is rundown/ going downhill 0% More houses being built 0% Parking 6% Condition of roads/ pavements 0% More traffic/ motorbikes/ roads unsafe
Research Resource Dundee City Council 250

Q6 Thinking now about the neighbourhood you live in, how would you rate it as a place to live?
57% Very good 35% Fairly good 7% Fairly poor 1% Very poor 0% No opinion Q7 How long have you lived in this house/ flat? 7% Up to one year 12% 1-2 years 20% 3-5 years 14% 6-10 years 43% Over 10 years 4% Always lived here 0% Don't know Q8 Please tell me which of the descriptions on this card best describes your house/ flat? 41% Rented from the Council 9% Rented from a housing association 12% Rented from a private landlord 2% Owned by you (not ex Council) 36% Owned by you (ex Council) 0% Other (please specify) Q9 Overall, how do you rate the general condition of this (your) house/ flat? 62% Very good 36% Fairly good 2% Average 0% Fairly poor 0% Very poor 0% Don't know
Research Resource Dundee City Council 251

Q10 Looking at this card, please state how satisfied or dissatisfied you are with the following services and facilities in your local area?
Very Satisfied Fairly Satisfied Fairly Dissatisfied Very Dissatisfied Doesn't exist/ never used
Local Health services
76% 24% 0% 0% 0%
Police service 61% 32% 1% 0% 6% Fire service 63% 32% 0% 0% 6% Refuse collection 64% 35% 1% 0% 0% Local Schools 58% 26% 0% 0% 16% Social care/ social
work services 17% 11% 0% 0% 72%
Social housing 48% 27% 1% 2% 22% Employment and
advice services 13% 31% 2% 0% 53%
Public transport 56% 24% 7% 2% 11% Street cleaning 33% 61% 4% 1% 1% Sports and leisure
facilities 47% 38% 2% 1% 13%
Community centre/ library
54% 31% 0% 0% 15%
Parks and open spaces
75% 21% 1% 0% 2%
Local phone boxes 33% 18% 2% 0% 48% Local youth facilities 14% 25% 4% 4% 53% Local shops 81% 14% 2% 0% 3% Community Warden
Service 18% 22% 2% 0% 58%
Access to free cash machine/ auto teller
81% 17% 1% 0% 0%
Research Resource Dundee City Council 252

Q11 And, looking at this card, how easy is it for you to access those services and facilities in your local area?
Very easy Fairly easy Fairly difficult Very difficult Doesn't exist/ never used
Local Health services
62% 37% 1% 0% 0%
Police service 66% 34% 0% 0% 0% Fire service 67% 33% 0% 0% 0% Refuse collection 67% 33% 0% 0% 0% Local Schools 55% 23% 0% 0% 21% Social care/ social
work services 40% 11% 0% 0% 49%
Social housing 61% 17% 1% 1% 21% Employment and
advice services 39% 14% 0% 0% 47%
Public transport 76% 19% 1% 0% 4% Street cleaning 48% 49% 0% 0% 2% Sports and leisure
facilities 51% 24% 2% 0% 23%
Community centre/ library
65% 26% 0% 0% 9%
Parks and open spaces
66% 32% 0% 0% 2%
Local phone boxes 43% 8% 1% 1% 48% Local youth facilities 36% 9% 0% 0% 55% Local shops 91% 8% 0% 0% 1% Community Warden
Service 37% 17% 1% 1% 44%
Access to free cash machine/ auto teller
90% 9% 0% 0% 1%
Q12 Looking at this card, how satisfied are you with the following in this neighbourhood? Very satisfied Fairly satisfied Fairly dissatisfied Very dissatisfied Don't know Children's Play areas 18% 49% 4% 1% 28% Cleanliness of
Streets 28% 66% 5% 1% 1%
Shopping Facilities 73% 26% 0% 0% 0% Condition of roads,
pavements and street lighting
25% 46% 26% 2% 0%
Quality and maintenance of open spaces
32% 65% 2% 0% 0%
Cleanliness of the area around your home
32% 61% 6% 1% 0%
The built environment (e.g. buildings, heritage etc)
38% 61% 1% 0% 0%
The natural environment (e.g. parks, open spaces, countryside etc)
44% 55% 1% 0% 0%
Research Resource Dundee City Council 253

Q13 Overall, how satisfied are you with the quality of life in this neighbourhood? 67% Very satisfied 27% Satisfied 5% Dissatisfied 0% Very dissatisfied Q14 Overall, how satisfied are you with the quality of life in Dundee? 72% Very satisfied 27% Satisfied 1% Dissatisfied 0% Very dissatisfied Q15 Can you tell me firstly, if you are aware of any of these in this area? 49% After school/ children's club 15% Youth clubs/ projects or drop-in centres 22% Voluntary Youth Organisations 4% Youth Information Services 2% Other Youthwork activities 64% Organised Sporting activities/ classes/ clubs 57% Organised Social/ Leisure activities/ classes/ clubs 28% Learning groups or adult education classes 15% Self-help or social care groups 42% Community Festivals/ Events e.g. Gala Day 23% Community Council or Neighbourhood Group 18% Community Regeneration Forum or Group 13% Local Consultation Activities or Events 10% None
Research Resource Dundee City Council 254

Q15 And then, if you are aware, how often do you, or anyone living in your home, take part in activities like these?
Daily Weekly Monthly Seldom Never After school/
children's clubs 1% 7% 0% 8% 84%
Youth clubs/ projects or drop-in centres
4% 4% 0% 0% 93%
Voluntary Youth Organisations
0% 7% 0% 0% 93%
Youth Information Services
0% 0% 0% 0% 100%
Other Youthwork activities
0% 0% 0% 0% 100%
Organised Sporting activities/ classes/ clubs
1% 30% 2% 6% 61%
Organised Social/ Leisure activities/ classes/ clubs
0% 26% 2% 7% 65%
Learning groups or adult education classes
0% 0% 0% 0% 100%
Self-help or social care groups
0% 0% 0% 0% 100%
Community Festivals/ Events e.g. Gala Day
0% 0% 0% 39% 61%
Community Council or Neighbourhood Group
0% 4% 0% 2% 94%
Community Regeneration Forum or Group
0% 0% 0% 11% 89%
Local Consultation Activities or Events
0% 0% 0% 18% 82%
Q16 Q16 Thinking back over the last 12 months, have you given up any time to help any clubs,
charities, campaigns or organisations. I mean in an unpaid capacity. 7% Yes 93% No
Research Resource Dundee City Council 255

Q17 Looking at this showcard, can you tell me if you have undertaken any work or given unpaid help to any of these types of groups or organisations at any time in the past 12 months?
2% Children's group - e.g. playgroup, mothers and toddlers 1% School children e.g. school trips, sports days, discos, in the classroom 0% Youth groups/ children's activities outside of school 0% Coaching or organising sport or exercise 0% Church, religion or faith-based group 0% The elderly 0% Health disability or social welfare group or organisation 0% Local community group/ neighbourhood association/ community council 0% Tenants group/ residents association 0% Trade union activities 0% Public service - e.g. school, hospital, police, local government service 0% Professional society 0% Safety/ first aid 0% The environment/ animals 0% Justice/ human rights 0% Hobbies/ recreation/ arts/ social club 0% Citizens groups 0% Domestic animal welfare 0% Wildlife protection 0% Environmental protection 97% None Q18 In the last 12 months have you been to any of these events or places in Dundee? 43% Cinema 0% Exhibition including art, photography or crafts 0% Book festival or reading group 9% Theatre e.g. pantomime, musical or play 0% Street arts (art in everyday surroundings like streets, parks or shopping centre) 0% Culturally specific festival e.g. mela/ Feis/ local Gala days 0% Classical music performance or opera 33% Live music event e.g. traditional music, rock concert, jazz event 2% Dance show/ event e.g. ballet 14% Museum 1% Historical place e.g. castle, stately home and grounds, battle or archaeology site 8% Gallery 30% Library, including mobile or online 0% Archive or records office 32% None
Research Resource Dundee City Council 256

Q19 If you have not taken part in any community activities or organisations, can you tell me why this is?
22% It costs too much 2% I don't know enough about it 16% Never occurred to me 55% Not really interested 2% I don't have anyone to go with 0% I wouldn't enjoy it 0% Not enough facilities close to where I live 11% Health isn't good enough 0% I might feel uncomfortable or out of place 0% Lack of transport/ I can't easily get to it 0% Poor access to venues (e.g. no disabled ramps) 0% Not enough information on what is available 0% Didn't enjoy it last time 9% It's difficult to find the time 0% I would feel unsafe going to/ from the activity/ event 0% I would feel unsafe at the activity/ event 2% Other Q20 Please tell me to what extent you agree or disagree with the following statements? Strongly agree Tend to agree Neither agree
nor disagree Tend to disagree
Strongly disagree
No opinion
I can influence decisions affecting my local area
1% 28% 18% 23% 13% 18%
People in my community can influence decisions affecting my local area
1% 35% 19% 10% 6% 29%
Q21 First of all could you tell me whether you are registered with.... a GP or health centre? 99% Yes 0% No 1% Don't know Q21 First of all could you tell me whether you are registered with.... a dentist? 92% Yes 7% No 0% Don't know Q22 How good is your health overall? 59% Very good 22% Good 11% Fair 7% Poor 1% Very poor 0% Don't know
Research Resource Dundee City Council 257

Q23 In a typical week, how often do you undertake moderate physical activity for at least 30 minutes in a day?
18% 4 days a week or more 51% 1-3 days a week 9% Less than once a week 22% Never Q24 Are you, or have you ever been, a smoker? 27% Currently smoke 27% Used to smoke 46% Never smoked Q25 How often do you have (8 for men/ 6 for women) or more alcoholic drinks on one
occasion? 1% Daily or almost daily 18% Weekly 16% Monthly 17% Less than monthly 47% Never 1% Don't know Q26 Please say which option best describes your experience over the last 2 weeks. None of the time Rarely Some of the time Often All of the time I've been feeling
optimistic about the future
0% 5% 41% 45% 9%
I've been feeling useful
0% 1% 23% 59% 16%
I've been feeling relaxed
0% 0% 35% 61% 4%
I've been feeling interested in other people
0% 2% 36% 56% 6%
I've had energy to spare
0% 3% 35% 57% 5%
I've been dealing well with problems
0% 0% 20% 54% 26%
I've been thinking clearly
0% 0% 18% 52% 30%
I've been feeling good about myself
0% 0% 19% 58% 23%
I've been feeling close to other people
0% 1% 13% 56% 31%
I've been feeling confident
0% 0% 14% 58% 28%
I've been able to make up my mind about things
0% 0% 15% 49% 36%
I've been feeling loved
0% 1% 13% 56% 30%
I've been interested in new things
0% 2% 26% 60% 12%
I've been feeling cheerful
0% 0% 13% 74% 12%
Research Resource Dundee City Council 258

Q27 On a scale of 1 to 6 where 1 is not at all and 6 is a great deal, to what extent do you feel that people treat you unfairly?
81% 1 - Not at all 16% 2 2% 3 0% 4 0% 5 0% 6 - A great deal 0% Don't know Q28 To what extent do you agree with the statement "I could turn to friends/ relatives in this
neighbourhood for support? 67% Strongly agree 30% Tend to agree 1% Tend to disagree 0% Strongly disagree 2% Don't know Q29 Are you currently taking part in any of these forms of education/ classes of training? 95% None 3% On the job training 2% An FE college course 0% A university based course 0% Distance learning/ Open University 0% School 0% Adult education or evening class 0% Help with reading, writing or use of numbers 0% Other Q30 What type of qualification, if any, will this lead to. Would it lead to... 54% No qualification 18% A qualification at degree level or above 28% Another qualification Q31 Taking everything into account how safe do you feel your neighbourhood is as a place to
live? 80% Very safe 16% Fairly safe 3% A bit unsafe 0% Very unsafe 0% Don't know Q32 How safe do you feel when... Very safe Fairly safe A bit unsafe Very unsafe Don't know Alone in your home
during the day 94% 6% 0% 0% 0%
Alone in your home at night
89% 10% 1% 0% 0%
Walking alone in your neighbourhood during the day
92% 8% 0% 0% 0%
Walking alone in your neighbourhood after dark
55% 28% 8% 1% 7%
Research Resource Dundee City Council 259

Q33 Do you think that the amount of crime in your neighbourhood has increased or decreased
over the past year? 0% Decreased a lot 6% Decreased a little 68% Remained the same 3% Increased a little 3% Increased a lot 19% Don't know Q34 If you feel crime has increased in your neighbourhood, what has influenced your option? 31% Personal experience of crime 8% Experience of family or friends 54% Talking to people in the area 15% Media - television, radio, paper 0% Social media internet sites e.g. Facebook, Twitter 0% Internet sites 7% Police or Council publications 8% Other Q35 What, in your opinion, is the main factor which contributes most to the level of crime in
your neighbourhood? 2% Boredom/ nothing to do/ lack of facilities 36% Don't know 0% Driving offences/ speeding/ motorbikes 1% Immigrants 49% Alcohol/ Drugs 1% Nothing 0% Lack of money/ poverty 1% Unemployment 0% Prostitution 0% New people/ undesirables moving into area/ not knowing who your neighbours are 0% Anti social behaviour 3% Crime e.g. Break ins/ burglary/ vandalism 7% This is a good area/ neighbourhood/ quiet/ no trouble 0% Lack of discipline/ parental control 0% Opportunists/ some people can't help themselves 0% Lack of policing/ wardens 1% Other 8% Gangs/ youths Q36 To what extent, if it all, does a fear of crime prevent you from taking part in your every day
activities? 92% Not at all 6% A little 2% Quite a lot 0% A great deal 0% Don't know
Research Resource Dundee City Council 260

Q37 Which of these accounts, if any, do you or your partner have? 98% Bank account 11% Building society account 6% Credit union account 6% Post Office card account 0% No, none of these 0% Prefer not to say Q38 Do you have insurance for the contents of your house such as for furniture, electrical
goods etc? 67% Yes 28% No 4% Prefer not to say 1% Don't know Q39 Think about the total value of any savings or investments you have, at the moment do
you (or your partner) have total savings or investments worth £1,000 or more in any combination of the places mentioned on this card, do you have less than £1,000 in savings or investments or do you have no savings or investments at all?
33% No savings 6% Less than £1,000 15% £1,000 or more 5% Don't know 41% Prefer not to say Q40 Are you currently experiencing, or within the last year have you had any difficulties with
the following? 3% Mortgage or rent payments 5% Changes to benefits 4% Council tax payments 3% Loan or credit card payments 3% Cost of food 18% Cost of domestic energy bills 0% Vehicle fuel prices 76% None of the above 1% Prefer not to say Q41 Taking everything together, which of these phrases on this card best describes how you
and your household are managing financially these days? 7% Manage very well 48% Manage quite well 37% Get by all right 2% Don't manage very well 4% Have some deep financial difficulties 1% Are in deep financial trouble 0% Refused 1% Don't know
Research Resource Dundee City Council 261
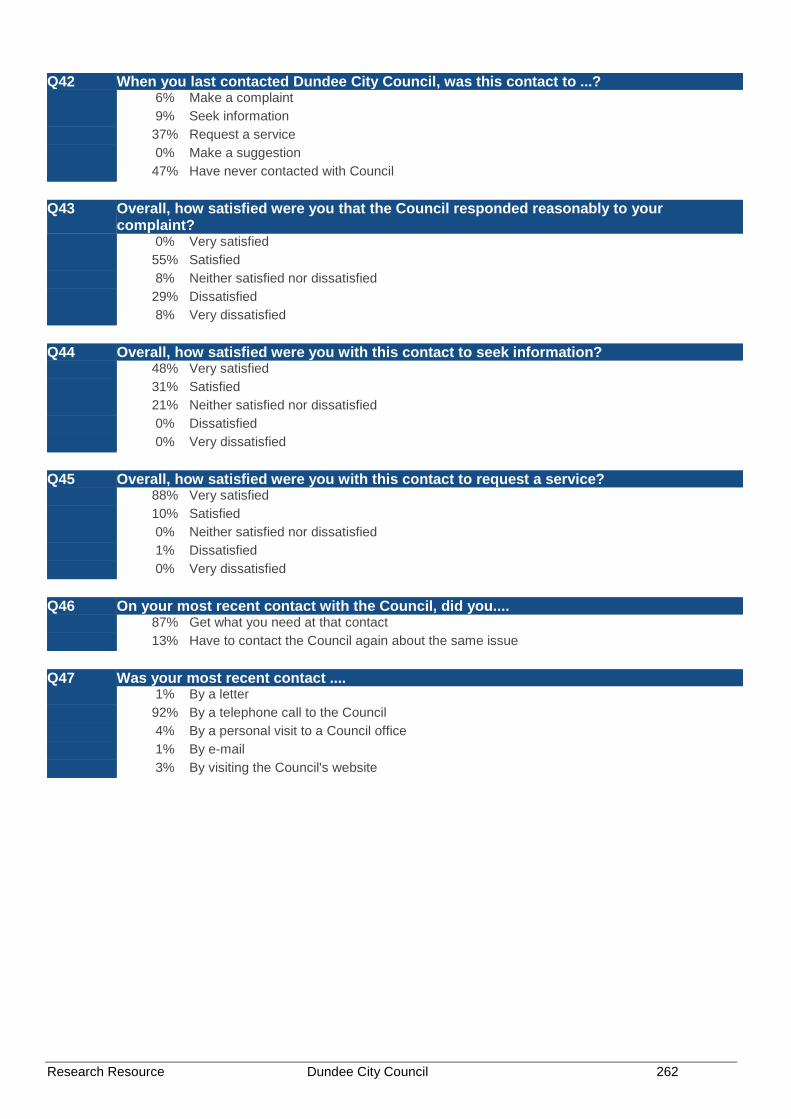
Q42 When you last contacted Dundee City Council, was this contact to ...? 6% Make a complaint 9% Seek information 37% Request a service 0% Make a suggestion 47% Have never contacted with Council Q43 Overall, how satisfied were you that the Council responded reasonably to your
complaint? 0% Very satisfied 55% Satisfied 8% Neither satisfied nor dissatisfied 29% Dissatisfied 8% Very dissatisfied Q44 Overall, how satisfied were you with this contact to seek information? 48% Very satisfied 31% Satisfied 21% Neither satisfied nor dissatisfied 0% Dissatisfied 0% Very dissatisfied Q45 Overall, how satisfied were you with this contact to request a service? 88% Very satisfied 10% Satisfied 0% Neither satisfied nor dissatisfied 1% Dissatisfied 0% Very dissatisfied Q46 On your most recent contact with the Council, did you.... 87% Get what you need at that contact 13% Have to contact the Council again about the same issue Q47 Was your most recent contact .... 1% By a letter 92% By a telephone call to the Council 4% By a personal visit to a Council office 1% By e-mail 3% By visiting the Council's website
Research Resource Dundee City Council 262

Q48 How satisfied or dissatisfied were you with your recent contact with the Council by telephone in terms of the following?
Very satisfied Fairly satisfied Neither nor Fairly dissatisfied
Very dissatisfied
Don't know
How easy it was for you to find the right number to call
86% 13% 0% 0% 0% 1%
How quickly the phone was answered
86% 13% 0% 0% 0% 1%
How easy it was to get through to someone who could help
85% 14% 0% 0% 0% 1%
Overall helpfulness/ friendliness/ courtesy of the staff you dealt with
83% 15% 1% 0% 0% 1%
How well the staff understood what you wanted
83% 12% 3% 1% 0% 1%
The outcome of your contact
81% 11% 0% 3% 5% 0%
Q49 How satisfied or dissatisfied were you with your recent contact when visiting a Council
office in terms of the following? Very satisfied Fairly satisfied Neither nor Fairly
dissatisfied Very
dissatisfied Don't know
How easy it was to get to the office
74% 26% 0% 0% 0% 0%
The suitability of the office e.g. waiting areas, privacy, access for disabled people etc
74% 26% 0% 0% 0% 0%
Overall helpfulness/ friendliness/ courtesy of the staff you dealt with
74% 26% 0% 0% 0% 0%
How well the staff understood what you wanted
74% 26% 0% 0% 0% 0%
The outcome of your contact
74% 26% 0% 0% 0% 0%
Q50 How satisfied or dissatisfied were you with your most recent cpntact with the Council by
email/ letter in terms of the following? Very satisfied Fairly satisfied Neither nor Fairly
dissatisfied Very
dissatisfied Don't know
How quickly you received a reply to your email/ letter
50% 0% 0% 50% 0% 0%
The extent to which the first reply you received answered your query
0% 0% 0% 50% 50% 0%
The outcome of your contact
0% 50% 0% 0% 50% 0%
Research Resource Dundee City Council 263

Q51 Have you ever used the Council's website? 33% Yes 67% No Q52 How satisfied or dissatisfied would you say you are with the website in terms of the
following? Very
satisfied Fairly
satisfied Neither nor Fairly
dissatisfied Very
dissatisfied Don't know Not
applicable How easily you
managed to find the information you wanted
47% 51% 1% 0% 0% 0% 0%
The amount of information provided on the website
48% 49% 3% 0% 0% 0% 0%
Q53 Generally, do you feel that you receive enough information about the Council and the
services it provides? 92% Yes 8% No Q54 Do you access, and use, the internet in any of the following ways... 78% Internet access at home 54% Internet access via a mobile phone 14% Internet access at work 4% Internet access through public access e.g. at library 2% Access the internet in some other way 17% None of these - I do not access the internet Q55 Do you know that the Council have procedures in place to respond to situations where
vulnerable adults might be at risk of harm? 53% Yes 47% No Q55 Would you know who to contact if you had concerns that a vulnerable adult was at risk of
being abused? 69% Yes 31% No Q56 I am going to read out a list of statements about your local Council and would like you to
tell me which 3 are of the most importance to you. Dundee City Council/ Angus Council... 41% Offering a good range of services 37% Providing an efficient service 48% Providing services which are value for money 39% Providing good quality services 19% Having friendly, polite, helpful, well informed employees 8% Promoting its services well 55% Tackling important issues for the future of the area 32% Listening to complaints 4% Communicating well with the public 15% Ensuring sustainable use of resources and care for the environment 0% Don't know
Research Resource Dundee City Council 264

Q57 I am going to read out the same list of statements again about your local Council. I would like you to tell me whether you agree or disagree with each of these statements. Dundee City Council/ Angus Council....
Agree Neither nor Disagree Don't know Offers a good range
of services 76% 24% 0% 0%
Provides an efficient service
74% 26% 0% 0%
Provides services which are value for money
66% 33% 1% 0%
Provides good quality services
74% 26% 0% 0%
Has friendly, polite, helpful, well informed employees
65% 35% 0% 0%
Promotes its services well
62% 35% 3% 0%
Tackles important issues for the future of the area
64% 33% 3% 0%
Listens to complaints 51% 47% 2% 0% Communicates well
with the public 62% 37% 1% 0%
Ensures sustainable use of resources and care for the environment
62% 37% 1% 0%
Q58 Could I just check how many adults, aged 16 or over, are there in the household including
you? And how many children? 32% 1 56% 2 9% 3 3% 4 0% 5 Q58 Could I just check how many adults, aged 16 or over, are there in the household including
you? And how many children? 66% 0 16% 1 17% 2 1% 3 0% 4 0% 5+ Q59 How many children are there in the household in each group? 0 1 2 3 4 5+ Less than 3 years 58% 39% 3% 0% 0% 0% 3-5years 62% 33% 6% 0% 0% 0% 6-15 years 48% 32% 21% 0% 0% 0% Q60 Gender of respondent: 46% Male 54% Female
Research Resource Dundee City Council 265

Q60 Age of respondent: 11% 16-24 25% 25-34 18% 35-44 17% 45-54 8% 55-59 5% 60-64 9% 65-74 7% 75+ 0% Refused HHCOMP HOUSEHOLD COMPOSITION 12% Single adult under 60 13% Single adult 60+ 22% Two adults under 60 7% Two adults aged 60+ 3% Two adults at least one over 60 7% Single adult with at least one child 25% Two adults and at least one child 9% Three or more adults with no children 3% Other Q61 How many motor vehicles does your household have access to for personal use? (this
includes motorbikes, mopeds, cars, vans etc) 46% 1 12% 2 0% 3 0% 4 or more 42% None Q62 Do you or any member of your household have a disability? 17% Yes 83% No Q63 What is the nature of the disability? 17% Mental health condition 83% Mobility/ physical disabilities 0% Learning difficulties (e.g. dyslexia) 6% Difficulties with sight 0% Learning disability (e.g. Downs Syndrome) 3% Developmental disorder (e.g. Autistic Spectrum Disorder or Asperger's syndrome) 3% Difficulties with hearing 0% Other condition (please write in) 0% Don't know 0% Refused
Research Resource Dundee City Council 266

Q64 Can you please look at this card and specify what is your religion? 61% None 16% Church of Scotland 20% Roman Catholic 2% Other Christian 0% Buddhist 0% Hindu 0% Jewish 0% Muslim 0% Sikh 0% Another religion (please specify) 0% Would rather not say Q65 Which of these groups on this card do you consider you belong to? 93% Scottish 1% Other British 0% Irish 0% Gypsy/ Traveller 5% Polish 1% Any other white ethnic group 0% Any mixed or multiple ethnic groups 0% Pakistani, Pakistani Scottish or Pakistani British 0% Indian, Indian Scottish or Indian British 0% Bangladeshi, Bangladeshi Scottish or Bangladeshi British 0% Chinese, Chinese Scottish ior Chinese British 0% Other 0% African, African Scottish or African British 0% Caribbean, Caribbean Scottish ior Caribbean British 0% Black, Black Scottish or Black British 0% Other 0% Arab 0% Any other background 0% Refused 0% Don't know Q66 Would you mind looking at the card and tell me which group your overall annual
household income falls. Please use net income from all sources i.e. after deductions of income tax. national insurance, and other compulsory deductions. Please take into account any money you may have from employment, including bonuses, overtime, pensions, state pensions, welfare benefits and interest from savings.
1% Less than £100 per week/ £5,199 per year 5% £100-199 per week / £5,200 - £10,399 per year 10% £200-299 per week / £10,400 - £15, 599 per year 12% £300-399 per week / £15,600 - £20,199 per year 11% £400-499 per week / £20,800 - £25,999 per year 7% £500-599 per week / £26,000 - £31,199 per year 5% £600 or more per week/ £31,200 or more per year 10% Don't know 40% Would rather not say
Research Resource Dundee City Council 267

Coldside and Maryfield
CITIZENS' SURVEY 2015 SQ1 Community Regeneration area: 0% Ardler, St Mary's and Kirkton 0% Beechwood, Lochee, Menziehill and Charleston 100% Coldside and Maryfield 0% Fintry, Whitfield and Mill O Mains 0% Mid Craigie, Linlathen and Douglas 0% None SQ2 Ward 0% West End 46% Maryfield 0% The Ferry 54% Coldside 0% Lochee 0% East End 0% North East 0% Strathmartine
Research Resource Dundee City Council 268

Q1 What do you like best about living in this neighbourhood? 0% Close to beach/ coast 0% Quality of housing 23% Close to shops/ quality of shops/ amenities 2% Always lived here/ familiar with/ know area 13% Pleasant/ nice area 26% Friendly people/ neighbours/ family and friends 38% Quiet/ peaceful 30% Convenient location 5% Central location 2% Other 1% None/ nothing 3% Don't know 0% Lots for kids to do 4% Lots of green/ open spaces/ countryside/ nice views 5% Safe 5% Good public transport 0% Everything 12% It's ok/ fine/ I like it here/ no problems Q2 What do you like least about living in this neighbourhood? 2% Littering/ dirty/ dog fouling 4% Difficult/ poor parking 5% Drug problems 3% Lack of facilities for youths/ children 1% ASB/ neighbours/ noisy 0% Youths/ gangs causing trouble 0% Poor shops 0% Vandalism 3% Other 75% None/ nothing 0% Lack of security 5% Don't know 1% Speeding cars/ traffic 1% Lack of transport/ poor public transport 4% Area going downhill/ untidy/ rundown 1% Roads/ pavements/ winter gritting/ snow clearing 0% Bin uplifts/ refuse collection 2% Too many private lets/ undesirables moving into the area 0% Too many stairs/ hills 0% Not much for people to do in general Q3 How long have you lived in this neighbourhood? 7% Up to one year 20% 1-2 years 21% 3-5 years 10% 6-10 years 36% Over 10 years 7% Always lived there 0% Don't know
Research Resource Dundee City Council 269

Q4 Could you please tell me if you think this neighbourhood has changed over the past 5 years, or since you've been living here if it's less than 5 years?
5% Yes - has got better 3% Yes - has got worse 70% No change 22% Don't know Q5better In what ways do you think it has changed? (GOT BETTER) 9% Access to parks/ open spaces 9% Better facilities/ amenities 0% Less vandalism 0% Housing improvements - new houses 0% Improved schools 0% Cleaner/ tidier/ less litter 0% Improved shops 0% Fewer drug problems 11% Friendliness of people/ neighbours 91% Quieter/ more peaceful 9% Other 0% Not sure 0% Less people hanging around street 0% Less crime 0% More young families in the area Q5worse Q5 In what ways do you think it has changed? (GOT WORSE) 0% Lack of parks/ open spaces 0% Overgrown gardens/ uncut grass 0% Poorer shops 0% More vandalism 52% Undesirable people moving in 0% Lack of facilities for youths/ children 17% ASB/ neighbours/ noisy 0% People/ neighbours less friendly 0% Youths/ gangs causing problems 66% Drug/ alcohol problems 14% Other 0% Not sure 0% More crime 0% People don't care about area 0% Too many private lets 14% Litter problems/ area is dirty 0% Area is rundown/ going downhill 0% More houses being built 0% Parking 0% Condition of roads/ pavements 0% More traffic/ motorbikes/ roads unsafe
Research Resource Dundee City Council 270

Q6 Thinking now about the neighbourhood you live in, how would you rate it as a place to live?
74% Very good 23% Fairly good 3% Fairly poor 0% Very poor 0% No opinion Q7 How long have you lived in this house/ flat? 8% Up to one year 20% 1-2 years 23% 3-5 years 13% 6-10 years 33% Over 10 years 3% Always lived here 0% Don't know Q8 Please tell me which of the descriptions on this card best describes your house/ flat? 16% Rented from the Council 13% Rented from a housing association 31% Rented from a private landlord 30% Owned by you (not ex Council) 10% Owned by you (ex Council) 0% Other (please specify) Q9 Overall, how do you rate the general condition of this (your) house/ flat? 69% Very good 28% Fairly good 4% Average 0% Fairly poor 0% Very poor 0% Don't know
Research Resource Dundee City Council 271

Q10 Looking at this card, please state how satisfied or dissatisfied you are with the following services and facilities in your local area?
Very Satisfied Fairly Satisfied Fairly Dissatisfied Very Dissatisfied Doesn't exist/ never used
Local Health services
78% 21% 0% 0% 1%
Police service 64% 26% 0% 0% 10% Fire service 65% 26% 0% 0% 10% Refuse collection 61% 38% 0% 0% 1% Local Schools 55% 23% 0% 0% 22% Social care/ social
work services 18% 15% 0% 0% 67%
Social housing 29% 28% 1% 4% 37% Employment and
advice services 20% 23% 5% 0% 52%
Public transport 75% 11% 8% 0% 5% Street cleaning 49% 49% 1% 0% 1% Sports and leisure
facilities 63% 22% 4% 0% 12%
Community centre/ library
66% 20% 2% 0% 13%
Parks and open spaces
85% 12% 2% 1% 1%
Local phone boxes 24% 22% 0% 0% 54% Local youth facilities 18% 28% 4% 0% 50% Local shops 89% 9% 2% 0% 0% Community Warden
Service 12% 18% 1% 1% 69%
Access to free cash machine/ auto teller
81% 13% 1% 1% 4%
Research Resource Dundee City Council 272

Q11 And, looking at this card, how easy is it for you to access those services and facilities in your local area?
Very easy Fairly easy Fairly difficult Very difficult Doesn't exist/ never used
Local Health services
69% 30% 0% 0% 1%
Police service 69% 28% 0% 0% 3% Fire service 69% 28% 0% 0% 3% Refuse collection 63% 35% 0% 0% 1% Local Schools 49% 14% 0% 0% 37% Social care/ social
work services 28% 11% 0% 0% 61%
Social housing 41% 16% 1% 1% 41% Employment and
advice services 31% 14% 1% 0% 54%
Public transport 80% 14% 0% 0% 6% Street cleaning 53% 46% 0% 0% 1% Sports and leisure
facilities 57% 16% 2% 0% 25%
Community centre/ library
65% 23% 0% 0% 12%
Parks and open spaces
73% 22% 1% 0% 5%
Local phone boxes 33% 11% 0% 1% 55% Local youth facilities 26% 11% 1% 0% 62% Local shops 92% 8% 0% 0% 0% Community Warden
Service 17% 10% 1% 0% 71%
Access to free cash machine/ auto teller
82% 11% 1% 1% 6%
Q12 Looking at this card, how satisfied are you with the following in this neighbourhood? Very satisfied Fairly satisfied Fairly dissatisfied Very dissatisfied Don't know Children's Play areas 20% 42% 5% 0% 32% Cleanliness of
Streets 40% 59% 1% 0% 0%
Shopping Facilities 85% 14% 2% 0% 0% Condition of roads,
pavements and street lighting
35% 43% 20% 2% 0%
Quality and maintenance of open spaces
56% 40% 4% 0% 0%
Cleanliness of the area around your home
60% 37% 4% 0% 0%
The built environment (e.g. buildings, heritage etc)
65% 35% 1% 0% 0%
The natural environment (e.g. parks, open spaces, countryside etc)
64% 32% 3% 0% 0%
Research Resource Dundee City Council 273

Q13 Overall, how satisfied are you with the quality of life in this neighbourhood? 64% Very satisfied 34% Satisfied 1% Dissatisfied 0% Very dissatisfied Q14 Overall, how satisfied are you with the quality of life in Dundee? 73% Very satisfied 26% Satisfied 1% Dissatisfied 0% Very dissatisfied Q15 Can you tell me firstly, if you are aware of any of these in this area? 48% After school/ children's club 17% Youth clubs/ projects or drop-in centres 24% Voluntary Youth Organisations 2% Youth Information Services 1% Other Youthwork activities 60% Organised Sporting activities/ classes/ clubs 56% Organised Social/ Leisure activities/ classes/ clubs 23% Learning groups or adult education classes 18% Self-help or social care groups 28% Community Festivals/ Events e.g. Gala Day 11% Community Council or Neighbourhood Group 2% Community Regeneration Forum or Group 8% Local Consultation Activities or Events 29% None
Research Resource Dundee City Council 274

Q15 And then, if you are aware, how often do you, or anyone living in your home, take part in activities like these?
Daily Weekly Monthly Seldom Never After school/
children's clubs 2% 16% 0% 11% 71%
Youth clubs/ projects or drop-in centres
0% 4% 0% 12% 84%
Voluntary Youth Organisations
0% 11% 0% 2% 87%
Youth Information Services
0% 28% 0% 0% 72%
Other Youthwork activities
0% 0% 0% 0% 100%
Organised Sporting activities/ classes/ clubs
0% 38% 4% 13% 45%
Organised Social/ Leisure activities/ classes/ clubs
0% 31% 5% 16% 48%
Learning groups or adult education classes
0% 7% 0% 2% 91%
Self-help or social care groups
0% 4% 0% 0% 96%
Community Festivals/ Events e.g. Gala Day
0% 0% 0% 71% 29%
Community Council or Neighbourhood Group
0% 4% 0% 0% 96%
Community Regeneration Forum or Group
0% 0% 0% 0% 100%
Local Consultation Activities or Events
0% 6% 0% 72% 21%
Q16 Q16 Thinking back over the last 12 months, have you given up any time to help any clubs,
charities, campaigns or organisations. I mean in an unpaid capacity. 9% Yes 91% No
Research Resource Dundee City Council 275

Q17 Looking at this showcard, can you tell me if you have undertaken any work or given unpaid help to any of these types of groups or organisations at any time in the past 12 months?
1% Children's group - e.g. playgroup, mothers and toddlers 0% School children e.g. school trips, sports days, discos, in the classroom 0% Youth groups/ children's activities outside of school 0% Coaching or organising sport or exercise 2% Church, religion or faith-based group 1% The elderly 0% Health disability or social welfare group or organisation 0% Local community group/ neighbourhood association/ community council 0% Tenants group/ residents association 0% Trade union activities 0% Public service - e.g. school, hospital, police, local government service 0% Professional society 0% Safety/ first aid 0% The environment/ animals 0% Justice/ human rights 0% Hobbies/ recreation/ arts/ social club 0% Citizens groups 0% Domestic animal welfare 0% Wildlife protection 0% Environmental protection 97% None Q18 In the last 12 months have you been to any of these events or places in Dundee? 54% Cinema 3% Exhibition including art, photography or crafts 0% Book festival or reading group 18% Theatre e.g. pantomime, musical or play 1% Street arts (art in everyday surroundings like streets, parks or shopping centre) 1% Culturally specific festival e.g. mela/ Feis/ local Gala days 1% Classical music performance or opera 29% Live music event e.g. traditional music, rock concert, jazz event 1% Dance show/ event e.g. ballet 15% Museum 2% Historical place e.g. castle, stately home and grounds, battle or archaeology site 9% Gallery 38% Library, including mobile or online 1% Archive or records office 15% None
Research Resource Dundee City Council 276

Q19 If you have not taken part in any community activities or organisations, can you tell me why this is?
5% It costs too much 5% I don't know enough about it 6% Never occurred to me 57% Not really interested 0% I don't have anyone to go with 4% I wouldn't enjoy it 0% Not enough facilities close to where I live 18% Health isn't good enough 0% I might feel uncomfortable or out of place 0% Lack of transport/ I can't easily get to it 0% Poor access to venues (e.g. no disabled ramps) 0% Not enough information on what is available 0% Didn't enjoy it last time 34% It's difficult to find the time 0% I would feel unsafe going to/ from the activity/ event 0% I would feel unsafe at the activity/ event 0% Other Q20 Please tell me to what extent you agree or disagree with the following statements? Strongly agree Tend to agree Neither agree
nor disagree Tend to disagree
Strongly disagree
No opinion
I can influence decisions affecting my local area
2% 25% 24% 25% 6% 18%
People in my community can influence decisions affecting my local area
3% 32% 26% 16% 4% 18%
Q21 First of all could you tell me whether you are registered with.... a GP or health centre? 99% Yes 1% No 0% Don't know Q21 First of all could you tell me whether you are registered with.... a dentist? 96% Yes 4% No 1% Don't know Q22 How good is your health overall? 49% Very good 38% Good 8% Fair 3% Poor 1% Very poor 0% Don't know
Research Resource Dundee City Council 277

Q23 In a typical week, how often do you undertake moderate physical activity for at least 30 minutes in a day?
18% 4 days a week or more 56% 1-3 days a week 12% Less than once a week 14% Never Q24 Are you, or have you ever been, a smoker? 28% Currently smoke 22% Used to smoke 50% Never smoked Q25 How often do you have (8 for men/ 6 for women) or more alcoholic drinks on one
occasion? 3% Daily or almost daily 27% Weekly 14% Monthly 21% Less than monthly 35% Never 0% Don't know Q26 Please say which option best describes your experience over the last 2 weeks. None of the time Rarely Some of the time Often All of the time I've been feeling
optimistic about the future
0% 5% 32% 57% 6%
I've been feeling useful
0% 1% 24% 69% 6%
I've been feeling relaxed
0% 1% 31% 67% 2%
I've been feeling interested in other people
0% 1% 25% 72% 2%
I've had energy to spare
0% 2% 30% 65% 3%
I've been dealing well with problems
0% 0% 15% 66% 18%
I've been thinking clearly
0% 0% 14% 66% 20%
I've been feeling good about myself
0% 1% 27% 56% 16%
I've been feeling close to other people
0% 0% 14% 60% 26%
I've been feeling confident
0% 0% 15% 68% 17%
I've been able to make up my mind about things
0% 0% 11% 55% 33%
I've been feeling loved
0% 0% 12% 65% 23%
I've been interested in new things
0% 1% 20% 75% 3%
I've been feeling cheerful
0% 0% 16% 81% 4%
Research Resource Dundee City Council 278

Q27 On a scale of 1 to 6 where 1 is not at all and 6 is a great deal, to what extent do you feel that people treat you unfairly?
70% 1 - Not at all 25% 2 4% 3 0% 4 0% 5 0% 6 - A great deal 0% Don't know Q28 To what extent do you agree with the statement "I could turn to friends/ relatives in this
neighbourhood for support? 58% Strongly agree 35% Tend to agree 1% Tend to disagree 0% Strongly disagree 7% Don't know Q29 Are you currently taking part in any of these forms of education/ classes of training? 95% None 1% On the job training 0% An FE college course 3% A university based course 0% Distance learning/ Open University 1% School 0% Adult education or evening class 0% Help with reading, writing or use of numbers 0% Other Q30 What type of qualification, if any, will this lead to. Would it lead to... 18% No qualification 57% A qualification at degree level or above 26% Another qualification Q31 Taking everything into account how safe do you feel your neighbourhood is as a place to
live? 73% Very safe 27% Fairly safe 0% A bit unsafe 0% Very unsafe 0% Don't know Q32 How safe do you feel when... Very safe Fairly safe A bit unsafe Very unsafe Don't know Alone in your home
during the day 92% 8% 0% 0% 0%
Alone in your home at night
92% 8% 0% 0% 0%
Walking alone in your neighbourhood during the day
91% 8% 0% 0% 0%
Walking alone in your neighbourhood after dark
55% 30% 5% 0% 10%
Research Resource Dundee City Council 279

Q33 Do you think that the amount of crime in your neighbourhood has increased or decreased
over the past year? 0% Decreased a lot 5% Decreased a little 75% Remained the same 3% Increased a little 0% Increased a lot 17% Don't know Q34 If you feel crime has increased in your neighbourhood, what has influenced your option? 0% Personal experience of crime 0% Experience of family or friends 100% Talking to people in the area 0% Media - television, radio, paper 0% Social media internet sites e.g. Facebook, Twitter 0% Internet sites 0% Police or Council publications 0% Other Q35 What, in your opinion, is the main factor which contributes most to the level of crime in
your neighbourhood? 3% Boredom/ nothing to do/ lack of facilities 45% Don't know 0% Driving offences/ speeding/ motorbikes 1% Immigrants 35% Alcohol/ Drugs 2% Nothing 0% Lack of money/ poverty 1% Unemployment 0% Prostitution 0% New people/ undesirables moving into area/ not knowing who your neighbours are 0% Anti social behaviour 2% Crime e.g. Break ins/ burglary/ vandalism 10% This is a good area/ neighbourhood/ quiet/ no trouble 0% Lack of discipline/ parental control 0% Opportunists/ some people can't help themselves 0% Lack of policing/ wardens 1% Other 5% Gangs/ youths Q36 To what extent, if it all, does a fear of crime prevent you from taking part in your every day
activities? 96% Not at all 4% A little 0% Quite a lot 0% A great deal 0% Don't know
Research Resource Dundee City Council 280

Q37 Which of these accounts, if any, do you or your partner have? 97% Bank account 19% Building society account 4% Credit union account 2% Post Office card account 0% No, none of these 0% Prefer not to say Q38 Do you have insurance for the contents of your house such as for furniture, electrical
goods etc? 71% Yes 23% No 2% Prefer not to say 4% Don't know Q39 Think about the total value of any savings or investments you have, at the moment do
you (or your partner) have total savings or investments worth £1,000 or more in any combination of the places mentioned on this card, do you have less than £1,000 in savings or investments or do you have no savings or investments at all?
26% No savings 11% Less than £1,000 28% £1,000 or more 2% Don't know 33% Prefer not to say Q40 Are you currently experiencing, or within the last year have you had any difficulties with
the following? 7% Mortgage or rent payments 5% Changes to benefits 1% Council tax payments 5% Loan or credit card payments 10% Cost of food 22% Cost of domestic energy bills 0% Vehicle fuel prices 74% None of the above 0% Prefer not to say Q41 Taking everything together, which of these phrases on this card best describes how you
and your household are managing financially these days? 26% Manage very well 45% Manage quite well 21% Get by all right 4% Don't manage very well 4% Have some deep financial difficulties 0% Are in deep financial trouble 0% Refused 0% Don't know
Research Resource Dundee City Council 281

Q42 When you last contacted Dundee City Council, was this contact to ...? 1% Make a complaint 18% Seek information 25% Request a service 1% Make a suggestion 56% Have never contacted with Council Q43 Overall, how satisfied were you that the Council responded reasonably to your
complaint? 70% Very satisfied 0% Satisfied 0% Neither satisfied nor dissatisfied 30% Dissatisfied 0% Very dissatisfied Q44 Overall, how satisfied were you with this contact to seek information? 33% Very satisfied 47% Satisfied 21% Neither satisfied nor dissatisfied 0% Dissatisfied 0% Very dissatisfied Q45 Overall, how satisfied were you with this contact to request a service? 60% Very satisfied 38% Satisfied 0% Neither satisfied nor dissatisfied 2% Dissatisfied 0% Very dissatisfied Q46 On your most recent contact with the Council, did you.... 82% Get what you need at that contact 18% Have to contact the Council again about the same issue Q47 Was your most recent contact .... 0% By a letter 77% By a telephone call to the Council 8% By a personal visit to a Council office 1% By e-mail 14% By visiting the Council's website
Research Resource Dundee City Council 282

Q48 How satisfied or dissatisfied were you with your recent contact with the Council by telephone in terms of the following?
Very satisfied Fairly satisfied Neither nor Fairly dissatisfied
Very dissatisfied
Don't know
How easy it was for you to find the right number to call
84% 16% 0% 0% 0% 0%
How quickly the phone was answered
84% 16% 0% 0% 0% 0%
How easy it was to get through to someone who could help
84% 16% 0% 0% 0% 0%
Overall helpfulness/ friendliness/ courtesy of the staff you dealt with
84% 16% 0% 0% 0% 0%
How well the staff understood what you wanted
84% 16% 0% 0% 0% 0%
The outcome of your contact
81% 13% 3% 2% 1% 0%
Q49 How satisfied or dissatisfied were you with your recent contact when visiting a Council
office in terms of the following? Very satisfied Fairly satisfied Neither nor Fairly
dissatisfied Very
dissatisfied Don't know
How easy it was to get to the office
100% 0% 0% 0% 0% 0%
The suitability of the office e.g. waiting areas, privacy, access for disabled people etc
87% 13% 0% 0% 0% 0%
Overall helpfulness/ friendliness/ courtesy of the staff you dealt with
87% 13% 0% 0% 0% 0%
How well the staff understood what you wanted
87% 13% 0% 0% 0% 0%
The outcome of your contact
33% 28% 26% 13% 0% 0%
Q50 How satisfied or dissatisfied were you with your most recent cpntact with the Council by
email/ letter in terms of the following? Very satisfied Fairly satisfied Neither nor Fairly
dissatisfied Very
dissatisfied Don't know
How quickly you received a reply to your email/ letter
0% 100% 0% 0% 0% 0%
The extent to which the first reply you received answered your query
100% 0% 0% 0% 0% 0%
The outcome of your contact
100% 0% 0% 0% 0% 0%
Research Resource Dundee City Council 283

Q51 Have you ever used the Council's website? 41% Yes 59% No Q52 How satisfied or dissatisfied would you say you are with the website in terms of the
following? Very
satisfied Fairly
satisfied Neither nor Fairly
dissatisfied Very
dissatisfied Don't know Not
applicable How easily you
managed to find the information you wanted
64% 36% 0% 0% 0% 0% 0%
The amount of information provided on the website
64% 36% 0% 0% 0% 0% 0%
Q53 Generally, do you feel that you receive enough information about the Council and the
services it provides? 86% Yes 14% No Q54 Do you access, and use, the internet in any of the following ways... 70% Internet access at home 54% Internet access via a mobile phone 23% Internet access at work 5% Internet access through public access e.g. at library 4% Access the internet in some other way 17% None of these - I do not access the internet Q55 Do you know that the Council have procedures in place to respond to situations where
vulnerable adults might be at risk of harm? 46% Yes 54% No Q55 Would you know who to contact if you had concerns that a vulnerable adult was at risk of
being abused? 64% Yes 36% No Q56 I am going to read out a list of statements about your local Council and would like you to
tell me which 3 are of the most importance to you. Dundee City Council/ Angus Council... 45% Offering a good range of services 43% Providing an efficient service 44% Providing services which are value for money 44% Providing good quality services 15% Having friendly, polite, helpful, well informed employees 10% Promoting its services well 55% Tackling important issues for the future of the area 28% Listening to complaints 6% Communicating well with the public 12% Ensuring sustainable use of resources and care for the environment 0% Don't know
Research Resource Dundee City Council 284
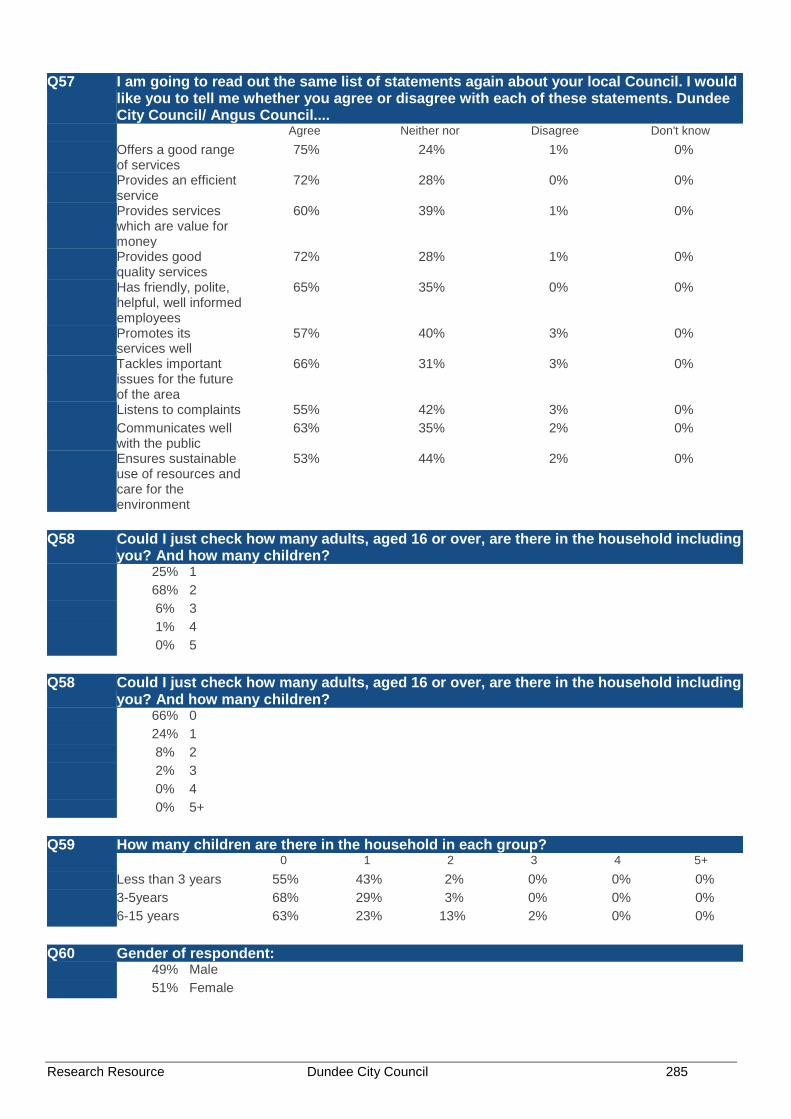
Q57 I am going to read out the same list of statements again about your local Council. I would like you to tell me whether you agree or disagree with each of these statements. Dundee City Council/ Angus Council....
Agree Neither nor Disagree Don't know Offers a good range
of services 75% 24% 1% 0%
Provides an efficient service
72% 28% 0% 0%
Provides services which are value for money
60% 39% 1% 0%
Provides good quality services
72% 28% 1% 0%
Has friendly, polite, helpful, well informed employees
65% 35% 0% 0%
Promotes its services well
57% 40% 3% 0%
Tackles important issues for the future of the area
66% 31% 3% 0%
Listens to complaints 55% 42% 3% 0% Communicates well
with the public 63% 35% 2% 0%
Ensures sustainable use of resources and care for the environment
53% 44% 2% 0%
Q58 Could I just check how many adults, aged 16 or over, are there in the household including
you? And how many children? 25% 1 68% 2 6% 3 1% 4 0% 5 Q58 Could I just check how many adults, aged 16 or over, are there in the household including
you? And how many children? 66% 0 24% 1 8% 2 2% 3 0% 4 0% 5+ Q59 How many children are there in the household in each group? 0 1 2 3 4 5+ Less than 3 years 55% 43% 2% 0% 0% 0% 3-5years 68% 29% 3% 0% 0% 0% 6-15 years 63% 23% 13% 2% 0% 0% Q60 Gender of respondent: 49% Male 51% Female
Research Resource Dundee City Council 285

Q60 Age of respondent: 12% 16-24 34% 25-34 14% 35-44 11% 45-54 6% 55-59 6% 60-64 12% 65-74 6% 75+ 0% Refused HHCOMP HOUSEHOLD COMPOSITION 13% Single adult under 60 7% Single adult 60+ 22% Two adults under 60 13% Two adults aged 60+ 4% Two adults at least one over 60 5% Single adult with at least one child 28% Two adults and at least one child 6% Three or more adults with no children 1% Other Q61 How many motor vehicles does your household have access to for personal use? (this
includes motorbikes, mopeds, cars, vans etc) 53% 1 12% 2 1% 3 0% 4 or more 34% None Q62 Do you or any member of your household have a disability? 14% Yes 86% No Q63 What is the nature of the disability? 3% Mental health condition 78% Mobility/ physical disabilities 3% Learning difficulties (e.g. dyslexia) 0% Difficulties with sight 0% Learning disability (e.g. Downs Syndrome) 0% Developmental disorder (e.g. Autistic Spectrum Disorder or Asperger's syndrome) 3% Difficulties with hearing 12% Other condition (please write in) 0% Don't know 0% Refused
Research Resource Dundee City Council 286

Q64 Can you please look at this card and specify what is your religion? 56% None 24% Church of Scotland 17% Roman Catholic 1% Other Christian 0% Buddhist 0% Hindu 0% Jewish 2% Muslim 0% Sikh 0% Another religion (please specify) 1% Would rather not say Q65 Which of these groups on this card do you consider you belong to? 85% Scottish 5% Other British 1% Irish 0% Gypsy/ Traveller 6% Polish 1% Any other white ethnic group 0% Any mixed or multiple ethnic groups 1% Pakistani, Pakistani Scottish or Pakistani British 1% Indian, Indian Scottish or Indian British 0% Bangladeshi, Bangladeshi Scottish or Bangladeshi British 1% Chinese, Chinese Scottish ior Chinese British 0% Other 0% African, African Scottish or African British 0% Caribbean, Caribbean Scottish ior Caribbean British 0% Black, Black Scottish or Black British 0% Other 0% Arab 0% Any other background 0% Refused 0% Don't know Q66 Would you mind looking at the card and tell me which group your overall annual
household income falls. Please use net income from all sources i.e. after deductions of income tax. national insurance, and other compulsory deductions. Please take into account any money you may have from employment, including bonuses, overtime, pensions, state pensions, welfare benefits and interest from savings.
3% Less than £100 per week/ £5,199 per year 5% £100-199 per week / £5,200 - £10,399 per year 7% £200-299 per week / £10,400 - £15, 599 per year 7% £300-399 per week / £15,600 - £20,199 per year 13% £400-499 per week / £20,800 - £25,999 per year 8% £500-599 per week / £26,000 - £31,199 per year 11% £600 or more per week/ £31,200 or more per year 12% Don't know 34% Would rather not say
Research Resource Dundee City Council 287

Fintry, Whitfield and Mill O Mains
CITIZENS' SURVEY 2015
SQ1 Community Regeneration area: 0% Ardler, St Mary's and Kirkton 0% Beechwood, Lochee, Menziehill and Charleston 0% Coldside and Maryfield 100% Fintry, Whitfield and Mill O Mains 0% Mid Craigie, Linlathen and Douglas 0% None SQ2 Ward 0% West End 0% Maryfield 0% The Ferry 0% Coldside 1% Lochee 1% East End 98% North East 0% Strathmartine
Research Resource Dundee City Council 288

Q1 What do you like best about living in this neighbourhood? 0% Close to beach/ coast 1% Quality of housing 12% Close to shops/ quality of shops/ amenities 7% Always lived here/ familiar with/ know area 14% Pleasant/ nice area 40% Friendly people/ neighbours/ family and friends 51% Quiet/ peaceful 10% Convenient location 0% Central location 2% Other 1% None/ nothing 4% Don't know 3% Lots for kids to do 2% Lots of green/ open spaces/ countryside/ nice views 3% Safe 5% Good public transport 0% Everything 12% It's ok/ fine/ I like it here/ no problems Q2 What do you like least about living in this neighbourhood? 3% Littering/ dirty/ dog fouling 0% Difficult/ poor parking 4% Drug problems 1% Lack of facilities for youths/ children 1% ASB/ neighbours/ noisy 1% Youths/ gangs causing trouble 4% Poor shops 1% Vandalism 1% Other 73% None/ nothing 0% Lack of security 8% Don't know 0% Speeding cars/ traffic 1% Lack of transport/ poor public transport 1% Area going downhill/ untidy/ rundown 1% Roads/ pavements/ winter gritting/ snow clearing 0% Bin uplifts/ refuse collection 1% Too many private lets/ undesirables moving into the area 0% Too many stairs/ hills 1% Not much for people to do in general Q3 How long have you lived in this neighbourhood? 5% Up to one year 9% 1-2 years 14% 3-5 years 18% 6-10 years 36% Over 10 years 18% Always lived there 0% Don't know
Research Resource Dundee City Council 289

Q4 Could you please tell me if you think this neighbourhood has changed over the past 5 years, or since you've been living here if it's less than 5 years?
9% Yes - has got better 3% Yes - has got worse 69% No change 19% Don't know Q5better In what ways do you think it has changed? (GOT BETTER) 15% Access to parks/ open spaces 14% Better facilities/ amenities 0% Less vandalism 28% Housing improvements - new houses 0% Improved schools 0% Cleaner/ tidier/ less litter 0% Improved shops 14% Fewer drug problems 7% Friendliness of people/ neighbours 22% Quieter/ more peaceful 21% Other 0% Not sure 0% Less people hanging around street 0% Less crime 0% More young families in the area Q5worse Q5 In what ways do you think it has changed? (GOT WORSE) 0% Lack of parks/ open spaces 0% Overgrown gardens/ uncut grass 20% Poorer shops 0% More vandalism 19% Undesirable people moving in 0% Lack of facilities for youths/ children 0% ASB/ neighbours/ noisy 0% People/ neighbours less friendly 20% Youths/ gangs causing problems 41% Drug/ alcohol problems 19% Other 0% Not sure 0% More crime 0% People don't care about area 0% Too many private lets 0% Litter problems/ area is dirty 0% Area is rundown/ going downhill 0% More houses being built 0% Parking 0% Condition of roads/ pavements 0% More traffic/ motorbikes/ roads unsafe
Research Resource Dundee City Council 290

Q6 Thinking now about the neighbourhood you live in, how would you rate it as a place to live?
74% Very good 24% Fairly good 1% Fairly poor 0% Very poor 0% No opinion Q7 How long have you lived in this house/ flat? 6% Up to one year 10% 1-2 years 16% 3-5 years 18% 6-10 years 43% Over 10 years 6% Always lived here 0% Don't know Q8 Please tell me which of the descriptions on this card best describes your house/ flat? 25% Rented from the Council 31% Rented from a housing association 8% Rented from a private landlord 19% Owned by you (not ex Council) 17% Owned by you (ex Council) 0% Other (please specify) Q9 Overall, how do you rate the general condition of this (your) house/ flat? 74% Very good 26% Fairly good 1% Average 0% Fairly poor 0% Very poor 0% Don't know
Research Resource Dundee City Council 291

Q10 Looking at this card, please state how satisfied or dissatisfied you are with the following services and facilities in your local area?
Very Satisfied Fairly Satisfied Fairly Dissatisfied Very Dissatisfied Doesn't exist/ never used
Local Health services
73% 26% 1% 0% 0%
Police service 64% 29% 1% 1% 6% Fire service 60% 31% 0% 0% 9% Refuse collection 68% 29% 1% 0% 2% Local Schools 64% 23% 1% 1% 12% Social care/ social
work services 13% 8% 1% 0% 78%
Social housing 44% 34% 1% 0% 21% Employment and
advice services 8% 27% 2% 0% 62%
Public transport 65% 29% 2% 0% 4% Street cleaning 45% 52% 1% 0% 1% Sports and leisure
facilities 63% 26% 3% 0% 7%
Community centre/ library
52% 37% 1% 0% 11%
Parks and open spaces
85% 10% 2% 0% 2%
Local phone boxes 19% 7% 1% 0% 73% Local youth facilities 19% 31% 9% 2% 39% Local shops 49% 27% 19% 4% 0% Community Warden
Service 22% 35% 1% 1% 40%
Access to free cash machine/ auto teller
50% 42% 6% 1% 1%
Research Resource Dundee City Council 292

Q11 And, looking at this card, how easy is it for you to access those services and facilities in your local area?
Very easy Fairly easy Fairly difficult Very difficult Doesn't exist/ never used
Local Health services
50% 49% 1% 0% 0%
Police service 57% 42% 0% 0% 1% Fire service 57% 42% 0% 0% 1% Refuse collection 62% 38% 0% 0% 0% Local Schools 50% 30% 0% 0% 20% Social care/ social
work services 25% 3% 0% 0% 72%
Social housing 53% 17% 0% 0% 30% Employment and
advice services 26% 5% 0% 0% 69%
Public transport 67% 32% 0% 0% 1% Street cleaning 48% 50% 0% 0% 2% Sports and leisure
facilities 52% 29% 2% 0% 17%
Community centre/ library
63% 31% 0% 0% 6%
Parks and open spaces
76% 23% 0% 0% 1%
Local phone boxes 29% 3% 0% 0% 68% Local youth facilities 35% 16% 1% 0% 47% Local shops 53% 40% 1% 0% 6% Community Warden
Service 34% 28% 1% 0% 37%
Access to free cash machine/ auto teller
52% 43% 3% 0% 1%
Q12 Looking at this card, how satisfied are you with the following in this neighbourhood? Very satisfied Fairly satisfied Fairly dissatisfied Very dissatisfied Don't know Children's Play areas 23% 53% 6% 0% 19% Cleanliness of
Streets 23% 74% 3% 0% 0%
Shopping Facilities 43% 35% 19% 3% 0% Condition of roads,
pavements and street lighting
23% 56% 21% 0% 0%
Quality and maintenance of open spaces
40% 60% 0% 0% 0%
Cleanliness of the area around your home
37% 61% 2% 0% 0%
The built environment (e.g. buildings, heritage etc)
50% 50% 0% 0% 0%
The natural environment (e.g. parks, open spaces, countryside etc)
60% 39% 1% 0% 0%
Research Resource Dundee City Council 293

Q13 Overall, how satisfied are you with the quality of life in this neighbourhood? 77% Very satisfied 22% Satisfied 1% Dissatisfied 0% Very dissatisfied Q14 Overall, how satisfied are you with the quality of life in Dundee? 86% Very satisfied 14% Satisfied 0% Dissatisfied 0% Very dissatisfied Q15 Can you tell me firstly, if you are aware of any of these in this area? 57% After school/ children's club 15% Youth clubs/ projects or drop-in centres 28% Voluntary Youth Organisations 5% Youth Information Services 6% Other Youthwork activities 74% Organised Sporting activities/ classes/ clubs 54% Organised Social/ Leisure activities/ classes/ clubs 26% Learning groups or adult education classes 12% Self-help or social care groups 33% Community Festivals/ Events e.g. Gala Day 25% Community Council or Neighbourhood Group 10% Community Regeneration Forum or Group 11% Local Consultation Activities or Events 7% None
Research Resource Dundee City Council 294

Q15 And then, if you are aware, how often do you, or anyone living in your home, take part in activities like these?
Daily Weekly Monthly Seldom Never After school/
children's clubs 0% 20% 0% 15% 65%
Youth clubs/ projects or drop-in centres
0% 12% 0% 0% 88%
Voluntary Youth Organisations
0% 21% 0% 0% 79%
Youth Information Services
0% 13% 0% 0% 87%
Other Youthwork activities
0% 33% 0% 11% 56%
Organised Sporting activities/ classes/ clubs
0% 53% 0% 8% 39%
Organised Social/ Leisure activities/ classes/ clubs
0% 33% 0% 10% 57%
Learning groups or adult education classes
0% 0% 0% 2% 98%
Self-help or social care groups
0% 0% 0% 0% 100%
Community Festivals/ Events e.g. Gala Day
0% 0% 0% 79% 21%
Community Council or Neighbourhood Group
0% 3% 0% 3% 95%
Community Regeneration Forum or Group
0% 0% 0% 0% 100%
Local Consultation Activities or Events
0% 0% 0% 23% 77%
Q16 Q16 Thinking back over the last 12 months, have you given up any time to help any clubs,
charities, campaigns or organisations. I mean in an unpaid capacity. 8% Yes 92% No
Research Resource Dundee City Council 295

Q17 Looking at this showcard, can you tell me if you have undertaken any work or given unpaid help to any of these types of groups or organisations at any time in the past 12 months?
0% Children's group - e.g. playgroup, mothers and toddlers 1% School children e.g. school trips, sports days, discos, in the classroom 0% Youth groups/ children's activities outside of school 0% Coaching or organising sport or exercise 0% Church, religion or faith-based group 0% The elderly 0% Health disability or social welfare group or organisation 0% Local community group/ neighbourhood association/ community council 0% Tenants group/ residents association 0% Trade union activities 0% Public service - e.g. school, hospital, police, local government service 0% Professional society 0% Safety/ first aid 0% The environment/ animals 0% Justice/ human rights 0% Hobbies/ recreation/ arts/ social club 0% Citizens groups 0% Domestic animal welfare 0% Wildlife protection 1% Environmental protection 99% None Q18 In the last 12 months have you been to any of these events or places in Dundee? 62% Cinema 1% Exhibition including art, photography or crafts 1% Book festival or reading group 16% Theatre e.g. pantomime, musical or play 0% Street arts (art in everyday surroundings like streets, parks or shopping centre) 1% Culturally specific festival e.g. mela/ Feis/ local Gala days 0% Classical music performance or opera 34% Live music event e.g. traditional music, rock concert, jazz event 4% Dance show/ event e.g. ballet 17% Museum 1% Historical place e.g. castle, stately home and grounds, battle or archaeology site 5% Gallery 53% Library, including mobile or online 0% Archive or records office 17% None
Research Resource Dundee City Council 296

Q19 If you have not taken part in any community activities or organisations, can you tell me why this is?
0% It costs too much 0% I don't know enough about it 18% Never occurred to me 64% Not really interested 12% I don't have anyone to go with 0% I wouldn't enjoy it 0% Not enough facilities close to where I live 15% Health isn't good enough 0% I might feel uncomfortable or out of place 0% Lack of transport/ I can't easily get to it 0% Poor access to venues (e.g. no disabled ramps) 0% Not enough information on what is available 0% Didn't enjoy it last time 12% It's difficult to find the time 0% I would feel unsafe going to/ from the activity/ event 0% I would feel unsafe at the activity/ event 0% Other Q20 Please tell me to what extent you agree or disagree with the following statements? Strongly agree Tend to agree Neither agree
nor disagree Tend to disagree
Strongly disagree
No opinion
I can influence decisions affecting my local area
3% 31% 20% 30% 1% 14%
People in my community can influence decisions affecting my local area
3% 39% 20% 26% 1% 11%
Q21 First of all could you tell me whether you are registered with.... a GP or health centre? 99% Yes 1% No 0% Don't know Q21 First of all could you tell me whether you are registered with.... a dentist? 95% Yes 5% No 0% Don't know Q22 How good is your health overall? 71% Very good 22% Good 5% Fair 2% Poor 0% Very poor 0% Don't know
Research Resource Dundee City Council 297

Q23 In a typical week, how often do you undertake moderate physical activity for at least 30 minutes in a day?
17% 4 days a week or more 68% 1-3 days a week 5% Less than once a week 10% Never Q24 Are you, or have you ever been, a smoker? 26% Currently smoke 21% Used to smoke 53% Never smoked Q25 How often do you have (8 for men/ 6 for women) or more alcoholic drinks on one
occasion? 1% Daily or almost daily 11% Weekly 9% Monthly 23% Less than monthly 56% Never 0% Don't know Q26 Please say which option best describes your experience over the last 2 weeks. None of the time Rarely Some of the time Often All of the time I've been feeling
optimistic about the future
0% 1% 31% 58% 10%
I've been feeling useful
0% 0% 30% 62% 8%
I've been feeling relaxed
0% 0% 34% 63% 3%
I've been feeling interested in other people
0% 0% 27% 69% 3%
I've had energy to spare
0% 3% 32% 62% 3%
I've been dealing well with problems
0% 0% 13% 68% 18%
I've been thinking clearly
0% 0% 11% 66% 23%
I've been feeling good about myself
0% 0% 15% 64% 21%
I've been feeling close to other people
0% 0% 10% 68% 23%
I've been feeling confident
0% 0% 9% 70% 21%
I've been able to make up my mind about things
0% 0% 10% 63% 27%
I've been feeling loved
0% 0% 15% 65% 21%
I've been interested in new things
0% 1% 19% 73% 6%
I've been feeling cheerful
0% 0% 8% 84% 8%
Research Resource Dundee City Council 298

Q27 On a scale of 1 to 6 where 1 is not at all and 6 is a great deal, to what extent do you feel that people treat you unfairly?
74% 1 - Not at all 24% 2 1% 3 0% 4 0% 5 0% 6 - A great deal 1% Don't know Q28 To what extent do you agree with the statement "I could turn to friends/ relatives in this
neighbourhood for support? 74% Strongly agree 25% Tend to agree 0% Tend to disagree 0% Strongly disagree 1% Don't know Q29 Are you currently taking part in any of these forms of education/ classes of training? 95% None 1% On the job training 1% An FE college course 0% A university based course 0% Distance learning/ Open University 2% School 1% Adult education or evening class 0% Help with reading, writing or use of numbers 0% Other Q30 What type of qualification, if any, will this lead to. Would it lead to... 0% No qualification 0% A qualification at degree level or above 100% Another qualification Q31 Taking everything into account how safe do you feel your neighbourhood is as a place to
live? 91% Very safe 9% Fairly safe 0% A bit unsafe 0% Very unsafe 0% Don't know Q32 How safe do you feel when... Very safe Fairly safe A bit unsafe Very unsafe Don't know Alone in your home
during the day 96% 4% 0% 0% 0%
Alone in your home at night
96% 4% 0% 0% 0%
Walking alone in your neighbourhood during the day
95% 5% 0% 0% 0%
Walking alone in your neighbourhood after dark
58% 35% 1% 0% 5%
Research Resource Dundee City Council 299

Q33 Do you think that the amount of crime in your neighbourhood has increased or decreased
over the past year? 0% Decreased a lot 8% Decreased a little 72% Remained the same 4% Increased a little 1% Increased a lot 16% Don't know Q34 If you feel crime has increased in your neighbourhood, what has influenced your option? 0% Personal experience of crime 14% Experience of family or friends 100% Talking to people in the area 0% Media - television, radio, paper 43% Social media internet sites e.g. Facebook, Twitter 14% Internet sites 0% Police or Council publications 0% Other Q35 What, in your opinion, is the main factor which contributes most to the level of crime in
your neighbourhood? 3% Boredom/ nothing to do/ lack of facilities 35% Don't know 0% Driving offences/ speeding/ motorbikes 1% Immigrants 45% Alcohol/ Drugs 2% Nothing 0% Lack of money/ poverty 1% Unemployment 0% Prostitution 1% New people/ undesirables moving into area/ not knowing who your neighbours are 0% Anti social behaviour 1% Crime e.g. Break ins/ burglary/ vandalism 13% This is a good area/ neighbourhood/ quiet/ no trouble 0% Lack of discipline/ parental control 0% Opportunists/ some people can't help themselves 0% Lack of policing/ wardens 1% Other 4% Gangs/ youths Q36 To what extent, if it all, does a fear of crime prevent you from taking part in your every day
activities? 97% Not at all 3% A little 0% Quite a lot 0% A great deal 1% Don't know
Research Resource Dundee City Council 300

Q37 Which of these accounts, if any, do you or your partner have?
100% Bank account
9% Building society account 7% Credit union account 1% Post Office card account 0% No, none of these 0% Prefer not to say Q38 Do you have insurance for the contents of your house such as for furniture, electrical
goods etc? 75% Yes 22% No 2% Prefer not to say 1% Don't know Q39 Think about the total value of any savings or investments you have, at the moment do
you (or your partner) have total savings or investments worth £1,000 or more in any combination of the places mentioned on this card, do you have less than £1,000 in savings or investments or do you have no savings or investments at all?
34% No savings 11% Less than £1,000 11% £1,000 or more 0% Don't know 44% Prefer not to say Q40 Are you currently experiencing, or within the last year have you had any difficulties with
the following? 1% Mortgage or rent payments 1% Changes to benefits 1% Council tax payments 1% Loan or credit card payments 5% Cost of food 20% Cost of domestic energy bills 2% Vehicle fuel prices 77% None of the above 1% Prefer not to say Q41 Taking everything together, which of these phrases on this card best describes how you
and your household are managing financially these days? 2% Manage very well 57% Manage quite well 40% Get by all right 0% Don't manage very well 1% Have some deep financial difficulties 0% Are in deep financial trouble 0% Refused 0% Don't know
Research Resource Dundee City Council 301

Q42 When you last contacted Dundee City Council, was this contact to ...? 2% Make a complaint 6% Seek information 37% Request a service 0% Make a suggestion 55% Have never contacted with Council Q43 Overall, how satisfied were you that the Council responded reasonably to your
complaint? 0% Very satisfied 66% Satisfied 34% Neither satisfied nor dissatisfied 0% Dissatisfied 0% Very dissatisfied Q44 Overall, how satisfied were you with this contact to seek information? 49% Very satisfied 51% Satisfied 0% Neither satisfied nor dissatisfied 0% Dissatisfied 0% Very dissatisfied Q45 Overall, how satisfied were you with this contact to request a service? 84% Very satisfied 16% Satisfied 0% Neither satisfied nor dissatisfied 0% Dissatisfied 0% Very dissatisfied Q46 On your most recent contact with the Council, did you.... 94% Get what you need at that contact 6% Have to contact the Council again about the same issue Q47 Was your most recent contact .... 0% By a letter 94% By a telephone call to the Council 3% By a personal visit to a Council office 0% By e-mail 3% By visiting the Council's website
Research Resource Dundee City Council 302

Q48 How satisfied or dissatisfied were you with your recent contact with the Council by telephone in terms of the following?
Very satisfied Fairly satisfied Neither nor Fairly dissatisfied
Very dissatisfied
Don't know
How easy it was for you to find the right number to call
86% 14% 0% 0% 0% 0%
How quickly the phone was answered
85% 15% 0% 0% 0% 0%
How easy it was to get through to someone who could help
79% 21% 0% 0% 0% 0%
Overall helpfulness/ friendliness/ courtesy of the staff you dealt with
80% 20% 0% 0% 0% 0%
How well the staff understood what you wanted
82% 18% 0% 0% 0% 0%
The outcome of your contact
80% 17% 2% 2% 0% 0%
Q49 How satisfied or dissatisfied were you with your recent contact when visiting a Council
office in terms of the following? Very satisfied Fairly satisfied Neither nor Fairly
dissatisfied Very
dissatisfied Don't know
How easy it was to get to the office
100% 0% 0% 0% 0% 0%
The suitability of the office e.g. waiting areas, privacy, access for disabled people etc
100% 0% 0% 0% 0% 0%
Overall helpfulness/ friendliness/ courtesy of the staff you dealt with
100% 0% 0% 0% 0% 0%
How well the staff understood what you wanted
100% 0% 0% 0% 0% 0%
The outcome of your contact
50% 50% 0% 0% 0% 0%
Q50 How satisfied or dissatisfied were you with your most recent cpntact with the Council by
email/ letter in terms of the following? Very satisfied Fairly satisfied Neither nor Fairly
dissatisfied Very
dissatisfied Don't know
How quickly you received a reply to your email/ letter
0% 0% 0% 0% 0% 0%
The extent to which the first reply you received answered your query
0% 0% 0% 0% 0% 0%
The outcome of your contact
0% 0% 0% 0% 0% 0%
Research Resource Dundee City Council 303

Q51 Have you ever used the Council's website? 54% Yes 46% No Q52 How satisfied or dissatisfied would you say you are with the website in terms of the
following? Very
satisfied Fairly
satisfied Neither nor Fairly
dissatisfied Very
dissatisfied Don't know Not
applicable How easily you
managed to find the information you wanted
31% 69% 0% 0% 0% 0% 0%
The amount of information provided on the website
31% 69% 0% 0% 0% 0% 0%
Q53 Generally, do you feel that you receive enough information about the Council and the
services it provides? 87% Yes 13% No Q54 Do you access, and use, the internet in any of the following ways... 89% Internet access at home 52% Internet access via a mobile phone 15% Internet access at work 1% Internet access through public access e.g. at library 0% Access the internet in some other way 10% None of these - I do not access the internet Q55 Do you know that the Council have procedures in place to respond to situations where
vulnerable adults might be at risk of harm? 32% Yes 68% No Q55 Would you know who to contact if you had concerns that a vulnerable adult was at risk of
being abused? 72% Yes 28% No Q56 I am going to read out a list of statements about your local Council and would like you to
tell me which 3 are of the most importance to you. Dundee City Council/ Angus Council... 36% Offering a good range of services 56% Providing an efficient service 46% Providing services which are value for money 40% Providing good quality services 10% Having friendly, polite, helpful, well informed employees 7% Promoting its services well 64% Tackling important issues for the future of the area 22% Listening to complaints 7% Communicating well with the public 11% Ensuring sustainable use of resources and care for the environment 1% Don't know
Research Resource Dundee City Council 304

Q57 I am going to read out the same list of statements again about your local Council. I would like you to tell me whether you agree or disagree with each of these statements. Dundee City Council/ Angus Council....
Agree Neither nor Disagree Don't know Offers a good range
of services 73% 27% 0% 0%
Provides an efficient service
69% 31% 0% 0%
Provides services which are value for money
62% 38% 0% 0%
Provides good quality services
67% 33% 0% 0%
Has friendly, polite, helpful, well informed employees
60% 40% 0% 0%
Promotes its services well
54% 45% 1% 0%
Tackles important issues for the future of the area
60% 38% 1% 0%
Listens to complaints 50% 50% 1% 0% Communicates well
with the public 53% 46% 1% 0%
Ensures sustainable use of resources and care for the environment
58% 40% 1% 0%
Q58 Could I just check how many adults, aged 16 or over, are there in the household including
you? And how many children? 26% 1 65% 2 6% 3 2% 4 1% 5 Q58 Could I just check how many adults, aged 16 or over, are there in the household including
you? And how many children? 57% 0 19% 1 20% 2 3% 3 1% 4 0% 5+ Q59 How many children are there in the household in each group? 0 1 2 3 4 5+ Less than 3 years 63% 31% 6% 0% 0% 0% 3-5years 49% 42% 9% 0% 0% 0% 6-15 years 55% 27% 16% 1% 0% 0% Q60 Gender of respondent: 45% Male 55% Female
Research Resource Dundee City Council 305

Q60 Age of respondent: 8% 16-24 30% 25-34 15% 35-44 19% 45-54 11% 55-59 7% 60-64 6% 65-74 4% 75+ 0% Refused HHCOMP HOUSEHOLD COMPOSITION 12% Single adult under 60 6% Single adult 60+ 19% Two adults under 60 9% Two adults aged 60+ 6% Two adults at least one over 60 8% Single adult with at least one child 31% Two adults and at least one child 5% Three or more adults with no children 4% Other Q61 How many motor vehicles does your household have access to for personal use? (this
includes motorbikes, mopeds, cars, vans etc) 60% 1 12% 2 1% 3 0% 4 or more 28% None Q62 Do you or any member of your household have a disability? 7% Yes 93% No Q63 What is the nature of the disability? 0% Mental health condition 91% Mobility/ physical disabilities 0% Learning difficulties (e.g. dyslexia) 0% Difficulties with sight 0% Learning disability (e.g. Downs Syndrome) 0% Developmental disorder (e.g. Autistic Spectrum Disorder or Asperger's syndrome) 10% Difficulties with hearing 19% Other condition (please write in) 0% Don't know 0% Refused
Research Resource Dundee City Council 306

Q64 Can you please look at this card and specify what is your religion? 66% None 21% Church of Scotland 11% Roman Catholic 0% Other Christian 1% Buddhist 1% Hindu 0% Jewish 0% Muslim 1% Sikh 0% Another religion (please specify) 0% Would rather not say Q65 Which of these groups on this card do you consider you belong to? 95% Scottish 0% Other British 0% Irish 0% Gypsy/ Traveller 4% Polish 1% Any other white ethnic group 0% Any mixed or multiple ethnic groups 0% Pakistani, Pakistani Scottish or Pakistani British 1% Indian, Indian Scottish or Indian British 0% Bangladeshi, Bangladeshi Scottish or Bangladeshi British 0% Chinese, Chinese Scottish ior Chinese British 0% Other 0% African, African Scottish or African British 0% Caribbean, Caribbean Scottish ior Caribbean British 0% Black, Black Scottish or Black British 0% Other 0% Arab 0% Any other background 0% Refused 0% Don't know Q66 Would you mind looking at the card and tell me which group your overall annual
household income falls. Please use net income from all sources i.e. after deductions of income tax. national insurance, and other compulsory deductions. Please take into account any money you may have from employment, including bonuses, overtime, pensions, state pensions, welfare benefits and interest from savings.
2% Less than £100 per week/ £5,199 per year 3% £100-199 per week / £5,200 - £10,399 per year 12% £200-299 per week / £10,400 - £15, 599 per year 10% £300-399 per week / £15,600 - £20,199 per year 15% £400-499 per week / £20,800 - £25,999 per year 9% £500-599 per week / £26,000 - £31,199 per year 4% £600 or more per week/ £31,200 or more per year 8% Don't know 37% Would rather not say
Research Resource Dundee City Council 307
Mid Craigie, Linlathen and Douglas
CITIZENS' SURVEY 2015 SQ1 Community Regeneration area: 0% Ardler, St Mary's and Kirkton 0% Beechwood, Lochee, Menziehill and Charleston 0% Coldside and Maryfield 0% Fintry, Whitfield and Mill O Mains 100% Mid Craigie, Linlathen and Douglas 0% None SQ2 Ward 0% West End 0% Maryfield 0% The Ferry 0% Coldside 0% Lochee 100% East End 0% North East 0% Strathmartine
Research Resource Dundee City Council 308

Q1 What do you like best about living in this neighbourhood? 0% Close to beach/ coast 0% Quality of housing 23% Close to shops/ quality of shops/ amenities 4% Always lived here/ familiar with/ know area 13% Pleasant/ nice area 24% Friendly people/ neighbours/ family and friends 49% Quiet/ peaceful 11% Convenient location 0% Central location 0% Other 3% None/ nothing 0% Don't know 1% Lots for kids to do 0% Lots of green/ open spaces/ countryside/ nice views 2% Safe 9% Good public transport 1% Everything 11% It's ok/ fine/ I like it here/ no problems Q2 What do you like least about living in this neighbourhood? 3% Littering/ dirty/ dog fouling 5% Difficult/ poor parking 8% Drug problems 0% Lack of facilities for youths/ children 8% ASB/ neighbours/ noisy 4% Youths/ gangs causing trouble 0% Poor shops 0% Vandalism 3% Other 70% None/ nothing 1% Lack of security 0% Don't know 4% Speeding cars/ traffic 1% Lack of transport/ poor public transport 3% Area going downhill/ untidy/ rundown 0% Roads/ pavements/ winter gritting/ snow clearing 1% Bin uplifts/ refuse collection 4% Too many private lets/ undesirables moving into the area 0% Too many stairs/ hills 0% Not much for people to do in general Q3 How long have you lived in this neighbourhood? 6% Up to one year 8% 1-2 years 15% 3-5 years 14% 6-10 years 49% Over 10 years 9% Always lived there 0% Don't know
Research Resource Dundee City Council 309

Q4 Could you please tell me if you think this neighbourhood has changed over the past 5 years, or since you've been living here if it's less than 5 years?
9% Yes - has got better 8% Yes - has got worse 64% No change 19% Don't know Q5better In what ways do you think it has changed? (GOT BETTER) 0% Access to parks/ open spaces 0% Better facilities/ amenities 4% Less vandalism 0% Housing improvements - new houses 0% Improved schools 8% Cleaner/ tidier/ less litter 0% Improved shops 4% Fewer drug problems 44% Friendliness of people/ neighbours 39% Quieter/ more peaceful 0% Other 0% Not sure 0% Less people hanging around street 0% Less crime 0% More young families in the area Q5worse Q5 In what ways do you think it has changed? (GOT WORSE) 0% Lack of parks/ open spaces 0% Overgrown gardens/ uncut grass 0% Poorer shops 0% More vandalism 19% Undesirable people moving in 0% Lack of facilities for youths/ children 19% ASB/ neighbours/ noisy 0% People/ neighbours less friendly 0% Youths/ gangs causing problems 66% Drug/ alcohol problems 0% Other 0% Not sure 0% More crime 5% People don't care about area 5% Too many private lets 0% Litter problems/ area is dirty 5% Area is rundown/ going downhill 0% More houses being built 9% Parking 0% Condition of roads/ pavements 0% More traffic/ motorbikes/ roads unsafe
Research Resource Dundee City Council 310

Q6 Thinking now about the neighbourhood you live in, how would you rate it as a place to live?
42% Very good 51% Fairly good 5% Fairly poor 2% Very poor 0% No opinion Q7 How long have you lived in this house/ flat? 6% Up to one year 9% 1-2 years 16% 3-5 years 15% 6-10 years 50% Over 10 years 3% Always lived here 0% Don't know Q8 Please tell me which of the descriptions on this card best describes your house/ flat? 45% Rented from the Council 9% Rented from a housing association 9% Rented from a private landlord 17% Owned by you (not ex Council) 20% Owned by you (ex Council) 0% Other (please specify) Q9 Overall, how do you rate the general condition of this (your) house/ flat? 42% Very good 46% Fairly good 10% Average 1% Fairly poor 0% Very poor 0% Don't know
Research Resource Dundee City Council 311

Q10 Looking at this card, please state how satisfied or dissatisfied you are with the following services and facilities in your local area?
Very Satisfied Fairly Satisfied Fairly Dissatisfied Very Dissatisfied Doesn't exist/ never used
Local Health services
34% 52% 12% 3% 0%
Police service 29% 51% 4% 1% 15% Fire service 31% 50% 0% 0% 18% Refuse collection 38% 61% 1% 0% 1% Local Schools 32% 31% 0% 0% 37% Social care/ social
work services 6% 32% 0% 0% 61%
Social housing 28% 43% 1% 1% 27% Employment and
advice services 0% 24% 6% 8% 62%
Public transport 44% 40% 10% 1% 6% Street cleaning 2% 80% 18% 0% 0% Sports and leisure
facilities 35% 33% 3% 2% 27%
Community centre/ library
37% 46% 2% 0% 14%
Parks and open spaces
37% 48% 11% 1% 2%
Local phone boxes 0% 21% 1% 8% 70% Local youth facilities 3% 35% 1% 2% 59% Local shops 53% 46% 0% 0% 1% Community Warden
Service 6% 40% 0% 0% 54%
Access to free cash machine/ auto teller
51% 44% 0% 0% 5%
Research Resource Dundee City Council 312

Q11 And, looking at this card, how easy is it for you to access those services and facilities in your local area?
Very easy Fairly easy Fairly difficult Very difficult Doesn't exist/ never used
Local Health services
17% 83% 0% 0% 0%
Police service 24% 71% 0% 0% 5% Fire service 24% 70% 0% 0% 6% Refuse collection 26% 73% 0% 0% 0% Local Schools 17% 55% 0% 0% 28% Social care/ social
work services 9% 29% 0% 0% 61%
Social housing 32% 37% 0% 0% 31% Employment and
advice services 7% 29% 2% 0% 62%
Public transport 44% 45% 6% 0% 5% Street cleaning 9% 84% 5% 0% 2% Sports and leisure
facilities 12% 54% 2% 0% 32%
Community centre/ library
16% 69% 2% 0% 14%
Parks and open spaces
14% 79% 3% 0% 3%
Local phone boxes 7% 24% 0% 0% 69% Local youth facilities 6% 27% 1% 0% 66% Local shops 58% 41% 0% 0% 1% Community Warden
Service 8% 34% 1% 0% 56%
Access to free cash machine/ auto teller
54% 41% 0% 0% 5%
Q12 Looking at this card, how satisfied are you with the following in this neighbourhood? Very satisfied Fairly satisfied Fairly dissatisfied Very dissatisfied Don't know Children's Play areas 1% 75% 3% 0% 21% Cleanliness of
Streets 1% 83% 16% 0% 0%
Shopping Facilities 40% 59% 0% 0% 0% Condition of roads,
pavements and street lighting
1% 79% 20% 0% 0%
Quality and maintenance of open spaces
3% 86% 11% 0% 0%
Cleanliness of the area around your home
3% 90% 6% 0% 0%
The built environment (e.g. buildings, heritage etc)
8% 84% 6% 0% 2%
The natural environment (e.g. parks, open spaces, countryside etc)
9% 80% 8% 2% 2%
Research Resource Dundee City Council 313

Q13 Overall, how satisfied are you with the quality of life in this neighbourhood? 43% Very satisfied 54% Satisfied 2% Dissatisfied 0% Very dissatisfied Q14 Overall, how satisfied are you with the quality of life in Dundee? 47% Very satisfied 52% Satisfied 1% Dissatisfied 0% Very dissatisfied Q15 Can you tell me firstly, if you are aware of any of these in this area? 54% After school/ children's club 19% Youth clubs/ projects or drop-in centres 26% Voluntary Youth Organisations 11% Youth Information Services 15% Other Youthwork activities 56% Organised Sporting activities/ classes/ clubs 48% Organised Social/ Leisure activities/ classes/ clubs 31% Learning groups or adult education classes 17% Self-help or social care groups 19% Community Festivals/ Events e.g. Gala Day 5% Community Council or Neighbourhood Group 2% Community Regeneration Forum or Group 8% Local Consultation Activities or Events 13% None
Research Resource Dundee City Council 314

Q15 And then, if you are aware, how often do you, or anyone living in your home, take part in activities like these?
Daily Weekly Monthly Seldom Never After school/
children's clubs 10% 9% 0% 0% 80%
Youth clubs/ projects or drop-in centres
4% 6% 0% 0% 90%
Voluntary Youth Organisations
0% 9% 3% 2% 86%
Youth Information Services
0% 0% 0% 0% 100%
Other Youthwork activities
0% 16% 3% 3% 78%
Organised Sporting activities/ classes/ clubs
0% 44% 1% 1% 54%
Organised Social/ Leisure activities/ classes/ clubs
1% 27% 0% 2% 70%
Learning groups or adult education classes
0% 17% 3% 0% 81%
Self-help or social care groups
0% 14% 2% 2% 82%
Community Festivals/ Events e.g. Gala Day
0% 0% 0% 64% 36%
Community Council or Neighbourhood Group
0% 9% 0% 0% 91%
Community Regeneration Forum or Group
0% 0% 0% 0% 100%
Local Consultation Activities or Events
0% 11% 5% 16% 68%
Q16 Q16 Thinking back over the last 12 months, have you given up any time to help any clubs,
charities, campaigns or organisations. I mean in an unpaid capacity. 6% Yes 94% No
Research Resource Dundee City Council 315

Q17 Looking at this showcard, can you tell me if you have undertaken any work or given unpaid help to any of these types of groups or organisations at any time in the past 12 months?
0% Children's group - e.g. playgroup, mothers and toddlers 0% School children e.g. school trips, sports days, discos, in the classroom 0% Youth groups/ children's activities outside of school 0% Coaching or organising sport or exercise 0% Church, religion or faith-based group 0% The elderly 0% Health disability or social welfare group or organisation 0% Local community group/ neighbourhood association/ community council 0% Tenants group/ residents association 0% Trade union activities 0% Public service - e.g. school, hospital, police, local government service 0% Professional society 0% Safety/ first aid 0% The environment/ animals 0% Justice/ human rights 0% Hobbies/ recreation/ arts/ social club 0% Citizens groups 0% Domestic animal welfare 0% Wildlife protection 0% Environmental protection 100% None Q18 In the last 12 months have you been to any of these events or places in Dundee? 54% Cinema 5% Exhibition including art, photography or crafts 0% Book festival or reading group 19% Theatre e.g. pantomime, musical or play 2% Street arts (art in everyday surroundings like streets, parks or shopping centre) 7% Culturally specific festival e.g. mela/ Feis/ local Gala days 3% Classical music performance or opera 27% Live music event e.g. traditional music, rock concert, jazz event 2% Dance show/ event e.g. ballet 21% Museum 2% Historical place e.g. castle, stately home and grounds, battle or archaeology site 7% Gallery 31% Library, including mobile or online 0% Archive or records office 21% None
Research Resource Dundee City Council 316

Q19 If you have not taken part in any community activities or organisations, can you tell me why this is?
14% It costs too much 3% I don't know enough about it 0% Never occurred to me 67% Not really interested 0% I don't have anyone to go with 8% I wouldn't enjoy it 0% Not enough facilities close to where I live 5% Health isn't good enough 3% I might feel uncomfortable or out of place 0% Lack of transport/ I can't easily get to it 0% Poor access to venues (e.g. no disabled ramps) 0% Not enough information on what is available 0% Didn't enjoy it last time 3% It's difficult to find the time 0% I would feel unsafe going to/ from the activity/ event 0% I would feel unsafe at the activity/ event 0% Other Q20 Please tell me to what extent you agree or disagree with the following statements? Strongly agree Tend to agree Neither agree
nor disagree Tend to disagree
Strongly disagree
No opinion
I can influence decisions affecting my local area
0% 31% 30% 22% 4% 12%
People in my community can influence decisions affecting my local area
0% 36% 27% 19% 4% 13%
Q21 First of all could you tell me whether you are registered with.... a GP or health centre? 99% Yes 0% No 0% Don't know Q21 First of all could you tell me whether you are registered with.... a dentist? 97% Yes 3% No 0% Don't know Q22 How good is your health overall? 34% Very good 49% Good 14% Fair 4% Poor 0% Very poor 0% Don't know
Research Resource Dundee City Council 317

Q23 In a typical week, how often do you undertake moderate physical activity for at least 30 minutes in a day?
32% 4 days a week or more 41% 1-3 days a week 17% Less than once a week 10% Never Q24 Are you, or have you ever been, a smoker? 35% Currently smoke 26% Used to smoke 39% Never smoked Q25 How often do you have (8 for men/ 6 for women) or more alcoholic drinks on one
occasion? 4% Daily or almost daily 29% Weekly 14% Monthly 21% Less than monthly 32% Never 0% Don't know Q26 Please say which option best describes your experience over the last 2 weeks. None of the time Rarely Some of the time Often All of the time I've been feeling
optimistic about the future
0% 14% 34% 48% 3%
I've been feeling useful
1% 9% 31% 57% 3%
I've been feeling relaxed
0% 6% 27% 63% 4%
I've been feeling interested in other people
1% 8% 24% 61% 6%
I've had energy to spare
0% 14% 28% 52% 6%
I've been dealing well with problems
0% 5% 26% 61% 8%
I've been thinking clearly
0% 6% 21% 63% 9%
I've been feeling good about myself
0% 9% 22% 61% 8%
I've been feeling close to other people
0% 4% 22% 60% 13%
I've been feeling confident
1% 8% 20% 64% 7%
I've been able to make up my mind about things
0% 5% 20% 64% 11%
I've been feeling loved
0% 4% 19% 61% 17%
I've been interested in new things
0% 9% 28% 54% 9%
I've been feeling cheerful
0% 5% 22% 64% 9%
Research Resource Dundee City Council 318

Q27 On a scale of 1 to 6 where 1 is not at all and 6 is a great deal, to what extent do you feel that people treat you unfairly?
79% 1 - Not at all 11% 2 5% 3 3% 4 1% 5 2% 6 - A great deal 0% Don't know Q28 To what extent do you agree with the statement "I could turn to friends/ relatives in this
neighbourhood for support? 38% Strongly agree 48% Tend to agree 3% Tend to disagree 9% Strongly disagree 3% Don't know Q29 Are you currently taking part in any of these forms of education/ classes of training? 96% None 2% On the job training 0% An FE college course 0% A university based course 0% Distance learning/ Open University 0% School 0% Adult education or evening class 0% Help with reading, writing or use of numbers 0% Other Q30 What type of qualification, if any, will this lead to. Would it lead to... 0% No qualification 11% A qualification at degree level or above 89% Another qualification Q31 Taking everything into account how safe do you feel your neighbourhood is as a place to
live? 53% Very safe 43% Fairly safe 2% A bit unsafe 1% Very unsafe 1% Don't know Q32 How safe do you feel when... Very safe Fairly safe A bit unsafe Very unsafe Don't know Alone in your home
during the day 76% 23% 1% 0% 0%
Alone in your home at night
73% 25% 2% 0% 0%
Walking alone in your neighbourhood during the day
63% 35% 2% 0% 0%
Walking alone in your neighbourhood after dark
24% 50% 13% 2% 10%
Research Resource Dundee City Council 319

Q33 Do you think that the amount of crime in your neighbourhood has increased or decreased
over the past year? 1% Decreased a lot 4% Decreased a little 59% Remained the same 5% Increased a little 2% Increased a lot 29% Don't know Q34 If you feel crime has increased in your neighbourhood, what has influenced your option? 23% Personal experience of crime 13% Experience of family or friends 89% Talking to people in the area 18% Media - television, radio, paper 0% Social media internet sites e.g. Facebook, Twitter 0% Internet sites 0% Police or Council publications 0% Other Q35 What, in your opinion, is the main factor which contributes most to the level of crime in
your neighbourhood? 4% Boredom/ nothing to do/ lack of facilities 24% Don't know 0% Driving offences/ speeding/ motorbikes 0% Immigrants 47% Alcohol/ Drugs 0% Nothing 5% Lack of money/ poverty 7% Unemployment 0% Prostitution 2% New people/ undesirables moving into area/ not knowing who your neighbours are 0% Anti social behaviour 0% Crime e.g. Break ins/ burglary/ vandalism 12% This is a good area/ neighbourhood/ quiet/ no trouble 1% Lack of discipline/ parental control 2% Opportunists/ some people can't help themselves 1% Lack of policing/ wardens 2% Other 3% Gangs/ youths Q36 To what extent, if it all, does a fear of crime prevent you from taking part in your every day
activities? 86% Not at all 11% A little 3% Quite a lot 0% A great deal 0% Don't know
Research Resource Dundee City Council 320

Q37 Which of these accounts, if any, do you or your partner have? 98% Bank account 12% Building society account 0% Credit union account 5% Post Office card account 0% No, none of these 2% Prefer not to say Q38 Do you have insurance for the contents of your house such as for furniture, electrical
goods etc? 83% Yes 15% No 0% Prefer not to say 1% Don't know Q39 Think about the total value of any savings or investments you have, at the moment do
you (or your partner) have total savings or investments worth £1,000 or more in any combination of the places mentioned on this card, do you have less than £1,000 in savings or investments or do you have no savings or investments at all?
32% No savings 2% Less than £1,000 10% £1,000 or more 1% Don't know 54% Prefer not to say Q40 Are you currently experiencing, or within the last year have you had any difficulties with
the following? 0% Mortgage or rent payments 2% Changes to benefits 9% Council tax payments 9% Loan or credit card payments 11% Cost of food 31% Cost of domestic energy bills 2% Vehicle fuel prices 65% None of the above 3% Prefer not to say Q41 Taking everything together, which of these phrases on this card best describes how you
and your household are managing financially these days? 5% Manage very well 37% Manage quite well 45% Get by all right 10% Don't manage very well 0% Have some deep financial difficulties 0% Are in deep financial trouble 0% Refused 1% Don't know
Research Resource Dundee City Council 321

Q42 When you last contacted Dundee City Council, was this contact to ...? 6% Make a complaint 12% Seek information 48% Request a service 0% Make a suggestion 34% Have never contacted with Council Q43 Overall, how satisfied were you that the Council responded reasonably to your
complaint? 0% Very satisfied 64% Satisfied 0% Neither satisfied nor dissatisfied 36% Dissatisfied 0% Very dissatisfied Q44 Overall, how satisfied were you with this contact to seek information? 13% Very satisfied 78% Satisfied 6% Neither satisfied nor dissatisfied 3% Dissatisfied 0% Very dissatisfied Q45 Overall, how satisfied were you with this contact to request a service? 40% Very satisfied 57% Satisfied 2% Neither satisfied nor dissatisfied 1% Dissatisfied 0% Very dissatisfied Q46 On your most recent contact with the Council, did you.... 89% Get what you need at that contact 11% Have to contact the Council again about the same issue Q47 Was your most recent contact .... 1% By a letter 87% By a telephone call to the Council 8% By a personal visit to a Council office 4% By e-mail 0% By visiting the Council's website
Research Resource Dundee City Council 322

Q48 How satisfied or dissatisfied were you with your recent contact with the Council by telephone in terms of the following?
Very satisfied Fairly satisfied Neither nor Fairly dissatisfied
Very dissatisfied
Don't know
How easy it was for you to find the right number to call
32% 63% 4% 1% 0% 0%
How quickly the phone was answered
32% 63% 4% 1% 0% 0%
How easy it was to get through to someone who could help
32% 63% 4% 1% 0% 0%
Overall helpfulness/ friendliness/ courtesy of the staff you dealt with
33% 64% 2% 1% 0% 0%
How well the staff understood what you wanted
33% 63% 3% 1% 0% 0%
The outcome of your contact
36% 57% 4% 1% 2% 1%
Q49 How satisfied or dissatisfied were you with your recent contact when visiting a Council
office in terms of the following? Very satisfied Fairly satisfied Neither nor Fairly
dissatisfied Very
dissatisfied Don't know
How easy it was to get to the office
8% 92% 0% 0% 0% 0%
The suitability of the office e.g. waiting areas, privacy, access for disabled people etc
8% 92% 0% 0% 0% 0%
Overall helpfulness/ friendliness/ courtesy of the staff you dealt with
8% 85% 7% 0% 0% 0%
How well the staff understood what you wanted
8% 85% 0% 7% 0% 0%
The outcome of your contact
22% 43% 7% 14% 7% 7%
Q50 How satisfied or dissatisfied were you with your most recent cpntact with the Council by
email/ letter in terms of the following? Very satisfied Fairly satisfied Neither nor Fairly
dissatisfied Very
dissatisfied Don't know
How quickly you received a reply to your email/ letter
37% 63% 0% 0% 0% 0%
The extent to which the first reply you received answered your query
37% 50% 0% 13% 0% 0%
The outcome of your contact
37% 37% 0% 26% 0% 0%
Research Resource Dundee City Council 323

Q51 Have you ever used the Council's website? 40% Yes 60% No Q52 How satisfied or dissatisfied would you say you are with the website in terms of the
following? Very
satisfied Fairly
satisfied Neither nor Fairly
dissatisfied Very
dissatisfied Don't know Not
applicable How easily you
managed to find the information you wanted
12% 85% 1% 2% 0% 0% 0%
The amount of information provided on the website
12% 85% 1% 2% 0% 0% 0%
Q53 Generally, do you feel that you receive enough information about the Council and the
services it provides? 90% Yes 10% No Q54 Do you access, and use, the internet in any of the following ways... 77% Internet access at home 46% Internet access via a mobile phone 11% Internet access at work 0% Internet access through public access e.g. at library 2% Access the internet in some other way 21% None of these - I do not access the internet Q55 Do you know that the Council have procedures in place to respond to situations where
vulnerable adults might be at risk of harm? 32% Yes 68% No Q55 Would you know who to contact if you had concerns that a vulnerable adult was at risk of
being abused? 66% Yes 34% No Q56 I am going to read out a list of statements about your local Council and would like you to
tell me which 3 are of the most importance to you. Dundee City Council/ Angus Council... 31% Offering a good range of services 44% Providing an efficient service 54% Providing services which are value for money 30% Providing good quality services 24% Having friendly, polite, helpful, well informed employees 7% Promoting its services well 56% Tackling important issues for the future of the area 19% Listening to complaints 10% Communicating well with the public 24% Ensuring sustainable use of resources and care for the environment 0% Don't know
Research Resource Dundee City Council 324

Q57 I am going to read out the same list of statements again about your local Council. I would like you to tell me whether you agree or disagree with each of these statements. Dundee City Council/ Angus Council....
Agree Neither nor Disagree Don't know Offers a good range
of services 49% 47% 4% 0%
Provides an efficient service
51% 44% 4% 0%
Provides services which are value for money
46% 39% 15% 0%
Provides good quality services
55% 39% 6% 0%
Has friendly, polite, helpful, well informed employees
54% 35% 11% 0%
Promotes its services well
53% 43% 4% 0%
Tackles important issues for the future of the area
47% 39% 14% 0%
Listens to complaints 51% 42% 6% 0% Communicates well
with the public 52% 40% 8% 0%
Ensures sustainable use of resources and care for the environment
49% 41% 10% 0%
Q58 Could I just check how many adults, aged 16 or over, are there in the household including
you? And how many children? 38% 1 51% 2 9% 3 2% 4 0% 5 Q58 Could I just check how many adults, aged 16 or over, are there in the household including
you? And how many children? 75% 0 13% 1 8% 2 3% 3 0% 4 0% 5+ Q59 How many children are there in the household in each group? 0 1 2 3 4 5+ Less than 3 years 59% 35% 6% 0% 0% 0% 3-5years 59% 32% 10% 0% 0% 0% 6-15 years 49% 34% 15% 2% 0% 0% Q60 Gender of respondent: 46% Male 54% Female
Research Resource Dundee City Council 325

Q60 Age of respondent: 9% 16-24 22% 25-34 16% 35-44 15% 45-54 10% 55-59 8% 60-64 15% 65-74 6% 75+ 0% Refused HHCOMP HOUSEHOLD COMPOSITION 19% Single adult under 60 12% Single adult 60+ 18% Two adults under 60 14% Two adults aged 60+ 4% Two adults at least one over 60 7% Single adult with at least one child 16% Two adults and at least one child 9% Three or more adults with no children 2% Other Q61 How many motor vehicles does your household have access to for personal use? (this
includes motorbikes, mopeds, cars, vans etc) 47% 1 9% 2 2% 3 0% 4 or more 42% None Q62 Do you or any member of your household have a disability? 20% Yes 80% No Q63 What is the nature of the disability? 8% Mental health condition 73% Mobility/ physical disabilities 2% Learning difficulties (e.g. dyslexia) 2% Difficulties with sight 0% Learning disability (e.g. Downs Syndrome) 0% Developmental disorder (e.g. Autistic Spectrum Disorder or Asperger's syndrome) 2% Difficulties with hearing 18% Other condition (please write in) 0% Don't know 0% Refused
Research Resource Dundee City Council 326

Q64 Can you please look at this card and specify what is your religion? 62% None 25% Church of Scotland 8% Roman Catholic 2% Other Christian 0% Buddhist 0% Hindu 0% Jewish 2% Muslim 0% Sikh 2% Another religion (please specify) 1% Would rather not say Q65 Which of these groups on this card do you consider you belong to? 91% Scottish 3% Other British 0% Irish 0% Gypsy/ Traveller 4% Polish 0% Any other white ethnic group 0% Any mixed or multiple ethnic groups 1% Pakistani, Pakistani Scottish or Pakistani British 0% Indian, Indian Scottish or Indian British 0% Bangladeshi, Bangladeshi Scottish or Bangladeshi British 0% Chinese, Chinese Scottish ior Chinese British 0% Other 0% African, African Scottish or African British 0% Caribbean, Caribbean Scottish ior Caribbean British 0% Black, Black Scottish or Black British 0% Other 0% Arab 0% Any other background 0% Refused 0% Don't know Q66 Would you mind looking at the card and tell me which group your overall annual
household income falls. Please use net income from all sources i.e. after deductions of income tax. national insurance, and other compulsory deductions. Please take into account any money you may have from employment, including bonuses, overtime, pensions, state pensions, welfare benefits and interest from savings.
1% Less than £100 per week/ £5,199 per year 6% £100-199 per week / £5,200 - £10,399 per year 6% £200-299 per week / £10,400 - £15, 599 per year 7% £300-399 per week / £15,600 - £20,199 per year 9% £400-499 per week / £20,800 - £25,999 per year 3% £500-599 per week / £26,000 - £31,199 per year 0% £600 or more per week/ £31,200 or more per year 3% Don't know 65% Would rather not say
Research Resource Dundee City Council 327

Appendix 2
Survey Questionnaire
Research Resource Dundee City Council 328

SQ1 Community regeneration area: Ardler, St Mary's and Kirkton 1
Beechwood, Lochee, Menzieshill and Charleston 2 Coldside and Maryfield 3 Fintry, Whitfield and Mill O Mains 4 Mid Craigie, Linlathen and Douglas 5
SQ2 Ward Dundee City West End 1
Dundee City – Maryfield 2 Dundee City - The Ferry 3 Dundee City - Coldside 4 Dundee City - Lochee 5 Dundee City - East End 6 Dundee City - North East 7 Dundee City - Strathmartine 8 INTERVIEWER: READ OUT Hello, my name is ……… (show badge) I’m carrying out a survey on behalf of Dundee City Council/Dundee Partnership. You have been selected at random for this survey, and I wonder if I could ask you some questions about your satisfaction with your neighbourhood, health and public services? It should take approximately 20 minutes, and all the answers you give will be kept completely confidential. Can you spare the time just now to complete the questionnaire with me? SECTION 1: YOUR HOUSE AND NEIGHBOURHOOD
1. The first few questions are about this neighbourhood. What do you like best about living in this neighbourhood? [INTERVIEWER: PROBE FULLY]
2. What do you like least about living in this neighbourhood? [INTERVIEWER: PROBE FULLY]
3. How long have you lived in this neighbourhood? Up to one year 1
GO TO Q4
1-2 years 2 3-5 years 3 6-10 years 4 Over 10 years 5 Always lived there 6 Don't know 7
Research Resource Dundee City Council 329

4. Could you please tell me if you think this neighbourhood has changed over the past 5
years, or since you've been living here if it's less than 5 years? Yes - has got better 1 GO TO Q5 Yes - has got worse 2 No change 3 GO TO Q6 Don't know 4
5. In what ways do you think it has changed? [INTERVIEWER: PROBE FULLY]
6. SHOWCARD Thinking now about the neighbourhood you live in, how would you rate it
as a place to live? Very good 1
GO TO Q7 Fairly good 2 Fairly poor 3 Very poor 4 No opinion 5
7. How long have you lived in this house/ flat? Up to one year 1
GO TO Q8
1-2 years 2 3-5 years 3 6-10 years 4 Over 10 years 5 Always lived there 6 Don't know 7
8. SHOWCARD Please tell me which of the descriptions on this card best describes your house/ flat? SELECT ONE ONLY
Rented from the Council 1
GO TO Q9
Rented from a housing association 2 Rented from a private landlord 3 Owned by you (not ex Council) 4 Owned by you (ex Council) 5
Other (please specify) 6
9. SHOWCARD Overall, how do you rate the general condition of this (your) house / flat? Very good 1
GO TO Q10
Fairly good 2 Average/ alright 3 Fairly poor 4 Very poor 5 Don’t know 6
Research Resource Dundee City Council 330

SECTION 2: LOCAL AREA AND SERVICES 10. SHOWCARD . Looking at this card, please state how satisfied or dissatisfied you are with the following
services and facilities in your local area? 11. SHOWCARD . And, looking at this card, how easy is it for you to access those services and facilities in your
local area? Q10 Q11
Very Satis.
Fairly Satis.
Fairly Dissatis.
Very Dissatis
Doesn't' exist/ never used
Very easy
Fairly easy
Fairly difficult
Very Difficult
Doesn't exist/ never used
Local Health services 1 2 3 4 5 1 2 3 4 5
Police service 1 2 3 4 5 1 2 3 4 5 Fire service 1 2 3 4 5 1 2 3 4 5 Refuse collection 1 2 3 4 5 1 2 3 4 5 Local Schools 1 2 3 4 5 1 2 3 4 5 Social care/social work services
1 2 3 4 5 1 2 3 4 5
Social housing 1 2 3 4 5 1 2 3 4 5 Employment and advice services 1 2 3 4 5 1 2 3 4 5
Public transport 1 2 3 4 5 1 2 3 4 5 Street cleaning 1 2 3 4 5 1 2 3 4 5 Sports and leisure facilities 1 2 3 4 5 1 2 3 4 5
Community centre / Library 1 2 3 4 5 1 2 3 4 5
Parks and open spaces
1 2 3 4 5 1 2 3 4 5
Local phone boxes 1 2 3 4 5 1 2 3 4 5 Local youth facilities 1 2 3 4 5 1 2 3 4 5 Local shops 1 2 3 4 5 1 2 3 4 5 Community Warden Service 1 2 3 4 5 1 2 3 4 5
Access to free cash machine/ auto teller 1 2 3 4 5 1 2 3 4 5
12. S SHOWCARD . Looking at this card, how satisfied are you with the following in this
neighbourhood?
Very satisfied
Fairly satisfied
Fairly dissatisfied
Very dissatisfied
Don’t know
Children's Play Areas 1 2 3 4 5 Cleanliness of Streets 1 2 3 4 5 Shopping Facilities 1 2 3 4 5 Condition of roads, pavements and street lighting 1 2 3 4 5 Quality and maintenance of open spaces 1 2 3 4 5 Cleanliness of the area around your home 1 2 3 4 5 The built environment (e.g. buildings, heritage etc) 1 2 3 4 5
The natural environment (e.g. parks, open spaces, countryside etc) 1 2 3 4 5
13. SHOWCARD Overall, how satisfied are you with the quality of life in this neighbourhood?
Very satisfied 1 GO TO Q14
Research Resource Dundee City Council 331

Satisfied 2 Dissatisfied 3 Very dissatisfied 4
14. SHOWCARD Overall, how satisfied are you with the quality of life in Dundee? Very satisfied 1
GO TO Q15 Satisfied 2 Dissatisfied 3 Very dissatisfied 4 SECTION 3: COMMUNITY PARTICIPATION
15. I am going to read out some examples of community activities and organisations. A)Can you tell me firstly, if you are aware of any of these in this area? MULTI B) SHOWCARD And then, if you are aware, how often do you, or anyone living in your home, take part in activities like these? Please take your answer from this card.
A) B) Take Part Aware Daily Weekly Monthly Seldom Never After school/children's clubs 1 1 2 3 4 5 Youth clubs/projects or drop-in centres 2 1 2 3 4 5 Voluntary Youth Organisations 3 1 2 3 4 5 Youth Information Services 4 1 2 3 4 5 Other Youthwork activities 5 1 2 3 4 5 Organised Sporting activities/ classes/clubs 6 1 2 3 4 5 Organised Social/Leisure activities/classes/clubs 7 1 2 3 4 5 Learning groups or adult education classes 8 1 2 3 4 5 Self-help or social care groups 9 1 2 3 4 5 Community Festivals/ Events eg Gala Day 10 1 2 3 4 5 Community Council or Neighbourhood Group 11 1 2 3 4 5 Community Regeneration Forum or Group 12 1 2 3 4 5 Local Consultation Activities or Events 13 1 2 3 4 5
16. READ OUT: The next set of questions are about the kinds of things that some
people do to give up their time, without pay, to help people or for the benefit of their neighbourhood or a wider area, and either through organisations or acting as individuals. Thinking back over the last 12 months, have you given up any time to help any clubs, charities, campaigns or organisations. I mean in an unpaid capacity.
Yes 1 GO TO Q18 No 2 GO TO Q17
Research Resource Dundee City Council 332
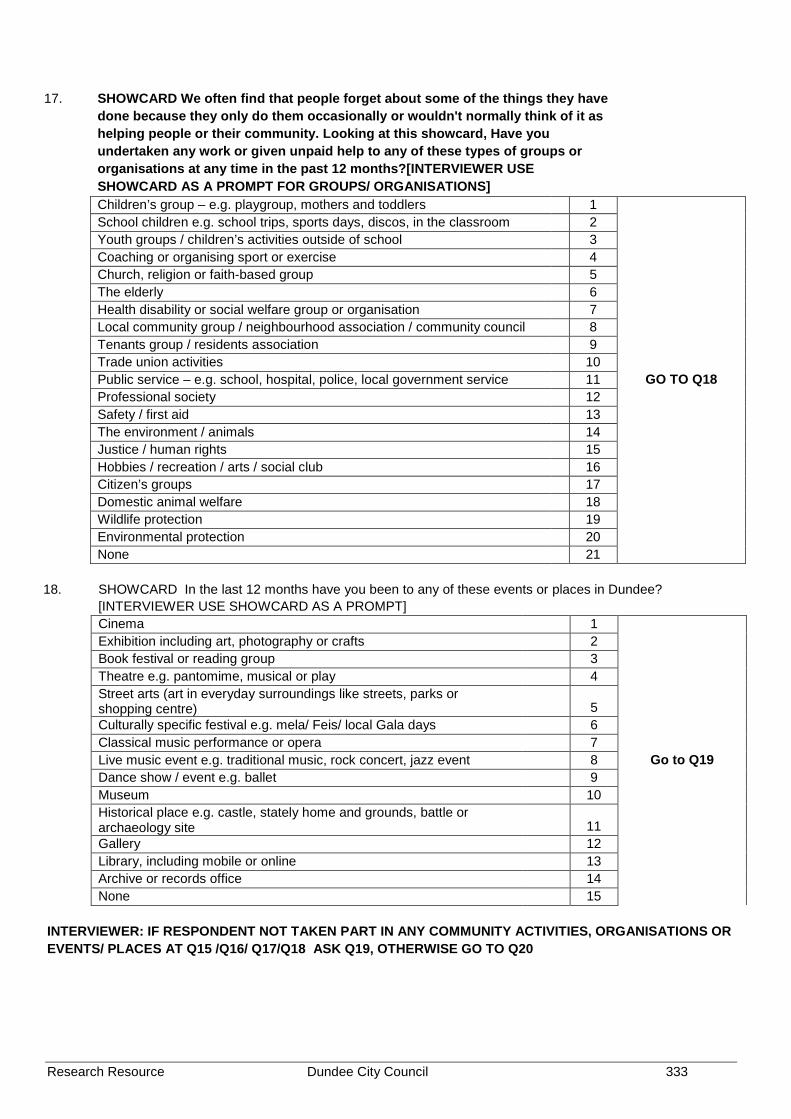
17. SHOWCARD We often find that people forget about some of the things they have
done because they only do them occasionally or wouldn't normally think of it as helping people or their community. Looking at this showcard, Have you undertaken any work or given unpaid help to any of these types of groups or organisations at any time in the past 12 months?[INTERVIEWER USE SHOWCARD AS A PROMPT FOR GROUPS/ ORGANISATIONS]
Children’s group – e.g. playgroup, mothers and toddlers 1
GO TO Q18
School children e.g. school trips, sports days, discos, in the classroom 2 Youth groups / children’s activities outside of school 3 Coaching or organising sport or exercise 4 Church, religion or faith-based group 5 The elderly 6 Health disability or social welfare group or organisation 7 Local community group / neighbourhood association / community council 8 Tenants group / residents association 9 Trade union activities 10 Public service – e.g. school, hospital, police, local government service 11 Professional society 12 Safety / first aid 13 The environment / animals 14 Justice / human rights 15 Hobbies / recreation / arts / social club 16 Citizen’s groups 17 Domestic animal welfare 18 Wildlife protection 19 Environmental protection 20 None 21
18. SHOWCARD In the last 12 months have you been to any of these events or places in Dundee? [INTERVIEWER USE SHOWCARD AS A PROMPT]
Cinema 1
Go to Q19
Exhibition including art, photography or crafts 2 Book festival or reading group 3 Theatre e.g. pantomime, musical or play 4
Street arts (art in everyday surroundings like streets, parks or shopping centre) 5
Culturally specific festival e.g. mela/ Feis/ local Gala days 6 Classical music performance or opera 7 Live music event e.g. traditional music, rock concert, jazz event 8 Dance show / event e.g. ballet 9 Museum 10
Historical place e.g. castle, stately home and grounds, battle or archaeology site 11
Gallery 12 Library, including mobile or online 13 Archive or records office 14 None 15 INTERVIEWER: IF RESPONDENT NOT TAKEN PART IN ANY COMMUNITY ACTIVITIES, ORGANISATIONS OR EVENTS/ PLACES AT Q15 /Q16/ Q17/Q18 ASK Q19, OTHERWISE GO TO Q20
Research Resource Dundee City Council 333

19. If you have not taken part in any community activities or organisations, can you tell me why this is?
It costs too much 1
GO TO Q20
I don't know enough about it 2 Never occurred to me 3 Not really interested 4 I don't have anyone to go with 5 I wouldn't enjoy it 6 Not enough facilities close to where I live 7 Health isn't good enough 8 I might feel uncomfortable or out of place 9 Lack of transport/ I can't easily get to it 10 Poor access to venues (e.g. no disabled ramps) 11 Not enough information on what is available 12 Didn't enjoy it last time 13 It's difficult to find the time 14 I would feel unsafe going to/from the activity/event 15 I would feel unsafe at the activity/event 16 Other, specify 17
20. S SHOWCARD . Please tell me to what extent you agree or disagree with the following statements (please take your response from this card):
Strongly agree
Tend to
agree
Neither agree nor disagree
Tend to disagree
Strongly disagree
No opinion
I can influence decisions affecting my local area
1 2 3 4 5 6
People in my community can influence decisions affecting my local area
1 2 3 4 5 6
SECTION 4: HEALTH
21. The next few questions are about your health. First of all could you tell me whether you are registered with… A) ….a GP or health centre? B)….a dentist?
YES NO DON’T KNOW A GP or health centre 1 2 3 A dentist? 1 2 3
22. How is your health in general? Would you say it is….. Very good 1
GO TO Q23
Good 2 Fair 3 Poor 4 Very poor 5 Don't know 6
23. SHOWCARD (THIS CONTAINS DEFINITIONS OF PHYSICAL ACTIVITY) In a typical week, how often do you undertake moderate physical activity for at least 30 minutes in a day?
4 days a week or more 1
GO TO Q24 1-3 days a week 2 Less than once a week 3 Never 4
Research Resource Dundee City Council 334

24. Are you, or have you ever been, a smoker? Currently smoke 1
GO TO Q25 Used to smoke 2 Never smoked 3
25. SHOWCARD – USE WHEEL IF NEED CLARIFICATION FOR MEN - How often do you have 8 units of alcohol a day (equivalent to 3 pints of strong beer)? FOR WOMEN - How often do you have 6 units of alcohol a day (equivalent to 2 large glasses of wine)?
Daily or almost daily 1
GO TO Q26
Weekly 2 Monthly 3 Less than monthly 4 Never 5 Don’t know 6
26. S SHOWCARD 9. I am going to read out statements about feelings and thoughts. Please say which option best describes your experience over the last 2 weeks. Please take your answer from this card
None of the time Rarely Some of
the time Often All of the time
I've been feeling optimistic about the future 1 2 3 4 5 I've been feeling useful 1 2 3 4 5 I've been feeling relaxed 1 2 3 4 5 I've been feeling interested in other people 1 2 3 4 5 I’ve had energy to spare 1 2 3 4 5 I’ve been dealing with problems well 1 2 3 4 5 I’ve been thinking clearly 1 2 3 4 5 I’ve been feeling good about myself 1 2 3 4 5 I’ve been feeling close to other people 1 2 3 4 5 I’ve been feeling confident 1 2 3 4 5
I’ve been able to make up my own mind about things 1 2 3 4 5
I’ve been feeling loved 1 2 3 4 5 I’ve been interested in new things 1 2 3 4 5 I’ve been feeling cheerful 1 2 3 4 5
27. SHOWCARD On a scale of 1 to 6 where 1 is not at all and 6 is a great deal, to what extent do you feel that people treat you unfairly?
1 - Not at all 1
GO TO Q28
2 2 3 3 4 4 5 5 6 – A great deal 6 Don’t know 7
Research Resource Dundee City Council 335

28. SHOWCARD To what extent do you agree with the statement: ‘I could turn to friends/
relatives in this neighbourhood for support? Strongly agree 1
GO TO Q29 Tend to agree 2 Tend to disagree 3 Strongly disagree 4 Don’t know 5 SECTION 5: EDUCATION
29. SHOWCARD Are you currently taking part in any of these forms of education/ classes or training?
None 1 GO TO Q31 On the job training 2 An FE college course 3 A university based course 4 Distance learning/ Open University 5 GO TO Q30 School 6 Adult education or evening class 7 Help with reading, writing or use of numbers 8 Other 9
30. What type of qualification, if any, will this lead to. Would it lead to…. No qualification 1
GO TO Q31 A qualification at degree level or above 2 Another qualification 3 SECTION 6: COMMUNITY SAFETY
31. Taking everything into account how safe do you feel your neighbourhood is as a place to live?
Very safe 1
GO TO Q32 Fairly safe 2 A bit unsafe 3 Very unsafe 4 Don’t know 5
32. S SHOWCARD . How safe do you feel when…
Very safe
Fairly safe
A bit unsafe
Very unsafe
Don’t know
Alone in your home during the day 1 2 3 4 5 Alone in your home at night 1 2 3 4 5 Walking alone in your neighbourhood during the day 1 2 3 4 5 Walking alone in your neighbourhood after dark 1 2 3 4 5
33. Do you think that the amount of crime in your neighbourhood has increased or decreased over the past year?
Decreased a lot 1 GO TO Q35 Decreased a little 2
Remained the same 3 Increased a little 4 GO TO Q34 Increased a lot 5 Don’t know 6 GO TO Q35
34. If you feel crime has increased in your neighbourhood, what has influenced your
Research Resource Dundee City Council 336

opinion? Personal experience of crime 1
GO TO Q35
Experience of family or friends 2 Talking to people in the area 3 Media – television, radio, paper 4 Social media internet sites eg Facebook, Twitter 5 Internet sites 6 Police or Council publications 7 Other 8 35. What, in your opinion, is the main factor which contributes most to the level of crime in your neighbourhood?
GO TO Q36
36. To what extent, if at all, does a fear of crime prevent you from taking part in your every day activities? Not at all 1
GO TO Q37 A little 2 Quite a lot 3 A great deal 4 SECTION 7: MONEY MATTERS [INTERVIEWER READ OUT] The next set of questions might seem very personal, but the Council is keen to find about levels of financial inclusion and people's financial security, including their ability to ‘cushion’ life’s unexpected problems. This includes being able to manage money effectively e.g. by having access to appropriate financial services and products. Please be assured that your responses to the survey are completely confidential
37. SHOWCARD Which of these accounts, if any, do you or your partner have? MULTI Bank account 1
GO TO Q38
Building society account 2 Credit union account 3 Post Office card account 4 No, none of these 5 Prefer not to say 6
38. Do you have insurance for the contents of your house such as for furniture, electrical goods etc?
Yes 1
GO TO Q39 No 2 Prefer not to say 3 Don’t know 4
39. Thinking about the total value of any savings or investments you have, at the moment do you (or your partner) have total savings or investments worth £1,000 or more in any combination of the places mentioned on this card, do you have less than £1,000 in savings or investment or do you have no savings or investments at all? SINGLE CODE
No savings 1
GO TO Q40 Less than £1,000 2 £1,000 or more 3 Don’t know 4 Prefer not to say 5
40. S SHOWCARD Are you currently experiencing, or within the last year have you had any difficulties with the following?
Mortgage or rent payments 1 GO TO Q41
Research Resource Dundee City Council 337

Changes to benefits 2 Council tax payments 3 Loan or credit card payments 4 Cost of food 5 Cost of domestic energy bills 6 Vehicle fuel prices 7 None of the above 8 Prefer not to say 9
41. SHOWCARD Taking everything together, which of these phrases on this card best describes how you and your household are managing financially these days? SINGLE CODE
Manage very well 1
GO TO Q42
Manage quite well 2 Get by all right 3 Don’t manage very well 4 Have some deep financial difficulties 5 Are in deep financial trouble 6 Refused 7 Don’t know 8 SECTION 8: CONTACTING YOUR COUNCIL
42. When you last contacted Dundee City Council, was this contact to …? READ OUT LIST. SINGLE CODE?
Make a complaint 1 GO TO Q43 Seek information 2 GO TO Q44 Request a service 3 GO TO Q45 Make a suggestion 4 GO TO Q46 Have never contacted the Council 5 GO TO Q51
43. SHOWCARD Overall, how satisfied were you that the Council responded reasonably to your complaint?
Very satisfied 1
GO TO Q46 Satisfied 2 Neither satisfied nor dissatisfied 3 Dissatisfied 4 Very dissatisfied 5
44. SHOWCARD Overall, how satisfied were you with this contact to seek information? Very satisfied 1
GO TO Q46 Satisfied 2 Neither satisfied nor dissatisfied 3 Dissatisfied 4 Very dissatisfied 5
Research Resource Dundee City Council 338

45. SHOWCARD Overall, how satisfied were you with this contact to request a service? Very satisfied 1
GO TO Q46 Satisfied 2 Neither satisfied nor dissatisfied 3 Dissatisfied 4 Very dissatisfied 5
46. On your most recent contact with the Council, did you….. Get what you need at that contact 1 GO TO Q47 Have to contact the Council again about the same issue 2
47. Was your most recent contact …. READ OUT LIST. SINGLE CODE By a letter 1 GO TO Q50 By a telephone call to the Council 2 GO TO Q48 By a personal visit to a Council office 3 GO TO Q49 By e-mail 4 GO TO Q50 By visiting the Council's website 5 GO TO Q52
48. S SHOWCARD . How satisfied or dissatisfied were you with your recent contact with the Council by telephone in terms of the following?
Very satisfied
Fairly satisfied
Neither nor
Fairly dissatisfied
Very dissatisfied
Don’t know
How easy it was for you to find the right number to call 1 2 3 4 5 6
How quickly the phone was answered 1 2 3 4 5 6
How easy it was to get through to someone who could help 1 2 3 4 5 6
Overall helpfulness/ friendliness/courtesy of the staff you dealt with 1 2 3 4 5 6
How well the staff understood what you wanted 1 2 3 4 5 6
The outcome of your contact 1 2 3 4 5 6 GO TO Q51
49. S SHOWCARD . How satisfied or dissatisfied were you with your recent
contact when visiting a Council office in terms of the following?
Very satisfied
Fairly satisfied
Neither nor
Fairly dissatisfied
Very dissatisfied
Don’t know
How easy it was to get to the office 1 2 3 4 5 6
The suitability of the office e.g. waiting areas, privacy, access for disabled people etc
1 2 3 4 5 6
Overall helpfulness/ friendliness/courtesy of the staff you dealt with 1 2 3 4 5 6
How well the staff understood what you wanted 1 2 3 4 5 6
The outcome of your contact 1 2 3 4 5 6 GO TO Q51
Research Resource Dundee City Council 339

50. S SHOWCARD . How satisfied or dissatisfied were you with your most
recent contact with the Council by email/ letter in terms of the following?
Very satisfied
Fairly satisfied
Neither nor
Fairly dissatisfied
Very dissatisfied
Don’t know
How quickly you received a reply to your e-mail/ letter 1 2 3 4 5 6
The extent to which the first reply you received answered your query 1 2 3 4 5 6
The outcome of your contact 1 2 3 4 5 6 GO TO Q51
51. Have you ever used the Council's website? Yes 1 GO TO Q52 No 2 GO TO Q53
52. S SHOWCARD . How would satisfied or dissatisfied would you way you
are with the website in terms of the following?
Very satisfied
Fairly satisfied
Neither nor
Fairly dissatisfied
Very dissatisfied
Don’t know
Not applic
How easily you managed to find the information you wanted 1 2 3 4 5 6 7
The amount of information provided on the website 1 2 3 4 5 6 7
53. Generally, do you feel that you receive enough information about the Council and the
services it provides? Yes 1 GO TO Q54 No 2
54. Q SHOWCARD . Do you access, and use, the internet in any of the following ways… CODE ALL THAT APPLY
Internet access at home 1 Internet access via a mobile phone 2 Internet access at work 3 GO TO Q55 Internet access through public access eg at library 4 Access the internet in some other way 5 None of these – I do not access the internet 6
55. YES NO
Do you know that the Council have procedures in place to respond to situations where vulnerable adults might be at risk of harm? 1 2
GO TO Q56 In general, would you know who to contact if you had concerns that a
vulnerable adult was at risk of being abused? 1 2
Research Resource Dundee City Council 340
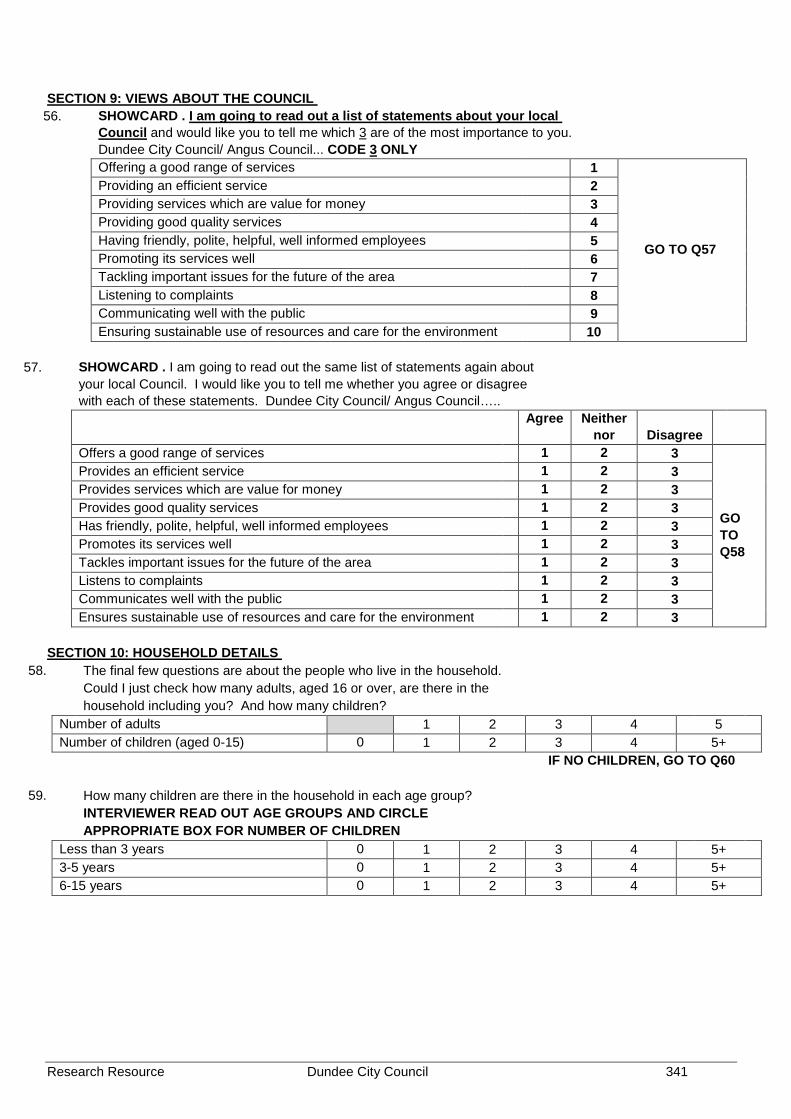
SECTION 9: VIEWS ABOUT THE COUNCIL
56. Q SHOWCARD . I am going to read out a list of statements about your local Council and would like you to tell me which 3 are of the most importance to you. Dundee City Council/ Angus Council... CODE 3 ONLY
Offering a good range of services 1
GO TO Q57
Providing an efficient service 2 Providing services which are value for money 3 Providing good quality services 4 Having friendly, polite, helpful, well informed employees 5 Promoting its services well 6 Tackling important issues for the future of the area 7 Listening to complaints 8 Communicating well with the public 9 Ensuring sustainable use of resources and care for the environment 10
57. Q SHOWCARD . I am going to read out the same list of statements again about
your local Council. I would like you to tell me whether you agree or disagree with each of these statements. Dundee City Council/ Angus Council…..
Agree Neither nor Disagree
Offers a good range of services 1 2 3
GO TO Q58
Provides an efficient service 1 2 3 Provides services which are value for money 1 2 3 Provides good quality services 1 2 3 Has friendly, polite, helpful, well informed employees 1 2 3 Promotes its services well 1 2 3 Tackles important issues for the future of the area 1 2 3 Listens to complaints 1 2 3 Communicates well with the public 1 2 3 Ensures sustainable use of resources and care for the environment 1 2 3
SECTION 10: HOUSEHOLD DETAILS
58. S The final few questions are about the people who live in the household. Could I just check how many adults, aged 16 or over, are there in the household including you? And how many children?
Number of adults 1 2 3 4 5 Number of children (aged 0-15) 0 1 2 3 4 5+
IF NO CHILDREN, GO TO Q60
59. S How many children are there in the household in each age group? INTERVIEWER READ OUT AGE GROUPS AND CIRCLE APPROPRIATE BOX FOR NUMBER OF CHILDREN
Less than 3 years 0 1 2 3 4 5+ 3-5 years 0 1 2 3 4 5+ 6-15 years 0 1 2 3 4 5+
Research Resource Dundee City Council 341

60. SHOWCARD . I'd like to record some basic information about the gender and age of each adult in the
household. Firstly, can I check which of these age groups you fall into? Then could we take the other adults in turn and I'd simply like to record for each whether they are male or female and their broad age group. CODE DETAILS BELOW
Person Gender Age Male Female 16-
24 25-34
35-44
45-54
55-59
60-64
65-74
75+
1. Respondent 2. 3. 4. 5. 6.
61. Q How many motor vehicles does your household have access to for personal use? (this
includes motorbikes, mopeds, cars, vans etc) 1 1 2 2 3 3 GO TO Q62 4 or more 4 None 5
62. Do you or any member of your household have a disability? (SINGLE CODE) Yes 1 GO TO Q63 No 2 GO TO Q64
63. SHOWCARD . What is the nature of the disability? (MULTI CODE) Mental health condition 1
GO TO Q64
Mobility/ physical disabilities 2 Learning difficulties (eg dyslexia) 3 Difficulties with sight 4 Learning disability (eg Down’s Syndrome) 5
Developmental disorder (eg Autistic Spectrum Disorder or Asperger's syndrome) 6
Difficulties with hearing 7
Other condition (please write in)
8
Don’t know 9
64. SHOWCARD . Can you please look at this card and specify what is your religion? SINGLE CODE
None 1
GO TO Q65
Church of Scotland 2 Roman Catholic 3 Other Christian 4 Buddhist 5 Hindu 6 Jewish 7 Muslim 8 Sikh 9
Another religion (please specify) 10
Would rather not say 11
Research Resource Dundee City Council 342

65. SHOWCARD . Which of the groups on this card do you consider you belong to?
SINGLE CODE ONLY White Scottish 1
GO TO Q66
Other British 2 Irish 3 Gypsy/ Traveller 4 Polish 5 Any other white ethnic group 6 Any mixed or multiple ethnic groups 7 Asian, Asian Scottish or Asian British Pakistani, Pakistani Scottish or Pakistani British 8 Indian, Indian Scottish or Indian British 9 Bangladeshi, Bangladeshi Scottish or Bangladeshi British 10 Chinese, Chinese Scottish or Chinese British 11 Other 12 African, Caribbean or Black African, African Scottish or African British 13 Caribbean, Caribbean Scottish or Caribbean British 14 Black, Black Scottish or Black British 15 Other 16 Other Ethnic Background Arab 17 Any other Background 18 Refused 19 Don’t know 20
66. SHOWCARD . I have a card here on which various sums of money are shown grouped together. Would you mind looking at the card and tell me in which group your overall annual household income falls. Please use net income from all sources i.e. after deductions of income tax, national insurance and other compulsory deductions. Please take into account any money you may have from employment, including bonuses, overtime, pensions, state pensions, welfare benefits and interest from savings.
Less than £100 per week / £5,199 per year 1
THANK AND CLOSE
£100-199 per week / £5,200 - £10,399 per year 2 £200-299 per week / £10,400-£15,599 per year 3 £300-399 per week / £15,600-£20,199 per year 4 £400-£499 per week / £20,800 - £25,999 per year 5 £500-£599 per week / £26,000 - £31,199 per year 6 £600 or more per week / £31,200 or more per year 7 Don't Know 8 Would rather not say 9
Thank and close statement • Thank you very much for answering my questions. • Are you happy to sign the questionnaire to verify that you have taken part in the survey and your answers have
been recorded accurately? ‘I confirm that this interview has been conducted in a proper manner and that the interviewer has accurately recorded the information I have provided’.
Signature
Print name
Research Resource Dundee City Council 343

Appendix 3
Technical Report Summary
Research Resource Dundee City Council 344

TECHNICAL REPORT SHEET – QUANTITATIVE RESEARCH Project number P766 Project name Dundee Citizens’ Survey
Objectives of the research
The specific research objectives of the 2015 Citizen Survey were as follows. To establish the public’s views on general and specific
aspects of life in Dundee, including: o The home and neighbourhood o Health o Education and employment o Community safety o Financial issues.
To establish levels of satisfaction with public services To establish the customer experience when contacting
the Council To strengthen the evidence base which will support and
inform the development of Dundee’s Single Outcome Agreement.
Target group Those who live in Dundee Council area
Target sample size 1800 interviews
Achieved sample size
1817 interviews
Electoral Ward Sample Base 2015
Survey
Population (adults
aged 16+ years)
Confidence Interval (at 95%)
Dundee City West End 101 18657 +/- 9.7% Dundee City - Maryfield 202 14499 +/- 6.9% Dundee City - The Ferry 100 16380 +/- 9.8% Dundee City - Coldside 200 17651 +/- 6.9% Dundee City - Lochee 302 15751 +/- 5.6% Dundee City - East End 301 13243 +/- 5.6% Dundee City - North East 310 11954 +/- 5.5%
Dundee City - Strathmartine 301 15429 +/- 5.6%
Total Dundee 1817 123564 +/- 2.3%
Research Resource Dundee City Council 345

Date of fieldwork 5th October to the 6th of November
Sampling method
The sample structure was designed to replicate the sampling methodology and structure utilised in the previous survey. This involved a disproportionate sampling methodology where: 800 interviews were completed with the general population
of Dundee (100 in each of the 8 wards) 1,000 interviews were carried out within community
regeneration areas (200 in each of the 5 regeneration areas)
The “disproportionate” sampling approach was used previously and involves delivering the same number of interviews in each Ward or regeneration area, regardless of the actual population size of the area. This ensures the data for each Ward or regeneration area can be directly compared (with the same level of accuracy). The “disproportionate” aspect is eliminated in the results by applying appropriate statistical reweighting to balance survey data to be reflective of the entire population. Within each area, a random sample was drawn to ensure coverage across each area. Interviewing was scheduled over day time, evening and weekends to ensure all segments of the working and non working population had the opportunity to participate.
Data collection method Face to face methodology Response rate and definition and method of how calculated N/A Any incentives? No Number of interviewers 8
Interview validation methods
10% of each interviewers work was back checked to ensure that interviews have been completed accurately and in line with ISO 20252 standards.
Showcards or any other materials used? Showcards used as per instructions on questionnaire Weighting procedures (if applicable) Not applicable Estimating and imputation procedures (if applicable) Not applicable
Reliability of findings At the overall Dundee level the margin of error associated with the results is +/-2.3%. (based upon a 50% estimate at the 95% level of confidence).
Research Resource Dundee City Council 346