Citizen Oversight Panel financial plan update and proposed ...
29
Financial Plan update and proposed 2022 Budget Citizen Oversight Panel 11/17/21
Transcript of Citizen Oversight Panel financial plan update and proposed ...

Financial Plan update and
proposed 2022 Budget
Citizen Oversight Panel11/17/21
2
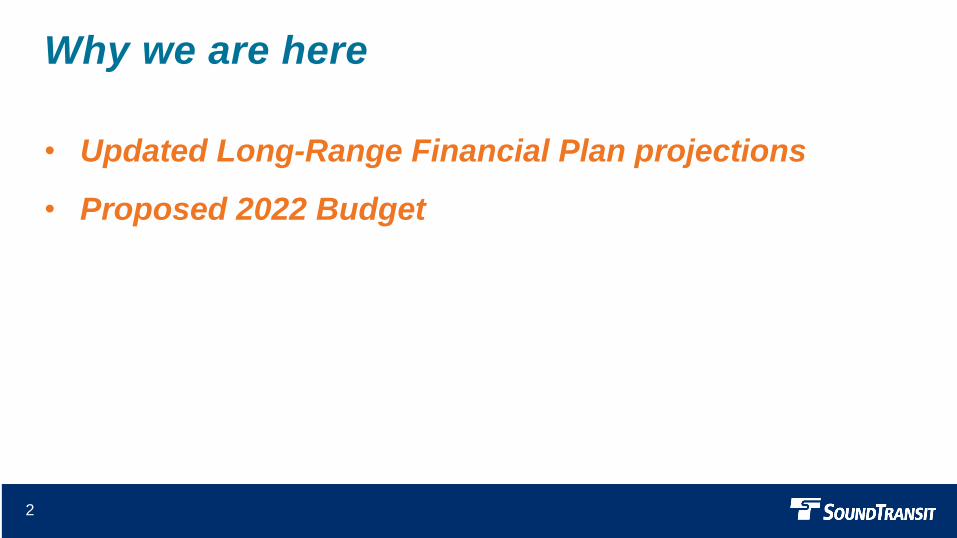
Why we are here
• Updated Long-Range Financial Plan projections
• Proposed 2022 Budget

3
Long-Range Financial Plan projections and 2022 Budget
3
Long-Range Financial Plan Projections 2017 - 2046
Transit Improvement Plan to 2027
Budget 2022
Including Sound Move, ST2, and ST3 sources and uses through 2046
Board-approved costs for active projects through 2027
Annual revenue, financing sources and expenditures for 2022

4
Basis for the Financial Plan
1. Financial Plan projections are based on affordable schedules
approved in realignment
- Staff continue to manage projects with focus on achieving target
schedules
2. October updates include tax revenue, fare revenue, project
inflation, operating expenditures, and debt issuance
3. Next steps in early 2022: Annual Program Review and
continuing work to meet target schedules

5
5
Financial projections 2017-2046
Board-adopted financial policies
Program costs from
engineers’ estimates
Key planning assumptions
Independent revenue and
inflation forecasts
Budget and audited
financials
(2017-2022)
Long-Range Financial Plan projections

6
Key takeaways
Realigned Financial Plan (affordable schedule) remains
affordable. Updates will have little impact on gaps for achieving
target schedules.
• Projected higher tax revenue coincides with projected higher
inflation (CCI and CPI)
• Higher debt capacity (AV) coincides with higher right-of-way costs
(ROWI)
• Cost growth outpaced revenue growth, additional debt will be issued
to cover the difference.

7
Major changes and impacts on the Financial Plan
8
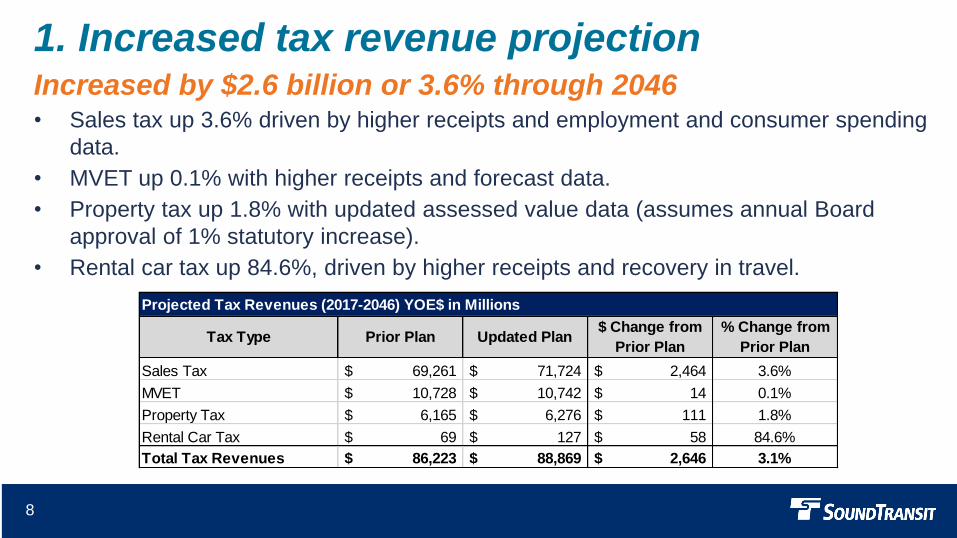
1. Increased tax revenue projectionIncreased by $2.6 billion or 3.6% through 2046 • Sales tax up 3.6% driven by higher receipts and employment and consumer spending
data.
• MVET up 0.1% with higher receipts and forecast data.
• Property tax up 1.8% with updated assessed value data (assumes annual Board
approval of 1% statutory increase).
• Rental car tax up 84.6%, driven by higher receipts and recovery in travel.
Projected Tax Revenues (2017-2046) YOE$ in Millions
Tax Type Prior Plan Updated Plan$ Change from
Prior Plan
% Change from
Prior Plan
Sales Tax $ 69,261 $ 71,724 $ 2,464 3.6%
MVET $ 10,728 $ 10,742 $ 14 0.1%
Property Tax $ 6,165 $ 6,276 $ 111 1.8%
Rental Car Tax $ 69 $ 127 $ 58 84.6%
Total Tax Revenues $ 86,223 $ 88,869 $ 2,646 3.1%

9
2. Decreased fare revenue projectionFare revenue projections lower by $0.6 billion or 7.2%
through 2046
• Lower near-term ridership update resulted in projected $0.6 billion fare revenue
decrease combined for all modes.
• Long term ridership update will be available towards the end of the year.
• Farebox recovery does not meet policy requirements.
Projected Fare Revenues, YOE$ in Millions
Tax Type
$ Change from
Prior Plan,
2017-2046
% Change from
Prior Plan
Light Rail $ (59) -0.9%
Tacoma Link $ (23) -15.3%
Sounder $ (155) -21.6%
STEX $ (180) -31.2%
Stride $ (230) -36.3%
Total $ (646) -7.2%

10
3. Increased capital and State of Good Repair (SOGR)cost projections
1
$2.0 billion or 2.5% increase in capital and SOGR cost forecasts through 2046
• Higher inflations drive projected capital cost increase: $1.5 billion
• Right-of-way (ROWI): +$0.7 billion
• Cost of construction index (CCI): +$0.6 billion
• CPI: +$0.2 billion
• Higher inflations drive projected SOGR cost increase: $0.5 billion
• CCI: +$0.4 billion
• CPI: +$0.2 billion
• Update of assumptions based on actuals/ TIP: -$0.1 billion

11
4. Increased operating cost projections
1
$3.0 billion or 9.1% projected increase in Operating Cost through 2046
• Projected purchased transportation cost growth: +$2.1 billion
• East Link staffing adds: $0.5B
• Forecasted additional Link staffing adds (LLE, FW, DRLE): $0.7B
• Long term purchased transportation cost inflation*: $0.9B
• Projected Agency costs to keep pace with system growth: +$0.9 billon
• Insurance cost: $0.4 billion
• Agency operations: $0.3 billion
• ORCA Next Gen Regional costs: $0.2 billion (this cost is reimbursed)
* Inflation: 5% through 2027, ~4% thereafter. 2016-2019 normalized purchased transportation inflation was 5.7%

12
5. Increased bond proceeds
1
Additional costs funded by revenue, cash
and additional $3.8 billion or 16% in bond
proceeds
• Cost growth outpaces revenue growth.
• $3.8B in additional debt projected to be
issued to fund increased costs not covered
by revenue growth and cash.
• Additional debt capacity to cover projected
debt increase made available through
increased assessed valuation.
Funded by Higher
Revenue , $2,248 ,
34%
Funded by Cash, $501
, 8%
Funded by New Debt,
$3,769 , 58%
How are higher expenditures funded?
(YOE$ in Millions through 2046)

13
6. Increased debt service
• Debt service through 2046 projected to increase $1.3
billion or 6.6%
• Principal and interest payment required through 2046 for the
additional debt issued to fund difference between
expenditures and revenues growth.

14
Higher assessed value creates capacity to fund increased costs with
additional debt through 2046. Realigned Financial Plan (affordable
schedule) remains affordable. Target schedule remains unaffordable with
gap roughly unchanged.
1
$-
$5
$10
$15
$20
$25
$30
$35
2021 2022 2023 2024 2025 2026 2027 2028 2029 2030 2031 2032 2033 2034 2035 2036 2037 2038 2039 2040 2041 2042 2043 2044 2045 2046
YOE$
in B
illio
ns
Debt Capacity – Prior Plan to Updated Plan
Prior Plan Principal Balance
Updated Plan - Affordable Schedule Principal Balance
Updated Plan - Target Schedule Principal Balance
Prior Plan AV
Updated Plan AV

2022 Proposed Budget
Citizen Oversight Panel11/17/21
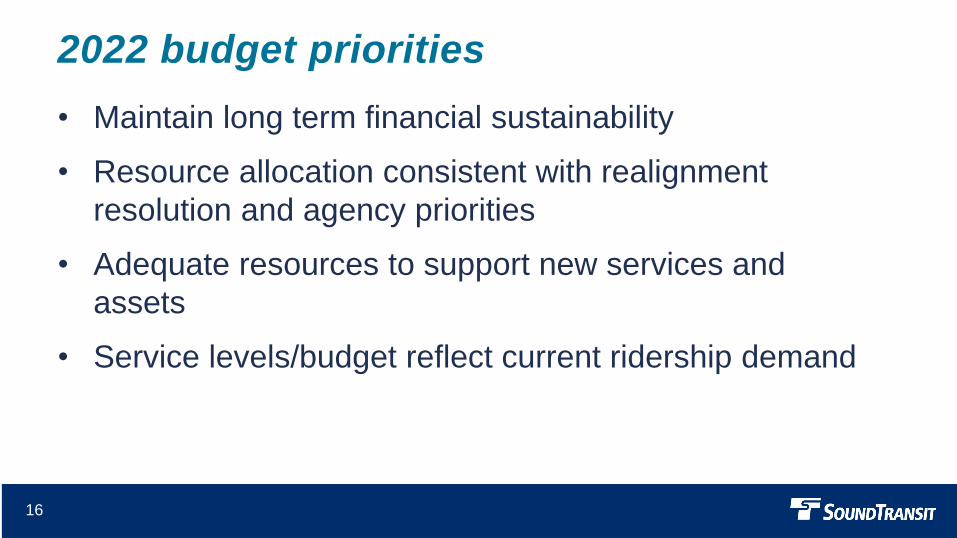
16
• Maintain long term financial sustainability
• Resource allocation consistent with realignment
resolution and agency priorities
• Adequate resources to support new services and
assets
• Service levels/budget reflect current ridership demand
2022 budget priorities
Revenues & funding sources

18
2022 tax revenues: $2.3 billion
In $million 2021
Forecast
2022
Proposed
% Change
Sales & Use Tax 1,577 1,685 7%
MVET 387 404 5%
Property Tax 157 165 5%
Rental Car Tax 3 3 3%
Total Tax Revenues $2,124 $2,258 6%
• Sales and use tax = 49% of all 2022 total revenue and financing sources
• Total tax revenues 6% above 2021 forecast
*Numbers may not sum due to rounding.

19
2022 other revenue and financing sources: $1.2 billion
In $Million 2021
Forecast
2022
Proposed
%
Change
Federal Grants 793 498 (37)%
Fare Revenues 20 36 79%
Investment /
Misc Revenues
27 31 18%
Total Other $840M $566M (33)%
TIFIA 87 615 NA
• Federal grants lower in 2022
due to CRRSAA /ARP
funding in 2021
• Fare revenues assumed up
with Northgate and as we
begin to regain ridership
• Higher ORCA regional
reimbursement
• TIFIA draws for OMFE in
2021 & Northgate in 2022
*Numbers may not sum due to rounding.
Expenditures

21
In $million 2021
Forecast
2022
Proposed
Projects 2,204 2,365
Transit Operating 368 444
Debt Service & Other 199 220
Total $2,770 $3,029
*Numbers may not add correctly due to rounding.
2022 proposed expenditures: $3.0 billion
Other includes debt service, tax collection & fees, contributions to partner
agencies, operating leases, and operating contingency

22
In $million 2021
Forecast
2022
Proposed
System Expansion 2,057 2,135
Enhancements 22 48
State of Good Repair 28 70
Administrative 112 132
Less charges to Transit Operating (15) (21)
Total $2,204 $2,365
*Numbers may not add correctly due to rounding.
2022 projects budget: $2.4 billion
Reflects Board realignment resolution

23
2022 transit operating budget: $444 million
$M2021
Forecast
2022
Proposed
Increase
($)
Increase
(%)
Transit Operating $368 $444 $77 21%
2022 budget is 21% growth over 2021 forecast• Growth to support service expansion, 11%
• Service increase to accommodate 2022 ridership demand and
cost escalation due to inflation, 7%
• State of good repair and other maintenance, 2%
• Insurance, 1%
24
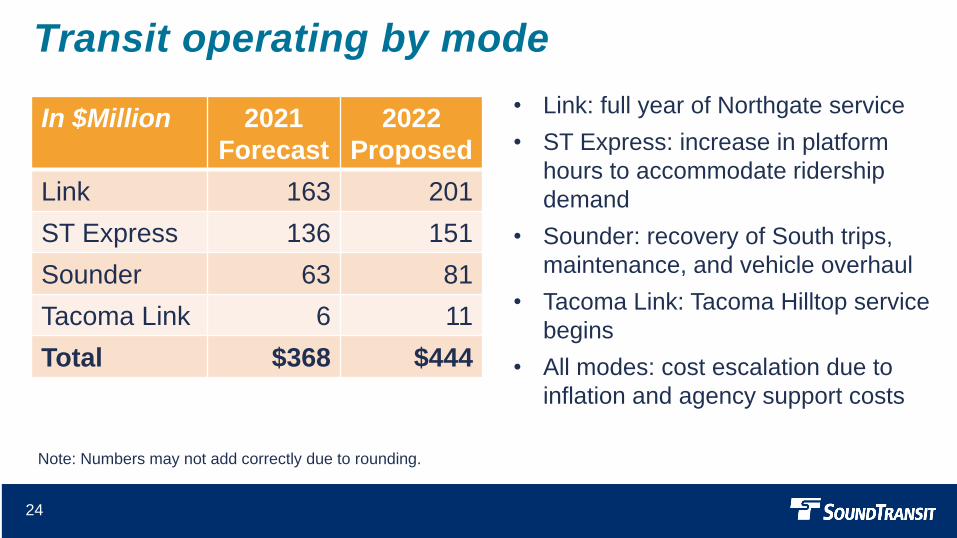
In $Million 2021
Forecast
2022
Proposed
Link 163 201
ST Express 136 151
Sounder 63 81
Tacoma Link 6 11
Total $368 $444
Note: Numbers may not add correctly due to rounding.
Transit operating by mode
• Link: full year of Northgate service
• ST Express: increase in platform
hours to accommodate ridership
demand
• Sounder: recovery of South trips,
maintenance, and vehicle overhaul
• Tacoma Link: Tacoma Hilltop service
begins
• All modes: cost escalation due to
inflation and agency support costs

25
2022 debt service and other: $220 million
• Debt service includes principal
repayment, interest expense and
financing expenses
• Tax collection fees to WA DOR for
rental car and sales & use taxes; DOL
for MVET collection
• Sales & use tax offset fee based on
3.25% of eligible construction costs
for FWLE and DRLE
• Contributions: First Hill Street Car
payment to the City of Seattle
In $Millions 2021
Forecast
2022
Proposed
Debt Service 150 157
Tax Collection Fees 10 9
Sales & Use Tax Offset Fee 17 20
Partner Contributions 5 5
Leases 16 17
Operating Contingency* 2 13
Total $201 $220
Note: Numbers may not add correctly due to rounding.
*Operating Contingency budget is equivalent to 2.0% of proposed operating budget.

Budget timeline
and next steps

27
Potential budget adjustment needed in 2022
Mid year budget adjustment may be requested from the Board:
• Increased service to meet higher ridership demand
• Continued COVID-related cost increases
• Adjustment to projects resulting from Annual Program
Review

28
Timeline
• October – overview of Long-Range Financial Plan
projections and budget
• November – budget reviews by Board committees
• December – budget recommendation and approval

Thank you.
soundtransit.org
![Arizona Citizen Review Panel Annual Report 2016term:name]/[node... · Arizona Citizen Review Panel Annual Report 2016 Prepared for the Department of Child Safety by Arizona State](https://static.fdocuments.in/doc/165x107/5f0894f97e708231d422b88e/arizona-citizen-review-panel-annual-report-2016-termnamenode-arizona-citizen.jpg)