Citizen Oversight of the Albany Police, 2010 F I N N
61
423 New Karner Road Suite 5 Albany, NY 12205 518.456.6323 Citizen Oversight of the Albany Police, 2010 Robert E. Worden & Sarah J. McLean A Report Prepared for the Albany Citizens’ Police Review Board, the City of Albany, and the Albany Law School Government Law Center F I N N The John F. Finn Institute For Public Safety, Inc. Robert E. Worden, Ph.D., Director • Sarah J. McLean, Ph.D., Associate Director
Transcript of Citizen Oversight of the Albany Police, 2010 F I N N

423 New Karner Road
Suite 5
Albany, NY 12205
518.456.6323
Citizen Oversight of the Albany Police, 2010
Robert E. Worden & Sarah J. McLean
A Report Prepared for the Albany Citizens’ Police Review Board, the City of Albany,
and the Albany Law School Government Law Center
F I N N
The John F. Finn Institute
For Public Safety, Inc.
Robert E. Worden, Ph.D., Director • Sarah J. McLean, Ph.D., Associate Director
i
The John F. Finn Institute for Public Safety, Inc., is an independent, not-for-profit and non-partisan corporation, whose work is dedicated to the development of criminal justice strategies, programs, and practices that are effective, lawful, and procedurally fair, through the application of social science findings and methods. The Institute conducts social research on matters of public safety and security – crime, public disorder, and the management of criminal justice agencies and partnerships – in collaboration with municipal, county, state, and federal criminal justice agencies, and for their direct benefit. The findings of the Institute’s research are also disseminated through other media to criminal justice professionals, academicians, elected public officials, and other interested parties, so that those findings may contribute to a broader body of knowledge about criminal justice and to the practical application of those findings in other settings.
The Finn Institute was established in 2007, building on a set of collaborative projects and relationships with criminal justice agencies dating to 1998. The first of those projects, for which we partnered with the Albany Police Department (APD), was initiated by John Finn, who was at that time the sergeant who commanded the APD’s Juvenile Unit. Later promoted to lieutenant and assigned to the department’s Administrative Services Bureau, he spearheaded efforts to implement problem-oriented policing, and to develop an institutional capability for analysis that would support problem-solving. The APD’s capacity for applying social science methods and results thereupon expanded exponentially, based on Lt. Finn’s appreciation for the value of research, his keen aptitude for analysis, and his vision of policing, which entailed the formulation of proactive, data-driven, and – as needed – unconventional strategies to address problems of public safety. Lt. Finn was fatally shot in the line of duty in 2003. The Institute that bears his name honors his life and career by fostering the more effective use of research and analysis within criminal justice agencies, just as Lt. Finn did in the APD.
© 2010, The John F. Finn Institute for Public Safety, Inc.

ii
Acknowledgements We gratefully acknowledge the support and cooperation of the Albany Law School’s Government Law Center, especially its Director, Patricia Salkin, and the CPRB Coordinator, Sharmaine Moseley. We are indebted to the research team at the Finn Institute: Heidi Bonner, who (re)developed the survey instruments, established the framework for mailing survey forms to Albany households, and executed the sampling strategy for the resident survey; Chris Kelly, who conducted the interviews with complainants in 2009-2010; Jessica McCormick, who performed bibliographic searches, data entry, and all manner of administrative chores; and Andy Wheeler, who assisted with some of the analysis.

iii
TABLE OF CONTENTS
I 1-23
COMPLAINANT SURVEY 1-23
INTRODUCTION 1
PREVIOUS FINDINGS 1-2
COMPLAINANTS 2001-2009 2-23
SURVEY METHODS 3-4
SUBJECTS OF COMPLAINTS 4
OUTCOMES OF COMPLAINTS 4-6
COMPLAINANTS’ SATISFACTION 6-7
CORRELATES OF COMPLAINANTS’ SATISFACTION 7-22
Outcomes 8-9
Complainants’ Goals 9-11
Experience with Intake 11
Experience with Investigation 11-13
TIMELINESS 14
PROCEDURAL FAIRNESS 14-21
INFLUENCES ON SATISFACTION 22
SUMMARY 22-23
II 24-43
RESIDENTS, 2009 24-40
SURVEY METHODS 24-26
RESIDENTS’ PERCEPTIONS OF POLICE 27-33
Satisfaction with the Police 27-32
Perceived Problems with the Police 32-33
PERCEPTIONS AMONG RESIDENTS WHO CALLED APD FOR ASSISTANCE 33-35
Satisfaction with the Police 35-38
RESIDENTS’ PERCEPTIONS OF THE COMPLAINT PROCESS 35-38
Reasons for Complaints 35-36
The Decision to Complain 36-37
The Complaint Experience 37-38
CITIZENS’ POLICE REVIEW BOARD 38-40
Residents’ Awareness of CPRB 38-39
Residents’ Perceptions of CPRB 39-40
SUMMARY 40
CONCLUSIONS 40-43
APPENDIX: RESIDENT SURVEY SUMMARY TABLES
Citizen Oversight of the Albany Police, 2010
1
Introduction
Created by legislation that was signed into law in July of 2000, the Albany Citizens‟ Police Review Board (CPRB) became operational in May of 2001. The same legislation that created the CPRB also provided for a contractor “to conduct surveys of complainants concerning the level of their satisfaction with the process and to conduct surveys of the community to get feedback concerning the CPRB and the Police Department.” We conducted surveys pursuant to this mandate, under a contract with the Government Law Center, between 2001 and 2004. We surveyed two populations: complainants, and people who had a contact with the Albany police, whom we called “clients.” In addition, under a contract with the Albany Police Department, we surveyed Albany residents in 2001, and again in 2002.
We contracted with the Government Law Center and resumed surveying for and about the CPRB in 2009, with a survey of complainants and a survey of Albany residents. We sought to survey all of the complainants whose cases were disposed by the CPRB since the discontinuation of surveying in 2004. We also surveyed a sample of Albany residents, asking them about their perceptions of police services in Albany and about their awareness of the CPRB.
In this report, we briefly summarize the results of our previous survey research, and then we present the findings from the more recent surveys. We analyze data on all of the complainants across the 2001-2009 period, examining patterns that we were not able to examine previously with a much smaller number of respondents. We also summarize findings from the 2009 resident survey. We include in these discussions references to studies of other complaint review systems, though such studies are few in number. We also offer some recommendations for consideration by the CPRB.
Previous Findings
From our survey of residents, in 2001-2002, we found:
Most residents of Albany (80 percent) were satisfied with the quality of police services, and most residents had favorable views of the performance of Albany police on more specific dimensions of police work (e.g., in keeping order, in working with residents).
Most residents (two thirds) did not then perceive police misconduct as a problem in their neighborhoods, but a large majority of the African-American population did perceive one or more forms of police misconduct as a problem in their neighborhoods.
Somewhat more than one half of residents believed that Albany had a “civilian review board”; one fifth did not know whether or not Albany had such a board, and more than one quarter believed that Albany did not have civilian review.
From our survey of clients, in 2001-2004, we found:
Most people who had contact with the Albany police were satisfied with how they were treated by police (75 percent) and with how police handled their problem (80 percent).
Most people who were dissatisfied with some aspect of their contact with the police cited as the reason either less serious forms of misconduct - discourtesy, for example - or poor service - such as a lack of concern or understanding, or an inability to solve the problem.
Most of those who were dissatisfied (81 percent) - most even of those who believed

Citizen Oversight of the Albany Police, 2010
2
that police engaged in misconduct (77 percent) - did not take any action to complain. Whether or not a complaint was made turned to some degree on perceptions of the complaint review process, especially would-be complainants‟ confidence in complaint investigations: citizens who believed that complaint investigations are thorough, and thus believe that they can be efficacious in complaining, were more likely to complain, given a reason to complain.
Furthermore, citizens‟ confidence in the complaint review process was affected by their awareness that citizens participate in complaint review, which suggests that the CPRB enhances the legitimacy of the complaint review system. But most clients (two-thirds) were not aware of citizen oversight in Albany.
Most of those who took action to complain did not direct their complaints to the Office of Professional Standards (OPS) or the CPRB. The formal complaint review process is one element of a set of mechanisms by which aggrieved citizens can be heard and seek the resolution of their concerns, as they consider appropriate, and through which citizen feedback on police performance is channeled to police executives.
From the complainant survey, in 2001-2004, we found:
Most CPRB complainants were not satisfied with how their complaints were handled or with the outcomes of their complaints. They doubted the thoroughness of the investigations. They did not understand how the outcome was reached or, in many cases, what it meant.
Complainants‟ satisfaction was strongly influenced by the disposition: complainants whose complaints were sustained were much more likely to be satisfied.
Complainants, 2001-2009
Citizen involvement in complaint review can take any of a number of different
forms, and one can find many variations on this theme in cities across the United States. Some efforts have been made to reduce this complexity in order to describe the main features of citizen review. One such effort describes four “models” of citizen review:
complaint review that provides for fact-finding investigations of complaints by persons who are not sworn police officers (i.e., “external” investigations), reports of which are reviewed by other civilian officials, who make recommendations about disposition to the police executive;
complaint review that provides for investigations conducted by police personnel (“internal” investigations) with citizen input in the review of investigative reports, whereby citizens may monitor police handling of complaints;
complaint review that provides for citizen involvement in an appellate capacity, with a board to which complainants may appeal if they are dissatisfied with the outcomes of their complaints;
complaint review that provides not only for citizen involvement in the review of police investigations of individual cases, but also for a citizen role in reviewing police policies and procedures and making recommendations for change.1
1 Samuel Walker, Police Accountability: The Role of Citizen Oversight (Belmont, Cal.:
Wadsworth, 2001), pp. 61-63. However, this set of models might oversimplify the structure of complaint review and thereby obfuscate elements of the complaint review process to which attention could be usefully devoted. Citizen involvement in complaint intake might be important, for example, but it is not a feature that is highlighted in these models of citizen review. For somewhat different formulations, see Douglas W. Perez, Common Sense about Complaint
Citizen Oversight of the Albany Police, 2010
3
Albany‟s CPRB would appear to fit into the last category, providing for a high degree – but not the highest degree – of independence from the police in the review of citizens‟ complaints.
Citizen involvement in complaint review is thought to have a number of salutary effects. It might improve:
the perceived receptivity of the complaint review system to complaints;
the perceived efficacy of the complaint review system;
the rate at which perceived misconduct is reported to authorities;2
the (actual and/or perceived) depth and thoroughness of complaint investigations;
the satisfaction of complainants with their experiences with the complaint review system; and
the fairness of complaint review, as it is judged by complainants. Many of these outcomes would be detectable among complainants, and the survey was designed to tap relevant perceptions. We begin with some background on survey methodology, and on the subjects and outcomes of complaints processed by the CPRB. We then summarize survey findings on complainants‟ satisfaction, both with the outcomes of their complaints and with how their complaints were handled, which is mainly a story of dissatisfaction. We thereupon consider a number of factors with which complainants‟ satisfaction is associated, or with which one would expect it to be associated, with a view toward clues about why complainants are dissatisfied. Those factors include the outcome of the complaint (both the actual outcome and the outcome as complainants understand it), complainants‟ goals in filing complaints, complainants‟ experiences with complaint intake and complaint investigation, and other elements of the complaint review process that have, in theory, a bearing on complainants‟ perceptions of procedural fairness. Survey Methods
From 2001 through September of 2004, we conducted a survey of complainants on a rolling basis, contacting complainants shortly after their cases were disposed by the CPRB. We made efforts to contact every complainant, and not only a sample. We provided mainly for a phone interview with each complainant, but in a number of cases (i.e., when we learned that the complainant was lodged at the Albany County Correctional Facility) we conducted face-to-face interviews with complainants. During this period, 122 disposed complaints were filed by 108 complainants. We interviewed 49 (45.3%) of those complainants, who were responsible for 54 of the complaints. Very few (four) complainants refused to participate, but we were unable to contact the remainder. We would note that the response rate was high compared with those of other surveys of complainants.
Review (Philadelphia: Temple University Press, 1994), and Wayne A. Kerstetter, Who Disciplines the Police? Who Should? in William A. Geller (ed.), Police Leadership in America: Crisis and Opportunity (New York: Praeger, 1985).
2 By “misconduct” we mean “any alleged improper or illegal act, omission or decision” by a police
officer that directly affects the person or property of an individual by reason of a violation of any general, standing or special order or guideline of the police department, a violation of any federal law, state law or municipal ordinance,” or “any act otherwise evidencing improper or unbecoming conduct.” In this we follow the City of Pittsburgh Citizen Police Review Board, Rules and Operating Procedures (1998), p. 2.

Citizen Oversight of the Albany Police, 2010
4
When we resumed the complainant survey in 2009, we made efforts to contact every complainant whose complaint had been disposed by the CPRB since the discontinuation of surveying in 2004 (and through notifications sent in November, 2009), which included 222 complaints filed by 203 complainants. We provided again for phone interviews, using an interview schedule that closely resembled the schedule that we used previously; thus the survey data collected across the two periods are quite comparable. We interviewed 60 (28.2%) of those complainants, who were responsible for 68 of the complaints. It should come as no surprise that the response rate was substantially lower in this second round of surveying, given the lapse of time between the disposition of complaints and the administration of the survey. Only five complainants refused to participate. We were unable to contact 138, for a number of whom we lacked any contact information; for most of those – more than two-thirds – the phone number was incorrect or out-of-date, and others (for whom the phone number appeared to be valid) we were unable to reach even after six calls.
Thus we have interview data on 109 complainants, of the 311 who filed complaints over this period. Response rates were not related to the subject of the complaint, with one exception: complainants whose complaints concerned “conduct standards” as the most serious allegation were the most likely to be contacted, the most likely to complete an interview (40 percent), and the most likely to refuse participation (eight of the nine refusals came from this group). Subjects of Complaints
Nearly half of the complaints included more than one allegation of misconduct. If we classify complaints according to the most serious misconduct alleged, and assuming that seriousness decreases as one moves down the list in the table below, then 30 percent involved the use of force, an additional 11 percent involved the abuse of some other form of police authority (mainly to arrest or search), nearly one-third involved “conduct standards,” and 14 percent involved “call handling.” The remaining 13 percent of complaints involved none of those forms of misconduct.
Table 1.1: Subjects of Complaints
Most Serious Allegation Number Percent
Use of force 105 29.9
Abuse of authority 38 10.8
Conduct standards 112 31.9
Call handling 50 14.2
Other 46 13.1
Total 351 100
Outcomes of Complaints
The outcomes of complaints that involve multiple allegations are difficult to characterize, since different findings can be reached for different allegations, and so any outcome might be mixed, with any of a wide variety of permutations. For this analytical purpose, we classified a complaint as sustained if any of the allegations was sustained. Otherwise, outcomes were characterized as the finding most favorable (or least unfavorable) to the complainant, assuming that findings are less favorable as one descends the list in Table 1.2, below.
Citizen Oversight of the Albany Police, 2010
5
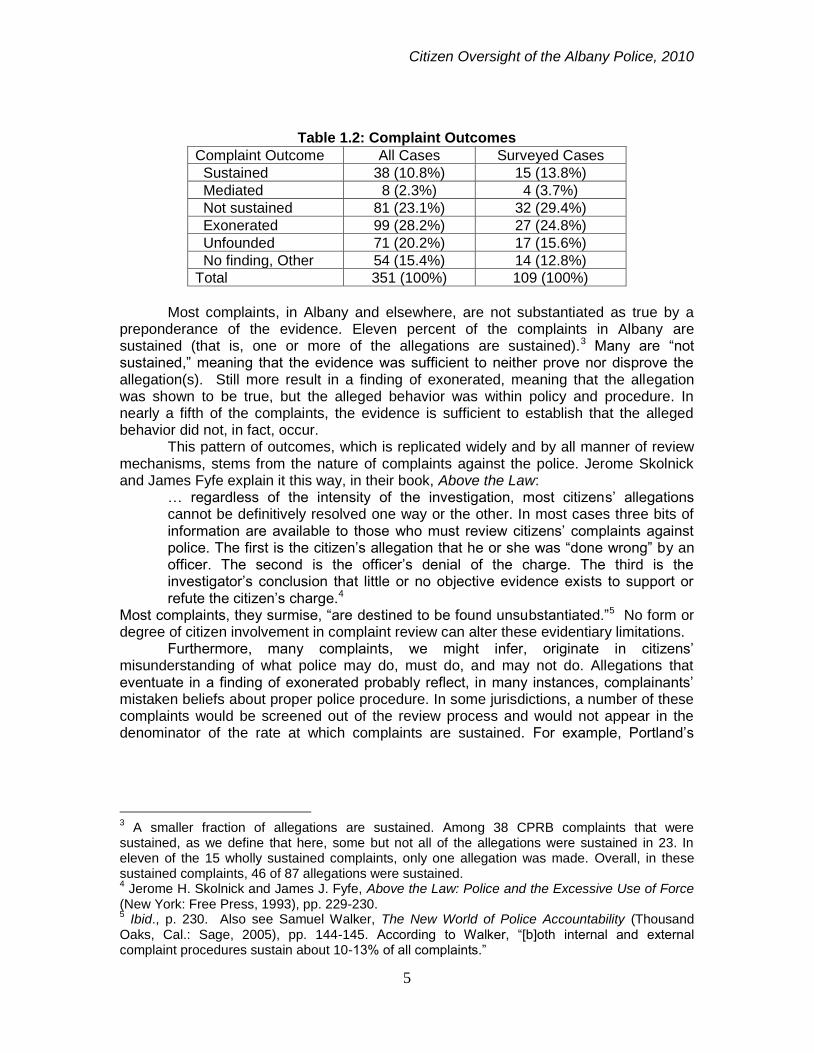
Table 1.2: Complaint Outcomes
Complaint Outcome All Cases Surveyed Cases
Sustained 38 (10.8%) 15 (13.8%)
Mediated 8 (2.3%) 4 (3.7%)
Not sustained 81 (23.1%) 32 (29.4%)
Exonerated 99 (28.2%) 27 (24.8%)
Unfounded 71 (20.2%) 17 (15.6%)
No finding, Other 54 (15.4%) 14 (12.8%)
Total 351 (100%) 109 (100%)
Most complaints, in Albany and elsewhere, are not substantiated as true by a
preponderance of the evidence. Eleven percent of the complaints in Albany are sustained (that is, one or more of the allegations are sustained).3 Many are “not sustained,” meaning that the evidence was sufficient to neither prove nor disprove the allegation(s). Still more result in a finding of exonerated, meaning that the allegation was shown to be true, but the alleged behavior was within policy and procedure. In nearly a fifth of the complaints, the evidence is sufficient to establish that the alleged behavior did not, in fact, occur.
This pattern of outcomes, which is replicated widely and by all manner of review mechanisms, stems from the nature of complaints against the police. Jerome Skolnick and James Fyfe explain it this way, in their book, Above the Law: … regardless of the intensity of the investigation, most citizens‟ allegations
cannot be definitively resolved one way or the other. In most cases three bits of information are available to those who must review citizens‟ complaints against police. The first is the citizen‟s allegation that he or she was “done wrong” by an officer. The second is the officer‟s denial of the charge. The third is the investigator‟s conclusion that little or no objective evidence exists to support or refute the citizen‟s charge.4
Most complaints, they surmise, “are destined to be found unsubstantiated.”5 No form or degree of citizen involvement in complaint review can alter these evidentiary limitations. Furthermore, many complaints, we might infer, originate in citizens‟ misunderstanding of what police may do, must do, and may not do. Allegations that eventuate in a finding of exonerated probably reflect, in many instances, complainants‟ mistaken beliefs about proper police procedure. In some jurisdictions, a number of these complaints would be screened out of the review process and would not appear in the denominator of the rate at which complaints are sustained. For example, Portland‟s
3 A smaller fraction of allegations are sustained. Among 38 CPRB complaints that were
sustained, as we define that here, some but not all of the allegations were sustained in 23. In eleven of the 15 wholly sustained complaints, only one allegation was made. Overall, in these sustained complaints, 46 of 87 allegations were sustained. 4 Jerome H. Skolnick and James J. Fyfe, Above the Law: Police and the Excessive Use of Force
(New York: Free Press, 1993), pp. 229-230. 5 Ibid., p. 230. Also see Samuel Walker, The New World of Police Accountability (Thousand
Oaks, Cal.: Sage, 2005), pp. 144-145. According to Walker, “[b]oth internal and external complaint procedures sustain about 10-13% of all complaints.”

Citizen Oversight of the Albany Police, 2010
6
Independent Police Review Division may “dismiss” complaints “that fail to describe at least a potential violation of federal, state, or municipal law or [Police] Bureau policy.”6 Complainants’ Satisfaction We assessed complainants‟ satisfaction both with the outcomes of their complaints and with how their complaints were handled. Some research suggests that people make distinctions between these two elements of their experiences with legal authorities, and that people may be satisfied with the process even when their outcomes are not favorable to them.
More than four-fifths of the complainants – and 87 percent of those that expressed an opinion – were very or somewhat dissatisfied with the outcome (shown in red and yellow shading in Figure 1.1 below). Most of those were very dissatisfied, rather than only somewhat dissatisfied.
Dissatisfaction with the handling of complaints was only slightly less prevalent, as somewhat more than three-quarters of the complainants – 82 percent of those who expressed an opinion – were very or somewhat dissatisfied with how their complaints were handled. But one can detect a difference in levels of satisfaction with the process and that with outcomes, in that complainants report a more moderate degree of dissatisfaction with the process, as 19 percent were only somewhat dissatisfied, while 58 percent were very dissatisfied. Still, only 18 percent of the complainants were at least somewhat satisfied with how their complaints were handled (shaded in green and blue in Figure 1.1).
Furthermore, these two outlooks on complaint review are strongly intercorrelated. Of those who expressed an opinion about both their satisfaction with the outcome and their satisfaction with how their complaints were handled, 70 percent selected identical response categories (e.g., very satisfied, somewhat dissatisfied, etc.). Of those who were dissatisfied with outcomes, only 11 percent were somewhat satisfied with how their complaints were handled (none were very satisfied). Of those who were satisfied with the outcomes, only 17 percent were dissatisfied with the process.
6 Independent Police Review Division, Annual Report 2007 (Office of the City Auditor, Portland,
Oregon, 2007), p. 12.

Citizen Oversight of the Albany Police, 2010
7
Figure 1.1
We hasten to add that complainant dissatisfaction is, so far as previous research
can tell us, the rule rather than the exception, regardless of the form of complaint review. For example, a study of complainant (and officer) satisfaction with Denver‟s Office of the Independent Monitor was conducted in 2005-2007.7 Complainants‟ satisfaction with the process improved from 10.2 percent in 2006 to 14.7 percent in 2007. In the latter year, 10 percent of complainants were satisfied with the outcome of their cases, and only 17 percent believed that they had been treated fairly. For another example, the City of Portland‟s Independent Police Review (IPR) Division has conducted surveys of complainants since 2001, and its most recent (2007) annual report shows that the proportion of complainants who were satisfied with the complaint process has ranged from 24 percent to 34 percent, and the proportion who were satisfied with the fairness of the outcome ranged from 16 percent to 32 percent.8 Other research, in this country and in others, has revealed low levels of complainant satisfaction.9 Correlates of Complainants’ Satisfaction Complainants‟ satisfaction is correlated with a number of factors, which we examine here. Each of these factors may influence complainants‟ satisfaction, though
7 See Joseph De Angelis, Assessing the Impact of the Office of the Independent Monitor on
Complainant and Officer Satisfaction (Denver: Office of the Independent Monitor, 2008), http://www.denvergov.org/OIM/bReportsb/OfficerComplainantSatisfactionSurveyReports/ tabid/429537/ Default.aspx, accessed May 24, 2010. 8 Independent Police Review Division, op cit., pp. 49-59.
9 Michele Sviridoff and Jerome E. McElroy, Processing Complaints Against Police in New York
City: The Complainant’s Perspective (New York: Vera Institute, 1989); Douglas W. Perez, Common Sense about Police Review (Philadelphia: Temple University Press, 1994); Ian Waters and Katie Brown, “Police Complaints and the Complainants‟ Perspective,” British Journal of Criminology 40 (2000): 617-638.
-100 -50 0 50
Handling
Outcome
Complainants' Satisfaction with Outcomes and Process
Very atisfied
Somewhat Satisfied
Somewhat Dissatisfied
Very Dissatisfied
Citizen Oversight of the Albany Police, 2010
8
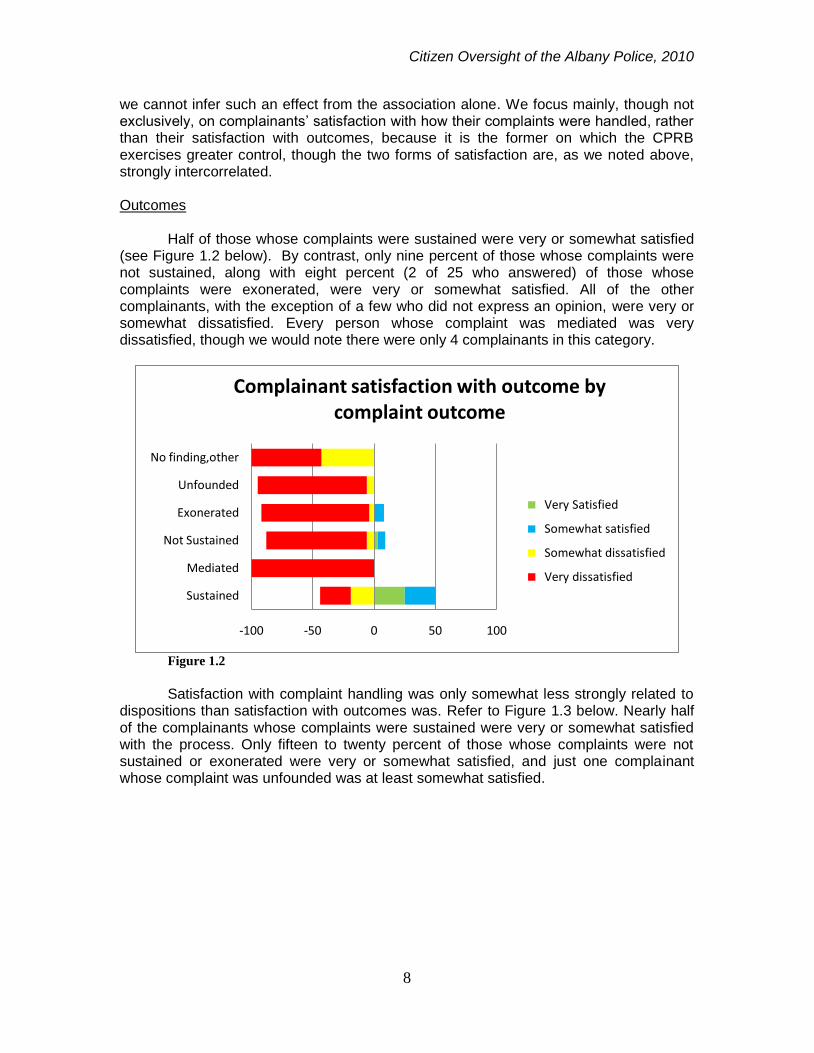
we cannot infer such an effect from the association alone. We focus mainly, though not exclusively, on complainants‟ satisfaction with how their complaints were handled, rather than their satisfaction with outcomes, because it is the former on which the CPRB exercises greater control, though the two forms of satisfaction are, as we noted above, strongly intercorrelated. Outcomes
Half of those whose complaints were sustained were very or somewhat satisfied (see Figure 1.2 below). By contrast, only nine percent of those whose complaints were not sustained, along with eight percent (2 of 25 who answered) of those whose complaints were exonerated, were very or somewhat satisfied. All of the other complainants, with the exception of a few who did not express an opinion, were very or somewhat dissatisfied. Every person whose complaint was mediated was very dissatisfied, though we would note there were only 4 complainants in this category.
Figure 1.2
Satisfaction with complaint handling was only somewhat less strongly related to
dispositions than satisfaction with outcomes was. Refer to Figure 1.3 below. Nearly half of the complainants whose complaints were sustained were very or somewhat satisfied with the process. Only fifteen to twenty percent of those whose complaints were not sustained or exonerated were very or somewhat satisfied, and just one complainant whose complaint was unfounded was at least somewhat satisfied.
-100 -50 0 50 100
Sustained
Mediated
Not Sustained
Exonerated
Unfounded
No finding,other
Complainant satisfaction with outcome by complaint outcome
Very Satisfied
Somewhat satisfied
Somewhat dissatisfied
Very dissatisfied

Citizen Oversight of the Albany Police, 2010
9
Figure 1.3
The association between satisfaction and complaint outcomes might be stronger
still but for the fact that complainants do not all comprehend the outcomes in which their complaints eventuated. As Table 3, below, shows, only about half of the complainants whose complaints were sustained realized that their complaints were (at least partially) sustained; the remainder either did not know what the outcome was in a way that they could describe it, or mistakenly believed that the allegations had been “dismissed” or something similar. (Some complainants did not answer the question about the outcome of their complaint because they reportedly had not been informed about the disposition, and so the numbers of respondents shown in the table do not match the numbers of complaints shown in Table 2, above.) Furthermore, the differences among dispositions other than sustained – i.e., unfounded, exonerated, not sustained, etc. – appear to befuddle many complainants.
Table 1.3: Complainants’ Perceived Outcomes by Actual CPRB Outcomes
CPRB Outcome
Outcome as Reported by Complainant
Sustained Mediated Not Sustained
Exonerated Unfounded No Finding, Other
Sustained 7 0 1 0 0 1
Not sustained 1 0 5 2 1 0
Exonerated 0 0 3 2 0 0
Unfounded 1 1 4 8 13 3
Other 3 2 7 4 1 3
Don‟t know 3 0 6 4 1 1
Total 15 3 26 20 16 8
Complainants‟ Goals Complainants do not all seek to have officers punished. Table 4 below shows the goals that complainants identified; because they were allowed to name multiple goals, the total number exceeds the number of complainants, and the percentage associated
-100 -50 0 50 100
Sustained
Mediated
Not Sustained
Exonerated
Unfounded
No finding,other
Complainant satisfaction with handling by complaint outcome
Very Satisfied
Somewhat satisfied
Somewhat dissatisfied
Very dissatisfied

Citizen Oversight of the Albany Police, 2010
10
with each number is the proportion of complainants who identified each goal. In addition, Table 1.4 shows the numbers of complainants for whom each goal was the most punitive of those that each complainant identified, assuming that punitiveness decreases as one moves down the list. The majority of complainants did not purport to want the officer punished. Some complainants instead (or in addition) wanted some kind of compensation, broadly defined, from monetary compensation to an apology or discontinuation of harassment. Still others merely wanted to inform the department about the incident and/or the officer.
Table 1.4: Complainants‟ Goals
Goal Total Number
Percent Most punitive
Percent
Have officer punished 38 34.8 38 34.8
Receive monetary compensation 7 6.4 4 3.7
Have charges dropped 10 9.2 7 6.4
Adjust ticket for violation 6 5.5 3 2.8
Receive apology 18 16.5 9 8.3
End harassment 13 11.9 4 3.7
Tell police department about a bad cop 17 15.6 5 4.6
Let police department know what happened 44 40.3 21 19.3
Other 47 43.1 18 16.5
Total [109] 109 100
Complainants‟ goals are related, albeit rather weakly, to their levels of satisfaction both with outcomes and with the process. Figure 1.4 and Figure 1.5, below, show, for each broad category of complainants‟ most punitive goals, the level of complainants‟ satisfaction with outcomes and with how their complaints are handled. Those whose primary objective was to give information were somewhat less dissatisfied than those whose goals included punishment or compensation, though majorities of complainants were dissatisfied regardless of their goals.
Figure 1.4
-100 -50 0 50
Punishment
Compensation
Information
Other
Satisfaction with complaint outcome by complainants' goals
Very Satisfied
Somewhat satisfied
Somewhat dissatisfied
Very dissatisfied

Citizen Oversight of the Albany Police, 2010
11
Figure 1.5
Experience with Intake
Complainants reported that, for the most part, they encountered little or no difficulty in filing their complaints. Of those who expressed an opinion, 82 percent agreed that it was easy to understand what had to be done to file a complaint. The same fraction reported that they did not find it difficult to file their complaint. Those who needed help with either the form or the process sought help from various sources: police, social workers, and other complainants.
Many complainants obtained a complaint form at a police facility, while a few went to the Government Law Center or to other sites at which forms are available. A substantial proportion of complainants submitted the form in person, but it appears to be more – and increasingly – common for complainants to mail the completed form.10
Those who had contact with officers at intake report more positive than negative experiences. Officers were, according to complainants, polite (80%), understanding (61%), helpful (56%), and did not try to dissuade the complainant from filing a complaint (74%).
Experience with Investigation Nearly half of the complainants did not have a contact with police investigators that the complainants recognized as investigative in nature. In some of these instances, we infer from the respondent‟s account of the steps that s/he took to complain that on
10
In the CPRB‟s earlier years, and before the Office of Professional Standards was relocated to 200 Henry Johnson Blvd., it appears to have been more common for complainants to visit the OPS office, then on Morton Avenue across the lobby from City Court, and complete the form there.
-100 -50 0 50
Punishment
Compensation
Information
Other
Satisfaction with complaint handling by complainants' goals
Very Satisfied
Somewhat satisfied
Somewhat dissatisfied
Very dissatisfied
Citizen Oversight of the Albany Police, 2010
12
the occasion of filing the complaint, OPS investigators conducted an interview with the complainant that served investigative purposes, but the complainant took the interaction as complaint intake and a prelude to an investigation. In other instances, the respondent‟s account alone does not suffice even to speculate about the reason for this omission – e.g., errors in recall, or that no such contact was in fact made.
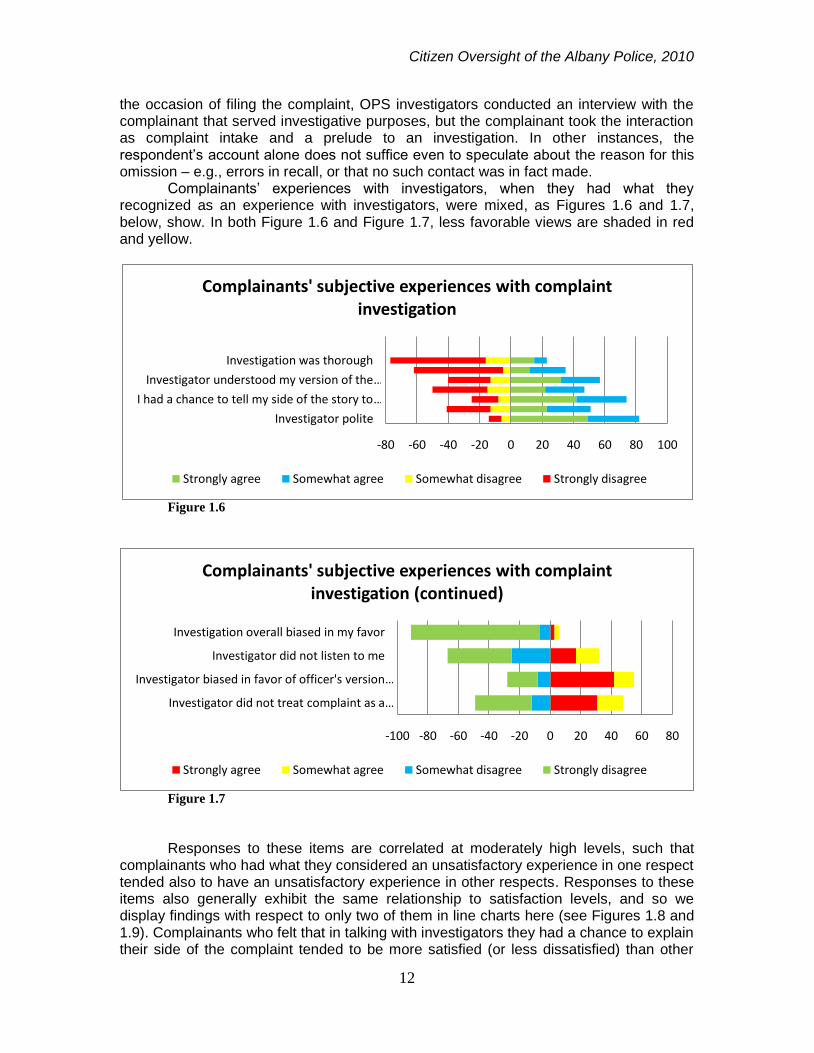
Complainants‟ experiences with investigators, when they had what they recognized as an experience with investigators, were mixed, as Figures 1.6 and 1.7, below, show. In both Figure 1.6 and Figure 1.7, less favorable views are shaded in red and yellow.
Figure 1.6
Figure 1.7
Responses to these items are correlated at moderately high levels, such that complainants who had what they considered an unsatisfactory experience in one respect tended also to have an unsatisfactory experience in other respects. Responses to these items also generally exhibit the same relationship to satisfaction levels, and so we display findings with respect to only two of them in line charts here (see Figures 1.8 and 1.9). Complainants who felt that in talking with investigators they had a chance to explain their side of the complaint tended to be more satisfied (or less dissatisfied) than other
-80 -60 -40 -20 0 20 40 60 80 100
Investigator polite
I had a chance to tell my side of the story to …
Investigator understood my version of the …
Investigation was thorough
Complainants' subjective experiences with complaint investigation
Strongly agree Somewhat agree Somewhat disagree Strongly disagree
-100 -80 -60 -40 -20 0 20 40 60 80
Investigator did not treat complaint as a …
Investigator biased in favor of officer's version …
Investigator did not listen to me
Investigation overall biased in my favor
Complainants' subjective experiences with complaint investigation (continued)
Strongly agree Somewhat agree Somewhat disagree Strongly disagree

Citizen Oversight of the Albany Police, 2010
13
complainants (shaded in green and blue). (Or, it may be that complainants who were less satisfied were less likely to think, after the fact, that their interaction with an investigator had given them an opportunity to tell their side of the story.) Similarly, complainants who thought that investigators were interested in finding out the truth were more likely to be satisfied with how their complaints were handled.
Figure 1.8
Figure 1.9
-100 -50 0 50
Strongly agree
Somewhat agree
Somewhat disagree
Strongly disagree
Satisfaction by perceived opportunity to tell their side of the story to investigators
In talking with the officers who investigated my complaint, I had a chance to tell my side of the story...
Very Satisfied
Somewhat satisfied
Somewhat dissatisfied
Very dissatisfied
Satisfaction level:
-100 -50 0 50 100
Strongly agree
Somewhat agree
Somewhat disagree
Strongly disagree
Satisfaction by complainants' perception of investigators interest in finding the truth
The officers investigating my complaint were interested in finding out the truth about the incident...
Very Satisfied
Somewhat satisfied
Somewhat dissatisfied
Very dissatisfied

Citizen Oversight of the Albany Police, 2010
14
Timeliness
The median time from complaint receipt to CPRB decision is 25 weeks, with a wide range, from a few weeks to a few years. Complainants‟ own estimates of the time from the filing of their complaints to disposition are largely congruent with CPRB records, and complainants tend to think that the process took too long. Nearly two-thirds agreed with the statement, “It took too long to reach an outcome,” and an additional 10% said that they didn‟t know. Complainants‟ judgments about the timeliness of the dispositions were associated with their satisfaction: 80% or more of those who thought that it took too long to dispose of their complaints were dissatisfied, while one-third to two-thirds of those who thought that it did not take too long were satisfied. See Figure 1.10.
Figure 1.10
Procedural Fairness Social research has identified several dimensions of “procedural fairness”11:
Participation: “People are more satisfied with procedures that allow them to participate by explaining their situation and communicating their views about situations to authorities.”
Neutrality: “People think that unbiased authorities that use objective indicators to make decisions, as opposed to personal views, act more fairly.”
Being treated with dignity and respect: “The quality of interpersonal treatment is consistently found to be a distinct element of fairness, separate from the quality of the decision-making process.”
Trustworthiness: “[P]eople feel that procedures are fairer when they trust the motives
11
National Research Council, Fairness and Effectiveness in Policing: The Evidence. Committee to Review Research on Police Policy and Practices; Wesley G. Skogan and Kathleen Frydll (eds.); Committee on Law and Justice, Division of Behavioral and Social Sciences and Education. (Washington: National Academies Press, 2004), p. 304.
-100 -50 0 50 100
Strongly agree
Somewhat agree
Somewhat disagree
Strongly disagree
Satisfaction by timelinessI felt that it took too long to reach an outcome...
Very Satisfied
Somewhat satisfied
Somewhat dissatisfied
Very dissatisfied
Satisfaction level:

Citizen Oversight of the Albany Police, 2010
15
of decision makers. ... Authorities can encourage people to view them as trustworthy by explaining their decisions and accounting for their conduct in ways that make clear their concern about giving attention to people‟s needs.”
As we found in our previous survey research in Albany, these expectations have powerful effects on clients„ assessments of their interactions with police; they explain why clients are more satisfied when police pay attention to what they have to say, why clients are more satisfied when police explain the reasons for their actions (e.g., a stop), and why clients are more satisfied when police are courteous and respectful, even when the outcomes are unambiguously unfavorable to the clients. These expectations, furthermore, might lead one to anticipate that complainants could be satisfied with the complaint review process even when the outcomes of that process are not favorable to complainants, and they direct attention to selected features of that process, to which we attend below. Monitors. One important and unusual feature of Albany‟s CPRB is the provision for the appointment of monitors in individual cases. We might expect that the involvement of a monitor – someone independent of the police department – in the investigation would enhance complainants‟ confidence in the integrity and thoroughness of investigations, and hence make complainants more satisfied with the process. This expectation is, for the most part, unfulfilled by the survey data. We find no interpretable relationship between the appointment of a monitor and complainants‟ satisfaction with how their complaints were handled: complainants to whose cases monitors were assigned are slightly more satisfied (19% very or somewhat satisfied, vs. 13% in cases with no monitor), but we also find among this group a larger fraction who were more intensely dissatisfied (shaded red in Figure 1.11 below).
Figure 1.11
To some extent this pattern may be attributable to complainants who were not aware that monitors had been appointed to their cases. It appears that only about one-third of complainants to whose cases monitors were assigned were aware that monitors had been assigned; more than half believed that no monitor had been assigned, while about 1 in 8 simply did not know. (We might add that this kind of misunderstanding went
-100 -50 0 50
Monitor assigned
No monitor assigned
Satisfaction by assignment of monitor
Very Satisfied
Somewhat satisfied
Somewhat dissatisfied
Very dissatisfied

Citizen Oversight of the Albany Police, 2010
16
the other way also: one-fifth of the complainants to whose cases no monitor had been appointed, mistakenly believed that a monitor had been assigned.) We find a more intuitively interpretable pattern of satisfaction levels when we take account of complainants‟ perceptions of the involvement of monitors, and one that offers some support for the expectation that monitors contribute to complainants‟ satisfaction. When the complainant believes that a monitor has been appointed, about one-quarter are very or somewhat satisfied; when the complainant believes that no monitor has been assigned, only 8% are very or somewhat satisfied (refer to Figure 1.12). In either instance, however, satisfaction levels remain low.
Figure 1.12
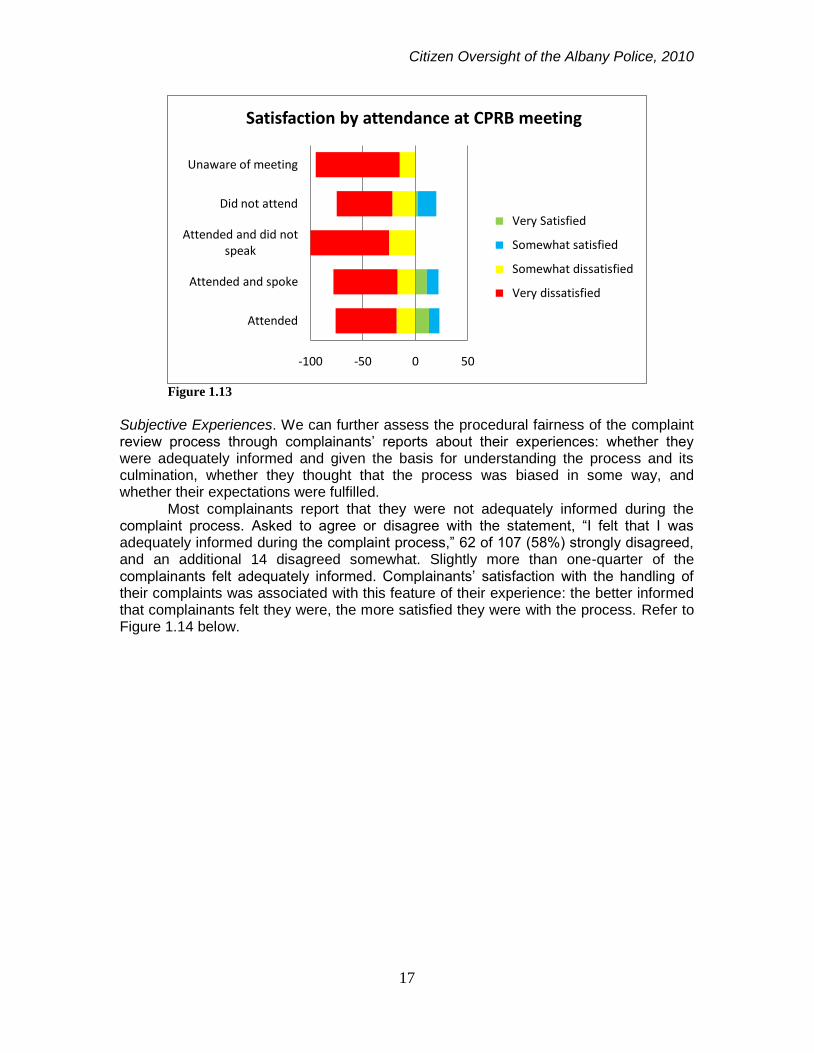
CPRB Meetings. We might also expect that the opportunity that CPRB meetings afford to complainants to hear the discussion about their complaints, lending to the process a high degree of transparency, would contribute to complainants‟ sense of the fairness of the process. We find, however, hardly any association between complainants‟ satisfaction and their attendance at the CPRB meetings at which their complaints were discussed. In Figure 1.13, we distinguish among three groups of complainants: those who knew about and attended the CPRB meeting; those who chose not to attend the CPRB meeting; and those who reportedly were not informed about the CPRB meeting. We further distinguish two subgroups of the first group: those who attended and spoke at the meeting, and those who attended but did not speak. As Figure 1.13, below, shows, satisfaction levels differed scarcely if at all between the first two groups, with 20-25% very or somewhat satisfied with the process in either case. Nearly half of those who attended the CPRB meeting were given an opportunity to speak, and they were somewhat more satisfied than those who attended and did not speak. The least satisfied complainants were those who were unaware of the meeting.
-100 -50 0 50
Believes monitor assigned
Believes no monitor assigned
Doesn't know
Satisfaction by perceived assignment of monitor
Very Satisfied
Somewhat satisfied
Somewhat dissatisfied
Very dissatisfied
Citizen Oversight of the Albany Police, 2010
17
Figure 1.13
Subjective Experiences. We can further assess the procedural fairness of the complaint review process through complainants‟ reports about their experiences: whether they were adequately informed and given the basis for understanding the process and its culmination, whether they thought that the process was biased in some way, and whether their expectations were fulfilled. Most complainants report that they were not adequately informed during the complaint process. Asked to agree or disagree with the statement, “I felt that I was adequately informed during the complaint process,” 62 of 107 (58%) strongly disagreed, and an additional 14 disagreed somewhat. Slightly more than one-quarter of the complainants felt adequately informed. Complainants‟ satisfaction with the handling of their complaints was associated with this feature of their experience: the better informed that complainants felt they were, the more satisfied they were with the process. Refer to Figure 1.14 below.
-100 -50 0 50
Attended
Attended and spoke
Attended and did not speak
Did not attend
Unaware of meeting
Satisfaction by attendance at CPRB meeting
Very Satisfied
Somewhat satisfied
Somewhat dissatisfied
Very dissatisfied

Citizen Oversight of the Albany Police, 2010
18
Figure 1.14
Most complainants believe that they did not receive an adequate explanation of the outcomes of their complaints. Asked to agree or disagree with the statement, “I received an adequate explanation of the outcome of my complaint,” 61 of 105 (58%) strongly disagreed, and an additional 16 disagreed somewhat. Only 28 (27%) indicated that they considered the explanation adequate. Moreover, satisfaction with complaint handling was related to this judgment: 40-45% of those who believed that they received an adequate explanation of the outcome (shown by bars labeled, „strongly agree‟ and „somewhat agree‟ in Figure 1.15 below) were very or at least somewhat satisfied with the handling of their complaints (shaded green and blue).
Figure 1.15
-100 -50 0 50 100
Strongly agree
Somewhat agree
Somewhat disagree
Strongly disagree
Satisfaction by perceived adequacy of information updates
I felt I was adequately informed during the process...
Very Satisfied
Somewhat satisfied
Somewhat dissatisfied
Very dissatisfied
-100 -50 0 50 100
Strongly agree
Somewhat agree
Somewhat disagree
Strongly disagree
Satisfaction by perceived adequacy of explanation of outcome
I received an adequate explanation of the outcome of my complaint...
Very Satisfied
Somewhat satisfied
Somewhat dissatisfied
Very dissatisfied
Satisfaction level:
Citizen Oversight of the Albany Police, 2010
19
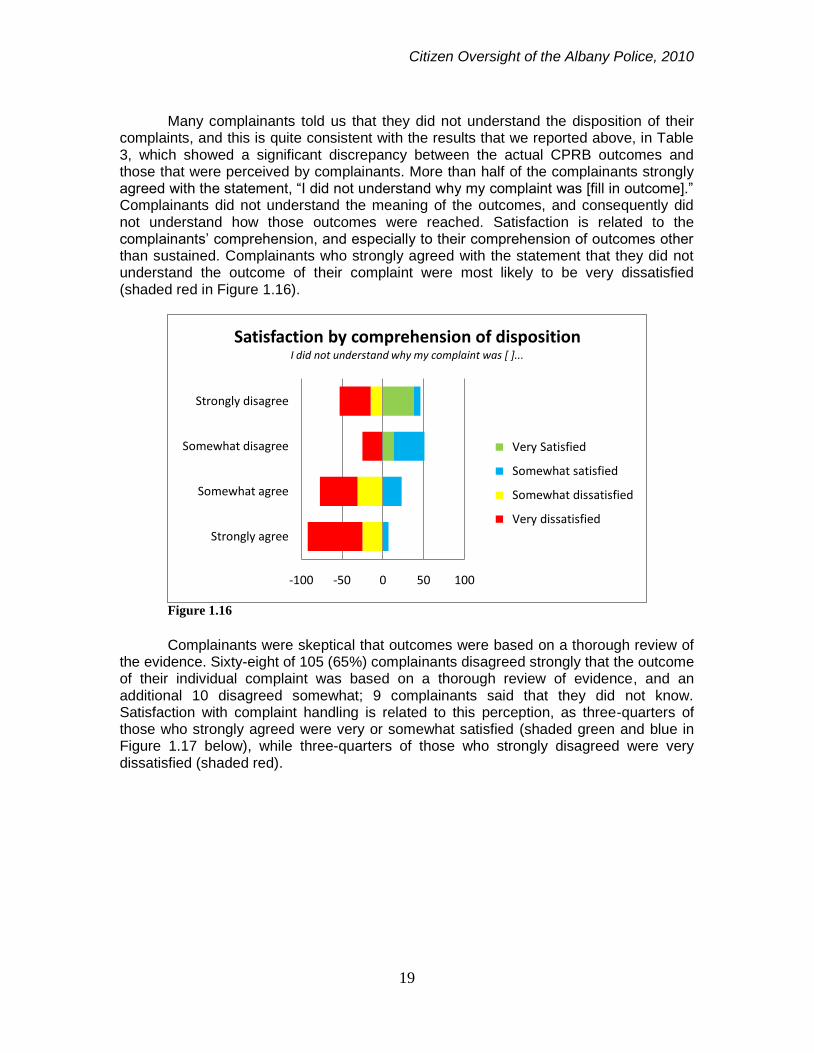
Many complainants told us that they did not understand the disposition of their complaints, and this is quite consistent with the results that we reported above, in Table 3, which showed a significant discrepancy between the actual CPRB outcomes and those that were perceived by complainants. More than half of the complainants strongly agreed with the statement, “I did not understand why my complaint was [fill in outcome].” Complainants did not understand the meaning of the outcomes, and consequently did not understand how those outcomes were reached. Satisfaction is related to the complainants‟ comprehension, and especially to their comprehension of outcomes other than sustained. Complainants who strongly agreed with the statement that they did not understand the outcome of their complaint were most likely to be very dissatisfied (shaded red in Figure 1.16).
Figure 1.16
Complainants were skeptical that outcomes were based on a thorough review of the evidence. Sixty-eight of 105 (65%) complainants disagreed strongly that the outcome of their individual complaint was based on a thorough review of evidence, and an additional 10 disagreed somewhat; 9 complainants said that they did not know. Satisfaction with complaint handling is related to this perception, as three-quarters of those who strongly agreed were very or somewhat satisfied (shaded green and blue in Figure 1.17 below), while three-quarters of those who strongly disagreed were very dissatisfied (shaded red).
-100 -50 0 50 100
Strongly agree
Somewhat agree
Somewhat disagree
Strongly disagree
Satisfaction by comprehension of dispositionI did not understand why my complaint was [ ]...
Very Satisfied
Somewhat satisfied
Somewhat dissatisfied
Very dissatisfied

Citizen Oversight of the Albany Police, 2010
20
Figure 1.17
Most complainants believed that the complaint review process was biased in
favor of the officer, though 11 of 102 (11%) did not believe that the process was biased toward police, and 13 professed not to know. Those who perceived this bias (somewhat agree or strongly agree in Figure 1.18) were the most likely to be dissatisfied with the process, and to be the most intensely dissatisfied (shaded red). Correspondingly, hardly any of the complainants believed that the process was biased in their favor (see Figure 1.19)
Figure 1.18
-100 -50 0 50 100
Strongly agree
Somewhat agree
Somewhat disagree
Strongly disagree
Don't know
Satisfaction by perceived thoroughness of review
I think that the outcome of my case was based on a thorough review of the evidence...
Very Satisfied
Somewhat satisfied
Somewhat dissatisfied
Very dissatisfied
Satisfaction level:
-100 -50 0 50 100
Strongly agree
Somewhat agree
Somewhat disagree
Strongly disagree
Satisfaction by perceived biasThe outcome was biased toward the officer...
Very Satisfied
Somewhat satisfied
Somewhat dissatisfied
Very dissatisfied

Citizen Oversight of the Albany Police, 2010
21
Figure 1.19
Finally, most complainants did not get what they wanted from the process; those
who did (represented by the bars in Figure 1.20 labeled, “somewhat agree” or “strongly agree”) tended to be very or at least somewhat satisfied, but they comprised only 16 percent (17 of 106) of complainants. Nearly three-quarters of the complainants felt strongly that they did not get what they wanted, which as Table 4, above, showed, ranged from punishment for the officer to compensation to merely informing the department about the incident. We know that the goal of punishment was seldom satisfied, given the small proportion of complaints that were sustained, but we can surmise from these responses that complainants with non-punitive goals were also frustrated by the process.
Figure 1.20
-100 -50 0 50 100
Strongly agree
Somewhat agree
Somewhat disagree
Strongly disagree
Satisfaction by perceived biasI think the outcome was biased in my favor...
Very Satisfied
Somewhat satisfied
Somewhat dissatisfied
Very dissatisfied
-100 0 100
Strongly agree
Somewhat agree
Somewhat disagree
Strongly disagree
Satisfaction by goal achievementI got what I wanted from the complaint process...
Very Satisfied
Somewhat satisfied
Somewhat dissatisfied
Very dissatisfied
Satisfaction level:

Citizen Oversight of the Albany Police, 2010
22
Influences on Satisfaction.
We have in the foregoing pages considered a number of factors that might shape the experiences of complainants and affect their satisfaction with the process. While these data do not enable us to make strong inferences about cause-and-effect relationships, we have conducted some additional, multivariate analysis in an effort to disentangle the relationships among these factors and estimate the magnitude of their independent effects on satisfaction. The results of that analysis suggest that the strongest and most statistically reliable influences on complainants‟ satisfaction with the process are: o First and foremost, the outcome, as complainants whose complaints are sustained
are much more satisfied with how their complaints are handled, and they also have a more favorable perspective on many of the other elements of the process, including the integrity and thoroughness of the investigation;
o The celerity of the process, as complainants who believed that it took too long to reach a disposition were much less satisfied with the complaint process;
o Complainants‟ sense that they were kept informed about the process, as those who felt adequately informed were more satisfied; and
o Complainants‟ comprehension of complaint outcomes – what they mean, and how they are reached – as complainants who felt that they understood how their complaints were resolved were more satisfied with the process.
Complainants‟ income, education, and race had no detectable, independent effects on their satisfaction.
These results do not all have clear implications for how the CPRB conducts its business, for some of these factors are not within the control of the CPRB. Outcomes, as we discussed above, are subject to the limitations of the evidence, and many complaints are not supported by the evidence. The celerity with which complaints are disposed certainly turns to a large degree on how quickly OPS finishes its investigations. The other factors may be more susceptible to CPRB efforts to make the process more satisfactory to complainants, but only within limits: as our efforts to survey them demonstrate, it can be challenging to contact many complainants, and so keeping them informed and helping them to better understand outcomes will entail efforts that will not succeed in some instances. Summary The complainants whose complaints are processed by Albany‟s CPRB are frequently dissatisfied with both the outcomes of their complaints and the process by which they are disposed. Complainants‟ dissatisfaction stems largely from the outcomes of their complaints, a small fraction of which are sustained. Our analysis of the survey data suggests that outcomes shape complainants‟ perceptions of many aspects of the process, and extant research suggests that no alterations in how complaints are investigated and evaluated will yield substantially higher rates of sustained complaints. Any process that revolves around the adjudication of allegations of police misconduct will, our findings indicate, seldom meet complainants‟ expectations in filing complaints. Those who seek to have officers sanctioned will seldom have reason to feel satisfied, for if their complaints are not sustained, then no punishment is applied. And the majority of complainants who do not seek to have officers punished are still less likely to have their expectations met. Even if they want merely to make the police department aware of the incident or of an officer who in their opinion performed poorly, the information that they

Citizen Oversight of the Albany Police, 2010
23
provide is, in effect, discredited unless their complaints are sustained. Formal resolutions of complaints against the police tend to leave complainants dissatisfied.12
12
See Sviridoff and McElroy, Processing Complaints Against Police in New York City, op cit., and also Joseph DeAngelis, “Assessing the Impact of Oversight and Procedural Justice on the Attitudes of Individuals Who File Police Complaints,” Police Quarterly 12 (2009): 214-236.

Citizen Oversight of the Albany Police, 2010
24
Residents, 2009 While we previously surveyed “clients” – people who had contact with Albany
police – as a community of interest, a survey of residents has the virtue of representing the views of the entire (residential) population, regardless of the form – if any – of residents‟ direct contact with the police. The resident survey affords information about residents‟ quality of life, fear of crime, and perceptions of public safety problems (especially neighborhood “incivilities”) as indicators of police performance in meeting community expectations, as well as information about residents‟ perceptions of, attitudes toward, and experiences with the Albany police. The 2001-2002 resident surveys included almost all of the same information, and may serve as a point of comparison.13
We begin with an explanation of survey methodology and a description of the sample. We then summarize survey findings regarding residents‟ perceptions of the Albany Police, satisfaction with the complaint process and handling, and awareness of the Citizen‟s Police Review Board.
Survey Methods We planned for a mail survey, rather than a phone survey, because mail surveys are more economical than phone surveys, although mail surveys tend to yield lower response rates, and mail surveys also allow for fewer survey items and a less complicated question structure. We based the survey instrument mainly on the 2001-2002 resident survey instrument, adapted to mail modality. Nearly all of the items on the 2009 survey were also used in the 2001-2002 surveys, focusing on perceptions of Albany police services, public safety problems in their neighborhoods, quality of life (e.g., fear of crime), and contacts with the police.14 We drew a stratified random sample of Albany households. We merged tax assessment and APD records with Albany patrol zone boundaries, such that we could draw a separate and potentially representative sample from each of the nineteen police patrol zones, which would also allow for a representative city-wide sample with appropriate sample weighting. Each patrol zone sample of 120 households was drawn to represent apartments and one- to three-family residences proportionately. The sample size was predicated on a response rate of 40 percent, which had been achieved in some surveys of this kind, using what is known as the “Dillman method.”15
Thus between November, 2009 and February, 2010, we mailed three waves of surveys to 2,270 households in Albany.16 Surveys included an introductory letter and a
13 Such comparisons should be drawn only very cautiously, given differences in sample sizes and the modality of survey administration. 14 A draft of the survey instrument was provided to the CPRB for comment. One comment was received and incorporated into the final draft. Many of the items included in 2001-2002 were drawn from the surveys administered in Chicago by the Chicago Community Policing Evaluation Consortium, which, in turn, were drawn from surveys conducted in the 1980s by the Police Foundation. Suffice to say that these items are well-established constructs for this purpose. 15
See, e.g., Catherine J. Grott and Jennifer Albright, Billings Police Department Crime and Criminal Justice Survey 2004 (Pullman, Wash.: Washington State University, 2004), esp. p. 2; and more generally Don A. Dillman, Mail and Telephone Surveys: The Total Design Method (New York: Wiley-Interscience, 1978). 16
The first mailing went out in the second week of November, a second wave of surveys was sent to nonrespondents 14 days after the first wave. Several days after the second mailing, we sent the same households a postcard describing the importance of their input and asking that they complete and return the survey. We delayed mailing the third, and final, wave until early February so that we could avoid sending surveys during the busy holiday season when would-be

Citizen Oversight of the Albany Police, 2010
25
postage paid return envelope, and each survey was marked with a numeric code that enabled us to (1) track survey returns and remove households from which responses were received from subsequent mailings, and (2) compute response rates by our sampling strata so that appropriate sampling weights could be applied in analysis of the data. The final sample included 419 returned surveys, yielding an overall response rate of 18.2 percent, much lower than originally projected. The Wave 1 and Wave 2 mailings produced 39 and 41 percent of our overall sample, respectively, while the Wave 3 mailing generated only 19 percent of the final sample, despite the financial incentive we included.
Using 2000 census data, we can assess the representativeness of the sample in terms of some key demographic indicators. Like many survey samples, this one overrepresents women (56.8 percent of our sample and 52.5 percent of the City‟s 2000 population), whites (73.9 percent vs. 63.1 percent), the better-educated (52 percent with a bachelor‟s degree vs. 32.5 percent), and higher-income households (median of $45,036 vs. $30,041); the sample underrepresents blacks (15.9 percent vs. 28.1 percent). These features of the sample are likely to introduce a small bias toward more favorable attitudes, but the differences are not pronounced and so the biases are, correspondingly, rather modest.
Figure 2.1
respondents might be less receptive to taking the time to participate. In addition, we attempted to bolster the response rate by adding an incentive for completing the survey. All surveys mailed in Wave 3 included a notice that one household among all those who returned surveys would be randomly selected and awarded a $250 gift certificate to Crossgates mall. (While we did not provide for an incentive in the Wave 1 and Wave 2 mailings, all households that returned surveys were included in the drawing.) Ten households were removed from the sample when surveys were returned as undeliverable by the USPS.
Citizen Oversight of the Albany Police, 2010
26
The lower-than-anticipated response rate precludes us from conducting analysis
of individual patrol zone samples, many of which are simply too small. Hence we collapsed the nineteen zones into eight areas so that we could analyze response patterns spatially, in terms of the parts of the City in which residents live (see Figure 2.1 above).
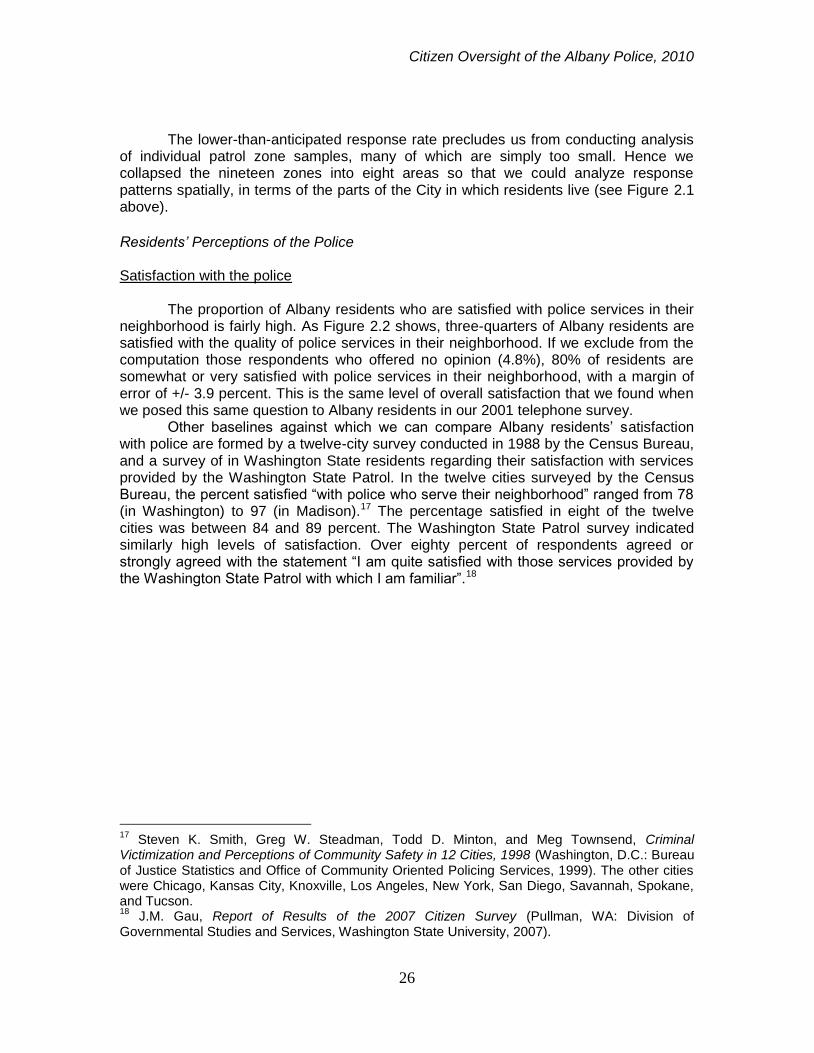
Residents’ Perceptions of the Police Satisfaction with the police The proportion of Albany residents who are satisfied with police services in their neighborhood is fairly high. As Figure 2.2 shows, three-quarters of Albany residents are satisfied with the quality of police services in their neighborhood. If we exclude from the computation those respondents who offered no opinion (4.8%), 80% of residents are somewhat or very satisfied with police services in their neighborhood, with a margin of error of +/- 3.9 percent. This is the same level of overall satisfaction that we found when we posed this same question to Albany residents in our 2001 telephone survey. Other baselines against which we can compare Albany residents‟ satisfaction with police are formed by a twelve-city survey conducted in 1988 by the Census Bureau, and a survey of in Washington State residents regarding their satisfaction with services provided by the Washington State Patrol. In the twelve cities surveyed by the Census Bureau, the percent satisfied “with police who serve their neighborhood” ranged from 78 (in Washington) to 97 (in Madison).17 The percentage satisfied in eight of the twelve cities was between 84 and 89 percent. The Washington State Patrol survey indicated similarly high levels of satisfaction. Over eighty percent of respondents agreed or strongly agreed with the statement “I am quite satisfied with those services provided by the Washington State Patrol with which I am familiar”.18
17
Steven K. Smith, Greg W. Steadman, Todd D. Minton, and Meg Townsend, Criminal Victimization and Perceptions of Community Safety in 12 Cities, 1998 (Washington, D.C.: Bureau of Justice Statistics and Office of Community Oriented Policing Services, 1999). The other cities were Chicago, Kansas City, Knoxville, Los Angeles, New York, San Diego, Savannah, Spokane, and Tucson. 18
J.M. Gau, Report of Results of the 2007 Citizen Survey (Pullman, WA: Division of Governmental Studies and Services, Washington State University, 2007).
Citizen Oversight of the Albany Police, 2010
27
Figure 2.2
As we did in the 2001 resident survey, we measured residents‟ satisfaction with the
police along several dimensions.19 The first dimension is police performance, which encompasses:
How good a job are police doing to prevent crime; and
How good a job are police doing helping people after they have been victims of
crime.
In these terms, we find that residents generally rate the police favorably. Figure 2.3 displays the percentages of residents with more favorable views (shaded blue and green), less favorable views (shaded yellow), and unfavorable views (with negative numbers shaded red). Just under half of all residents (46%) give police ratings of very good or good in terms of both crime prevention and helping victims. Nearly one-quarter of residents do not have an opinion on how well police fare in helping people who have been victims of crime, and eleven percent do not have an opinion on crime prevention. Of those who have an opinion, half to three-fifths believe that the police are doing a good job or very good job, while only 10 to 15 percent believe they are doing a poor job. The rating of police performance is consistent with what we found when we posed these same questions to Albany residents in 2001.
19
Chicago Community Policing Evaluation Consortium, Community Policing in Chicago, Year Seven: An Interim Report. (Chicago: Illinois Criminal Justice Information Authority, 2000).
32.1
43.4
14.7
5
Very satisfied
Somewhat satisfied
Somewhat dissatisfied
Very dissatisfied
Satisfaction with Police: All residents

Citizen Oversight of the Albany Police, 2010
28
Figure 2.3
The second dimension along which police services are commonly measured is police
responsiveness. The items to assess responsiveness include:
How responsive are the police in your neighborhood to community concerns;
How good a job are the police doing in dealing with problems that really concern
people in your neighborhood;
How good a job are the police doing in working with residents in your
neighborhood to solve local problems.
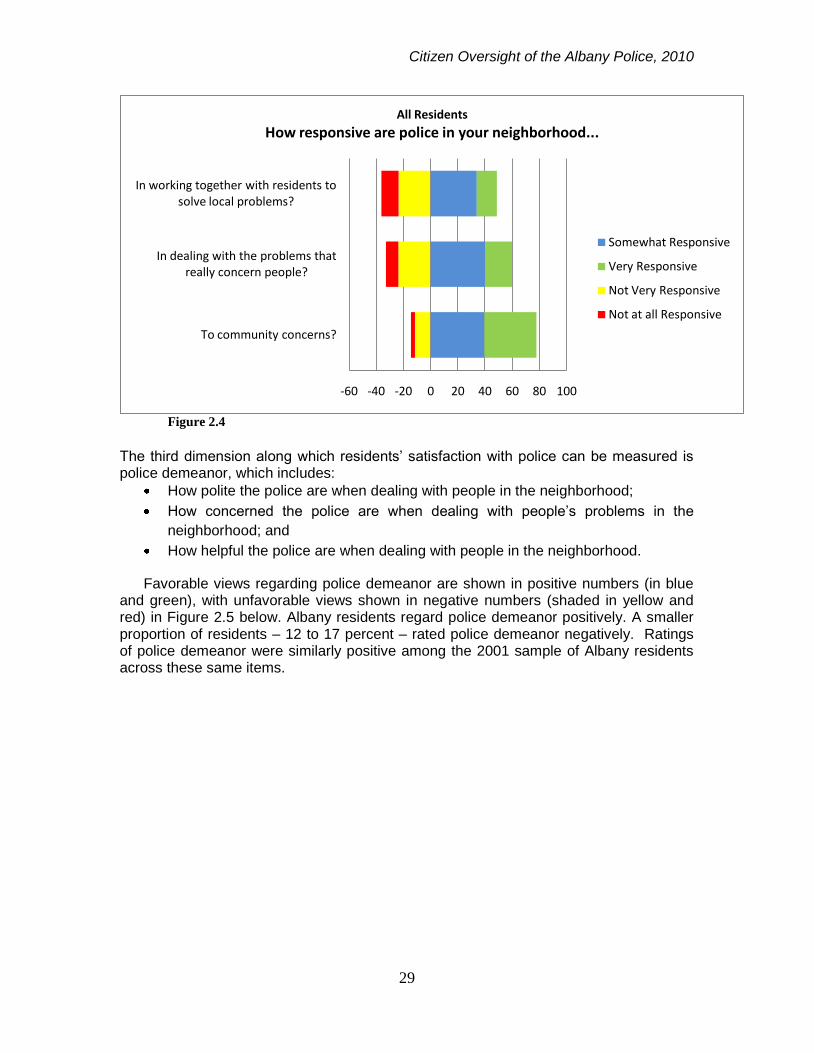
Residents give the police generally high marks in terms of responsiveness. Nearly eighty percent of residents believe the police are somewhat or very responsive to community concerns, while 8 percent do not know (and are not shown in Figure 2.4 below). Six in ten residents believe the police are doing a good or very good job dealing with problems that really concern people in their neighborhood. Residents feel less positive about the job police are doing working together with residents to solve local problems. Slightly less than half (49 percent) believe that police are doing a good or very good job working together with residents, 35 percent believe police are doing a fair to poor job, and 15 percent do not know (and are excluded from the bar chart).
The proportion of residents who give the police unfavorable marks in responsiveness is small in 2009, as it was in 2001. The picture has changed slightly, if at all, in that the proportion of residents giving the police favorable marks for responsiveness is slightly higher now than it was in 2001 (but within a margin of sampling error). This holds true across all three items measuring responsiveness.
-20 0 20 40 60 80
In helping people out after they have been victims of crimes?
To prevent crime in your neighborhood?
All Residents
How good a job are the police doing...
Poor job
Fair job
Good job
Very good job
Citizen Oversight of the Albany Police, 2010
29
Figure 2.4
The third dimension along which residents‟ satisfaction with police can be measured is police demeanor, which includes:
How polite the police are when dealing with people in the neighborhood;
How concerned the police are when dealing with people‟s problems in the
neighborhood; and
How helpful the police are when dealing with people in the neighborhood.
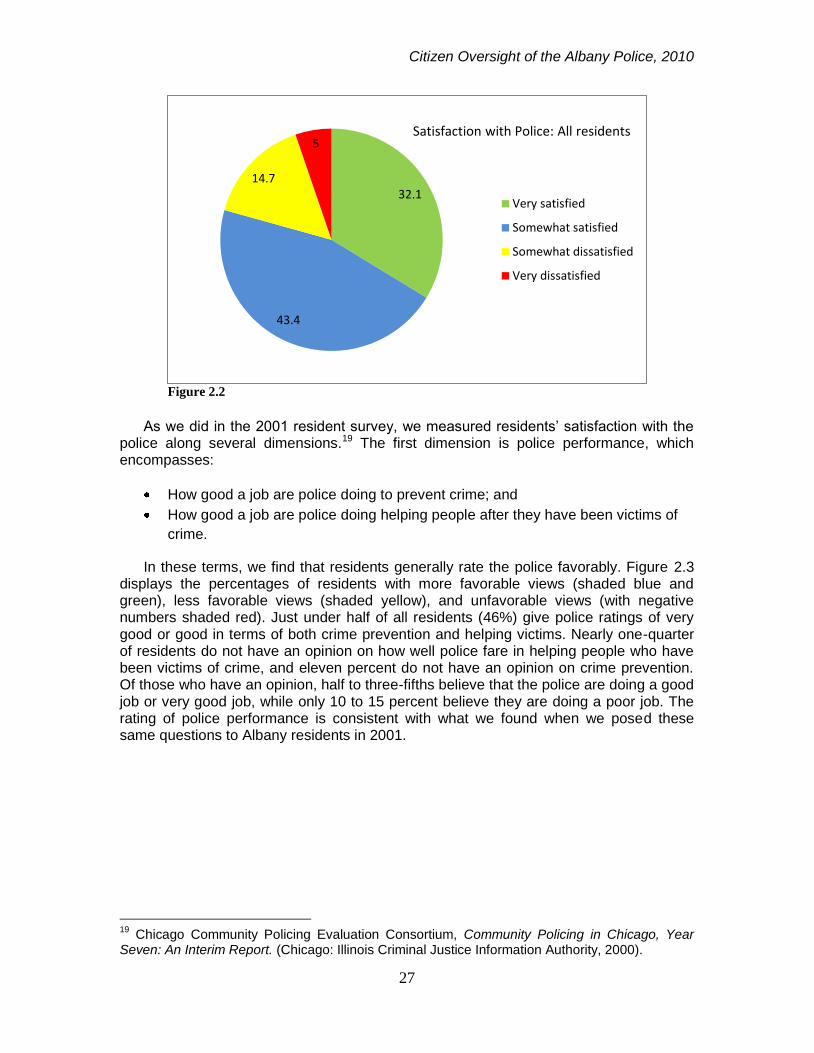
Favorable views regarding police demeanor are shown in positive numbers (in blue and green), with unfavorable views shown in negative numbers (shaded in yellow and red) in Figure 2.5 below. Albany residents regard police demeanor positively. A smaller proportion of residents – 12 to 17 percent – rated police demeanor negatively. Ratings of police demeanor were similarly positive among the 2001 sample of Albany residents across these same items.
-60 -40 -20 0 20 40 60 80 100
To community concerns?
In dealing with the problems that really concern people?
In working together with residents to solve local problems?
All Residents
How responsive are police in your neighborhood...
Somewhat Responsive
Very Responsive
Not Very Responsive
Not at all Responsive

Citizen Oversight of the Albany Police, 2010
30
Figure 2.5
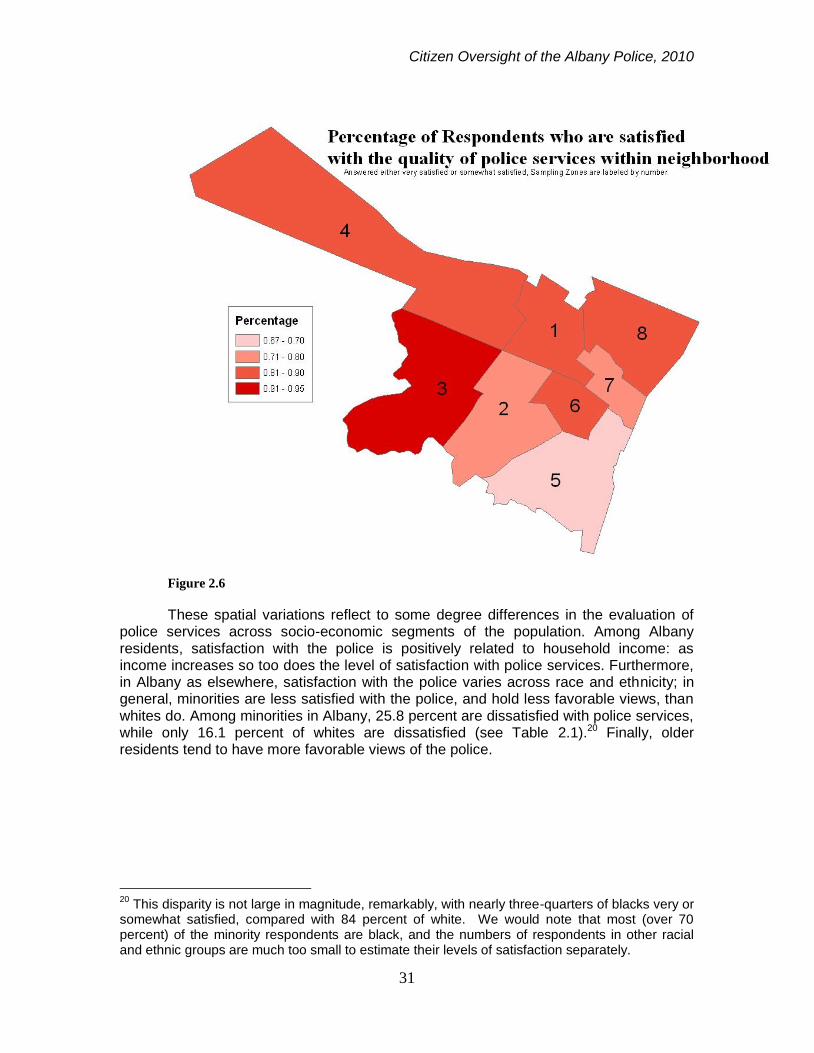
Overall, Albany residents are satisfied with the quality of police services. The level of satisfaction varies some across the areas of the City. Area 5 (see the map in Figure 2.6), which roughly corresponds to the South End and Delaware neighborhoods, exhibits the lowest level of satisfaction, while area 3, which encompasses the Buckingham Lake and Normanskill neighborhoods, has the highest level of satisfaction. The range of the levels of satisfaction is moderately wide, from about two-thirds (very or somewhat) satisfied to nearly all satisfied.
-40 -20 0 20 40 60 80
Polite
Concerned about people's problems
Helpful
Police DemeanorAll Residents
When dealing with people in your neighborhood, how ___ are police?
Not at all
Not very
Somewhat
Very
Citizen Oversight of the Albany Police, 2010
31
Figure 2.6
These spatial variations reflect to some degree differences in the evaluation of police services across socio-economic segments of the population. Among Albany residents, satisfaction with the police is positively related to household income: as income increases so too does the level of satisfaction with police services. Furthermore, in Albany as elsewhere, satisfaction with the police varies across race and ethnicity; in general, minorities are less satisfied with the police, and hold less favorable views, than whites do. Among minorities in Albany, 25.8 percent are dissatisfied with police services, while only 16.1 percent of whites are dissatisfied (see Table 2.1).20 Finally, older residents tend to have more favorable views of the police.
20
This disparity is not large in magnitude, remarkably, with nearly three-quarters of blacks very or somewhat satisfied, compared with 84 percent of white. We would note that most (over 70 percent) of the minority respondents are black, and the numbers of respondents in other racial and ethnic groups are much too small to estimate their levels of satisfaction separately.

Citizen Oversight of the Albany Police, 2010
32
Table 2.1 Satisfaction by Race
Minority % (n = 101) White % (n = 291)
Very Dissatisfied 10.9 2.4
Somewhat Dissatisfied 14.9 13.7
Somewhat Satisfied 42.6 44.7
Very Satisfied 31.7 39.2
These spatial patterns also likely reflect variation in the public safety conditions
that prevail in different parts of Albany, conditions for which residents hold the police responsible. Residents who perceive more serious problems with crime and disorder – not only muggings and break-ins but also public drinking, “corner gangs” (i.e., groups of young people “hanging around”), vacant lots and dilapidated buildings – are also less satisfied with the police. These kinds of patterns are found in many cities, and these factors are well-established influences on citizens‟ attitudes toward the police.21 Moreover, in Albany, a statistical analysis of satisfaction suggests that these factors account for the observed differences in satisfaction between whites and minorities: minorities are less satisfied, it appears, mainly because they tend to live in neighborhoods with higher levels of crime and disorder, and controlling statistically for the latter eliminates the difference by race. Perceived Problems with Police
The survey included five items designed to assess public perceptions of police practices that are commonly at the root of community-police tensions. Figure 2.7 shows the percentage of residents who perceive the following as a problem:
Police use of excessive physical force;
Police use of excessive force (verbal or physical);
Police stopping too many people; and
Police being too tough on people they stop.
For the most part, residents did not perceive as a problem in their neighborhoods either the use of force by Albany police or the quantity of and interaction during stops. No more than 20 percent of residents saw any of the four police practices as a problem. Of those who perceived excessive force to be a problem (a big problem or somewhat of a problem), 59 percent indicated both verbal and physical abuse was a problem, for 31 percent verbal abuse was the perceived problem, and 4 percent indicated only physical abuse was a problem.
21
See, e.g., Michael D. Reisig and Roger B. Parks, “Experience, Quality of Life, and Neighborhood Context: A Hierarchical Analysis of Satisfaction with Police,” Justice Quarterly 17 (2000): 607-630.

Citizen Oversight of the Albany Police, 2010
33
Figure 2.7
Perceptions Among Residents who Called APD for Assistance Within the Past Year
An estimated 41 percent of residents in our sample had called the Albany police for assistance within the previous year, which reflects a much higher level of contact with the police than the national average.22 Citizens‟ assessments of the quality of their contacts are of intrinsic interest, of course, and previous research suggests that citizens‟ satisfaction with their experiences with the police affect – and are affected by – their more general satisfaction with and attitudes toward the police.23 Findings presented in this section are based on the weighted responses of only those who indicated they had contact with the APD within the past year.
Satisfaction with the Police
Of those who called the police for assistance within the past year, 63 percent
were very or somewhat satisfied with the way the problem was handled; see Figure 2.8. (The margin of error for the estimate is +/- 7.2, higher than that for satisfaction overall because it is based on a small subsample, those residents who called the police in the past year.) Twenty-nine percent were very or somewhat dissatisfied, and 8 percent did not respond or did not know (and are omitted from the bar chart).
22
The Bureau of Justice Statistics estimates, based on the Police-Public Contact Survey, that 19 percent of U.S. residents age 16 or older had a face-to-face contact with a police officer in 2005. See Matthew R. Durose, Erica L. Smith, and Patrick A. Langan, Contacts between Police and the Public, 2005, Bureau of Justice Statistics Special Report (Washington: Bureau of Justice Statistics, 2007). 23
See Steven G. Brandl, James Frank, Robert E. Worden, and Timothy S. Bynum, “Global and Specific Attitudes Toward the Police: Disentangling the Relationship,” Justice Quarterly 11 (1994):119-134; Wesley G. Skogan, “Citizen Satisfaction With Police Encounters,” Police Quarterly 8 (2005): 298-321; and Dennis P. Rosenbaum, Amie M. Schuck, Sandra K. Costello, Darnell F. Hawkins, and Marianne K. Ring, “Attitudes Toward the Police: The Effects of Direct and Vicarious Experience,” Police Quarterly 8 (2005): 343-365.
-20 0 20 40 60 80
Police stopping too many people on the streets without a good reason?
Police being too tough on people they stop?
Police using just excessive physical (not verbal) force against people?
Problems with PoliceAll Residents
How big a problem in your neighborhood is...
A big problem
Somewhat of a problem
No Problem

Citizen Oversight of the Albany Police, 2010
34
Figure 2.8
So that we might better understand residents‟ attitudes about different dimensions of
their interactions with police, respondents who had called the APD within the previous year were asked to rate police performance in terms of:
Were the police polite;
Did you find the police helpful;
Did the police take care of the problem;
Did the police explain the action they would take in response; and
Did the police pay careful attention to what you had to say.
In the main, police performance was rated favorably by the majority of those who had recently called APD for assistance (indicated in green shading in Figure 2.9 below). Across all five dimensions police performance in the most recent assistance call was rated positively by 61 percent or more of the respondents who expressed an opinion. While the majority of respondents indicated that the police did take care of the problem about which they contacted the police, and that police also explained the action they would take in response to the problem, these two dimensions were viewed less favorably than the other three dimensions. Just over one-quarter of respondents indicated that the police did not take care of the problem they reported and indicated that the police did not explain the action they would take in response to the reported problem. Those who responded that they did not know are not shown in the bar chart). Police again were given high positive marks for demeanor during the contact; seventy percent or more felt the police were polite, helpful, and attentive.
Very Satisfied
Somewhat Satisfied
Somewhat Dissatisfied
Very Dissatisfied
Satisfaction with Police in Assistance CallsResidents who Called for Assistance
Overall, how satisfied were you with the way the problem was handled?

Citizen Oversight of the Albany Police, 2010
35
Figure 2.9
Residents’ Perceptions of the Complaint Process
When asked whether, since September of 2008, respondents or any member of their households had any reason to complain about any aspect of police services from the Albany Police Department, 14 percent said that they had. We would expect a low prevalence of perceived reasons to complain, given that we randomly sampled Albany residents, the majority of whom had had no contact with APD within the past year, and among those who had, most were satisfied.
Reasons for Complaints
Among those residents who had a reason to complain about police services, the most common problems about which they would complain included: police not being equitable in delivering services/how they treat people (34 percent), ineffective/incomplete police work (33 percent), police courtesy (29 percent), unnecessary stops (26 percent), and need for more service/police presence/visibility (20 percent); see Figure 2.10.24
24
Respondents were prompted to select the best response. However, some selected more than one problem. Therefore, the percent total exceeds 100.
-50 0 50 100
Paid attention
Explained action
Took care of Problem
Helpful
Polite
Police Performance in Assistance CallsResidents who Requested Assistance
Yes/Very or Somewhat
No

Citizen Oversight of the Albany Police, 2010
36
Figure 2.10
The Decision to Complain
Of those respondents who believed they had a reason to complain about Albany police, just over one-third indicated that a complaint was made by either the respondent (25.4 percent) or a member of their household (11 percent). Among those who indicated they had a reason to complain but elected not to, the overwhelming sentiment driving the decision was a belief that it “wouldn‟t do any good to complain.” See Figure 2.11 for a full description of the response categories from which respondents could chose when asked to describe the reason for not complaining, and the percentage of respondents selecting each.
Figure 2.11
0 5 10 15 20 25 30 35 40
Request for more service, police presence, or visibility
Police courtsey (rude of verbally abusive officers)
Physical mistreatment
Unnecessary stop
Car unfairly towed
Speed traps
Ineffective/incomplete police work
Unfair parking ticket
Complaint about traffic signal/stop sign
Police not being equitable in delivering services/how they treat …
Could you briefly describe what the problem was?
0 10 20 30 40 50 60 70
Afraid of police
Problem fixed without needing to …
Wouldn't do any good to complain
Complaining might make problem worse
Didn't know how/to whom to complain
Someone else complained for me
Why didn't you complain?Residents who had a Reason to Complain but did not Make a
Complaint

Citizen Oversight of the Albany Police, 2010
37
When those who did complain were asked to whom their complaint was made,
41 percent did not know or did not answer the question. Most who did know to whom their complaint was made indicated that they called the police department and spoke with whomever answered or was put on the phone. Just over nine percent indicated that they made a complaint through another outlet, including traffic court and writing a letter. Figure 2.12 displays all of the targets to whom respondents directed their complaints.
Figure 2.12
The Complaint Experience
The majority of those who took action to complain held unfavorable views about
how their complaints were handled (shaded in red and yellow on the bar chart below). Among those with unfavorable views, the majority believed that nothing was done with their complaint and a few others felt that complaining made matters worse. Less than two percent reported that the party to whom their complaint was directed did what the respondent wanted, while nearly twenty percent reported that the party did something to help.
Figure 2.13
0 5 10 15 20 25 30 35 40
Called police department, talked to person who answered/was put on phone
Office of Professional Standards/internal affairs
Called City Hall/talked to person who answered/was put on phone
Lawyer
Other
To whom was the complaint made?
-60 -40 -20 0 20 40
Did they...
Do what you wanted
Do something to help
Do nothing
Make matters worse

Citizen Oversight of the Albany Police, 2010
38
Among those who did complain, just over half had negative views regarding the
handling of their complaint (shaded red and yellow in Figure 2.14). Most who were not satisfied were very dissatisfied (shaded red).
Figure 2.14
Citizens’ Police Review Board Residents‟ Awareness of CPRB
All respondents were asked if they were aware that Albany has a citizen review board, that is, a board that includes citizens who oversee the police department‟s investigation of complaints about its officers. Fifty percent of residents are not aware of citizen review in Albany, 45 percent know that Albany has citizen review, and 5 percent did not respond to the question.
The most common mechanisms by which people learned of citizen review in Albany included: the newspaper (62 percent), television (49 percent), a community group (22 percent), or radio (19 percent). Only 14 percent of those who were aware of the CPRB also were aware that the CPRB maintained a website. See Figure 2.15 for a complete list of ways in which residents were made aware of the review board. Respondents were prompted to indicate all that applied.
-60 -40 -20 0 20 40
How satisfied were you with how your complaint was handled?
Residents who Made Complaints
Very satisfied
Somewhat satisfied
Somewhat dissatisfied
Very dissatisfied

Citizen Oversight of the Albany Police, 2010
39
Figure 2.15
Residents‟ Perceptions of CPRB Residents who know about citizen review in Albany express skepticism regarding the process. Nearly half believe that a police officer against whom a complaint is filed would be treated fairly by the Board, and only about one-third believe that they, as complainants, would be treated fairly (see Figure 2.16). Many residents (about 48%) profess not to know how fairly the parties to a complaint would be treated (and are not included in the bars of the chart, thus results do not sum to 100).
Figure 2.16
The issue of review board treatment of officers and complainants was further measured in a question designed to differentiate degrees of fairness (moving beyond the yes or no questions posed to respondents); see Figure 2.17. Excluding those who did not know, three-fifths believed the review board would act favorably toward the police
0 10 20 30 40 50 60 70
Newspaper
Television
Radio
Flyers
Police
Local social service or government agency
Community group
Religious organization (church, synagogue, etc)
Friend or relative
Other
How did you hear about the CPRB?
-40 -20 0 20 40 60
You would be treated fairly?
The police officer would be treated fairly?
Perceived Fairness of CPRBResidents who were/are aware of CPRB
If you were to make a complaint against a polcie officer, do you think that...
Yes
No
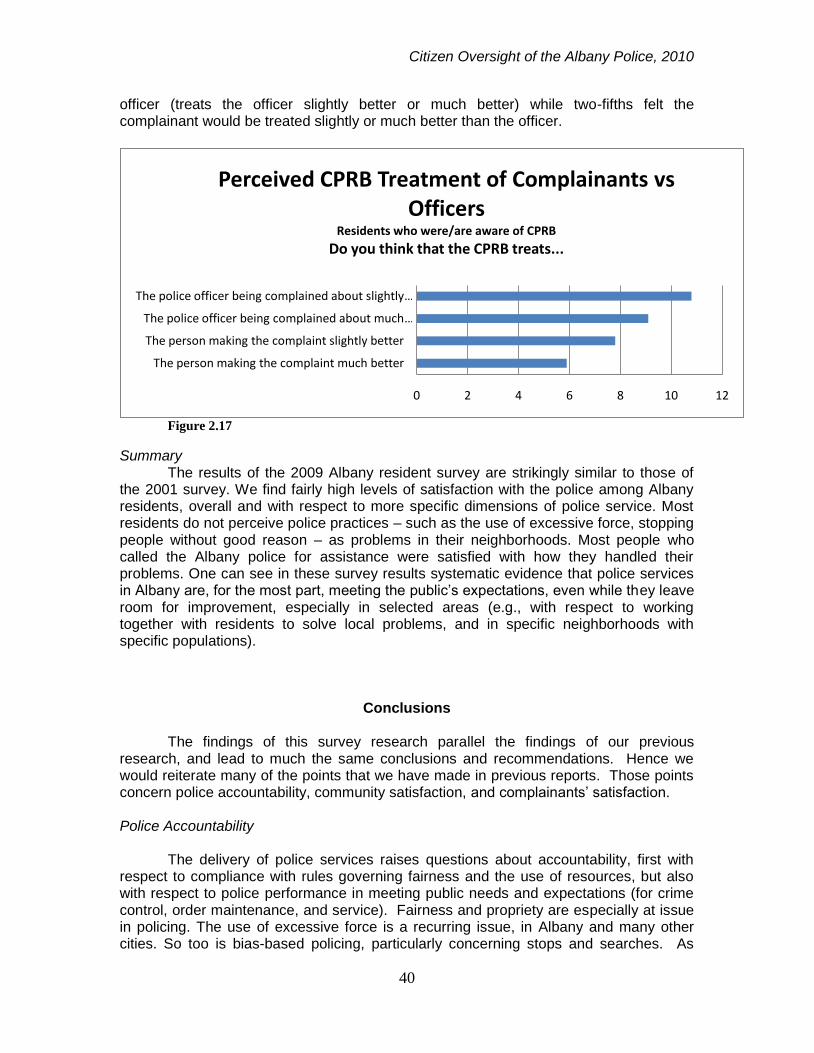
Citizen Oversight of the Albany Police, 2010
40
officer (treats the officer slightly better or much better) while two-fifths felt the complainant would be treated slightly or much better than the officer.
Figure 2.17
Summary The results of the 2009 Albany resident survey are strikingly similar to those of the 2001 survey. We find fairly high levels of satisfaction with the police among Albany residents, overall and with respect to more specific dimensions of police service. Most residents do not perceive police practices – such as the use of excessive force, stopping people without good reason – as problems in their neighborhoods. Most people who called the Albany police for assistance were satisfied with how they handled their problems. One can see in these survey results systematic evidence that police services in Albany are, for the most part, meeting the public‟s expectations, even while they leave room for improvement, especially in selected areas (e.g., with respect to working together with residents to solve local problems, and in specific neighborhoods with specific populations).
Conclusions The findings of this survey research parallel the findings of our previous research, and lead to much the same conclusions and recommendations. Hence we would reiterate many of the points that we have made in previous reports. Those points concern police accountability, community satisfaction, and complainants‟ satisfaction. Police Accountability
The delivery of police services raises questions about accountability, first with respect to compliance with rules governing fairness and the use of resources, but also with respect to police performance in meeting public needs and expectations (for crime control, order maintenance, and service). Fairness and propriety are especially at issue in policing. The use of excessive force is a recurring issue, in Albany and many other cities. So too is bias-based policing, particularly concerning stops and searches. As
0 2 4 6 8 10 12
The person making the complaint much better
The person making the complaint slightly better
The police officer being complained about much …
The police officer being complained about slightly …
Perceived CPRB Treatment of Complainants vs Officers
Residents who were/are aware of CPRB
Do you think that the CPRB treats...

Citizen Oversight of the Albany Police, 2010
41
important as these issues are, however, the attention to fairness and propriety reflects the “accountability bias” in American government: “Accountability holders concentrate on finances and fairness. They give much less attention to performance.”25 Expectations for finances and fairness, which take the form of explicit rules, are clearer than those for performance, and failures to meet these expectations can be more readily defined, detected, and sanctioned.
In order to affect compliance with police rules and procedures, citizen oversight agencies rely mainly on deterring misconduct. But there is good reason to doubt that misconduct can be deterred by complaint review: underreporting and evidentiary problems make the probability that misconduct will be detected and sanctioned quite low. We previously estimated, based on the client survey that action is taken to complain in only 23% of the cases of perceived misconduct. Furthermore, most complaints are directed not to the CPRB but to other officials: only 9% are directed to OPS or the CPRB. If as many as 20 percent of those complaints are sustained (and 20 percent is a rate unlikely to be achieved even with the strongest, most independent form of oversight), then less than one half of 1 percent of the (perceived) misconduct by police is sanctioned as a result of complaint review. Even dramatic improvements in the rate at which complaints are sustained would do little to enhance the deterrent effect of complaint review. (If 50 percent of the formal complaints were sustained, and assuming that all of them were meritorious, only 1 percent of the misconduct would be sanctioned through complaint review.) When one considers that some misconduct consists of actions taken in the heat of the moment, or simple mistakes or bad judgments, which are not readily deterred, then the prospects for compliance through complaint review appear dim indeed.26
Moreover, police do not necessarily perform well in controlling crime, maintaining order, and providing service, merely because they comply with rules and procedures. “Working to rule” is a dysfunction found in many organizations, at one time or another; in police agencies, “working to rule” may have detrimental consequences for the public‟s safety and well-being. Attending to accountability as compliance with rules (fairness and finances) does not suffice to ensure performance that meets public needs and demands.
Research on public bureaucracies suggests that governmental institutions can hold public agencies accountable - with respect to their performance or with respect to their compliance with rules and procedures - by wielding certain forms of governmental authority: budgetary authority; appointment authority; oversight authority. The CPRB has only some oversight authority. Other institutions monopolize some of these key resources: the mayor has the power of appointment and removal, and also some budget authority, and the Common Council has some budget authority and the authority to ask questions. The CPRB is, then, one element in an accountability network. Even in performing its policy review function, it must depend on other officials to accept recommended changes. Its principal influence may lie in bringing attention to patterns of misconduct, in particular, and police performance, more generally. For ultimately it is the leadership of the agency that has the greatest capacity to determine police priorities and shape the quality of the services that citizens receive.
25
Robert D. Behn, Rethinking Democratic Accountability (Washington: Brookings Institution, 2001), pp. 12-13.
26 This is not to imply that a well-structured and properly implemented system of complaint review
serves no useful purposes. It is to say that controlling police misconduct through deterrence is not among those purposes.
Citizen Oversight of the Albany Police, 2010
42
This means that in addition to its review of individual complaints, the CPRB should make maximal use of its authority to make recommendations to the Common Council and the Mayor concerning police policies and practices. Samuel Walker, a well-known proponent of citizen oversight, has observed that “the shortcomings of many citizen review agencies to date result from a lack of vision and an excessively narrow focus on symptoms - individual complaints - rather than on the underlying problems.”27 Walker and others suggest that citizen oversight agencies should place greater emphasis on their role in reviewing police policy and making recommendations for changes in procedure and training. The CPRB cannot forego the review of individual complaints. But it might be able to do more with respect to reviewing police policies and practices. Community Satisfaction
We have found in our surveys of Albany residents no evidence of pervasive misconduct, nor have we found evidence of widespread perceptions of police misconduct. We find among Albany residents a high level of satisfaction with police services in their neighborhoods, and favorable views of the performance of Albany police on more specific dimensions of police work. Furthermore, in our surveys of residents and of clients, we find among people who have contact with the Albany police a high level of satisfaction with how they are treated by the police and how their problems are handled. Even among those who are stopped by Albany police, we have found a high level of satisfaction with how they are treated by officers. A fairly small segment of residents perceive abuses of police authority - stopping too many people, or using excessive force - as problems.
We have also found that citizens who believe that they have some reason to complain about police services complain, if they complain at all, by airing their concerns in any of a number of venues, of which the CPRB is but one. The CPRB remains one part of a larger system for processing citizens‟ grievances against the police. Thus the complaints processed by OPS and the CPRB represent the proverbial tip of the iceberg of unsatisfactory police-citizen contacts (unsatisfactory from the citizen‟s perspective, at least). Complainant Satisfaction
Many proponents of citizen oversight form their strongest expectations for
positive impacts with respect to complainants‟ satisfaction with complaint review, yet it is there that they may find their most profound disappointment. These expectations are implicitly or explicitly based on three assumptions: that many complaints are meritorious; that complainants are interested primarily in having police misconduct punished; and that police investigations of these complaints are not sufficiently probing. From these premises, it follows that citizen oversight of complaint investigations will result in a sharp increase in the proportion of complaints that are sustained, and also in an increase in the satisfaction of complainants.
27
Samuel Walker, New Directions in Citizen Oversight: The Auditor Approach to Handling Citizen Complaints, in Tara O‟Connor Shelley and Anne C. Grant (eds.), Problem-Oriented Policing: Crime-Specific Problems, Critical Issues and Making POP Work (Washington: Police Executive Research Forum, 1998), p. 171.

Citizen Oversight of the Albany Police, 2010
43
But the documented experience in other jurisdictions shows that the rate at which citizen complaints are sustained has remained low even after the adoption of citizen oversight. Whenever and wherever police investigations of citizen complaints are thorough and fair in the absence of citizen oversight, the adoption of citizen oversight is unlikely to raise the rate at which complaints are sustained. The implication is that at least two (or all three) of the assumptions were untrue, at least in those jurisdictions. A process designed primarily to fix guilt and impose sanctions in cases in which guilt is difficult to establish - even when the officer is guilty and the investigation is thorough - is one that seems unlikely to yield outcomes that are satisfactory to anyone interested primarily in punishment.
Moreover, it appears that such a process is not well-adapted to most complainants‟ goals in filing complaints. A study of New York City‟s Civilian Complaint Review Board found, as we have in Albany, that most complainants do not file complaints in order to have the officer punished, and the authors of that study concluded that the focus of civilian review on investigation and punishment was not compatible with the objectives of many complainants.28 Complainants who file complaints with the objective of letting the department know about the incident find that the review process typically eventuates in one of four outcomes, only one of which B a sustained complaint B could be satisfactory from a complainant‟s point of view. This is a structural shortcoming of citizen oversight, and it may be the reason that some advocates of citizen oversight have placed greater emphasis on the role of oversight bodies in reviewing police policy and making recommendations for changes in procedure and training, and less emphasis on the review of complaints, as noted above. Even so, citizen review of complaints may serve as an important mechanism of accountability, given many citizens‟ - and especially clients‟ - skepticism about the integrity of the complaint review process when citizens do not play a role. The implication is that an assessment of citizen oversight should not turn primarily on the level of satisfaction among complainants.
28
Sviridoff and McElroy, Processing Complaints Against the Police in New York City, op cit., especially pp. 27-30.

Citizen Oversight of the Albany Police, 2010
44
APPENDIX
Resident Survey Summary Tables

Q1
Very satisfiedSomewhat
satisfied
Somewhat
dissatisfied
Very
dissatisfied
Don't
know/No
response
32.1 43.4 14.7 5 4.8
Q2
Very responsiveSomewhat
responsive
Not very
responsive
Not at all
responsive
Don't
know/No
response
38.3 39.6 11.5 3 7.5
Q3-Q6
Very good job Good job Fair job Poor job
Don't
know/No
response
19.9 40 23.7 9.2 8.2
14.7 34 23.6 12.6 15.1
In helping people out after they have been victims of crimes? 14.4 32 21.3 8 24.2
To prevent crime in your neighborhood? 13.6 32.6 28 14.6 11
Overall, how satisfied are you with the quality of police services in your
neighborhood?
2009 RESIDENT SURVEY SUMMARY TABLES
How responsive are the police in your neighborhood to community
concerns?
In dealing with the problems that really concern people in your
neighborhood?
In working together with residents in your neighborhood to solve local
problems?
How good a job are the police doing…
Page 1

Q7-Q9
Very Somewhat Not very Not at all
Don't
know/No
response
Polite? 44.1 30.9 7.4 5.8 11.5
Concerned about people's problems? 25.9 39.4 13.7 3.7 17.1
Helpful? 32 39.5 9.5 2.9 15.7
Q10-Q13
A big problemSomewhat of a
problemNo Problem
Don't
know/No
response
Police stopping too many people on the streets without a good reason? 4.8 14.4 67.4 13.2
Police being too tough on people they stop? 5.4 12.6 65.4 16.6
6.8 11 64.7 17.5
Police using just excessive physical (not verbal) force against people? 5.4 10.8 65.5 18
Q14
Verbal Abuse
Only
Physical Abuse
OnlyBoth
Don't
know/No
response
Would you say that it is verbal abuse that is a problem, physical abuse, or both? 31.4 3.7 58.8 6
Police using excessive force, that is, being verbally or physically abusive to
people?
When dealing with people in your neighborhood, are police:
In your neighborhood, how big a problem is…
Page 2
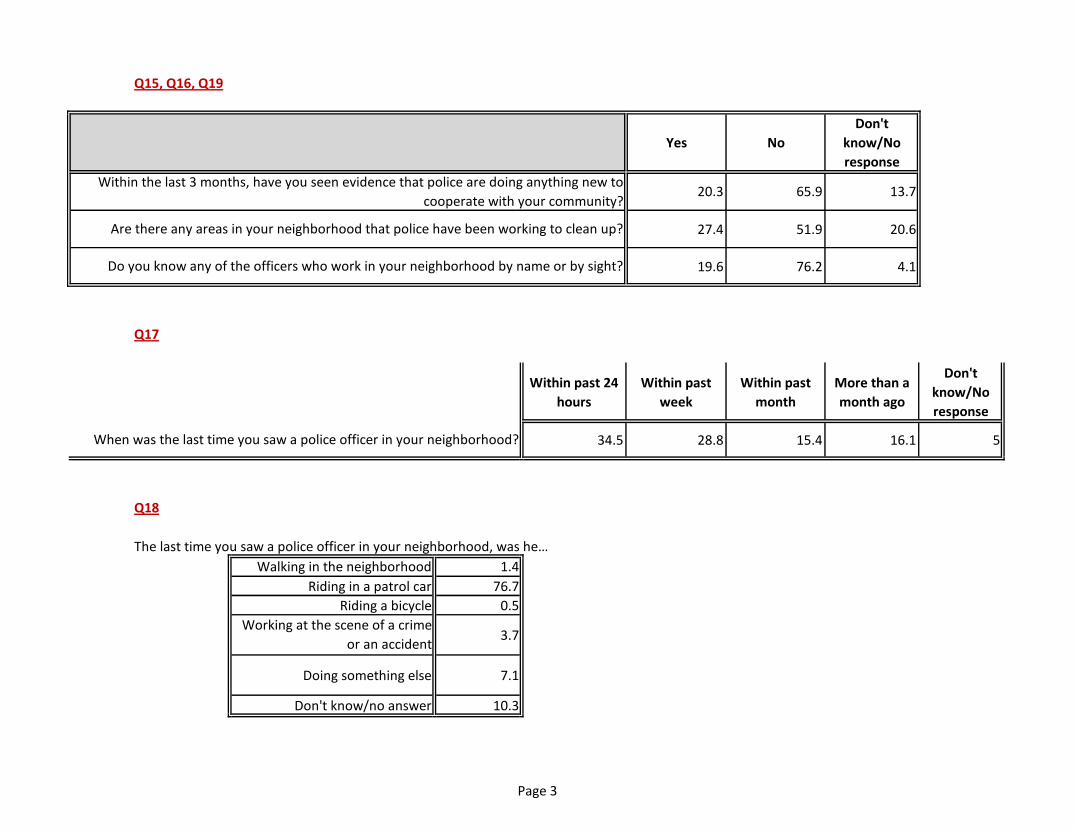
Q15, Q16, Q19
Yes No
Don't
know/No
response
20.3 65.9 13.7
27.4 51.9 20.6
19.6 76.2 4.1
Q17
Within past 24
hours
Within past
week
Within past
month
More than a
month ago
Don't
know/No
response
34.5 28.8 15.4 16.1 5
Q18
The last time you saw a police officer in your neighborhood, was he…
Walking in the neighborhood 1.4
Riding in a patrol car 76.7
Riding a bicycle 0.5
3.7
Doing something else 7.1
Don't know/no answer 10.3
Within the last 3 months, have you seen evidence that police are doing anything new to
cooperate with your community?
Working at the scene of a crime
or an accident
Are there any areas in your neighborhood that police have been working to clean up?
Do you know any of the officers who work in your neighborhood by name or by sight?
When was the last time you saw a police officer in your neighborhood?
Page 3

Q20
Yes No
Don't
know/No
response
Within the past year, have you called the Albany police for assistance? 40.9 56.6 2.6
*Among those who called for assistance in the past year……
Q23
In my
neighborhood
Somewhere
else
Don't
know/No
response
Did the problem occur in your neighborhood or somewhere else? 83.7 10.1 6.2
Q24
How quickly did the police come?
Faster than you expected 27.1
Slower than you expected 17.9
About as fast as you expected 43.8
Did not come 2.3
Don't know/no response 8.9
Q25, Q26, Q29
Yes No
Don't
know/no
response
When you talked to police, did they pay careful attention to what you had to say? 75.9 16.5 7.6
Did police clearly explain what action they would take in response to your contact? 65.4 26.1 8.5
Did police take care of the problem? 61.5 27.5 11
During this contact with police…
Page 4

Q27, Q28
Very Somewhat Not very Not at all
Don't
know/no
response
Helpful 43.6 29 12.9 7 7.5
Polite 55.2 24.1 9.3 1.4 10
Q30
Overall, how satisfied were you with the way the problem was handled?
Very satisfied 46.9
somewhat satisfied 16.1
Somewhat dissatisfied 16.1
Very dissatisfied 12.5
Don't know/no response 8.3
Entire Sample….
Q31
Very safe Somewhat safeSomewhat
unsafeVery unsafe
Don't
know/No
response
26.5 39.4 21.6 10.2 2
Q32
Yes No
Don't
know/No
response
55.6 40.5 3.9
During this contact with police, were they…
How safe do you feel or would you feel being alone outside in your
neighborhood at night?
Is there any particular place in your neighborhood where you would be afraid to go alone
either during the day or after dark?
Page 5
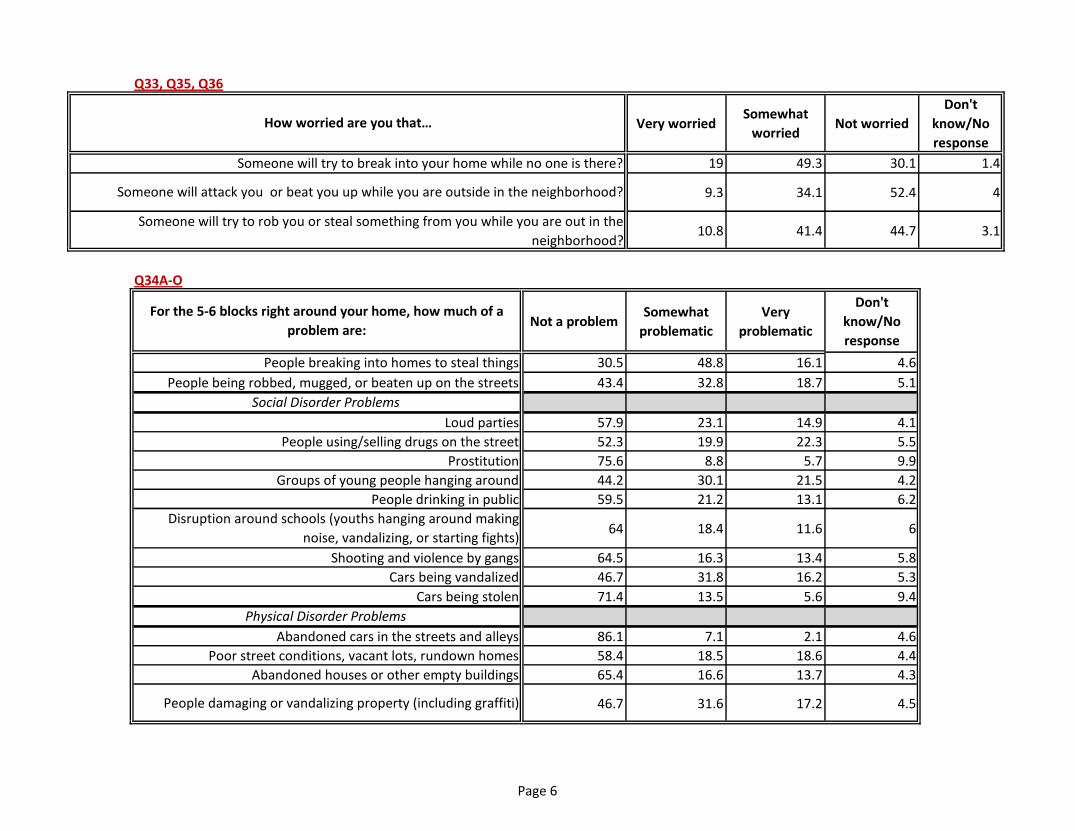
Q33, Q35, Q36
Very worriedSomewhat
worriedNot worried
Don't
know/No
response
Someone will try to break into your home while no one is there? 19 49.3 30.1 1.4
9.3 34.1 52.4 4
10.8 41.4 44.7 3.1
Q34A-O
Not a problemSomewhat
problematic
Very
problematic
Don't
know/No
response
People breaking into homes to steal things 30.5 48.8 16.1 4.6
People being robbed, mugged, or beaten up on the streets 43.4 32.8 18.7 5.1
Loud parties 57.9 23.1 14.9 4.1
People using/selling drugs on the street 52.3 19.9 22.3 5.5
Prostitution 75.6 8.8 5.7 9.9
Groups of young people hanging around 44.2 30.1 21.5 4.2
People drinking in public 59.5 21.2 13.1 6.2
64 18.4 11.6 6
Shooting and violence by gangs 64.5 16.3 13.4 5.8
Cars being vandalized 46.7 31.8 16.2 5.3
Cars being stolen 71.4 13.5 5.6 9.4
Abandoned cars in the streets and alleys 86.1 7.1 2.1 4.6
Poor street conditions, vacant lots, rundown homes 58.4 18.5 18.6 4.4
Abandoned houses or other empty buildings 65.4 16.6 13.7 4.3
46.7 31.6 17.2 4.5
Someone will attack you or beat you up while you are outside in the neighborhood?
Someone will try to rob you or steal something from you while you are out in the
neighborhood?
How worried are you that…
For the 5-6 blocks right around your home, how much of a
problem are:
Social Disorder Problems
Disruption around schools (youths hanging around making
noise, vandalizing, or starting fights)
Physical Disorder Problems
People damaging or vandalizing property (including graffiti)
Page 6

Q37
How often does worry about crime prevent you from doing the things you would like to in your neighborhood?
Very often 9
Somewhat often 18.7
Rarely 37.6
Never 31.5
Don't know/No response 2.9
Q42
Before you moved here, did you live…
Somewhere else in this neighborhood 18.2
Somewhere else in the city, or 45.4
Some other city altogether 31.4
Don't know/No Response 5
Q43
In the next year, how likely is it that you will move from the City of Albany?
Definitely move 6.6
Probably move 13.8
Probably not move 28
Definitely not move 48.9
Don't know/ No response 2.7
Q44
Yes No
Don't
know/No
response
14.5 82.3 3.1
In the last year, since September of 2008, have you or any member of your
household had any reason to complain about any aspect of police services from
the Albany Police Department?
Page 7

*Among those who had a reason to complain…
Q47
Could you briefly describe what the problem was?
Request for more service, police presence, or visibility 20.2
Police courtesy (rude of verbally abusive officers) 29.4
Physical mistreatment 3.4
Unnecessary stop 25.6
Car unfairly towed 3.5
Speed traps 13.9
Ineffective/incomplete police work 32.8
Unfair parking ticket 17
Complaint about traffic signal/stop sign 2.8
Police not being equitable in delivering services/how they treat people 33.7
Q48
Regarding this most recent problem, did you or any member of your household make a complaint?
Yes, I made complaint 25.4
Yes, other household member made complaint 11.1
No 57.8
Don't know/No response 4.2
Q49
*Among those who did complain…
To whom was the complaint made?
Called police department, talked to person who answered/was put on phone 38
Office of Professional Standards/internal affairs 6
Civilian Police Review Board 0
Police-community relations group/leader 0
Called City Hall/talked to person who answered/was put on phone 2.1
City council member 0
Civic group/Civil rights group/Neighborhood group/leader 0
Priest/religious leader 0
Lawyer 3.3
Other 9.2 Went to traffic court or APD, letter
Don't know/No response 41.4
Page 8

Q50
Did they…
Do what you wanted 1.8
Do something to help 19.3
Do nothing 43
Make matters worse 4
Don't know/No response 31.9
Q51
Very satisfiedSomewhat
satisfied
Somewhat
dissatisfied
Very
dissatisfied
Don't
know/No
response
How satisfied were you with how your complaint was handled? 7.2 23.5 5.4 49.8 14.2
Q52
Why didn't you complain?
Afraid of police 3.1
No time 0
Problem fixed without needing to complain 5
Wouldn't do any good to complain 59.6
Complaining might make problem worse 4.8
Didn't know how/to whom to complain 3.8
Someone else complained for me 2.9
Not important enough 0
Don't know/No response 20.8
Page 9

Entire Sample…
Q53
Yes No
Don't
know/No
response
45 50 5
Q54
How did you hear about it? Yes
Newspaper 62.2
Television 49.1
Radio 19.4
Billboards, other signage 0
Flyers 1.5
Police 5.1
Local social service or government agency 7.2
Community group 22.1
Religious organization (church, synagogue, etc) 4
Friend or relative 12.4
Other 10.3 employer, Albany law school, internet, library
Q55, Q56
Yes No Don't know
Don't
know/No
response
You would be treated fairly? 34.5 17.4 44.7 3.3
The police officer would be treated fairly? 47.6 4.8 42.6 5.1
Do you know whether Albany has a civilian review board, that is, a board that includes civilians
who oversee the police department's investigation of complaints about its officers?
If you were to make a complaint against a police officer, do you think that…
Page 10

Q57
Treats the person making the complaint much better 5.9
Treats the person making the complaint slightly better 7.8
Treats the police officer being complained about much better 9.1
Treats the police officer being complained about slightly better 10.8
Don't know 56.7
No response 9.6
Q58, Q59
Yes NoDon't know/No
response
Are you aware that the review board has a website? 14.5 77.9 7.6
If yes, have you ever referred to this site? 5.5 82 12.5
Q62
Male 40.3
Female 56.8
Q63
What is the highest level of education completed?
Completed elementary school 0.4
Some high school 4.2
High school graduate 13.5
Some college or trade school 18.1
Associates degree/2 year program 9.6
Bachelor's degree 24
Advanced degree 28
No response 2.3
Do you think that the review board would treat the person making the complaint
better or the police officer being complained about better?
Page 11

Q64
What is your racial/ethnic background?
Black/African American 15.9
White/Caucasian (non-Hispanic) 73.9
Latino/Latina 1.9
Native American 0.5
Asian 1.1
Pacific Islander 0
East Indian 0.3
Other 2.1
No response 4.3
Q65
Please indicate your approximate family income before taxes in 2008
Less than $10,000 7.1
$10,001 to $25,000 12.3
$25,001 to $40,000 20.1
$40,001 to $55,000 12.5
$55,001 to $70,000 11.4
$70,001 to $95,000 8.3
More than $95,000 15.9
No response 12.5
Q66
What was your work status last week?
Working full-time 48.1
Working part-time 10.4
Employed with job but vacation/sick/etc 1.1
Unemployed/laid off 5.6
Retired 24.6
In school/School break 2.2
Keeping house 3.6
No response 4.2
Page 12

Q67
Are you presently…
Married 40.9
Divorced 16.4
Separated 4.7
Widowed 8.1
Never been married 26.4
No response 3.5
Q68
In what kind of housing unit do you live?
Single-family home 60
A duplex or flat 17
An apartment building 20.3
A mobile home 0
No response 2.6
Q69
Own Rent No response
Do you own or rent your home? 68.9 30.2 0.9
Page 13


![PATRICIA ELLEN SALKIN - University of Baltimore · (Government Ethics [on-line course], ... City of Albany Citizen’s Police Review Board, 2000-2002; ongoing oversight to present](https://static.fdocuments.in/doc/165x107/5b7af5427f8b9aa74b8ba16d/patricia-ellen-salkin-university-of-government-ethics-on-line-course-.jpg)