citigroup April 17, 2000 - First Quarter Financial Supplement
Upload
quarterlyearningsreportsCategory
view
341download
6description
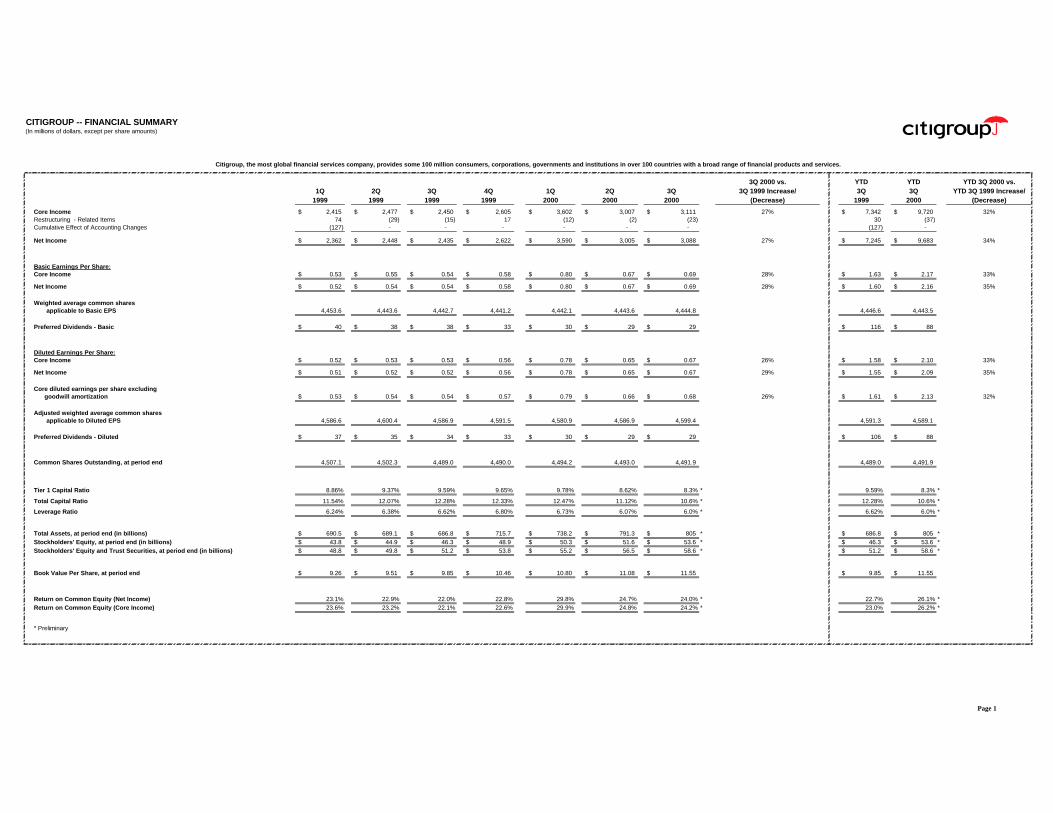
CITIGROUP - QUARTERLY FINANCIAL DATA SUPPLEMENT
Page Number
Citigroup ConsolidatedFinancial Summary 1Segment Net Revenues 2Segment Core Income 3
Segment DetailGlobal Consumer:
Banking / LendingCitibanking North America 4Mortgage Banking 5North America Cards 6CitiFinancial 7InsuranceTravelers Life and Annuity 8Primerica Financial Services 9Travelers Property Casualty - Personal Lines 10InternationalEurope, Middle East & Africa 11Asia Pacific 12Latin America 13Other Consumer 14
Global Corporate and Investment Bank:Salomon Smith Barney 15 & 16Global Relationship Banking 17Emerging Markets Corporate Banking 17Travelers Property Casualty - Commercial Lines 18
Global Investment Management and Private Banking:SSB Citi Asset Management Group and Global Retirement Services 19Global Private Bank 20
Investment Activities 21
Citigroup Supplemental DetailConsolidated Statement of Income 22Earnings Analysis - Managed Basis 23Consumer Loan Delinquency Amounts, Net Credit Losses and Ratios 24Details of Credit Loss Experience 25Cash Basis and Renegotiated Loans, Other Real Estate Owned and Assets Pending Disposition 26
Insurance Investment Portfolio 27
Global Cards Supplemental Data 28
Global Corporate and Investment Bank - Supplemental Product and Regional Results 29Emerging Markets - Consumer and Corporate Banking 30Global Wealth Management 31
Citicorp Supplemental Data 32
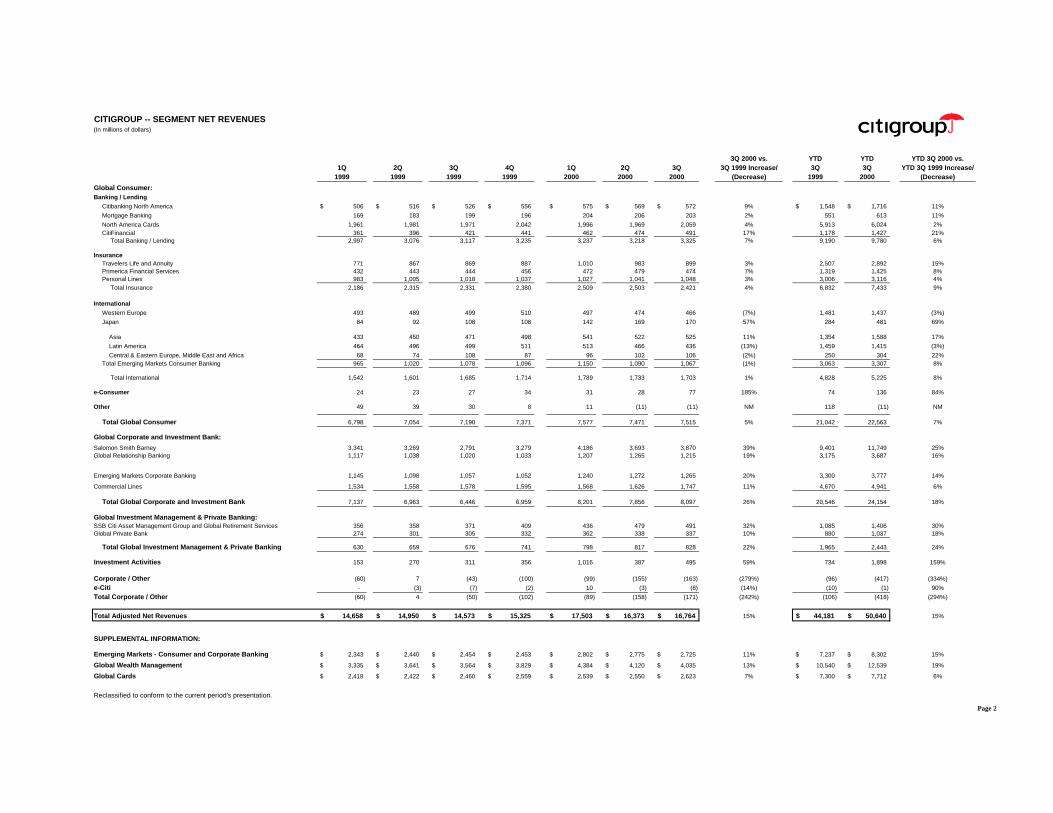
CITIGROUP -- FINANCIAL SUMMARY(In millions of dollars, except per share amounts)
3Q 2000 vs. YTD YTD YTD 3Q 2000 vs.1Q 2Q 3Q 4Q 1Q 2Q 3Q 3Q 1999 Increase/ 3Q 3Q YTD 3Q 1999 Increase/
1999 1999 1999 1999 2000 2000 2000 (Decrease) 1999 2000 (Decrease)
Core Income 2,415$ 2,477$ 2,450$ 2,605$ 3,602$ 3,007$ 3,111$ 27% 7,342$ 9,720$ 32%Restructuring - Related Items 74 (29) (15) 17 (12) (2) (23) 30 (37)Cumulative Effect of Accounting Changes (127) - - - - - - (127) -
Net Income 2,362$ 2,448$ 2,435$ 2,622$ 3,590$ 3,005$ 3,088$ 27% 7,245$ 9,683$ 34%
Basic Earnings Per Share:Core Income 0.53$ 0.55$ 0.54$ 0.58$ 0.80$ 0.67$ 0.69$ 28% 1.63$ 2.17$ 33%
Net Income 0.52$ 0.54$ 0.54$ 0.58$ 0.80$ 0.67$ 0.69$ 28% 1.60$ 2.16$ 35%
Weighted average common sharesapplicable to Basic EPS 4,453.6 4,443.6 4,442.7 4,441.2 4,442.1 4,443.6 4,444.8 4,446.6 4,443.5
Preferred Dividends - Basic 40$ 38$ 38$ 33$ 30$ 29$ 29$ 116$ 88$
Diluted Earnings Per Share:Core Income 0.52$ 0.53$ 0.53$ 0.56$ 0.78$ 0.65$ 0.67$ 26% 1.58$ 2.10$ 33%
Net Income 0.51$ 0.52$ 0.52$ 0.56$ 0.78$ 0.65$ 0.67$ 29% 1.55$ 2.09$ 35%
Core diluted earnings per share excludinggoodwill amortization 0.53$ 0.54$ 0.54$ 0.57$ 0.79$ 0.66$ 0.68$ 26% 1.61$ 2.13$ 32%
Adjusted weighted average common sharesapplicable to Diluted EPS 4,586.6 4,600.4 4,586.9 4,591.5 4,580.9 4,586.9 4,599.4 4,591.3 4,589.1
Preferred Dividends - Diluted 37$ 35$ 34$ 33$ 30$ 29$ 29$ 106$ 88$
Common Shares Outstanding, at period end 4,507.1 4,502.3 4,489.0 4,490.0 4,494.2 4,493.0 4,491.9 4,489.0 4,491.9
Tier 1 Capital Ratio 8.86% 9.37% 9.59% 9.65% 9.78% 8.62% 8.3% * 9.59% 8.3% *
Total Capital Ratio 11.54% 12.07% 12.28% 12.33% 12.47% 11.12% 10.6% * 12.28% 10.6% *
Leverage Ratio 6.24% 6.38% 6.62% 6.80% 6.73% 6.07% 6.0% * 6.62% 6.0% *
Total Assets, at period end (in billions) 690.5$ 689.1$ 686.8$ 715.7$ 738.2$ 791.3$ 805$ * 686.8$ 805$ *Stockholders' Equity, at period end (in billions) 43.8$ 44.9$ 46.3$ 48.9$ 50.3$ 51.6$ 53.6$ * 46.3$ 53.6$ *Stockholders' Equity and Trust Securities, at period end (in billions) 48.8$ 49.8$ 51.2$ 53.8$ 55.2$ 56.5$ 58.6$ * 51.2$ 58.6$ *
Book Value Per Share, at period end 9.26$ 9.51$ 9.85$ 10.46$ 10.80$ 11.08$ 11.55$ 9.85$ 11.55$
Return on Common Equity (Net Income) 23.1% 22.9% 22.0% 22.8% 29.8% 24.7% 24.0% * 22.7% 26.1% *Return on Common Equity (Core Income) 23.6% 23.2% 22.1% 22.6% 29.9% 24.8% 24.2% * 23.0% 26.2% *
* Preliminary
Citigroup, the most global financial services company, provides some 100 million consumers, corporations, governments and institutions in over 100 countries with a broad range of financial products and services.
Page 1
CITIGROUP -- SEGMENT NET REVENUES(In millions of dollars)
3Q 2000 vs. YTD YTD YTD 3Q 2000 vs.1Q 2Q 3Q 4Q 1Q 2Q 3Q 3Q 1999 Increase/ 3Q 3Q YTD 3Q 1999 Increase/
1999 1999 1999 1999 2000 2000 2000 (Decrease) 1999 2000 (Decrease)
Global Consumer:Banking / Lending
Citibanking North America 506$ 516$ 526$ 556$ 575$ 569$ 572$ 9% 1,548$ 1,716$ 11%
Mortgage Banking 169 183 199 196 204 206 203 2% 551 613 11%
North America Cards 1,961 1,981 1,971 2,042 1,996 1,969 2,059 4% 5,913 6,024 2%CitiFinancial 361 396 421 441 462 474 491 17% 1,178 1,427 21%
Total Banking / Lending 2,997 3,076 3,117 3,235 3,237 3,218 3,325 7% 9,190 9,780 6%
InsuranceTravelers Life and Annuity 771 867 869 887 1,010 983 899 3% 2,507 2,892 15%Primerica Financial Services 432 443 444 456 472 479 474 7% 1,319 1,425 8%Personal Lines 983 1,005 1,018 1,037 1,027 1,041 1,048 3% 3,006 3,116 4%
Total Insurance 2,186 2,315 2,331 2,380 2,509 2,503 2,421 4% 6,832 7,433 9%
International
Western Europe 493 489 499 510 497 474 466 (7%) 1,481 1,437 (3%)
Japan 84 92 108 108 142 169 170 57% 284 481 69%
Asia 433 450 471 498 541 522 525 11% 1,354 1,588 17%
Latin America 464 496 499 511 513 466 436 (13%) 1,459 1,415 (3%)
Central & Eastern Europe, Middle East and Africa 68 74 108 87 96 102 106 (2%) 250 304 22%Total Emerging Markets Consumer Banking 965 1,020 1,078 1,096 1,150 1,090 1,067 (1%) 3,063 3,307 8%
Total International 1,542 1,601 1,685 1,714 1,789 1,733 1,703 1% 4,828 5,225 8%
e-Consumer 24 23 27 34 31 28 77 185% 74 136 84%
Other 49 39 30 8 11 (11) (11) NM 118 (11) NM
Total Global Consumer 6,798 7,054 7,190 7,371 7,577 7,471 7,515 5% 21,042 22,563 7%
Global Corporate and Investment Bank:
Salomon Smith Barney 3,341 3,269 2,791 3,279 4,186 3,693 3,870 39% 9,401 11,749 25%Global Relationship Banking 1,117 1,038 1,020 1,033 1,207 1,265 1,215 19% 3,175 3,687 16%
Emerging Markets Corporate Banking 1,145 1,098 1,057 1,052 1,240 1,272 1,265 20% 3,300 3,777 14%
Commercial Lines 1,534 1,558 1,578 1,595 1,568 1,626 1,747 11% 4,670 4,941 6%
Total Global Corporate and Investment Bank 7,137 6,963 6,446 6,959 8,201 7,856 8,097 26% 20,546 24,154 18%
Global Investment Management & Private Banking:SSB Citi Asset Management Group and Global Retirement Services 356 358 371 409 436 479 491 32% 1,085 1,406 30%Global Private Bank 274 301 305 332 362 338 337 10% 880 1,037 18%
Total Global Investment Management & Private Banking 630 659 676 741 798 817 828 22% 1,965 2,443 24%
Investment Activities 153 270 311 356 1,016 387 495 59% 734 1,898 159%
Corporate / Other (60) 7 (43) (100) (99) (155) (163) (279%) (96) (417) (334%)
e-Citi - (3) (7) (2) 10 (3) (8) (14%) (10) (1) 90%
Total Corporate / Other (60) 4 (50) (102) (89) (158) (171) (242%) (106) (418) (294%)
Total Adjusted Net Revenues 14,658$ 14,950$ 14,573$ 15,325$ 17,503$ 16,373$ 16,764$ 15% 44,181$ 50,640$ 15%
SUPPLEMENTAL INFORMATION:
Emerging Markets - Consumer and Corporate Banking 2,343$ 2,440$ 2,454$ 2,453$ 2,802$ 2,775$ 2,725$ 11% 7,237$ 8,302$ 15%
Global Wealth Management 3,335$ 3,641$ 3,564$ 3,829$ 4,384$ 4,120$ 4,035$ 13% 10,540$ 12,539$ 19%
Global Cards 2,418$ 2,422$ 2,460$ 2,559$ 2,539$ 2,550$ 2,623$ 7% 7,300$ 7,712$ 6%
Reclassified to conform to the current period's presentation.
Page 2
CITIGROUP -- SEGMENT CORE INCOME(In millions of dollars)
3Q 2000 vs. YTD YTD YTD 3Q 2000 vs.1Q 2Q 3Q 4Q 1Q 2Q 3Q 3Q 1999 Increase/ 3Q 3Q YTD 3Q 1999 Increase/
1999 1999 1999 1999 2000 2000 2000 (Decrease) 1999 2000 (Decrease)
Global Consumer:Banking / Lending
Citibanking North America 72$ 104$ 107$ 115$ 138$ 139$ 143$ 34% 283$ 420$ 48%Mortgage Banking 59 52 59 55 61 65 70 19% 170 196 15%North America Cards 277 280 301 324 296 308 369 23% 858 973 13%CitiFinancial 71 78 135 108 112 117 124 (8%) 284 353 24%
Total Banking / Lending 479 514 602 602 607 629 706 17% 1,595 1,942 22%
InsuranceTravelers Life and Annuity 147 173 168 135 187 202 179 7% 488 568 16%Primerica Financial Services 110 113 114 115 119 125 124 9% 337 368 9%Personal Lines 83 79 23 94 75 82 68 196% 185 225 22%
Total Insurance 340 365 305 344 381 409 371 22% 1,010 1,161 15%
InternationalWestern Europe 65 67 71 72 88 75 88 24% 203 251 24%
Japan 21 23 25 18 29 39 36 44% 69 104 51%
Asia 81 84 92 99 144 142 142 54% 257 428 67%
Latin America 47 41 52 82 66 41 32 (38%) 140 139 (1%)
Central & Eastern Europe, Middle East and Africa 3 6 27 10 14 16 15 (44%) 36 45 25%Total Emerging Markets Consumer Banking 131 131 171 191 224 199 189 11% 433 612 41%
Total International 217 221 267 281 341 313 313 17% 705 967 37%
e-Consumer (22) (27) (29) (33) (68) (46) (43) (48%) (78) (157) (101%)
Other (16) (25) (12) (22) (29) (28) (25) (108%) (53) (82) (55%)
Total Global Consumer 998 1,048 1,133 1,172 1,232 1,277 1,322 17% 3,179 3,831 21%
Global Corporate and Investment Bank:
Salomon Smith Barney 648 610 432 664 957 641 622 44% 1,690 2,220 31%Global Relationship Banking 184 146 143 163 240 261 250 75% 473 751 59%
Emerging Markets Corporate Banking 315 286 303 257 392 370 401 32% 904 1,163 29%
Commercial Lines 189 201 255 200 240 267 315 24% 645 822 27%
Total Global Corporate and Investment Bank 1,336 1,243 1,133 1,284 1,829 1,539 1,588 40% 3,712 4,956 34%
Global Investment Management & Private Banking:SSB Citi Asset Management Group and Global Retirement Services 81 85 84 79 95 92 96 14% 250 283 13%Global Private Bank 55 71 70 73 80 79 80 14% 196 239 22%
Total Global Investment Management & Private Banking 136 156 154 152 175 171 176 14% 446 522 17%
Investment Activities 89 162 194 213 634 234 292 51% 445 1,160 161%
Corporate / Other (138) (121) (145) (202) (253) (196) (244) (68%) (404) (693) (72%)
e-Citi (6) (11) (19) (14) (15) (18) (23) (21%) (36) (56) (56%)
Total Corporate / Other (144) (132) (164) (216) (268) (214) (267) (63%) (440) (749) (70%)
Total Core Income 2,415$ 2,477$ 2,450$ 2,605$ 3,602$ 3,007$ 3,111$ 27% 7,342$ 9,720$ 32%
SUPPLEMENTAL INFORMATION:
Emerging Markets - Consumer and Corporate Banking 465$ 485$ 545$ 490$ 703$ 632$ 641$ 18% 1,495$ 1,976$ 32%
Global Wealth Management 607$ 683$ 663$ 685$ 892$ 782$ 758$ 14% 1,953$ 2,432$ 25%
Global Cards 334$ 330$ 360$ 422$ 385$ 430$ 476$ 32% 1,024$ 1,291$ 26%
Reclassified to conform to the current period's presentation.
Page 3
GLOBAL CONSUMER - Banking/LendingCITIBANKING NORTH AMERICA(In millions of dollars)
3Q 2000 vs. YTD YTD YTD 3Q 2000 vs.1Q 2Q 3Q 4Q 1Q 2Q 3Q 3Q 1999 Increase/ 3Q 3Q YTD 3Q 1999 Increase/
1999 1999 1999 1999 2000 2000 2000 (Decrease) 1999 2000 (Decrease)
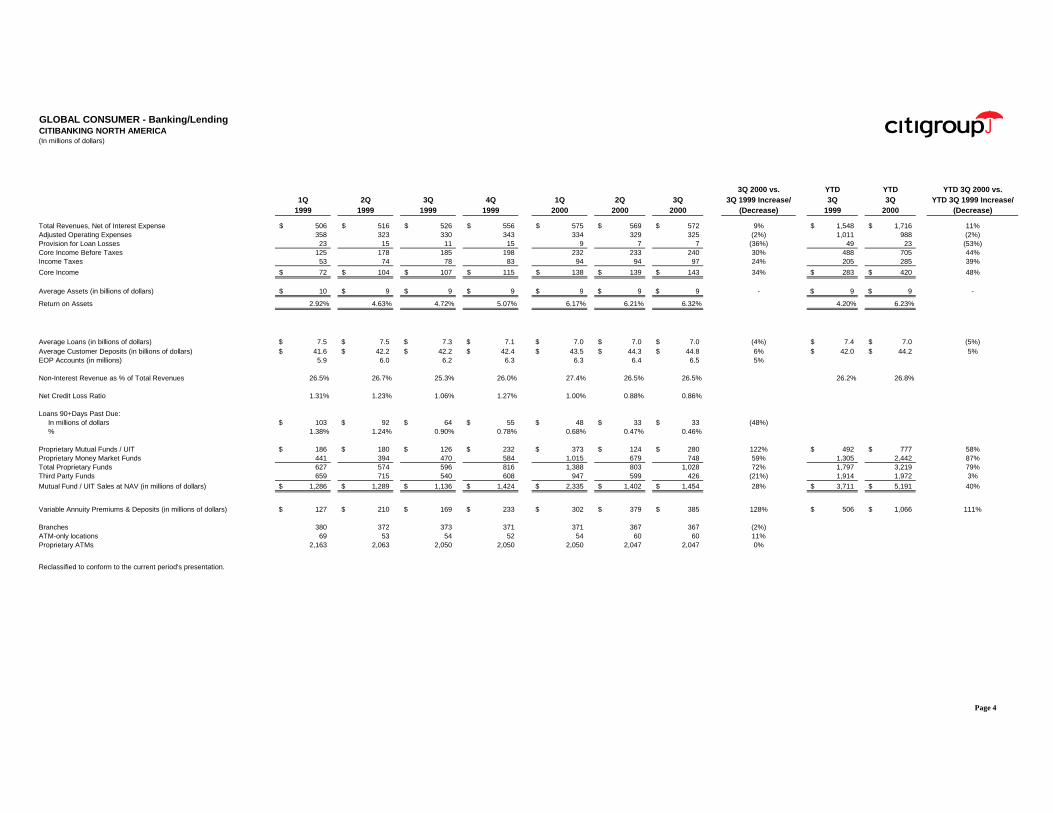
Total Revenues, Net of Interest Expense 506$ 516$ 526$ 556$ 575$ 569$ 572$ 9% 1,548$ 1,716$ 11%Adjusted Operating Expenses 358 323 330 343 334 329 325 (2%) 1,011 988 (2%)Provision for Loan Losses 23 15 11 15 9 7 7 (36%) 49 23 (53%)Core Income Before Taxes 125 178 185 198 232 233 240 30% 488 705 44%Income Taxes 53 74 78 83 94 94 97 24% 205 285 39%
Core Income 72$ 104$ 107$ 115$ 138$ 139$ 143$ 34% 283$ 420$ 48%
Average Assets (in billions of dollars) 10$ 9$ 9$ 9$ 9$ 9$ 9$ - 9$ 9$ -
Return on Assets 2.92% 4.63% 4.72% 5.07% 6.17% 6.21% 6.32% 4.20% 6.23%
Average Loans (in billions of dollars) 7.5$ 7.5$ 7.3$ 7.1$ 7.0$ 7.0$ 7.0$ (4%) 7.4$ 7.0$ (5%)Average Customer Deposits (in billions of dollars) 41.6$ 42.2$ 42.2$ 42.4$ 43.5$ 44.3$ 44.8$ 6% 42.0$ 44.2$ 5%EOP Accounts (in millions) 5.9 6.0 6.2 6.3 6.3 6.4 6.5 5%
Non-Interest Revenue as % of Total Revenues 26.5% 26.7% 25.3% 26.0% 27.4% 26.5% 26.5% 26.2% 26.8%
Net Credit Loss Ratio 1.31% 1.23% 1.06% 1.27% 1.00% 0.88% 0.86%
Loans 90+Days Past Due:In millions of dollars 103$ 92$ 64$ 55$ 48$ 33$ 33$ (48%)% 1.38% 1.24% 0.90% 0.78% 0.68% 0.47% 0.46%
Proprietary Mutual Funds / UIT 186$ 180$ 126$ 232$ 373$ 124$ 280$ 122% 492$ 777$ 58%Proprietary Money Market Funds 441 394 470 584 1,015 679 748 59% 1,305 2,442 87%Total Proprietary Funds 627 574 596 816 1,388 803 1,028 72% 1,797 3,219 79%Third Party Funds 659 715 540 608 947 599 426 (21%) 1,914 1,972 3%
Mutual Fund / UIT Sales at NAV (in millions of dollars) 1,286$ 1,289$ 1,136$ 1,424$ 2,335$ 1,402$ 1,454$ 28% 3,711$ 5,191$ 40%
Variable Annuity Premiums & Deposits (in millions of dollars) 127$ 210$ 169$ 233$ 302$ 379$ 385$ 128% 506$ 1,066$ 111%
Branches 380 372 373 371 371 367 367 (2%)ATM-only locations 69 53 54 52 54 60 60 11%Proprietary ATMs 2,163 2,063 2,050 2,050 2,050 2,047 2,047 0%
Reclassified to conform to the current period's presentation.
Page 4
GLOBAL CONSUMER - Banking/LendingMORTGAGE BANKING (1)(In millions of dollars)
3Q 2000 vs. YTD YTD YTD 3Q 2000 vs.1Q 2Q 3Q 4Q 1Q 2Q 3Q 3Q 1999 Increase/ 3Q 3Q YTD 3Q 1999 Increase/
1999 1999 1999 1999 2000 2000 2000 (Decrease) 1999 2000 (Decrease)
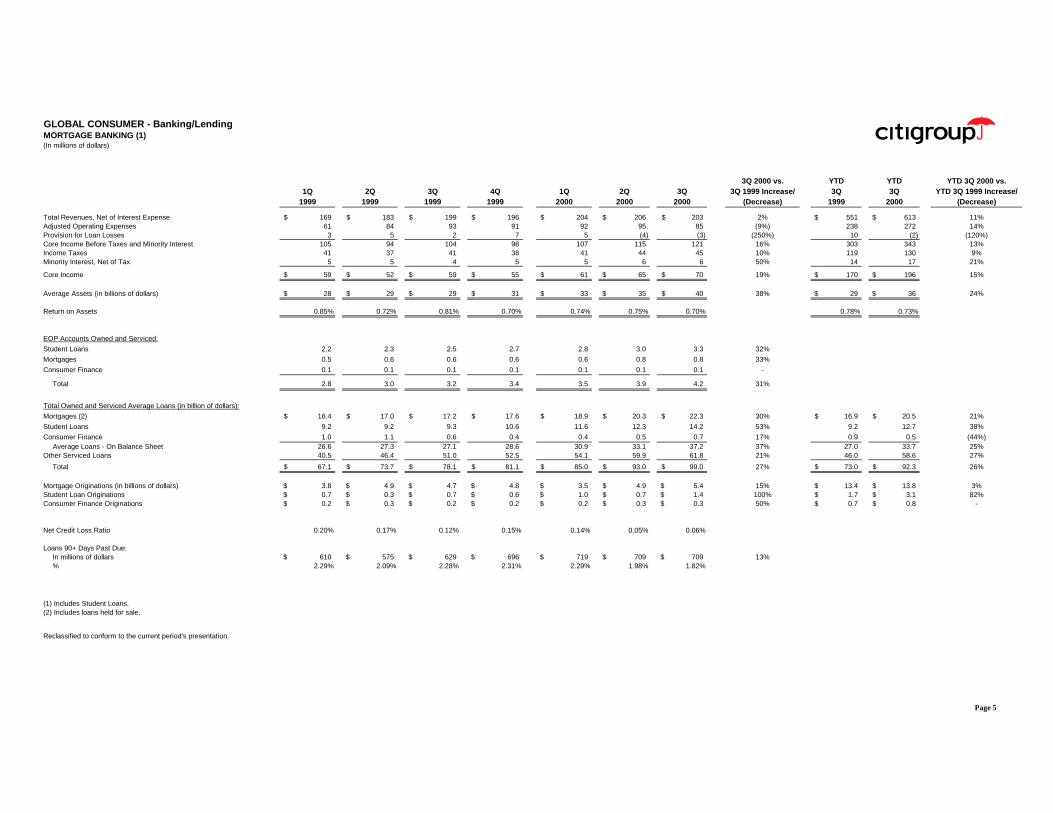
Total Revenues, Net of Interest Expense 169$ 183$ 199$ 196$ 204$ 206$ 203$ 2% 551$ 613$ 11%Adjusted Operating Expenses 61 84 93 91 92 95 85 (9%) 238 272 14%Provision for Loan Losses 3 5 2 7 5 (4) (3) (250%) 10 (2) (120%)Core Income Before Taxes and Minority Interest 105 94 104 98 107 115 121 16% 303 343 13%Income Taxes 41 37 41 38 41 44 45 10% 119 130 9%Minority Interest, Net of Tax 5 5 4 5 5 6 6 50% 14 17 21%
Core Income 59$ 52$ 59$ 55$ 61$ 65$ 70$ 19% 170$ 196$ 15%
Average Assets (in billions of dollars) 28$ 29$ 29$ 31$ 33$ 35$ 40$ 38% 29$ 36$ 24%
Return on Assets 0.85% 0.72% 0.81% 0.70% 0.74% 0.75% 0.70% 0.78% 0.73%
EOP Accounts Owned and Serviced:
Student Loans 2.2 2.3 2.5 2.7 2.8 3.0 3.3 32%
Mortgages 0.5 0.6 0.6 0.6 0.6 0.8 0.8 33%
Consumer Finance 0.1 0.1 0.1 0.1 0.1 0.1 0.1 -
Total 2.8 3.0 3.2 3.4 3.5 3.9 4.2 31%
Total Owned and Serviced Average Loans (in billion of dollars):
Mortgages (2) 16.4$ 17.0$ 17.2$ 17.6$ 18.9$ 20.3$ 22.3$ 30% 16.9$ 20.5$ 21%
Student Loans 9.2 9.2 9.3 10.6 11.6 12.3 14.2 53% 9.2 12.7 38%
Consumer Finance 1.0 1.1 0.6 0.4 0.4 0.5 0.7 17% 0.9 0.5 (44%)Average Loans - On Balance Sheet 26.6 27.3 27.1 28.6 30.9 33.1 37.2 37% 27.0 33.7 25%
Other Serviced Loans 40.5 46.4 51.0 52.5 54.1 59.9 61.8 21% 46.0 58.6 27%
Total 67.1$ 73.7$ 78.1$ 81.1$ 85.0$ 93.0$ 99.0$ 27% 73.0$ 92.3$ 26%
Mortgage Originations (in billions of dollars) 3.8$ 4.9$ 4.7$ 4.8$ 3.5$ 4.9$ 5.4$ 15% 13.4$ 13.8$ 3%Student Loan Originations 0.7$ 0.3$ 0.7$ 0.6$ 1.0$ 0.7$ 1.4$ 100% 1.7$ 3.1$ 82%Consumer Finance Originations 0.2$ 0.3$ 0.2$ 0.2$ 0.2$ 0.3$ 0.3$ 50% 0.7$ 0.8$ -
Net Credit Loss Ratio 0.20% 0.17% 0.12% 0.15% 0.14% 0.05% 0.06%
Loans 90+ Days Past Due:In millions of dollars 610$ 575$ 629$ 696$ 719$ 709$ 709$ 13%% 2.29% 2.09% 2.28% 2.31% 2.29% 1.98% 1.82%
(1) Includes Student Loans.(2) Includes loans held for sale.
Reclassified to conform to the current period's presentation.
Page 5
GLOBAL CONSUMER - Banking/LendingNORTH AMERICA CARDS (1)
(In millions of dollars)
3Q 2000 vs. YTD YTD YTD 3Q 2000 vs.1Q 2Q 3Q 4Q 1Q 2Q 3Q 3Q 1999 Increase/ 3Q 3Q YTD 3Q 1999 Increase/
1999 1999 1999 1999 2000 2000 2000 (Decrease) 1999 2000 (Decrease)
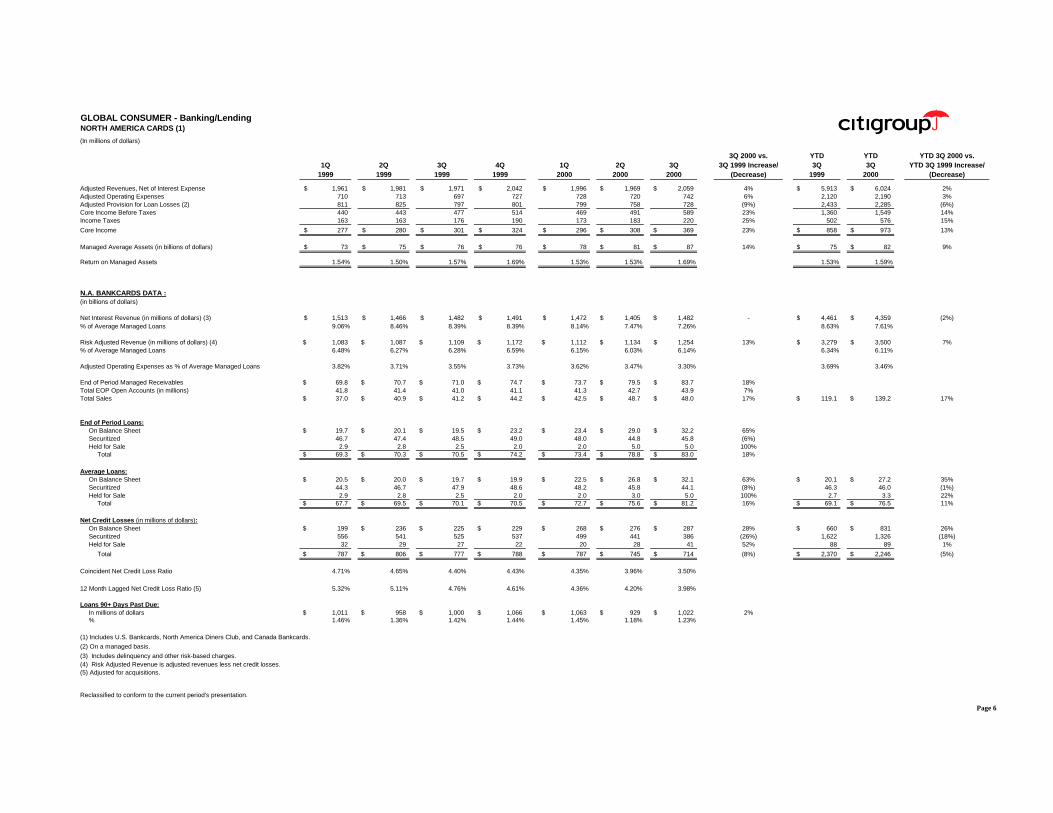
Adjusted Revenues, Net of Interest Expense 1,961$ 1,981$ 1,971$ 2,042$ 1,996$ 1,969$ 2,059$ 4% 5,913$ 6,024$ 2%Adjusted Operating Expenses 710 713 697 727 728 720 742 6% 2,120 2,190 3%Adjusted Provision for Loan Losses (2) 811 825 797 801 799 758 728 (9%) 2,433 2,285 (6%)Core Income Before Taxes 440 443 477 514 469 491 589 23% 1,360 1,549 14%Income Taxes 163 163 176 190 173 183 220 25% 502 576 15%
Core Income 277$ 280$ 301$ 324$ 296$ 308$ 369$ 23% 858$ 973$ 13%
Managed Average Assets (in billions of dollars) 73$ 75$ 76$ 76$ 78$ 81$ 87$ 14% 75$ 82$ 9%
Return on Managed Assets 1.54% 1.50% 1.57% 1.69% 1.53% 1.53% 1.69% 1.53% 1.59%
N.A. BANKCARDS DATA :(in billions of dollars)
Net Interest Revenue (in millions of dollars) (3) 1,513$ 1,466$ 1,482$ 1,491$ 1,472$ 1,405$ 1,482$ - 4,461$ 4,359$ (2%)% of Average Managed Loans 9.06% 8.46% 8.39% 8.39% 8.14% 7.47% 7.26% 8.63% 7.61%
Risk Adjusted Revenue (in millions of dollars) (4) 1,083$ 1,087$ 1,109$ 1,172$ 1,112$ 1,134$ 1,254$ 13% 3,279$ 3,500$ 7%% of Average Managed Loans 6.48% 6.27% 6.28% 6.59% 6.15% 6.03% 6.14% 6.34% 6.11%
Adjusted Operating Expenses as % of Average Managed Loans 3.82% 3.71% 3.55% 3.73% 3.62% 3.47% 3.30% 3.69% 3.46%
End of Period Managed Receivables 69.8$ 70.7$ 71.0$ 74.7$ 73.7$ 79.5$ 83.7$ 18%Total EOP Open Accounts (in millions) 41.8 41.4 41.0 41.1 41.3 42.7 43.9 7%Total Sales 37.0$ 40.9$ 41.2$ 44.2$ 42.5$ 48.7$ 48.0$ 17% 119.1$ 139.2$ 17%
End of Period Loans:On Balance Sheet 19.7$ 20.1$ 19.5$ 23.2$ 23.4$ 29.0$ 32.2$ 65%Securitized 46.7 47.4 48.5 49.0 48.0 44.8 45.8 (6%)Held for Sale 2.9 2.8 2.5 2.0 2.0 5.0 5.0 100%
Total 69.3$ 70.3$ 70.5$ 74.2$ 73.4$ 78.8$ 83.0$ 18%
Average Loans:On Balance Sheet 20.5$ 20.0$ 19.7$ 19.9$ 22.5$ 26.8$ 32.1$ 63% 20.1$ 27.2$ 35%Securitized 44.3 46.7 47.9 48.6 48.2 45.8 44.1 (8%) 46.3 46.0 (1%)Held for Sale 2.9 2.8 2.5 2.0 2.0 3.0 5.0 100% 2.7 3.3 22%
Total 67.7$ 69.5$ 70.1$ 70.5$ 72.7$ 75.6$ 81.2$ 16% 69.1$ 76.5$ 11%
Net Credit Losses (in millions of dollars):On Balance Sheet 199$ 236$ 225$ 229$ 268$ 276$ 287$ 28% 660$ 831$ 26%Securitized 556 541 525 537 499 441 386 (26%) 1,622 1,326 (18%)Held for Sale 32 29 27 22 20 28 41 52% 88 89 1%
Total 787$ 806$ 777$ 788$ 787$ 745$ 714$ (8%) 2,370$ 2,246$ (5%)
Coincident Net Credit Loss Ratio 4.71% 4.65% 4.40% 4.43% 4.35% 3.96% 3.50%
12 Month Lagged Net Credit Loss Ratio (5) 5.32% 5.11% 4.76% 4.61% 4.36% 4.20% 3.98%
Loans 90+ Days Past Due:In millions of dollars 1,011$ 958$ 1,000$ 1,066$ 1,063$ 929$ 1,022$ 2%% 1.46% 1.36% 1.42% 1.44% 1.45% 1.18% 1.23%
(1) Includes U.S. Bankcards, North America Diners Club, and Canada Bankcards.
(2) On a managed basis.
(3) Includes delinquency and other risk-based charges.(4) Risk Adjusted Revenue is adjusted revenues less net credit losses.(5) Adjusted for acquisitions.
Reclassified to conform to the current period's presentation.
Page 6
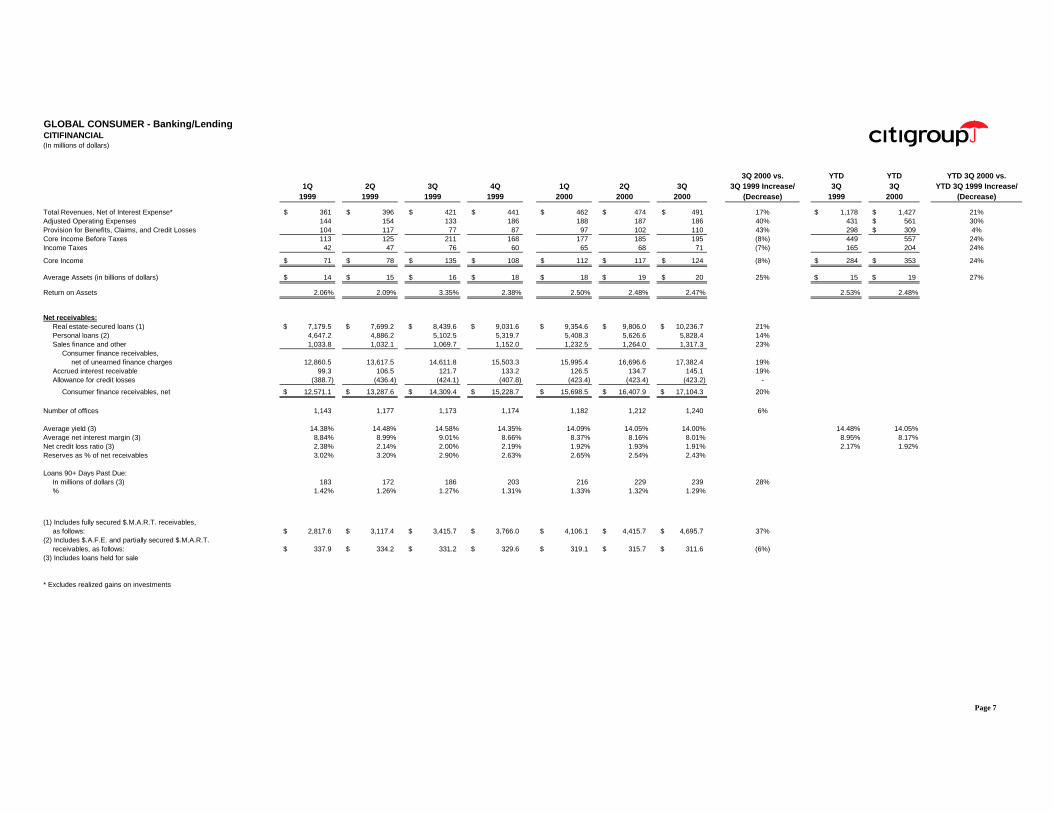
GLOBAL CONSUMER - Banking/LendingCITIFINANCIAL(In millions of dollars)
3Q 2000 vs. YTD YTD YTD 3Q 2000 vs.1Q 2Q 3Q 4Q 1Q 2Q 3Q 3Q 1999 Increase/ 3Q 3Q YTD 3Q 1999 Increase/
1999 1999 1999 1999 2000 2000 2000 (Decrease) 1999 2000 (Decrease)
Total Revenues, Net of Interest Expense* 361$ 396$ 421$ 441$ 462$ 474$ 491$ 17% 1,178$ 1,427$ 21%Adjusted Operating Expenses 144 154 133 186 188 187 186 40% 431 561$ 30%Provision for Benefits, Claims, and Credit Losses 104 117 77 87 97 102 110 43% 298 309$ 4%Core Income Before Taxes 113 125 211 168 177 185 195 (8%) 449 557 24%Income Taxes 42 47 76 60 65 68 71 (7%) 165 204 24%
Core Income 71$ 78$ 135$ 108$ 112$ 117$ 124$ (8%) 284$ 353$ 24%
Average Assets (in billions of dollars) 14$ 15$ 16$ 18$ 18$ 19$ 20$ 25% 15$ 19$ 27%
Return on Assets 2.06% 2.09% 3.35% 2.38% 2.50% 2.48% 2.47% 2.53% 2.48%
Net receivables:Real estate-secured loans (1) 7,179.5$ 7,699.2$ 8,439.6$ 9,031.6$ 9,354.6$ 9,806.0$ 10,236.7$ 21%Personal loans (2) 4,647.2 4,886.2 5,102.5 5,319.7 5,408.3 5,626.6 5,828.4 14%Sales finance and other 1,033.8 1,032.1 1,069.7 1,152.0 1,232.5 1,264.0 1,317.3 23%
Consumer finance receivables,net of unearned finance charges 12,860.5 13,617.5 14,611.8 15,503.3 15,995.4 16,696.6 17,382.4 19%
Accrued interest receivable 99.3 106.5 121.7 133.2 126.5 134.7 145.1 19%Allowance for credit losses (388.7) (436.4) (424.1) (407.8) (423.4) (423.4) (423.2) -
Consumer finance receivables, net 12,571.1$ 13,287.6$ 14,309.4$ 15,228.7$ 15,698.5$ 16,407.9$ 17,104.3$ 20%
Number of offices 1,143 1,177 1,173 1,174 1,182 1,212 1,240 6%
Average yield (3) 14.38% 14.48% 14.58% 14.35% 14.09% 14.05% 14.00% 14.48% 14.05%Average net interest margin (3) 8.84% 8.99% 9.01% 8.66% 8.37% 8.16% 8.01% 8.95% 8.17%Net credit loss ratio (3) 2.38% 2.14% 2.00% 2.19% 1.92% 1.93% 1.91% 2.17% 1.92%Reserves as % of net receivables 3.02% 3.20% 2.90% 2.63% 2.65% 2.54% 2.43%
Loans 90+ Days Past Due:In millions of dollars (3) 183 172 186 203 216 229 239 28%% 1.42% 1.26% 1.27% 1.31% 1.33% 1.32% 1.29%
(1) Includes fully secured $.M.A.R.T. receivables,as follows: 2,817.6$ 3,117.4$ 3,415.7$ 3,766.0$ 4,106.1$ 4,415.7$ 4,695.7$ 37%
(2) Includes $.A.F.E. and partially secured $.M.A.R.T.receivables, as follows: 337.9$ 334.2$ 331.2$ 329.6$ 319.1$ 315.7$ 311.6$ (6%)
(3) Includes loans held for sale
* Excludes realized gains on investments
Page 7
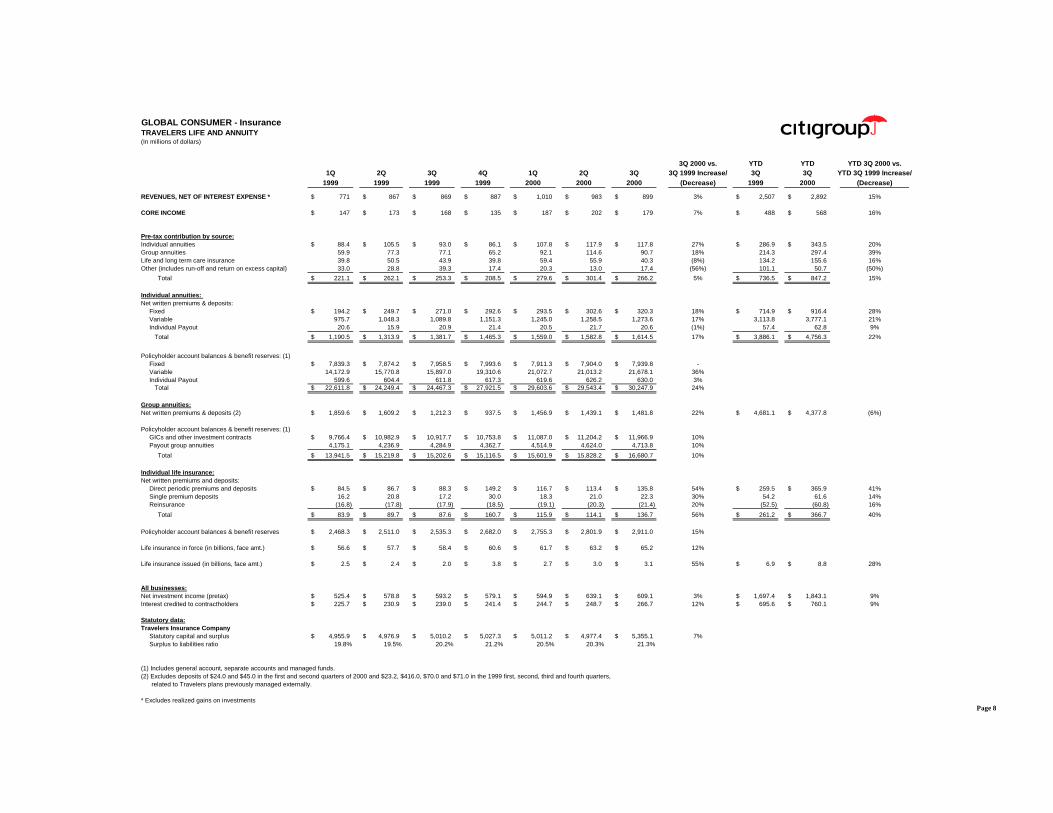
GLOBAL CONSUMER - InsuranceTRAVELERS LIFE AND ANNUITY(In millions of dollars)
3Q 2000 vs. YTD YTD YTD 3Q 2000 vs.1Q 2Q 3Q 4Q 1Q 2Q 3Q 3Q 1999 Increase/ 3Q 3Q YTD 3Q 1999 Increase/
1999 1999 1999 1999 2000 2000 2000 (Decrease) 1999 2000 (Decrease)
REVENUES, NET OF INTEREST EXPENSE * 771$ 867$ 869$ 887$ 1,010$ 983$ 899$ 3% 2,507$ 2,892$ 15%
CORE INCOME 147$ 173$ 168$ 135$ 187$ 202$ 179$ 7% 488$ 568$ 16%
Pre-tax contribution by source:Individual annuities 88.4$ 105.5$ 93.0$ 86.1$ 107.8$ 117.9$ 117.8$ 27% 286.9$ 343.5$ 20%Group annuities 59.9 77.3 77.1 65.2 92.1 114.6 90.7 18% 214.3 297.4 39%Life and long term care insurance 39.8 50.5 43.9 39.8 59.4 55.9 40.3 (8%) 134.2 155.6 16%Other (includes run-off and return on excess capital) 33.0 28.8 39.3 17.4 20.3 13.0 17.4 (56%) 101.1 50.7 (50%)
Total 221.1$ 262.1$ 253.3$ 208.5$ 279.6$ 301.4$ 266.2$ 5% 736.5$ 847.2$ 15%
Individual annuities:Net written premiums & deposits:
Fixed 194.2$ 249.7$ 271.0$ 292.6$ 293.5$ 302.6$ 320.3$ 18% 714.9$ 916.4$ 28%Variable 975.7 1,048.3 1,089.8 1,151.3 1,245.0 1,258.5 1,273.6 17% 3,113.8 3,777.1 21%Individual Payout 20.6 15.9 20.9 21.4 20.5 21.7 20.6 (1%) 57.4 62.8 9%
Total 1,190.5$ 1,313.9$ 1,381.7$ 1,465.3$ 1,559.0$ 1,582.8$ 1,614.5$ 17% 3,886.1$ 4,756.3$ 22%
Policyholder account balances & benefit reserves: (1)Fixed 7,839.3$ 7,874.2$ 7,958.5$ 7,993.6$ 7,911.3$ 7,904.0$ 7,939.8$ -Variable 14,172.9 15,770.8 15,897.0 19,310.6 21,072.7 21,013.2 21,678.1 36%Individual Payout 599.6 604.4 611.8 617.3 619.6 626.2 630.0 3%
Total 22,611.8$ 24,249.4$ 24,467.3$ 27,921.5$ 29,603.6$ 29,543.4$ 30,247.9$ 24%
Group annuities:Net written premiums & deposits (2) 1,859.6$ 1,609.2$ 1,212.3$ 937.5$ 1,456.9$ 1,439.1$ 1,481.8$ 22% 4,681.1$ 4,377.8$ (6%)
Policyholder account balances & benefit reserves: (1)GICs and other investment contracts 9,766.4$ 10,982.9$ 10,917.7$ 10,753.8$ 11,087.0$ 11,204.2$ 11,966.9$ 10%Payout group annuities 4,175.1 4,236.9 4,284.9 4,362.7 4,514.9 4,624.0 4,713.8 10%
Total 13,941.5$ 15,219.8$ 15,202.6$ 15,116.5$ 15,601.9$ 15,828.2$ 16,680.7$ 10%
Individual life insurance:Net written premiums and deposits:
Direct periodic premiums and deposits 84.5$ 86.7$ 88.3$ 149.2$ 116.7$ 113.4$ 135.8$ 54% 259.5$ 365.9$ 41%Single premium deposits 16.2 20.8 17.2 30.0 18.3 21.0 22.3 30% 54.2 61.6 14%Reinsurance (16.8) (17.8) (17.9) (18.5) (19.1) (20.3) (21.4) 20% (52.5) (60.8) 16%
Total 83.9$ 89.7$ 87.6$ 160.7$ 115.9$ 114.1$ 136.7$ 56% 261.2$ 366.7$ 40%
Policyholder account balances & benefit reserves 2,468.3$ 2,511.0$ 2,535.3$ 2,682.0$ 2,755.3$ 2,801.9$ 2,911.0$ 15%
Life insurance in force (in billions, face amt.) 56.6$ 57.7$ 58.4$ 60.6$ 61.7$ 63.2$ 65.2$ 12%
Life insurance issued (in billions, face amt.) 2.5$ 2.4$ 2.0$ 3.8$ 2.7$ 3.0$ 3.1$ 55% 6.9$ 8.8$ 28%
All businesses:Net investment income (pretax) 525.4$ 578.8$ 593.2$ 579.1$ 594.9$ 639.1$ 609.1$ 3% 1,697.4$ 1,843.1$ 9%Interest credited to contractholders 225.7$ 230.9$ 239.0$ 241.4$ 244.7$ 248.7$ 266.7$ 12% 695.6$ 760.1$ 9%
Statutory data:Travelers Insurance Company
Statutory capital and surplus 4,955.9$ 4,976.9$ 5,010.2$ 5,027.3$ 5,011.2$ 4,977.4$ 5,355.1$ 7%Surplus to liabilities ratio 19.8% 19.5% 20.2% 21.2% 20.5% 20.3% 21.3%
(1) Includes general account, separate accounts and managed funds.(2) Excludes deposits of $24.0 and $45.0 in the first and second quarters of 2000 and $23.2, $416.0, $70.0 and $71.0 in the 1999 first, second, third and fourth quarters,
related to Travelers plans previously managed externally.
* Excludes realized gains on investmentsPage 8
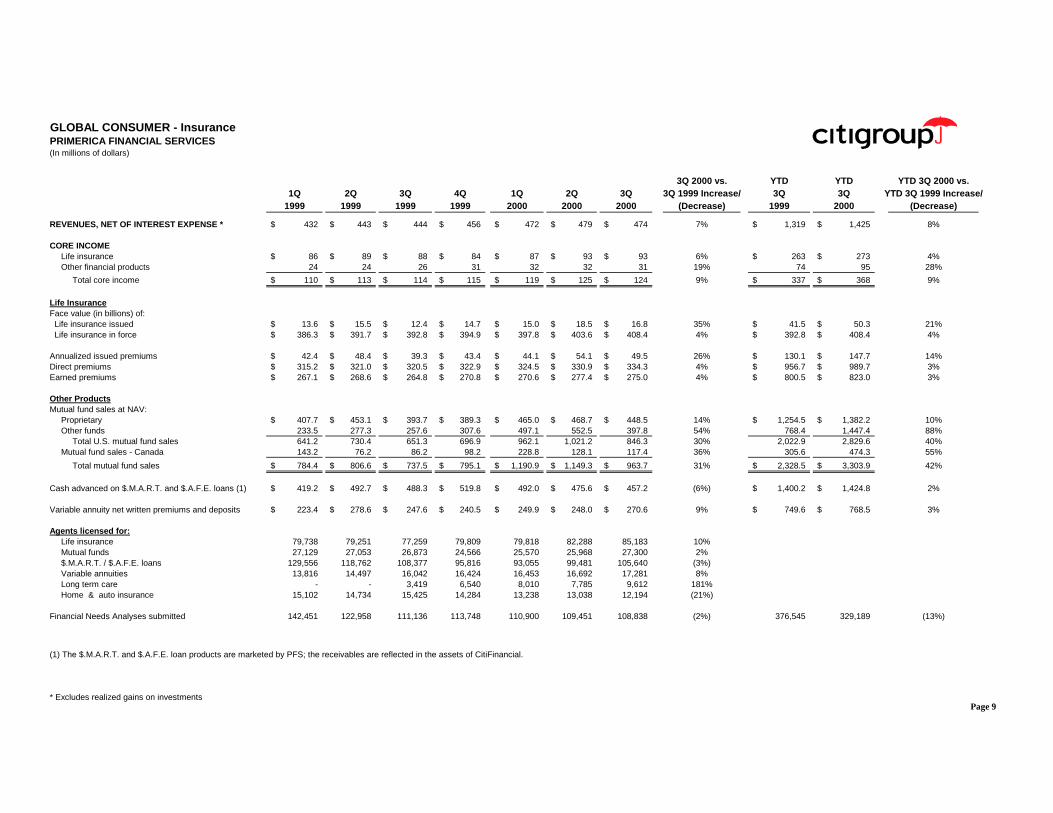
GLOBAL CONSUMER - InsurancePRIMERICA FINANCIAL SERVICES(In millions of dollars)
3Q 2000 vs. YTD YTD YTD 3Q 2000 vs.1Q 2Q 3Q 4Q 1Q 2Q 3Q 3Q 1999 Increase/ 3Q 3Q YTD 3Q 1999 Increase/
1999 1999 1999 1999 2000 2000 2000 (Decrease) 1999 2000 (Decrease)
REVENUES, NET OF INTEREST EXPENSE * 432$ 443$ 444$ 456$ 472$ 479$ 474$ 7% 1,319$ 1,425$ 8%
CORE INCOMELife insurance 86$ 89$ 88$ 84$ 87$ 93$ 93$ 6% 263$ 273$ 4%Other financial products 24 24 26 31 32 32 31 19% 74 95 28%
Total core income 110$ 113$ 114$ 115$ 119$ 125$ 124$ 9% 337$ 368$ 9%
Life InsuranceFace value (in billions) of:
Life insurance issued 13.6$ 15.5$ 12.4$ 14.7$ 15.0$ 18.5$ 16.8$ 35% 41.5$ 50.3$ 21%Life insurance in force 386.3$ 391.7$ 392.8$ 394.9$ 397.8$ 403.6$ 408.4$ 4% 392.8$ 408.4$ 4%
Annualized issued premiums 42.4$ 48.4$ 39.3$ 43.4$ 44.1$ 54.1$ 49.5$ 26% 130.1$ 147.7$ 14%Direct premiums 315.2$ 321.0$ 320.5$ 322.9$ 324.5$ 330.9$ 334.3$ 4% 956.7$ 989.7$ 3%Earned premiums 267.1$ 268.6$ 264.8$ 270.8$ 270.6$ 277.4$ 275.0$ 4% 800.5$ 823.0$ 3%
Other ProductsMutual fund sales at NAV:
Proprietary 407.7$ 453.1$ 393.7$ 389.3$ 465.0$ 468.7$ 448.5$ 14% 1,254.5$ 1,382.2$ 10%Other funds 233.5 277.3 257.6 307.6 497.1 552.5 397.8 54% 768.4 1,447.4 88%
Total U.S. mutual fund sales 641.2 730.4 651.3 696.9 962.1 1,021.2 846.3 30% 2,022.9 2,829.6 40%Mutual fund sales - Canada 143.2 76.2 86.2 98.2 228.8 128.1 117.4 36% 305.6 474.3 55%
Total mutual fund sales 784.4$ 806.6$ 737.5$ 795.1$ 1,190.9$ 1,149.3$ 963.7$ 31% 2,328.5$ 3,303.9$ 42%
Cash advanced on $.M.A.R.T. and $.A.F.E. loans (1) 419.2$ 492.7$ 488.3$ 519.8$ 492.0$ 475.6$ 457.2$ (6%) 1,400.2$ 1,424.8$ 2%
Variable annuity net written premiums and deposits 223.4$ 278.6$ 247.6$ 240.5$ 249.9$ 248.0$ 270.6$ 9% 749.6$ 768.5$ 3%
Agents licensed for:Life insurance 79,738 79,251 77,259 79,809 79,818 82,288 85,183 10%Mutual funds 27,129 27,053 26,873 24,566 25,570 25,968 27,300 2%$.M.A.R.T. / $.A.F.E. loans 129,556 118,762 108,377 95,816 93,055 99,481 105,640 (3%)Variable annuities 13,816 14,497 16,042 16,424 16,453 16,692 17,281 8%Long term care - - 3,419 6,540 8,010 7,785 9,612 181%Home & auto insurance 15,102 14,734 15,425 14,284 13,238 13,038 12,194 (21%)
Financial Needs Analyses submitted 142,451 122,958 111,136 113,748 110,900 109,451 108,838 (2%) 376,545 329,189 (13%)
(1) The $.M.A.R.T. and $.A.F.E. loan products are marketed by PFS; the receivables are reflected in the assets of CitiFinancial.
* Excludes realized gains on investmentsPage 9

GLOBAL CONSUMER - InsuranceTRAVELERS PROPERTY CASUALTY - PERSONAL LINES(In millions of dollars)
3Q 2000 vs. YTD YTD YTD 3Q 2000 vs.1Q 2Q 3Q 4Q 1Q 2Q 3Q 3Q 1999 Increase/ 3Q 3Q YTD 3Q 1999 Increase/
1999 1999 1999 1999 2000 2000 2000 (Decrease) 1999 2000 (Decrease)
REVENUES, NET OF INTEREST EXPENSE * 983$ 1,005$ 1,018$ 1,037$ 1,027$ 1,041$ 1,048$ 3% 3,006 3,116$ 4%
CORE INCOME (1) 83$ 79$ 23$ 94$ 75$ 82$ 68$ 196% 185 225$ 22%
Net written premiums by product line: (2)Auto 619.6$ 597.0$ 581.1$ 571.0$ 583.3$ 607.7$ 598.6$ 3% 1,797.7$ 1,789.6$ -Homeowners and other 363.8 353.9 370.6 347.8 306.4 375.7 394.2 6% 1,088.3 1,076.3 (1%)
Total net written premiums (a) 983.4$ 950.9$ 951.7$ 918.8$ 889.7$ 983.4$ 992.8$ 4% 2,886.0$ 2,865.9$ (1%)
Net written premiums by distribution channel: (2)Independent agents 791.6$ 750.6$ 743.0$ 721.2$ 710.2$ 790.4$ 798.3$ 7% 2,285.2$ 2,298.9$ 1%Affinity group marketing 83.0 84.5 92.1 93.7 97.3 101.6 107.5 17% 259.6 306.4 18%SECURE 57.2 62.6 58.5 46.3 30.8 26.4 16.7 (71%) 178.3 73.9 (59%)Joint marketing arrangements 51.6 53.2 58.1 57.6 51.4 65.0 70.3 21% 162.9 186.7 15%
Total net written premiums (a) 983.4$ 950.9$ 951.7$ 918.8$ 889.7$ 983.4$ 992.8$ 4% 2,886.0$ 2,865.9$ (1%)
Statutory ratio development:Earned premiums (b) 892.1$ 905.1$ 915.5$ 921.6$ 910.3$ 920.0$ 928.6$ 1% 2,712.7$ 2,758.9$ 2%
Losses and loss adjustment expenses (c) 594.3 627.1 702.7 619.8 656.4 668.1 711.8 1% 1,924.1 2,036.3 6%Other underwriting expenses (d) 269.8 242.5 258.7 244.7 239.8 251.2 256.6 (1%) 771.0 747.6 (3%)
Total deductions 864.1 869.6 961.4 864.5 896.2 919.3 968.4 1% 2,695.1 2,783.9 3%
Statutory underwriting gain/(loss) 28.0$ 35.5$ (45.9)$ 57.1$ 14.1$ 0.7$ (39.8)$ 13% 17.6$ (25.0)$ NM
Statutory combined ratio: (2)Loss and loss adjustment expense ratio (c / b) 66.6% 69.3% 76.8% 67.3% 72.1% 72.6% 76.7% 70.9% 73.8%Other underwriting expense ratio (d / a) 27.4% 25.5% 27.2% 26.6% 27.0% 25.5% 25.8% 26.7% 26.1%
Combined ratio 94.0% 94.8% 104.0% 93.9% 99.1% 98.1% 102.5% 97.6% 99.9%
Net investment income (pre-tax) 90.4$ 98.8$ 102.0$ 109.0$ 112.6$ 114.6$ 112.4$ 10% 291.2$ 339.6$ 17%Effective tax rate on net investment income 27.2% 27.7% 28.4% 28.9% 29.3% 29.5% 29.4% 27.8% 29.4%Catastrophe losses, net of reinsurance (after-tax) 8.1$ 23.2$ 48.2$ -$ 30.4$ 17.2$ 1.9$ (96%) 79.5$ 49.5$ (38%)
(1) During April 2000, Travelers Insurance Group Inc. completed a cash tender offer to purchase all the outstanding shares of Class A Common Stock of Travelers Property Casualty Corp. at aprice of $41.95 per share. Results for the periods prior to April 20, 2000 are net of minority interest.
(2) The 1999 first quarter and nine months net written premiums include an adjustment associated with a reinsurance transaction, which increased homeowners premiums written by independent agents by$71.7 million. Excluding this transaction, the statutory loss and loss adjustment expense ratio, other underwriting expense ratio, and combined ratio for the 1999 first quarter were 66.6%, 26.6% and 93.2%,respectively, and for the 1999 nine months were 70.9%, 26.4%, and 97.3%, respectively.
* Excludes realized gains on investments
NM - Not meaningful
Page 10
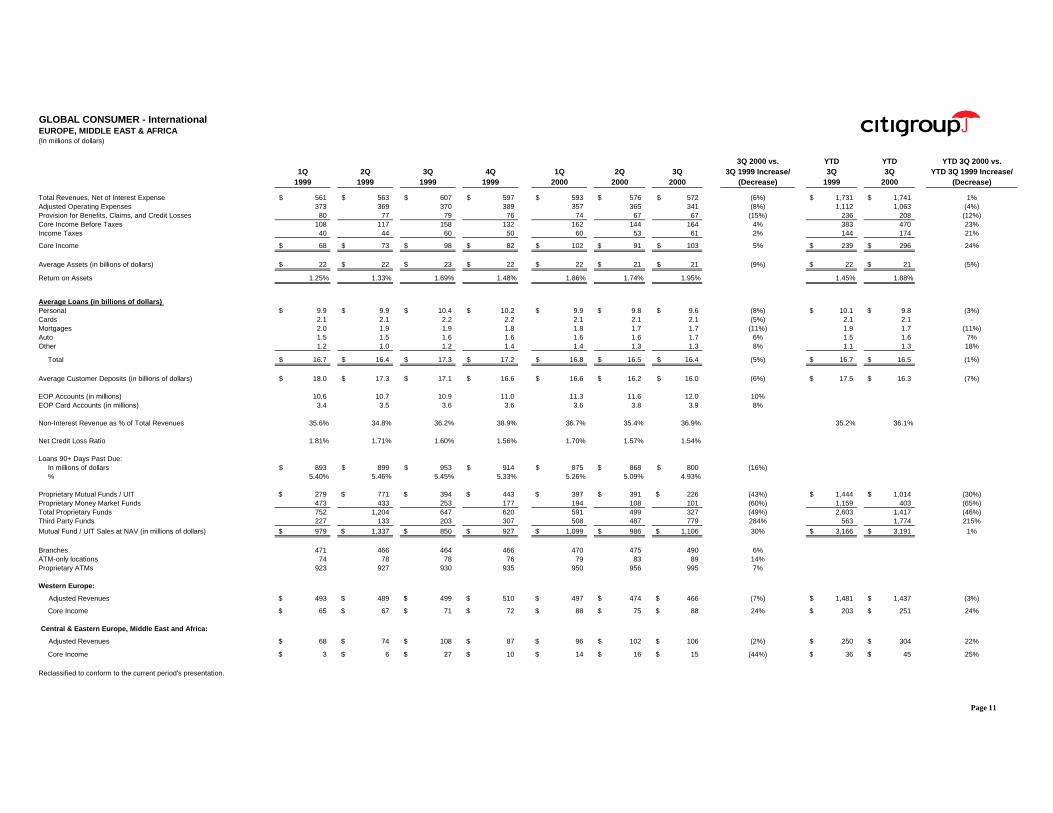
GLOBAL CONSUMER - InternationalEUROPE, MIDDLE EAST & AFRICA(In millions of dollars)
3Q 2000 vs. YTD YTD YTD 3Q 2000 vs.1Q 2Q 3Q 4Q 1Q 2Q 3Q 3Q 1999 Increase/ 3Q 3Q YTD 3Q 1999 Increase/
1999 1999 1999 1999 2000 2000 2000 (Decrease) 1999 2000 (Decrease)
Total Revenues, Net of Interest Expense 561$ 563$ 607$ 597$ 593$ 576$ 572$ (6%) 1,731$ 1,741$ 1%Adjusted Operating Expenses 373 369 370 389 357 365 341 (8%) 1,112 1,063 (4%)Provision for Benefits, Claims, and Credit Losses 80 77 79 76 74 67 67 (15%) 236 208 (12%)Core Income Before Taxes 108 117 158 132 162 144 164 4% 383 470 23%Income Taxes 40 44 60 50 60 53 61 2% 144 174 21%
Core Income 68$ 73$ 98$ 82$ 102$ 91$ 103$ 5% 239$ 296$ 24%
Average Assets (in billions of dollars) 22$ 22$ 23$ 22$ 22$ 21$ 21$ (9%) 22$ 21$ (5%)
Return on Assets 1.25% 1.33% 1.69% 1.48% 1.86% 1.74% 1.95% 1.45% 1.88%
Average Loans (in billions of dollars)Personal 9.9$ 9.9$ 10.4$ 10.2$ 9.9$ 9.8$ 9.6$ (8%) 10.1$ 9.8$ (3%)Cards 2.1 2.1 2.2 2.2 2.1 2.1 2.1 (5%) 2.1 2.1 -Mortgages 2.0 1.9 1.9 1.8 1.8 1.7 1.7 (11%) 1.9 1.7 (11%)Auto 1.5 1.5 1.6 1.6 1.6 1.6 1.7 6% 1.5 1.6 7%Other 1.2 1.0 1.2 1.4 1.4 1.3 1.3 8% 1.1 1.3 18%
Total 16.7$ 16.4$ 17.3$ 17.2$ 16.8$ 16.5$ 16.4$ (5%) 16.7$ 16.5$ (1%)
Average Customer Deposits (in billions of dollars) 18.0$ 17.3$ 17.1$ 16.6$ 16.6$ 16.2$ 16.0$ (6%) 17.5$ 16.3$ (7%)
EOP Accounts (in millions) 10.6 10.7 10.9 11.0 11.3 11.6 12.0 10%EOP Card Accounts (in millions) 3.4 3.5 3.6 3.6 3.6 3.8 3.9 8%
Non-Interest Revenue as % of Total Revenues 35.6% 34.8% 36.2% 38.9% 36.7% 35.4% 36.9% 35.2% 36.1%
Net Credit Loss Ratio 1.81% 1.71% 1.60% 1.56% 1.70% 1.57% 1.54%
Loans 90+ Days Past Due:In millions of dollars 893$ 899$ 953$ 914$ 875$ 868$ 800$ (16%)% 5.40% 5.46% 5.45% 5.33% 5.26% 5.09% 4.93%
Proprietary Mutual Funds / UIT 279$ 771$ 394$ 443$ 397$ 391$ 226$ (43%) 1,444$ 1,014$ (30%)Proprietary Money Market Funds 473 433 253 177 194 108 101 (60%) 1,159 403 (65%)Total Proprietary Funds 752 1,204 647 620 591 499 327 (49%) 2,603 1,417 (46%)Third Party Funds 227 133 203 307 508 487 779 284% 563 1,774 215%
Mutual Fund / UIT Sales at NAV (in millions of dollars) 979$ 1,337$ 850$ 927$ 1,099$ 986$ 1,106$ 30% 3,166$ 3,191$ 1%
Branches 471 466 464 466 470 475 490 6%ATM-only locations 74 78 78 76 79 83 89 14%Proprietary ATMs 923 927 930 935 950 956 995 7%
Western Europe:
Adjusted Revenues 493$ 489$ 499$ 510$ 497$ 474$ 466$ (7%) 1,481$ 1,437$ (3%)
Core Income 65$ 67$ 71$ 72$ 88$ 75$ 88$ 24% 203$ 251$ 24%
Central & Eastern Europe, Middle East and Africa:
Adjusted Revenues 68$ 74$ 108$ 87$ 96$ 102$ 106$ (2%) 250$ 304$ 22%
Core Income 3$ 6$ 27$ 10$ 14$ 16$ 15$ (44%) 36$ 45$ 25%
Reclassified to conform to the current period's presentation.
Page 11
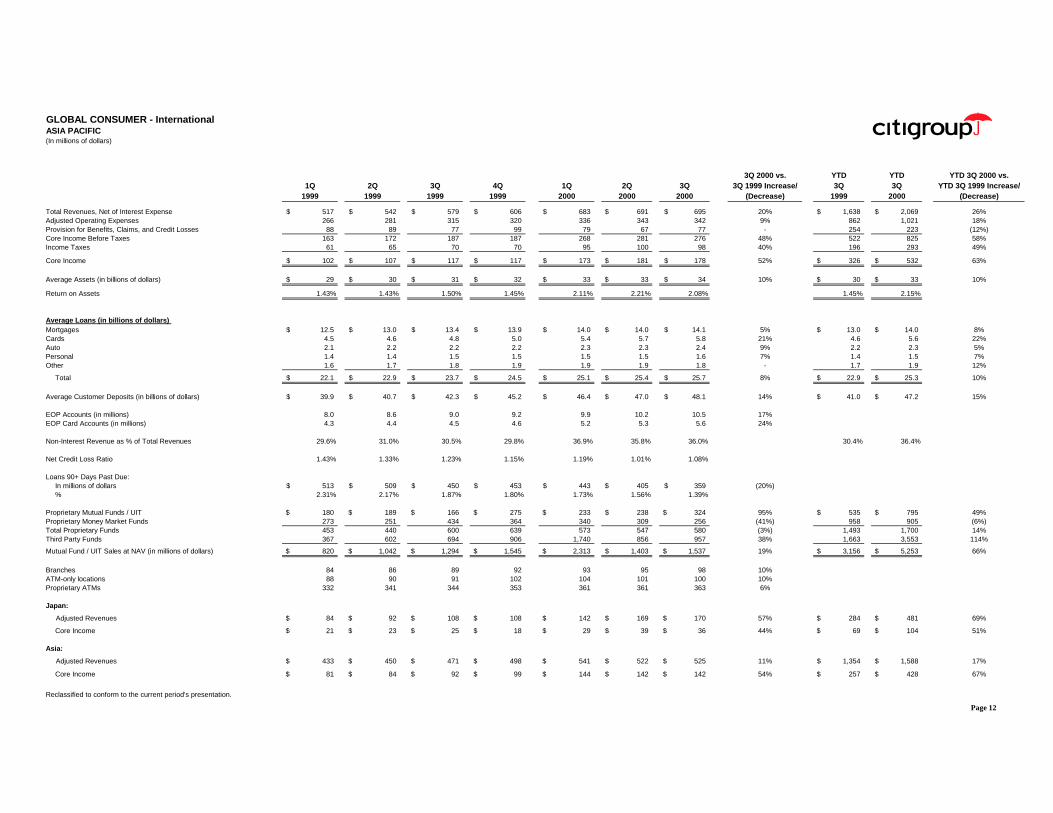
GLOBAL CONSUMER - InternationalASIA PACIFIC(In millions of dollars)
3Q 2000 vs. YTD YTD YTD 3Q 2000 vs.1Q 2Q 3Q 4Q 1Q 2Q 3Q 3Q 1999 Increase/ 3Q 3Q YTD 3Q 1999 Increase/
1999 1999 1999 1999 2000 2000 2000 (Decrease) 1999 2000 (Decrease)
Total Revenues, Net of Interest Expense 517$ 542$ 579$ 606$ 683$ 691$ 695$ 20% 1,638$ 2,069$ 26%Adjusted Operating Expenses 266 281 315 320 336 343 342 9% 862 1,021 18%Provision for Benefits, Claims, and Credit Losses 88 89 77 99 79 67 77 - 254 223 (12%)Core Income Before Taxes 163 172 187 187 268 281 276 48% 522 825 58%Income Taxes 61 65 70 70 95 100 98 40% 196 293 49%
Core Income 102$ 107$ 117$ 117$ 173$ 181$ 178$ 52% 326$ 532$ 63%
Average Assets (in billions of dollars) 29$ 30$ 31$ 32$ 33$ 33$ 34$ 10% 30$ 33$ 10%
Return on Assets 1.43% 1.43% 1.50% 1.45% 2.11% 2.21% 2.08% 1.45% 2.15%
Average Loans (in billions of dollars)Mortgages 12.5$ 13.0$ 13.4$ 13.9$ 14.0$ 14.0$ 14.1$ 5% 13.0$ 14.0$ 8%Cards 4.5 4.6 4.8 5.0 5.4 5.7 5.8 21% 4.6 5.6 22%Auto 2.1 2.2 2.2 2.2 2.3 2.3 2.4 9% 2.2 2.3 5%Personal 1.4 1.4 1.5 1.5 1.5 1.5 1.6 7% 1.4 1.5 7%Other 1.6 1.7 1.8 1.9 1.9 1.9 1.8 - 1.7 1.9 12%
Total 22.1$ 22.9$ 23.7$ 24.5$ 25.1$ 25.4$ 25.7$ 8% 22.9$ 25.3$ 10%
Average Customer Deposits (in billions of dollars) 39.9$ 40.7$ 42.3$ 45.2$ 46.4$ 47.0$ 48.1$ 14% 41.0$ 47.2$ 15%
EOP Accounts (in millions) 8.0 8.6 9.0 9.2 9.9 10.2 10.5 17%EOP Card Accounts (in millions) 4.3 4.4 4.5 4.6 5.2 5.3 5.6 24%
Non-Interest Revenue as % of Total Revenues 29.6% 31.0% 30.5% 29.8% 36.9% 35.8% 36.0% 30.4% 36.4%
Net Credit Loss Ratio 1.43% 1.33% 1.23% 1.15% 1.19% 1.01% 1.08%
Loans 90+ Days Past Due:In millions of dollars 513$ 509$ 450$ 453$ 443$ 405$ 359$ (20%)% 2.31% 2.17% 1.87% 1.80% 1.73% 1.56% 1.39%
Proprietary Mutual Funds / UIT 180$ 189$ 166$ 275$ 233$ 238$ 324$ 95% 535$ 795$ 49%Proprietary Money Market Funds 273 251 434 364 340 309 256 (41%) 958 905 (6%)Total Proprietary Funds 453 440 600 639 573 547 580 (3%) 1,493 1,700 14%Third Party Funds 367 602 694 906 1,740 856 957 38% 1,663 3,553 114%
Mutual Fund / UIT Sales at NAV (in millions of dollars) 820$ 1,042$ 1,294$ 1,545$ 2,313$ 1,403$ 1,537$ 19% 3,156$ 5,253$ 66%
Branches 84 86 89 92 93 95 98 10%ATM-only locations 88 90 91 102 104 101 100 10%Proprietary ATMs 332 341 344 353 361 361 363 6%
Japan:
Adjusted Revenues 84$ 92$ 108$ 108$ 142$ 169$ 170$ 57% 284$ 481$ 69%
Core Income 21$ 23$ 25$ 18$ 29$ 39$ 36$ 44% 69$ 104$ 51%
Asia:
Adjusted Revenues 433$ 450$ 471$ 498$ 541$ 522$ 525$ 11% 1,354$ 1,588$ 17%
Core Income 81$ 84$ 92$ 99$ 144$ 142$ 142$ 54% 257$ 428$ 67%
Reclassified to conform to the current period's presentation.
Page 12
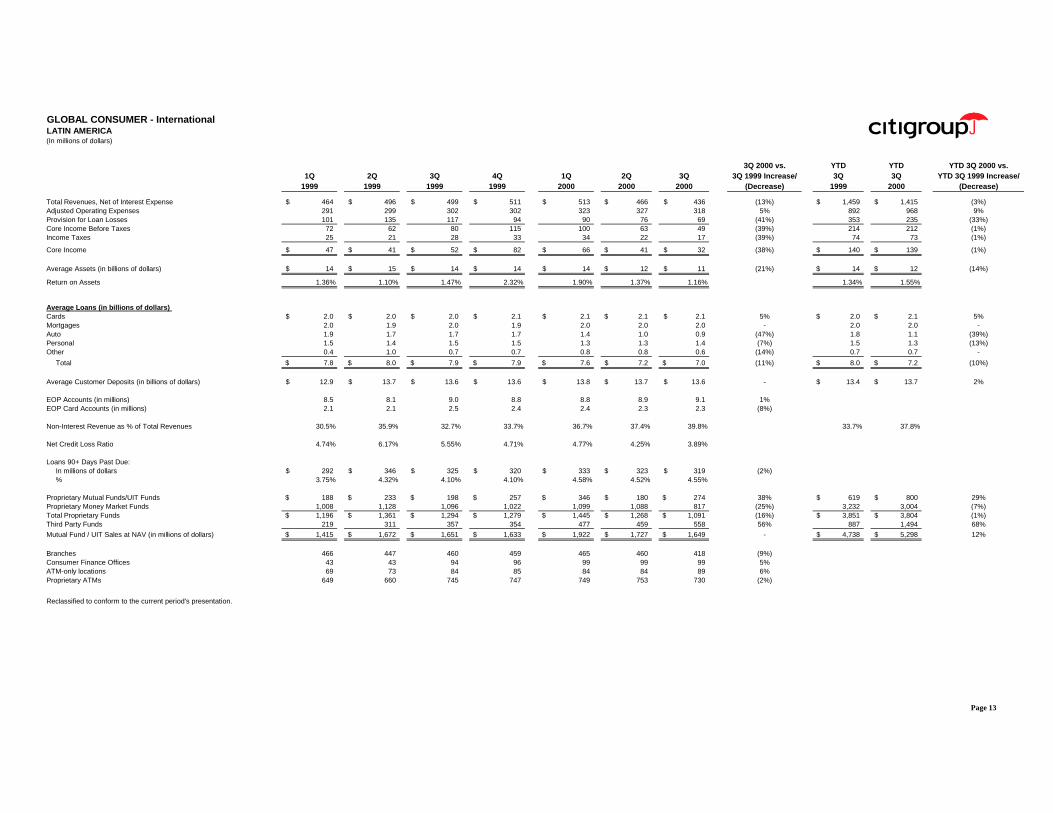
GLOBAL CONSUMER - InternationalLATIN AMERICA(In millions of dollars)
3Q 2000 vs. YTD YTD YTD 3Q 2000 vs.1Q 2Q 3Q 4Q 1Q 2Q 3Q 3Q 1999 Increase/ 3Q 3Q YTD 3Q 1999 Increase/
1999 1999 1999 1999 2000 2000 2000 (Decrease) 1999 2000 (Decrease)
Total Revenues, Net of Interest Expense 464$ 496$ 499$ 511$ 513$ 466$ 436$ (13%) 1,459$ 1,415$ (3%)Adjusted Operating Expenses 291 299 302 302 323 327 318 5% 892 968 9%Provision for Loan Losses 101 135 117 94 90 76 69 (41%) 353 235 (33%)Core Income Before Taxes 72 62 80 115 100 63 49 (39%) 214 212 (1%)Income Taxes 25 21 28 33 34 22 17 (39%) 74 73 (1%)
Core Income 47$ 41$ 52$ 82$ 66$ 41$ 32$ (38%) 140$ 139$ (1%)
Average Assets (in billions of dollars) 14$ 15$ 14$ 14$ 14$ 12$ 11$ (21%) 14$ 12$ (14%)
Return on Assets 1.36% 1.10% 1.47% 2.32% 1.90% 1.37% 1.16% 1.34% 1.55%
Average Loans (in billions of dollars)Cards 2.0$ 2.0$ 2.0$ 2.1$ 2.1$ 2.1$ 2.1$ 5% 2.0$ 2.1$ 5%Mortgages 2.0 1.9 2.0 1.9 2.0 2.0 2.0 - 2.0 2.0 -Auto 1.9 1.7 1.7 1.7 1.4 1.0 0.9 (47%) 1.8 1.1 (39%)Personal 1.5 1.4 1.5 1.5 1.3 1.3 1.4 (7%) 1.5 1.3 (13%)Other 0.4 1.0 0.7 0.7 0.8 0.8 0.6 (14%) 0.7 0.7 -
Total 7.8$ 8.0$ 7.9$ 7.9$ 7.6$ 7.2$ 7.0$ (11%) 8.0$ 7.2$ (10%)
Average Customer Deposits (in billions of dollars) 12.9$ 13.7$ 13.6$ 13.6$ 13.8$ 13.7$ 13.6$ - 13.4$ 13.7$ 2%
EOP Accounts (in millions) 8.5 8.1 9.0 8.8 8.8 8.9 9.1 1%EOP Card Accounts (in millions) 2.1 2.1 2.5 2.4 2.4 2.3 2.3 (8%)
Non-Interest Revenue as % of Total Revenues 30.5% 35.9% 32.7% 33.7% 36.7% 37.4% 39.8% 33.7% 37.8%
Net Credit Loss Ratio 4.74% 6.17% 5.55% 4.71% 4.77% 4.25% 3.89%
Loans 90+ Days Past Due:In millions of dollars 292$ 346$ 325$ 320$ 333$ 323$ 319$ (2%)% 3.75% 4.32% 4.10% 4.10% 4.58% 4.52% 4.55%
Proprietary Mutual Funds/UIT Funds 188$ 233$ 198$ 257$ 346$ 180$ 274$ 38% 619$ 800$ 29%Proprietary Money Market Funds 1,008 1,128 1,096 1,022 1,099 1,088 817 (25%) 3,232 3,004 (7%)Total Proprietary Funds 1,196$ 1,361$ 1,294$ 1,279$ 1,445$ 1,268$ 1,091$ (16%) 3,851$ 3,804$ (1%)Third Party Funds 219 311 357 354 477 459 558 56% 887 1,494 68%
Mutual Fund / UIT Sales at NAV (in millions of dollars) 1,415$ 1,672$ 1,651$ 1,633$ 1,922$ 1,727$ 1,649$ - 4,738$ 5,298$ 12%
Branches 466 447 460 459 465 460 418 (9%)Consumer Finance Offices 43 43 94 96 99 99 99 5%ATM-only locations 69 73 84 85 84 84 89 6%Proprietary ATMs 649 660 745 747 749 753 730 (2%)
Reclassified to conform to the current period's presentation.
Page 13
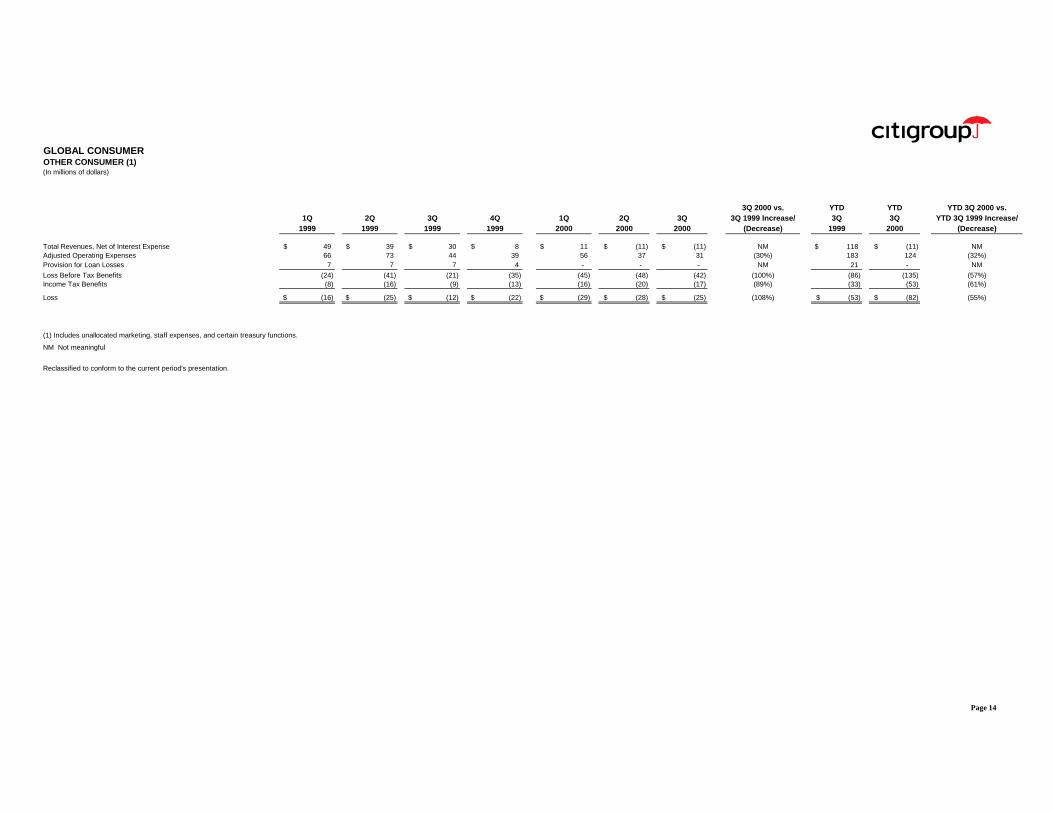
GLOBAL CONSUMEROTHER CONSUMER (1)(In millions of dollars)
3Q 2000 vs. YTD YTD YTD 3Q 2000 vs.1Q 2Q 3Q 4Q 1Q 2Q 3Q 3Q 1999 Increase/ 3Q 3Q YTD 3Q 1999 Increase/
1999 1999 1999 1999 2000 2000 2000 (Decrease) 1999 2000 (Decrease)
Total Revenues, Net of Interest Expense 49$ 39$ 30$ 8$ 11$ (11)$ (11)$ NM 118$ (11)$ NMAdjusted Operating Expenses 66 73 44 39 56 37 31 (30%) 183 124 (32%)Provision for Loan Losses 7 7 7 4 - - - NM 21 - NM
Loss Before Tax Benefits (24) (41) (21) (35) (45) (48) (42) (100%) (86) (135) (57%)Income Tax Benefits (8) (16) (9) (13) (16) (20) (17) (89%) (33) (53) (61%)
Loss (16)$ (25)$ (12)$ (22)$ (29)$ (28)$ (25)$ (108%) (53)$ (82)$ (55%)
(1) Includes unallocated marketing, staff expenses, and certain treasury functions.
NM Not meaningful
Reclassified to conform to the current period's presentation.
Page 14
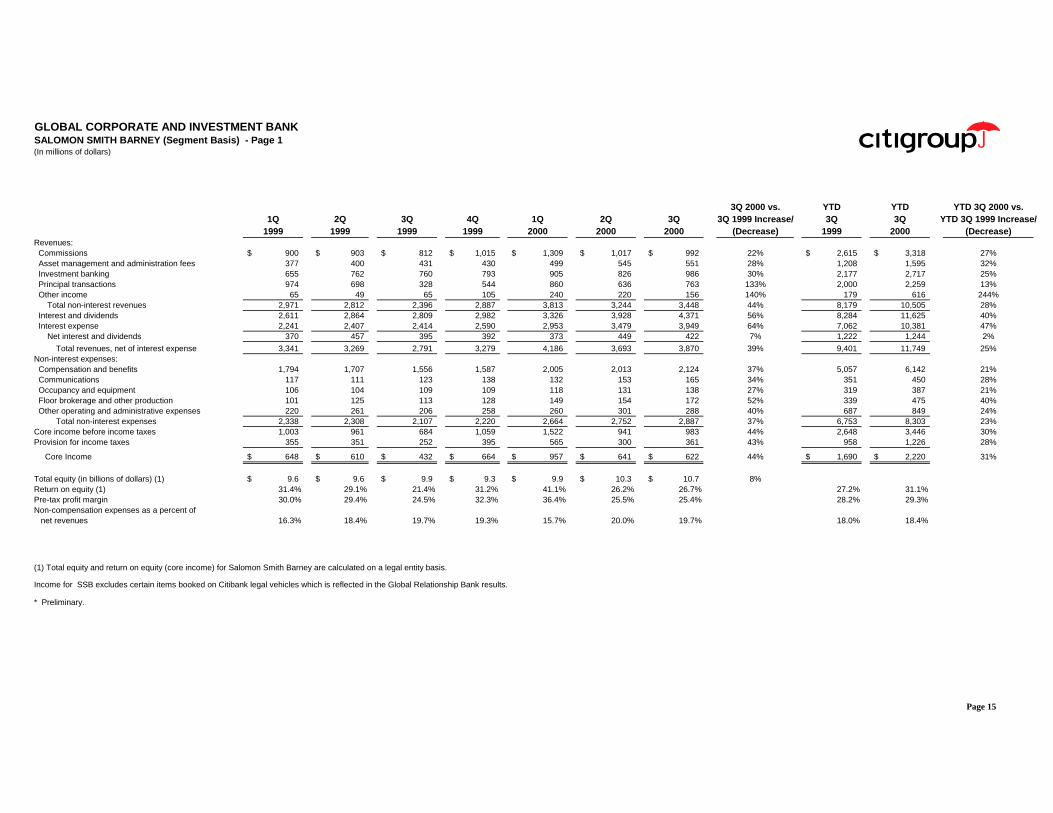
GLOBAL CORPORATE AND INVESTMENT BANKSALOMON SMITH BARNEY (Segment Basis) - Page 1(In millions of dollars)
3Q 2000 vs. YTD YTD YTD 3Q 2000 vs.1Q 2Q 3Q 4Q 1Q 2Q 3Q 3Q 1999 Increase/ 3Q 3Q YTD 3Q 1999 Increase/
1999 1999 1999 1999 2000 2000 2000 (Decrease) 1999 2000 (Decrease)Revenues:Commissions 900$ 903$ 812$ 1,015$ 1,309$ 1,017$ 992$ 22% 2,615$ 3,318$ 27%Asset management and administration fees 377 400 431 430 499 545 551 28% 1,208 1,595 32%Investment banking 655 762 760 793 905 826 986 30% 2,177 2,717 25%Principal transactions 974 698 328 544 860 636 763 133% 2,000 2,259 13%Other income 65 49 65 105 240 220 156 140% 179 616 244%
Total non-interest revenues 2,971 2,812 2,396 2,887 3,813 3,244 3,448 44% 8,179 10,505 28%Interest and dividends 2,611 2,864 2,809 2,982 3,326 3,928 4,371 56% 8,284 11,625 40%Interest expense 2,241 2,407 2,414 2,590 2,953 3,479 3,949 64% 7,062 10,381 47%
Net interest and dividends 370 457 395 392 373 449 422 7% 1,222 1,244 2%
Total revenues, net of interest expense 3,341 3,269 2,791 3,279 4,186 3,693 3,870 39% 9,401 11,749 25%Non-interest expenses:Compensation and benefits 1,794 1,707 1,556 1,587 2,005 2,013 2,124 37% 5,057 6,142 21%Communications 117 111 123 138 132 153 165 34% 351 450 28%Occupancy and equipment 106 104 109 109 118 131 138 27% 319 387 21%Floor brokerage and other production 101 125 113 128 149 154 172 52% 339 475 40%Other operating and administrative expenses 220 261 206 258 260 301 288 40% 687 849 24%
Total non-interest expenses 2,338 2,308 2,107 2,220 2,664 2,752 2,887 37% 6,753 8,303 23%Core income before income taxes 1,003 961 684 1,059 1,522 941 983 44% 2,648 3,446 30%Provision for income taxes 355 351 252 395 565 300 361 43% 958 1,226 28%
Core Income 648$ 610$ 432$ 664$ 957$ 641$ 622$ 44% 1,690$ 2,220$ 31%
Total equity (in billions of dollars) (1) 9.6$ 9.6$ 9.9$ 9.3$ 9.9$ 10.3$ 10.7$ 8%Return on equity (1) 31.4% 29.1% 21.4% 31.2% 41.1% 26.2% 26.7% 27.2% 31.1%Pre-tax profit margin 30.0% 29.4% 24.5% 32.3% 36.4% 25.5% 25.4% 28.2% 29.3%Non-compensation expenses as a percent of
net revenues 16.3% 18.4% 19.7% 19.3% 15.7% 20.0% 19.7% 18.0% 18.4%
(1) Total equity and return on equity (core income) for Salomon Smith Barney are calculated on a legal entity basis.
Income for SSB excludes certain items booked on Citibank legal vehicles which is reflected in the Global Relationship Bank results.
* Preliminary.
Page 15
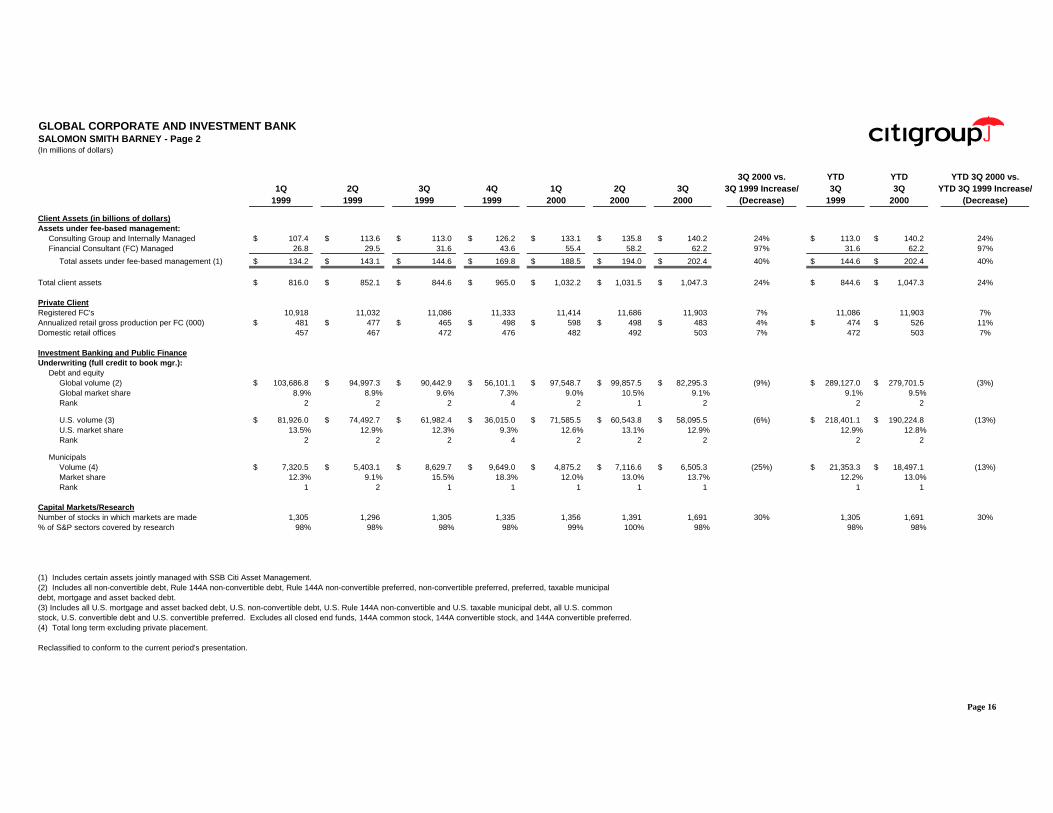
GLOBAL CORPORATE AND INVESTMENT BANKSALOMON SMITH BARNEY - Page 2(In millions of dollars)
3Q 2000 vs. YTD YTD YTD 3Q 2000 vs.1Q 2Q 3Q 4Q 1Q 2Q 3Q 3Q 1999 Increase/ 3Q 3Q YTD 3Q 1999 Increase/
1999 1999 1999 1999 2000 2000 2000 (Decrease) 1999 2000 (Decrease)
Client Assets (in billions of dollars)Assets under fee-based management:
Consulting Group and Internally Managed 107.4$ 113.6$ 113.0$ 126.2$ 133.1$ 135.8$ 140.2$ 24% 113.0$ 140.2$ 24%Financial Consultant (FC) Managed 26.8 29.5 31.6 43.6 55.4 58.2 62.2 97% 31.6 62.2 97%
Total assets under fee-based management (1) 134.2$ 143.1$ 144.6$ 169.8$ 188.5$ 194.0$ 202.4$ 40% 144.6$ 202.4$ 40%
Total client assets 816.0$ 852.1$ 844.6$ 965.0$ 1,032.2$ 1,031.5$ 1,047.3$ 24% 844.6$ 1,047.3$ 24%
Private ClientRegistered FC's 10,918 11,032 11,086 11,333 11,414 11,686 11,903 7% 11,086 11,903 7%Annualized retail gross production per FC (000) 481$ 477$ 465$ 498$ 598$ 498$ 483$ 4% 474$ 526$ 11%Domestic retail offices 457 467 472 476 482 492 503 7% 472 503 7%
Investment Banking and Public FinanceUnderwriting (full credit to book mgr.):
Debt and equityGlobal volume (2) 103,686.8$ 94,997.3$ 90,442.9$ 56,101.1$ 97,548.7$ 99,857.5$ 82,295.3$ (9%) 289,127.0$ 279,701.5$ (3%)Global market share 8.9% 8.9% 9.6% 7.3% 9.0% 10.5% 9.1% 9.1% 9.5%Rank 2 2 2 4 2 1 2 2 2
U.S. volume (3) 81,926.0$ 74,492.7$ 61,982.4$ 36,015.0$ 71,585.5$ 60,543.8$ 58,095.5$ (6%) 218,401.1$ 190,224.8$ (13%)U.S. market share 13.5% 12.9% 12.3% 9.3% 12.6% 13.1% 12.9% 12.9% 12.8%Rank 2 2 2 4 2 2 2 2 2
MunicipalsVolume (4) 7,320.5$ 5,403.1$ 8,629.7$ 9,649.0$ 4,875.2$ 7,116.6$ 6,505.3$ (25%) 21,353.3$ 18,497.1$ (13%)Market share 12.3% 9.1% 15.5% 18.3% 12.0% 13.0% 13.7% 12.2% 13.0%Rank 1 2 1 1 1 1 1 1 1
Capital Markets/ResearchNumber of stocks in which markets are made 1,305 1,296 1,305 1,335 1,356 1,391 1,691 30% 1,305 1,691 30%% of S&P sectors covered by research 98% 98% 98% 98% 99% 100% 98% 98% 98%
(1) Includes certain assets jointly managed with SSB Citi Asset Management.(2) Includes all non-convertible debt, Rule 144A non-convertible debt, Rule 144A non-convertible preferred, non-convertible preferred, preferred, taxable municipaldebt, mortgage and asset backed debt.(3) Includes all U.S. mortgage and asset backed debt, U.S. non-convertible debt, U.S. Rule 144A non-convertible and U.S. taxable municipal debt, all U.S. commonstock, U.S. convertible debt and U.S. convertible preferred. Excludes all closed end funds, 144A common stock, 144A convertible stock, and 144A convertible preferred.(4) Total long term excluding private placement.
Reclassified to conform to the current period's presentation.
Page 16

GLOBAL CORPORATE AND INVESTMENT BANKGLOBAL RELATIONSHIP BANKING(In millions of dollars)
3Q 2000 vs. YTD YTD YTD 3Q 2000 vs.1Q 2Q 3Q 4Q 1Q 2Q 3Q 3Q 1999 Increase/ 3Q 3Q YTD 3Q 1999 Increase/
1999 1999 1999 1999 2000 2000 2000 (Decrease) 1999 2000 (Decrease)
Total Revenues, Net of Interest Expense 1,117$ 1,038$ 1,020$ 1,033$ 1,207$ 1,265$ 1,215$ 19% 3,175$ 3,687$ 16%Adjusted Operating Expenses 829 805 789 775 792 801 815 3% 2,423 2,408 (1%)Provision for Loan Losses (3) 1 6 2 40 52 13 117% 4 105 NMCore Income Before Taxes and Minority Interest 291 232 225 256 375 412 387 72% 748 1,174 57%Income Taxes 107 86 82 93 135 151 139 70% 275 425 55%Minority Interest, Net of Tax - - - - - - (2) NM - (2) NM
Core Income 184$ 146$ 143$ 163$ 240$ 261$ 250$ 75% 473$ 751$ 59%
Average Assets (in billions of dollars) 88$ 81$ 76$ 81$ 85$ 96$ 96$ 26% 82$ 92$ 12%
Return on Assets 0.85% 0.72% 0.75% 0.80% 1.14% 1.09% 1.04% 0.77% 1.09%
GLOBAL CORPORATE AND INVESTMENT BANKEMERGING MARKETS CORPORATE BANKING(In millions of dollars)
3Q 2000 vs. YTD YTD YTD 3Q 2000 vs.1Q 2Q 3Q 4Q 1Q 2Q 3Q 3Q 1999 Increase/ 3Q 3Q YTD 3Q 1999 Increase/
1999 1999 1999 1999 2000 2000 2000 (Decrease) 1999 2000 (Decrease)
Total Revenues, Net of Interest Expense 1,145$ 1,098$ 1,057$ 1,052$ 1,240$ 1,272$ 1,265$ 20% 3,300$ 3,777$ 14%Adjusted Operating Expenses 522 525 535 547 536 604 597 12% 1,582 1,737 10%Provision for Loan Losses 115 110 32 90 84 79 22 (31%) 257 185 (28%)Core Income Before Taxes and Minority Interest 508 463 490 415 620 589 646 32% 1,461 1,855 27%Income Taxes 192 175 186 156 226 215 245 32% 553 686 24%Minority Interest, Net of Tax 1 2 1 2 2 4 - (100%) 4 6 50%Core Income 315$ 286$ 303$ 257$ 392$ 370$ 401$ 32% 904$ 1,163$ 29%
Average Assets (in billions of dollars) 80$ 83$ 82$ 82$ 83$ 87$ 93$ 13% 82$ 88$ 7%
Return on Assets 1.60% 1.38% 1.47% 1.24% 1.90% 1.71% 1.72% 1.47% 1.77%
NM Not meaningful
Reclassified to conform to the current period's presentation.
Page 17

GLOBAL CORPORATE AND INVESTMENT BANKTRAVELERS PROPERTY CASUALTY - COMMERCIAL LINES(In millions of dollars)
3Q 2000 vs. YTD YTD YTD 3Q 2000 vs.1Q 2Q 3Q 4Q 1Q 2Q 3Q 3Q 1999 Increase/ 3Q 3Q YTD 3Q 1999 Increase/
1999 1999 1999 1999 2000 2000 2000 (Decrease) 1999 2000 (Decrease)
REVENUES, NET OF INTEREST EXPENSE * 1,534$ 1,558$ 1,578$ 1,595$ 1,568$ 1,626$ 1,747$ 11% 4,670$ 4,941$ 6%
CORE INCOME (1) 189$ 201$ 255$ 200$ 240$ 267$ 315$ 24% 645$ 822$ 27%
Net written premiums by market (2):Commercial accounts 443.6$ 440.1$ 469.9$ 462.7$ 487.4$ 457.4$ 563.1$ 20% 1,353.6$ 1,507.9$ 11%Select accounts 372.3 393.4 355.4 373.0 387.3 406.8 382.4 8% 1,121.1 1,176.5 5%Specialty accounts 148.2 159.8 158.4 143.1 180.5 310.0 274.3 73% 466.4 764.8 64%National accounts 149.9 101.4 148.8 88.3 92.0 58.5 131.4 (12%) 400.1 281.9 (30%)
Total net written premiums (a) 1,114.0$ 1,094.7$ 1,132.5$ 1,067.1$ 1,147.2$ 1,232.7$ 1,351.2$ 19% 3,341.2$ 3,731.1$ 12%
Statutory ratio development:Earned premiums (b) 1,072.7$ 1,100.8$ 1,110.3$ 1,090.7$ 1,079.0$ 1,120.5$ 1,232.5$ 11% 3,283.8 3,432.0$ 5%
Losses and loss adjustment expenses (3) (c) 817.5 827.2 928.8 832.2 792.7 854.7 960.3 3% 2,573.5 2,607.7 1%Other underwriting expenses (d) 317.9 333.8 349.8 350.6 320.4 373.3 350.5 - 1,001.5 1,044.2 4%
Total deductions 1,135.4 1,161.0 1,278.6 1,182.8 1,113.1 1,228.0 1,310.8 3% 3,575.0 3,651.9 2%
Statutory underwriting loss (62.7)$ (60.2)$ (168.3)$ (92.1)$ (34.1)$ (107.5)$ (78.3)$ 53% (291.2)$ (219.9)$ 24%
Statutory combined ratio: (2), (3), (4)Loss and loss adjustment expense ratio (c / b) 76.2% 75.1% 83.7% 76.3% 73.5% 76.3% 77.9% 78.4% 76.0%Other underwriting expense ratio (d / a) 28.5% 30.5% 30.9% 32.9% 27.9% 30.3% 25.9% 30.0% 28.0%
Combined ratio 104.7% 105.6% 114.6% 109.2% 101.4% 106.6% 103.8% 108.4% 104.0%
Net investment income (pre-tax) 412.6$ 410.5$ 420.2$ 445.4$ 435.9$ 439.1$ 418.5$ - 1,243.3$ 1,293.5$ 4%Effective tax rate on net investment income 26.6% 26.5% 26.7% 27.1% 26.9% 26.9% 26.6% 26.6% 26.8%Catastrophe losses, net of reinsurance (after-tax) -$ 9.9$ 17.4$ -$ -$ -$ -$ NM 27.3$ -$ NM
(1) During April 2000, Travelers Insurance Group Inc. completed a cash tender offer to purchase all the outstanding shares of Class A Common Stock of Travelers Property Casualty Corp. at aprice of $41.95 per share. Results for the periods prior to April 20, 2000 are net of minority interest.
(2) The 2000 second quarter and nine months net written premiums include a $130.7 million adjustment associated with the acquisition of the Reliance Surety business. Excluding this transaction,the loss and loss adjustment expense ratio, other underwriting expense ratio, and combined ratio for the 2000 second quarter were 76.3%, 29.1% and 105.4%, respectively, and for the2000 nine months were 76.0%, 27.5% and 103.5%, respectively.
(3) The 1999 third quarter and nine months include the effects of a settlement of an asbestos liability, which increased losses and loss adjustment expenses, for statutory purposes only, by $105.2 million.Excluding this transaction, the statutory loss and loss adjustment expense ratio, other underwriting expense ratio, and combined ratio for the 1999 third quarter were 74.2%, 30.9% and 105.1%,respectively, and for the 1999 nine months were 75.2%, 30.0% and 105.2%, respectively.
(4) Before policyholder dividends.
* Excludes realized gains on investments
NM - Not meaningful
Page 18
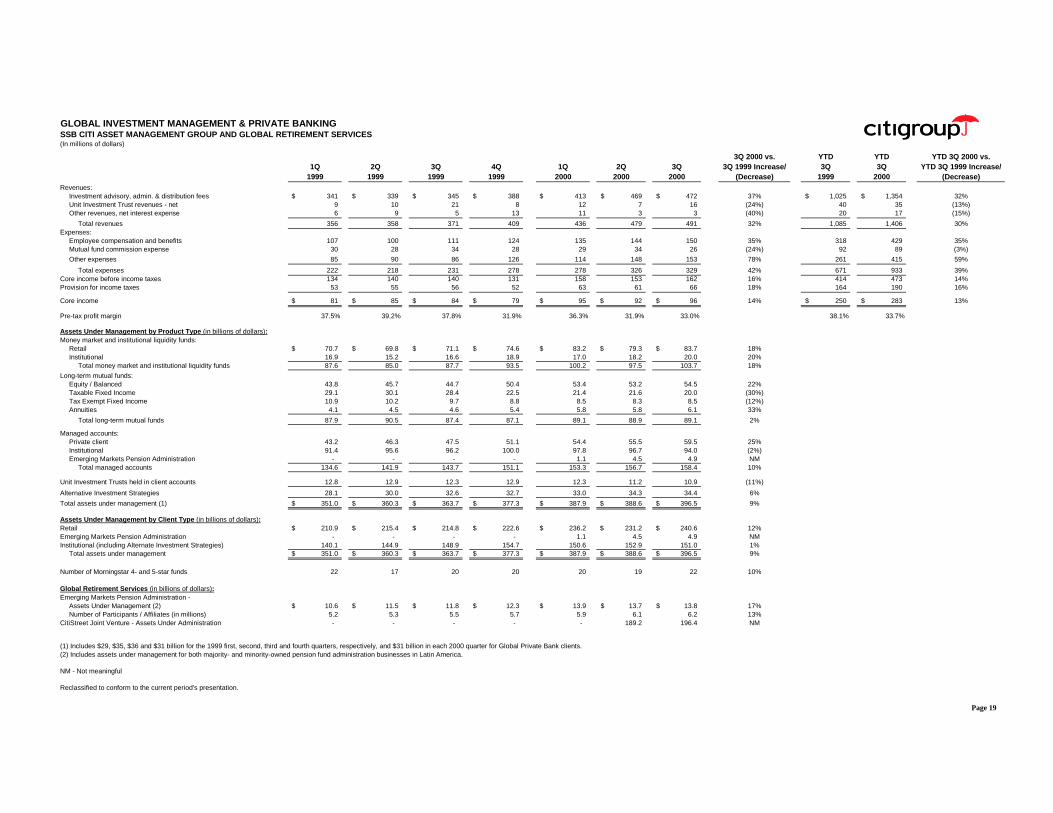
GLOBAL INVESTMENT MANAGEMENT & PRIVATE BANKINGSSB CITI ASSET MANAGEMENT GROUP AND GLOBAL RETIREMENT SERVICES(In millions of dollars)
3Q 2000 vs. YTD YTD YTD 3Q 2000 vs.1Q 2Q 3Q 4Q 1Q 2Q 3Q 3Q 1999 Increase/ 3Q 3Q YTD 3Q 1999 Increase/
1999 1999 1999 1999 2000 2000 2000 (Decrease) 1999 2000 (Decrease)Revenues:
Investment advisory, admin. & distribution fees 341$ 339$ 345$ 388$ 413$ 469$ 472$ 37% 1,025$ 1,354$ 32%Unit Investment Trust revenues - net 9 10 21 8 12 7 16 (24%) 40 35 (13%)Other revenues, net interest expense 6 9 5 13 11 3 3 (40%) 20 17 (15%)
Total revenues 356 358 371 409 436 479 491 32% 1,085 1,406 30%Expenses:
Employee compensation and benefits 107 100 111 124 135 144 150 35% 318 429 35%Mutual fund commission expense 30 28 34 28 29 34 26 (24%) 92 89 (3%)
Other expenses 85 90 86 126 114 148 153 78% 261 415 59%
Total expenses 222 218 231 278 278 326 329 42% 671 933 39%Core income before income taxes 134 140 140 131 158 153 162 16% 414 473 14%Provision for income taxes 53 55 56 52 63 61 66 18% 164 190 16%
Core income 81$ 85$ 84$ 79$ 95$ 92$ 96$ 14% 250$ 283$ 13%
Pre-tax profit margin 37.5% 39.2% 37.8% 31.9% 36.3% 31.9% 33.0% 38.1% 33.7%
Assets Under Management by Product Type (in billions of dollars):Money market and institutional liquidity funds:
Retail 70.7$ 69.8$ 71.1$ 74.6$ 83.2$ 79.3$ 83.7$ 18%Institutional 16.9 15.2 16.6 18.9 17.0 18.2 20.0 20%
Total money market and institutional liquidity funds 87.6 85.0 87.7 93.5 100.2 97.5 103.7 18%
Long-term mutual funds:Equity / Balanced 43.8 45.7 44.7 50.4 53.4 53.2 54.5 22%Taxable Fixed Income 29.1 30.1 28.4 22.5 21.4 21.6 20.0 (30%)Tax Exempt Fixed Income 10.9 10.2 9.7 8.8 8.5 8.3 8.5 (12%)Annuities 4.1 4.5 4.6 5.4 5.8 5.8 6.1 33%
Total long-term mutual funds 87.9 90.5 87.4 87.1 89.1 88.9 89.1 2%
Managed accounts:Private client 43.2 46.3 47.5 51.1 54.4 55.5 59.5 25%Institutional 91.4 95.6 96.2 100.0 97.8 96.7 94.0 (2%)Emerging Markets Pension Administration - - - - 1.1 4.5 4.9 NM
Total managed accounts 134.6 141.9 143.7 151.1 153.3 156.7 158.4 10%
Unit Investment Trusts held in client accounts 12.8 12.9 12.3 12.9 12.3 11.2 10.9 (11%)
Alternative Investment Strategies 28.1 30.0 32.6 32.7 33.0 34.3 34.4 6%
Total assets under management (1) 351.0$ 360.3$ 363.7$ 377.3$ 387.9$ 388.6$ 396.5$ 9%
Assets Under Management by Client Type (in billions of dollars):Retail 210.9$ 215.4$ 214.8$ 222.6$ 236.2$ 231.2$ 240.6$ 12%Emerging Markets Pension Administration - - - - 1.1 4.5 4.9 NMInstitutional (including Alternate Investment Strategies) 140.1 144.9 148.9 154.7 150.6 152.9 151.0 1%
Total assets under management 351.0$ 360.3$ 363.7$ 377.3$ 387.9$ 388.6$ 396.5$ 9%
Number of Morningstar 4- and 5-star funds 22 17 20 20 20 19 22 10%
Global Retirement Services (in billions of dollars):Emerging Markets Pension Administration -
Assets Under Management (2) 10.6$ 11.5$ 11.8$ 12.3$ 13.9$ 13.7$ 13.8$ 17%Number of Participants / Affiliates (in millions) 5.2 5.3 5.5 5.7 5.9 6.1 6.2 13%
CitiStreet Joint Venture - Assets Under Administration - - - - - 189.2 196.4 NM
(1) Includes $29, $35, $36 and $31 billion for the 1999 first, second, third and fourth quarters, respectively, and $31 billion in each 2000 quarter for Global Private Bank clients.(2) Includes assets under management for both majority- and minority-owned pension fund administration businesses in Latin America.
NM - Not meaningful
Reclassified to conform to the current period's presentation.
Page 19
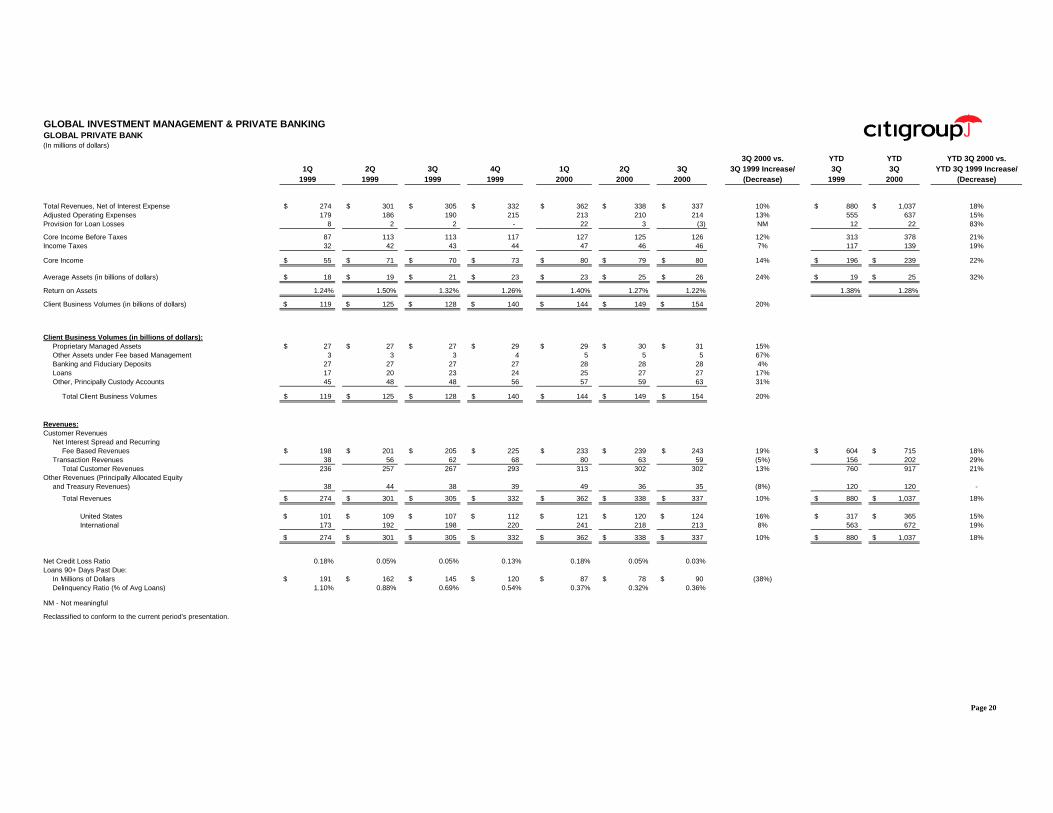
GLOBAL INVESTMENT MANAGEMENT & PRIVATE BANKINGGLOBAL PRIVATE BANK(In millions of dollars)
3Q 2000 vs. YTD YTD YTD 3Q 2000 vs.1Q 2Q 3Q 4Q 1Q 2Q 3Q 3Q 1999 Increase/ 3Q 3Q YTD 3Q 1999 Increase/
1999 1999 1999 1999 2000 2000 2000 (Decrease) 1999 2000 (Decrease)
Total Revenues, Net of Interest Expense 274$ 301$ 305$ 332$ 362$ 338$ 337$ 10% 880$ 1,037$ 18%Adjusted Operating Expenses 179 186 190 215 213 210 214 13% 555 637 15%Provision for Loan Losses 8 2 2 - 22 3 (3) NM 12 22 83%
Core Income Before Taxes 87 113 113 117 127 125 126 12% 313 378 21%Income Taxes 32 42 43 44 47 46 46 7% 117 139 19%
Core Income 55$ 71$ 70$ 73$ 80$ 79$ 80$ 14% 196$ 239$ 22%
Average Assets (in billions of dollars) 18$ 19$ 21$ 23$ 23$ 25$ 26$ 24% 19$ 25$ 32%
Return on Assets 1.24% 1.50% 1.32% 1.26% 1.40% 1.27% 1.22% 1.38% 1.28%
Client Business Volumes (in billions of dollars) 119$ 125$ 128$ 140$ 144$ 149$ 154$ 20%
Client Business Volumes (in billions of dollars):Proprietary Managed Assets 27$ 27$ 27$ 29$ 29$ 30$ 31$ 15%Other Assets under Fee based Management 3 3 3 4 5 5 5 67%Banking and Fiduciary Deposits 27 27 27 27 28 28 28 4%Loans 17 20 23 24 25 27 27 17%Other, Principally Custody Accounts 45 48 48 56 57 59 63 31%
Total Client Business Volumes 119$ 125$ 128$ 140$ 144$ 149$ 154$ 20%
Revenues:Customer Revenues
Net Interest Spread and RecurringFee Based Revenues 198$ 201$ 205$ 225$ 233$ 239$ 243$ 19% 604$ 715$ 18%
Transaction Revenues 38 56 62 68 80 63 59 (5%) 156 202 29%Total Customer Revenues 236 257 267 293 313 302 302 13% 760 917 21%
Other Revenues (Principally Allocated Equityand Treasury Revenues) 38 44 38 39 49 36 35 (8%) 120 120 -
Total Revenues 274$ 301$ 305$ 332$ 362$ 338$ 337$ 10% 880$ 1,037$ 18%
United States 101$ 109$ 107$ 112$ 121$ 120$ 124$ 16% 317$ 365$ 15%International 173 192 198 220 241 218 213 8% 563 672 19%
274$ 301$ 305$ 332$ 362$ 338$ 337$ 10% 880$ 1,037$ 18%
Net Credit Loss Ratio 0.18% 0.05% 0.05% 0.13% 0.18% 0.05% 0.03%Loans 90+ Days Past Due:
In Millions of Dollars 191$ 162$ 145$ 120$ 87$ 78$ 90$ (38%)Delinquency Ratio (% of Avg Loans) 1.10% 0.88% 0.69% 0.54% 0.37% 0.32% 0.36%
NM - Not meaningful
Reclassified to conform to the current period's presentation.
Page 20
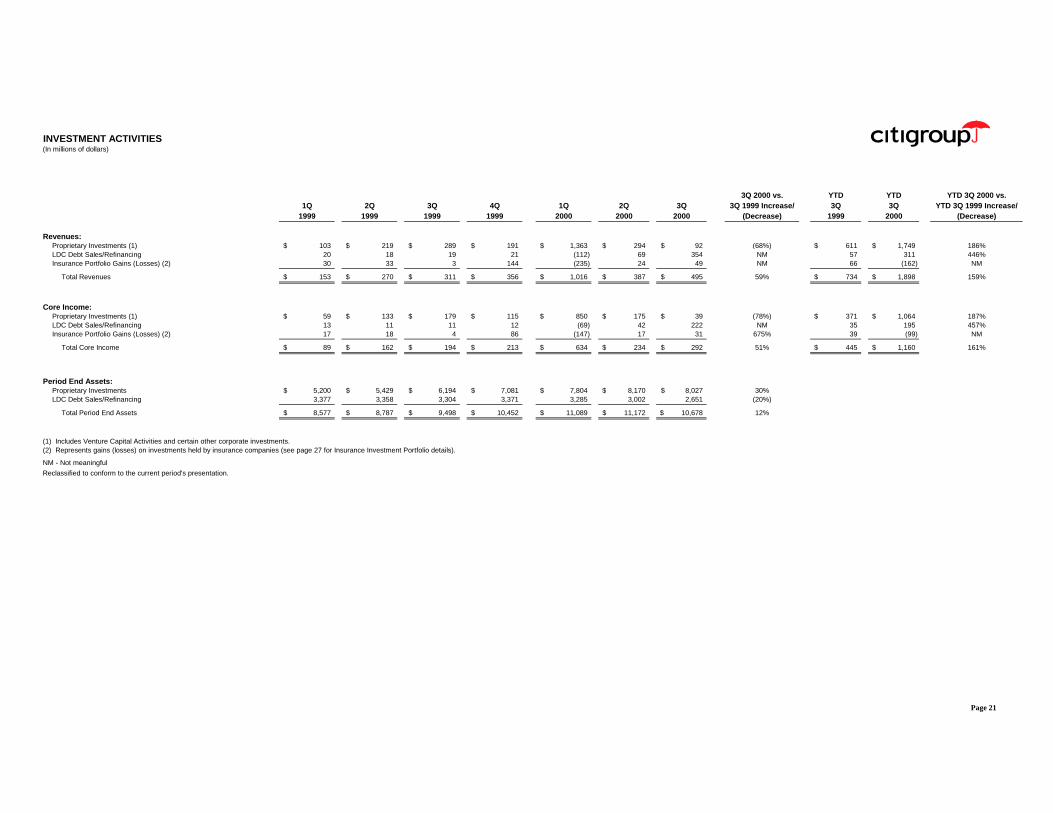
INVESTMENT ACTIVITIES(In millions of dollars)
3Q 2000 vs. YTD YTD YTD 3Q 2000 vs.1Q 2Q 3Q 4Q 1Q 2Q 3Q 3Q 1999 Increase/ 3Q 3Q YTD 3Q 1999 Increase/
1999 1999 1999 1999 2000 2000 2000 (Decrease) 1999 2000 (Decrease)
Revenues:Proprietary Investments (1) 103$ 219$ 289$ 191$ 1,363$ 294$ 92$ (68%) 611$ 1,749$ 186%LDC Debt Sales/Refinancing 20 18 19 21 (112) 69 354 NM 57 311 446%Insurance Portfolio Gains (Losses) (2) 30 33 3 144 (235) 24 49 NM 66 (162) NM
Total Revenues 153$ 270$ 311$ 356$ 1,016$ 387$ 495$ 59% 734$ 1,898$ 159%
Core Income:Proprietary Investments (1) 59$ 133$ 179$ 115$ 850$ 175$ 39$ (78%) 371$ 1,064$ 187%LDC Debt Sales/Refinancing 13 11 11 12 (69) 42 222 NM 35 195 457%Insurance Portfolio Gains (Losses) (2) 17 18 4 86 (147) 17 31 675% 39 (99) NM
Total Core Income 89$ 162$ 194$ 213$ 634$ 234$ 292$ 51% 445$ 1,160$ 161%
Period End Assets:Proprietary Investments 5,200$ 5,429$ 6,194$ 7,081$ 7,804$ 8,170$ 8,027$ 30%LDC Debt Sales/Refinancing 3,377 3,358 3,304 3,371 3,285 3,002 2,651 (20%)
Total Period End Assets 8,577$ 8,787$ 9,498$ 10,452$ 11,089$ 11,172$ 10,678$ 12%
(1) Includes Venture Capital Activities and certain other corporate investments.(2) Represents gains (losses) on investments held by insurance companies (see page 27 for Insurance Investment Portfolio details).
NM - Not meaningful
Reclassified to conform to the current period's presentation.
Page 21
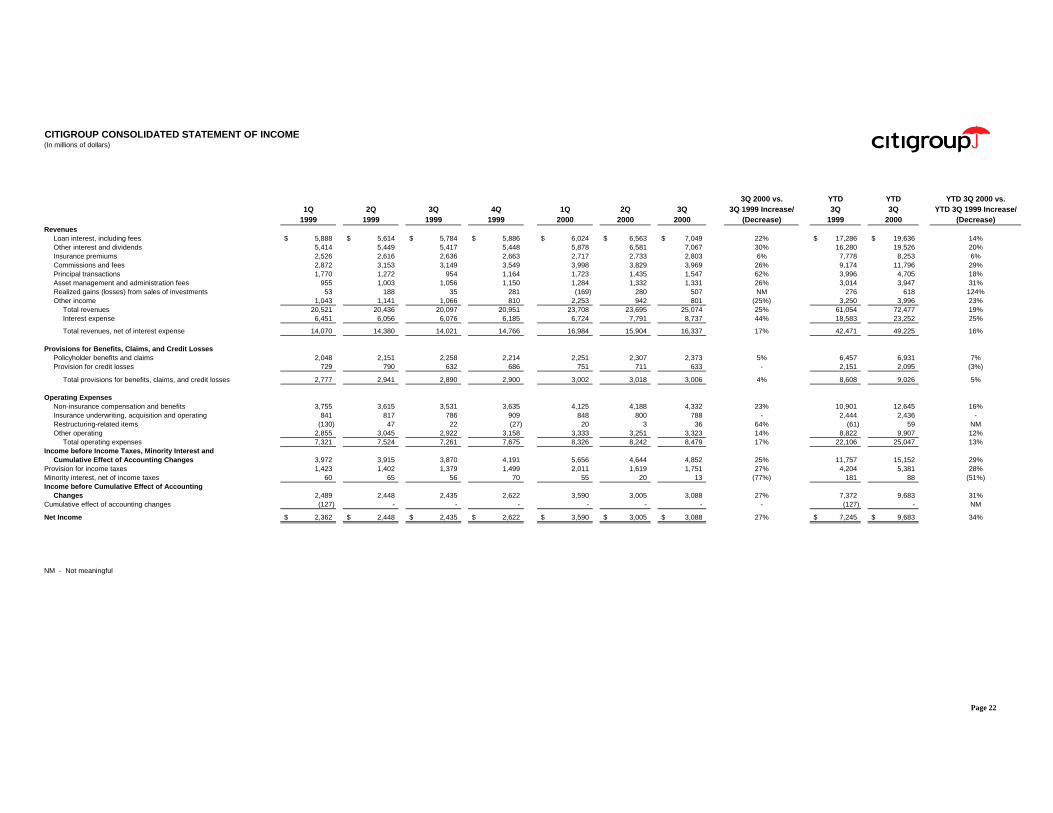
CITIGROUP CONSOLIDATED STATEMENT OF INCOME(In millions of dollars)
3Q 2000 vs. YTD YTD YTD 3Q 2000 vs.1Q 2Q 3Q 4Q 1Q 2Q 3Q 3Q 1999 Increase/ 3Q 3Q YTD 3Q 1999 Increase/
1999 1999 1999 1999 2000 2000 2000 (Decrease) 1999 2000 (Decrease)Revenues
Loan interest, including fees 5,888$ 5,614$ 5,784$ 5,886$ 6,024$ 6,563$ 7,049$ 22% 17,286$ 19,636$ 14%Other interest and dividends 5,414 5,449 5,417 5,448 5,878 6,581 7,067 30% 16,280 19,526 20%Insurance premiums 2,526 2,616 2,636 2,663 2,717 2,733 2,803 6% 7,778 8,253 6%Commissions and fees 2,872 3,153 3,149 3,549 3,998 3,829 3,969 26% 9,174 11,796 29%Principal transactions 1,770 1,272 954 1,164 1,723 1,435 1,547 62% 3,996 4,705 18%Asset management and administration fees 955 1,003 1,056 1,150 1,284 1,332 1,331 26% 3,014 3,947 31%Realized gains (losses) from sales of investments 53 188 35 281 (169) 280 507 NM 276 618 124%Other income 1,043 1,141 1,066 810 2,253 942 801 (25%) 3,250 3,996 23%
Total revenues 20,521 20,436 20,097 20,951 23,708 23,695 25,074 25% 61,054 72,477 19%Interest expense 6,451 6,056 6,076 6,185 6,724 7,791 8,737 44% 18,583 23,252 25%
Total revenues, net of interest expense 14,070 14,380 14,021 14,766 16,984 15,904 16,337 17% 42,471 49,225 16%
Provisions for Benefits, Claims, and Credit LossesPolicyholder benefits and claims 2,048 2,151 2,258 2,214 2,251 2,307 2,373 5% 6,457 6,931 7%Provision for credit losses 729 790 632 686 751 711 633 - 2,151 2,095 (3%)
Total provisions for benefits, claims, and credit losses 2,777 2,941 2,890 2,900 3,002 3,018 3,006 4% 8,608 9,026 5%
Operating ExpensesNon-insurance compensation and benefits 3,755 3,615 3,531 3,635 4,125 4,188 4,332 23% 10,901 12,645 16%Insurance underwriting, acquisition and operating 841 817 786 909 848 800 788 - 2,444 2,436 -Restructuring-related items (130) 47 22 (27) 20 3 36 64% (61) 59 NMOther operating 2,855 3,045 2,922 3,158 3,333 3,251 3,323 14% 8,822 9,907 12%
Total operating expenses 7,321 7,524 7,261 7,675 8,326 8,242 8,479 17% 22,106 25,047 13%Income before Income Taxes, Minority Interest and
Cumulative Effect of Accounting Changes 3,972 3,915 3,870 4,191 5,656 4,644 4,852 25% 11,757 15,152 29%Provision for income taxes 1,423 1,402 1,379 1,499 2,011 1,619 1,751 27% 4,204 5,381 28%Minority interest, net of income taxes 60 65 56 70 55 20 13 (77%) 181 88 (51%)Income before Cumulative Effect of Accounting
Changes 2,489 2,448 2,435 2,622 3,590 3,005 3,088 27% 7,372 9,683 31%Cumulative effect of accounting changes (127) - - - - - - - (127) - NM
Net Income 2,362$ 2,448$ 2,435$ 2,622$ 3,590$ 3,005$ 3,088$ 27% 7,245$ 9,683$ 34%
NM - Not meaningful
Page 22
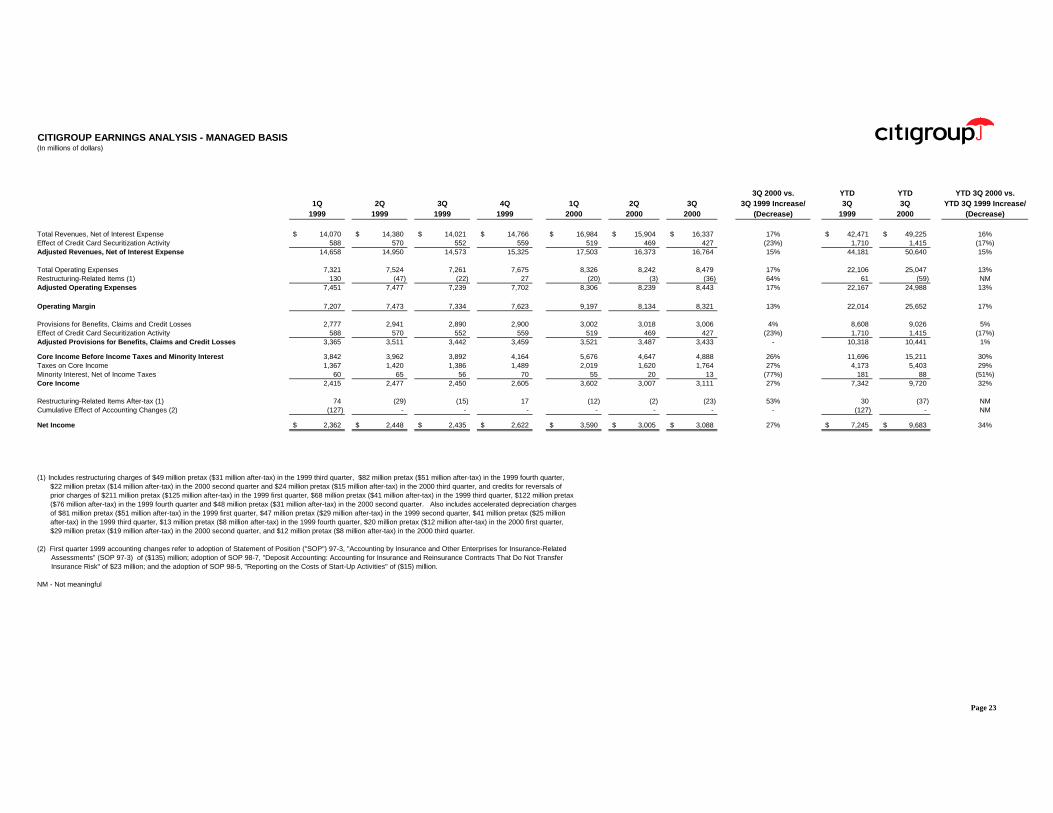
CITIGROUP EARNINGS ANALYSIS - MANAGED BASIS(In millions of dollars)
3Q 2000 vs. YTD YTD YTD 3Q 2000 vs.1Q 2Q 3Q 4Q 1Q 2Q 3Q 3Q 1999 Increase/ 3Q 3Q YTD 3Q 1999 Increase/
1999 1999 1999 1999 2000 2000 2000 (Decrease) 1999 2000 (Decrease)
Total Revenues, Net of Interest Expense 14,070$ 14,380$ 14,021$ 14,766$ 16,984$ 15,904$ 16,337$ 17% 42,471$ 49,225$ 16%Effect of Credit Card Securitization Activity 588 570 552 559 519 469 427 (23%) 1,710 1,415 (17%)Adjusted Revenues, Net of Interest Expense 14,658 14,950 14,573 15,325 17,503 16,373 16,764 15% 44,181 50,640 15%
Total Operating Expenses 7,321 7,524 7,261 7,675 8,326 8,242 8,479 17% 22,106 25,047 13%Restructuring-Related Items (1) 130 (47) (22) 27 (20) (3) (36) 64% 61 (59) NMAdjusted Operating Expenses 7,451 7,477 7,239 7,702 8,306 8,239 8,443 17% 22,167 24,988 13%
Operating Margin 7,207 7,473 7,334 7,623 9,197 8,134 8,321 13% 22,014 25,652 17%
Provisions for Benefits, Claims and Credit Losses 2,777 2,941 2,890 2,900 3,002 3,018 3,006 4% 8,608 9,026 5%Effect of Credit Card Securitization Activity 588 570 552 559 519 469 427 (23%) 1,710 1,415 (17%)Adjusted Provisions for Benefits, Claims and Credit Losses 3,365 3,511 3,442 3,459 3,521 3,487 3,433 - 10,318 10,441 1%
Core Income Before Income Taxes and Minority Interest 3,842 3,962 3,892 4,164 5,676 4,647 4,888 26% 11,696 15,211 30%Taxes on Core Income 1,367 1,420 1,386 1,489 2,019 1,620 1,764 27% 4,173 5,403 29%Minority Interest, Net of Income Taxes 60 65 56 70 55 20 13 (77%) 181 88 (51%)Core Income 2,415 2,477 2,450 2,605 3,602 3,007 3,111 27% 7,342 9,720 32%
Restructuring-Related Items After-tax (1) 74 (29) (15) 17 (12) (2) (23) 53% 30 (37) NMCumulative Effect of Accounting Changes (2) (127) - - - - - - - (127) - NM
Net Income 2,362$ 2,448$ 2,435$ 2,622$ 3,590$ 3,005$ 3,088$ 27% 7,245$ 9,683$ 34%
(1) Includes restructuring charges of $49 million pretax ($31 million after-tax) in the 1999 third quarter, $82 million pretax ($51 million after-tax) in the 1999 fourth quarter,$22 million pretax ($14 million after-tax) in the 2000 second quarter and $24 million pretax ($15 million after-tax) in the 2000 third quarter, and credits for reversals ofprior charges of $211 million pretax ($125 million after-tax) in the 1999 first quarter, $68 million pretax ($41 million after-tax) in the 1999 third quarter, $122 million pretax($76 million after-tax) in the 1999 fourth quarter and $48 million pretax ($31 million after-tax) in the 2000 second quarter. Also includes accelerated depreciation chargesof $81 million pretax ($51 million after-tax) in the 1999 first quarter, $47 million pretax ($29 million after-tax) in the 1999 second quarter, $41 million pretax ($25 millionafter-tax) in the 1999 third quarter, $13 million pretax ($8 million after-tax) in the 1999 fourth quarter, $20 million pretax ($12 million after-tax) in the 2000 first quarter,$29 million pretax ($19 million after-tax) in the 2000 second quarter, and $12 million pretax ($8 million after-tax) in the 2000 third quarter.
(2) First quarter 1999 accounting changes refer to adoption of Statement of Position ("SOP") 97-3, "Accounting by Insurance and Other Enterprises for Insurance-RelatedAssessments" (SOP 97-3) of ($135) million; adoption of SOP 98-7, "Deposit Accounting: Accounting for Insurance and Reinsurance Contracts That Do Not TransferInsurance Risk" of $23 million; and the adoption of SOP 98-5, "Reporting on the Costs of Start-Up Activities" of ($15) million.
NM - Not meaningful
Page 23
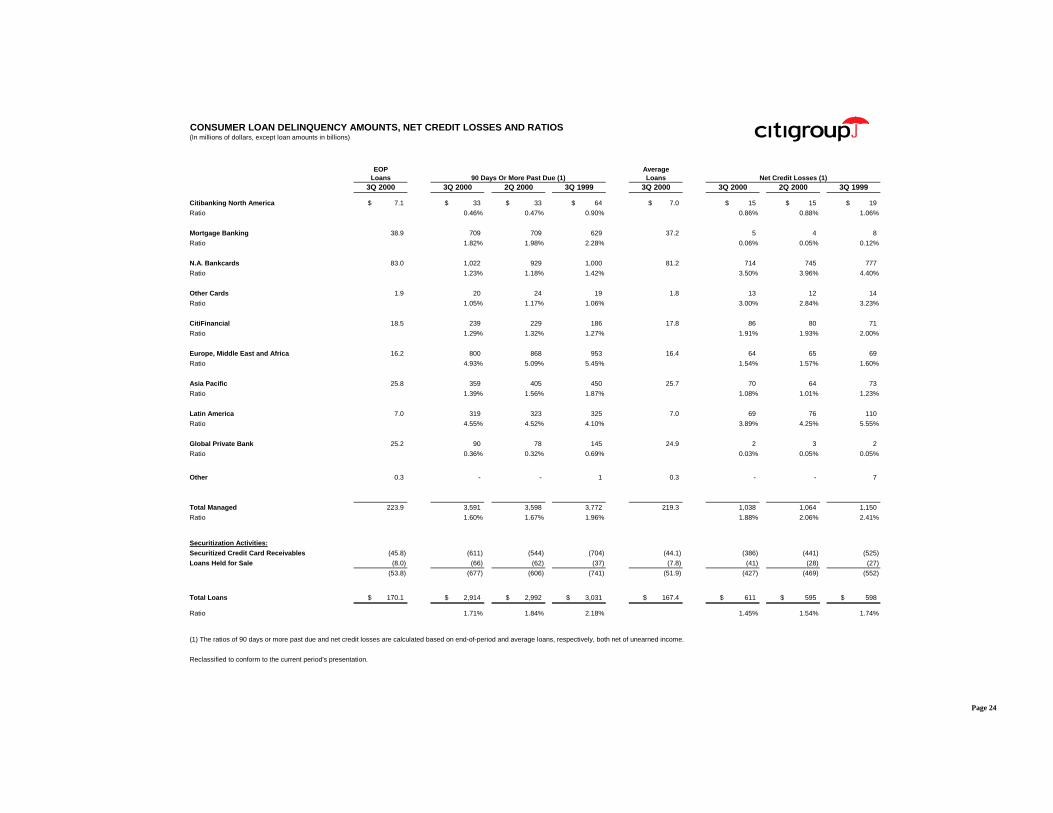
CONSUMER LOAN DELINQUENCY AMOUNTS, NET CREDIT LOSSES AND RATIOS(In millions of dollars, except loan amounts in billions)
EOP AverageLoans Loans
3Q 2000 3Q 2000 2Q 2000 3Q 1999 3Q 2000 3Q 2000 2Q 2000 3Q 1999
Citibanking North America 7.1$ 33$ 33$ 64$ 7.0$ 15$ 15$ 19$
Ratio 0.46% 0.47% 0.90% 0.86% 0.88% 1.06%
Mortgage Banking 38.9 709 709 629 37.2 5 4 8
Ratio 1.82% 1.98% 2.28% 0.06% 0.05% 0.12%
N.A. Bankcards 83.0 1,022 929 1,000 81.2 714 745 777
Ratio 1.23% 1.18% 1.42% 3.50% 3.96% 4.40%
Other Cards 1.9 20 24 19 1.8 13 12 14
Ratio 1.05% 1.17% 1.06% 3.00% 2.84% 3.23%
CitiFinancial 18.5 239 229 186 17.8 86 80 71
Ratio 1.29% 1.32% 1.27% 1.91% 1.93% 2.00%
Europe, Middle East and Africa 16.2 800 868 953 16.4 64 65 69
Ratio 4.93% 5.09% 5.45% 1.54% 1.57% 1.60%
Asia Pacific 25.8 359 405 450 25.7 70 64 73
Ratio 1.39% 1.56% 1.87% 1.08% 1.01% 1.23%
Latin America 7.0 319 323 325 7.0 69 76 110
Ratio 4.55% 4.52% 4.10% 3.89% 4.25% 5.55%
Global Private Bank 25.2 90 78 145 24.9 2 3 2
Ratio 0.36% 0.32% 0.69% 0.03% 0.05% 0.05%
Other 0.3 - - 1 0.3 - - 7
Total Managed 223.9 3,591 3,598 3,772 219.3 1,038 1,064 1,150
Ratio 1.60% 1.67% 1.96% 1.88% 2.06% 2.41%
Securitization Activities:Securitized Credit Card Receivables (45.8) (611) (544) (704) (44.1) (386) (441) (525)
Loans Held for Sale (8.0) (66) (62) (37) (7.8) (41) (28) (27)
(53.8) (677) (606) (741) (51.9) (427) (469) (552)
Total Loans 170.1$ 2,914$ 2,992$ 3,031$ 167.4$ 611$ 595$ 598$
Ratio 1.71% 1.84% 2.18% 1.45% 1.54% 1.74%
(1) The ratios of 90 days or more past due and net credit losses are calculated based on end-of-period and average loans, respectively, both net of unearned income.
Reclassified to conform to the current period's presentation.
90 Days Or More Past Due (1) Net Credit Losses (1)
Page 24
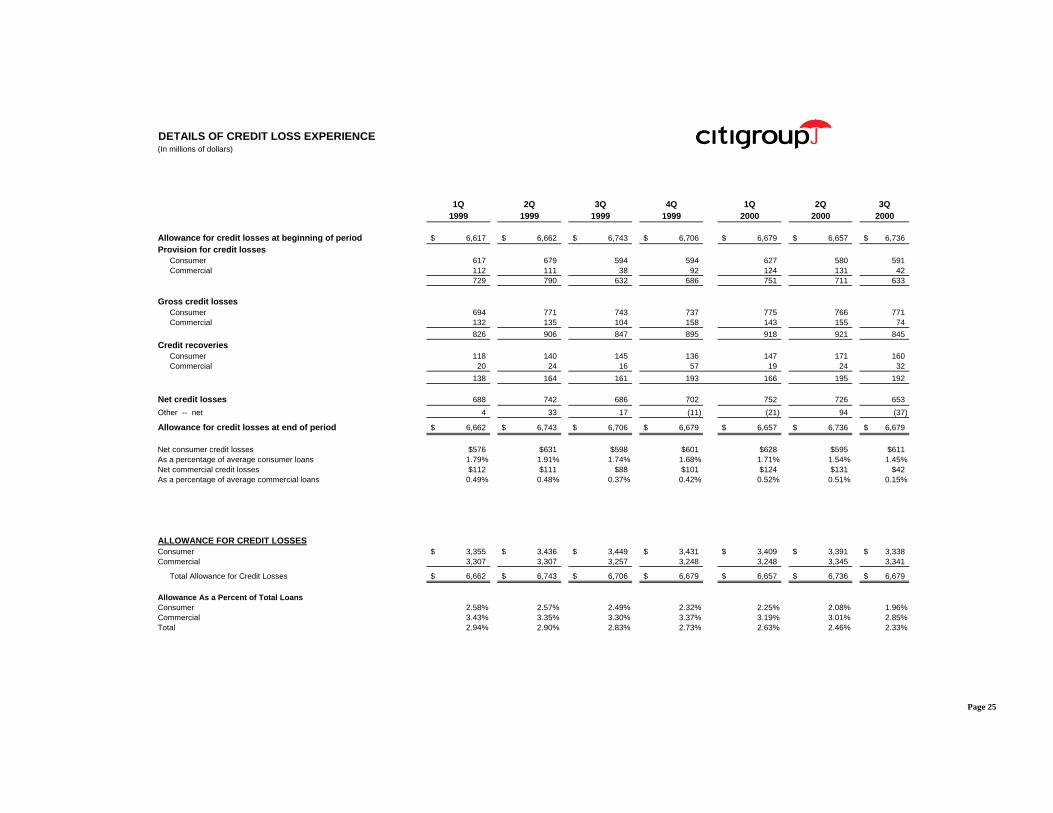
DETAILS OF CREDIT LOSS EXPERIENCE(In millions of dollars)
1Q 2Q 3Q 4Q 1Q 2Q 3Q1999 1999 1999 1999 2000 2000 2000
Allowance for credit losses at beginning of period 6,617$ 6,662$ 6,743$ 6,706$ 6,679$ 6,657$ 6,736$
Provision for credit lossesConsumer 617 679 594 594 627 580 591Commercial 112 111 38 92 124 131 42
729 790 632 686 751 711 633
Gross credit lossesConsumer 694 771 743 737 775 766 771Commercial 132 135 104 158 143 155 74
826 906 847 895 918 921 845Credit recoveries
Consumer 118 140 145 136 147 171 160Commercial 20 24 16 57 19 24 32
138 164 161 193 166 195 192
Net credit losses 688 742 686 702 752 726 653
Other -- net 4 33 17 (11) (21) 94 (37)
Allowance for credit losses at end of period 6,662$ 6,743$ 6,706$ 6,679$ 6,657$ 6,736$ 6,679$
Net consumer credit losses $576 $631 $598 $601 $628 $595 $611As a percentage of average consumer loans 1.79% 1.91% 1.74% 1.68% 1.71% 1.54% 1.45%Net commercial credit losses $112 $111 $88 $101 $124 $131 $42As a percentage of average commercial loans 0.49% 0.48% 0.37% 0.42% 0.52% 0.51% 0.15%
ALLOWANCE FOR CREDIT LOSSESConsumer 3,355$ 3,436$ 3,449$ 3,431$ 3,409$ 3,391$ 3,338$Commercial 3,307 3,307 3,257 3,248 3,248 3,345 3,341
Total Allowance for Credit Losses 6,662$ 6,743$ 6,706$ 6,679$ 6,657$ 6,736$ 6,679$
Allowance As a Percent of Total LoansConsumer 2.58% 2.57% 2.49% 2.32% 2.25% 2.08% 1.96%Commercial 3.43% 3.35% 3.30% 3.37% 3.19% 3.01% 2.85%Total 2.94% 2.90% 2.83% 2.73% 2.63% 2.46% 2.33%
Page 25
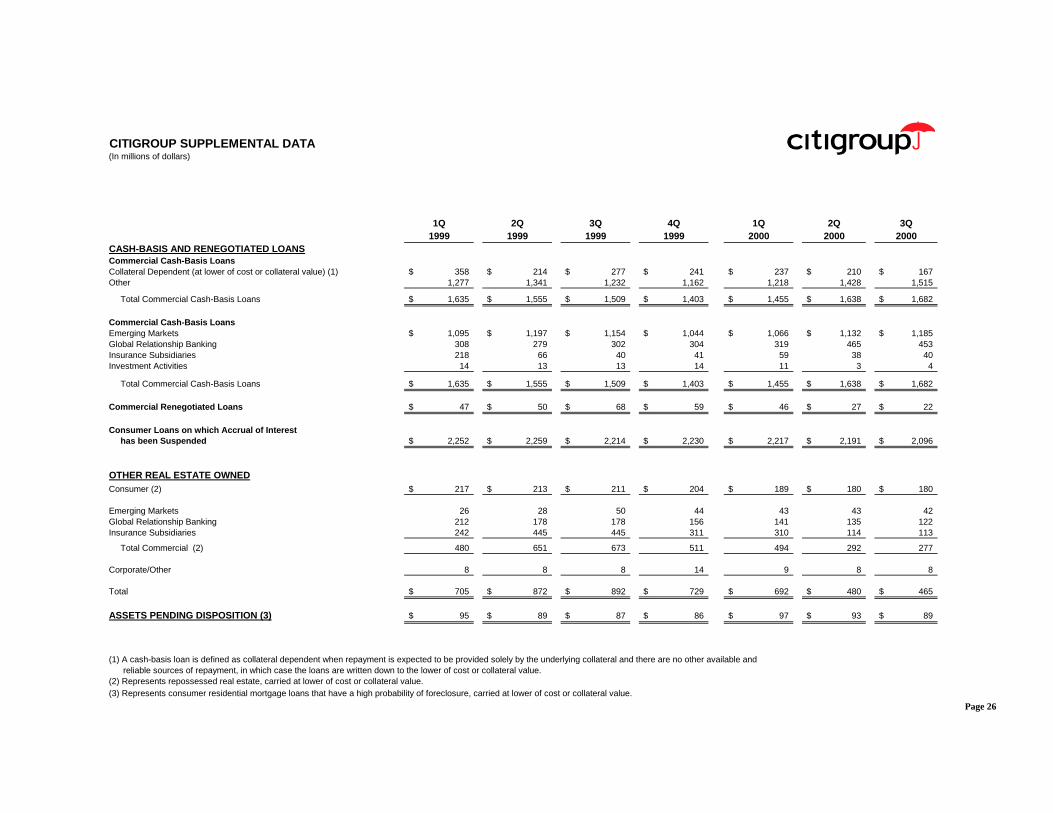
CITIGROUP SUPPLEMENTAL DATA(In millions of dollars)
1Q 2Q 3Q 4Q 1Q 2Q 3Q1999 1999 1999 1999 2000 2000 2000
CASH-BASIS AND RENEGOTIATED LOANSCommercial Cash-Basis LoansCollateral Dependent (at lower of cost or collateral value) (1) 358$ 214$ 277$ 241$ 237$ 210$ 167$Other 1,277 1,341 1,232 1,162 1,218 1,428 1,515
Total Commercial Cash-Basis Loans 1,635$ 1,555$ 1,509$ 1,403$ 1,455$ 1,638$ 1,682$
Commercial Cash-Basis LoansEmerging Markets 1,095$ 1,197$ 1,154$ 1,044$ 1,066$ 1,132$ 1,185$Global Relationship Banking 308 279 302 304 319 465 453Insurance Subsidiaries 218 66 40 41 59 38 40Investment Activities 14 13 13 14 11 3 4
Total Commercial Cash-Basis Loans 1,635$ 1,555$ 1,509$ 1,403$ 1,455$ 1,638$ 1,682$
Commercial Renegotiated Loans 47$ 50$ 68$ 59$ 46$ 27$ 22$
Consumer Loans on which Accrual of Interesthas been Suspended 2,252$ 2,259$ 2,214$ 2,230$ 2,217$ 2,191$ 2,096$
OTHER REAL ESTATE OWNEDConsumer (2) 217$ 213$ 211$ 204$ 189$ 180$ 180$
Emerging Markets 26 28 50 44 43 43 42Global Relationship Banking 212 178 178 156 141 135 122Insurance Subsidiaries 242 445 445 311 310 114 113
Total Commercial (2) 480 651 673 511 494 292 277
Corporate/Other 8 8 8 14 9 8 8
Total 705$ 872$ 892$ 729$ 692$ 480$ 465$
ASSETS PENDING DISPOSITION (3) 95$ 89$ 87$ 86$ 97$ 93$ 89$
(1) A cash-basis loan is defined as collateral dependent when repayment is expected to be provided solely by the underlying collateral and there are no other available andreliable sources of repayment, in which case the loans are written down to the lower of cost or collateral value.
(2) Represents repossessed real estate, carried at lower of cost or collateral value.(3) Represents consumer residential mortgage loans that have a high probability of foreclosure, carried at lower of cost or collateral value.
Page 26
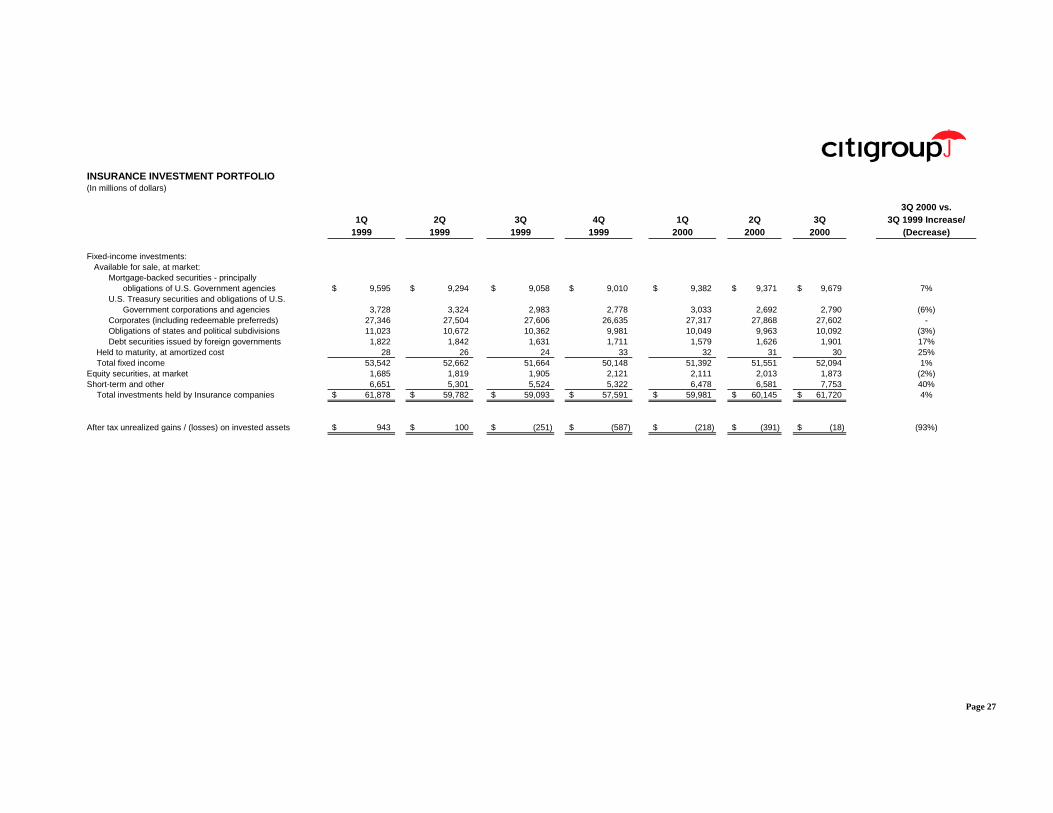
INSURANCE INVESTMENT PORTFOLIO(In millions of dollars)
3Q 2000 vs.1Q 2Q 3Q 4Q 1Q 2Q 3Q 3Q 1999 Increase/
1999 1999 1999 1999 2000 2000 2000 (Decrease)
Fixed-income investments:Available for sale, at market:
Mortgage-backed securities - principallyobligations of U.S. Government agencies 9,595$ 9,294$ 9,058$ 9,010$ 9,382$ 9,371$ 9,679$ 7%
U.S. Treasury securities and obligations of U.S.Government corporations and agencies 3,728 3,324 2,983 2,778 3,033 2,692 2,790 (6%)
Corporates (including redeemable preferreds) 27,346 27,504 27,606 26,635 27,317 27,868 27,602 -Obligations of states and political subdivisions 11,023 10,672 10,362 9,981 10,049 9,963 10,092 (3%)Debt securities issued by foreign governments 1,822 1,842 1,631 1,711 1,579 1,626 1,901 17%
Held to maturity, at amortized cost 28 26 24 33 32 31 30 25%Total fixed income 53,542 52,662 51,664 50,148 51,392 51,551 52,094 1%
Equity securities, at market 1,685 1,819 1,905 2,121 2,111 2,013 1,873 (2%)Short-term and other 6,651 5,301 5,524 5,322 6,478 6,581 7,753 40%
Total investments held by Insurance companies 61,878$ 59,782$ 59,093$ 57,591$ 59,981$ 60,145$ 61,720$ 4%
After tax unrealized gains / (losses) on invested assets 943$ 100$ (251)$ (587)$ (218)$ (391)$ (18)$ (93%)
Page 27

GLOBAL CONSUMERGLOBAL CARDS SUPPLEMENTAL DATA (1)
(In millions of dollars)
3Q 2000 vs. YTD YTD YTD 3Q 2000 vs.1Q 2Q 3Q 4Q 1Q 2Q 3Q 3Q 1999 Increase/ 3Q 3Q YTD 3Q 1999 Increase/
1999 1999 1999 1999 2000 2000 2000 (Decrease) 1999 2000 (Decrease)
Adjusted Revenues, Net of Interest Expense 2,418$ 2,422$ 2,460$ 2,559$ 2,539$ 2,550$ 2,623$ 7% 7,300$ 7,712$ 6%Adjusted Operating Expenses 964 963 975 997 1,032 1,025 1,048 7% 2,902 3,105 7%Adjusted Provision for Loan Losses (2) 925 938 914 898 898 848 822 (10%) 2,777 2,568 (8%)
Core Income Before Taxes 529 521 571 664 609 677 753 32% 1,621 2,039 26%Income Taxes 195 191 211 242 224 247 277 31% 597 748 25%
Core Income 334$ 330$ 360$ 422$ 385$ 430$ 476$ 32% 1,024$ 1,291$ 26%
Managed Average Assets (in billions of dollars) 81$ 82$ 84$ 85$ 88$ 92$ 97$ 15% 82$ 92$ 12%
Return on Managed Assets 1.67% 1.61% 1.70% 1.97% 1.76% 1.88% 1.95% 1.67% 1.87%
KEY INDICATORS(in billions of dollars)
End of Period Managed Receivables 80.1$ 81.4$ 81.8$ 85.7$ 85.5$ 91.6$ 95.6$ 17%Total EOP Open Accounts (in millions) 52.6 52.4 52.6 52.7 53.5 55.1 56.8 8%Total Sales 46.3$ 51.2$ 51.8$ 55.2$ 54.0$ 61.1$ 60.6$ 17%Coincident Net Credit Loss Ratio % 4.74% 4.66% 4.45% 4.36% 4.31% 3.90% 3.51%Loans 90+ Days Past Due % 1.57% 1.48% 1.49% 1.52% 1.53% 1.25% 1.27%
GEOGRAPHIC DISTRIBUTIONCore Income
North America 277$ 280$ 301$ 324$ 296$ 308$ 369$ 23% 858$ 973$ 13%International 57 50 59 98 89 122 107 81% 166 318 92%
Total 334$ 330$ 360$ 422$ 385$ 430$ 476$ 32% 1,024$ 1,291$ 26%
Average LoansNorth America 69.2$ 71.2$ 71.7$ 72.3$ 74.3$ 77.5$ 83.0$ 16% 70.7$ 78.3$ 11%International 8.6 8.7 9.0 9.2 9.6 9.9 9.9 10% 8.8 9.8 11%
Total 77.8$ 79.9$ 80.7$ 81.5$ 83.9$ 87.4$ 92.9$ 15% 79.5$ 88.1$ 11%
Total EOP Open Accounts (in millions)North America 42.8 42.4 42.0 42.1 42.3 43.7 45.0 7%International 9.8 10.0 10.6 10.6 11.2 11.4 11.8 11%
Total 52.6 52.4 52.6 52.7 53.5 55.1 56.8 8%
Total SalesNorth America 39.6$ 44.0$ 44.3$ 47.2$ 45.7$ 52.1$ 51.3$ 16% 127.9$ 149.1$ 17%International 6.7 7.2 7.5 8.0 8.3 9.0 9.3 24% 21.4 26.6 24%
Total 46.3$ 51.2$ 51.8$ 55.2$ 54.0$ 61.1$ 60.6$ 17% 149.3$ 175.7$ 18%
Net Credit Losses (in millions of dollars):North America 798$ 818$ 791$ 800$ 798$ 757$ 727$ (8%) 2,407$ 2,282$ (5%)International 111 110 115 95 101 90 92 (20%) 336 283 (16%)
Total 909$ 928$ 906$ 895$ 899$ 847$ 819$ (10%) 2,743$ 2,565$ (6%)
(1) Worldwide Cards consists of the Cards business segment and card operations included within the International consumer segments.
(2) On a managed basis.
Reclassified to conform to the current period's presentation.
Page 28
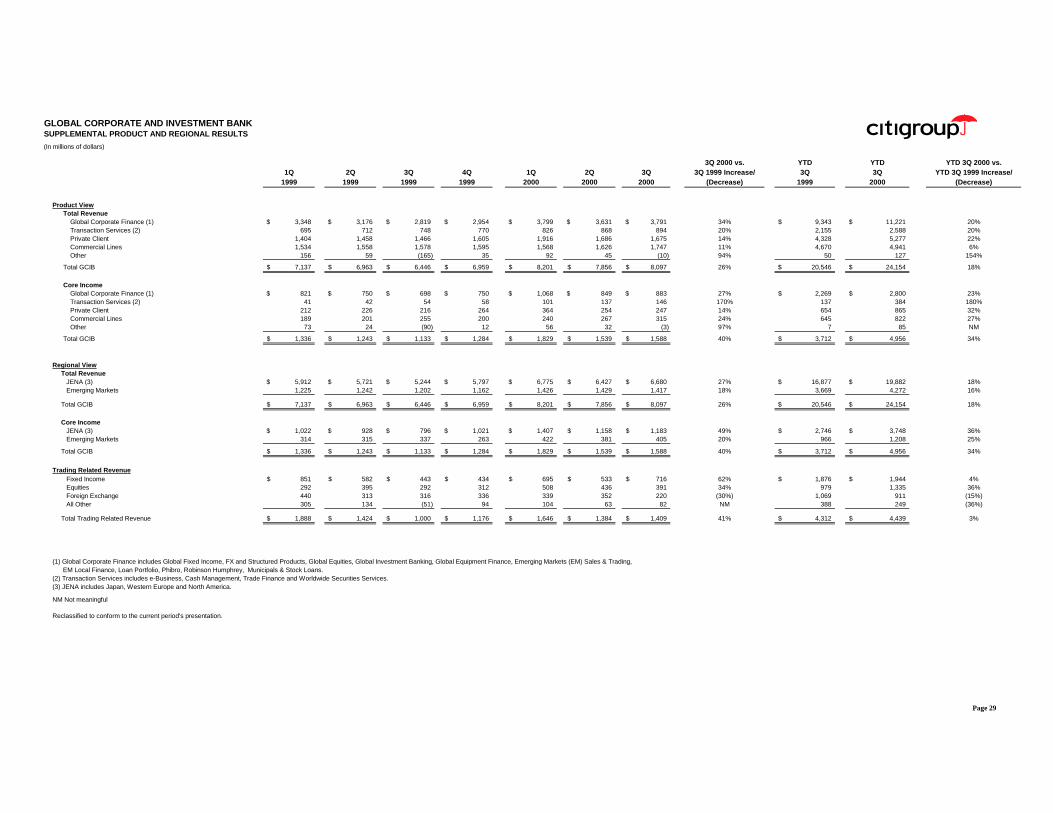
GLOBAL CORPORATE AND INVESTMENT BANKSUPPLEMENTAL PRODUCT AND REGIONAL RESULTS
(In millions of dollars)
3Q 2000 vs. YTD YTD YTD 3Q 2000 vs.1Q 2Q 3Q 4Q 1Q 2Q 3Q 3Q 1999 Increase/ 3Q 3Q YTD 3Q 1999 Increase/
1999 1999 1999 1999 2000 2000 2000 (Decrease) 1999 2000 (Decrease)
Product ViewTotal Revenue
Global Corporate Finance (1) 3,348$ 3,176$ 2,819$ 2,954$ 3,799$ 3,631$ 3,791$ 34% 9,343$ 11,221$ 20%Transaction Services (2) 695 712 748 770 826 868 894 20% 2,155 2,588 20%Private Client 1,404 1,458 1,466 1,605 1,916 1,686 1,675 14% 4,328 5,277 22%Commercial Lines 1,534 1,558 1,578 1,595 1,568 1,626 1,747 11% 4,670 4,941 6%Other 156 59 (165) 35 92 45 (10) 94% 50 127 154%
Total GCIB 7,137$ 6,963$ 6,446$ 6,959$ 8,201$ 7,856$ 8,097$ 26% 20,546$ 24,154$ 18%
Core IncomeGlobal Corporate Finance (1) 821$ 750$ 698$ 750$ 1,068$ 849$ 883$ 27% 2,269$ 2,800$ 23%Transaction Services (2) 41 42 54 58 101 137 146 170% 137 384 180%Private Client 212 226 216 264 364 254 247 14% 654 865 32%Commercial Lines 189 201 255 200 240 267 315 24% 645 822 27%Other 73 24 (90) 12 56 32 (3) 97% 7 85 NM
Total GCIB 1,336$ 1,243$ 1,133$ 1,284$ 1,829$ 1,539$ 1,588$ 40% 3,712$ 4,956$ 34%
Regional ViewTotal Revenue
JENA (3) 5,912$ 5,721$ 5,244$ 5,797$ 6,775$ 6,427$ 6,680$ 27% 16,877$ 19,882$ 18%Emerging Markets 1,225 1,242 1,202 1,162 1,426 1,429 1,417 18% 3,669 4,272 16%
Total GCIB 7,137$ 6,963$ 6,446$ 6,959$ 8,201$ 7,856$ 8,097$ 26% 20,546$ 24,154$ 18%
Core IncomeJENA (3) 1,022$ 928$ 796$ 1,021$ 1,407$ 1,158$ 1,183$ 49% 2,746$ 3,748$ 36%Emerging Markets 314 315 337 263 422 381 405 20% 966 1,208 25%
Total GCIB 1,336$ 1,243$ 1,133$ 1,284$ 1,829$ 1,539$ 1,588$ 40% 3,712$ 4,956$ 34%
Trading Related RevenueFixed Income 851$ 582$ 443$ 434$ 695$ 533$ 716$ 62% 1,876$ 1,944$ 4%Equities 292 395 292 312 508 436 391 34% 979 1,335 36%Foreign Exchange 440 313 316 336 339 352 220 (30%) 1,069 911 (15%)All Other 305 134 (51) 94 104 63 82 NM 388 249 (36%)
Total Trading Related Revenue 1,888$ 1,424$ 1,000$ 1,176$ 1,646$ 1,384$ 1,409$ 41% 4,312$ 4,439$ 3%
(1) Global Corporate Finance includes Global Fixed Income, FX and Structured Products, Global Equities, Global Investment Banking, Global Equipment Finance, Emerging Markets (EM) Sales & Trading,EM Local Finance, Loan Portfolio, Phibro, Robinson Humphrey, Municipals & Stock Loans.
(2) Transaction Services includes e-Business, Cash Management, Trade Finance and Worldwide Securities Services.(3) JENA includes Japan, Western Europe and North America.
NM Not meaningful
Reclassified to conform to the current period's presentation.
Page 29
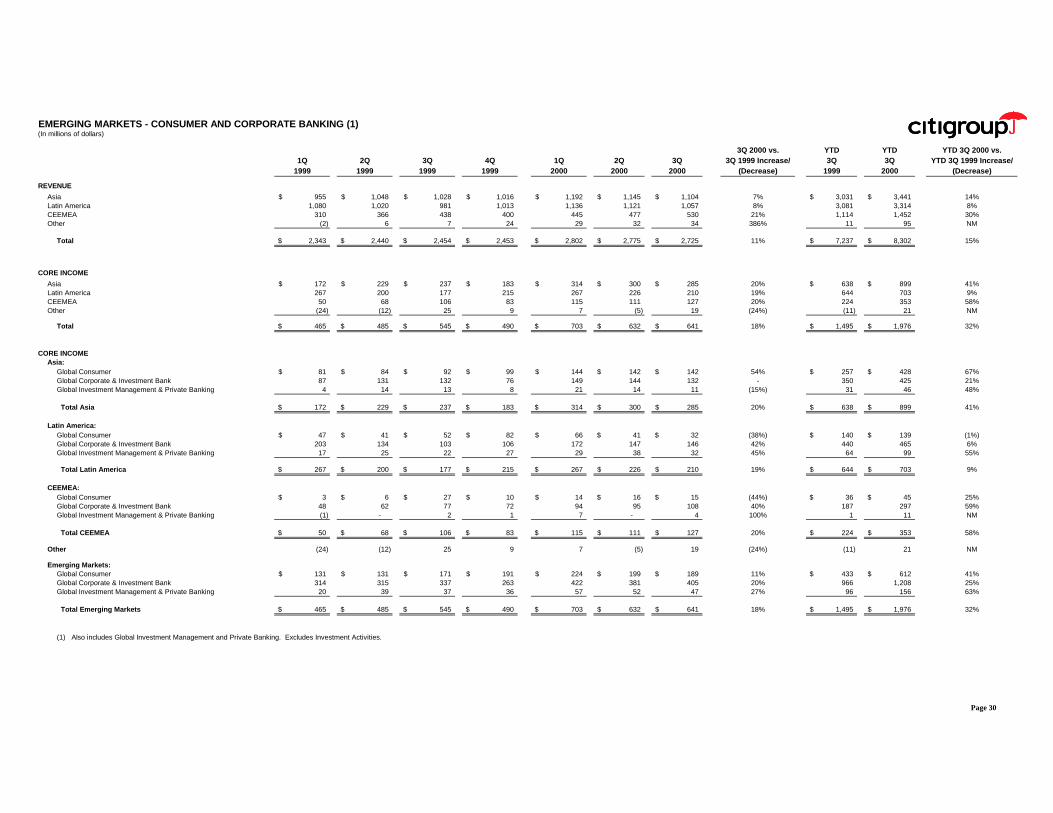
EMERGING MARKETS - CONSUMER AND CORPORATE BANKING (1)(In millions of dollars)
3Q 2000 vs. YTD YTD YTD 3Q 2000 vs.1Q 2Q 3Q 4Q 1Q 2Q 3Q 3Q 1999 Increase/ 3Q 3Q YTD 3Q 1999 Increase/
1999 1999 1999 1999 2000 2000 2000 (Decrease) 1999 2000 (Decrease)
REVENUE
Asia 955$ 1,048$ 1,028$ 1,016$ 1,192$ 1,145$ 1,104$ 7% 3,031$ 3,441$ 14%Latin America 1,080 1,020 981 1,013 1,136 1,121 1,057 8% 3,081 3,314 8%CEEMEA 310 366 438 400 445 477 530 21% 1,114 1,452 30%Other (2) 6 7 24 29 32 34 386% 11 95 NM
Total 2,343$ 2,440$ 2,454$ 2,453$ 2,802$ 2,775$ 2,725$ 11% 7,237$ 8,302$ 15%
CORE INCOME
Asia 172$ 229$ 237$ 183$ 314$ 300$ 285$ 20% 638$ 899$ 41%Latin America 267 200 177 215 267 226 210 19% 644 703 9%CEEMEA 50 68 106 83 115 111 127 20% 224 353 58%Other (24) (12) 25 9 7 (5) 19 (24%) (11) 21 NM
Total 465$ 485$ 545$ 490$ 703$ 632$ 641$ 18% 1,495$ 1,976$ 32%
CORE INCOMEAsia:
Global Consumer 81$ 84$ 92$ 99$ 144$ 142$ 142$ 54% 257$ 428$ 67%Global Corporate & Investment Bank 87 131 132 76 149 144 132 - 350 425 21%Global Investment Management & Private Banking 4 14 13 8 21 14 11 (15%) 31 46 48%
Total Asia 172$ 229$ 237$ 183$ 314$ 300$ 285$ 20% 638$ 899$ 41%
Latin America:Global Consumer 47$ 41$ 52$ 82$ 66$ 41$ 32$ (38%) 140$ 139$ (1%)Global Corporate & Investment Bank 203 134 103 106 172 147 146 42% 440 465 6%Global Investment Management & Private Banking 17 25 22 27 29 38 32 45% 64 99 55%
Total Latin America 267$ 200$ 177$ 215$ 267$ 226$ 210$ 19% 644$ 703$ 9%
CEEMEA:Global Consumer 3$ 6$ 27$ 10$ 14$ 16$ 15$ (44%) 36$ 45$ 25%Global Corporate & Investment Bank 48 62 77 72 94 95 108 40% 187 297 59%Global Investment Management & Private Banking (1) - 2 1 7 - 4 100% 1 11 NM
Total CEEMEA 50$ 68$ 106$ 83$ 115$ 111$ 127$ 20% 224$ 353$ 58%
Other (24) (12) 25 9 7 (5) 19 (24%) (11) 21 NM
Emerging Markets:Global Consumer 131$ 131$ 171$ 191$ 224$ 199$ 189$ 11% 433$ 612$ 41%Global Corporate & Investment Bank 314 315 337 263 422 381 405 20% 966 1,208 25%Global Investment Management & Private Banking 20 39 37 36 57 52 47 27% 96 156 63%
Total Emerging Markets 465$ 485$ 545$ 490$ 703$ 632$ 641$ 18% 1,495$ 1,976$ 32%
(1) Also includes Global Investment Management and Private Banking. Excludes Investment Activities.
Page 30
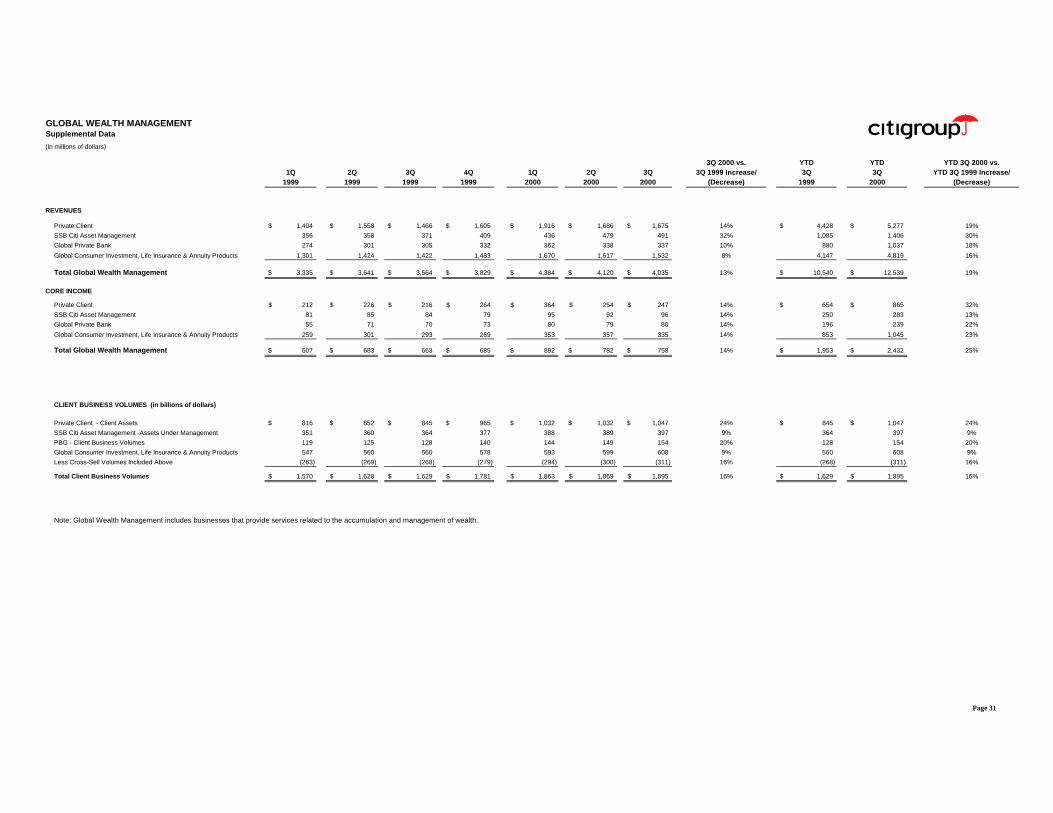
GLOBAL WEALTH MANAGEMENTSupplemental Data
(In millions of dollars)
3Q 2000 vs. YTD YTD YTD 3Q 2000 vs.1Q 2Q 3Q 4Q 1Q 2Q 3Q 3Q 1999 Increase/ 3Q 3Q YTD 3Q 1999 Increase/
1999 1999 1999 1999 2000 2000 2000 (Decrease) 1999 2000 (Decrease)
REVENUES
Private Client 1,404$ 1,558$ 1,466$ 1,605$ 1,916$ 1,686$ 1,675$ 14% 4,428$ 5,277$ 19%
SSB Citi Asset Management 356 358 371 409 436 479 491 32% 1,085 1,406 30%
Global Private Bank 274 301 305 332 362 338 337 10% 880 1,037 18%
Global Consumer Investment, Life Insurance & Annuity Products 1,301 1,424 1,422 1,483 1,670 1,617 1,532 8% 4,147 4,819 16%
Total Global Wealth Management 3,335$ 3,641$ 3,564$ 3,829$ 4,384$ 4,120$ 4,035$ 13% 10,540$ 12,539$ 19%
CORE INCOME
Private Client 212$ 226$ 216$ 264$ 364$ 254$ 247$ 14% 654$ 865$ 32%
SSB Citi Asset Management 81 85 84 79 95 92 96 14% 250 283 13%
Global Private Bank 55 71 70 73 80 79 80 14% 196 239 22%
Global Consumer Investment, Life Insurance & Annuity Products 259 301 293 269 353 357 335 14% 853 1,045 23%
Total Global Wealth Management 607$ 683$ 663$ 685$ 892$ 782$ 758$ 14% 1,953$ 2,432$ 25%
CLIENT BUSINESS VOLUMES (in billions of dollars)
Private Client - Client Assets 816$ 852$ 845$ 965$ 1,032$ 1,032$ 1,047$ 24% 845$ 1,047$ 24%
SSB Citi Asset Management -Assets Under Management 351 360 364 377 388 389 397 9% 364 397 9%
PBG - Client Business Volumes 119 125 128 140 144 149 154 20% 128 154 20%
Global Consumer Investment, Life Insurance & Annuity Products 547 560 560 578 593 599 608 9% 560 608 9%
Less Cross-Sell Volumes Included Above (263) (269) (268) (279) (294) (300) (311) 16% (268) (311) 16%
Total Client Business Volumes 1,570$ 1,628$ 1,629$ 1,781$ 1,863$ 1,869$ 1,895$ 16% 1,629$ 1,895$ 16%
Note: Global Wealth Management includes businesses that provide services related to the accumulation and management of wealth.
Page 31
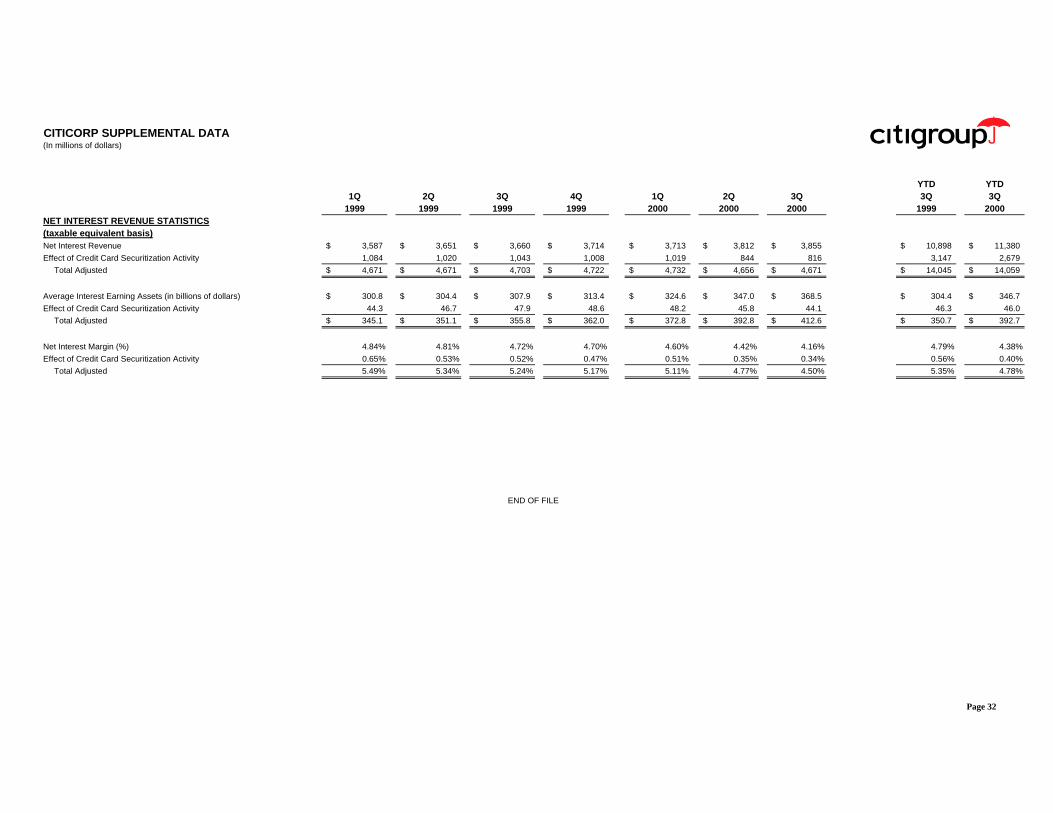
CITICORP SUPPLEMENTAL DATA(In millions of dollars)
YTD YTD1Q 2Q 3Q 4Q 1Q 2Q 3Q 3Q 3Q
1999 1999 1999 1999 2000 2000 2000 1999 2000NET INTEREST REVENUE STATISTICS(taxable equivalent basis)Net Interest Revenue 3,587$ 3,651$ 3,660$ 3,714$ 3,713$ 3,812$ 3,855$ 10,898$ 11,380$
Effect of Credit Card Securitization Activity 1,084 1,020 1,043 1,008 1,019 844 816 3,147 2,679
Total Adjusted 4,671$ 4,671$ 4,703$ 4,722$ 4,732$ 4,656$ 4,671$ 14,045$ 14,059$
Average Interest Earning Assets (in billions of dollars) 300.8$ 304.4$ 307.9$ 313.4$ 324.6$ 347.0$ 368.5$ 304.4$ 346.7$
Effect of Credit Card Securitization Activity 44.3 46.7 47.9 48.6 48.2 45.8 44.1 46.3 46.0
Total Adjusted 345.1$ 351.1$ 355.8$ 362.0$ 372.8$ 392.8$ 412.6$ 350.7$ 392.7$
Net Interest Margin (%) 4.84% 4.81% 4.72% 4.70% 4.60% 4.42% 4.16% 4.79% 4.38%
Effect of Credit Card Securitization Activity 0.65% 0.53% 0.52% 0.47% 0.51% 0.35% 0.34% 0.56% 0.40%
Total Adjusted 5.49% 5.34% 5.24% 5.17% 5.11% 4.77% 4.50% 5.35% 4.78%
END OF FILE
Page 32