citigroup Financial Supplement
28
Second Quarter 2008 Earnings Review July 18, 2008 REVISED The earnings presentation deck originally posted on our web site had two inadvertent numerical errors on slide 9 (titled 2Q '08 Negatives) under the heading Consumer. This presentation has been revised to show corrected numbers of (1,993) for Net Credit Losses (YoY change) and (1,754) for Loan Loss Reserve Build (YoY change)
-
Upload
quarterlyearningsreports -
Category
Technology
-
view
216 -
download
0
Transcript of citigroup Financial Supplement
Second Quarter 2008 Earnings ReviewJuly 18, 2008
REVISEDThe earnings presentation deck originally posted on our web site had two inadvertent numerical
errors on slide 9 (titled 2Q '08 Negatives) under the heading Consumer.
This presentation has been revised to show corrected numbers of (1,993) for Net Credit
Losses (YoY change) and (1,754) for Loan Loss Reserve Build (YoY change)

1
($B, except EPS) 2Q’08 2Q’07 %
Net Interest Revenue $14.3 $11.4 26%Other Revenue 4.3 14.9 (71)
Net Revenues $18.7 $26.3 (29)%
Operating Expenses 15.9 14.7 9
Credit Losses, Claims & Benefits 7.2 2.7 NM
Pre-tax Income from Cont. Ops. $(4.5) $8.9 NM
Income Taxes and Minority Interest (2.3) 2.8 NM
Income from Cont. Ops. $(2.2) $6.1 NM
Net Income (2.5) 6.2 NM
Diluted EPS from Cont. Ops. (1) $(0.49) $1.23 NM
Diluted EPS (1) (0.54) 1.24 NM
Preferred Share Dividend $0.4 $0.0 NM
Return on Common Equity NM 20.1%
Summary Income Statement
(1) Diluted shares used in the diluted EPS calculation represent basic shares for the second quarter of 2008 due to the Net Loss. Using actual diluted shares would result in anti-dilution. 2Q’08: basic shares equal 5,287 million and diluted shares equal 5,800 million.Note: Totals may not sum due to rounding.

2
Sequential revenue improvement
Strong growth in revenue drivers
Net interest margin expansion
Moderating expense growth; sequential decline
Headcount reduction
Strong capital ratios; legacy asset reduction
New hires strengthen leadership team
2Q’08 Positives

3
Revenues
13.0
21.9 21.123.5 25.2 26.3
22.2
7.0
18.7
(7.2)(12.3)
(17.0)
(3.0)
2Q'06 3Q'06 4Q'06 1Q'07 2Q'07 3Q'07 4Q'07 1Q'08 2Q'08
25.2 24.0 25.825.3
1H’07$51.5B
1H’08 ex-marks$51.1B
GAAP revenues ($B) S&B revenue marks (1) ($B)
(1) For a list of S&B revenue marks please refer to page 25. Note: Totals may not sum due to rounding.

4
Key Revenue Drivers
Consumer (1) N.A. (2) 8% 9% 10% 9% 6%EMEA 36 47 48 47 24Latin America 43 39 39 34 22Asia 13 14 16 19 15
Corporate 23 27 24 19 3
Consumer (3) N.A. 19 16 9 5 3EMEA 30 47 47 49 19Latin America 18 17 20 21 8Asia 7 8 11 13 10
Transaction Services 24 33 35 32 15
N.A. Cards Purchase Sales (4) 5 6 8 4 --
Int’l Cards Purchase Sales (4) 31 36 37 41 25
Int’l Consumer Investment Sales 19 27 24 (14) (21)
Int’l Consumer Investment AUMs 27 28 24 14 5
GWM Client Fee-Based AUMs 40 38 27 15 (8)
% Year-over-Year 2Q’07 3Q’07 4Q’07 1Q’08 2Q’08
AverageLoans
AverageDeposits
Sales
(1) Consumer: comprised of Global Cards and Consumer Banking. (2) Managed basis.(3) Does not include Global Wealth Management deposits. (4) Includes cash advances.
AUMs
5
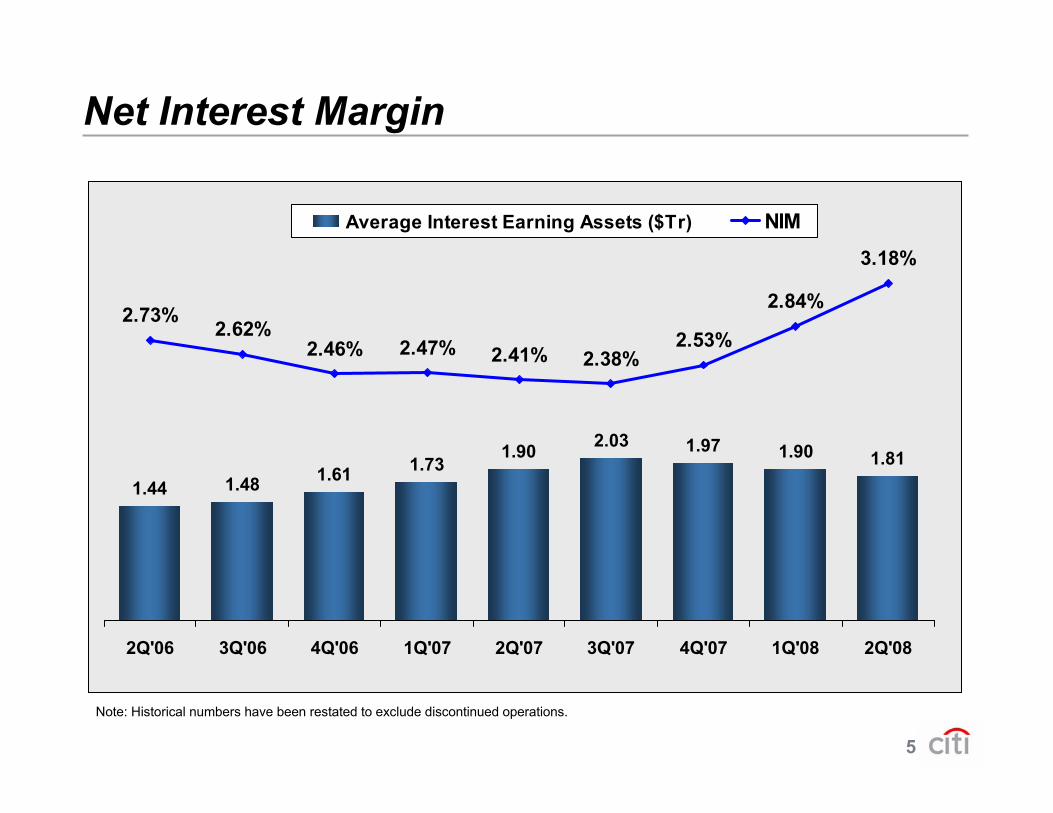
1.44 1.48 1.61 1.731.90 2.03 1.97 1.90 1.81
2.73%2.62%
2.46% 2.47% 2.41% 2.38%2.53%
2.84%
3.18%
2Q'06 3Q'06 4Q'06 1Q'07 2Q'07 3Q'07 4Q'07 1Q'08 2Q'08
Average Interest Earning Assets ($Tr) NIM
Net Interest Margin
Note: Historical numbers have been restated to exclude discontinued operations.

6
Expenses
12.6 11.713.8 15.4 14.7 14.4
16.4 15.916.1
17%
4%
17% 17% 19%
5%9%
23%23%
13%
(1)% (2)%2%
(2)%
17%
(5)% (7)%
5%
2Q'06 3Q'06 4Q'06 1Q'07 2Q'07 3Q'07 4Q'07 1Q'08 2Q'08
(1) Excludes the impact from the 1Q’07 $1.38B pre-tax charge related to a structural expense review.(2) $300 million pre-tax release of litigation reserves, which were established in May 2004 for Enron, WorldCom, Research and
IPO-related matters.
(1)(1)
Y-o-Y Growth Q-o-Q GrowthExpenses ($B)
Acq. & Divest.: 4%Repositioning: 3%2Q’07 release (2): 2%BAU: 0%

7
Headcount
313 320 327 343 361 371 375 369 363
9% 10% 9%12%
15% 16% 15%
8%
3%1%
1%
(2)%(2)%
2% 2%5% 5%
2%
2Q'06 3Q'06 4Q'06 1Q'07 2Q'07 3Q'07 4Q'07 1Q'08 2Q'08
Y-o-Y Growth Q-o-Q GrowthHeadcount (M)
Acquisitions& Divestitures: 1%

8
Balance Sheet
(1) Preliminary.
Assets ($Tr)
8.6% 8.3% 7.9%7.3% 7.1%
7.7%8.7%
11.7% 11.5% 11.2%10.6% 10.7%
11.2%12.2%
5.2% 4.8% 4.4% 4.1% 4.0% 4.4%5.0%
6.8% 6.7% 6.3% 5.9% 5.7%6.2%
6.9%
4Q'06 2Q'07 4Q'07 2Q'08
Tier 1 Capital Ratio Total Capital RatioLeverage Ratio TCE/RWMA
1.88
2.02
2.22
2.36
2.19 2.202.10
4Q'06 2Q'07 4Q'07 2Q'08
Key Metrics
25%$474B
(11)%$(257)B
(1) (1)

9
ConsumerNet Credit Losses (YoY ∆) $(1,993) Consumer Banking &Loan Loss Reserve Build (YoY ∆) (1,754) Global Cards
MSR related losses (745) N.A. Consumer Banking
ICGWrite-downs on sub-primerelated direct exposures (1) (3,475) Fixed Income Markets
Monoline Credit ValueAdjustment (CVA) (2,430) Fixed Income Markets
Write-downs on highly leveragedfinance commitments (2) (428) Debt U/W, Lending
Pre-tax ($MM) Impact Business
(1) Includes $80 million recorded in credit costs.(2) Net of underwriting fees.
2Q’08 Negatives

10
2Q'07 NCLs Loan Loss ReserveBuilds
2Q'08
Cost of CreditYear-over-Year Change ($MM)
2,5132,388
2,026
Major Drivers:N.A. Cons. Banking $1,144 ICG 394N.A. Cards 234LatAm Cards 217LatAm Cons. Banking 143
6,927
Major Drivers:N.A. Cons. Banking $1,472 ICG 243N.A. Cards 111Asia Cons. Banking 87

11
2.352.77
2.071.83
1.20 1.32 1.34 1.31 1.432.23 2.45
1.521.08 0.98 1.00 1.01
1.32
2.251.97
2.842.45
1.27 1.191.66
1.96
1.712.421.95
2.47
1.99
2.29 2.07
3.252.56
1.201.381.69
2.17
1.70
2.62
1.75
2.32
2.17
1.80
1Q'03 2Q'03 3Q'03 4Q'03 1Q'04 2Q'04 3Q'04 4Q'04 1Q'05 2Q'05 3Q'05 4Q'05 1Q'06 2Q'06 3Q'06 4Q'06 1Q'07 2Q'07 3Q'07 4Q'07 1Q'08 2Q'08
NCL ratio Loan Loss Reserve ratio
Consumer (1) Credit TrendsNorth America
3.09 3.42 3.36
6.63
2.70 3.02 3.00 3.25 3.382.85
3.56 3.15 3.70 3.88
2.70 2.67 2.802.11 2.16 2.14 2.08 2.10 2.08 2.19 2.44 2.84 2.74 3.05 3.25
2.72
2.563.012.48
2.93
2.502.82 2.80
3.34 2.72
2.73
2.933.12 3.02 2.98
1Q'03 2Q'03 3Q'03 4Q'03 1Q'04 2Q'04 3Q'04 4Q'04 1Q'05 2Q'05 3Q'05 4Q'05 1Q'06 2Q'06 3Q'06 4Q'06 1Q'07 2Q'07 3Q'07 4Q'07 1Q'08 2Q'08
NCL ratio Loan Loss Reserve ratio
(1) Consumer: comprised of Global Cards and Consumer Banking.(2) Includes impact from conforming of EMEA Retail Banking and Consumer Finance write-off policy.Note: NCLs as a % of average loans; Loan Loss Reserves as a % of EOP loans.
International(2)
12
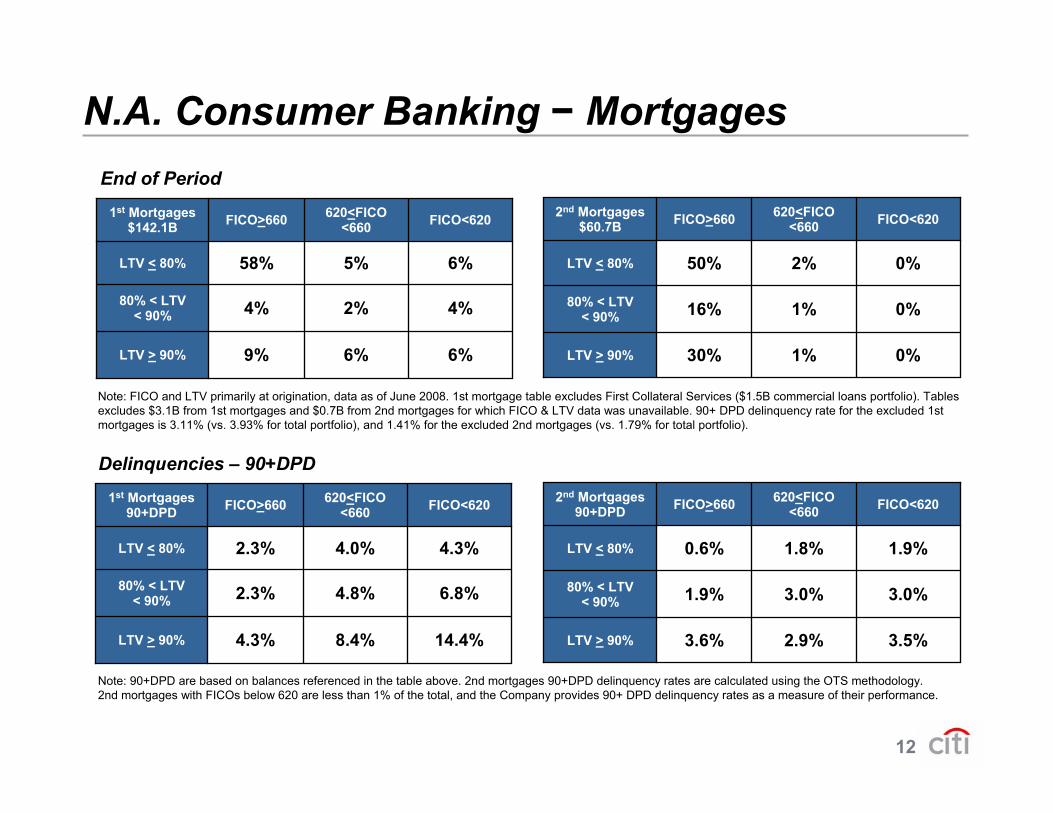
N.A. Consumer Banking − Mortgages
Note: 90+DPD are based on balances referenced in the table above. 2nd mortgages 90+DPD delinquency rates are calculated using the OTS methodology. 2nd mortgages with FICOs below 620 are less than 1% of the total, and the Company provides 90+ DPD delinquency rates as a measure of their performance.
Note: FICO and LTV primarily at origination, data as of June 2008. 1st mortgage table excludes First Collateral Services ($1.5B commercial loans portfolio). Tables excludes $3.1B from 1st mortgages and $0.7B from 2nd mortgages for which FICO & LTV data was unavailable. 90+ DPD delinquency rate for the excluded 1st mortgages is 3.11% (vs. 3.93% for total portfolio), and 1.41% for the excluded 2nd mortgages (vs. 1.79% for total portfolio).
Delinquencies – 90+DPD
14.4%8.4%4.3%LTV > 90%
6.8%4.8%2.3%80% < LTV < 90%
4.3%4.0%2.3%LTV < 80%
FICO<620620<FICO<660FICO>6601st Mortgages
90+DPD
3.5%2.9%3.6%LTV > 90%
3.0%3.0%1.9%80% < LTV < 90%
1.9%1.8%0.6%LTV < 80%
FICO<620620<FICO<660FICO>6602nd Mortgages
90+DPD
6%6%9%LTV > 90%
4%2%4%80% < LTV < 90%
6%5%58%LTV < 80%
FICO<620620<FICO<660FICO>6601st Mortgages
$142.1B
0%1%30%LTV > 90%
0%1%16%80% < LTV < 90%
0%2%50%LTV < 80%
FICO<620620<FICO<660FICO>6602nd Mortgages
$60.7B
End of Period

13
0.94%
1.75%1.45%
1.38%0.08% 0.09% 0.13% 0.25%
0.14%
0.15% 0.11%
0.41%
0.99%
0.17%
0.14%0.09%0.09%0.11% 0.06%0.06%
3.66%3.16%
0.15%0.47%
0.04%
1.67%
1Q'03 2Q'03 3Q'03 4Q'03 1Q'04 2Q'04 3Q'04 4Q'04 1Q'05 2Q'05 3Q'05 4Q'05 1Q'06 2Q'06 3Q'06 4Q'06 1Q'07 2Q'07 3Q'07 4Q'07 1Q'08 2Q'08
90+ DPDNCL ratio
N.A. Consumer Banking − Mortgages
2.82%2.54%
3.02%
3.69%
0.63% 0.56% 0.49% 0.37% 0.32% 0.25% 0.26% 0.26%0.56%
1.00%
1.68%2.07%
1.47%
2.04%2.51%
1.40% 1.38%1.58%1.84%
2.05%
0.31% 0.41%
1Q'03 2Q'03 3Q'03 4Q'03 1Q'04 2Q'04 3Q'04 4Q'04 1Q'05 2Q'05 3Q'05 4Q'05 1Q'06 2Q'06 3Q'06 4Q'06 1Q'07 2Q'07 3Q'07 4Q'07 1Q'08 2Q'08
90+DPDNCL ratio
1st Mortgages FICO<6208.51%
LTV>=90 3.58%
90+ Days Past Due, NCL ratios
Note: 1st mortgage portfolio: comprised of the Citibank 1st mortgage portfolios and the CitiFinancial Real Estate portfolio. It includes deferred fees/costs and loans held for sale. 2Q’08 90+DPD based on EOP balances of $145.2 billion. 2nd mortgage portfolio: comprised of the Citibank Home Equity portfolios; 90+DPD rate calculated by combined MBA/OTS methodology. 2Q’08 90+DPD based on EOP balances of $61.5 billion.
2nd Mortgages
14
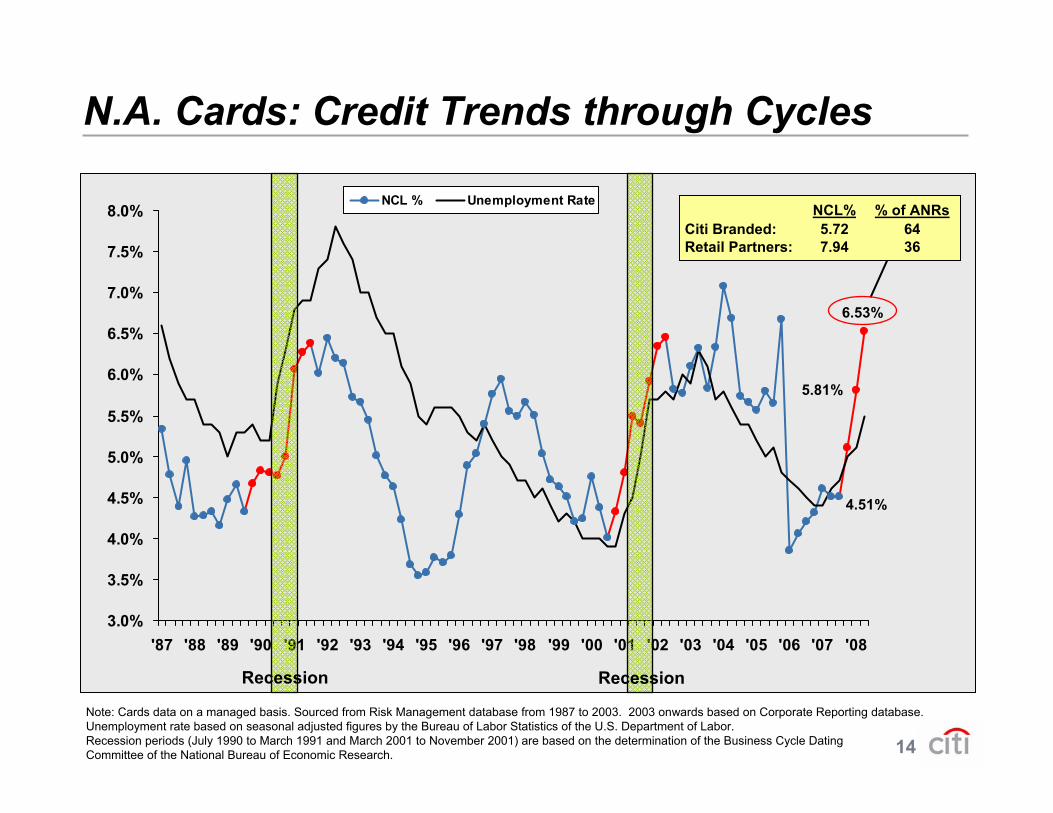
N.A. Cards: Credit Trends through Cycles
3.0%
3.5%
4.0%
4.5%
5.0%
5.5%
6.0%
6.5%
7.0%
7.5%
8.0%
'87 '88 '89 '90 '91 '92 '93 '94 '95 '96 '97 '98 '99 '00 '01 '02 '03 '04 '05 '06 '07 '08
NCL % Unemployment Rate
Note: Cards data on a managed basis. Sourced from Risk Management database from 1987 to 2003. 2003 onwards based on Corporate Reporting database. Unemployment rate based on seasonal adjusted figures by the Bureau of Labor Statistics of the U.S. Department of Labor. Recession periods (July 1990 to March 1991 and March 2001 to November 2001) are based on the determination of the Business Cycle Dating Committee of the National Bureau of Economic Research.
5.81%
4.51%
Recession Recession
6.53%
NCL% % of ANRsCiti Branded: 5.72 64Retail Partners: 7.94 36

15
Global Cards
Revenues $5,468 $5,325 3%– North America 2,928 3,298 (11)– EMEA 652 506 29– Latin America 1,229 990 24– Asia 659 531 24
Expenses 2,725 2,490 9
Credit Costs 2,023 1,288 57
Net Income $467 $1,057 (56)%– North America 178 711 (75)– EMEA 19 53 (64)– Latin America 165 184 (10)– Asia 105 109 (4)
N.A. Cards Managed Revenue GAAP Revenue $2,928 $3,298 (11)%
Impact of sec. activity 2,016 998 NM
Managed Revenue $4,944 $4,296 15%
($MM) 2Q’08 2Q’07 % Managed revenues up 18%
North America– Managed revenues up 15%– Lower securitization revenues; flat purchase sales– Receivables up 6%; payment rate down 1% – Asset sales: $170 million revenue benefit
EMEA– Average loans up 42%; purchase sales up 27%
Latam– Average loans up 26%; purchase sales up 29%
Asia– Average loans up 27%; purchase sales up 21%
Expenses– Higher collections costs
Credit Costs – N.A. environment continues to deteriorate– Mexico and Brazil suffered the largest credit cost
increases outside of N.A.
16
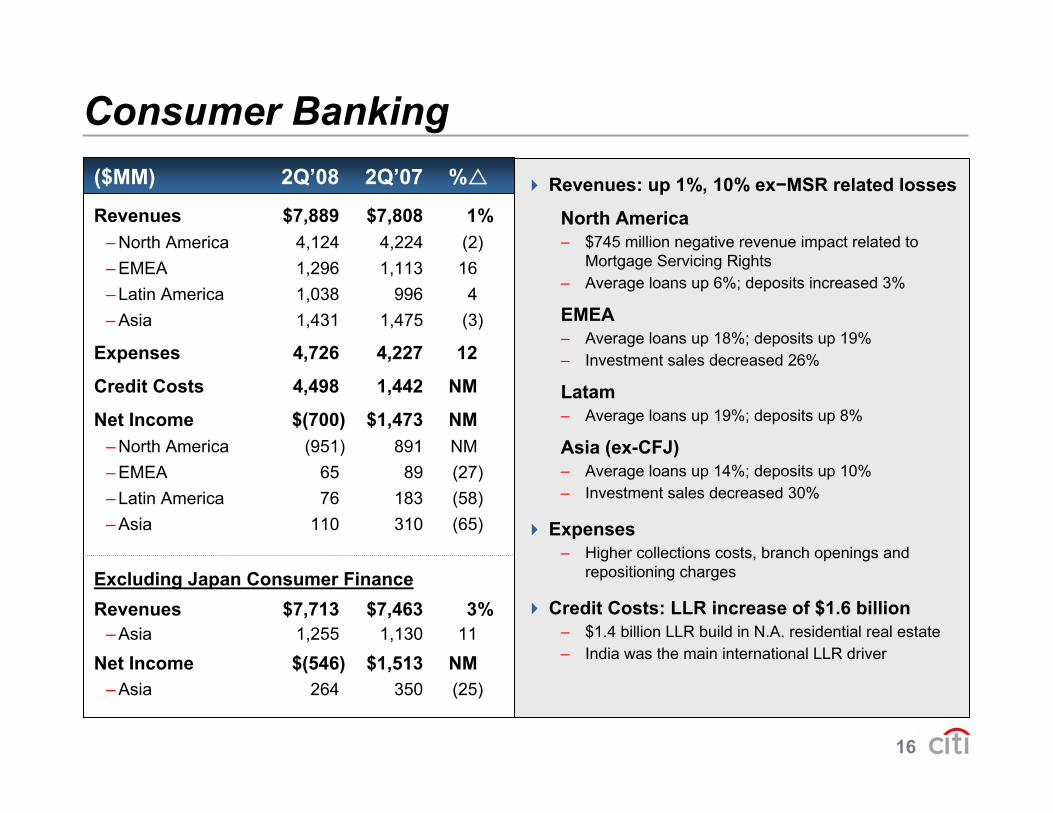
Consumer Banking
Revenues $7,889 $7,808 1%– North America 4,124 4,224 (2)– EMEA 1,296 1,113 16– Latin America 1,038 996 4– Asia 1,431 1,475 (3)
Expenses 4,726 4,227 12
Credit Costs 4,498 1,442 NM
Net Income $(700) $1,473 NM– North America (951) 891 NM– EMEA 65 89 (27)– Latin America 76 183 (58)– Asia 110 310 (65)
Excluding Japan Consumer FinanceRevenues $7,713 $7,463 3%
– Asia 1,255 1,130 11
Net Income $(546) $1,513 NM– Asia 264 350 (25)
Revenues: up 1%, 10% ex−MSR related losses
North America– $745 million negative revenue impact related to
Mortgage Servicing Rights – Average loans up 6%; deposits increased 3%
EMEA– Average loans up 18%; deposits up 19% – Investment sales decreased 26%
Latam– Average loans up 19%; deposits up 8%
Asia (ex-CFJ)– Average loans up 14%; deposits up 10% – Investment sales decreased 30%
Expenses– Higher collections costs, branch openings and
repositioning charges
Credit Costs: LLR increase of $1.6 billion– $1.4 billion LLR build in N.A. residential real estate– India was the main international LLR driver
($MM) 2Q’08 2Q’07 %

17
Revenues $539 $8,414 (94)%– North America (2,244) 3,655 NM– EMEA 871 2,313 (62)– Latin America 707 724 (2)– Asia 1,205 1,722 (30)
Expenses 4,486 4,220 6
Credit Costs 608 (24) NM
Net Income $(2,745) $2,868 NM– North America (2,904) 1,409 NM– EMEA (327) 631 NM– Latin America 260 301 (14)– Asia 226 527 (57)
Product Revenues ($MM):– Investment Banking $453 $1,469 (69)%– Lending 95 504 (81)– Equity Markets 1,398 1,582 (12)– Fixed Income Markets (633) 4,652 NM
($MM) 2Q’08 2Q’07 %
ICG − Securities and BankingRevenues
– Fixed Income Markets: write-downs of $3.4B on subprime related direct exposures, $2.4B related to exposure to monolines, $0.5B on CRE positions. Record revenues in interest rate, currency and credit trading, and commodities.
– Equity Markets: weakness in derivatives proprietary trading, offset by strength in the cash business and record prime broker revenues
– Investment Banking: $585 million in write-downs on highly leveraged finance commitments and lower fixed income U/W volumes, partly offset by equity underwriting
– Lending: higher losses on credit default swap hedges
Expenses– $300 million litigation reserve release in 2Q’07– Lower incentive compensation– Higher repositioning charges
Credit costs – NCLs up by $386 million mainly due to loan sales– LLR increased by $227 million reflecting weakness
in leading indicators of losses

18
S&B – Direct Subprime Exposures
ABS CDO Super SeniorTotal Gross Exposures $33.2 $27.9
Hedged Exposures 10.5 9.8Net Exposures
ABCP (3) $16.8 $(2.0) (0.4) $14.4High grade 3.8 (1.3) (4) (0.5) 2.0Mezzanine 2.0 0.1 (4) (0.5) 1.6ABS CDO-squared 0.1 0.0 (0.0) 0.2
Total Net Exposures $22.7 $(3.2) $(1.5) (5) $18.1
Lending & StructuringGross Exposures
CDO warehousing/unsold tranches of ABS CDOs $0.2 $(0.0) $(0.1) $0.1
Subprime loans purchased for sale or securitization 3.6 (0.3) (0.6) 2.8
Financing transactions secured by subprime 2.6 (0.1) (4) (1.0) 1.5
Total Gross Exposures $6.4 $(0.3) $(1.7) $4.3
Total Exposures (6) $29.1 $(3.5) $(3.2) $22.5Credit Adj. on hedge counterparty exposure (7) $(2.4)
Total Net Write-Downs $(5.9)
Mar. 31, 2008 2Q'08 2Q'08 Jun. 30, 2008Exposure Write-downs (1) Other (2) Exposure
(1) Includes losses associated with liquidations. (2) Other includes sales, transfers, repayment of principal and restructuring/liquidations. (3) Consists of older vintage, high grade ABS CDOs. (4) Includes $80 million recorded in credit costs. (5) A portion of the underlying securities werepurchased in liquidations of two CDOs and we have been managing and selling these securities in our trading books. As of June 30, $319 million wereheld in the trading books. (6) Comprised of net CDO Super Senior exposures and gross Lending and Structuring exposures.(7) FAS 157 adjustment related to counterparty credit risk. Note: Totals may not sum due to rounding.
$B

19
S&B – Direct Subprime ExposuresAs of June 30, 2008
Stratification by Face Value
Exposure Face Market % Current VintageType Value Value Mark Rating ≤ 04 05 ≥ 06 Total
(1) Consists of older vintage, high grade ABS CDOs. Note: Totals may not sum due to rounding. The information in the above table is based on Citi's ABS CDO super senior exposures as of June 30, 2008 and is as of the most recent portfolio data available as of June 30, 2008. The vintage information is expressed as a percentage of the notional amount of the assets underlying the CDOs. The vintage information was derived from third party sources that publish the date of issue for securities. Mortgage loans or exposures underlying other CDOs in which the transactions have invested may have been originated prior to or after the date of issue of such other CDOs.Note: Totals may not sum due to rounding.
ABCP (1) $23.7B $14.4B 61% AAA to AA 30% 27% 14% 71%A 6 6 1 13
≤ BBB 4 7 5 16Total 40 39 21 100
High Grade $7.4 $2.0B 27% AAA to AA 6% 9% 22% 38%A 1 3 3 7
≤ BBB 0 3 52 55Total 8 15 77 100
Mezzanine $8.4B $1.6B 19% AAA to AA 0% 0% 1% 1%A 0 1 2 3
≤ BBB 3 41 52 96Total 3 42 54 100

20
12.1
5.9 4.313.6
1Q'08 2Q'08
AFS Trading
1Q'08 2Q'08
19.121.2 20.7
5.0 5.3
22.3
1Q'08 2Q'08
Fair Value Loans & Comm. Equity Method
S&B – Other ExposuresAlt-A Mortgage Loans (1) ($B)
Auction Rate Securities ($B)Commercial Real Estate ($B)
Write-down: $0.5B
11.2
16.9
13.020.7
1Q'08 2Q'08
Funded Unfunded
Highly Leveraged Finance Commitments ($B)
Write-down: $0.4B
37.7
24.2
Write-down: $0.3B
6.5 5.6
19.5 16.4
Write-up: $0.2B
(1) Defined for the purposes of this presentation as non-agency residential mortgage-backed securities (RMBS) where the underlying collateral hasweighted average FICO scores between 680 and 720 or, for FICO scores greater than 720, RMBS where ≤ 30% of the underlying collateral iscomprised of full documentation loans.
Note: Excludes positions in Alternative Investments SIVs. Totals may not sum due to rounding.

21
Revenues $2,400 $1,847 30%– North America 496 371 34– EMEA 869 680 28– Latin America 368 261 41– Asia 667 535 25
Expenses 1,372 1,129 22
Credit Costs 18 (6) NM
Net Income $701 $516 36%– North America 51 52 (2)– EMEA 238 173 38– Latin America 142 90 58– Asia 270 201 34
Product Revenues ($MM): – TTS $1,581 $1,222 29%
– Securities Services 819 625 31
($MM) 2Q’08 2Q’07 %
ICG − Transaction Services
Revenues– North America: driven by the Bisys acquisition
– EMEA: overall strong customer volumes; liability balances up 25% to a record $110 billion
– Latin America: growth in TTS liabilities and spreads
– Asia: double-digit growth across all products
Expenses– Higher business volumes, record new wins,
increased investment spending
Credit– Higher credit losses in Asia reflect slight weakening
of the environment
– LLR build of $9 million
Liability balances up 15% to $276 billion
Assets under custody up 13% to $12.8 trillion

22
Revenues $3,315 $3,197 4%– North America 2,427 2,441 (1)– EMEA 153 137 12– Latin America 102 92 11– Asia 633 527 20
Expenses 2,634 2,461 7
Credit Costs 40 12 NM
Net Income $405 $512 (21)%– North America 309 334 (7)– EMEA 20 46 (57)– Latin America 15 29 (48)– Asia 61 103 (41)
Product Revenues ($MM): – Smith Barney $2,715 $2,611 4%
– Private Bank 600 586 2
($MM) 2Q’08 2Q’07 %
Global Wealth Management
Revenues– North America: lower revenues from investments
and capital markets
– EMEA: higher banking revenues
– Latin America: higher capital markets revenues
– Asia: increased ownership in Nikko, partially offset by lower capital markets revenues
Expenses– Driven by the Nikko acquisition
Credit– Increased loan loss reserves, mainly in North
America
Client assets under fee based management declined 8% to $469 billion, mainly driven by the decrease in market valuations
Average deposit and customer liability balances up 12% to $127 billion

23
Corporate/Other
Revenues $(959) $(261) NM
Net Income (345) (283) (22)%
Negative revenue impact from:− Higher funding costs driven by an increase in the
deferred tax asset, hedging and enhancing liquidity
− Inter-company costs related to the sale of CitiCapitaland recent capital raising
Lower taxes held at corporate
($MM) 2Q’08 2Q’07 %
Corporate/Other

24
1. Litigation reserve release of $300 million pre-tax, $188 million after-tax, related to Enron, WorldCom, Research and IPO-related matters.
2. Tax benefit of $96 million related to the initial application of APB 23 to certain foreign subsidiaries.3. Gain on a cards portfolio sale of $170 million pre-tax, $107 million after-tax.4. Repositioning charges of $446 million pre-tax, $275 million after-tax.
Summary of Press Release Disclosed Items2Q’07 2Q’08
Pre-tax After-tax Pre-tax After-tax
North America -- -- $161 (3,4) $101 (3,4)
EMEA -- -- -- --Latin America -- -- -- --Asia -- -- (2) (4) (1) (4)
Global Cards -- -- $159 $100North America -- -- (92) (4) (56) (4)
EMEA -- -- (24) (4) (15) (4)
Latin America -- -- -- --Asia -- -- (15) (4) (9) (4)
Consumer Banking -- -- $(130) $(81)North America $300 (1) $188 (1) (141) (4) (85) (4)
EMEA NM 31 (2) (82) (4) (51) (4)
Latin America -- -- (8) (4) (5) (4)
Asia -- -- (27) (4) (18) (4)
Securities and Banking $300 $219 $(257) $(160)North America -- -- (1) (4) (1) (4)
EMEA -- -- -- --Latin America -- -- (0) (4) (0) (4)
Asia -- -- (1) (4) (0) (4)
Transaction Services -- -- $(2) $(1)North America -- -- (29) (4) (18) (4)
EMEA NM 42 (2) -- --Latin America -- 8 (2) -- --Asia -- 15 (2) 8 (4) 7 (4)
Global Wealth Management NM $65 $(22) $(10)Corporate Other -- -- (24) (4) (15) (4)
$MM

25
Write-downs on sub-primerelated direct exposures (1,831) (16,481) (5,912) (3,395)
Monoline Credit ValueAdjustment (CVA) --- (935) (1,495) (2,430)
Write-downs on highly leveragedfinance commitments (1) (1,352) (135) (3,078) (428)
Write-downs on Alt-Amortgages (2, 3) --- --- (1,015) (325)
Mark to market on AuctionRate Securities --- --- (1,457) 197
Write-downs on CommercialReal Estate (3) --- --- (573) (545)
CVA on Citi Liabilities atFair Value Option 194 512 1,279 (228)
Total Revenue Marks (2,989) (17,039) (12,251) (7,153)
($MM) 3Q’07 4Q’07 1Q’08 2Q’08
Securities and Banking Revenue Marks
(1) Net of underwriting fees.(2) Net of hedges.(3) Excludes positions in Alternative Investments SIVs.

26
Certain statements in this document are “forward-looking
statements” within the meaning of the Private Securities Litigation
Reform Act. These statements are based on management’s
current expectations and are subject to uncertainty and changes in
circumstances. Actual results may differ materially from those
included in these statements due to a variety of factors. More
information about these factors is contained in Citigroup’s filings
with the Securities and Exchange Commission.

Second Quarter 2008 Earnings ReviewJuly 18, 2008
Question & Answer Session