CITATION - psa.gov.ph 1.pdf · Report No. 1 – C REGION I – ILOCOS Population by Province, City,...
153
Transcript of CITATION - psa.gov.ph 1.pdf · Report No. 1 – C REGION I – ILOCOS Population by Province, City,...


CITATION:
Philippine Statistics Authority, 2015 Census of Population Report No. 1 – C REGION I – ILOCOS Population by Province, City, Municipality, and Barangay August 2016 ISSN 0117-1453
ISSN 0117-1453
REPORT NO. 1 – C
Republic of the Philippines
Philippine Statistics Authority
Quezon City
2015 Census
of Population
Population
by Province,
City, Municipality,
and Barangay
REGION I – ILOCOS


REPUBLIC OF THE PHILIPPINES
HIS EXCELLENCY
PRESIDENT RODRIGO R. DUTERTE
PHILIPPINE STATISTICS AUTHORITY BOARD
Honorable Ernesto M. Pernia Chairperson
PHILIPPINE STATISTICS AUTHORITY
Lisa Grace S. Bersales, Ph.D. National Statistician
Josie B. Perez
Deputy National Statistician Censuses and Technical Coordination Office
Minerva Eloisa P. Esquivias Assistant National Statistician National Censuses Service
ISSN 0117-1453


Philippine Statistics Authority
Presidential Proclamation No. 1269

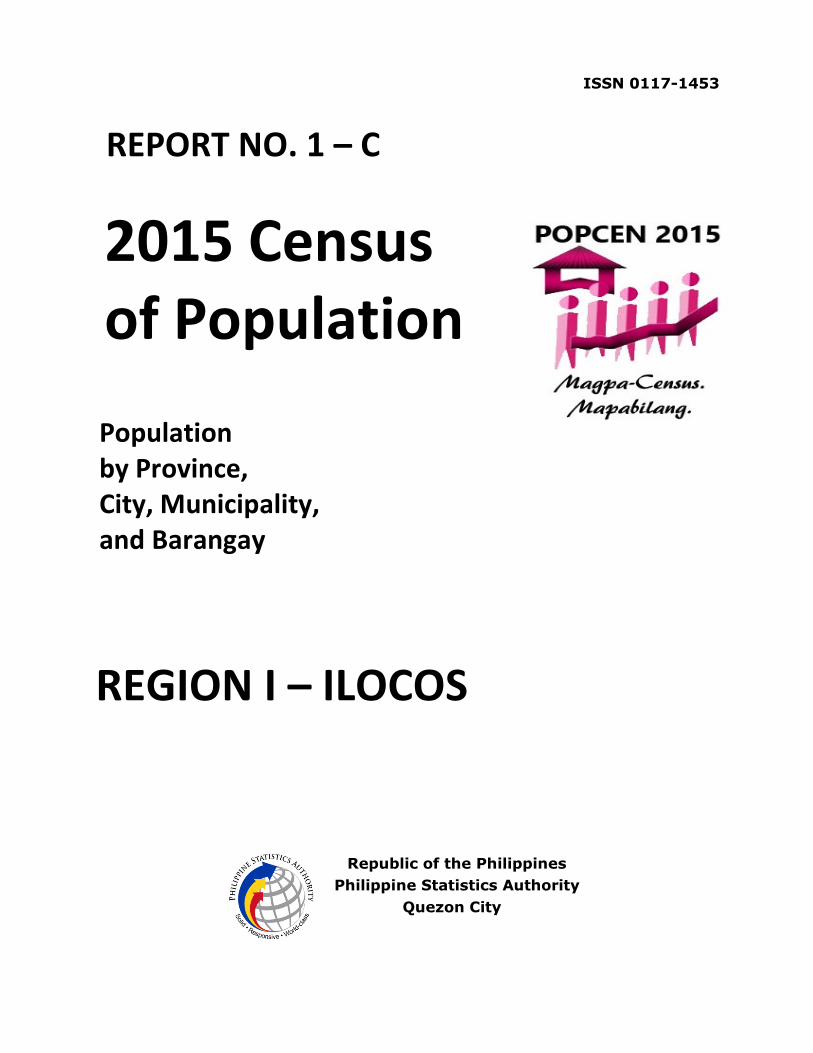
TABLE OF CONTENTS
Foreword v
Presidential Proclamation No. 1269 vii
List of Abbreviations and Acronyms xi
Explanatory Text xiii
Map of the Region I – Ilocos xxi
Highlights of the Philippine Population xxiii
Highlights of the Population: Region I – Ilocos xxvii
Summary Tables
Table A. Population and Annual Population Growth Rates for the Philippines and Its Regions, Provinces, and Highly Urbanized Cities: 2000, 2010, and 2015
xxxi
Table B. Population and Annual Population Growth Rates by Province, City, and Municipality in Region I – Ilocos: 2000, 2010, and 2015
xxxiv
Table C. Total Population, Household Population, Number of Households, and Average Household Size by Region, Province, and Highly Urbanized City as of August 1, 2015: Philippines
xxxvii
Statistical Tables
Table 1. Total Population, Household Population, Number of Households, and Average Household Size by Province, City, and Municipality as of August 1, 2015: Region I – Ilocos 1
Table 2. Total Population, Household Population, and Number of Households by Province, City, Municipality, and Barangay as of August 1, 2015:
Ilocos Norte 4 Ilocos Sur 20 La Union 42 Pangasinan 58

Table of Contents 2015 Census of Population
Philippine Statistics Authority x
Appendices
A. Excerpts from Republic Act No. 10625 Relevant to the Conduct of the 2015 Census of Population
A-1
B. Executive Order No. 352 – Designation of Statistical Activities That Will
Generate Critical Data for Decision-Making of the Government and the Private Sector B-1
C. Presidential Proclamation No. 1031 – Declaring August 2015 as National Census Month C-1
D. Trainings and Fieldwork for the Conduct of the POPCEN 2015 D-1
E. Evaluation of Population Counts from the POPCEN 2015 E-1
F. List of Report No. 1 – Population by Province, City, Municipality,
and Barangay
F-1

LIST OF ABBREVIATIONS AND ACRONYMS
ADB Asian Developmant Bank AHS Average Household Size ARMM Autonomous Region in Muslim Mindanao CALABARZON Cavite, Laguna, Batangas, Rizal, and Quezon CAR Cordilllera Administrative Region CP Census of Population CPH Census of Population and Housing C/MCCB City/Municipal Census Coordinating Board DBM Department of Budget and Management DILG Department of the Interior and Local Government E-QUESTIONNAIRE Electronic Questionnaire EO Executive Officer EO No. 352 Executive Order No. 352 FAO Food and Agriculture Organization HUC Highly Urbanized City ILO International Labor Organization ILQ Institutional Living Quarter LGU Local Government Unit MIMAROPA Mindoro, Marinduque, Romblon, and Palawan NCCB National Census Coordinating Board NCR National Capital Region NEDA National Economic and Development Authority NGO Nongovernment Organization NIR Negros Island Region NS National Statistician NSCB National Statistical Coordination Board PCCB Provincial Census Coordinating Board PGR Population Growth Rate PO Provincial Statistical Office POPCEN 2015 2015 Census of Population PSA Philippine Statistics Authority PSO Provincial Statistics Officer R.A. No. 10625 Republic Act No. 10625 RCCB Regional Census Coordinating Board RD Regional Director RSSO Regional Statistical Services Office SAQ Self-Administered Questionnaire SOCCSKSARGEN South Cotabato, Cotabato City, Sultan Kudarat, Sarangani,
and General Santos Cty TNT Tago Ng Tago UN United Nations USAID United States Agency for International Development


EXPLANATORY TEXT
INTRODUCTION The Philippine Statistics Authority (PSA) conducted the 2015 Census of Population (POPCEN 2015) in August 2015. This is the 14th census of population undertaken in the country. Like the previous censuses conducted in the country, the POPCEN 2015 was designed to take an inventory of the population of the Philippines and to collect information about its characteristics. AUTHORITY TO CONDUCT THE POPCEN 2015
The authority and mandate of the PSA to conduct the POPCEN 2015 emanates
from Republic Act (RA) No. 10625 and Executive Order No. 352.
RA No. 10625, also known as the Philippine Statistical Act of 2013, which was approved on 12 September 2013, states that “the PSA shall be primarily responsible for all national censuses and surveys, sectoral statistics, consolidation of administrative recording system, and compilation of national accounts.” Specifically, Section 6(b) of this Act mandates the PSA “to prepare and conduct periodic censuses on population, housing, agriculture, fisheries, business, industry, and other sectors of the economy”.
Executive Order No. 352 – Designation of Statistical Activities That Will Generate Critical Data for Decision-Making of the Government and the Private Sector, stipulates the conduct of a mid-decade census primarily to update the population count in all barangays nationwide. Moreover, Presidential Proclamation No. 1031, Declaring August 2015 as National Census Month, enjoined all departments and other government agencies, including government-owned and -controlled corporations, as well as local government units (LGUs), to implement and execute the operational plans, directives, and orders of the PSA Board through the PSA, relative to this Proclamation. COORDINATION FOR THE POPCEN 2015
Section 9 of RA No. 10625 states that one of the functions of the PSA Board is to prescribe appropriate frameworks for the improvement of statistical coordination and establish mechanisms for statistical coordination at the regional and LGU levels. With this mandated function and being the highest policy making body on statistical matters, the PSA Board was designated as the National Census Coordinating Board (NCCB) for the POPCEN 2015.
Explanatory Text 2015 Census of Population
Philippine Statistics Authority xiv
The NCCB was chaired by the PSA Board Chairperson, who is the Secretary for Socioeconomic Planning and Director, National Economic and Development Authority (NEDA). The Secretary of the Department of Budget and Management or his/her duly authorized Undersecretary served as the NCCB Vice-Chairperson. The members of the Board were the National Statistician (NS) of the PSA, who served as the Executive Officer (EO) of the NCCB; Executive Director of the Philippine Statistical Research and Training Institute; one representative each from the executive departments; Bangko Sentral ng Pilipinas; Commission on Higher Education; Technical Education and Skills Development Authority; Governance Commission for Government-Owned and -Controlled Corporations; Philippine Statistical Association, Incorporated; Union of Local Authorities of the Philippines; and the private sector.
The local census coordinating boards were composed of the Regional Census Coordinating Board (RCCB), Provincial Census Coordinating Board (PCCB), and City/Municipal Census Coordinating Board (C/MCCB). The PSA Regional Director (RD) was responsible for organizing the RCCB. The RD oversaw the creation of the PCCB by the Provincial Statistics Officer (PSO) in all the provinces under his/her jurisdiction. The PSO, on the other hand, oversaw the creation of the C/MCCB by the Provincial Statistical Office (PO) statistician/staff in all the cities/municipalities under his/her jurisdiction. In provincial capitals where there are no PO statistician/staff designated to create the local CCB, the PSO was responsible for the formation of the C/MCCB.
Aside from the national and local CCBs, the PSA likewise coordinated with other government agencies such as the Philippine Information Agency, National Commission on Indigenous Peoples, National Commission on Muslim Filipinos, and National Commission on Disability Affairs. Coordination was also made with nongovernment organizations (NGOs), religious groups and civic organizations (both at the national and local levels); homeowners, village associations, and building administrators; and indigenous cultural communities/indigenous peoples (ICCs/IPs). DEFINITION OF TERMS AND CONCEPTS
The operational definitions and concepts adopted in the POPCEN 2015 have also been used in the past censuses of population. The use of the same operational definitions of terms and concepts in population censuses ensures comparability of census results. The POPCEN 2015 enumerators were instructed to adhere strictly to these operational definitions.
Barangay
A barangay is the smallest political unit in the country. Generally, one enumerator (EN) is assigned to enumerate one barangay. The official list of barangays of the Department of the Interior and Local Government (DILG) in the Philippine Standard Geographic Code as of December 2015 was used for the POPCEN 2015.

2015 Census of Population Explanatory Text
Philippine Statistics Authority xv
Usual Place of Residence All persons were enumerated in their usual place of residence, which refers to
the geographic place (street, barangay, city/municipality or province) where the person usually resides. As a rule, a person’s usual place of residence is the place where that person sleeps most of the time. Hence, it may be the same as or different from the place where he/she was found at the time of the census.
Household
A household is a social unit consisting of a person living alone or a group of
persons who sleep in the same housing unit and have a common arrangement in the preparation and consumption of food.
In most cases, a household consists of persons who are related by kinship ties,
such as parents and their children. In some instances, several generations of familial ties are represented in one household while, still in others, even more distant relatives are included as members of the household.
Some household members may have no relationship to the head of the
household, for example, household helpers, boarders, and nonrelatives. They are considered as members of the household provided that they sleep in the same housing unit and have a common arrangement in the preparation and consumption of food with the household and that they do not go home to their family at least once a week.
A person who shares a housing unit with a household but separately cooks
his/her meals or consumes his/her food elsewhere is not considered a member of the household he/she shares the housing unit with. This person should be listed as a separate (one member) household.
Household Population
Household population comprises of persons who belong to a household.
Institutional Living Quarter Institutional Living Quarter (ILQ) is a structurally separate and independent place
of abode intended for habitation by large groups of individuals. Such a quarter usually has certain common facilities such as kitchen and dining rooms, toilet and bath, and lounging areas which are shared by the occupants.
Institutional Population
Institutional population comprises of persons who are found living in ILQs. They
may have their own families or households elsewhere but at the time of the census, they are committed or confined in institutions; or they live in ILQs and are usually subject to a common authority or management, or are bound by either a common public objective or a common personal interest.

Explanatory Text 2015 Census of Population
Philippine Statistics Authority xvi
Household Membership In determining the household membership, the basic criterion was the usual
place of residence or the place where the person usually resided. This may be the same or different from the place where a person was found at the time of the census. As a rule, it was the place where a person usually sleeps. Who Were Enumerated
As in the past population and housing censuses, ENs of POPCEN 2015 were
provided with guidelines on whom to list as members of a household and ILQ. This helped ensure uniformity in determining household membership, institutional population, and in identifying persons to be included in the enumeration or excluded from it. Further, this helped ensure that there was no omission or duplication in the enumeration of persons and households during census-taking. The following guidelines were used in determining household membership and institutional population:
Persons Enumerated as Members of the Household 1. Those who were present at the time of visit and whose usual place of
residence was the housing unit where the household lived; 2. Family members who were overseas workers and who were away at the
time of the census and were expected to be back within five years from the date of last departure.
These included household members who may or may not have had a
specific work contract or had been presently at home on vacation but had an existing overseas employment to return to. Undocumented overseas workers or the so-called TNT (Tago Nang Tago) were still considered as members of the household for as long as they had been away for not more than five years. Immigrants, however, were excluded from the census.
3. Those whose usual place of residence was the place where the household
lived but were temporarily away at the time of the census for any of the following reasons:
a. on vacation, business/pleasure trip, or training somewhere in the Philippines and was expected to be back within six months from the date of departure. An example was a person on training with the Armed Forces of the Philippines for not more than six months;
b. on vacation, business/pleasure trip, on study/training abroad and
was expected to be back within a year from the date of departure; c. working or attending school outside their usual place of residence
but usually came home at least once a week;

2015 Census of Population Explanatory Text
Philippine Statistics Authority xvii
d. confined in hospitals for a period of not more than six months as of the time of enumeration, except when they were confined as patients in mental hospitals, leprosaria/ leper colonies or drug rehabilitation centers, regardless of the duration of their confinement;
e. detained in national/provincial/city/municipal jails or in military
camps for a period of not more than six months as of the time of enumeration, except when their sentence or detention was expected to exceed six months;
f. on board coastal, interisland, or fishing vessels within Philippine
territories; and g. on board oceangoing vessels but expected to be back within five
years from the date of departure.
4. Boarders/lodgers of the household or employees of household-operated businesses who did not return/go home to their respective households weekly;
5. Citizens of foreign countries who resided or were expected to reside in the
Philippines for at least a year from their arrival, except members of diplomatic missions and non-Filipino members of international organizations;
6. Filipino balikbayans with usual place of residence in a foreign country but
resided or were expected to reside in the Philippines for at least a year from their arrival; and
7. Persons temporarily staying with the household who had no usual place of
residence or who were not certain to be enumerated elsewhere. Persons Enumerated as Members of the Institutional Population 1. Permanent lodgers in boarding houses; 2. Dormitory residents who did not usually go home to their respective
households at least once a week; 3. Hotel residents who stayed in the hotel for more than six months at the
time of the census; 4. Boarders in residential houses, provided that their number was 10 or
more. However, if the number of boarders in a house was less than 10, they were considered as members of regular households, not of institutions;
5. Patients in hospitals who were confined for more than six months;

Explanatory Text 2015 Census of Population
Philippine Statistics Authority xviii
6. Patients confined in mental hospitals, leprosaria or leper colonies, and
drug rehabilitation centers, regardless of the length of their confinement; 7. Wards in orphanages, homes for the aged, and other welfare institutions; 8. Prisoners of corrective and penal institutions; 9. Seminarians, nuns in convents, monks, and postulants; 10. Soldiers residing in military camps; and 11. Workers in mining and similar camps. The following persons were not considered as members of the institutional population and were included in the households to which they belonged: 1. Military officials/enlisted men or draftees (and members of their
households) with housing units within military installations or camps; 2. Managers (and members of their households) of refugee camps,
dormitories, hotels, hospitals, and other institutions, who occupied and regularly used as their place of abode the living quarters in the institutions that they managed; and
3. Priests, Pastors or Imams, who, together with their relatives and/or
household help, occupied and regularly used as their place of abode a living quarter in the church or seminary.
Persons Included in the Census Enumeration Included in the enumeration were those who were alive as of the POPCEN 2015 reference date, that was, 12:01 a.m. of 1 August 2015 were enumerated. Specifically, these were the following: 1. Filipino nationals permanently residing in the Philippines; 2. Filipino nationals, who, as of 1 August 2015, were temporarily at Philippine
sea, or were temporarily on vacation, business/pleasure trip or studying/training abroad and were expected to be back within a year from the date of departure;
3. Filipino overseas workers, including those on board oceangoing vessels,
who were away as of 1 August 2015 but were expected to be back within five years from the date of last departure;
4. Philippine government officials, both military and civilian, including
Philippine diplomatic personnel and their families, assigned abroad; and

2015 Census of Population Explanatory Text
Philippine Statistics Authority xix
5. Civilian citizens of foreign countries who had their usual residence in the Philippines, or foreign visitors who had stayed or were expected to stay for at least a year from the date of their arrival in this country.
Persons Excluded in the Census Enumeration Excluded from the enumeration were the following persons, although they happened to be within the territorial jurisdiction of the Philippines at the time of the census enumeration: 1. Foreign ambassadors, ministers, consuls or other diplomatic
representatives, and members of their families; 2. Citizens of foreign countries living within the premises of an embassy,
legation, chancellery or consulate; 3. Citizens of foreign countries who were chiefs or officials of international
organizations and who were subjected to reassignment to other countries after their tour of duty in the Philippines, and members of their families. Examples of these international organizations are the United Nations (UN), International Labor Organization (ILO), Asian Development Bank (ADB), Food and Agriculture Organization (FAO) or the United States Agency for International Development (USAID);
4. Citizens of foreign countries, together with non-Filipino members of their
families, who were students or who were employed or had business in the Philippines, but who had stayed or were expected to stay in the country for less than a year from their arrival;
5. Citizens of foreign countries and Filipinos with usual place of residence in
a foreign country, who were visiting the Philippines and who had stayed or were expected to stay in the country for less than a year from their arrival. An example was a balikbayan who had plans to return to his/her usual place of residence abroad after a short vacation or visit in the Philippines;
6. Citizens of foreign countries in refugee camps/vessels; and 7. Residents of the Philippines on vacation, pleasure or business trip, study
or training abroad who had been away or were expected to be away from the Philippines for more than one year from their departure.
Method of Enumeration
The gathering of population and housing data was performed by census ENs through house to house visits and interview of a responsible member of each household. Self-Administered Questionnaires (SAQs) and/or Electronic Questionnaires (E-Questionnaires) were provided to households living in special areas, such as high-rise buildings/condominiums, exclusive subdivisions/villages, and townhouses, and institutions where personal interview was not possible. A complete listing of buildings

Explanatory Text 2015 Census of Population
Philippine Statistics Authority xx
which contain living quarters, including the vacant ones, as well as housing units and ILQs was also done.
A complete enumeration was conducted in all barangays nationwide to obtain
population count and data on selected characteristics of the household population, household and housing characteristics, and registration of deaths among members of the household in the last two years. For institutional population, selected characteristics were also gathered.
Information about households of Filipinos working in Philippine embassies in
foreign countries, as well as homeless population were likewise gathered and included in the total population of the country.

Map of Region I - Ilocos
Ilocos Norte
Ilocos Sur
La Union
Pangasinan
N
Ilocos Norte
Ilocos Sur
La Union
Pangasinan
N
Philippine Statistics Authority xxi


Table 1. Total Population: Philippines (Based on the 2000, 2010, and 2015 Censuses)
Census Year
Census Reference
Date
Total Population
(in millions)
2000 May 1, 2000 76.51 2010 May 1, 2010 92.34 2015 August 1, 2015 100.98
Table 2. Annual Population Growth Rate: Philippines
(Based on the 2000, 2010, and 2015 Censuses)
Reference Period
Annual Population Growth Rate
(in percent)
2010-2015 1.72
2000-2010 1.90
HIGHLIGHTS OF THE PHILIPPINE POPULATION
� The total population of the Philippines as of August 1, 2015 was 100,981,437, based on the 2015 Census of Population (POPCEN 2015).
� The 2015 total population is higher by 8.64 million compared with the total population of 92.34 million in 2010, and by 24.47 million compared with the total population of 76.51 million in 2000. Refer to Table 1.
� The total Philippine population increased by 1.72 percent annually, on average, during the period 2010 to 2015. By comparison, the rate at which the country’s total population grew during the period 2000 to 2010 was higher at 1.90 percent. See Table 2.
� Of the country’s 18 administrative regions, Region IV-A (CALABARZON) had the biggest total population in 2015 with 14.41 million, followed by the National Capital Region (NCR) with 12.88 million, and Region III (Central Luzon) with 11.22 million. The combined total population of these three regions accounted for about 38.1 percent of the total Philippine population in 2015.
� The Autonomous Region in Muslim Mindanao (ARMM) was the fastest growing region with an average annual population growth rate (PGR) of 2.89 percent.
� The country has 81 provinces. Of these provinces, Cavite was the most populous in 2015 with 3.68 million persons, followed by Bulacan (3.29 million), and Laguna (3.04 million). Twenty-four other provinces surpassed the one million total population mark. Refer to Table 3.
� Batanes was the smallest province in terms of total population size with 17,246 persons. Two other provinces posted a total population size of less than 100,000. These are Siquijor (95,984) and Camiguin (88,478).

Highlights 2015 Census of Population
Philippine Statistics Authority xxiv
Table 3. Provinces With More Than One Million Total Population: Philippines, 2015
Rank Province Total
Population (in thousands)
Rank Province Total
Population (in thousands)
1 Cavite 3,678 15 Isabela 1,594
2 Bulacan 3,292 16 Bukidnon 1,415
3 Laguna 3,035 17 Cotabato (North Cotabato) 1,380
4 Pangasinan 2,957 18 Tarlac 1,366
5 Cebu* 2,939 19 Negros Oriental 1,355
6 Rizal 2,884 20 Albay 1,315
7 Batangas 2,694 21 Bohol 1,314
8 Negros Occidental* 2,497 22 Cagayan 1,199
9 Pampanga* 2,198 23 Maguindanao 1,174
10 Nueva Ecija 2,151 24 Lanao del Sur 1,045
11 Camarines Sur 1,953 25 Davao del Norte 1,016
12 Iloilo* 1,936 26 Zamboanga del Norte 1,011
13 Quezon* 1,857 27 Zamboanga del Sur* 1,011
14 Leyte* 1,725
* Excluding the population of highly urbanized cities.
� The Philippines has 33 highly urbanized cities (HUCs). Four of these HUCs had surpassed the one million total population mark, namely, Quezon City (2.94 million), City of Manila (1.78 million), Davao City (1.63 million), and Caloocan City (1.58 million).
� The country has 1,489 municipalities. The three largest municipalities in terms of total population size are all located in the province of Rizal. These are the municipalities of Rodriquez (Montalban) with 369,222 persons, Cainta (332,128), and Taytay (319,104). Fifteen other municipalities had a total population size of more than 150,000. See Table 4.
Table 4. Municipalities With More Than 150,000 Total Population: Philippines, 2015
Rank Municipality Province Total Population
1 Rodriguez (Montalban) Rizal 369,222
2 Cainta Rizal 332,128
3 Taytay Rizal 319,104
4 Binangonan Rizal 282,474
5 Santa Maria Bulacan 256,454
6 San Mateo Rizal 252,527
7 Silang Cavite 248,085
8 Tanza Cavite 226,188
9 Marilao Bulacan 221,965
10 Santo Tomas Batangas 179,844
11 Lubao Pampanga 160,838
12 Gen. Mariano Alvarez Cavite 155,143
13 Mexico Pampanga 154,624
14 Pikit Cotabato (North Cotabato) 154,441
15 Concepcion Tarlac 154,188
16 San Miguel Bulacan 153,882
17 Polomolok South Cotabato 152,589
18 Midsayap Cotabato (North Cotabato) 151,684

2015 Census of Population Highlights
Philippine Statistics Authority xxv
� The municipality of Kalayaan in Palawan was the smallest municipality in 2015, in terms of total population size, with 184 persons.
� There are 42,036 barangays in the country. The largest barangay in terms of total population size is Barangay 176 in Caloocan City with 247 thousand persons. It was followed by Commonwealth in Quezon City (198,285) and Batasan Hills in Quezon City (161,409). Twelve other barangays posted a total population size of more than a hundred thousand persons. Refer to Table 5.
Table 5. Barangays with More Than 100,000 Total Population: Philippines, 2015
Rank Barangay City/Municipality/Province Total
Population
1 Barangay 176 Caloocan City 246,515
2 Commonwealth Quezon City 198,285
3 Batasan Hills Quezon City 161,409
4 Pinagbuhatan City of Pasig 151,979
5 Payatas Quezon City 130,333
6 San Jose Rodriguez (Montalban), Rizal 124,868
7 San Isidro Rodriguez (Montalban), Rizal 117,277
8 Poblacion City of Muntinlupa 115,387
9 Cupang City of Antipolo, Rizal 113,613
10 Holy Spirit Quezon City 110,447
11 Barangay 178 Caloocan City 107,596
12 Muzon City of San Jose del Monte, Bulacan 106,603
13 San Juan Taytay, Rizal 103,343
14 Pasong Tamo Quezon City 103,100
15 San Jose (Pob.) City of Antipolo, Rizal 103,051
� The household population of the Philippines in 2015 was 100,573,715 persons, higher by 8.48 million from the household population of 92.10 million in 2010, and by 23.96 million from the household population of 76.61 million in 2000. See Table 6.
Table 6. Household Population, Number of Households, and Average Household Size: Philippines
(Based on the 2000, 2010, and 2015 Censuses)
Census Year Household Population
(in millions) Number of Households
(in millions) Average Household
Size
2000 76.61 15.28 5.0
2010 92.10 20.17 4.6
2015 100.57 22.98 4.4
� The total number of households in the country in 2015 was recorded at 22.98 million, higher by 2.81 million compared with the 20.17 million households posted in 2010. In 2000, the total number of households was 15.28 million.
� The country’s average household size (AHS) in 2015 was 4.4 persons, lower than the AHS of 4.6 persons in 2010. In 2000, there were 5.0 persons, on average, per household.

Highlights 2015 Census of Population
Philippine Statistics Authority xxvi
� Among the country’s 18 regions, Region IV-A had the most number of households with 3.40 million, followed by the NCR with 3.10 million and Region III with 2.57 million. Cordillera Administrative Region (CAR) had the least number of households with 396 thousand. Refer to Table 7.
� ARMM had the highest AHS of 6.1 persons, followed by Region V with 4.8 persons. The lowest AHS was recorded in the NCR and Region XI, both with 4.1 persons.
Table 7. Household Population, Number of Households, and Average Household Size by Region: Philippines, 2015
Region Household Population
Number of Households
Average Household
Size
Philippines 100,573,715 22,975,630 4.4
National Capital Region 12,787,669 3,095,766 4.1
Cordillera Administrative Region 1,714,220 395,881 4.3
I – Ilocos 5,014,622 1,151,629 4.4
II – Cagayan Valley 3,443,493 804,524 4.3
III – Central Luzon 11,184,068 2,566,558 4.4
IV-A – CALABARZON 14,365,137 3,395,383 4.2
MIMAROPA Region 2,946,505 682,668 4.3
V – Bicol 5,780,963 1,216,421 4.8
VI – Western Visayas 4,464,277 1,014,987 4.4
VII – Central Visayas 6,008,987 1,388,475 4.3
Negros Island Region 4,402,196 1,012,323 4.3
VIII – Eastern Visayas 4,425,172 986,003 4.5
IX – Zamboanga Peninsula 3,615,108 799,219 4.5
X – Northern Mindanao 4,663,108 1,042,929 4.5
XI – Davao 4,867,168 1,177,461 4.1
XII – SOCCSKSARGEN 4,531,642 1,050,680 4.3
XIII – Caraga 2,588,131 574,338 4.5
Autonomous Region in Muslim Mindanao 3,771,249 620,385 6.1

Table 1. Total Population: Region I – Ilocos (Based on the 2000, 2010, and 2015 Censuses)
Census Year
Census Reference
Date
Total Population
(in millions)
2000 May 1, 2000 4.20 2010 May 1, 2010 4.75 2015 August 1, 2015 5.03
Table 2. Annual Population Growth Rate: Region I – Ilocos
(Based on the 2000, 2010, and 2015 Censuses)
Reference Period
Annual Population Growth Rate
(in percent)
2010-2015 1.09
2000-2010 1.23
HIGHLIGHTS OF THE POPULATION REGION I – ILOCOS
The total population of Region I – Ilocos
as of August 1, 2015 was 5,026,128, based on the 2015 Census of Population (POPCEN 2015).
The 2015 total population of the region is higher by 277,756 compared with the total population of 4.75 million in 2010, and by 825,650 compared with the total population of 4.20 million in 2000. Refer to Table 1.
The total population of Region I increased by 1.09 percent annually, on average, during the period 2010 to 2015. By comparison, the rate at which the region’s total population grew during the period 2000 to 2010 was higher at 1.23 percent. See Table 2.
Among the four provinces comprising the region, Pangasinan had the biggest total
population in 2015 with 2.96 million, followed by La Union with 787 thousand, and Ilocos Sur with 690 thousand. Ilocos Norte had the smallest total population with 593 thousand. Refer to Table 3.
The total population of Region I accounted for about 5.0 percent of the total Philippine population in 2015.
Table 3. Total Population by Province: Region I – Ilocos (Based on the 2000, 2010, and 2015 Censuses)
Province Total Population (in thousands)
2000 2010 2015
Ilocos Norte 514 568 593
Ilocos Sur 594 659 690
La Union 658 742 787
Pangasinan 2,434 2,780 2,957

Highlights 2015 Census of Population
Philippine Statistics Authority xxviii
Pangasinan was the fastest growing province in the region with an average annual population growth rate (PGR) of 1.18 percent during the period 2010 to 2015. It was followed by La Union (1.12 percent) and Ilocos Sur (0.88 percent). Ilocos Norte posted the lowest PGR of 0.83 percent. See Table 4.
Table 4. Annual Population Growth Rate by Province: Region I – Ilocos (Based on the 2000, 2010, and 2015 Censuses)
Province Population Growth Rate
2010-2015 2000-2010
Ilocos Norte 0.83 1.00
Ilocos Sur 0.88 1.03
La Union 1.12 1.21
Pangasinan 1.18 1.34
Region I is composed of nine cities, 116 municipalities, and 3,265 barangays.
Among the cities and municipalities in the region, the largest in terms of total
population size is San Carlos City, Pangasinan with 188,571 persons. It was followed by two other cities in Pangasinan – Dagupan City (171,271) and the City of Urdaneta (132,940). Five other municipalities in Pangasinan and one city each in La Union and Ilocos Norte comprise the rest of the top ten most populous cities/municipalities in Region I. Refer to Table 5.
Table 5. Top Ten Most Populous Cities/Municipalities: Region I – Ilocos, 2015
Rank City/Municipality Province Total
Population
1 San Carlos City Pangasinan 188,571
2 Dagupan City Pangasinan 171,271
3 City of Urdaneta Pangasinan 132,940
4 Malasiqui Pangasinan 130,275
5 City of San Fernando La Union 121,812
6 Bayambang Pangasinan 118,205
7 Laoag City Ilocos Norte 111,125
8 Mangaldan Pangasinan 106,331
9 Lingayen Pangasinan 103,278
10 Calasiao Pangasinan 95,154

2015 Census of Population Highlights
Philippine Statistics Authority xxix
Carasi in Ilocos Norte is the least populous city/municipality in Region I with 1,567 persons. It was followed by Adams, Ilocos Norte (1,792) and Sigay, Ilocos Sur (2,737). The rest of the ten least populous cities/municipalities in the region are located either in the province of Ilocos Norte or in the province of Ilocos Sur. See Table 6.
Table 6. Ten Least Populous Cities/Municipalities: Region I – Ilocos, 2015
Rank City/Municipality Province Total
Population
1 Carasi Ilocos Norte 1,567
2 Adams Ilocos Norte 1,792
3 Sigay Ilocos Sur 2,737
4 Dumalneg Ilocos Norte 2,947
5 Sugpon Ilocos Sur 4,585
6 Lidlidda Ilocos Sur 4,647
7 Gregorio del Pilar (Concepcion) Ilocos Sur 4,875
8 Nagbukel Ilocos Sur 5,259
9 Alilem Ilocos Sur 6,695
10 San Emilio Ilocos Sur 7,407
Of the 3,265 barangays in Region I, the largest in terms of total population size is
Bonuan Gueset in Dagupan City, Pangasinan with 23,373 persons. It was followed by two other barangays in Dagupan City, Pangasinan – Pantal (17,841) and Bonuan Boquig (14,354). The rest of the top ten most populous barangays in the region are located either in the province of Pangasinan or in the province of La Union. Refer to Table 7.
Table 7. Top Ten Most Populous Barangays: Region I – Ilocos, 2015
Rank Barangay City/Municipality/Province Total
Population
1 Bonuan Gueset Dagupan City, Pangasinan 23,373
2 Pantal Dagupan City, Pangasinan 17,841
3 Bonuan Boquig Dagupan City, Pangasinan 14,354
4 Poblacion Lingayen, Pangasinan 12,238
5 Sevilla City of San Fernando, La Union 11,470
6 San Vicente City of Urdaneta, Pangasinan 10,572
7 Poblacion City of Alaminos, Pangasinan 10,302
8 Lucao Dagupan City, Pangasinan 10,252
9 Poblacion Bugallon, Pangasinan 9,999
10 Catbangen City of San Fernando, La Union 9,781

Highlights 2015 Census of Population
Philippine Statistics Authority xxx
The household population of Region I in 2015 was 5.01 million persons, higher by 272 thousand from the household population of 4.74 million in 2010, and by 818 thousand from the household population of 4.20 million in 2000. See Table 8.
Table 8. Household Population, Number of Households, and Average Household Size:
Region I – Ilocos (Based on the 2000, 2010, and 2015 Censuses)
Census Year Household Population
(in thousands)
Number of Households (in thousands)
Average Household
Size
2000 4,196 832 5.0
2010 4,743 1,051 4.5
2015 5,015 1,152 4.4
The total number of households in Region I in 2015 was recorded at 1.15 million, higher by 101 thousand compared with the 1.05 million households posted in 2010. In 2000, the total number of households in the region was 832 thousand.
The region’s average household size (AHS) in 2015 was 4.4 persons, lower than the AHS of 4.5 persons in 2010. In 2000, there were 5.0 persons, on average, per household.
Among the four provinces in Region I, Pangasinan had the most number of households with 675 thousand, followed by La Union with 181 thousand and Ilocos Sur with 157 thousand. Ilocos Norte had the least number of households with 139 thousand. Refer to Table 9.
Table 9. Household Population, Number of Households, and Average Household Size by Province: Region I – Ilocos, 2015
Province Household Population
(in thousands)
Number of Households (in thousands)
Average Household
Size
Ilocos Norte 591 139 4.2
Ilocos Sur 688 157 4.4
La Union 785 181 4.3
Pangasinan 2,951 675 4.4
Ilocos Sur and Pangasinan had the same AHS of 4.4 persons. La Union and Ilocos Norte posted an AHS of 4.3 persons and 4.2 persons, respectively.

2015 Census of Population Summary Table
2000-
2010
2010-
2015
2000-
2015
PHILIPPINES 76,506,928 a 92,337,852 b 100,981,437 c 1.90 1.72 1.84
NATIONAL CAPITAL REGION (NCR) 9,932,560 11,855,975 12,877,253 1.78 1.58 1.72CITY OF MANILA 1,581,082 1,652,171 1,780,148 0.44 1.43 0.78CITY OF MANDALUYONG 278,474 328,699 386,276 1.67 3.12 2.17CITY OF MARIKINA 391,170 424,150 450,741 0.81 1.16 0.93CITY OF PASIG 505,058 669,773 755,300 2.86 2.31 2.67QUEZON CITY 2,173,831 2,761,720 2,936,116 2.42 1.17 1.99CITY OF SAN JUAN 117,680 121,430 122,180 0.31 0.12 0.25CALOOCAN CITY 1,177,604 1,489,040 1,583,978 2.37 1.18 1.96CITY OF MALABON 338,855 353,337 365,525 0.42 0.65 0.50CITY OF NAVOTAS 230,403 249,131 249,463 0.78 0.03 0.52CITY OF VALENZUELA 485,433 575,356 620,422 1.71 1.45 1.62CITY OF LAS PIÑAS 472,780 552,573 588,894 1.57 1.22 1.45CITY OF MAKATI 471,379 529,039 582,602 1.16 1.85 1.40CITY OF MUNTINLUPA 379,310 459,941 504,509 1.95 1.78 1.89CITY OF PARAÑAQUE 449,811 588,126 665,822 2.72 2.39 2.60PASAY CITY 354,908 392,869 416,522 1.02 1.12 1.05PATEROS 57,407 64,147 63,840 1.12 -0.09 0.70TAGUIG CITY 467,375 644,473 804,915 3.26 4.32 3.63
CORDILLERA ADMINISTRATIVE REGION (CAR) 1,365,412 1,616,867 1,722,006 1.70 1.21 1.53ABRA 209,491 234,733 241,160 1.14 0.52 0.93BENGUET (excluding BAGUIO CITY) 330,129 403,944 446,224 2.04 1.91 1.99BAGUIO CITY 252,386 318,676 345,366 2.36 1.54 2.08IFUGAO 161,623 191,078 202,802 1.69 1.14 1.50KALINGA 174,023 201,613 212,680 1.48 1.02 1.32MOUNTAIN PROVINCE 140,631 154,187 154,590 0.92 0.05 0.62APAYAO 97,129 112,636 119,184 1.49 1.08 1.35
REGION I - ILOCOS 4,200,478 4,748,372 5,026,128 1.23 1.09 1.18ILOCOS NORTE 514,241 568,017 593,081 1.00 0.83 0.94ILOCOS SUR 594,206 658,587 689,668 1.03 0.88 0.98LA UNION 657,945 741,906 786,653 1.21 1.12 1.18PANGASINAN 2,434,086 2,779,862 2,956,726 1.34 1.18 1.28
REGION II - CAGAYAN VALLEY 2,813,159 3,229,163 3,451,410 1.39 1.27 1.35BATANES 16,467 16,604 17,246 0.08 0.72 0.30CAGAYAN 993,580 1,124,773 1,199,320 1.25 1.23 1.24ISABELA 1,287,575 1,489,645 1,593,566 1.47 1.29 1.41NUEVA VIZCAYA 366,962 421,355 452,287 1.39 1.36 1.38QUIRINO 148,575 176,786 188,991 1.75 1.28 1.59
REGION III - CENTRAL LUZON 8,204,742 10,137,737 11,218,177 2.14 1.95 2.07BATAAN 557,659 687,482 760,650 2.11 1.94 2.06BULACAN 2,234,088 2,924,433 3,292,071 2.73 2.28 2.57NUEVA ECIJA 1,659,883 1,955,373 2,151,461 1.65 1.84 1.71PAMPANGA (excluding ANGELES CITY) 1,614,942 2,014,019 2,198,110 2.23 1.68 2.04ANGELES CITY 267,788 326,336 411,634 2.00 4.52 2.86TARLAC 1,068,783 1,273,240 1,366,027 1.76 1.35 1.62ZAMBALES (excluding OLONGAPO CITY) 433,542 534,443 590,848 2.11 1.93 2.05OLONGAPO CITY 194,260 221,178 233,040 1.31 1.00 1.20AURORA 173,797 201,233 214,336 1.48 1.21 1.38
REGION IV-A - CALABARZON 9,320,629 12,609,803 14,414,774 3.07 2.58 2.90BATANGAS 1,905,348 2,377,395 2,694,335 2.24 2.41 2.30CAVITE 2,063,161 3,090,691 3,678,301 4.12 3.37 3.86LAGUNA 1,965,872 2,669,847 3,035,081 3.11 2.47 2.89QUEZON (excluding LUCENA CITY) 1,482,955 1,740,638 1,856,582 1.61 1.23 1.48LUCENA CITY 196,075 246,392 266,248 2.31 1.49 2.02RIZAL 1,707,218 2,484,840 2,884,227 3.82 2.88 3.50
TABLE A. POPULATION AND ANNUAL POPULATION GROWTH RATES FOR THE PHILIPPINES AND ITS REGIONS, PROVINCES, AND HIGHLY URBANIZED CITIES: 2000, 2010, AND 2015
REGION, PROVINCE, AND HIGHLY URBANIZED CITYPOPULATION GROWTH RATE
1-May-00 1-May-10 1-Aug-15
TOTAL POPULATION
Philippine Statistics Authority xxxi

Summary Table 2015 Census of Population
2000-
2010
2010-
2015
2000-
2015
TABLE A. POPULATION AND ANNUAL POPULATION GROWTH RATES FOR THE PHILIPPINES AND ITS REGIONS, PROVINCES, AND HIGHLY URBANIZED CITIES: 2000, 2010, AND 2015
REGION, PROVINCE, AND HIGHLY URBANIZED CITYPOPULATION GROWTH RATE
1-May-00 1-May-10 1-Aug-15
TOTAL POPULATION
MIMAROPA REGION 1 2,299,229 2,744,671 2,963,360 1.79 1.47 1.68MARINDUQUE 217,392 227,828 234,521 0.47 0.55 0.50OCCIDENTAL MINDORO 380,250 452,971 487,414 1.76 1.40 1.64ORIENTAL MINDORO 681,818 785,602 844,059 1.43 1.38 1.41PALAWAN (excluding PUERTO PRINCESA CITY) 593,500 771,667 849,469 2.66 1.84 2.38PUERTO PRINCESA CITY 161,912 222,673 255,116 3.24 2.62 3.02ROMBLON 264,357 283,930 292,781 0.72 0.59 0.67
REGION V - BICOL 4,686,669 5,420,411 5,796,989 1.46 1.29 1.40ALBAY 1,090,907 1,233,432 1,314,826 1.23 1.22 1.23CAMARINES NORTE 470,654 542,915 583,313 1.44 1.38 1.42CAMARINES SUR 1,551,549 1,822,371 1,952,544 1.62 1.32 1.52CATANDUANES 215,356 246,300 260,964 1.35 1.11 1.27MASBATE 707,668 834,650 892,393 1.66 1.28 1.53SORSOGON 650,535 740,743 792,949 1.31 1.30 1.31
REGION VI - WESTERN VISAYAS 3,645,315 4,194,579 4,477,247 1.41 1.25 1.36AKLAN 451,314 535,725 574,823 1.73 1.35 1.60ANTIQUE 472,822 546,031 582,012 1.45 1.22 1.37CAPIZ 654,156 719,685 761,384 0.96 1.08 1.00ILOILO (excluding ILOILO CITY) 1,559,182 1,805,576 1,936,423 1.48 1.34 1.43ILOILO CITY 366,391 424,619 447,992 1.49 1.02 1.33GUIMARAS 141,450 162,943 174,613 1.42 1.33 1.39
REGION VII - CENTRAL VISAYAS 4,576,865 5,513,514 6,041,903 1.88 1.76 1.84BOHOL 1,139,130 1,255,128 1,313,560 0.97 0.87 0.94CEBU (excluding the cities of CEBU, LAPU-LAPU, and MANDAUE) 2,160,569 2,619,362 2,938,982 1.94 2.22 2.04CEBU CITY 718,821 866,171 922,611 1.88 1.21 1.65LAPU-LAPU CITY (OPON) 217,019 350,467 408,112 4.91 2.94 4.23MANDAUE CITY 259,728 331,320 362,654 2.46 1.73 2.21SIQUIJOR 81,598 91,066 95,984 1.10 1.01 1.07
NEGROS ISLAND REGION (NIR) 2 3,695,811 4,194,525 4,414,131 1.27 0.98 1.17
NEGROS OCCIDENTAL (excluding BACOLOD CITY) 3 2,136,647 2,396,039 2,497,261 1.15 0.79 1.03BACOLOD CITY 429,076 511,820 561,875 1.78 1.79 1.78
NEGROS ORIENTAL 4 1,130,088 1,286,666 1,354,995 1.31 0.99 1.20
REGION VIII - EASTERN VISAYAS 3,610,355 4,101,322 4,440,150 1.28 1.52 1.36EASTERN SAMAR 375,822 428,877 467,160 1.33 1.64 1.44LEYTE (excluding TACLOBAN CITY) 1,413,697 1,567,984 1,724,679 1.04 1.83 1.31TACLOBAN CITY 178,639 221,174 242,089 2.16 1.73 2.01NORTHERN SAMAR 500,639 589,013 632,379 1.64 1.36 1.54SAMAR (WESTERN SAMAR) 641,124 733,377 780,481 1.35 1.19 1.30SOUTHERN LEYTE 360,160 399,137 421,750 1.03 1.05 1.04BILIRAN 140,274 161,760 171,612 1.43 1.13 1.33
REGION IX - ZAMBOANGA PENINSULA 2,831,412 3,407,353 3,629,783 1.87 1.21 1.64ZAMBOANGA DEL NORTE 823,130 957,997 1,011,393 1.53 1.04 1.36ZAMBOANGA DEL SUR (excluding ZAMBOANGA CITY) 836,217 959,685 1,010,674 1.39 0.99 1.25ZAMBOANGA CITY 601,794 807,129 861,799 2.98 1.26 2.38ZAMBOANGA SIBUGAY 497,239 584,685 633,129 1.63 1.53 1.60CITY OF ISABELA 73,032 97,857 112,788 2.97 2.74 2.89
REGION X - NORTHERN MINDANAO 3,505,708 4,297,323 4,689,302 2.06 1.68 1.92BUKIDNON 1,060,415 1,299,192 1,415,226 2.05 1.64 1.91CAMIGUIN 74,232 83,807 88,478 1.22 1.04 1.16LANAO DEL NORTE (excluding ILIGAN CITY) 473,062 607,917 676,395 2.54 2.05 2.37ILIGAN CITY 285,061 322,821 342,618 1.25 1.14 1.21MISAMIS OCCIDENTAL 486,723 567,642 602,126 1.55 1.13 1.40MISAMIS ORIENTAL (excluding CAGAYAN DE ORO CITY) 664,338 813,856 888,509 2.05 1.68 1.92CAGAYAN DE ORO CITY 461,877 602,088 675,950 2.69 2.23 2.53
xxxii Philippine Statistics Authority

2015 Census of Population Summary Table
2000-
2010
2010-
2015
2000-
2015
TABLE A. POPULATION AND ANNUAL POPULATION GROWTH RATES FOR THE PHILIPPINES AND ITS REGIONS, PROVINCES, AND HIGHLY URBANIZED CITIES: 2000, 2010, AND 2015
REGION, PROVINCE, AND HIGHLY URBANIZED CITYPOPULATION GROWTH RATE
1-May-00 1-May-10 1-Aug-15
TOTAL POPULATION
REGION XI - DAVAO 3,676,163 4,468,563 4,893,318 1.97 1.74 1.89DAVAO DEL NORTE 743,811 945,764 1,016,332 2.43 1.38 2.07DAVAO DEL SUR (excluding DAVAO CITY) 504,289 574,910 632,588 1.32 1.84 1.50DAVAO CITY 1,147,116 1,449,296 1,632,991 2.36 2.30 2.34DAVAO ORIENTAL 446,191 517,618 558,958 1.50 1.47 1.49COMPOSTELA VALLEY 580,244 687,195 736,107 1.71 1.32 1.57
DAVAO OCCIDENTAL 5 254,512 293,780 316,342 1.44 1.42 1.44
REGION XII - SOCCSKSARGEN 3,222,169 4,109,571 4,545,276 2.46 1.94 2.28COTABATO (NORTH COTABATO) 958,643 1,226,508 1,379,747 2.49 2.27 2.41SOUTH COTABATO (excluding GENERAL SANTOS CITY) 690,728 827,200 915,289 1.82 1.94 1.86GENERAL SANTOS CITY (DADIANGAS) 411,822 538,086 594,446 2.71 1.91 2.43SULTAN KUDARAT 586,505 747,087 812,095 2.45 1.60 2.16SARANGANI 410,622 498,904 544,261 1.97 1.67 1.86COTABATO CITY 163,849 271,786 299,438 5.19 1.86 4.03
REGION XIII - CARAGA 2,095,367 2,429,224 2,596,709 1.49 1.28 1.42AGUSAN DEL NORTE (excluding BUTUAN CITY) 285,570 332,487 354,503 1.53 1.23 1.43BUTUAN CITY 267,279 309,709 337,063 1.48 1.62 1.53AGUSAN DEL SUR 559,294 656,418 700,653 1.61 1.25 1.49SURIGAO DEL NORTE 374,465 442,588 485,088 1.68 1.76 1.71SURIGAO DEL SUR 501,808 561,219 592,250 1.12 1.03 1.09DINAGAT ISLANDS 106,951 126,803 127,152 1.72 0.05 1.14
AUTONOMOUS REGION IN MUSLIM MINDANAO (ARMM) 2,803,045 3,256,140 3,781,387 1.51 2.89 1.98BASILAN (excluding CITY OF ISABELA) 259,796 293,322 346,579 1.22 3.23 1.91LANAO DEL SUR 800,162 933,260 1,045,429 1.55 2.18 1.77MAGUINDANAO (excluding COTABATO CITY) 801,102 944,718 1,173,933 1.66 4.22 2.54SULU 619,668 718,290 824,731 1.49 2.66 1.89TAWI-TAWI 322,317 366,550 390,715 1.29 1.22 1.27
Notes:a Population counts for the regions do not add up to the national total. Includes 18,989 persons residing in the areas disputed by the City of Pasig
(National Capital Region) and the province of Rizal (Region IV-A); and 2,851 Filipinos in Philippine embassies,consulates and missions abroad.
b Population counts for the regions do not add up to the national total. Includes 2,739 Filipinos in Philippine embassies, consulates, and missions abroad.c Population counts for the regions do not add up to the national total. Includes 2,134 Filipinos in Philippine embassies, consulates, and missions abroad.
1 Renamed pursuant to Republic Act No. 10879, also known as the MIMAROPA Act, which took effect on 17 July 2016.2 Created into a region under Executive Order No. 183.3 Transferred province under Executive Order No. 183; taken from Region VI - Western Visayas.4 Transferred province under Executive Order No. 183; taken from Region VII - Central Visayas.5 Created into a province under Republic Act No. 10360 dated July 23, 2012; ratified on October 28, 2013; taken from the province of Davao del Sur.
Sources:Philippine Statistics Authority, 2000 Census of Population and HousingPhilippine Statistics Authority, 2010 Census of Population and HousingPhilippine Statistics Authority, 2015 Census of Population
Philippine Statistics Authority xxxiii

Summary Table 2015 Census of Population
2000-
2010
2010-
2015
2000-
2015
REGION I - ILOCOS 4,200,478 4,748,372 5,026,128 1.23 1.09 1.18
ILOCOS NORTE 514,241 568,017 593,081 1.00 0.83 0.94ADAMS 1,480 1,785 1,792 1.89 0.07 1.26BACARRA 29,668 31,648 32,215 0.65 0.34 0.54BADOC 27,862 30,708 31,616 0.98 0.56 0.83BANGUI 13,602 14,227 14,672 0.45 0.59 0.50CITY OF BATAC 47,682 53,542 55,201 1.17 0.58 0.96BURGOS 8,534 9,687 9,777 1.27 0.18 0.90CARASI 1,154 1,473 1,567 2.47 1.18 2.02CURRIMAO 10,615 11,970 12,184 1.21 0.34 0.91DINGRAS 33,310 37,021 38,562 1.06 0.78 0.96DUMALNEG 2,211 2,612 2,947 1.68 2.32 1.90BANNA (ESPIRITU) 16,704 19,051 19,438 1.32 0.38 1.00LAOAG CITY (Capital) 94,466 104,904 111,125 1.05 1.10 1.07MARCOS 15,154 16,984 17,777 1.15 0.87 1.05NUEVA ERA 6,095 7,837 9,506 2.54 3.74 2.96PAGUDPUD 19,315 21,877 23,770 1.25 1.59 1.37PAOAY 21,745 23,956 24,866 0.97 0.71 0.88PASUQUIN 24,739 27,952 28,980 1.23 0.69 1.04PIDDIG 19,059 20,606 21,497 0.78 0.81 0.79PINILI 15,903 16,732 17,300 0.51 0.64 0.55SAN NICOLAS 31,688 34,237 36,736 0.78 1.35 0.97SARRAT 22,886 24,770 25,212 0.79 0.34 0.64SOLSONA 21,338 22,990 24,121 0.75 0.92 0.81VINTAR 29,031 31,448 32,220 0.80 0.46 0.69
ILOCOS SUR 594,206 658,587 689,668 1.03 0.88 0.98ALILEM 6,353 6,640 6,695 0.44 0.16 0.34BANAYOYO 6,728 7,694 7,748 1.35 0.13 0.93BANTAY 30,519 34,323 35,731 1.18 0.77 1.04BURGOS 11,175 11,679 12,224 0.44 0.87 0.59CABUGAO 31,459 35,706 37,501 1.27 0.94 1.16CITY OF CANDON 50,564 57,884 60,623 1.36 0.88 1.20CAOAYAN 17,199 18,551 19,861 0.76 1.31 0.95CERVANTES 14,195 16,573 17,211 1.56 0.72 1.27GALIMUYOD 8,879 10,011 10,748 1.21 1.36 1.26GREGORIO DEL PILAR (CONCEPCION) 4,134 4,219 4,875 0.20 2.79 1.09LIDLIDDA 4,022 4,398 4,647 0.90 1.05 0.95MAGSINGAL 25,580 28,302 30,792 1.02 1.62 1.22NAGBUKEL 4,671 4,938 5,259 0.56 1.21 0.78NARVACAN 38,435 42,803 44,006 1.08 0.53 0.89QUIRINO (ANGKAKI) 7,130 8,535 8,573 1.81 0.08 1.22SALCEDO (BAUGEN) 10,409 10,935 11,288 0.49 0.61 0.53SAN EMILIO 6,717 7,427 7,407 1.01 -0.05 0.64SAN ESTEBAN 7,174 8,072 8,349 1.19 0.64 1.00SAN ILDEFONSO 5,584 7,075 7,787 2.39 1.84 2.20SAN JUAN (LAPOG) 23,146 25,199 26,411 0.85 0.90 0.87SAN VICENTE 10,877 11,720 12,758 0.75 1.63 1.05SANTA 13,918 15,106 15,340 0.82 0.29 0.64SANTA CATALINA 12,537 13,597 13,945 0.81 0.48 0.70SANTA CRUZ 34,433 37,911 39,868 0.97 0.96 0.97SANTA LUCIA 22,363 24,981 25,402 1.11 0.32 0.84SANTA MARIA 26,396 28,597 30,321 0.80 1.12 0.91SANTIAGO 15,876 17,958 18,759 1.24 0.83 1.10SANTO DOMINGO 24,520 27,596 27,975 1.19 0.26 0.87SIGAY 2,375 2,419 2,737 0.18 2.38 0.93SINAIT 24,070 25,427 25,640 0.55 0.16 0.41SUGPON 3,513 3,820 4,585 0.84 3.53 1.76SUYO 9,685 10,622 11,446 0.93 1.43 1.10TAGUDIN 34,427 38,122 39,277 1.02 0.57 0.87
TABLE B. POPULATION AND ANNUAL POPULATION GROWTH RATES BY PROVINCE, CITY, AND MUNICIPALITYIN REGION I - ILOCOS: 2000, 2010, AND 2015
POPULATION GROWTH RATE
PROVINCE, CITY, AND MUNICIPALITY1-May-00 1-May-10 1-Aug-15
TOTAL POPULATION
xxxiv Philippine Statistics Authority

2015 Census of Population Summary Table
2000-
2010
2010-
2015
2000-
2015
TABLE B. POPULATION AND ANNUAL POPULATION GROWTH RATES BY PROVINCE, CITY, AND MUNICIPALITYIN REGION I - ILOCOS: 2000, 2010, AND 2015
POPULATION GROWTH RATE
PROVINCE, CITY, AND MUNICIPALITY1-May-00 1-May-10 1-Aug-15
TOTAL POPULATION
CITY OF VIGAN (Capital) 45,143 49,747 53,879 0.98 1.53 1.17
LA UNION 657,945 741,906 786,653 1.21 1.12 1.18AGOO 51,923 60,596 63,692 1.56 0.95 1.35ARINGAY 41,422 44,949 47,458 0.82 1.04 0.90BACNOTAN 35,419 40,307 42,078 1.30 0.82 1.14BAGULIN 11,857 12,590 13,456 0.60 1.27 0.83BALAOAN 33,786 37,910 39,188 1.16 0.63 0.98BANGAR 31,491 34,522 35,947 0.92 0.77 0.87BAUANG 63,373 70,735 75,032 1.10 1.13 1.11BURGOS 6,748 7,850 8,067 1.52 0.52 1.18CABA 19,565 21,244 22,039 0.83 0.70 0.78LUNA 32,259 35,380 35,802 0.93 0.23 0.69NAGUILIAN 43,501 48,407 54,221 1.07 2.18 1.45PUGO 13,442 16,518 19,690 2.08 3.40 2.53ROSARIO 43,497 52,679 55,458 1.93 0.98 1.60CITY OF SAN FERNANDO (Capital) 102,082 114,963 121,812 1.19 1.11 1.16SAN GABRIEL 14,909 16,628 18,172 1.10 1.70 1.31SAN JUAN 30,393 35,098 37,188 1.45 1.11 1.33SANTO TOMAS 31,204 35,999 39,092 1.44 1.58 1.49SANTOL 11,202 12,007 12,476 0.70 0.73 0.71SUDIPEN 15,099 16,531 17,056 0.91 0.60 0.80TUBAO 24,773 26,993 28,729 0.86 1.19 0.98
PANGASINAN 2,434,086 2,779,862 2,956,726 1.34 1.18 1.28AGNO 25,077 27,508 28,052 0.93 0.37 0.74AGUILAR 33,213 39,529 41,463 1.76 0.91 1.46CITY OF ALAMINOS 73,448 85,025 89,708 1.47 1.03 1.32ALCALA 35,734 41,077 43,402 1.40 1.05 1.28ANDA 32,833 37,011 39,504 1.20 1.25 1.22ASINGAN 51,225 56,353 57,355 0.96 0.34 0.74BALUNGAO 23,813 26,678 31,106 1.14 2.97 1.77BANI 42,824 45,758 50,306 0.66 1.82 1.06BASISTA 26,616 30,385 32,959 1.33 1.56 1.41BAUTISTA 27,066 30,193 32,307 1.10 1.30 1.17BAYAMBANG 96,609 111,521 118,205 1.44 1.11 1.33BINALONAN 48,967 52,832 54,555 0.76 0.61 0.71BINMALEY 72,625 78,702 83,052 0.81 1.03 0.88BOLINAO 61,068 74,545 82,084 2.01 1.85 1.96BUGALLON 57,445 64,253 67,348 1.13 0.90 1.05BURGOS 18,142 18,315 21,637 0.09 3.22 1.16CALASIAO 77,039 91,109 95,154 1.69 0.83 1.39DAGUPAN CITY 130,328 163,676 171,271 2.30 0.87 1.81DASOL 25,381 26,991 29,110 0.62 1.45 0.90INFANTA 20,632 23,455 24,584 1.29 0.90 1.16LABRADOR 19,264 21,149 23,201 0.94 1.78 1.23LINGAYEN (Capital) 88,891 98,740 103,278 1.06 0.86 0.99MABINI 21,035 24,011 24,765 1.33 0.59 1.08MALASIQUI 113,190 123,566 130,275 0.88 1.01 0.93MANAOAG 54,743 64,578 69,497 1.67 1.41 1.58MANGALDAN 82,142 98,905 106,331 1.87 1.39 1.71MANGATAREM 60,943 69,969 73,241 1.39 0.87 1.21MAPANDAN 30,775 34,439 37,059 1.13 1.41 1.23NATIVIDAD 19,870 22,713 24,299 1.35 1.29 1.33POZORRUBIO 58,252 66,111 69,555 1.27 0.97 1.17ROSALES 52,086 59,687 63,081 1.37 1.06 1.26SAN CARLOS CITY 154,264 175,103 188,571 1.27 1.42 1.32SAN FABIAN 66,274 77,899 83,025 1.63 1.22 1.49SAN JACINTO 32,758 37,737 40,848 1.42 1.52 1.46SAN MANUEL 41,206 46,875 52,939 1.30 2.34 1.66SAN NICOLAS 31,418 34,108 35,574 0.82 0.80 0.82
Philippine Statistics Authority xxxv

Summary Table 2015 Census of Population
2000-
2010
2010-
2015
2000-
2015
TABLE B. POPULATION AND ANNUAL POPULATION GROWTH RATES BY PROVINCE, CITY, AND MUNICIPALITYIN REGION I - ILOCOS: 2000, 2010, AND 2015
POPULATION GROWTH RATE
PROVINCE, CITY, AND MUNICIPALITY1-May-00 1-May-10 1-Aug-15
TOTAL POPULATION
SAN QUINTIN 28,258 32,626 32,945 1.45 0.19 1.01SANTA BARBARA 64,261 76,637 82,012 1.78 1.30 1.61SANTA MARIA 27,860 31,091 33,038 1.10 1.16 1.12SANTO TOMAS 12,304 14,406 15,022 1.59 0.80 1.32SISON 40,955 43,979 47,518 0.71 1.48 0.98SUAL 25,832 31,216 34,149 1.91 1.72 1.85TAYUG 36,199 40,018 43,149 1.01 1.44 1.16UMINGAN 58,603 67,534 73,252 1.43 1.56 1.47URBIZTONDO 40,089 47,831 50,170 1.78 0.91 1.48CITY OF URDANETA 111,582 125,451 132,940 1.18 1.11 1.15VILLASIS 54,224 59,111 62,333 0.87 1.02 0.92LAOAC 26,723 29,456 31,497 0.98 1.28 1.08
Sources:Philippine Statistics Authority, 2000 Census of Population and HousingPhilippine Statistics Authority, 2010 Census of Population and HousingPhilippine Statistics Authority, 2015 Census of Population
xxxvi Philippine Statistics Authority

2015 Census of Population Summary Table
REGION, PROVINCE, AND HIGHLY URBANIZED CITY
TABLE C. TOTAL POPULATION, HOUSEHOLD POPULATION, NUMBER OF HOUSEHOLDS, AND AVERAGE HOUSEHOLD SIZE BY REGION, PROVINCE, AND HIGHLY URBANIZED CITY AS OF AUGUST 1, 2015: PHILIPPINES
HOUSEHOLD
POPULATION
NUMBER
OF HOUSEHOLDS
AVERAGE
HOUSEHOLD SIZE
TOTAL
POPULATION
Philippine Statistics Authority xxxvii
Philippine Statistics Authority xxxvii
100,981,437a
100,573,715 22,975,630 4.4
12,877,253 12,787,669 3,095,766 4.1
1,780,148 1,763,348 435,237 4.1 386,276 377,850 100,356 3.8 450,741 448,893 98,238 4.6 755,300 753,030 180,612 4.2
2,936,116 2,919,657 683,126 4.3 122,180 121,197 28,740 4.2
1,583,978 1,581,025 367,878 4.3 365,525 364,283 86,191 4.2 249,463 249,176 60,904 4.1 620,422 619,324 153,041 4.0 588,894 587,675 141,925 4.1 582,602 579,433 154,095 3.8 504,509 481,762 122,286 3.9 665,822 663,733 163,074 4.1 416,522 412,497 107,619 3.8 63,840 63,643 14,188 4.5
804,915 801,143 198,256 4.0
1,722,006 1,714,220 395,881 4.3
241,160 240,233 53,062 4.5 446,224 444,634 106,838 4.2 345,366 342,200 89,987 3.8 202,802 202,519 43,281 4.7 212,680 212,003 42,115 5.0 154,590 153,978 35,038 4.4 119,184 118,653 25,560 4.6
5,026,128 5,014,622 1,151,629 4.4
593,081 591,198 139,336 4.2 689,668 687,511 157,043 4.4 786,653 784,646 180,675 4.3
2,956,726 2,951,267 674,575 4.4
3,451,410 3,443,493 804,524 4.3
17,246 17,108 4,761 3.6 1,199,320 1,195,523 271,967 4.4 1,593,566 1,591,017 372,950 4.3
452,287 451,121 111,340 4.1 188,991 188,724 43,506 4.3
11,218,177 11,184,068 2,566,558 4.4
760,650 755,296 173,212 4.4 3,292,071 3,283,215 760,964 4.3 2,151,461 2,147,656 496,977 4.3 2,198,110 2,193,394 479,082 4.6
411,634 408,885 96,219 4.2 1,366,027 1,361,763 311,994 4.4
590,848 588,353 142,218 4.1 233,040 231,823 56,482 4.1 214,336 213,683 49,410 4.3
14,414,774 14,365,137 3,395,383 4.2
2,694,335 2,686,444 613,825 4.4 3,678,301 3,662,844 877,767 4.2 3,035,081 3,021,537 765,513 3.9 1,856,582 1,851,792 425,837 4.3
266,248 265,011 59,836 4.4
PHILIPPINES
NATIONAL CAPITAL REGION (NCR)
CITY OF MANILACITY OF MANDALUYONGCITY OF MARIKINACITY OF PASIGQUEZON CITYCITY OF SAN JUANCALOOCAN CITYCITY OF MALABONCITY OF NAVOTASCITY OF VALENZUELACITY OF LAS PIÑASCITY OF MAKATICITY OF MUNTINLUPACITY OF PARAÑAQUEPASAY CITYPATEROSTAGUIG CITY
CORDILLERA ADMINISTRATIVE REGION (CAR)
ABRABENGUET (excluding BAGUIO CITY)BAGUIO CITYIFUGAOKALINGAMOUNTAIN PROVINCEAPAYAO
REGION I - ILOCOS
ILOCOS NORTEILOCOS SURLA UNIONPANGASINAN
REGION II - CAGAYAN VALLEY
BATANESCAGAYANISABELANUEVA VIZCAYAQUIRINO
REGION III - CENTRAL LUZON
BATAANBULACANNUEVA ECIJAPAMPANGA (excluding ANGELES CITY)ANGELES CITYTARLACZAMBALES (excluding OLONGAPO CITY)OLONGAPO CITYAURORA
REGION IV-A - CALABARZON
BATANGASCAVITELAGUNAQUEZON (excluding LUCENA CITY)LUCENA CITYRIZAL 2,884,227 2,877,509 652,605 4.4

Summary Table 2015 Census of Population
REGION, PROVINCE, AND HIGHLY URBANIZED CITY
TABLE C. TOTAL POPULATION, HOUSEHOLD POPULATION, NUMBER OF HOUSEHOLDS, AND AVERAGE HOUSEHOLD SIZE BY REGION, PROVINCE, AND HIGHLY URBANIZED CITY AS OF AUGUST 1, 2015: PHILIPPINES
HOUSEHOLD
POPULATION
NUMBER
OF HOUSEHOLDS
AVERAGE
HOUSEHOLD SIZE
TOTAL
POPULATION
xxxviii Philippine Statistics Authority
2,963,360 2,946,505 682,668 4.3
234,521 234,031 54,508 4.3 487,414 483,472 111,714 4.3 844,059 841,608 190,763 4.4 849,469 845,650 195,074 4.3 255,116 250,175 62,247 4.0 292,781 291,569 68,362 4.3
5,796,989 5,780,963 1,216,421 4.8
1,314,826 1,312,309 277,127 4.7 583,313 581,809 129,999 4.5
1,952,544 1,947,487 400,615 4.9 260,964 258,874 53,814 4.8 892,393 890,170 188,013 4.7 792,949 790,314 166,853 4.7
4,477,247 4,464,277 1,014,987 4.4
574,823 572,599 133,679 4.3 582,012 581,037 129,812 4.5 761,384 760,307 180,098 4.2
1,936,423 1,931,532 435,723 4.4 447,992 444,486 95,100 4.7 174,613 174,316 40,575 4.3
6,041,903 6,008,987 1,388,475 4.3
1,313,560 1,308,785 288,515 4.5 2,938,982 2,928,034 669,322 4.4
922,611 910,678 213,781 4.3 408,112 406,353 99,573 4.1 362,654 359,777 94,547 3.8 95,984 95,360 22,737 4.2
4,414,131 4,402,196 1,012,323 4.3
2,497,261 2,492,432 572,574 4.4 561,875 558,851 129,076 4.3
1,354,995 1,350,913 310,673 4.3
4,440,150 4,425,172 986,003 4.5
467,160 465,426 106,324 4.4 1,724,679 1,718,543 405,873 4.2
242,089 240,513 50,547 4.8 632,379 630,912 126,619 5.0 780,481 778,669 165,286 4.7 421,750 420,374 92,836 4.5 171,612 170,735 38,518 4.4
3,629,783 3,615,108 799,219 4.5
1,011,393 1,008,000 224,828 4.5 1,010,674 1,007,448 216,714 4.6
861,799 855,418 193,970 4.4 633,129 632,122 140,791 4.5 112,788 112,120 22,916 4.9
4,689,302 4,663,108 1,042,929 4.5
1,415,226 1,406,764 308,777 4.6 88,478 88,281 20,080 4.4
676,395 674,771 140,350 4.8 342,618 339,057 76,593 4.4 602,126 599,213 134,870 4.4 888,509 884,428 199,020 4.4
MIMAROPA REGION 1
MARINDUQUEOCCIDENTAL MINDOROORIENTAL MINDOROPALAWAN (excluding PUERTO PRINCESA CITY)PUERTO PRINCESA CITYROMBLON
REGION V - BICOL
ALBAYCAMARINES NORTECAMARINES SURCATANDUANESMASBATESORSOGON
REGION VI - WESTERN VISAYAS
AKLANANTIQUECAPIZILOILO (excluding ILOILO CITY)ILOILO CITYGUIMARAS
REGION VII - CENTRAL VISAYAS
BOHOLCEBU (excluding the cities of CEBU, LAPU-LAPU, and MANDAUE)CEBU CITYLAPU-LAPU CITY (OPON)MANDAUE CITYSIQUIJOR
NEGROS ISLAND REGION (NIR) 2
NEGROS OCCIDENTAL (excluding BACOLOD CITY) 3
BACOLOD CITYNEGROS ORIENTAL 4
REGION VIII - EASTERN VISAYAS
EASTERN SAMARLEYTE (excluding TACLOBAN CITY)TACLOBAN CITYNORTHERN SAMARSAMAR (WESTERN SAMAR)SOUTHERN LEYTEBILIRAN
REGION IX - ZAMBOANGA PENINSULA
ZAMBOANGA DEL NORTEZAMBOANGA DEL SUR (excluding ZAMBOANGA CITY)ZAMBOANGA CITYZAMBOANGA SIBUGAYCITY OF ISABELA
REGION X - NORTHERN MINDANAO
BUKIDNONCAMIGUINLANAO DEL NORTE (excluding ILIGAN CITY)ILIGAN CITYMISAMIS OCCIDENTALMISAMIS ORIENTAL (excluding CAGAYAN DE ORO CITY)CAGAYAN DE ORO CITY 675,950 670,594 163,239 4.1

2015 Census of Population Summary Table
REGION, PROVINCE, AND HIGHLY URBANIZED CITY
TABLE C. TOTAL POPULATION, HOUSEHOLD POPULATION, NUMBER OF HOUSEHOLDS, AND AVERAGE HOUSEHOLD SIZE BY REGION, PROVINCE, AND HIGHLY URBANIZED CITY AS OF AUGUST 1, 2015: PHILIPPINES
HOUSEHOLD
POPULATION
NUMBER
OF HOUSEHOLDS
AVERAGE
HOUSEHOLD SIZE
TOTAL
POPULATION
Philippine Statistics Authority xxxix
4,893,318 4,867,168 1,177,461 4.1
1,016,332 1,006,888 233,232 4.3 632,588 630,672 158,796 4.0
1,632,991 1,622,427 409,951 4.0 558,958 557,025 128,574 4.3 736,107 734,402 169,477 4.3 316,342 315,754 77,431 4.1
4,545,276 4,531,642 1,050,680 4.3
1,379,747 1,373,962 320,567 4.3 915,289 912,957 217,944 4.2 594,446 592,884 144,340 4.1 812,095 810,199 184,650 4.4 544,261 543,417 124,313 4.4 299,438 298,223 58,866 5.1
2,596,709 2,588,131 574,338 4.5
354,503 353,595 77,641 4.6 337,063 335,377 76,216 4.4 700,653 698,764 153,653 4.5 485,088 482,821 108,814 4.4 592,250 590,641 129,457 4.6 127,152 126,933 28,557 4.4
3,781,387 3,771,249 620,385 6.1
346,579 346,288 59,860 5.8 1,045,429 1,038,883 160,132 6.5 1,173,933 1,172,381 194,507 6.0
824,731 823,983 138,357 6.0
REGION XI - DAVAO
DAVAO DEL NORTEDAVAO DEL SUR (excluding DAVAO CITY)DAVAO CITYDAVAO ORIENTALCOMPOSTELA VALLEYDAVAO OCCIDENTAL 5
REGION XII - SOCCSKSARGEN
COTABATO (NORTH COTABATO)SOUTH COTABATO (excluding GENERAL SANTOS CITY)GENERAL SANTOS CITY (DADIANGAS)SULTAN KUDARATSARANGANICOTABATO CITY
REGION XIII - CARAGA
AGUSAN DEL NORTE (excluding BUTUAN CITY)BUTUAN CITYAGUSAN DEL SURSURIGAO DEL NORTESURIGAO DEL SURDINAGAT ISLANDS
AUTONOMOUS REGION IN MUSLIM MINDANAO (ARMM)
BASILAN (excluding CITY OF ISABELA)LANAO DEL SURMAGUINDANAO (excluding COTABATO CITY)SULUTAWI-TAWI 390,715 389,714 67,529 5.8
Notes:a
1
2
3
4
5
Population counts for the regions do not add up to the national total. Includes 2,134 Filipinos in Philippine embassies, consulates and missions abroad.
Renamed pursuant to Republic Act No. 10879, also known as the MIMAROPA Act, which took effect on 17 July 2016. Created into a region under Executive Order No. 183. Transferred province under Executive Order No. 183; taken from Region VI - Western Visayas. Transferred province under Executive Order No. 183; taken from Region VII - Central Visayas.Created into a province under Republic Act No. 10360 dated July 23, 2012; ratified on October 28, 2013; taken from the province of Davao del Sur.
Source:
Philippine Statistics Authority, 2015 Census of Population


2015 Census of Population REGION I - ILOCOS
Total Household Number Average
Population Population of Households Household Size
REGION I - ILOCOS 5,026,128 5,014,622 1,151,629 4.4
ILOCOS NORTE 593,081 591,198 139,336 4.2
ADAMS 1,792 1,792 411 4.4
BACARRA 32,215 32,149 8,269 3.9
BADOC 31,616 31,616 7,375 4.3
BANGUI 14,672 14,660 3,568 4.1
CITY OF BATAC 55,201 54,951 12,797 4.3
BURGOS 9,777 9,729 2,403 4.0
CARASI 1,567 1,566 304 5.2
CURRIMAO 12,184 12,166 2,805 4.3
DINGRAS 38,562 38,531 8,757 4.4
DUMALNEG 2,947 2,821 574 4.9
BANNA (ESPIRITU) 19,438 19,383 4,532 4.3
LAOAG CITY (CAPITAL) 111,125 110,413 25,285 4.4
MARCOS 17,777 17,774 4,563 3.9
NUEVA ERA 9,506 9,493 2,453 3.9
PAGUDPUD 23,770 23,650 5,807 4.1
PAOAY 24,866 24,844 5,822 4.3
PASUQUIN 28,980 28,935 6,698 4.3
PIDDIG 21,497 21,407 5,040 4.2
PINILI 17,300 17,293 3,932 4.4
SAN NICOLAS 36,736 36,536 8,516 4.3
SARRAT 25,212 25,183 5,749 4.4
SOLSONA 24,121 24,086 5,497 4.4
VINTAR 32,220 32,220 8,179 3.9
ILOCOS SUR 689,668 687,511 157,043 4.4
ALILEM 6,695 6,687 1,476 4.5
BANAYOYO 7,748 7,744 1,782 4.3
BANTAY 35,731 35,501 8,229 4.3
BURGOS 12,224 12,223 2,785 4.4
CABUGAO 37,501 37,429 8,188 4.6
CITY OF CANDON 60,623 60,395 13,812 4.4
CAOAYAN 19,861 19,861 4,604 4.3
CERVANTES 17,211 17,111 3,682 4.6
GALIMUYOD 10,748 10,747 2,326 4.6
GREGORIO DEL PILAR (CONCEPCION) 4,875 4,836 908 5.3
LIDLIDDA 4,647 4,642 1,004 4.6
MAGSINGAL 30,792 30,766 7,943 3.9
NAGBUKEL 5,259 5,254 1,182 4.4
NARVACAN 44,006 43,959 9,856 4.5
QUIRINO (ANGKAKI) 8,573 8,542 1,830 4.7
SALCEDO (BAUGEN) 11,288 11,287 2,683 4.2
SAN EMILIO 7,407 7,394 1,537 4.8
SAN ESTEBAN 8,349 8,344 2,001 4.2
SAN ILDEFONSO 7,787 7,506 1,760 4.3
SAN JUAN (LAPOG) 26,411 26,403 6,477 4.1
SAN VICENTE 12,758 12,754 2,971 4.3
Province, City, and Municipality
TABLE 1 Total Population, Household Population, Number of Households, and Average Household Size
by Province, City, and Municipality as of August 1, 2015: Region I - Ilocos
(total population includes institutional population)
Philippine Statistics Authority 1

REGION I - ILOCOS 2015 Census of Population
Total Household Number Average
Population Population of Households Household SizeProvince, City, and Municipality
TABLE 1 Total Population, Household Population, Number of Households, and Average Household Size
by Province, City, and Municipality as of August 1, 2015: Region I - Ilocos
(total population includes institutional population)
SANTA 15,340 15,340 3,509 4.4
SANTA CATALINA 13,945 13,939 2,844 4.9
SANTA CRUZ 39,868 39,822 8,982 4.4
SANTA LUCIA 25,402 25,402 5,930 4.3
SANTA MARIA 30,321 30,303 6,944 4.4
SANTIAGO 18,759 18,731 4,387 4.3
SANTO DOMINGO 27,975 27,967 6,777 4.1
SIGAY 2,737 2,737 515 5.3
SINAIT 25,640 25,635 6,138 4.2
SUGPON 4,585 4,585 972 4.7
SUYO 11,446 11,410 2,505 4.6
TAGUDIN 39,277 39,240 8,644 4.5
CITY OF VIGAN (CAPITAL) 53,879 53,015 11,860 4.5
LA UNION 786,653 784,646 180,675 4.3
AGOO 63,692 63,346 13,850 4.6
ARINGAY 47,458 47,422 10,817 4.4
BACNOTAN 42,078 41,954 9,963 4.2
BAGULIN 13,456 13,420 2,978 4.5
BALAOAN 39,188 39,155 8,963 4.4
BANGAR 35,947 35,946 8,078 4.4
BAUANG 75,032 74,805 17,254 4.3
BURGOS 8,067 8,067 1,750 4.6
CABA 22,039 21,965 5,227 4.2
LUNA 35,802 35,677 8,490 4.2
NAGUILIAN 54,221 54,159 12,161 4.5
PUGO 19,690 19,636 4,811 4.1
ROSARIO 55,458 55,343 13,171 4.2
CITY OF SAN FERNANDO (CAPITAL) 121,812 121,219 28,505 4.3
SAN GABRIEL 18,172 18,166 3,907 4.6
SAN JUAN 37,188 37,082 8,714 4.3
SANTO TOMAS 39,092 39,066 8,996 4.3
SANTOL 12,476 12,468 2,789 4.5
SUDIPEN 17,056 17,021 3,810 4.5
TUBAO 28,729 28,729 6,441 4.5
PANGASINAN 2,956,726 2,951,267 674,575 4.4
AGNO 28,052 28,052 6,624 4.2
AGUILAR 41,463 41,442 8,777 4.7
CITY OF ALAMINOS 89,708 89,518 21,576 4.1
ALCALA 43,402 43,396 10,174 4.3
ANDA 39,504 39,504 9,376 4.2
ASINGAN 57,355 57,349 13,623 4.2
BALUNGAO 31,106 30,860 7,606 4.1
BANI 50,306 50,292 12,337 4.1
BASISTA 32,959 32,922 6,904 4.8
BAUTISTA 32,307 32,302 6,892 4.7
BAYAMBANG 118,205 118,182 25,596 4.6
BINALONAN 54,555 54,442 12,849 4.2
2 Philippine Statistics Authority

2015 Census of Population REGION I - ILOCOS
Total Household Number Average
Population Population of Households Household SizeProvince, City, and Municipality
TABLE 1 Total Population, Household Population, Number of Households, and Average Household Size
by Province, City, and Municipality as of August 1, 2015: Region I - Ilocos
(total population includes institutional population)
BINMALEY 83,052 82,910 20,160 4.1
BOLINAO 82,084 81,953 17,681 4.6
BUGALLON 67,348 67,197 14,587 4.6
BURGOS 21,637 21,422 4,800 4.5
CALASIAO 95,154 95,071 22,542 4.2
DAGUPAN CITY 171,271 170,144 38,168 4.5
DASOL 29,110 29,110 6,785 4.3
INFANTA 24,584 24,584 5,621 4.4
LABRADOR 23,201 23,150 5,480 4.2
LINGAYEN (CAPITAL) 103,278 102,865 21,780 4.7
MABINI 24,765 24,765 5,917 4.2
MALASIQUI 130,275 130,263 29,047 4.5
MANAOAG 69,497 69,399 14,939 4.6
MANGALDAN 106,331 106,313 23,437 4.5
MANGATAREM 73,241 73,200 16,554 4.4
MAPANDAN 37,059 36,989 8,667 4.3
NATIVIDAD 24,299 24,269 5,794 4.2
POZORRUBIO 69,555 69,541 16,856 4.1
ROSALES 63,081 62,941 14,576 4.3
SAN CARLOS CITY 188,571 188,278 42,049 4.5
SAN FABIAN 83,025 82,960 19,886 4.2
SAN JACINTO 40,848 40,848 9,211 4.4
SAN MANUEL 52,939 52,888 12,552 4.2
SAN NICOLAS 35,574 35,547 8,277 4.3
SAN QUINTIN 32,945 32,927 8,584 3.8
SANTA BARBARA 82,012 81,928 18,636 4.4
SANTA MARIA 33,038 33,001 7,491 4.4
SANTO TOMAS 15,022 15,022 3,374 4.5
SISON 47,518 47,280 10,659 4.4
SUAL 34,149 34,124 7,859 4.3
TAYUG 43,149 42,967 10,039 4.3
UMINGAN 73,252 73,175 17,261 4.2
URBIZTONDO 50,170 50,150 10,618 4.7
CITY OF URDANETA 132,940 132,039 30,294 4.4
VILLASIS 62,333 62,304 14,631 4.3
LAOAC 31,497 31,482 7,429 4.2
Source:
Philippine Statistics Authority, 2015 Census of Population
Philippine Statistics Authority 3

Ilocos Norte 2015 Census of Population
Province, City, Municipality, Total Household Number of
and Barangay Population Population Households
ILOCOS NORTE 593,081 591,198 139,336
ADAMS 1,792 1,792 411
Adams (Pob.) 1,792 1,792 411
BACARRA 32,215 32,149 8,269
Bani 853 853 247
Buyon 1,596 1,596 357
Cabaruan 1,413 1,413 392
Cabulalaan 733 733 212
Cabusligan 1,038 1,038 269
Cadaratan 1,192 1,180 310
Calioet-Libong 823 819 203
Casilian 992 992 234
Corocor 814 814 224
Duripes 1,010 1,010 257
Ganagan 699 699 191
Libtong 1,587 1,587 402
Macupit 625 622 141
Nambaran 982 982 231
Natba 530 530 132
Paninaan 440 440 106
Pasiocan 1,162 1,162 294
Pasngal 760 760 196
Pipias 1,049 1,049 282
Pulangi 1,082 1,082 269
Pungto 571 571 155
San Agustin I (Pob.) 546 546 151
San Agustin II (Pob.) 274 274 72
San Andres I (Pob.) 782 771 165
San Andres II (Pob.) 694 694 186
San Gabriel I (Pob.) 269 269 64
San Gabriel II (Pob.) 390 390 104
San Pedro I (Pob.) 385 385 89
San Pedro II (Pob.) 597 597 147
San Roque I (Pob.) 524 524 132
San Roque II (Pob.) 352 352 105
San Simon I (Pob.) 626 626 191
San Simon II (Pob.) 333 333 99
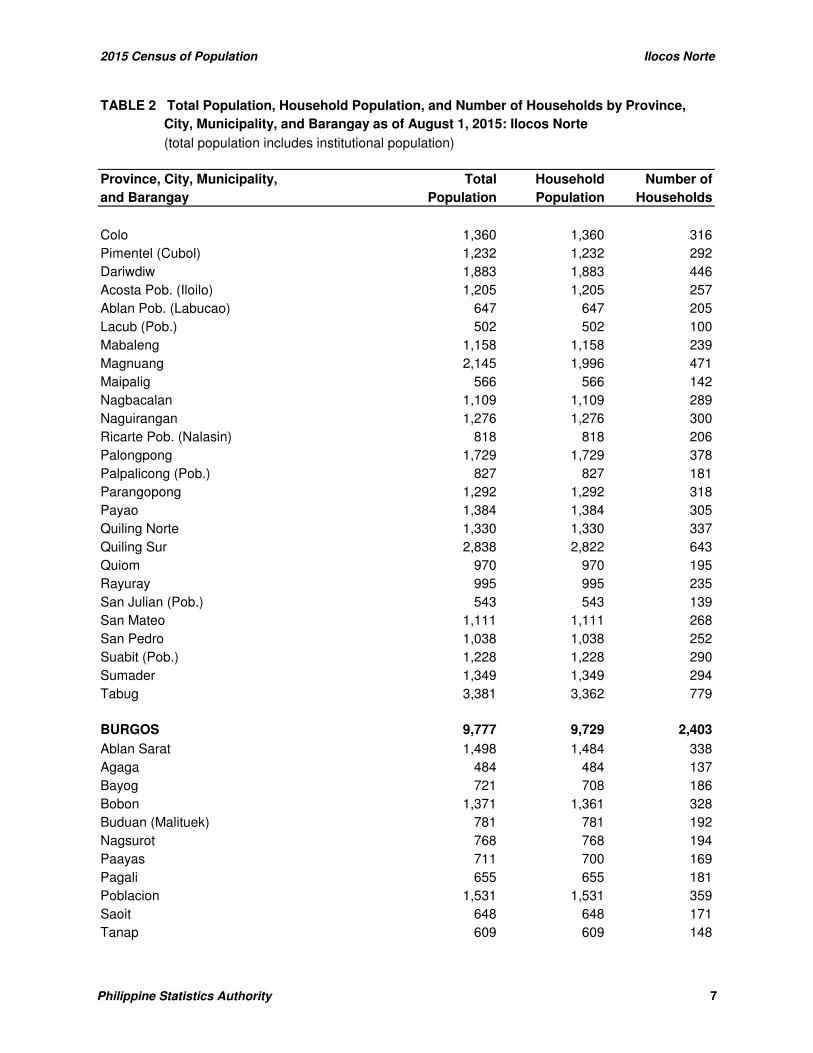
TABLE 2 Total Population, Household Population, and Number of Households by Province,
(total population includes institutional population)
City, Municipality, and Barangay as of August 1, 2015: Ilocos Norte
4 Philippine Statistics Authority

2015 Census of Population Ilocos Norte
Province, City, Municipality, Total Household Number of
and Barangay Population Population Households
TABLE 2 Total Population, Household Population, and Number of Households by Province,
(total population includes institutional population)
City, Municipality, and Barangay as of August 1, 2015: Ilocos Norte
San Vicente (Pob.) 649 649 171
Sangil 1,031 1,031 243
Santa Filomena I (Pob.) 264 264 78
Santa Filomena II (Pob.) 342 342 98
Santa Rita (Pob.) 1,104 1,068 278
Santo Cristo I (Pob.) 409 409 120
Santo Cristo II (Pob.) 420 420 114
Tambidao 775 775 185
Teppang 643 643 168
Tubburan 855 855 205
BADOC 31,616 31,616 7,375
Alay-Nangbabaan (Alay 15-B) 1,079 1,079 240
Alogoog 936 936 218
Ar-arusip 799 799 211
Aring 1,351 1,351 304
Balbaldez 320 320 75
Bato 979 979 239
Camanga 1,126 1,126 265
Canaan (Pob.) 573 573 143
Caraitan 1,370 1,370 333
Gabut Norte 1,536 1,536 317
Gabut Sur 1,011 1,011 249
Garreta (Pob.) 1,376 1,376 327
Labut 765 765 199
Lacuben 1,422 1,422 303
Lubigan 1,260 1,260 271
Mabusag Norte 1,130 1,130 261
Mabusag Sur 1,133 1,133 240
Madupayas 861 861 211
Morong 854 854 214
Nagrebcan 525 525 153
Napu 1,488 1,488 347
La Virgen Milagrosa (Paguetpet) 1,080 1,080 230
Pagsanahan Norte 1,180 1,180 274
Pagsanahan Sur 1,337 1,337 320
Paltit 1,617 1,617 368
Parang 427 427 100
Pasuc 428 428 104
Philippine Statistics Authority 5

Ilocos Norte 2015 Census of Population
Province, City, Municipality, Total Household Number of
and Barangay Population Population Households
TABLE 2 Total Population, Household Population, and Number of Households by Province,
(total population includes institutional population)
City, Municipality, and Barangay as of August 1, 2015: Ilocos Norte
Santa Cruz Norte 958 958 209
Santa Cruz Sur 689 689 156
Saud 1,244 1,244 295
Turod 762 762 199
BANGUI 14,672 14,660 3,568
Abaca 1,729 1,729 426
Bacsil 725 725 167
Banban 740 740 186
Baruyen 1,541 1,531 378
Dadaor 426 426 103
Lanao 1,958 1,958 498
Malasin 1,000 1,000 231
Manayon 1,092 1,092 260
Masikil 629 629 147
Nagbalagan 701 701 156
Payac 758 758 208
San Lorenzo (Pob.) 2,176 2,174 522
Taguiporo 547 547 137
Utol 650 650 149
CITY OF BATAC 55,201 54,951 12,797
Aglipay (Pob.) 1,412 1,412 349
Baay 3,075 3,075 724
Baligat 1,907 1,907 428
Bungon 1,520 1,504 362
Baoa East 756 756 177
Baoa West 1,218 1,218 271
Barani (Pob.) 659 659 145
Ben-agan (Pob.) 659 659 160
Bil-loca 2,866 2,866 635
Biningan 445 445 96
Callaguip (Pob.) 900 900 202
Camandingan 1,499 1,499 322
Camguidan 535 535 131
Cangrunaan (Pob.) 961 961 226
Capacuan 753 753 168
Caunayan (Pob.) 1,175 1,131 304
Valdez Pob. (Caoayan) 945 939 220
6 Philippine Statistics Authority
2015 Census of Population Ilocos Norte
Province, City, Municipality, Total Household Number of
and Barangay Population Population Households
TABLE 2 Total Population, Household Population, and Number of Households by Province,
(total population includes institutional population)
City, Municipality, and Barangay as of August 1, 2015: Ilocos Norte
Colo 1,360 1,360 316
Pimentel (Cubol) 1,232 1,232 292
Dariwdiw 1,883 1,883 446
Acosta Pob. (Iloilo) 1,205 1,205 257
Ablan Pob. (Labucao) 647 647 205
Lacub (Pob.) 502 502 100
Mabaleng 1,158 1,158 239
Magnuang 2,145 1,996 471
Maipalig 566 566 142
Nagbacalan 1,109 1,109 289
Naguirangan 1,276 1,276 300
Ricarte Pob. (Nalasin) 818 818 206
Palongpong 1,729 1,729 378
Palpalicong (Pob.) 827 827 181
Parangopong 1,292 1,292 318
Payao 1,384 1,384 305
Quiling Norte 1,330 1,330 337
Quiling Sur 2,838 2,822 643
Quiom 970 970 195
Rayuray 995 995 235
San Julian (Pob.) 543 543 139
San Mateo 1,111 1,111 268
San Pedro 1,038 1,038 252
Suabit (Pob.) 1,228 1,228 290
Sumader 1,349 1,349 294
Tabug 3,381 3,362 779
BURGOS 9,777 9,729 2,403
Ablan Sarat 1,498 1,484 338
Agaga 484 484 137
Bayog 721 708 186
Bobon 1,371 1,361 328
Buduan (Malituek) 781 781 192
Nagsurot 768 768 194
Paayas 711 700 169
Pagali 655 655 181
Poblacion 1,531 1,531 359
Saoit 648 648 171
Tanap 609 609 148
Philippine Statistics Authority 7

Ilocos Norte 2015 Census of Population
Province, City, Municipality, Total Household Number of
and Barangay Population Population Households
TABLE 2 Total Population, Household Population, and Number of Households by Province,
(total population includes institutional population)
City, Municipality, and Barangay as of August 1, 2015: Ilocos Norte
CARASI 1,567 1,566 304
Angset 171 171 28
Barbaqueso (Pob.) 783 783 161
Virbira 613 612 115
CURRIMAO 12,184 12,166 2,805
Anggapang Norte 279 279 65
Anggapang Sur 156 156 35
Bimmanga 411 411 92
Cabuusan 354 354 85
Comcomloong 129 129 33
Gaang 1,238 1,238 275
Lang-ayan-Baramban 574 563 133
Lioes 477 477 116
Maglaoi Centro 239 239 57
Maglaoi Norte 671 671 153
Maglaoi Sur 541 541 118
Paguludan-Salindeg 319 319 77
Pangil 601 601 136
Pias Norte 887 887 220
Pias Sur 723 720 172
Poblacion I 744 740 181
Poblacion II 611 611 126
Salugan 471 471 101
San Simeon 300 300 69
Santa Cruz 293 293 66
Tapao-Tigue 791 791 191
Torre 429 429 100
Victoria 946 946 204
DINGRAS 38,562 38,531 8,757
Albano (Pob.) 823 823 175
Bacsil 837 837 193
Bagut 972 972 228
Parado (Bangay) 1,524 1,524 317
Baresbes 1,998 1,992 451
Barong 2,374 2,374 565
Bungcag 538 538 138
Cali 1,319 1,308 252
8 Philippine Statistics Authority

2015 Census of Population Ilocos Norte
Province, City, Municipality, Total Household Number of
and Barangay Population Population Households
TABLE 2 Total Population, Household Population, and Number of Households by Province,
(total population includes institutional population)
City, Municipality, and Barangay as of August 1, 2015: Ilocos Norte
Capasan 697 697 177
Dancel (Pob.) 570 566 139
Foz 874 874 205
Guerrero (Pob.) 1,492 1,492 345
Lanas 905 905 238
Lumbad 1,023 1,023 226
Madamba (Pob.) 1,984 1,974 456
Mandaloque 664 664 158
Medina 1,290 1,290 287
Ver (Naglayaan) 1,175 1,175 288
San Marcelino (Padong) 3,710 3,710 821
Puruganan (Pob.) 880 880 179
Peralta (Pob.) 1,331 1,331 294
Root (Baldias) 828 828 190
Sagpatan 822 822 190
Saludares 1,469 1,469 329
San Esteban 828 828 177
Espiritu 975 975 232
Sulquiano (Sidiran) 1,458 1,458 334
San Francisco (Surrate) 2,154 2,154 497
Suyo 1,400 1,400 297
San Marcos 649 649 146
Elizabeth 999 999 233
DUMALNEG 2,947 2,821 574
Dumalneg 1,964 1,838 376
San Isidro 1
983 983 198
BANNA (ESPIRITU) 19,438 19,383 4,532
Balioeg 877 877 169
Bangsar 901 901 202
Barbarangay 782 782 193
Bomitog 1,314 1,261 305
Bugasi 938 938 249
Caestebanan 1,063 1,063 202
Caribquib 980 978 235
Catagtaguen 1,270 1,270 300
Crispina 984 984 233
Hilario (Pob.) 993 993 212
Philippine Statistics Authority 9

Ilocos Norte 2015 Census of Population
Province, City, Municipality, Total Household Number of
and Barangay Population Population Households
TABLE 2 Total Population, Household Population, and Number of Households by Province,
(total population includes institutional population)
City, Municipality, and Barangay as of August 1, 2015: Ilocos Norte
Imelda 610 610 155
Lorenzo (Pob.) 794 794 206
Macayepyep 1,180 1,180 277
Marcos (Pob.) 975 975 242
Nagpatayan 912 912 214
Valdez 969 969 220
Sinamar 1,198 1,198 262
Tabtabagan 1,149 1,149 286
Valenciano (Pob.) 725 725 171
Binacag 824 824 199
LAOAG CITY (Capital) 111,125 110,413 25,285
Bgy. No. 42, Apaya 916 916 229
Bgy. No. 36, Araniw 873 873 210
Bgy. No. 56-A, Bacsil North 951 951 228
Bgy. No. 56-B, Bacsil South 1,349 1,349 327
Bgy. No. 41, Balacad 1,422 1,422 354
Bgy. No. 40, Balatong 2,659 2,566 526
Bgy. No. 55-A, Barit-Pandan 2,233 2,233 510
Bgy. No. 47, Bengcag 1,874 1,874 445
Bgy. No. 50, Buttong 3,044 3,038 679
Bgy. No. 60-A, Caaoacan 1,430 1,430 364
Bgy. No. 48-A, Cabungaan North 1,788 1,788 464
Bgy. No. 48-B, Cabungaan South 1,239 1,239 328
Bgy. No. 37, Calayab 2,081 2,071 473
Bgy. No. 54-B, Camangaan 1,005 1,005 206
Bgy. No. 58, Casili 964 964 218
Bgy. No. 61, Cataban 766 766 182
Bgy. No. 43, Cavit 1,086 1,086 297
Bgy. No. 49-A, Darayday 976 976 207
Bgy. No. 59-B, Dibua North 865 865 175
Bgy. No. 59-A, Dibua South 1,100 1,100 258
Bgy. No. 34-B, Gabu Norte East 1,230 1,230 291
Bgy. No. 34-A, Gabu Norte West 777 777 187
Bgy. No. 35, Gabu Sur 1,778 1,778 457
Bgy. No. 32-C La Paz East 1,693 1,693 356
Bgy. No. 33-B, La Paz Proper 1,052 1,052 233
Bgy. No. 32-B, La Paz West 1,065 1,065 250
Bgy. No. 54-A, Lagui-Sail 2,372 2,372 460
10 Philippine Statistics Authority

2015 Census of Population Ilocos Norte
Province, City, Municipality, Total Household Number of
and Barangay Population Population Households
TABLE 2 Total Population, Household Population, and Number of Households by Province,
(total population includes institutional population)
City, Municipality, and Barangay as of August 1, 2015: Ilocos Norte
Bgy. No. 32-A, La Paz East 1,433 1,433 311
Bgy. No. 33-A, La Paz Proper 1,113 1,113 249
Bgy. No. 52-B, Lataag 876 876 218
Bgy. No. 60-B, Madiladig 1,469 1,469 301
Bgy. No. 38-A, Mangato East 1,040 1,040 228
Bgy. No. 38-B, Mangato West 1,188 1,188 267
Bgy. No. 62-A, Navotas North 796 796 183
Bgy. No. 62-B, Navotas South 912 910 187
Bgy. No. 46, Nalbo 2,401 2,401 563
Bgy. No. 51-A, Nangalisan East 1,510 1,506 368
Bgy. No. 51-B, Nangalisan West 814 807 188
Bgy. No. 24, Nstra. Sra. De Consolacion (Pob.) 1,054 1,054 240
Bgy. No. 7-A, Nstra. Sra. De Natividad (Pob.) 1,131 1,116 258
Bgy. No. 7-B, Nstra. Sra. De Natividad (Pob.) 968 968 273
Bgy. No. 27, Nstra. Sra. De Soledad (Pob.) 1,618 1,618 367
Bgy. No. 13, Nstra. Sra. De Visitacion (Pob.) 1,443 1,436 339
Bgy. No. 3, Nstra. Sra. Del Rosario (Pob.) 1,189 1,189 246
Bgy. No. 57, Pila 1,866 1,865 413
Bgy. No. 49-B, Raraburan 1,658 1,647 360
Bgy. No. 53, Rioeng 1,616 1,616 334
Bgy. No. 55-B, Salet-Bulangon 2,521 2,519 575
Bgy. No. 6, San Agustin (Pob.) 1,371 1,371 282
Bgy. No. 22, San Andres (Pob.) 1,065 1,065 270
Bgy. No. 28, San Bernardo (Pob.) 1,758 1,742 405
Bgy. No. 17, San Francisco (Pob.) 708 671 155
Bgy. No. 4, San Guillermo (Pob.) 1,256 1,256 308
Bgy. No. 15, San Guillermo (Pob.) 1,098 1,076 250
Bgy. No. 12, San Isidro (Pob.) 1,607 1,607 373
Bgy. No. 16, San Jacinto (Pob.) 1,060 1,060 247
Bgy. No. 10, San Jose (Pob.) 1,005 1,005 259
Bgy. No. 1, San Lorenzo (Pob.) 4,733 4,532 980
Bgy. No. 26, San Marcelino (Pob.) 963 963 222
Bgy. No. 52-A, San Mateo 629 629 155
Bgy. No. 23, San Matias (Pob.) 2,857 2,613 595
Bgy. No. 20, San Miguel (Pob.) 1,029 1,029 197
Bgy. No. 21, San Pedro (Pob.) 1,349 1,338 236
Bgy. No. 5, San Pedro (Pob.) 1,723 1,722 400
Bgy. No. 18, San Quirino (Pob.) 723 723 159
Bgy. No. 8, San Vicente (Pob.) 1,042 1,042 236
Philippine Statistics Authority 11

Ilocos Norte 2015 Census of Population
Province, City, Municipality, Total Household Number of
and Barangay Population Population Households
TABLE 2 Total Population, Household Population, and Number of Households by Province,
(total population includes institutional population)
City, Municipality, and Barangay as of August 1, 2015: Ilocos Norte
Bgy. No. 9, Santa Angela (Pob.) 802 802 210
Bgy. No. 11, Santa Balbina (Pob.) 1,365 1,365 280
Bgy. No. 25, Santa Cayetana (Pob.) 1,201 1,188 278
Bgy. No. 2, Santa Joaquina (Pob.) 2,568 2,568 620
Bgy. No. 19, Santa Marcela (Pob.) 1,144 1,144 289
Bgy. No. 30-B, Santa Maria 1,516 1,516 329
Bgy. No. 39, Santa Rosa 789 789 179
Bgy. No. 14, Santo Tomas (Pob.) 1,147 1,138 256
Bgy. No. 29, Santo Tomas (Pob.) 1,330 1,330 309
Bgy. No. 30-A, Suyo 762 762 156
Bgy. No. 31, Talingaan 1,616 1,616 376
Bgy. No. 45, Tangid 997 997 252
Bgy. No. 55-C, Vira 1,377 1,377 327
Bgy. No. 44, Zamboanga 1,331 1,331 313
MARCOS 17,777 17,774 4,563
Pacifico (Agunit) 1,755 1,755 463
Imelda (Capariaan) 865 865 235
Elizabeth (Culao) 1,288 1,288 323
Daquioag 1,726 1,726 448
Escoda 2,068 2,068 541
Ferdinand 945 945 253
Fortuna 1,127 1,127 265
Lydia (Pob.) 2,270 2,267 540
Mabuti 1,122 1,122 294
Valdez (Biding) 1,096 1,096 283
Tabucbuc (Ragas) 1,716 1,716 462
Santiago 1,410 1,410 360
Cacafean 389 389 96
NUEVA ERA 9,506 9,493 2,453
Acnam 609 609 170
Barangobong 370 370 90
Barikir 527 527 134
Bugayong 723 723 198
Cabittauran 1,000 994 252
Caray 763 763 184
Garnaden 616 616 156
Naguillan (Pagpag-ong) 888 888 215
12 Philippine Statistics Authority

2015 Census of Population Ilocos Norte
Province, City, Municipality, Total Household Number of
and Barangay Population Population Households
TABLE 2 Total Population, Household Population, and Number of Households by Province,
(total population includes institutional population)
City, Municipality, and Barangay as of August 1, 2015: Ilocos Norte
Poblacion 2,196 2,189 606
Santo Niño 962 962 211
Uguis 852 852 237
PAGUDPUD 23,770 23,650 5,807
Aggasi 667 667 190
Baduang 1,103 1,103 291
Balaoi 1,934 1,889 454
Burayoc 1,509 1,473 345
Caunayan 1,382 1,382 332
Dampig 1,015 1,015 261
Ligaya 997 997 245
Pancian 2,205 2,204 505
Pasaleng 1,727 1,727 385
Poblacion 1 2,536 2,536 628
Poblacion 2 2,942 2,938 748
Saguigui 872 872 230
Saud 1,551 1,544 358
Subec 1,557 1,557 383
Tarrag 934 934 241
Caparispisan 839 812 211
PAOAY 24,866 24,844 5,822
Bacsil 665 665 158
Cabagoan 547 547 138
Cabangaran 407 407 98
Callaguip 1,970 1,970 434
Cayubog 508 508 131
Dolores 514 514 114
Laoa 344 344 73
Masintoc 631 631 154
Monte 693 693 160
Mumulaan 768 768 196
Nagbacalan 3,008 3,001 674
Nalasin 1,286 1,286 288
Nanguyudan 669 669 177
Oaig-Upay-Abulao 641 641 153
Pambaran 237 237 64
Pannaratan (Pob.) 236 236 49
Philippine Statistics Authority 13

Ilocos Norte 2015 Census of Population
Province, City, Municipality, Total Household Number of
and Barangay Population Population Households
TABLE 2 Total Population, Household Population, and Number of Households by Province,
(total population includes institutional population)
City, Municipality, and Barangay as of August 1, 2015: Ilocos Norte
Paratong 1,118 1,118 276
Pasil 1,031 1,031 241
Salbang (Pob.) 689 683 164
San Agustin 1,008 1,008 245
San Blas (Pob.) 249 243 57
San Juan 267 267 59
San Pedro 647 644 142
San Roque (Pob.) 1,195 1,195 273
Sangladan Pob. (Nalbuan) 427 427 91
Santa Rita (Pob.) 706 706 170
Sideg 459 459 108
Suba 1,579 1,579 389
Sungadan 1,309 1,309 296
Surgui 794 794 188
Veronica 264 264 62
PASUQUIN 28,980 28,935 6,698
Batuli 376 376 97
Binsang 862 862 203
Nalvo (Cababaan-Nalvo) 522 522 133
Caruan 1,275 1,275 276
Carusikis 776 776 209
Carusipan 480 480 117
Dadaeman 340 340 90
Darupidip 306 306 81
Davila 4,123 4,107 890
Dilanis 402 402 101
Dilavo 574 574 138
Estancia 1,024 1,024 233
Naglicuan 1,642 1,640 398
Nagsanga 1,293 1,292 297
Ngabangab 726 726 185
Pangil 430 430 94
Poblacion 1 1,175 1,175 244
Poblacion 2 1,919 1,913 418
Poblacion 3 1,035 1,035 221
Poblacion 4 1,412 1,403 321
Pragata (Pragata-Bungro) 520 520 123
Puyupuyan 798 798 187
14 Philippine Statistics Authority

2015 Census of Population Ilocos Norte
Province, City, Municipality, Total Household Number of
and Barangay Population Population Households
TABLE 2 Total Population, Household Population, and Number of Households by Province,
(total population includes institutional population)
City, Municipality, and Barangay as of August 1, 2015: Ilocos Norte
Sulongan 442 442 98
Salpad 586 586 135
San Juan 1,475 1,475 330
Santa Catalina 917 917 204
Santa Matilde 406 406 107
Sapat 62 52 13
Sulbec 816 816 196
Surong 334 334 97
Susugaen 1,364 1,364 318
Tabungao 215 215 50
Tadao 353 352 94
PIDDIG 21,497 21,407 5,040
Ab-abut 412 412 103
Abucay 1,531 1,531 384
Anao (Pob.) 1,233 1,232 260
Arua-ay 381 370 90
Bimmanga 297 297 75
Boyboy 1,549 1,549 369
Cabaroan (Pob.) 958 952 214
Calambeg 1,288 1,288 302
Callusa 651 651 152
Dupitac 712 712 165
Estancia 1,810 1,755 398
Gayamat 597 594 142
Lagandit 628 628 143
Libnaoan 616 616 142
Loing (Pob.) 1,555 1,550 350
Maab-abaca 454 454 117
Mangitayag 611 611 156
Maruaya 894 894 205
San Antonio 700 700 177
Santa Maria 1,491 1,490 320
Sucsuquen 681 673 175
Tangaoan 1,024 1,024 242
Tonoton 1,424 1,424 359
Philippine Statistics Authority 15

Ilocos Norte 2015 Census of Population
Province, City, Municipality, Total Household Number of
and Barangay Population Population Households
TABLE 2 Total Population, Household Population, and Number of Households by Province,
(total population includes institutional population)
City, Municipality, and Barangay as of August 1, 2015: Ilocos Norte
PINILI 17,300 17,293 3,932
Aglipay 607 607 137
Apatut-Lubong 394 394 91
Badio 1,355 1,355 294
Barbar 622 622 153
Buanga 421 421 107
Bulbulala 504 504 115
Bungro 380 380 96
Cabaroan 467 467 119
Capangdanan 755 755 187
Dalayap 668 668 140
Darat 1,091 1,091 258
Gulpeng 380 380 88
Liliputen 479 479 114
Lumbaan-Bicbica 726 726 165
Nagtrigoan 698 698 168
Pagdilao (Pob.) 1,236 1,236 268
Pugaoan 559 559 135
Puritac 562 562 129
Sacritan 1,184 1,184 264
Salanap 478 478 113
Santo Tomas 721 721 157
Tartarabang 1,098 1,098 226
Puzol 257 257 62
Upon 577 577 134
Valbuena (Pob.) 1,081 1,074 212
SAN NICOLAS 36,736 36,536 8,516
San Francisco (Pob.) 1,599 1,599 316
San Ildefonso (Pob.) 1,470 1,464 354
San Agustin 2,249 2,152 531
San Baltazar (Pob.) 752 739 175
San Bartolome (Pob.) 872 872 206
San Cayetano (Pob.) 776 776 195
San Eugenio (Pob.) 1,075 1,075 250
San Fernando (Pob.) 1,086 1,086 263
San Gregorio (Pob.) 1,718 1,718 405
San Guillermo 1,777 1,746 422
San Jose (Pob.) 1,130 1,130 278
16 Philippine Statistics Authority

2015 Census of Population Ilocos Norte
Province, City, Municipality, Total Household Number of
and Barangay Population Population Households
TABLE 2 Total Population, Household Population, and Number of Households by Province,
(total population includes institutional population)
City, Municipality, and Barangay as of August 1, 2015: Ilocos Norte
San Juan Bautista (Pob.) 3,041 3,041 680
San Lorenzo 2,277 2,277 543
San Lucas (Pob.) 1,384 1,384 327
San Marcos (Payas) 2,675 2,663 613
San Miguel (Pob.) 1,606 1,606 358
San Pablo 1,709 1,701 406
San Paulo (Pob.) 959 959 208
San Pedro (Bingao) 1,815 1,783 414
San Rufino (Pob.) 1,145 1,145 249
San Silvestre (Pob.) 835 835 224
Santa Asuncion (Samac) 881 881 210
Santa Cecilia (Barabar) 1,904 1,904 436
Santa Monica (Nagrebcan) 2,001 2,000 453
SARRAT 25,212 25,183 5,749
San Agustin (Pob.) 604 604 146
San Andres 1,479 1,479 344
San Antonio 1,188 1,188 268
San Bernabe 250 250 61
San Cristobal 1,597 1,597 374
San Felipe 1,114 1,114 257
San Francisco (Pob.) 970 970 226
San Isidro 1,125 1,125 278
San Joaquin (Pob.) 1,399 1,399 347
San Jose 1,542 1,540 343
San Juan 784 784 185
San Leandro (Pob.) 1,328 1,328 282
San Lorenzo 964 964 215
San Manuel 814 814 167
San Marcos 1,377 1,361 300
San Nicolas 1,810 1,805 407
San Pedro 852 852 194
San Roque 981 981 215
San Vicente (Pob.) 940 934 192
Santa Barbara (Pob.) 604 604 148
Santa Magdalena 803 803 191
Santa Rosa 1,013 1,013 227
Santo Santiago 725 725 159
Santo Tomas 949 949 223
Philippine Statistics Authority 17

Ilocos Norte 2015 Census of Population
Province, City, Municipality, Total Household Number of
and Barangay Population Population Households
TABLE 2 Total Population, Household Population, and Number of Households by Province,
(total population includes institutional population)
City, Municipality, and Barangay as of August 1, 2015: Ilocos Norte
SOLSONA 24,121 24,086 5,497
Aguitap 882 882 206
Bagbag 637 632 154
Bagbago 1,160 1,160 256
Barcelona 1,331 1,331 332
Bubuos 811 811 176
Capurictan 1,138 1,135 290
Catangraran 1,395 1,395 288
Darasdas 1,474 1,474 324
Juan (Pob.) 2,376 2,367 568
Laureta (Pob.) 1,438 1,438 329
Lipay 343 343 85
Maananteng 1,277 1,259 256
Manalpac 2,093 2,093 453
Mariquet 1,154 1,154 257
Nagpatpatan 702 702 161
Nalasin 685 685 163
Puttao 1,252 1,252 263
San Juan 550 550 131
San Julian 269 269 61
Santa Ana 1,208 1,208 278
Santiago 908 908 220
Talugtog 1,038 1,038 246
VINTAR 32,220 32,220 8,179
Abkir 1,290 1,290 313
Alsem 508 508 134
Bago 384 384 100
Bulbulala 1,282 1,282 314
Cabangaran 607 607 173
Cabayo 556 556 165
Cabisocolan 744 744 206
Canaam 773 773 161
Columbia 764 764 200
Dagupan 616 616 178
Pedro F. Alviar (Diaton) 918 918 244
Dipilat 1,158 1,158 303
Esperanza 328 328 89
Ester 1,541 1,541 341
18 Philippine Statistics Authority

2015 Census of Population Ilocos Norte
Province, City, Municipality, Total Household Number of
and Barangay Population Population Households
TABLE 2 Total Population, Household Population, and Number of Households by Province,
(total population includes institutional population)
City, Municipality, and Barangay as of August 1, 2015: Ilocos Norte
Isic Isic 1,796 1,796 502
Lubnac 1,668 1,668 433
Mabanbanag 671 671 160
Alejo Malasig 1,196 1,196 272
Manarang 666 666 181
Margaay 808 808 211
Namoroc 799 799 191
Malampa (Peninaan-Malampa) 776 776 186
Parparoroc 1,328 1,328 309
Parut 1,310 1,310 325
Salsalamagui 1,139 1,139 294
San Jose (Lipay) 835 835 273
San Nicolas (Pob.) 1,115 1,115 247
San Pedro (Pob.) 897 897 208
San Ramon (Pob.) 1,221 1,221 332
San Roque (Pob.) 1,064 1,064 273
Santa Maria (Pob.) 1,033 1,033 230
Tamdagan 1,346 1,346 374
Visaya 1,083 1,083 257
Note:1
Transferred barangay from Bangui under Supreme Court Decision in G. R. 198655.
Source:
Philippine Statistics Authority, 2015 Census of Population
Philippine Statistics Authority 19

Ilocos Sur 2015 Census of Population
Province, City, Municipality, Total Household Number of
and Barangay Population Population Households
ILOCOS SUR 689,668 687,511 157,043
ALILEM 6,695 6,687 1,476
Alilem Daya (Pob.) 1,575 1,568 372
Amilongan 520 520 109
Anaao 772 772 181
Apang 489 489 96
Apaya 531 531 101
Batbato 502 502 113
Daddaay 608 608 131
Dalawa 1,241 1,241 269
Kiat 457 456 104
BANAYOYO 7,748 7,744 1,782
Bagbagotot 450 450 105
Banbanaal 629 629 140
Bisangol 206 206 52
Cadanglaan 283 283 58
Casilagan Norte 551 551 131
Casilagan Sur 429 429 108
Elefante 572 572 140
Guardia 512 512 125
Lintic 1,312 1,312 294
Lopez 422 422 91
Montero 119 119 29
Naguimba 960 960 226
Pila 201 201 48
Poblacion 1,102 1,098 235
BANTAY 35,731 35,501 8,229
Aggay 733 733 196
An-annam 1,495 1,495 293
Balaleng 2,481 2,481 575
Banaoang 458 458 114
Bulag 2,568 2,568 629
Buquig 939 939 216
Cabalanggan 745 687 149
Cabaroan 819 819 205
Cabusligan 720 720 182
TABLE 2 Total Population, Household Population, and Number of Households by Province,
(total population includes institutional population)
City, Municipality, and Barangay as of August 1, 2015: Ilocos Sur
20 Philippine Statistics Authority

2015 Census of Population Ilocos Sur
Province, City, Municipality, Total Household Number of
and Barangay Population Population Households
TABLE 2 Total Population, Household Population, and Number of Households by Province,
(total population includes institutional population)
City, Municipality, and Barangay as of August 1, 2015: Ilocos Sur
Capangdanan 923 923 215
Guimod 1,106 1,105 251
Lingsat 1,151 1,151 267
Malingeb 1,427 1,427 288
Mira 568 568 143
Naguiddayan 668 668 154
Ora 2,135 2,135 480
Paing 1,542 1,542 348
Puspus 534 534 130
Quimmarayan 577 577 132
Sagneb 363 363 86
Sagpat 766 766 172
San Mariano (Sallacong) 371 371 96
San Isidro 841 841 206
San Julian 961 961 226
Sinabaan 680 671 151
Taguiporo 1,349 1,349 315
Taleb 1,938 1,785 410
Tay-ac 2,609 2,609 601
Barangay 1 (Pob.) 595 595 133
Barangay 2 (Pob.) 660 660 173
Barangay 3 (Pob.) 920 920 206
Barangay 4 (Pob.) 970 966 222
Barangay 5 (Pob.) 690 685 165
Barangay 6 (Pob.) 429 429 100
BURGOS 12,224 12,223 2,785
Ambugat 411 411 92
Balugang 445 445 103
Bangbangar 289 289 63
Bessang 437 437 92
Cabcaburao 501 501 101
Cadacad 386 386 82
Callitong 551 551 134
Dayanki 677 677 160
Lesseb 147 147 32
Lubing 436 436 107
Lucaban 498 498 110
Luna 1,126 1,125 244
Philippine Statistics Authority 21

Ilocos Sur 2015 Census of Population
Province, City, Municipality, Total Household Number of
and Barangay Population Population Households
TABLE 2 Total Population, Household Population, and Number of Households by Province,
(total population includes institutional population)
City, Municipality, and Barangay as of August 1, 2015: Ilocos Sur
Macaoayan 467 467 115
Mambug 612 612 144
Manaboc 586 586 144
Mapanit 264 264 58
Poblacion Sur (Masingit) 180 180 41
Nagpanaoan 384 384 82
Dirdirig (Dirdirig-Paday) 955 955 226
Paduros 688 688 158
Patac 268 268 56
Poblacion Norte (Bato) 339 339 81
Sabangan Pinggan 385 385 81
Subadi Norte 410 410 84
Subadi Sur 167 167 40
Taliao 615 615 155
CABUGAO 37,501 37,429 8,188
Alinaay 808 808 176
Aragan 804 804 182
Arnap 1,242 1,242 258
Baclig (Pob.) 2,366 2,334 516
Bato 533 533 107
Bonifacio (Pob.) 1,372 1,351 307
Bungro 438 438 103
Cacadiran 915 915 210
Caellayan 1,067 1,067 254
Carusipan 562 562 139
Catucdaan 943 943 224
Cuancabal 969 969 223
Cuantacla 813 813 181
Daclapan 2,280 2,280 460
Dardarat 1,606 1,606 366
Lipit 840 840 179
Maradodon 753 753 186
Margaay 832 832 198
Nagsantaan 409 409 92
Nagsincaoan 426 426 93
Namruangan 1,914 1,914 428
Pila 752 752 175
Pug-os 1,917 1,909 420
22 Philippine Statistics Authority

2015 Census of Population Ilocos Sur
Province, City, Municipality, Total Household Number of
and Barangay Population Population Households
TABLE 2 Total Population, Household Population, and Number of Households by Province,
(total population includes institutional population)
City, Municipality, and Barangay as of August 1, 2015: Ilocos Sur
Quezon (Pob.) 2,093 2,093 412
Reppaac 364 364 84
Rizal (Pob.) 1,398 1,395 277
Sabang 1,335 1,327 309
Sagayaden 1,197 1,197 262
Salapasap 1,821 1,821 355
Salomague 1,619 1,619 347
Sisim 732 732 148
Turod 1,452 1,452 313
Turod-Patac 929 929 204
CITY OF CANDON 60,623 60,395 13,812
Allangigan Primero 1,296 1,296 292
Allangigan Segundo 1,109 1,109 263
Amguid 699 699 133
Ayudante 952 952 233
Bagani Camposanto 2,125 2,125 469
Bagani Gabor 583 583 117
Bagani Tocgo 610 610 130
Bagani Ubbog 1,479 1,479 347
Bagar 1,327 1,327 290
Balingaoan 1,733 1,733 404
Bugnay 816 816 181
Calaoaan 2,572 2,528 621
Calongbuyan 2,716 2,709 557
Caterman 2,497 2,497 549
Cubcubboot 458 458 103
Darapidap 3,253 3,242 705
Langlangca Primero 668 668 163
Langlangca Segundo 1,230 1,230 267
Oaig-Daya 2,119 2,119 486
Palacapac 810 810 193
Paras 1,299 1,287 306
Parioc Primero 1,314 1,314 339
Parioc Segundo 1,580 1,580 395
Patpata Primero 1,130 1,130 256
Patpata Segundo 1,665 1,665 416
Paypayad 2,402 2,402 540
Salvador Primero 950 950 219
Philippine Statistics Authority 23

Ilocos Sur 2015 Census of Population
Province, City, Municipality, Total Household Number of
and Barangay Population Population Households
TABLE 2 Total Population, Household Population, and Number of Households by Province,
(total population includes institutional population)
City, Municipality, and Barangay as of August 1, 2015: Ilocos Sur
Salvador Segundo 802 802 176
San Agustin 1,671 1,613 397
San Andres 773 773 175
San Antonio (Pob.) 1,090 1,082 249
San Isidro (Pob.) 2,028 2,013 413
San Jose (Pob.) 2,044 2,026 454
San Juan (Pob.) 865 845 182
San Nicolas 2,651 2,620 587
San Pedro 721 721 163
Santo Tomas 724 724 168
Tablac 3,151 3,151 748
Talogtog 1,920 1,916 421
Tamurong Primero 1,420 1,420 343
Tamurong Segundo 924 924 255
Villarica 447 447 107
CAOAYAN 19,861 19,861 4,604
Anonang Mayor 1,061 1,061 256
Anonang Menor 876 876 217
Baggoc 749 749 168
Callaguip 994 994 224
Caparacadan 376 376 83
Fuerte 2,711 2,711 607
Manangat 1,038 1,038 239
Naguilian 1,432 1,432 347
Nansuagao 770 770 177
Pandan 1,291 1,291 285
Pantay-Quitiquit 422 422 102
Don Dimas Querubin (Pob.) 1,005 1,005 222
Puro 1,227 1,227 281
Pantay Tamurong 2,020 2,020 505
Villamar 1,585 1,585 347
Don Alejandro Quirolgico (Pob.) 1,268 1,268 305
Don Lorenzo Querubin (Pob.) 1,036 1,036 239
CERVANTES 17,211 17,111 3,682
Aluling 1,286 1,286 310
Comillas North 1,870 1,861 374
Comillas South 1,834 1,826 398
24 Philippine Statistics Authority

2015 Census of Population Ilocos Sur
Province, City, Municipality, Total Household Number of
and Barangay Population Population Households
TABLE 2 Total Population, Household Population, and Number of Households by Province,
(total population includes institutional population)
City, Municipality, and Barangay as of August 1, 2015: Ilocos Sur
Concepcion (Pob.) 1,791 1,778 380
Dinwede East 564 564 135
Dinwede West 686 686 161
Libang 1,003 1,003 211
Pilipil 406 404 86
Remedios 1,070 1,057 240
Rosario (Pob.) 2,115 2,064 479
San Juan 2,004 2,000 398
San Luis 900 900 161
Malaya 1,682 1,682 349
GALIMUYOD 10,748 10,747 2,326
Abaya 311 311 58
Baracbac 293 293 61
Bidbiday 831 831 194
Bitong 214 214 45
Borobor 279 279 63
Calimugtong 507 507 98
Calongbuyan 639 639 130
Calumbaya 289 289 44
Daldagan 428 427 98
Kilang 205 205 48
Legaspi 355 355 74
Mabayag 357 357 76
Matanubong 206 206 46
Mckinley 572 572 129
Nagsingcaoan 292 292 67
Oaig-Daya 316 316 62
Pagangpang 504 504 119
Patac 1,433 1,433 312
Poblacion 536 536 127
Rubio 658 658 144
Sabangan-Bato 524 524 118
Sacaang 403 403 91
San Vicente 253 253 53
Sapang 343 343 69
Philippine Statistics Authority 25

Ilocos Sur 2015 Census of Population
Province, City, Municipality, Total Household Number of
and Barangay Population Population Households
TABLE 2 Total Population, Household Population, and Number of Households by Province,
(total population includes institutional population)
City, Municipality, and Barangay as of August 1, 2015: Ilocos Sur
GREGORIO DEL PILAR (CONCEPCION) 4,875 4,836 908
Alfonso (Tangaoan) 958 958 185
Bussot 529 529 82
Concepcion 825 791 158
Dapdappig 536 536 117
Matue-Butarag 771 771 146
Poblacion Norte 616 616 114
Poblacion Sur 640 635 106
LIDLIDDA 4,647 4,642 1,004
Banucal 705 705 151
Bequi-Walin 550 550 127
Bugui 273 273 53
Calungbuyan 224 224 48
Carcarabasa 401 401 85
Labut 281 281 56
Poblacion Norte 974 969 216
Poblacion Sur 308 308 69
San Vicente 420 420 97
Suysuyan 338 338 67
Tay-ac 173 173 35
MAGSINGAL 30,792 30,766 7,943
Alangan 844 843 230
Bacar 622 622 157
Barbarit 911 911 237
Bungro 1,466 1,466 361
Cabaroan 610 610 151
Cadanglaan 191 191 42
Caraisan 787 787 177
Dacutan 820 820 211
Labut 774 774 204
Maas-asin 747 747 189
Macatcatud 928 928 216
Namalpalan 1,090 1,090 295
Manzante 1,887 1,886 547
Maratudo 1,312 1,312 345
Miramar 1,408 1,408 391
Napo 1,007 1,007 237
26 Philippine Statistics Authority

2015 Census of Population Ilocos Sur
Province, City, Municipality, Total Household Number of
and Barangay Population Population Households
TABLE 2 Total Population, Household Population, and Number of Households by Province,
(total population includes institutional population)
City, Municipality, and Barangay as of August 1, 2015: Ilocos Sur
Pagsanaan Norte 563 563 139
Pagsanaan Sur 655 655 174
Panay Norte 1,367 1,367 369
Panay Sur 683 683 171
Patong 1,508 1,508 377
Puro 4,535 4,535 1,141
San Basilio (Pob.) 536 536 150
San Clemente (Pob.) 1,074 1,074 264
San Julian (Pob.) 556 556 160
San Lucas (Pob.) 670 670 174
San Ramon (Pob.) 935 930 253
San Vicente (Pob.) 756 754 188
Santa Monica 792 775 199
Sarsaracat 758 758 194
NAGBUKEL 5,259 5,254 1,182
Balaweg 558 558 125
Bandril 426 426 99
Bantugo 688 688 162
Cadacad 237 237 61
Casilagan 308 308 68
Casocos 187 187 37
Lapting 399 396 82
Mapisi 367 367 96
Mission 385 385 87
Poblacion East 517 517 110
Poblacion West 546 544 109
Taleb 641 641 146
NARVACAN 44,006 43,959 9,856
Abuor 1,147 1,147 275
Ambulogan 1,407 1,407 351
Aquib 937 937 249
Banglayan 1,120 1,120 246
Bulanos 937 937 180
Cadacad 682 682 165
Cagayungan 1,198 1,198 245
Camarao 1,321 1,321 285
Casilagan 647 647 148
Philippine Statistics Authority 27

Ilocos Sur 2015 Census of Population
Province, City, Municipality, Total Household Number of
and Barangay Population Population Households
TABLE 2 Total Population, Household Population, and Number of Households by Province,
(total population includes institutional population)
City, Municipality, and Barangay as of August 1, 2015: Ilocos Sur
Codoog 952 952 230
Dasay 1,254 1,254 320
Dinalaoan 1,103 1,103 249
Estancia 244 244 59
Lanipao 647 647 158
Lungog 2,152 2,151 496
Margaay 2,227 2,227 493
Marozo 1,304 1,304 323
Naguneg 1,947 1,947 473
Orence 1,876 1,876 414
Pantoc 1,078 1,078 217
Paratong 1,612 1,612 313
Parparia 1,241 1,241 290
Quinarayan 2,739 2,739 622
Rivadavia 747 747 173
San Antonio 1,866 1,866 430
San Jose (Pob.) 1,393 1,393 275
San Pablo 1,228 1,228 277
San Pedro 1,947 1,947 432
Santa Lucia (Pob.) 1,574 1,547 284
Sarmingan 520 520 123
Sucoc 1,517 1,517 351
Sulvec 2,005 1,986 423
Turod 619 619 136
Bantay Abot 818 818 151
QUIRINO (ANGKAKI) 8,573 8,542 1,830
Banoen 636 636 127
Cayus 721 711 167
Patungcaleo (Lamag) 1,117 1,117 229
Malideg 782 782 158
Namitpit 1,266 1,245 244
Patiacan 953 953 203
Legleg (Pob.) 1,865 1,865 419
Suagayan 680 680 162
Lamag (Tubtuba) 553 553 121
28 Philippine Statistics Authority

2015 Census of Population Ilocos Sur
Province, City, Municipality, Total Household Number of
and Barangay Population Population Households
TABLE 2 Total Population, Household Population, and Number of Households by Province,
(total population includes institutional population)
City, Municipality, and Barangay as of August 1, 2015: Ilocos Sur
SALCEDO (BAUGEN) 11,288 11,287 2,683
Atabay 288 288 91
Calangcuasan 1,079 1,079 241
Balidbid 1,181 1,180 290
Baluarte 690 690 148
Baybayading 248 248 64
Boguibog 734 734 169
Bulala-Leguey 306 306 67
Kaliwakiw 374 374 100
Culiong 271 271 76
Dinaratan 811 811 177
Kinmarin 382 382 89
Lucbuban 539 539 110
Madarang 303 303 69
Maligcong 323 323 61
Pias 546 546 118
Poblacion Norte 845 845 214
Poblacion Sur 597 597 151
San Gaspar 369 369 99
San Tiburcio 600 600 142
Sorioan 622 622 163
Ubbog 180 180 44
SAN EMILIO 7,407 7,394 1,537
Cabaroan (Pob.) 1,146 1,146 238
Kalumsing 710 710 159
Lancuas 889 889 188
Matibuey 1,064 1,064 223
Paltoc 562 562 122
Sibsibbu 656 656 140
Tiagan 1,710 1,697 337
San Miliano 670 670 130
SAN ESTEBAN 8,349 8,344 2,001
Ansad 692 692 175
Apatot 1,678 1,678 376
Bateria 512 512 126
Cabaroan 867 867 208
Cappa-cappa 811 811 202
Philippine Statistics Authority 29

Ilocos Sur 2015 Census of Population
Province, City, Municipality, Total Household Number of
and Barangay Population Population Households
TABLE 2 Total Population, Household Population, and Number of Households by Province,
(total population includes institutional population)
City, Municipality, and Barangay as of August 1, 2015: Ilocos Sur
Poblacion 745 740 168
San Nicolas 945 945 223
San Pablo 1,030 1,030 253
San Rafael 659 659 176
Villa Quirino 410 410 94
SAN ILDEFONSO 7,787 7,506 1,760
Arnap 218 218 57
Bahet 836 836 189
Belen 140 140 34
Bungro 702 702 172
Busiing Sur 584 584 142
Busiing Norte 824 824 189
Dongalo 347 347 86
Gongogong 336 336 79
Iboy 446 446 101
Otol-Patac 486 486 111
Poblacion East 1,001 720 159
Poblacion West 559 559 138
Kinamantirisan 276 276 57
Sagneb 336 336 76
Sagsagat 696 696 170
SAN JUAN (LAPOG) 26,411 26,403 6,477
Bacsil 1,068 1,068 277
Baliw 859 859 231
Bannuar (Pob.) 1,269 1,269 314
Barbar 1,486 1,486 402
Cabanglotan 966 966 236
Cacandongan 326 326 83
Camanggaan 641 641 170
Camindoroan 816 816 187
Caronoan 673 673 181
Darao 417 417 113
Dardarat 627 624 120
Guimod Norte 376 376 95
Guimod Sur 997 997 239
Immayos Norte 729 729 182
Immayos Sur 237 237 64
30 Philippine Statistics Authority

2015 Census of Population Ilocos Sur
Province, City, Municipality, Total Household Number of
and Barangay Population Population Households
TABLE 2 Total Population, Household Population, and Number of Households by Province,
(total population includes institutional population)
City, Municipality, and Barangay as of August 1, 2015: Ilocos Sur
Labnig 1,060 1,060 273
Lapting 1,109 1,109 270
Lira (Pob.) 896 896 210
Malamin 656 656 176
Muraya 702 702 180
Nagsabaran 896 896 247
Nagsupotan 1,319 1,319 331
Pandayan (Pob.) 797 797 157
Refaro 1,389 1,389 349
Resurreccion (Pob.) 1,116 1,111 254
Sabangan 671 671 157
San Isidro 828 828 202
Saoang 845 845 189
Solotsolot 811 811 169
Sunggiam 1,098 1,098 236
Surngit 466 466 112
Asilang 265 265 71
SAN VICENTE 12,758 12,754 2,971
Bantaoay 1,768 1,768 401
Bayubay Norte 1,317 1,313 298
Bayubay Sur 1,685 1,685 410
Lubong 1,203 1,203 246
Poblacion 1,250 1,250 286
Pudoc 2,414 2,414 595
San Sebastian 3,121 3,121 735
SANTA 15,340 15,340 3,509
Ampandula 671 671 137
Banaoang 487 487 116
Basug 239 239 52
Bucalag 232 232 58
Cabangaran 263 263 61
Calungboyan 593 593 150
Casiber 584 584 132
Dammay 186 186 45
Labut Norte 571 571 129
Labut Sur 261 261 76
Mabilbila Sur 1,948 1,948 455
Philippine Statistics Authority 31

Ilocos Sur 2015 Census of Population
Province, City, Municipality, Total Household Number of
and Barangay Population Population Households
TABLE 2 Total Population, Household Population, and Number of Households by Province,
(total population includes institutional population)
City, Municipality, and Barangay as of August 1, 2015: Ilocos Sur
Mabilbila Norte 685 685 154
Magsaysay District (Pob.) 982 982 206
Manueva 955 955 231
Marcos (Pob.) 588 588 121
Nagpanaoan 762 762 208
Namalangan 756 756 174
Oribi 192 192 34
Pasungol 550 550 131
Quezon (Pob.) 325 325 79
Quirino (Pob.) 333 333 90
Rancho 667 667 145
Rizal 852 852 180
Sacuyya Norte 843 843 164
Sacuyya Sur 571 571 123
Tabucolan 244 244 58
SANTA CATALINA 13,945 13,939 2,844
Cabaroan 1,294 1,294 281
Cabittaogan 2,621 2,621 496
Cabuloan 1,374 1,374 288
Pangada 804 804 174
Paratong 1,154 1,154 201
Poblacion 1,439 1,433 324
Sinabaan 1,237 1,237 243
Subec 1,181 1,181 226
Tamorong 2,841 2,841 611
SANTA CRUZ 39,868 39,822 8,982
Amarao 664 664 148
Babayoan 581 581 165
Bacsayan 465 465 115
Banay 446 446 113
Bayugao Este 325 325 74
Bayugao Oeste 599 599 109
Besalan 1,028 1,028 252
Bugbuga 842 807 179
Calaoaan 1,495 1,495 293
Camanggaan 1,132 1,132 245
Candalican 510 510 110
32 Philippine Statistics Authority

2015 Census of Population Ilocos Sur
Province, City, Municipality, Total Household Number of
and Barangay Population Population Households
TABLE 2 Total Population, Household Population, and Number of Households by Province,
(total population includes institutional population)
City, Municipality, and Barangay as of August 1, 2015: Ilocos Sur
Capariaan 1,525 1,525 379
Casilagan 842 842 188
Coscosnong 456 456 107
Daligan 567 567 132
Dili 1,776 1,776 370
Gabor Norte 1,101 1,101 229
Gabor Sur 707 707 157
Lalong 309 309 70
Lantag 969 969 220
Las-ud 571 571 136
Mambog 1,081 1,081 221
Mantanas 1,311 1,311 307
Nagtengnga 987 987 211
Padaoil 595 594 132
Paratong 637 637 154
Pattiqui 658 658 160
Pidpid 768 768 171
Pilar 1,576 1,576 351
Pinipin 1,135 1,135 268
Poblacion Este 754 754 167
Poblacion Norte 944 944 198
Poblacion Weste 460 460 105
Poblacion Sur 603 597 136
Quinfermin 253 253 59
Quinsoriano 616 616 140
Sagat 1,150 1,150 253
San Antonio 467 467 98
San Jose 620 620 157
San Pedro 591 591 122
Saoat 360 360 87
Sevilla 1,541 1,537 374
Sidaoen 994 994 227
Suyo 1,027 1,027 241
Tampugo 318 318 84
Turod 551 551 130
Villa Garcia 1,066 1,066 246
Villa Hermosa 1,609 1,609 329
Villa Laurencia 286 286 63
Philippine Statistics Authority 33

Ilocos Sur 2015 Census of Population
Province, City, Municipality, Total Household Number of
and Barangay Population Population Households
TABLE 2 Total Population, Household Population, and Number of Households by Province,
(total population includes institutional population)
City, Municipality, and Barangay as of August 1, 2015: Ilocos Sur
SANTA LUCIA 25,402 25,402 5,930
Alincaoeg 494 494 117
Angkileng 796 796 177
Arangin 399 399 100
Ayusan (Pob.) 1,149 1,149 252
Banbanaba 490 490 121
Bao-as 693 693 164
Barangobong (Pob.) 1,064 1,064 220
Buliclic 405 405 107
Burgos (Pob.) 432 432 96
Cabaritan 503 503 115
Catayagan 754 754 167
Conconig East 1,363 1,363 268
Conconig West 892 892 199
Damacuag 779 779 209
Lubong 324 324 82
Luba 812 812 205
Nagrebcan 720 720 172
Nagtablaan 423 423 111
Namatican 684 684 177
Nangalisan 1,018 1,018 222
Palali Norte 911 911 218
Palali Sur 908 908 211
Paoc Norte 812 812 200
Paoc Sur 394 394 91
Paratong 896 896 219
Pila East 662 662 138
Pila West 558 558 131
Quinabalayangan 240 240 48
Ronda 759 759 187
Sabuanan 1,437 1,437 333
San Juan 800 800 195
San Pedro 423 423 104
Sapang 433 433 115
Suagayan 422 422 107
Vical 944 944 226
Bani 609 609 126
34 Philippine Statistics Authority

2015 Census of Population Ilocos Sur
Province, City, Municipality, Total Household Number of
and Barangay Population Population Households
TABLE 2 Total Population, Household Population, and Number of Households by Province,
(total population includes institutional population)
City, Municipality, and Barangay as of August 1, 2015: Ilocos Sur
SANTA MARIA 30,321 30,303 6,944
Ag-agrao 1,006 1,006 235
Ampuagan 579 579 130
Baballasioan 769 769 172
Baliw Daya 456 456 109
Baliw Laud 584 584 143
Bia-o 577 577 143
Butir 724 724 200
Cabaroan 1,485 1,485 344
Danuman East 436 436 97
Danuman West 639 639 145
Dunglayan 837 837 190
Gusing 1,153 1,153 266
Langaoan 678 678 160
Laslasong Norte 960 960 229
Laslasong Sur 630 630 152
Laslasong West 190 190 45
Lesseb 209 209 47
Lingsat 2,057 2,057 463
Lubong 960 960 228
Maynganay Norte 868 868 208
Maynganay Sur 817 817 173
Nagsayaoan 787 787 174
Nagtupacan 778 778 179
Nalvo 1,500 1,500 312
Pacang 711 711 168
Penned 193 193 43
Poblacion Norte 1,186 1,178 264
Poblacion Sur 2,028 2,022 397
Silag 1,399 1,399 317
Sumagui 261 261 55
Suso 2,626 2,622 643
Tangaoan 1,203 1,203 280
Tinaan 1,035 1,035 233
SANTIAGO 18,759 18,731 4,387
Al-aludig 872 872 206
Ambucao 1,709 1,709 377
San Jose (Baraoas) 291 291 59
Philippine Statistics Authority 35

Ilocos Sur 2015 Census of Population
Province, City, Municipality, Total Household Number of
and Barangay Population Population Households
TABLE 2 Total Population, Household Population, and Number of Households by Province,
(total population includes institutional population)
City, Municipality, and Barangay as of August 1, 2015: Ilocos Sur
Baybayabas 566 545 131
Bigbiga 655 655 165
Bulbulala 548 548 121
Busel-busel 493 493 116
Butol 998 998 246
Caburao 1,371 1,371 293
Dan-ar 1,935 1,935 460
Gabao 813 813 193
Guinabang 300 300 64
Imus 299 299 71
Lang-ayan 373 373 100
Mambug 1,200 1,200 279
Nalasin 588 588 136
Olo-olo Norte 941 941 227
Olo-olo Sur 408 408 101
Poblacion Norte 402 395 104
Poblacion Sur 496 496 107
Sabangan 1,203 1,203 270
Salincub 839 839 201
San Roque 839 839 207
Ubbog 620 620 153
SANTO DOMINGO 27,975 27,967 6,777
Binalayangan 269 269 74
Binongan 658 658 165
Borobor 485 485 125
Cabaritan 1,067 1,067 270
Cabigbigaan 575 575 160
Calautit 1,158 1,158 272
Calay-ab 821 821 193
Camestizoan 1,032 1,032 243
Casili 331 331 86
Flora 559 559 157
Lagatit 917 917 218
Laoingen 1,351 1,351 311
Lussoc 1,152 1,152 271
Nalasin 1,378 1,377 295
Nagbettedan 705 705 180
Naglaoa-an 867 867 198
36 Philippine Statistics Authority

2015 Census of Population Ilocos Sur
Province, City, Municipality, Total Household Number of
and Barangay Population Population Households
TABLE 2 Total Population, Household Population, and Number of Households by Province,
(total population includes institutional population)
City, Municipality, and Barangay as of August 1, 2015: Ilocos Sur
Nambaran 1,383 1,383 315
Nanerman 527 527 145
Napo 554 554 144
Padu Chico 1,032 1,032 220
Padu Grande 289 289 88
Paguraper 472 472 140
Panay 178 178 53
Pangpangdan 557 557 156
Parada 764 764 153
Paras 690 690 154
Poblacion 896 896 225
Puerta Real 845 845 203
Pussuac 1,079 1,079 250
Quimmarayan 1,135 1,135 269
San Pablo 878 871 209
Santa Cruz 605 605 139
Santo Tomas 439 439 99
Sived 796 796 224
Vacunero 1,121 1,121 274
Suksukit 410 410 99
SIGAY 2,737 2,737 515
Abaccan 254 254 55
Mabileg 327 327 54
Matallucod 278 278 58
Poblacion (Madayaw) 335 335 71
San Elias 481 481 86
San Ramon 601 601 107
Santo Rosario 461 461 84
SINAIT 25,640 25,635 6,138
Aguing 321 321 88
Ballaigui (Pob.) 649 649 129
Baliw 233 233 56
Baracbac 734 734 193
Barikir 429 429 114
Battog 483 483 130
Binacud 319 319 81
Cabangtalan 513 513 120
Philippine Statistics Authority 37

Ilocos Sur 2015 Census of Population
Province, City, Municipality, Total Household Number of
and Barangay Population Population Households
TABLE 2 Total Population, Household Population, and Number of Households by Province,
(total population includes institutional population)
City, Municipality, and Barangay as of August 1, 2015: Ilocos Sur
Cabarambanan 364 364 103
Cabulalaan 319 319 83
Cadanglaan 340 340 85
Calingayan 270 270 70
Curtin 332 332 89
Dadalaquiten Norte 783 783 172
Dadalaquiten Sur 760 760 196
Duyayyat 503 503 126
Jordan 522 522 138
Calanutian 569 569 118
Katipunan 994 994 223
Macabiag (Pob.) 812 812 214
Magsaysay 639 639 130
Marnay 361 361 90
Masadag 608 608 167
Nagcullooban 433 433 110
Nagbalioartian 512 512 119
Nagongburan 386 386 97
Namnama (Pob.) 746 746 193
Pacis 664 664 151
Paratong 1,452 1,452 282
Dean Leopoldo Yabes (Pug-os) 1,611 1,611 335
Purag 497 497 132
Quibit-quibit 394 394 104
Quimmallogong 352 352 84
Rang-ay (Pob.) 546 546 126
Ricudo 477 477 114
Sabañgan (Marcos) 921 921 202
Sallacapo 357 357 100
Santa Cruz 858 858 220
Sapriana 564 564 154
Tapao 736 736 192
Teppeng 1,333 1,328 274
Tubigay 363 363 93
Ubbog 260 260 66
Zapat 321 321 75
38 Philippine Statistics Authority

2015 Census of Population Ilocos Sur
Province, City, Municipality, Total Household Number of
and Barangay Population Population Households
TABLE 2 Total Population, Household Population, and Number of Households by Province,
(total population includes institutional population)
City, Municipality, and Barangay as of August 1, 2015: Ilocos Sur
SUGPON 4,585 4,585 972
Banga 843 843 180
Caoayan 663 663 132
Licungan (Cullang) 525 525 80
Danac 572 572 90
Pangotan 374 374 128
Balbalayang (Pob.) 1,608 1,608 362
SUYO 11,446 11,410 2,505
Baringcucurong 1,601 1,591 344
Cabugao 1,301 1,301 294
Man-atong 1,856 1,856 404
Patoc-ao 700 700 138
Poblacion (Kimpusa) 1,931 1,918 447
Suyo Proper 1,848 1,848 384
Urzadan 837 837 190
Uso 1,372 1,359 304
TAGUDIN 39,277 39,240 8,644
Ag-aguman 694 694 160
Ambalayat 1,861 1,861 378
Baracbac 966 966 215
Bario-an 594 594 133
Baritao 639 639 139
Borono 926 926 214
Becques 1,905 1,905 445
Bimmanga 809 809 181
Bio 1,008 1,008 220
Bitalag 1,184 1,184 264
Bucao East 234 234 56
Bucao West 434 434 100
Cabaroan 703 703 180
Cabugbugan 902 902 207
Cabulanglangan 500 500 109
Dacutan 562 562 125
Dardarat 1,818 1,818 423
Del Pilar (Pob.) 1,283 1,283 289
Farola 1,203 1,203 284
Gabur 664 664 150
Philippine Statistics Authority 39

Ilocos Sur 2015 Census of Population
Province, City, Municipality, Total Household Number of
and Barangay Population Population Households
TABLE 2 Total Population, Household Population, and Number of Households by Province,
(total population includes institutional population)
City, Municipality, and Barangay as of August 1, 2015: Ilocos Sur
Garitan 992 992 240
Jardin 363 363 77
Lacong 934 934 202
Lantag 328 328 75
Las-ud 986 986 230
Libtong 2,299 2,299 488
Lubnac 879 879 182
Magsaysay (Pob.) 669 669 136
Malacañang 413 413 84
Pacac 857 857 180
Pallogan 948 948 212
Pudoc East 1,721 1,721 362
Pudoc West 1,681 1,681 344
Pula 478 478 111
Quirino (Pob.) 660 648 124
Ranget 1,272 1,272 263
Rizal (Pob.) 745 720 166
Salvacion 504 504 116
San Miguel 379 379 84
Sawat 948 948 216
Tallaoen 995 995 211
Tampugo 1,141 1,141 220
Tarangotong 196 196 49
CITY OF VIGAN (Capital) 53,879 53,015 11,860
Ayusan Norte 3,349 3,349 716
Ayusan Sur 1,162 1,036 226
Barangay I (Pob.) 567 558 136
Barangay II (Pob.) 601 574 134
Barangay III (Pob.) 968 963 236
Barangay IV (Pob.) 2,349 2,349 521
Barangay V (Pob.) 888 879 184
Barangay VI (Pob.) 1,444 1,444 323
Barraca 277 277 73
Beddeng Laud 913 913 205
Beddeng Daya 588 588 127
Bongtolan 673 673 151
Bulala 2,205 2,205 515
Cabalangegan 592 592 135
40 Philippine Statistics Authority

2015 Census of Population Ilocos Sur
Province, City, Municipality, Total Household Number of
and Barangay Population Population Households
TABLE 2 Total Population, Household Population, and Number of Households by Province,
(total population includes institutional population)
City, Municipality, and Barangay as of August 1, 2015: Ilocos Sur
Cabaroan Daya 950 950 216
Cabaroan Laud 471 471 112
Camangaan 979 979 221
Capangpangan 1,797 1,792 368
Mindoro 1,624 1,624 375
Nagsangalan 1,878 1,851 421
Pantay Daya 2,606 2,500 529
Pantay Fatima 2,792 2,682 594
Pantay Laud 784 784 184
Paoa 917 917 217
Paratong 1,374 1,374 287
Pong-ol 548 548 130
Purok-a-bassit 620 620 144
Purok-a-dackel 847 847 205
Raois 1,528 1,528 321
Rugsuanan 850 850 192
Salindeg 1,399 1,399 304
San Jose 901 901 192
San Julian Norte 2,724 2,724 554
San Julian Sur 1,278 1,278 287
San Pedro 1,444 1,444 344
Tamag 3,596 3,159 818
Barangay VII 1,367 1,367 300
Barangay VIII 1,454 1,454 263
Barangay IX 2,575 2,572 600
Source:
Philippine Statistics Authority, 2015 Census of Population
Philippine Statistics Authority 41

La Union 2015 Census of Population
Province, City, Municipality, Total Household Number of
and Barangay Population Population Households
LA UNION 786,653 784,646 180,675
AGOO 63,692 63,346 13,850
Ambitacay 806 806 196
Balawarte 1,754 1,754 348
Capas 1,070 1,070 228
Consolacion (Pob.) 1,661 1,661 307
Macalva Central 662 662 152
Macalva Norte 1,138 1,138 265
Macalva Sur 1,429 1,429 316
Nazareno 2,061 2,061 461
Purok 654 654 134
San Agustin East 2,387 2,190 494
San Agustin Norte 1,319 1,319 287
San Agustin Sur 1,186 1,186 279
San Antonino 1,009 1,009 211
San Antonio 2,372 2,311 556
San Francisco 1,044 1,044 226
San Isidro 2,082 2,082 459
San Joaquin Norte 1,424 1,413 312
San Joaquin Sur 1,480 1,480 303
San Jose Norte 820 820 178
San Jose Sur 1,796 1,796 419
San Juan 1,131 1,131 246
San Julian Central 619 619 152
San Julian East 1,121 1,121 266
San Julian Norte 744 744 169
San Julian West 1,914 1,914 434
San Manuel Norte 2,031 2,031 446
San Manuel Sur 873 873 186
San Marcos 2,072 2,072 467
San Miguel 1,577 1,577 331
San Nicolas Central (Pob.) 1,177 1,177 230
San Nicolas East 821 821 195
San Nicolas Norte (Pob.) 689 673 148
San Nicolas West 2,710 2,687 540
San Nicolas Sur (Pob.) 485 471 115
San Pedro 1,106 1,106 205
San Roque West 1,455 1,455 315
TABLE 2 Total Population, Household Population, and Number of Households by Province,
(total population includes institutional population)
City, Municipality, and Barangay as of August 1, 2015: La Union
42 Philippine Statistics Authority

2015 Census of Population La Union
Province, City, Municipality, Total Household Number of
and Barangay Population Population Households
TABLE 2 Total Population, Household Population, and Number of Households by Province,
(total population includes institutional population)
City, Municipality, and Barangay as of August 1, 2015: La Union
San Roque East 787 787 200
San Vicente Norte 1,092 1,092 232
San Vicente Sur 1,108 1,108 257
Santa Ana 1,936 1,936 385
Santa Barbara (Pob.) 1,907 1,883 425
Santa Fe 804 804 177
Santa Maria 971 971 225
Santa Monica 1,026 1,026 242
Santa Rita (Nalinac) 1,529 1,529 323
Santa Rita East 777 777 166
Santa Rita Norte 1,158 1,158 262
Santa Rita Sur 1,074 1,074 201
Santa Rita West 844 844 179
ARINGAY 47,458 47,422 10,817
Alaska 954 954 222
Basca 2,137 2,137 455
Dulao 3,427 3,427 728
Gallano 988 988 218
Macabato 1,498 1,498 358
Manga 1,650 1,650 311
Pangao-aoan East 1,182 1,182 298
Pangao-aoan West 969 969 195
Poblacion 3,473 3,450 801
Samara 2,735 2,735 619
San Antonio 1,034 1,034 237
San Benito Norte 2,625 2,625 622
San Benito Sur 3,638 3,625 832
San Eugenio 3,783 3,783 960
San Juan East 916 916 225
San Juan West 1,250 1,250 293
San Simon East 1,077 1,077 264
San Simon West 1,282 1,282 302
Santa Cecilia 1,868 1,868 445
Santa Lucia 3,096 3,096 695
Santa Rita East 1,069 1,069 241
Santa Rita West 3,438 3,438 746
Santo Rosario East 1,490 1,490 311
Santo Rosario West 1,879 1,879 439
Philippine Statistics Authority 43

La Union 2015 Census of Population
Province, City, Municipality, Total Household Number of
and Barangay Population Population Households
TABLE 2 Total Population, Household Population, and Number of Households by Province,
(total population includes institutional population)
City, Municipality, and Barangay as of August 1, 2015: La Union
BACNOTAN 42,078 41,954 9,963
Agtipal 555 555 130
Arosip 588 588 123
Bacqui 532 532 127
Bacsil 785 785 190
Bagutot 243 243 61
Ballogo 942 942 223
Baroro 2,731 2,731 615
Bitalag 1,596 1,596 364
Bulala 1,268 1,268 303
Burayoc 432 432 106
Bussaoit 583 583 150
Cabaroan 1,914 1,903 445
Cabarsican 1,171 1,171 257
Cabugao 427 427 108
Calautit 720 720 151
Carcarmay 560 560 155
Casiaman 869 845 187
Galongen 1,037 989 250
Guinabang 979 979 215
Legleg 553 553 155
Lisqueb 816 816 215
Mabanengbeng 1st 351 351 81
Mabanengbeng 2nd 341 341 78
Maragayap 546 546 114
Nangalisan 814 814 178
Nagatiran 676 676 170
Nagsaraboan 1,092 1,092 255
Nagsimbaanan 705 705 151
Narra 1,211 1,211 285
Ortega 917 917 220
Paagan 572 572 135
Pandan 1,166 1,166 294
Pang-pang 197 197 43
Poblacion 3,549 3,523 867
Quirino 1,080 1,078 263
Raois 894 894 240
Salincob 561 561 127
San Martin 810 810 197
44 Philippine Statistics Authority

2015 Census of Population La Union
Province, City, Municipality, Total Household Number of
and Barangay Population Population Households
TABLE 2 Total Population, Household Population, and Number of Households by Province,
(total population includes institutional population)
City, Municipality, and Barangay as of August 1, 2015: La Union
Santa Cruz 1,247 1,247 273
Santa Rita 648 648 152
Sapilang 940 927 234
Sayoan 403 403 98
Sipulo 1,042 1,042 250
Tammocalao 1,368 1,368 297
Ubbog 579 579 144
Oya-oy 522 522 137
Zaragosa 546 546 150
BAGULIN 13,456 13,420 2,978
Alibangsay 1,211 1,189 258
Baay 1,097 1,089 226
Cambaly 1,849 1,849 421
Cardiz 1,313 1,313 273
Dagup 2,286 2,286 490
Libbo 877 877 206
Suyo (Pob.) 1,732 1,726 406
Tagudtud 1,019 1,019 227
Tio-angan 933 933 212
Wallayan 1,139 1,139 259
BALAOAN 39,188 39,155 8,963
Apatut 955 955 232
Ar-arampang 891 891 213
Baracbac Este 992 992 236
Baracbac Oeste 426 426 99
Bet-ang 677 677 173
Bulbulala 1,653 1,653 378
Bungol 1,457 1,455 301
Butubut Este 822 822 212
Butubut Norte 1,237 1,237 296
Butubut Oeste 687 687 152
Butubut Sur 757 757 164
Cabuaan Oeste (Pob.) 1,248 1,248 289
Calliat 1,369 1,369 301
Calungbuyan 1,438 1,438 331
Camiling 957 957 236
Guinaburan 919 919 208
Philippine Statistics Authority 45

La Union 2015 Census of Population
Province, City, Municipality, Total Household Number of
and Barangay Population Population Households
TABLE 2 Total Population, Household Population, and Number of Households by Province,
(total population includes institutional population)
City, Municipality, and Barangay as of August 1, 2015: La Union
Masupe 947 947 223
Nagsabaran Norte 1,546 1,546 340
Nagsabaran Sur 1,144 1,144 275
Nalasin 1,465 1,465 332
Napaset 578 578 147
Pagbennecan 880 880 194
Pagleddegan 666 666 148
Pantar Norte 1,452 1,452 342
Pantar Sur 915 915 211
Pa-o 607 607 130
Almieda 1,457 1,457 343
Paraoir 2,022 2,022 407
Patpata 1,441 1,441 328
Dr. Camilo Osias Pob. (Cabuaan Este) 1,873 1,863 419
Sablut 851 851 206
San Pablo 1,214 1,214 264
Sinapangan Norte 647 647 151
Sinapangan Sur 1,217 1,217 265
Tallipugo 1,007 1,007 241
Antonino 774 753 176
BANGAR 35,947 35,946 8,078
Agdeppa 1,254 1,254 274
Alzate 1,329 1,329 304
Bangaoilan East 970 970 210
Bangaoilan West 912 912 199
Barraca 1,248 1,248 275
Cadapli 1,407 1,407 335
Caggao 190 190 46
Consuegra 1,356 1,356 301
General Prim East 868 868 204
General Prim West 1,509 1,509 344
General Terrero 1,042 1,042 251
Luzong Norte 1,334 1,334 289
Luzong Sur 989 989 234
Maria Cristina East 896 896 182
Maria Cristina West 1,022 1,022 226
Mindoro 1,801 1,801 435
Nagsabaran 1,439 1,439 317
46 Philippine Statistics Authority

2015 Census of Population La Union
Province, City, Municipality, Total Household Number of
and Barangay Population Population Households
TABLE 2 Total Population, Household Population, and Number of Households by Province,
(total population includes institutional population)
City, Municipality, and Barangay as of August 1, 2015: La Union
Paratong Norte 1,591 1,591 361
Paratong No. 3 1,039 1,039 227
Paratong No. 4 865 865 189
Central East No. 1 (Pob.) 371 370 101
Central East No. 2 (Pob.) 1,097 1,097 237
Central West No. 1 (Pob.) 443 443 98
Central West No. 2 (Pob.) 558 558 129
Central West No. 3 (Pob.) 605 605 130
Quintarong 1,092 1,092 265
Reyna Regente 993 993 231
Rissing 2,438 2,438 539
San Blas 1,250 1,250 270
San Cristobal 808 808 185
Sinapangan Norte 1,032 1,032 222
Sinapangan Sur 926 926 189
Ubbog 1,273 1,273 279
BAUANG 75,032 74,805 17,254
Acao 4,283 4,257 965
Baccuit Norte 2,488 2,488 671
Baccuit Sur 2,322 2,322 543
Bagbag 1,349 1,349 377
Ballay 1,646 1,646 375
Bawanta 1,166 1,166 248
Boy-utan 1,202 1,202 268
Bucayab 1,426 1,426 301
Cabalayangan 1,593 1,593 392
Cabisilan 675 675 158
Calumbaya 2,525 2,525 570
Carmay 482 482 112
Casilagan 1,104 1,104 215
Central East (Pob.) 4,308 4,288 971
Central West (Pob.) 4,135 4,064 971
Dili 2,026 2,026 474
Disso-or 1,064 1,064 237
Guerrero 969 969 225
Nagrebcan 1,458 1,458 344
Pagdalagan Sur 2,507 2,495 514
Palintucang 1,099 1,099 230
Philippine Statistics Authority 47

La Union 2015 Census of Population
Province, City, Municipality, Total Household Number of
and Barangay Population Population Households
TABLE 2 Total Population, Household Population, and Number of Households by Province,
(total population includes institutional population)
City, Municipality, and Barangay as of August 1, 2015: La Union
Palugsi-Limmansangan 1,558 1,558 333
Parian Oeste 1,223 1,223 319
Parian Este 1,899 1,899 431
Paringao 4,044 4,028 967
Payocpoc Norte Este 1,343 1,343 275
Payocpoc Norte Oeste 1,884 1,884 427
Payocpoc Sur 2,947 2,947 672
Pilar 415 415 91
Pudoc 1,737 1,737 393
Pottot 1,412 1,412 320
Pugo 3,058 3,040 747
Quinavite 3,706 3,706 860
Lower San Agustin 1,085 1,085 234
Santa Monica 1,276 1,276 295
Santiago 3,245 3,245 728
Taberna 1,814 1,814 409
Upper San Agustin 1,239 1,239 287
Urayong 1,320 1,256 305
BURGOS 8,067 8,067 1,750
Agpay 709 709 154
Bilis 1,130 1,130 246
Caoayan 471 471 96
Dalacdac 308 308 68
Delles 1,443 1,443 312
Imelda 387 387 77
Libtong 640 640 139
Linuan 427 427 98
New Poblacion 885 885 173
Old Poblacion 511 511 113
Lower Tumapoc 332 332 81
Upper Tumapoc 824 824 193
CABA 22,039 21,965 5,227
Bautista 1,093 1,093 267
Gana 2,405 2,405 553
Juan Cartas 788 788 189
Las-ud 1,344 1,344 300
Liquicia 1,227 1,227 274
48 Philippine Statistics Authority

2015 Census of Population La Union
Province, City, Municipality, Total Household Number of
and Barangay Population Population Households
TABLE 2 Total Population, Household Population, and Number of Households by Province,
(total population includes institutional population)
City, Municipality, and Barangay as of August 1, 2015: La Union
Poblacion Norte 1,395 1,350 318
Poblacion Sur 883 862 205
San Carlos 1,472 1,471 363
San Cornelio 1,404 1,404 362
San Fermin 990 990 251
San Gregorio 1,104 1,104 261
San Jose 2,454 2,454 584
Santiago Norte 1,095 1,095 261
Santiago Sur 1,969 1,969 452
Sobredillo 1,325 1,318 304
Urayong 684 684 181
Wenceslao 407 407 102
LUNA 35,802 35,677 8,490
Alcala (Pob.) 836 836 215
Ayaoan 654 654 153
Barangobong 915 915 235
Barrientos 1,902 1,902 463
Bungro 451 451 111
Buselbusel 1,124 1,124 271
Cabalitocan 1,086 1,086 240
Cantoria No. 1 499 499 124
Cantoria No. 2 534 534 144
Cantoria No. 3 701 701 164
Cantoria No. 4 538 538 119
Carisquis 687 687 163
Darigayos 1,568 1,568 358
Magallanes (Pob.) 1,990 1,990 478
Magsiping 857 857 196
Mamay 354 354 78
Nagrebcan 875 875 207
Nalvo Norte 1,318 1,271 285
Nalvo Sur 1,538 1,533 344
Napaset 1,260 1,254 305
Oaqui No. 1 531 531 128
Oaqui No. 2 368 368 85
Oaqui No. 3 684 684 158
Oaqui No. 4 711 711 170
Pila 1,345 1,345 279
Philippine Statistics Authority 49

La Union 2015 Census of Population
Province, City, Municipality, Total Household Number of
and Barangay Population Population Households
TABLE 2 Total Population, Household Population, and Number of Households by Province,
(total population includes institutional population)
City, Municipality, and Barangay as of August 1, 2015: La Union
Pitpitac 647 647 152
Rimos No. 1 726 714 192
Rimos No. 2 566 566 146
Rimos No. 3 763 763 195
Rimos No. 4 850 850 217
Rimos No. 5 1,356 1,356 303
Rissing 410 410 90
Salcedo (Pob.) 1,038 1,038 255
Santo Domingo Norte 1,495 1,495 354
Santo Domingo Sur 983 983 245
Sucoc Norte 558 558 131
Sucoc Sur 382 382 98
Suyo 607 607 147
Tallaoen 708 708 179
Victoria (Pob.) 1,387 1,332 313
NAGUILIAN 54,221 54,159 12,161
Aguioas 934 934 229
Al-alinao Norte 1,450 1,450 338
Al-alinao Sur 982 982 233
Ambaracao Norte 1,803 1,803 443
Ambaracao Sur 1,023 1,023 237
Angin 857 837 184
Balecbec 1,025 1,025 194
Bancagan 1,271 1,271 272
Baraoas Norte 1,017 1,017 226
Baraoas Sur 3,479 3,479 788
Bariquir 1,986 1,986 456
Bato 1,754 1,735 361
Bimmotobot 1,169 1,169 245
Cabaritan Norte 553 553 121
Cabaritan Sur 2,052 2,052 471
Casilagan 2,210 2,210 479
Dal-lipaoen 1,935 1,935 422
Daramuangan 1,200 1,200 264
Guesset 1,478 1,478 309
Gusing Norte 1,617 1,617 377
Gusing Sur 1,622 1,622 394
Imelda 1,431 1,431 315
50 Philippine Statistics Authority

2015 Census of Population La Union
Province, City, Municipality, Total Household Number of
and Barangay Population Population Households
TABLE 2 Total Population, Household Population, and Number of Households by Province,
(total population includes institutional population)
City, Municipality, and Barangay as of August 1, 2015: La Union
Lioac Norte 1,529 1,529 341
Lioac Sur 1,434 1,434 315
Magungunay 906 906 197
Mamat-ing Norte 1,136 1,136 237
Mamat-ing Sur 1,289 1,289 281
Nagsidorisan 1,131 1,131 256
Natividad (Pob.) 3,201 3,201 699
Ortiz (Pob.) 2,968 2,968 683
Ribsuan 1,151 1,128 288
San Antonio 915 915 221
San Isidro 933 933 202
Sili 1,291 1,291 293
Suguidan Norte 893 893 197
Suguidan Sur 1,044 1,044 227
Tuddingan 1,552 1,552 366
PUGO 19,690 19,636 4,811
Ambalite 1,037 1,037 257
Ambangonan 1,192 1,192 292
Cares 2,671 2,671 676
Cuenca 1,931 1,931 437
Duplas 604 604 177
Maoasoas Norte 1,413 1,413 319
Maoasoas Sur 1,005 1,005 208
Palina 1,763 1,710 455
Poblacion East 895 895 234
San Luis 2,452 2,452 588
Saytan 1,671 1,671 436
Tavora East 752 751 170
Tavora Proper 1,256 1,256 289
Poblacion West 1,048 1,048 273
ROSARIO 55,458 55,343 13,171
Alipang 952 952 233
Ambangonan 581 564 131
Amlang 2,084 2,078 515
Bacani 1,359 1,359 288
Bangar 658 658 172
Bani 1,654 1,654 370
Philippine Statistics Authority 51

La Union 2015 Census of Population
Province, City, Municipality, Total Household Number of
and Barangay Population Population Households
TABLE 2 Total Population, Household Population, and Number of Households by Province,
(total population includes institutional population)
City, Municipality, and Barangay as of August 1, 2015: La Union
Benteng-Sapilang 1,263 1,254 284
Cadumanian 1,019 1,019 238
Camp One 3,213 3,213 790
Carunuan East 1,474 1,474 357
Carunuan West 1,498 1,498 304
Casilagan 667 667 162
Cataguingtingan 2,554 2,554 597
Concepcion 3,274 3,274 832
Damortis 2,513 2,513 465
Gumot-Nagcolaran 1,958 1,958 456
Inabaan Norte 1,873 1,863 485
Inabaan Sur 1,481 1,463 365
Nagtagaan 1,919 1,875 420
Nangcamotian 742 742 190
Parasapas 1,798 1,798 428
Poblacion East 2,180 2,180 543
Poblacion West 1,867 1,867 429
Puzon 836 836 214
Rabon 1,035 1,035 271
San Jose 590 590 156
Marcos 1,398 1,398 340
Subusub 2,621 2,621 677
Tabtabungao 2,847 2,847 735
Tanglag 743 732 175
Tay-ac 2,672 2,672 637
Udiao 2,592 2,592 621
Vila 1,543 1,543 291
CITY OF SAN FERNANDO (Capital) 121,812 121,219 28,505
Abut 543 543 140
Apaleng 454 454 111
Bacsil 568 568 158
Bangbangolan 593 593 137
Bangcusay 1,402 1,402 309
Barangay I (Pob.) 2,216 2,205 457
Barangay II (Pob.) 487 452 117
Barangay III (Pob.) 383 347 91
Barangay IV (Pob.) 695 693 133
Baraoas 1,019 1,019 225
52 Philippine Statistics Authority

2015 Census of Population La Union
Province, City, Municipality, Total Household Number of
and Barangay Population Population Households
TABLE 2 Total Population, Household Population, and Number of Households by Province,
(total population includes institutional population)
City, Municipality, and Barangay as of August 1, 2015: La Union
Bato 1,046 1,046 256
Biday 3,967 3,967 969
Birunget 539 539 118
Bungro 1,467 1,467 331
Cabaroan (Negro) 3,288 3,285 793
Cabarsican 426 426 91
Cadaclan 1,547 1,547 307
Calabugao 437 437 105
Camansi 930 930 236
Canaoay 1,647 1,647 370
Carlatan 2,461 2,461 605
Catbangen 9,781 9,769 2,358
Dallangayan Este 1,315 1,315 314
Dallangayan Oeste 2,218 2,218 512
Dalumpinas Este 1,455 1,455 315
Dalumpinas Oeste 1,587 1,587 379
Ilocanos Norte 1,368 1,368 277
Ilocanos Sur 2,755 2,733 531
Langcuas 1,825 1,825 441
Lingsat 7,286 7,268 1,676
Madayegdeg 1,762 1,757 454
Mameltac 1,483 1,483 354
Masicong 498 498 103
Nagyubuyuban 1,329 1,329 309
Namtutan 808 808 200
Narra Este 491 491 106
Narra Oeste 700 700 162
Pacpaco 931 931 211
Pagdalagan 3,311 3,311 783
Pagdaraoan 2,711 2,711 694
Pagudpud 2,210 2,198 507
Pao Norte 630 630 163
Pao Sur 399 399 109
Parian 3,650 3,650 789
Pias 1,397 1,231 267
Poro 6,711 6,603 1,597
Puspus 480 480 118
Sacyud 629 629 135
Sagayad 2,861 2,861 665
Philippine Statistics Authority 53

La Union 2015 Census of Population
Province, City, Municipality, Total Household Number of
and Barangay Population Population Households
TABLE 2 Total Population, Household Population, and Number of Households by Province,
(total population includes institutional population)
City, Municipality, and Barangay as of August 1, 2015: La Union
San Agustin 2,204 2,204 518
San Francisco 3,432 3,416 819
San Vicente 2,471 2,401 555
Santiago Norte 3,928 3,885 867
Santiago Sur 1,808 1,808 407
Saoay 841 841 189
Sevilla 11,470 11,459 2,848
Siboan-Otong 878 878 217
Tanqui 5,010 4,987 1,229
Tanquigan 1,074 1,074 268
SAN GABRIEL 18,172 18,166 3,907
Amontoc 2,023 2,023 453
Apayao 943 943 221
Balbalayang 695 695 167
Bayabas 494 494 115
Bucao 1,908 1,908 445
Bumbuneg 2,431 2,431 587
Lacong 1,609 1,609 323
Lipay Este 527 527 106
Lipay Norte 677 677 142
Lipay Proper 413 413 82
Lipay Sur 821 821 116
Lon-oy 760 760 159
Poblacion 2,919 2,913 619
Polipol 940 940 164
Daking 1,012 1,012 208
SAN JUAN 37,188 37,082 8,714
Allangigan 194 194 45
Aludaid 670 670 153
Bacsayan 880 880 218
Balballosa 500 499 125
Bambanay 541 541 128
Bugbugcao 678 678 157
Caarusipan 320 320 73
Cabaroan 1,420 1,420 332
Cabugnayan 861 861 212
Cacapian 1,174 1,137 283
54 Philippine Statistics Authority

2015 Census of Population La Union
Province, City, Municipality, Total Household Number of
and Barangay Population Population Households
TABLE 2 Total Population, Household Population, and Number of Households by Province,
(total population includes institutional population)
City, Municipality, and Barangay as of August 1, 2015: La Union
Caculangan 414 414 111
Calincamasan 1,026 1,026 242
Casilagan 851 850 209
Catdongan 473 473 113
Dangdangla 907 907 206
Dasay 709 708 160
Dinanum 798 798 169
Duplas 652 652 157
Guinguinabang 573 573 145
Ili Norte (Pob.) 2,598 2,570 628
Ili Sur (Pob.) 2,520 2,513 592
Legleg 558 558 131
Lubing 904 904 213
Nadsaag 797 797 180
Nagsabaran 598 598 120
Naguirangan 695 695 164
Naguituban 1,225 1,225 272
Nagyubuyuban 427 427 113
Oaquing 321 321 69
Pacpacac 509 509 106
Pagdildilan 507 507 120
Panicsican 1,344 1,344 293
Quidem 215 215 52
San Felipe 1,360 1,360 316
Santa Rosa 462 462 109
Santo Rosario 754 754 176
Saracat 560 560 128
Sinapangan 553 553 128
Taboc 2,871 2,859 666
Talogtog 1,790 1,772 440
Urbiztondo 1,979 1,978 460
SANTO TOMAS 39,092 39,066 8,996
Ambitacay 687 687 143
Bail 2,397 2,397 551
Balaoc 1,344 1,344 302
Balsaan 872 872 212
Baybay 1,379 1,379 284
Cabaruan 1,372 1,372 281
Philippine Statistics Authority 55

La Union 2015 Census of Population
Province, City, Municipality, Total Household Number of
and Barangay Population Population Households
TABLE 2 Total Population, Household Population, and Number of Households by Province,
(total population includes institutional population)
City, Municipality, and Barangay as of August 1, 2015: La Union
Casantaan 2,137 2,137 533
Casilagan 1,568 1,568 341
Cupang 1,484 1,484 312
Damortis 2,750 2,750 672
Fernando 1,359 1,359 265
Linong 805 805 212
Lomboy 1,350 1,350 340
Malabago 534 534 136
Namboongan 2,480 2,480 607
Namonitan 2,152 2,152 441
Narvacan 594 594 130
Patac 3,149 3,149 778
Poblacion 1,938 1,938 461
Pongpong 1,573 1,573 356
Raois 1,077 1,077 243
Tubod 2,892 2,892 706
Tococ 1,269 1,269 315
Ubagan 1,930 1,904 375
SANTOL 12,476 12,468 2,789
Corrooy 2,169 2,166 471
Lettac Norte 1,125 1,124 267
Lettac Sur 1,152 1,152 250
Mangaan 1,141 1,141 253
Paagan 1,431 1,431 324
Poblacion 1,582 1,578 371
Puguil 1,056 1,056 229
Ramot 728 728 165
Sapdaan 395 395 90
Sasaba 878 878 207
Tubaday 819 819 162
SUDIPEN 17,056 17,021 3,810
Bigbiga 1,080 1,080 248
Castro 1,550 1,550 313
Duplas 973 973 230
Ipet 1,638 1,628 368
Ilocano 833 833 198
Maliclico 833 833 198
56 Philippine Statistics Authority

2015 Census of Population La Union
Province, City, Municipality, Total Household Number of
and Barangay Population Population Households
TABLE 2 Total Population, Household Population, and Number of Households by Province,
(total population includes institutional population)
City, Municipality, and Barangay as of August 1, 2015: La Union
Old Central 1,361 1,361 303
Namaltugan 1,021 1,021 227
Poblacion 1,240 1,216 268
Porporiket 900 900 193
San Francisco Norte 524 524 120
San Francisco Sur 847 847 199
San Jose 871 871 196
Sengngat 1,357 1,357 286
Turod 879 879 199
Up-uplas 537 537 132
Bulalaan 612 611 132
TUBAO 28,729 28,729 6,441
Amallapay 1,975 1,975 464
Anduyan 1,896 1,896 431
Caoigue 1,223 1,223 265
Francia Sur 1,443 1,443 331
Francia West 1,669 1,669 381
Garcia 1,610 1,610 348
Gonzales 1,735 1,735 399
Halog East 921 921 184
Halog West 1,437 1,437 343
Leones East 1,519 1,519 341
Leones West 1,459 1,459 311
Linapew 1,388 1,388 336
Magsaysay 1,565 1,565 337
Pideg 1,586 1,586 308
Poblacion 731 731 170
Rizal 1,451 1,451 318
Santa Teresa 1,618 1,618 357
Lloren 3,503 3,503 817
Source:
Philippine Statistics Authority, 2015 Census of Population
Philippine Statistics Authority 57

Pangasinan 2015 Census of Population
Province, City, Municipality, Total Household Number of
and Barangay Population Population Households
PANGASINAN 2,956,726 2,951,267 674,575
AGNO 28,052 28,052 6,624
Allabon 661 661 154
Aloleng 2,560 2,560 637
Bangan-Oda 3,771 3,771 878
Baruan 1,664 1,664 348
Boboy 3,311 3,311 728
Cayungnan 2,119 2,119 501
Dangley 586 586 146
Gayusan 1,416 1,416 305
Macaboboni 2,428 2,428 582
Magsaysay 1,155 1,155 301
Namatucan 1,234 1,234 277
Patar 1,020 1,020 231
Poblacion East 1,521 1,521 352
Poblacion West 1,190 1,190 269
San Juan 1,220 1,220 325
Tupa 1,228 1,228 331
Viga 968 968 259
AGUILAR 41,463 41,442 8,777
Bayaoas 2,048 2,048 436
Baybay 3,455 3,455 721
Bocacliw 2,951 2,951 625
Bocboc East 2,538 2,538 598
Bocboc West 1,812 1,812 363
Buer 3,245 3,245 681
Calsib 2,609 2,608 553
Ninoy 3,810 3,799 810
Poblacion 3,505 3,496 815
Pogomboa 1,860 1,860 376
Pogonsili 2,540 2,540 547
San Jose 2,585 2,585 541
Tampac 2,193 2,193 458
Laoag 3,413 3,413 659
Manlocboc 1,273 1,273 272
Panacol 1,626 1,626 322
TABLE 2 Total Population, Household Population, and Number of Households by Province,
(total population includes institutional population)
City, Municipality, and Barangay as of August 1, 2015: Pangasinan
58 Philippine Statistics Authority

2015 Census of Population Pangasinan
Province, City, Municipality, Total Household Number of
and Barangay Population Population Households
TABLE 2 Total Population, Household Population, and Number of Households by Province,
(total population includes institutional population)
City, Municipality, and Barangay as of August 1, 2015: Pangasinan
CITY OF ALAMINOS 89,708 89,518 21,576
Alos 2,077 2,077 488
Amandiego 1,575 1,483 415
Amangbangan 1,238 1,238 337
Balangobong 1,891 1,891 488
Balayang 1,193 1,193 265
Bisocol 1,645 1,645 408
Bolaney 2,331 2,315 577
Baleyadaan 1,807 1,807 384
Bued 3,197 3,197 771
Cabatuan 1,857 1,857 419
Cayucay 1,649 1,649 425
Dulacac 1,293 1,293 330
Inerangan 1,858 1,858 470
Linmansangan 1,342 1,342 342
Lucap 5,714 5,700 1,288
Macatiw 985 969 251
Magsaysay 3,237 3,237 783
Mona 1,857 1,857 465
Palamis 4,484 4,484 1,310
Pangapisan 2,734 2,734 608
Poblacion 10,302 10,251 2,363
Pocalpocal 2,270 2,269 539
Pogo 2,248 2,248 460
Polo 2,354 2,354 599
Quibuar 1,648 1,648 421
Sabangan 1,960 1,960 408
San Jose 1,646 1,646 353
San Roque 2,367 2,367 639
San Vicente 3,757 3,757 953
Santa Maria 1,327 1,327 315
Tanaytay 1,645 1,645 441
Tangcarang 2,300 2,300 548
Tawintawin 1,564 1,564 336
Telbang 3,488 3,488 812
Victoria 2,345 2,345 530
Landoc 688 688 172
Maawi 1,294 1,294 288
Pandan 1,398 1,398 324
Philippine Statistics Authority 59

Pangasinan 2015 Census of Population
Province, City, Municipality, Total Household Number of
and Barangay Population Population Households
TABLE 2 Total Population, Household Population, and Number of Households by Province,
(total population includes institutional population)
City, Municipality, and Barangay as of August 1, 2015: Pangasinan
San Antonio (R. Magsaysay) 1,143 1,143 251
ALCALA 43,402 43,396 10,174
Anulid 2,322 2,322 494
Atainan 1,532 1,532 334
Bersamin 3,498 3,498 827
Canarvacanan 1,767 1,767 440
Caranglaan 1,131 1,131 265
Curareng 718 718 170
Gualsic 1,535 1,535 364
Kasikis 3,170 3,170 711
Laoac 2,911 2,911 631
Macayo 1,908 1,908 460
Pindangan Centro 1,658 1,658 400
Pindangan East 1,688 1,688 356
Pindangan West 1,337 1,337 290
Poblacion East 1,438 1,438 343
Poblacion West 1,724 1,724 415
San Juan 2,004 2,004 476
San Nicolas 679 679 165
San Pedro Apartado 3,606 3,606 809
San Pedro III 3,410 3,404 828
San Vicente 4,239 4,239 1,144
Vacante 1,127 1,127 252
ANDA 39,504 39,504 9,376
Awile 1,658 1,658 423
Awag 2,226 2,226 506
Batiarao 1,665 1,665 399
Cabungan 3,178 3,178 720
Carot 3,440 3,440 770
Dolaoan 2,164 2,164 489
Imbo 1,626 1,626 348
Macaleeng 1,710 1,710 426
Macandocandong 1,040 1,040 249
Mal-ong 2,877 2,877 722
Namagbagan 1,726 1,726 444
Poblacion 3,450 3,450 841
Roxas 1,786 1,786 424
60 Philippine Statistics Authority

2015 Census of Population Pangasinan
Province, City, Municipality, Total Household Number of
and Barangay Population Population Households
TABLE 2 Total Population, Household Population, and Number of Households by Province,
(total population includes institutional population)
City, Municipality, and Barangay as of August 1, 2015: Pangasinan
Sablig 2,377 2,377 585
San Jose 2,216 2,216 545
Siapar 1,594 1,594 368
Tondol 2,935 2,935 697
Toritori 1,836 1,836 420
ASINGAN 57,355 57,349 13,623
Ariston Este 1,162 1,162 312
Ariston Weste 2,958 2,958 689
Bantog 4,421 4,415 1,069
Baro 2,846 2,846 724
Bobonan 1,402 1,402 326
Cabalitian 2,449 2,449 564
Calepaan 4,086 4,086 985
Carosucan Norte 3,824 3,824 922
Carosucan Sur 3,255 3,255 763
Coldit 1,746 1,746 368
Domanpot 5,728 5,728 1,346
Dupac 2,248 2,248 539
Macalong 3,663 3,663 822
Palaris 2,120 2,120 514
Poblacion East 2,930 2,930 690
Poblacion West 1,570 1,570 378
San Vicente Este 1,354 1,354 302
San Vicente Weste 2,265 2,265 532
Sanchez 1,275 1,275 363
Sobol 2,701 2,701 625
Toboy 3,352 3,352 790
BALUNGAO 31,106 30,860 7,606
Angayan Norte 1,272 1,264 308
Angayan Sur 707 707 171
Capulaan 1,198 1,198 287
Esmeralda 3,160 3,152 711
Kita-kita 1,746 1,746 501
Mabini 992 988 238
Mauban 1,139 1,139 269
Poblacion 2,197 2,182 579
Pugaro 2,553 2,351 614
Philippine Statistics Authority 61

Pangasinan 2015 Census of Population
Province, City, Municipality, Total Household Number of
and Barangay Population Population Households
TABLE 2 Total Population, Household Population, and Number of Households by Province,
(total population includes institutional population)
City, Municipality, and Barangay as of August 1, 2015: Pangasinan
Rajal 2,009 2,009 495
San Andres 1,061 1,054 247
San Aurelio 1st 2,074 2,074 539
San Aurelio 2nd 1,638 1,638 401
San Aurelio 3rd 871 871 196
San Joaquin 1,656 1,656 410
San Julian 1,124 1,124 279
San Leon 2,072 2,072 438
San Marcelino 1,511 1,511 397
San Miguel 740 740 179
San Raymundo 1,386 1,384 347
BANI 50,306 50,292 12,337
Ambabaay 1,998 1,998 521
Aporao 800 800 176
Arwas 2,085 2,085 466
Ballag 1,144 1,144 308
Banog Norte 2,323 2,323 524
Banog Sur 1,460 1,460 368
Centro Toma 1,992 1,992 467
Colayo 1,900 1,900 497
Dacap Norte 1,131 1,131 244
Dacap Sur 2,610 2,610 579
Garrita 1,561 1,561 366
Luac 1,936 1,936 441
Macabit 1,138 1,138 273
Masidem 1,096 1,096 254
Poblacion 5,011 5,004 1,380
Quinaoayanan 3,317 3,317 792
Ranao 2,290 2,290 594
Ranom Iloco 1,708 1,708 446
San Jose 1,982 1,975 530
San Miguel 3,466 3,466 914
San Simon 1,433 1,433 333
San Vicente 1,439 1,439 381
Tiep 2,296 2,296 540
Tipor 874 874 222
Tugui Grande 1,487 1,487 294
Tugui Norte 733 733 185
62 Philippine Statistics Authority

2015 Census of Population Pangasinan
Province, City, Municipality, Total Household Number of
and Barangay Population Population Households
TABLE 2 Total Population, Household Population, and Number of Households by Province,
(total population includes institutional population)
City, Municipality, and Barangay as of August 1, 2015: Pangasinan
Calabeng 1,096 1,096 242
BASISTA 32,959 32,922 6,904
Anambongan 3,206 3,206 664
Bayoyong 1,847 1,846 426
Cabeldatan 2,896 2,896 641
Dumpay 5,955 5,955 1,279
Malimpec East 1,604 1,602 321
Mapolopolo 2,311 2,311 502
Nalneran 1,296 1,296 313
Navatat 3,049 3,034 599
Obong 2,314 2,314 458
Osmena Sr. 1,873 1,873 375
Palma 2,266 2,266 445
Patacbo 1,619 1,619 324
Poblacion 2,723 2,704 557
BAUTISTA 32,307 32,302 6,892
Artacho 1,298 1,298 300
Cabuaan 1,399 1,399 317
Cacandongan 909 909 192
Diaz 4,519 4,519 934
Nandacan 1,407 1,407 312
Nibaliw Norte 2,078 2,078 429
Nibaliw Sur 1,059 1,059 210
Palisoc 1,720 1,720 360
Poblacion East 1,969 1,969 418
Poblacion West 982 982 205
Pogo 1,944 1,944 413
Poponto 1,977 1,977 398
Primicias 1,916 1,916 454
Ketegan 1,121 1,121 224
Sinabaan 612 612 131
Vacante 1,624 1,624 338
Villanueva 2,451 2,446 544
Baluyot 3,322 3,322 713
BAYAMBANG 118,205 118,182 25,596
Alinggan 1,430 1,430 349
Philippine Statistics Authority 63

Pangasinan 2015 Census of Population
Province, City, Municipality, Total Household Number of
and Barangay Population Population Households
TABLE 2 Total Population, Household Population, and Number of Households by Province,
(total population includes institutional population)
City, Municipality, and Barangay as of August 1, 2015: Pangasinan
Amamperez 1,058 1,058 235
Amancosiling Norte 1,168 1,168 268
Amancosiling Sur 2,812 2,812 593
Ambayat I 847 847 211
Ambayat II 1,230 1,230 273
Apalen 958 958 204
Asin 550 550 111
Ataynan 1,267 1,267 246
Bacnono 2,097 2,097 466
Balaybuaya 1,941 1,941 333
Banaban 1,797 1,797 370
Bani 2,860 2,860 573
Batangcawa 1,148 1,148 225
Beleng 1,699 1,699 297
Bical Norte 3,005 3,005 645
Bical Sur 1,614 1,614 314
Bongato East 2,080 2,080 466
Bongato West 807 807 179
Buayaen 2,894 2,894 574
Buenlag 1st 1,017 1,017 275
Buenlag 2nd 1,420 1,420 288
Cadre Site 2,642 2,642 542
Carungay 1,112 1,112 266
Caturay 1,387 1,387 317
Duera 1,089 1,089 216
Dusoc 1,268 1,268 303
Hermoza 2,966 2,955 708
Idong 866 866 175
Inanlorenzana 1,093 1,093 235
Inirangan 1,560 1,560 334
Iton 119 119 31
Langiran 1,513 1,513 344
Ligue 1,285 1,285 263
M. H. del Pilar 1,927 1,915 397
Macayocayo 1,439 1,439 282
Magsaysay 1,387 1,387 325
Maigpa 1,477 1,477 326
Malimpec 1,184 1,184 272
Malioer 2,262 2,262 487
64 Philippine Statistics Authority

2015 Census of Population Pangasinan
Province, City, Municipality, Total Household Number of
and Barangay Population Population Households
TABLE 2 Total Population, Household Population, and Number of Households by Province,
(total population includes institutional population)
City, Municipality, and Barangay as of August 1, 2015: Pangasinan
Managos 1,534 1,534 355
Manambong Norte 906 906 186
Manambong Parte 1,869 1,869 395
Manambong Sur 2,323 2,323 476
Mangayao 1,095 1,095 226
Nalsian Norte 1,774 1,774 444
Nalsian Sur 1,497 1,497 326
Pangdel 2,212 2,212 497
Pantol 1,235 1,235 284
Paragos 593 593 144
Poblacion Sur 1,219 1,219 243
Pugo 1,439 1,439 305
Reynado 1,205 1,205 252
San Gabriel 1st 1,375 1,375 304
San Gabriel 2nd 2,194 2,194 521
San Vicente 2,706 2,706 591
Sangcagulis 1,748 1,748 359
Sanlibo 3,010 3,010 586
Sapang 1,985 1,985 409
Tamaro 1,733 1,733 379
Tambac 2,653 2,653 596
Tampog 1,457 1,457 314
Darawey (Tangal) 1,209 1,209 255
Tanolong 3,044 3,044 684
Tatarao 1,183 1,183 352
Telbang 2,165 2,165 521
Tococ East 788 788 150
Tococ West 1,994 1,994 400
Warding 1,247 1,247 288
Wawa 1,572 1,572 367
Zone I (Pob.) 234 234 50
Zone II (Pob.) 260 260 58
Zone III (Pob.) 372 372 88
Zone IV (Pob.) 689 689 139
Zone V (Pob.) 1,320 1,320 286
Zone VI (Pob.) 1,081 1,081 219
Zone VII (Pob.) 1,010 1,010 229
Philippine Statistics Authority 65

Pangasinan 2015 Census of Population
Province, City, Municipality, Total Household Number of
and Barangay Population Population Households
TABLE 2 Total Population, Household Population, and Number of Households by Province,
(total population includes institutional population)
City, Municipality, and Barangay as of August 1, 2015: Pangasinan
BINALONAN 54,555 54,442 12,849
Balangobong 1,497 1,497 367
Bued 2,875 2,873 666
Bugayong 2,955 2,955 654
Camangaan 1,162 1,162 277
Canarvacanan 1,998 1,997 458
Capas 2,163 2,163 484
Cili 2,109 2,109 469
Dumayat 1,396 1,396 294
Linmansangan 3,851 3,829 958
Mangcasuy 1,444 1,444 364
Moreno 1,565 1,565 396
Pasileng Norte 648 648 155
Pasileng Sur 1,348 1,348 323
Poblacion 7,532 7,523 1,688
San Felipe Central 2,304 2,304 567
San Felipe Sur 2,147 2,126 500
San Pablo 1,715 1,715 421
Santa Catalina 2,708 2,708 660
Santa Maria Norte 2,682 2,624 644
Santiago 1,352 1,352 323
Santo Niño 1,624 1,624 385
Sumabnit 4,463 4,463 1,104
Tabuyoc 1,204 1,204 277
Vacante 1,813 1,813 415
BINMALEY 83,052 82,910 20,160
Amancoro 832 832 232
Balagan 1,838 1,838 480
Balogo 2,188 2,188 587
Basing 2,236 2,236 582
Baybay Lopez 2,654 2,654 672
Baybay Polong 2,804 2,804 640
Biec 3,284 3,273 749
Buenlag 2,946 2,946 709
Calit 2,420 2,420 560
Caloocan Norte 2,760 2,760 705
Caloocan Sur 3,572 3,572 885
Camaley 2,312 2,312 506
66 Philippine Statistics Authority

2015 Census of Population Pangasinan
Province, City, Municipality, Total Household Number of
and Barangay Population Population Households
TABLE 2 Total Population, Household Population, and Number of Households by Province,
(total population includes institutional population)
City, Municipality, and Barangay as of August 1, 2015: Pangasinan
Canaoalan 3,694 3,694 933
Dulag 3,166 3,166 816
Gayaman 4,189 4,189 1,011
Linoc 2,266 2,266 585
Lomboy 3,521 3,521 742
Nagpalangan 1,891 1,891 477
Malindong 3,321 3,321 730
Manat 1,635 1,635 407
Naguilayan 4,440 4,440 1,180
Pallas 2,032 2,032 420
Papagueyan 1,635 1,635 412
Parayao 1,842 1,842 441
Poblacion 4,933 4,814 1,125
Pototan 1,096 1,096 236
Sabangan 747 747 171
Salapingao 1,272 1,272 318
San Isidro Norte 2,527 2,515 688
San Isidro Sur 2,634 2,634 633
Santa Rosa 3,285 3,285 789
Tombor 1,974 1,974 489
Caloocan Dupo 1,106 1,106 250
BOLINAO 82,084 81,953 17,681
Arnedo 5,354 5,354 1,169
Balingasay 4,435 4,435 938
Binabalian 4,039 4,039 882
Cabuyao 2,607 2,607 559
Catuday 2,752 2,752 612
Catungi 1,594 1,594 366
Concordia (Pob.) 4,307 4,307 969
Culang 1,676 1,676 418
Dewey 1,984 1,984 438
Estanza 1,892 1,892 439
Germinal (Pob.) 3,668 3,668 753
Goyoden 2,691 2,691 559
Ilogmalino 2,660 2,660 577
Lambes (Lames) 1,158 1,158 272
Liwa-liwa 2,601 2,601 558
Lucero 3,168 3,168 689
Philippine Statistics Authority 67

Pangasinan 2015 Census of Population
Province, City, Municipality, Total Household Number of
and Barangay Population Population Households
TABLE 2 Total Population, Household Population, and Number of Households by Province,
(total population includes institutional population)
City, Municipality, and Barangay as of August 1, 2015: Pangasinan
Luciente 1.0 5,366 5,353 1,132
Luciente 2.0 3,822 3,822 830
Luna 3,355 3,343 654
Patar 1,397 1,397 331
Pilar 2,788 2,788 623
Salud 3,188 3,188 523
Samang Norte 1,084 1,071 239
Samang Sur 1,191 1,191 262
Sampaloc 2,940 2,938 638
San Roque 905 905 192
Tara 2,733 2,651 569
Tupa 2,231 2,227 486
Victory 1,320 1,320 290
Zaragoza 3,178 3,173 714
BUGALLON 67,348 67,197 14,587
Angarian 1,672 1,672 300
Asinan 1,911 1,911 402
Banaga 1,969 1,969 429
Bacabac 2,105 2,105 462
Bolaoen 2,148 2,148 408
Buenlag 1,630 1,630 388
Cabayaoasan 1,904 1,904 388
Cayanga 2,707 2,707 547
Gueset 2,438 2,438 588
Hacienda 3,575 3,575 739
Laguit Centro 1,672 1,672 382
Laguit Padilla 3,364 3,364 721
Magtaking 5,898 5,887 1,286
Pangascasan 1,822 1,822 384
Pantal 1,909 1,909 432
Poblacion 9,999 9,971 2,187
Polong 2,702 2,702 626
Portic 2,264 2,176 478
Salasa 2,927 2,927 669
Salomague Norte 1,334 1,334 290
Salomague Sur 2,902 2,878 596
Samat 1,776 1,776 440
San Francisco 1,407 1,407 296
68 Philippine Statistics Authority

2015 Census of Population Pangasinan
Province, City, Municipality, Total Household Number of
and Barangay Population Population Households
TABLE 2 Total Population, Household Population, and Number of Households by Province,
(total population includes institutional population)
City, Municipality, and Barangay as of August 1, 2015: Pangasinan
Umanday 5,313 5,313 1,149
BURGOS 21,637 21,422 4,800
Anapao (Bur Anapac) 476 476 104
Cacayasen 1,559 1,559 352
Concordia 1,133 1,133 249
Ilio-ilio (Iliw-iliw) 2,275 2,275 473
Papallasen 1,718 1,545 340
Poblacion 3,180 3,180 750
Pogoruac 2,405 2,405 506
Don Matias 1,438 1,438 318
San Miguel 1,088 1,088 259
San Pascual 1,491 1,491 339
San Vicente 910 910 226
Sapa Grande 1,321 1,321 301
Sapa Pequeña 970 970 215
Tambacan 1,673 1,631 368
CALASIAO 95,154 95,071 22,542
Ambonao 6,209 6,209 1,499
Ambuetel 2,877 2,877 681
Banaoang 4,682 4,682 1,056
Bued 5,589 5,573 1,333
Buenlag 8,338 8,338 2,012
Cabilocaan 2,899 2,899 691
Dinalaoan 3,850 3,849 919
Doyong 3,528 3,511 947
Gabon 2,631 2,631 637
Lasip 3,947 3,947 758
Longos 3,051 3,051 639
Lumbang 2,041 2,041 523
Macabito 4,025 4,025 946
Malabago 4,106 4,106 1,026
Mancup 3,458 3,458 779
Nagsaing 6,056 6,056 1,366
Nalsian 5,341 5,292 1,286
Poblacion East 1,693 1,693 418
Poblacion West 903 903 215
Quesban 2,921 2,921 717
Philippine Statistics Authority 69

Pangasinan 2015 Census of Population
Province, City, Municipality, Total Household Number of
and Barangay Population Population Households
TABLE 2 Total Population, Household Population, and Number of Households by Province,
(total population includes institutional population)
City, Municipality, and Barangay as of August 1, 2015: Pangasinan
San Miguel 7,860 7,860 1,975
San Vicente 1,629 1,629 390
Songkoy 2,869 2,869 662
Talibaew 4,651 4,651 1,067
DAGUPAN CITY 171,271 170,144 38,168
Bacayao Norte 3,476 3,476 747
Bacayao Sur 2,686 2,686 624
Barangay II (Nueva) 2,562 2,549 496
Barangay IV (Zamora) 1,201 1,151 256
Bolosan 3,872 3,872 886
Bonuan Binloc 9,506 9,496 2,142
Bonuan Boquig 14,354 14,354 3,272
Bonuan Gueset 23,373 22,446 5,188
Calmay 6,972 6,972 1,556
Carael 4,872 4,872 1,109
Caranglaan 7,485 7,485 1,673
Herrero 2,474 2,474 523
Lasip Chico 1,983 1,978 468
Lasip Grande 2,818 2,818 579
Lomboy 1,337 1,337 238
Lucao 10,252 10,228 2,195
Malued 9,581 9,581 2,078
Mamalingling 1,653 1,653 372
Mangin 4,019 4,019 921
Mayombo 6,943 6,933 1,467
Pantal 17,841 17,798 4,273
Poblacion Oeste 4,651 4,651 1,020
Barangay I (T. Bugallon) 664 664 166
Pogo Chico 4,747 4,741 1,112
Pogo Grande 2,211 2,211 539
Pugaro Suit 5,233 5,233 987
Salapingao 2,996 2,996 600
Salisay 2,140 2,140 454
Tambac 2,272 2,272 573
Tapuac 4,154 4,115 1,031
Tebeng 2,943 2,943 623
70 Philippine Statistics Authority

2015 Census of Population Pangasinan
Province, City, Municipality, Total Household Number of
and Barangay Population Population Households
TABLE 2 Total Population, Household Population, and Number of Households by Province,
(total population includes institutional population)
City, Municipality, and Barangay as of August 1, 2015: Pangasinan
DASOL 29,110 29,110 6,785
Alilao 532 532 104
Amalbalan 1,821 1,821 425
Bobonot 1,361 1,361 313
Eguia 3,194 3,194 731
Gais-Guipe 2,502 2,502 556
Hermosa 1,652 1,652 390
Macalang 2,025 2,025 471
Magsaysay 682 682 150
Malacapas 1,046 1,046 235
Malimpin 1,392 1,392 334
Osmeña 1,541 1,541 350
Petal 1,507 1,507 376
Poblacion 3,416 3,416 810
San Vicente 1,128 1,128 264
Tambac 838 838 222
Tambobong 1,658 1,658 403
Uli 2,033 2,033 472
Viga 782 782 179
INFANTA 24,584 24,584 5,621
Bamban 2,864 2,864 697
Batang 1,365 1,365 337
Bayambang 2,466 2,466 560
Cato 4,629 4,629 987
Doliman 1,429 1,429 319
Fatima 2,190 2,190 506
Maya 1,155 1,155 266
Nangalisan 1,253 1,253 302
Nayom 1,688 1,688 400
Pita 989 989 198
Poblacion 3,256 3,256 742
Potol 741 741 193
Babuyan 559 559 114
LABRADOR 23,201 23,150 5,480
Bolo 3,854 3,840 996
Bongalon 2,286 2,286 540
Dulig 2,345 2,345 517
Philippine Statistics Authority 71

Pangasinan 2015 Census of Population
Province, City, Municipality, Total Household Number of
and Barangay Population Population Households
TABLE 2 Total Population, Household Population, and Number of Households by Province,
(total population includes institutional population)
City, Municipality, and Barangay as of August 1, 2015: Pangasinan
Laois 2,500 2,475 565
Magsaysay 1,484 1,484 318
Poblacion 2,505 2,505 582
San Gonzalo 1,107 1,107 284
San Jose 1,232 1,232 287
Tobuan 2,951 2,941 769
Uyong 2,937 2,935 622
LINGAYEN (Capital) 103,278 102,865 21,780
Aliwekwek 1,437 1,437 270
Baay 5,633 5,622 1,223
Balangobong 1,412 1,412 276
Balococ 2,283 2,283 483
Bantayan 1,181 1,181 253
Basing 2,770 2,770 580
Capandanan 2,399 2,399 534
Domalandan Center 2,178 2,178 477
Domalandan East 2,394 2,394 508
Domalandan West 2,940 2,927 606
Dorongan 329 329 74
Dulag 1,654 1,654 343
Estanza 4,088 4,088 992
Lasip 1,970 1,970 367
Libsong East 6,176 6,176 1,295
Libsong West 4,994 4,983 1,077
Malawa 2,255 2,255 397
Malimpuec 3,669 3,669 895
Maniboc 7,670 7,670 1,602
Matalava 2,827 2,827 586
Naguelguel 3,051 3,051 619
Namolan 2,507 2,507 503
Pangapisan North 7,336 7,336 1,530
Pangapisan Sur 1,887 1,887 430
Poblacion 12,238 11,860 2,556
Quibaol 2,766 2,766 592
Rosario 2,106 2,106 408
Sabangan 1,484 1,484 362
Talogtog 641 641 127
Tonton 5,316 5,316 1,125
72 Philippine Statistics Authority

2015 Census of Population Pangasinan
Province, City, Municipality, Total Household Number of
and Barangay Population Population Households
TABLE 2 Total Population, Household Population, and Number of Households by Province,
(total population includes institutional population)
City, Municipality, and Barangay as of August 1, 2015: Pangasinan
Tumbar 1,847 1,847 346
Wawa 1,840 1,840 344
MABINI 24,765 24,765 5,917
Bacnit 1,345 1,345 307
Barlo 1,605 1,605 329
Caabiangaan 892 892 210
Cabanaetan 1,638 1,638 408
Cabinuangan 1,388 1,388 361
Calzada 1,834 1,834 433
Caranglaan 1,463 1,463 374
De Guzman 1,760 1,760 429
Luna 1,370 1,370 305
Magalong 850 850 208
Nibaliw 1,094 1,094 245
Patar 915 915 206
Poblacion 2,940 2,940 737
San Pedro 1,136 1,136 263
Tagudin 3,277 3,277 790
Villacorta 1,258 1,258 312
MALASIQUI 130,275 130,263 29,047
Abonagan 1,404 1,404 327
Agdao 793 793 168
Alacan 1,965 1,965 425
Aliaga 2,422 2,422 527
Amacalan 1,233 1,233 261
Anolid 1,163 1,163 263
Apaya 1,937 1,937 463
Asin Este 2,752 2,752 610
Asin Weste 965 965 247
Bacundao Este 1,298 1,298 301
Bacundao Weste 1,346 1,346 262
Bakitiw 2,110 2,110 441
Balite 882 882 207
Banawang 2,661 2,661 545
Barang 2,202 2,202 521
Bawer 725 725 150
Binalay 1,380 1,380 265
Philippine Statistics Authority 73

Pangasinan 2015 Census of Population
Province, City, Municipality, Total Household Number of
and Barangay Population Population Households
TABLE 2 Total Population, Household Population, and Number of Households by Province,
(total population includes institutional population)
City, Municipality, and Barangay as of August 1, 2015: Pangasinan
Bobon 1,044 1,044 225
Bolaoit 2,686 2,686 605
Bongar 1,829 1,829 409
Butao 1,239 1,239 254
Cabatling 2,715 2,703 625
Cabueldatan 653 653 155
Calbueg 1,859 1,859 427
Canan Norte 1,890 1,890 400
Canan Sur 1,182 1,182 254
Cawayan Bogtong 2,911 2,911 672
Don Pedro 3,077 3,077 661
Gatang 1,573 1,573 360
Goliman 1,378 1,378 304
Gomez 1,191 1,191 351
Guilig 1,470 1,470 275
Ican 1,462 1,462 326
Ingalagala 923 923 189
Lareg-lareg 2,483 2,483 554
Lasip 1,484 1,484 317
Lepa 2,151 2,151 460
Loqueb Este 2,638 2,638 557
Loqueb Norte 2,128 2,128 495
Loqueb Sur 1,549 1,549 366
Lunec 2,488 2,488 541
Mabulitec 923 923 200
Malimpec 2,266 2,266 454
Manggan-Dampay 1,422 1,422 298
Nancapian 1,293 1,293 300
Nalsian Norte 3,046 3,046 661
Nalsian Sur 1,199 1,199 254
Nansangaan 632 632 161
Olea 2,423 2,423 587
Pacuan 743 743 158
Palapar Norte 1,225 1,225 284
Palapar Sur 834 834 207
Palong 2,298 2,298 505
Pamaranum 695 695 147
Pasima 2,547 2,547 557
Payar 1,371 1,371 299
74 Philippine Statistics Authority

2015 Census of Population Pangasinan
Province, City, Municipality, Total Household Number of
and Barangay Population Population Households
TABLE 2 Total Population, Household Population, and Number of Households by Province,
(total population includes institutional population)
City, Municipality, and Barangay as of August 1, 2015: Pangasinan
Poblacion 8,027 8,027 2,055
Polong Norte 1,434 1,434 314
Polong Sur 1,636 1,636 396
Potiocan 1,634 1,634 338
San Julian 1,390 1,390 319
Tabo-Sili 1,161 1,161 237
Tobor 2,174 2,174 550
Talospatang 3,259 3,259 741
Taloy 2,424 2,424 502
Taloyan 1,298 1,298 266
Tambac 3,243 3,243 681
Tolonguat 890 890 206
Tomling 1,562 1,562 344
Umando 1,319 1,319 304
Viado 761 761 163
Waig 1,022 1,022 250
Warey 2,883 2,883 544
MANAOAG 69,497 69,399 14,939
Babasit 5,618 5,618 1,295
Baguinay 2,369 2,369 522
Baritao 5,401 5,372 1,148
Bisal 1,748 1,748 378
Bucao 1,725 1,725 358
Cabanbanan 3,964 3,964 853
Calaocan 1,891 1,891 394
Inamotan 2,498 2,498 584
Lelemaan 2,805 2,805 629
Licsi 1,607 1,592 336
Lipit Norte 2,377 2,377 497
Lipit Sur 2,993 2,993 642
Parian 519 519 94
Matolong 1,644 1,644 367
Mermer 1,479 1,479 300
Nalsian 2,409 2,409 543
Oraan East 1,149 1,149 220
Oraan West 1,594 1,594 344
Pantal 3,175 3,175 669
Pao 3,456 3,456 787
Philippine Statistics Authority 75

Pangasinan 2015 Census of Population
Province, City, Municipality, Total Household Number of
and Barangay Population Population Households
TABLE 2 Total Population, Household Population, and Number of Households by Province,
(total population includes institutional population)
City, Municipality, and Barangay as of August 1, 2015: Pangasinan
Poblacion 5,320 5,266 1,028
Pugaro 5,536 5,536 1,187
San Ramon 1,628 1,628 344
Santa Ines 1,868 1,868 388
Sapang 2,679 2,679 557
Tebuel 2,045 2,045 475
MANGALDAN 106,331 106,313 23,437
Alitaya 4,378 4,378 960
Amansabina 2,609 2,609 515
Anolid 7,393 7,393 1,610
Banaoang 5,267 5,267 1,273
Bantayan 3,633 3,633 788
Bari 6,044 6,032 1,256
Bateng 2,715 2,715 588
Buenlag 3,787 3,787 876
David 4,389 4,383 1,012
Embarcadero 3,021 3,021 606
Gueguesangen 2,551 2,551 559
Guesang 3,935 3,935 791
Guiguilonen 2,945 2,945 730
Guilig 3,491 3,491 645
Inlambo 1,673 1,673 378
Lanas 3,285 3,285 679
Landas 2,023 2,023 524
Maasin 3,862 3,862 923
Macayug 2,485 2,485 564
Malabago 5,095 5,095 1,147
Navaluan 3,678 3,678 863
Nibaliw 3,105 3,105 653
Osiem 3,437 3,437 727
Palua 2,013 2,013 457
Poblacion 4,639 4,639 928
Pogo 1,631 1,631 398
Salaan 2,598 2,598 601
Salay 5,331 5,331 1,180
Tebag 2,832 2,832 660
Talogtog 2,486 2,486 546
76 Philippine Statistics Authority

2015 Census of Population Pangasinan
Province, City, Municipality, Total Household Number of
and Barangay Population Population Households
TABLE 2 Total Population, Household Population, and Number of Households by Province,
(total population includes institutional population)
City, Municipality, and Barangay as of August 1, 2015: Pangasinan
MANGATAREM 73,241 73,200 16,554
Andangin 840 840 173
Arellano Street (Pob.) 447 447 109
Bantay 493 493 117
Bantocaling 1,496 1,496 355
Baracbac 1,051 1,051 243
Peania Pedania (Bedania) 1,302 1,302 277
Bogtong Bolo 836 836 207
Bogtong Bunao 787 787 182
Bogtong Centro 367 367 87
Bogtong Niog 585 585 132
Bogtong Silag 1,815 1,815 419
Buaya 390 390 80
Buenlag 642 642 149
Bueno 839 839 180
Bunagan 539 539 126
Bunlalacao 1,081 1,081 230
Burgos Street (Pob.) 984 984 229
Cabaluyan 1st 532 532 125
Cabaluyan 2nd 1,080 1,080 233
Cabarabuan 786 786 182
Cabaruan 549 549 127
Cabayaoasan 1,309 1,309 309
Cabayugan 662 662 168
Cacaoiten 602 602 157
Calumboyan Norte 585 585 120
Calumboyan Sur 871 871 181
Calvo (Pob.) 912 912 209
Casilagan 1,399 1,399 333
Catarataraan 374 374 82
Caturay Norte 797 797 146
Caturay Sur 969 969 191
Caviernesan 1,279 1,279 318
Dorongan Ketaket 992 992 237
Dorongan Linmansangan 184 184 38
Dorongan Punta 1,833 1,833 355
Dorongan Sawat 1,778 1,778 383
Dorongan Valerio 1,880 1,880 388
General Luna (Pob.) 283 272 72
Philippine Statistics Authority 77

Pangasinan 2015 Census of Population
Province, City, Municipality, Total Household Number of
and Barangay Population Population Households
TABLE 2 Total Population, Household Population, and Number of Households by Province,
(total population includes institutional population)
City, Municipality, and Barangay as of August 1, 2015: Pangasinan
Historia 443 443 111
Lawak Langka 971 971 220
Linmansangan 1,006 1,006 224
Lopez (Pob.) 799 799 186
Mabini (Pob.) 683 680 153
Macarang 1,350 1,350 295
Malabobo 1,671 1,658 411
Malibong 293 293 71
Malunec 335 335 73
Maravilla (Pob.) 770 770 173
Maravilla-Arellano Ext. (Pob.) 1,259 1,259 289
Muelang 464 464 100
Naguilayan East 503 503 125
Naguilayan West 653 653 138
Nancasalan 1,308 1,308 320
Niog-Cabison-Bulaney 1,086 1,086 243
Olegario-Caoile (Pob.) 410 410 108
Olo Cacamposan 1,525 1,525 373
Olo Cafabrosan 1,113 1,113 262
Olo Cagarlitan 1,046 1,046 256
Osmeña (Pob.) 878 878 195
Pacalat 917 917 222
Pampano 2,431 2,431 460
Parian 1,089 1,089 288
Paul 513 513 125
Pogon-Aniat 329 329 65
Pogon-Lomboy (Pob.) 779 779 171
Ponglo-Baleg 488 488 113
Ponglo-Muelag 520 520 131
Quetegan (Pogon-Baleg) 1,981 1,981 465
Quezon (Pob.) 148 148 34
Salavante 789 789 160
Sapang 803 803 168
Sonson Ongkit 887 887 192
Suaco 504 504 112
Tagac 937 937 218
Takipan 645 645 145
Talogtog 614 614 141
Tococ Barikir 433 433 104
78 Philippine Statistics Authority

2015 Census of Population Pangasinan
Province, City, Municipality, Total Household Number of
and Barangay Population Population Households
TABLE 2 Total Population, Household Population, and Number of Households by Province,
(total population includes institutional population)
City, Municipality, and Barangay as of August 1, 2015: Pangasinan
Torre 1st 560 560 127
Torre 2nd 1,038 1,038 211
Torres Bugallon (Pob.) 1,408 1,408 312
Umangan 1,957 1,943 433
Zamora (Pob.) 755 755 182
MAPANDAN 37,059 36,989 8,667
Amanoaoac 2,678 2,678 480
Apaya 1,362 1,362 300
Aserda 1,178 1,178 274
Baloling 3,835 3,835 1,105
Coral 1,374 1,374 283
Golden 1,425 1,425 347
Jimenez 1,831 1,831 371
Lambayan 1,616 1,616 337
Luyan (Luyan South) 3,225 3,168 712
Nilombot 4,215 4,215 1,218
Pias 4,619 4,619 979
Poblacion 3,714 3,701 1,007
Primicias 1,904 1,904 416
Santa Maria (Luyan North) 1,305 1,305 263
Torres 2,778 2,778 575
NATIVIDAD 24,299 24,269 5,794
Barangobong 792 792 201
Batchelor East 1,298 1,283 316
Batchelor West 1,168 1,162 268
Burgos (San Narciso) 943 943 232
Cacandungan 1,412 1,412 346
Calapugan 1,295 1,295 291
Canarem 1,139 1,137 279
Luna 1,488 1,488 337
Poblacion East 1,921 1,916 455
Poblacion West 1,760 1,758 440
Rizal 836 836 209
Salud 1,708 1,708 408
San Eugenio 1,601 1,601 398
San Macario Norte 1,154 1,154 252
San Macario Sur 1,135 1,135 280
Philippine Statistics Authority 79

Pangasinan 2015 Census of Population
Province, City, Municipality, Total Household Number of
and Barangay Population Population Households
TABLE 2 Total Population, Household Population, and Number of Households by Province,
(total population includes institutional population)
City, Municipality, and Barangay as of August 1, 2015: Pangasinan
San Maximo 1,569 1,569 348
San Miguel 2,343 2,343 563
Silag 737 737 171
POZORRUBIO 69,555 69,541 16,856
Alipangpang 5,634 5,634 1,453
Amagbagan 2,480 2,480 594
Balacag 806 806 196
Banding 996 996 260
Bantugan 1,046 1,046 290
Batakil 2,770 2,770 629
Bobonan 2,645 2,645 608
Buneg 1,914 1,914 520
Cablong 1,791 1,791 411
Castaño 1,010 1,010 256
Dilan 3,714 3,714 911
Don Benito 1,397 1,397 344
Haway 628 628 144
Imbalbalatong 2,200 2,200 536
Inoman 2,372 2,372 578
Laoac 1,207 1,207 311
Maambal 1,315 1,315 336
Malasin 2,021 2,021 496
Malokiat 1,136 1,136 271
Manaol 1,435 1,435 309
Nama 3,095 3,095 709
Nantangalan 1,742 1,742 459
Palacpalac 2,871 2,871 695
Palguyod 3,043 3,043 679
Poblacion I 2,578 2,578 520
Poblacion II 1,299 1,299 349
Poblacion III 1,510 1,496 331
Poblacion IV 1,621 1,621 359
Rosario 5,187 5,187 1,381
Sugcong 1,906 1,906 449
Talogtog 2,303 2,303 615
Tulnac 885 885 191
Villegas 1,861 1,861 405
Casanfernandoan 1,137 1,137 261
80 Philippine Statistics Authority

2015 Census of Population Pangasinan
Province, City, Municipality, Total Household Number of
and Barangay Population Population Households
TABLE 2 Total Population, Household Population, and Number of Households by Province,
(total population includes institutional population)
City, Municipality, and Barangay as of August 1, 2015: Pangasinan
ROSALES 63,081 62,941 14,576
Acop 2,015 2,015 481
Bakitbakit 854 854 211
Balingcanaway 2,004 2,004 488
Cabalaoangan Norte 1,840 1,840 450
Cabalaoangan Sur 2,255 2,255 524
Camangaan 1,154 1,154 290
Capitan Tomas 1,411 1,411 363
Carmay West 775 775 162
Carmen East 3,921 3,921 908
Carmen West 2,788 2,788 622
Casanicolasan 1,162 1,162 276
Coliling 1,965 1,965 450
Calanutan (Don Felix Coloma) 1,290 1,290 294
Guiling 3,246 3,246 746
Palakipak 1,880 1,880 421
Pangaoan 1,515 1,515 301
Rabago 2,185 2,185 536
Rizal 1,415 1,415 357
Salvacion 1,118 1,118 285
San Antonio 1,227 1,227 276
San Bartolome 1,452 1,452 372
San Isidro 1,406 1,406 315
San Luis 1,054 1,054 250
San Pedro East 1,785 1,785 433
San Pedro West 1,954 1,880 410
San Vicente 455 455 112
San Angel 932 932 218
Station District 3,207 3,207 723
Tomana East 1,367 1,367 295
Tomana West 3,118 3,118 743
Zone I (Pob.) 1,251 1,251 272
Zone IV (Pob.) 1,583 1,567 358
Carmay East 2,985 2,962 673
Don Antonio Village 889 889 173
Zone II (Pob.) 722 707 156
Zone III (Pob.) 908 908 211
Zone V (Pob.) 1,993 1,981 421
Philippine Statistics Authority 81

Pangasinan 2015 Census of Population
Province, City, Municipality, Total Household Number of
and Barangay Population Population Households
TABLE 2 Total Population, Household Population, and Number of Households by Province,
(total population includes institutional population)
City, Municipality, and Barangay as of August 1, 2015: Pangasinan
SAN CARLOS CITY 188,571 188,278 42,049
Abanon 1,877 1,877 385
Agdao 3,776 3,776 911
Anando 1,048 1,048 226
Ano 2,758 2,758 630
Antipangol 1,889 1,889 382
Aponit 2,128 2,128 465
Bacnar 5,145 5,145 1,101
Balaya 1,906 1,906 369
Balayong 1,883 1,883 390
Baldog 2,001 2,001 482
Balite Sur 3,346 3,346 810
Balococ 1,736 1,736 377
Bani 723 723 165
Bega 2,013 2,013 496
Bocboc 1,122 1,122 262
Bugallon-Posadas Street (Pob.) 513 513 166
Bogaoan 2,692 2,692 573
Bolingit 3,285 3,285 864
Bolosan 1,109 1,109 430
Bonifacio (Pob.) 618 618 137
Buenglat 1,552 1,552 459
Burgos Padlan (Pob.) 1,240 1,240 312
Cacaritan 2,220 2,220 493
Caingal 1,435 1,435 306
Calobaoan 3,608 3,608 716
Calomboyan 3,514 3,514 726
Capataan 2,221 2,221 446
Caoayan-Kiling 4,261 4,261 909
Cobol 3,640 3,640 851
Coliling 4,541 4,541 1,010
Cruz 2,027 2,027 406
Doyong 2,175 2,175 447
Gamata 2,161 2,161 455
Guelew 4,116 4,116 884
Ilang 1,226 1,226 262
Inerangan 1,504 1,504 295
Isla 2,520 2,520 541
Libas 4,030 4,030 855
82 Philippine Statistics Authority

2015 Census of Population Pangasinan
Province, City, Municipality, Total Household Number of
and Barangay Population Population Households
TABLE 2 Total Population, Household Population, and Number of Households by Province,
(total population includes institutional population)
City, Municipality, and Barangay as of August 1, 2015: Pangasinan
Lilimasan 2,488 2,488 574
Longos 1,205 1,205 252
Lucban (Pob.) 1,070 1,070 243
Mabalbalino 1,173 1,173 372
Mabini (Pob.) 678 678 179
Magtaking 2,926 2,926 653
Malacañang 3,882 3,882 760
Maliwara 822 822 213
Mamarlao 2,679 2,679 549
Manzon 1,779 1,779 395
Matagdem 3,216 3,216 665
Mestizo Norte 1,592 1,592 391
Naguilayan 1,626 1,626 309
Nilentap 1,417 1,417 281
Padilla-Gomez 2,096 2,061 414
Pagal 4,121 4,039 910
Palaming 2,823 2,823 561
Palaris (Pob.) 616 616 162
Palospos 1,480 1,480 270
Pangalangan 3,112 3,112 644
Pangoloan 1,523 1,523 296
Pangpang 3,140 3,140 631
Paitan-Panoypoy 1,656 1,656 416
Parayao 934 934 177
Payapa 1,295 1,295 280
Payar 1,667 1,667 353
Perez Boulevard (Pob.) 694 694 166
Polo 1,654 1,654 356
Quezon Boulevard (Pob.) 1,599 1,538 341
Quintong 3,709 3,709 881
Rizal (Pob.) 2,579 2,579 581
Roxas Boulevard (Pob.) 1,503 1,503 322
Salinap 2,471 2,471 611
San Juan 2,900 2,900 710
San Pedro-Taloy 2,551 2,454 612
Sapinit 1,360 1,360 298
PNR Station Site 890 883 217
Supo 1,480 1,480 303
Talang 1,611 1,611 368
Philippine Statistics Authority 83

Pangasinan 2015 Census of Population
Province, City, Municipality, Total Household Number of
and Barangay Population Population Households
TABLE 2 Total Population, Household Population, and Number of Households by Province,
(total population includes institutional population)
City, Municipality, and Barangay as of August 1, 2015: Pangasinan
Tamayo 3,059 3,059 635
Tandoc 3,758 3,758 929
Tarece 4,666 4,655 1,048
Tarectec 1,525 1,525 336
Tayambani 1,540 1,540 324
Tebag 1,228 1,228 320
Turac 5,702 5,702 1,350
M. Soriano 932 932 239
Tandang Sora 585 585 158
SAN FABIAN 83,025 82,960 19,886
Ambalangan-Dalin 2,190 2,190 522
Angio 3,227 3,227 733
Anonang 4,520 4,520 1,032
Aramal 3,274 3,274 773
Bigbiga 1,154 1,154 244
Binday 2,254 2,254 505
Bolaoen 1,159 1,159 259
Bolasi 2,983 2,983 737
Cayanga 4,586 4,586 1,054
Gomot 770 770 209
Inmalog 1,552 1,552 370
Lekep-Butao 2,796 2,796 642
Longos 2,818 2,818 710
Mabilao 2,713 2,713 652
Nibaliw Central 979 979 205
Nibaliw East 2,464 2,464 584
Nibaliw Magliba 1,993 1,982 526
Palapad 1,818 1,796 408
Poblacion 4,002 4,002 972
Rabon 2,351 2,346 579
Sagud-Bahley 4,125 4,125 1,022
Sobol 2,479 2,479 621
Tempra-Guilig 3,886 3,886 863
Tocok 3,446 3,446 800
Lipit-Tomeeng 2,104 2,104 588
Colisao 842 842 203
Nibaliw Narvarte (Nibaliw West Compound) 2,422 2,422 597
Nibaliw Vidal (Nibaliw West Proper) 3,405 3,405 956
84 Philippine Statistics Authority

2015 Census of Population Pangasinan
Province, City, Municipality, Total Household Number of
and Barangay Population Population Households
TABLE 2 Total Population, Household Population, and Number of Households by Province,
(total population includes institutional population)
City, Municipality, and Barangay as of August 1, 2015: Pangasinan
Alacan 1,812 1,812 464
Cabaruan 1,461 1,461 359
Inmalog Norte 1,469 1,469 304
Longos-Amangonan-Parac-Parac Fabrica 2,602 2,602 561
Longos Proper 2,233 2,233 518
Tiblong 1,136 1,109 314
SAN JACINTO 40,848 40,848 9,211
Awai 1,136 1,136 257
Bolo 1,626 1,626 402
Capaoay (Pob.) 2,556 2,556 562
Casibong 2,567 2,567 552
Imelda (Decrito) 1,321 1,321 276
Guibel 2,156 2,156 447
Labney 2,199 2,199 504
Magsaysay (Capay) 1,059 1,059 231
Lobong 4,798 4,798 1,125
Macayug 3,149 3,149 711
Bagong Pag-asa (Poblacion East) 1,312 1,312 278
San Guillermo (Poblacion West) 920 920 225
San Jose 2,812 2,812 600
San Juan 1,819 1,819 403
San Roque 1,792 1,792 398
San Vicente 4,027 4,027 1,001
Santa Cruz 551 551 143
Santa Maria 2,690 2,690 626
Santo Tomas 2,358 2,358 470
SAN MANUEL 52,939 52,888 12,552
San Antonio-Arzadon 2,599 2,599 580
Cabacaraan 1,983 1,983 475
Cabaritan 2,531 2,531 531
Flores 6,499 6,499 1,709
Guiset Norte (Pob.) 4,973 4,964 1,269
Guiset Sur (Pob.) 5,039 5,039 1,025
Lapalo 1,544 1,544 354
Nagsaag 2,885 2,885 603
Narra 3,453 3,453 874
San Bonifacio 3,523 3,523 819
Philippine Statistics Authority 85

Pangasinan 2015 Census of Population
Province, City, Municipality, Total Household Number of
and Barangay Population Population Households
TABLE 2 Total Population, Household Population, and Number of Households by Province,
(total population includes institutional population)
City, Municipality, and Barangay as of August 1, 2015: Pangasinan
San Juan 2,901 2,901 651
San Roque 5,714 5,672 1,407
San Vicente 3,672 3,672 912
Santo Domingo 5,623 5,623 1,343
SAN NICOLAS 35,574 35,547 8,277
Bensican 705 705 155
Cabitnongan 1,285 1,285 284
Caboloan 879 879 204
Cacabugaoan 1,348 1,338 309
Calanutian 539 539 121
Calaocan 1,239 1,239 290
Camanggaan 535 535 135
Camindoroan 524 524 121
Casaratan 1,133 1,133 264
Dalumpinas 1,433 1,433 361
Fianza 860 860 177
Lungao 630 630 159
Malico 254 254 73
Malilion 1,103 1,103 274
Nagkaysa 986 986 221
Nining 429 429 101
Poblacion East 2,712 2,695 642
Poblacion West 601 601 138
Salingcob 782 782 199
Salpad 556 556 127
San Felipe East 2,640 2,640 599
San Felipe West 1,019 1,019 235
San Isidro (Sta. Cruzan) 799 799 191
San Jose 1,130 1,130 244
San Rafael Centro 842 842 196
San Rafael East 811 811 210
San Rafael West 1,510 1,510 331
San Roque 2,775 2,775 615
Santa Maria East 1,823 1,823 408
Santa Maria West 1,241 1,241 306
Santo Tomas 547 547 146
Siblot 1,288 1,288 301
Sobol 616 616 140
86 Philippine Statistics Authority

2015 Census of Population Pangasinan
Province, City, Municipality, Total Household Number of
and Barangay Population Population Households
TABLE 2 Total Population, Household Population, and Number of Households by Province,
(total population includes institutional population)
City, Municipality, and Barangay as of August 1, 2015: Pangasinan
SAN QUINTIN 32,945 32,927 8,584
Alac 3,650 3,650 1,003
Baligayan 998 998 257
Bantog 1,177 1,177 282
Bolintaguen 1,703 1,703 455
Cabangaran 1,535 1,523 428
Cabalaoangan 3,074 3,074 842
Calomboyan 1,983 1,983 517
Carayacan 1,784 1,784 499
Casantamarian 1,931 1,925 486
Gonzalo 1,884 1,884 512
Labuan 673 673 159
Lagasit 3,547 3,547 942
Lumayao 1,193 1,193 299
Mabini 895 895 202
Mantacdang 1,082 1,082 280
Nangapugan 1,854 1,854 443
San Pedro 1,449 1,449 356
Ungib 1,118 1,118 302
Poblacion Zone I 586 586 134
Poblacion Zone II 483 483 100
Poblacion Zone III 346 346 86
SANTA BARBARA 82,012 81,928 18,636
Alibago 1,373 1,373 293
Balingueo 3,545 3,498 775
Banaoang 4,638 4,638 1,083
Banzal 1,504 1,504 359
Botao 3,327 3,327 751
Cablong 2,481 2,481 544
Carusocan 1,766 1,765 389
Dalongue 1,980 1,980 419
Erfe 689 689 166
Gueguesangen 1,687 1,687 391
Leet 4,258 4,258 969
Malanay 2,559 2,559 589
Maningding 4,606 4,606 1,037
Maronong 3,303 3,303 690
Maticmatic 4,575 4,563 1,061
Philippine Statistics Authority 87

Pangasinan 2015 Census of Population
Province, City, Municipality, Total Household Number of
and Barangay Population Population Households
TABLE 2 Total Population, Household Population, and Number of Households by Province,
(total population includes institutional population)
City, Municipality, and Barangay as of August 1, 2015: Pangasinan
Minien East 3,068 3,068 802
Minien West 4,750 4,750 1,294
Nilombot 2,298 2,298 513
Patayac 2,751 2,751 594
Payas 3,610 3,610 756
Poblacion Norte 1,713 1,713 373
Poblacion Sur 1,905 1,901 439
Sapang 2,252 2,252 370
Sonquil 3,000 3,000 676
Tebag East 547 536 145
Tebag West 2,452 2,452 617
Tuliao 6,053 6,053 1,367
Ventinilla (Ventinilla East) 3,383 3,374 754
Primicias (Ventinilla West) 1,939 1,939 420
SANTA MARIA 33,038 33,001 7,491
Bal-loy 641 641 154
Bantog 1,193 1,193 279
Caboluan 743 743 152
Cal-litang 2,281 2,281 517
Capandanan 996 996 224
Cauplasan 927 925 226
Dalayap 1,187 1,187 282
Libsong 1,055 1,055 241
Namagbagan 2,054 2,048 488
Paitan 2,083 2,083 476
Pataquid 883 883 187
Pilar 1,851 1,851 393
Poblacion East 1,051 1,049 226
Poblacion West 1,197 1,197 262
Pugot 264 264 63
Samon 2,430 2,430 551
San Alejandro 2,079 2,079 465
San Mariano 878 878 204
San Pablo 1,343 1,343 324
San Patricio 1,088 1,088 248
San Vicente 3,755 3,728 840
Santa Cruz 967 967 241
Santa Rosa 2,092 2,092 448
88 Philippine Statistics Authority

2015 Census of Population Pangasinan
Province, City, Municipality, Total Household Number of
and Barangay Population Population Households
TABLE 2 Total Population, Household Population, and Number of Households by Province,
(total population includes institutional population)
City, Municipality, and Barangay as of August 1, 2015: Pangasinan
SANTO TOMAS 15,022 15,022 3,374
La Luna 914 914 211
Poblacion East 1,119 1,119 242
Poblacion West 606 606 127
Salvacion 1,537 1,537 327
San Agustin 1,618 1,618 349
San Antonio 4,249 4,249 950
San Jose 1,334 1,334 319
San Marcos 975 975 211
Santo Domingo 1,496 1,496 361
Santo Niño 1,174 1,174 277
SISON 47,518 47,280 10,659
Agat 1,310 1,310 315
Alibeng 1,422 1,422 325
Amagbagan 751 751 148
Artacho 1,305 1,135 279
Asan Norte 2,425 2,417 530
Asan Sur 2,826 2,826 639
Bantay Insik 1,416 1,416 333
Bila 1,686 1,685 418
Binmeckeg 1,734 1,734 394
Bulaoen East 1,031 1,031 234
Bulaoen West 1,046 1,046 215
Cabaritan 1,619 1,619 356
Calunetan 817 817 189
Camangaan 1,185 1,185 234
Cauringan 1,649 1,649 329
Dungon 1,588 1,588 346
Esperanza 1,891 1,891 452
Killo 1,764 1,746 395
Labayug 2,859 2,819 702
Paldit 4,078 4,077 986
Pindangan 1,562 1,562 300
Pinmilapil 1,867 1,867 391
Poblacion Central 1,596 1,596 352
Poblacion Norte 1,984 1,984 421
Poblacion Sur 1,137 1,137 255
Sagunto 2,064 2,064 436
Philippine Statistics Authority 89

Pangasinan 2015 Census of Population
Province, City, Municipality, Total Household Number of
and Barangay Population Population Households
TABLE 2 Total Population, Household Population, and Number of Households by Province,
(total population includes institutional population)
City, Municipality, and Barangay as of August 1, 2015: Pangasinan
Inmalog 1,673 1,673 391
Tara-tara 1,233 1,233 294
SUAL 34,149 34,124 7,859
Baquioen 2,837 2,822 647
Baybay Norte 1,339 1,339 331
Baybay Sur 1,506 1,506 359
Bolaoen 903 903 217
Cabalitian 993 993 220
Calumbuyan 626 626 154
Camagsingalan 1,751 1,751 416
Caoayan 2,575 2,575 588
Capantolan 1,712 1,712 376
Macaycayawan 654 654 154
Paitan East 1,101 1,101 275
Paitan West 1,971 1,971 454
Pangascasan 3,172 3,162 761
Poblacion 7,312 7,312 1,630
Santo Domingo 772 772 194
Seselangen 1,900 1,900 431
Sioasio East 1,082 1,082 252
Sioasio West 657 657 142
Victoria 1,286 1,286 258
TAYUG 43,149 42,967 10,039
Agno 2,080 2,080 481
Amistad 2,331 2,331 555
Barangobong 1,857 1,821 450
Carriedo 2,421 2,421 539
C. Lichauco 1,196 1,191 283
Evangelista 1,840 1,840 443
Guzon 542 542 140
Lawak 2,167 2,167 523
Legaspi 3,558 3,558 821
Libertad 2,542 2,542 568
Magallanes 2,948 2,948 726
Panganiban 2,909 2,909 637
Barangay A (Pob.) 2,495 2,495 554
Barangay B (Pob.) 1,400 1,400 346
90 Philippine Statistics Authority

2015 Census of Population Pangasinan
Province, City, Municipality, Total Household Number of
and Barangay Population Population Households
TABLE 2 Total Population, Household Population, and Number of Households by Province,
(total population includes institutional population)
City, Municipality, and Barangay as of August 1, 2015: Pangasinan
Barangay C (Pob.) 1,802 1,663 405
Barangay D (Pob.) 1,618 1,618 345
Saleng 666 666 156
Santo Domingo 1,622 1,622 408
Toketec 1,964 1,962 455
Trenchera 4,107 4,107 964
Zamora 1,084 1,084 240
UMINGAN 73,252 73,175 17,261
Abot Molina 1,756 1,756 440
Alo-o 1,225 1,225 273
Amaronan 1,938 1,938 448
Annam 724 706 167
Bantug 2,032 2,032 517
Baracbac 913 901 213
Barat 2,440 2,440 546
Buenavista 656 656 158
Cabalitian 868 868 210
Cabaruan 1,096 1,096 301
Cabatuan 1,398 1,398 330
Cadiz 940 940 215
Calitlitan 930 930 215
Capas 1,208 1,200 300
Carosalesan 1,257 1,257 278
Casilan 607 607 159
Caurdanetaan 2,085 2,085 469
Concepcion 883 883 198
Decreto 624 624 148
Diaz 1,462 1,462 353
Diket 1,231 1,231 263
Don Justo Abalos (Caroan) 1,138 1,138 256
Don Montano 2,403 2,403 576
Esperanza 1,027 1,027 252
Evangelista 599 599 149
Flores 1,979 1,979 467
Fulgosino 797 797 203
Gonzales 1,846 1,846 423
La Paz 2,263 2,263 567
Labuan 543 543 132
Philippine Statistics Authority 91

Pangasinan 2015 Census of Population
Province, City, Municipality, Total Household Number of
and Barangay Population Population Households
TABLE 2 Total Population, Household Population, and Number of Households by Province,
(total population includes institutional population)
City, Municipality, and Barangay as of August 1, 2015: Pangasinan
Lauren 1,217 1,217 317
Lubong 1,289 1,289 293
Luna Weste 836 836 199
Luna Este 952 952 222
Mantacdang 699 699 153
Maseil-seil 2,090 2,090 477
Nampalcan 1,254 1,254 294
Nancalabasaan 2,616 2,616 608
Pangangaan 888 888 204
Papallasen 1,242 1,242 318
Pemienta 2,016 2,016 451
Poblacion East 1,545 1,545 381
Poblacion West 2,570 2,567 534
Prado 1,112 1,112 264
Resurreccion 801 801 172
Ricos 1,014 990 218
San Andres 875 875 172
San Juan 1,172 1,172 286
San Leon 2,288 2,288 517
San Pablo 446 446 112
San Vicente 1,026 1,014 258
Santa Maria 1,674 1,674 423
Santa Rosa 832 832 195
Sinabaan 1,124 1,124 282
Tanggal Sawang 392 392 102
Cabangaran 1,036 1,036 237
Carayungan Sur 997 997 253
Del Rosario 381 381 93
URBIZTONDO 50,170 50,150 10,618
Angatel 2,771 2,771 625
Balangay 1,397 1,397 315
Batangcaoa 1,722 1,722 370
Baug 1,626 1,626 341
Bayaoas 3,864 3,864 795
Bituag 2,106 2,106 424
Camambugan 1,355 1,355 297
Dalangiring 5,995 5,995 1,293
Duplac 1,126 1,126 244
92 Philippine Statistics Authority

2015 Census of Population Pangasinan
Province, City, Municipality, Total Household Number of
and Barangay Population Population Households
TABLE 2 Total Population, Household Population, and Number of Households by Province,
(total population includes institutional population)
City, Municipality, and Barangay as of August 1, 2015: Pangasinan
Galarin 2,080 2,080 458
Gueteb 1,774 1,774 345
Malaca 1,346 1,346 284
Malayo 1,822 1,822 402
Malibong 2,876 2,876 585
Pasibi East 2,440 2,430 506
Pasibi West 1,159 1,159 248
Pisuac 3,025 3,025 600
Poblacion 5,106 5,096 1,093
Real 2,727 2,727 575
Salavante 1,028 1,028 224
Sawat 2,825 2,825 594
CITY OF URDANETA 132,940 132,039 30,294
Anonas 5,595 4,973 1,174
Bactad East 2,104 2,104 527
Dr. Pedro T. Orata (Bactad Proper) 1,960 1,960 466
Bayaoas 5,653 5,578 1,270
Bolaoen 1,565 1,565 340
Cabaruan 2,281 2,279 518
Cabuloan 2,830 2,830 662
Camanang 4,484 4,460 1,010
Camantiles 6,123 6,123 1,260
Casantaan 1,559 1,559 362
Catablan 5,576 5,576 1,235
Cayambanan 4,008 3,998 1,063
Consolacion 1,585 1,585 364
Dilan Paurido 6,185 6,185 1,369
Labit Proper 3,417 3,410 765
Labit West 2,443 2,443 539
Mabanogbog 3,349 3,349 774
Macalong 1,515 1,515 347
Nancalobasaan 3,226 3,226 707
Nancamaliran East 4,882 4,870 1,080
Nancamaliran West 5,383 5,364 1,214
Nancayasan 6,944 6,902 1,598
Oltama 1,393 1,393 301
Palina East 4,510 4,510 1,112
Palina West 2,965 2,965 671
Philippine Statistics Authority 93

Pangasinan 2015 Census of Population
Province, City, Municipality, Total Household Number of
and Barangay Population Population Households
TABLE 2 Total Population, Household Population, and Number of Households by Province,
(total population includes institutional population)
City, Municipality, and Barangay as of August 1, 2015: Pangasinan
Pinmaludpod 7,213 7,197 1,658
Poblacion 7,665 7,637 1,842
San Jose 5,677 5,676 1,291
San Vicente 10,572 10,541 2,383
Santa Lucia 2,840 2,840 648
Santo Domingo 3,241 3,241 779
Sugcong 960 960 195
Tipuso 1,911 1,911 451
Tulong 1,326 1,314 319
VILLASIS 62,333 62,304 14,631
Amamperez 4,876 4,876 1,144
Bacag 5,914 5,914 1,321
Barangobong 3,752 3,752 913
Barraca 2,022 2,022 457
Capulaan 3,478 3,478 859
Caramutan 3,588 3,574 880
La Paz 1,057 1,057 237
Labit 1,284 1,284 316
Lipay 3,694 3,694 809
Lomboy 1,669 1,669 379
Piaz (Plaza) 5,241 5,241 1,202
Zone V (Pob.) 784 784 198
Zone I (Pob.) 1,679 1,664 409
Zone II (Pob.) 2,454 2,454 583
Zone III (Pob.) 1,141 1,141 292
Zone IV (Pob.) 1,136 1,136 288
Puelay 7,319 7,319 1,710
San Blas 3,094 3,094 670
San Nicolas 2,166 2,166 515
Tombod 2,322 2,322 573
Unzad 3,663 3,663 876
LAOAC 31,497 31,482 7,429
Anis 1,667 1,667 422
Botique 839 839 215
Caaringayan 1,275 1,275 297
Domingo Alarcio (Cabilaoan East) 1,361 1,361 309
Cabilaoan West 1,823 1,823 404
94 Philippine Statistics Authority

2015 Census of Population Pangasinan
Province, City, Municipality, Total Household Number of
and Barangay Population Population Households
TABLE 2 Total Population, Household Population, and Number of Households by Province,
(total population includes institutional population)
City, Municipality, and Barangay as of August 1, 2015: Pangasinan
Cabulalaan 1,181 1,181 271
Calaoagan 1,163 1,163 297
Calmay 1,790 1,790 454
Casampagaan 938 938 214
Casanestebanan 729 729 178
Casantiagoan 1,575 1,575 365
Inmanduyan 1,604 1,604 402
Poblacion (Laoac) 2,025 2,010 464
Lebueg 2,189 2,189 485
Maraboc 1,260 1,260 272
Nanbagatan 1,372 1,372 312
Panaga 1,455 1,455 344
Talogtog 1,080 1,080 302
Turko 1,117 1,117 254
Yatyat 1,711 1,711 399
Balligi 1,163 1,163 298
Banuar 2,180 2,180 471
Source:
Philippine Statistics Authority, 2015 Census of Population
Philippine Statistics Authority 95


Appendices


Philippine Statistics Authority A - 1
APPENDIX A
EXCERPTS FROM REPUBLIC ACT NO. 10625
RELEVANT TO THE CONDUCT OF THE 2015 CENSUS OF POPULATION
REPUBLIC ACT NO. 10625
AN ACT REORGANIZING THE PHILIPPINE STATISTICAL SYSTEM, REPEALING
FOR THE PURPOSE EXECUTIVE ORDER NUMBERED ONE HUNDRED TWENTY-
ONE, ENTITLED “REORGANIZING AND STRENGTHENING THE PHILIPPINE
STATISTICAL SYSTEM AND FOR OTHER PURPOSES”
SECTION 6. Functions of the PSA. – The PSA shall have the following functions:
(b) Prepare and conduct periodic censuses on population, housing, agriculture, fisheries, business, industry and other sectors of the economy;
SECTION 25. Obligation to Provide Information. – The National Statistician shall determine whether a statistical inquiry or survey to be conducted is with or without obligation to provide information. If such obligation is stipulated, all respondents whether natural or legal persons shall be liable to reply to the statistical inquiry or survey. This section applies to all statistical inquiries or surveys conducted by other statistical offices in the Philippine Statistical System (PSS).
The respondents under this Act are required to give truthful and complete answers to statistical inquiries or surveys of the PSA and other statistical offices of the PSS. The respondent is considered to have complied with the obligation only upon receipt of the duly completed statistical inquiry or survey forms. The government shall provide franking privileges, charges and postings to the survey offices, unless otherwise disallowed by law.
SECTION 26. Confidentiality of Information. – Individual data furnished by a respondent to statistical inquiries, surveys and censuses of the PSA shall be considered privileged communication and as such shall be inadmissible as evidence in any proceeding.
The PSA may release aggregated information from statistical inquiries, surveys and censuses in the form of summaries or statistical tables in which no reference to an individual, corporation, association, partnership, institution or business enterprise shall appear.
The National Statistician and all staff of the PSA shall take a solemn oath regarding confidentiality of information.

Appendix A – Republic Act No. 10625 2015 Census of Population
Philippine Statistics Authority A - 2
SECTION 27. Penalties. – Respondents of primary data collection activities such as censuses and sample surveys are obliged to give truthful and complete answers to statistical inquiries. The gathering, consolidation and analysis of such data shall likewise be done in the most truthful and credible manner.
To ensure compliance, any violation of this Act shall result in the imposition of the penalty of one (1) year imprisonment and a fine of One hundred thousand pesos (P100,000.00). In cases where the respondent who fails to give a truthful and complete answer to such statistical inquiries is a corporation, the above penalty shall be imposed against the responsible officer, director, manager and/or agent of said corporation.
Approved, (SGD) JINGGOY EJERCITO ESTRADA (SGD) FELICIANO BELMONTE JR. Acting Senate President Speaker of the House of Representatives
This Act which originated in the House of Representatives was finally passed by the House of Representatives and the Senate on June 6, 2013. (SGD) EMMA LIRIO-REYES (SGD) MARILYN B. BARUA-YAP Secretary of the Senate Secretary General House of Representatives
APPROVED: September 12, 2013
(SGD) BENIGNO S. AQUINO III President of the Philippines

Philippine Statistics Authority B - 1
APPENDIX B
Executive Order No. 352
Designation of Statistical Activities That Will Generate Critical Data for Decision-Making
of the Government and the Private Sector WHEREAS, Executive Order No. 121, which was issued in January 1987, created the National Statistical Coordination Board (NSCB) as the policy-making and coordinating body of the decentralized Philippine Statistical System; WHEREAS, the NSCB, now an agency attached to the National Economic and Development Authority (NEDA), has established a system of designated statistics in accordance with its mandate, that enables the identification and generation of the most critical and essential statistics required for social and economic planning/analysis based on approved criteria; WHEREAS, the generation of said data requires the conduct of nationwide censuses and surveys and the maintenance/processing of administrative-based records on a regular basis to allow for monitoring, time series analysis and forecasting by policy-makers; WHEREAS, the quality of these designated statistics needs to be continuously improved to address the needs of data users; WHEREAS, the system of designated statistics is a dynamic process that allows for updating to keep attuned to the emerging demands of data users; NOW, THEREFORE, I, FIDEL V. RAMOS, President of the Philippines, by virtue of the powers vested in me by law, do hereby order: SECTION 1. The activities and statistics that have been designated by the NSCB as per ANNEX of this Executive Order shall be adopted by the government as the means of generating the critical and essential data for administrators, planners and policy-makers in the government and private sectors. SECTION 2. The implementing agencies shall provide the Office of the President thru the NSCB results of said censuses, surveys and administrative-based reports on a regular basis and ensure the dissemination of the data to the general public in accordance with the designated time frame.

Appendix B – Executive Order No. 352 2015 Census of Population
Philippine Statistics Authority B - 2
SECTION 3. The implementing agencies shall be responsible in carrying out the improvements in the design and methodology of said activities in coordination with the NSCB. SECTION 4. Any modification, addition or deletion from the above list shall be approved through a Board Resolution by the NSCB in accordance with its implementing guidelines. The NSCB is authorized to issue implementing guidelines consistent with the provisions of this Executive Order. It shall also be responsible in monitoring the system's implementation to attain the objectives of this Executive Order. SECTION 5. The NSCB shall regularly conduct adequate consultations with the data users and producers as a means of updating the lists of designated statistics to be responsive to the emerging needs of data users. SECTION 6. The amounts necessary to carry out the provisions of this Executive Order shall be provided for in the General Appropriations Act (GAA) in the year following its approval and thereafter. However, any immediate requirement to implement this Executive Order shall be taken from any available appropriations in the CY l994 GAA, subject to the usual budgetary rules and regulations. SECTION 7. This Executive Order shall take effect immediately. Done in the City of Manila, this 1st day of July in the year of our Lord, nineteen hundred and ninety six. (Signed) FIDEL V. RAMOS President of the Philippines
Excerpt of ANNEX (List of Designated Statistical Activities) of Executive Order 352
For Mid-Decade Census of Population:
Activity Agency Frequency of Conduct
Geographic Disaggregation
Schedule of Data Dissemination
With ARC
Mid-Decade Census of Population
NSO
every 10 years
national, regional, provincial, city, municipal, barangay, urban-rural
Before the end of every census year for population figures from national down to barangay levels; 18 months after the reference year for other statistics
Note: NSO was merged with three other statistical agencies: NSCB, BAS, and BLES

Philippine Statistics Authority C - 1
APPENDIX C
Presidential Proclamation No. 1031
Declaring August 2015 as National Census Month

Philippine Statistics Authority D - 1
APPENDIX D
TRAININGS AND FIELDWORK FOR THE CONDUCT OF THE POPCEN 2015
The 2015 Census of Population (POPCEN 2015) is designed primarily to take an inventory of the population in the Philippines and collect information about their characteristics. All information about the population and living quarters were collected as of 12:01 AM of 1 August 2015, the census reference date and time.
The Philippine Statistics Authority (PSA) is the agency mandated by law to conduct the
POPCEN 2015. Republic Act (RA) No. 10625 and Executive Order (EO) No. 352 are the legal bases for the conduct of this census. RA No. 10625 mandates the PSA to conduct national censuses and surveys, while EO No. 352 requires the conduct of a mid-decade census. Section 25 of RA No. 10625 provides that all respondents are obliged to give truthful and complete answers during the censuses and surveys conducted by the PSA while Section 26 stipulates the confidentiality of information provided by respondents to the PSA in censuses and surveys.
The census-taking was conducted from 10 August to 6 September 2015. The
enumeration lasted for approximately 25 working days, except in highly urbanized cities such as the cities in the National Capital Region, and in large provinces in Region IV-A – CALABARZON and Region III – Central Luzon, where the enumeration period was extended beyond 25 days. About 90 thousand individuals were employed as census enumerators (ENs), 23 thousand as team supervisors (TSs), and five thousand as census area supervisors (CASs). They were hired to augment and support the permanent personnel of the PSA during the census enumeration.
An EN was assigned to enumerate one enumeration area (EA), which had about 400
households. To ensure quality data collection during the census enumeration, a ratio of one TS for every four ENs and one CAS for every five TSs was implemented, in general.
To prepare the hired census personnel for enumeration work, four levels of training were
conducted. The first level or the task force training for enumeration was conducted within Metro Manila on 29 June to 4 July 2015. The said training was participated in by selected personnel of the PSA central, regional, and provincial offices, who, in turn acted as trainers in the succeeding levels of training. The second level training was conducted within the region for selected PSA provincial and regional office staff who, in turn, served as trainers in the third and fourth level training. The third level training, which was conducted within the province was participated in by selected provincial office personnel and pre-selected hired CASs. The ENs and TSs were trained during the fourth level training, which was conducted within the city and municipality with available training center. A standard training program covering the concepts, definitions, procedures, as well as duties and responsibilities of ENs and supervisors was used.
Census-taking involved going around the whole enumeration area to do the required
census procedures, as follows: 1. Courtesy Call. As a matter of protocol, the census personnel made a courtesy call to
the Punong Barangay. The ENs informed the official that the census would be undertaken in the barangay and that they would go around the entire area to ask questions from the residents.

Appendix D – Trainings And Fieldwork 2015 Census of Population
Philippine Statistics Authority D - 2
2. Mapping and Canvassing. The ENs went around the entire EA to familiarize themselves with the place, checked the barangay or EA boundaries and landmarks, and reflected these on the barangay/EA map.
3. Listing. The ENs listed buildings with living quarters, housing units, households and number of household members, and institutional living quarters (ILQs) and number of persons staying in ILQs in CP Form 1 or the Listing Booklet. Structures which were occupied or used as living quarters by households, even though these were not intended for human habitation were also listed. During the listing, the names of the household heads and their addresses, and the names and addresses of ILQs were recorded.
4. Interview and Recording of Answers. For every household or ILQ listed, the ENs
administered a questionnaire, that is, CP Form 2 for a household or CP Form 4 for an ILQ. The Punong Barangay or any barangay official was also interviewed by the ENs or their TS using CP Form 5 (Barangay Questionnaire).
5. Plotting. The ENs plotted the building with its assigned serial number on the EA
map. Standard cartographic symbols were used in plotting the buildings of the households and ILQs.
6. Posting of sticker. The ENs posted a sticker or CP Form 6 (Notice of Listing/
Enumeration) on the door, gate or any conspicuous part of the housing unit or ILQ, to indicate that the household or ILQ has been listed and/or interviewed.
In addition to the count of the household population and institutional population,
information about selected demographic and socio-economic characteristics of the population were collected using the census questionnaires. These questionnaires were reviewed for completeness and consistency of entries at various phases of the census operations. During data collection, the census supervisors scrutinized questionnaires for completeness and consistency of entries.
Progress monitoring reports were utilized to track the progress of census and field
operations and evaluate the completeness of census coverage in each barangay/EA while the enumeration was still ongoing. The provincial, regional, and central offices of the PSA monitored the progress of enumeration through the Progress Monitoring System (PMS). The PMS generated reports on the number of households, ILQs, and persons enumerated based on the information sent by the area supervisors through short messaging system (SMS) or text messaging.
Review of accomplished questionnaires for completeness and consistency of entries was
also carried out at the census headquarters or other designated areas where the census teams met weekly and at the Provincial Statistical Office (PO) during manual processing. Machine processing included scanning and interpretation, key-from-image (KFI) data entry, electronic coding, verification of codes, key-verification of batchfiles, validation of geographic and household identification, completeness and consistency checking, and tabulation of marginal and consistency tables. Data files and images were transmitted from the Data Processing Centers (DPCs) to the Central Office (CO) for the generation of census counts. Population counts by province, city, municipality, and barangay, as determined from the processed census questionnaires are considered official for all purposes once they are proclaimed by the President of the Philippines.

2015 Census of Population Appendix D – Trainings And Fieldwork
Philippine Statistics Authority D - 3
The POPCEN 2015 adopted the following technologies to make the census operations efficient:
1. GPS technology for mapping. For this census round, GPS (Global Positioning
System) technology was used for mapping selected barangays in all regions. This activity provided the ENs with more accurate maps with exact boundary information. The use of GPS technology will be continued by the PSA as part of its rolling program for mapping activities.
2. SMS technology for progress monitoring. The PSA made use of the SMS technology in monitoring the progress of census enumeration nationwide. Started in the 2007 census, the enhanced version of the PMS was adopted for this census round. The Philippines is the first country in Asia and the Pacific to use the SMS technology in progress monitoring.
3. OMR technology for data processing. The use of Optical Mark Reader (OMR)
technology in the Philippine census started in the 2000 Census of Population and Housing (2000 CPH). The Philippines is among the first few countries to have successfully used this technology. The use of OMR shortened the data entry phase because only selected items with codes corresponding to write-in entries were encoded. Data encoding using KFI was done instead of keying from the questionnaires.
4. CAFES for supervisors. The Computer-Aided Field Editing System (CAFES), a module of the Computer-Aided Data Collection System (CADaCS), is a data entry program installed in the tablet, which enabled the CASs to encode entries from accomplished household questionnaires during supervision. The CAFES, thereby, enabled the Head CASs to detect errors or inconsistencies in the accomplished questionnaires during field editing.
5. MIS for quick monitoring of selected POPCEN 2015 activities. The Management Information System (MIS) is a web-based application system that served as a sound board for both the PSA CO and Field Office (FO) staff. It facilitated the monitoring of status of delivery of census questionnaires and supplies, reporting of accidents, injuries, and deaths, among others.
6. Satellite images for validating census coverage. The CO downloaded satellite
images and identified structures (buildings) in selected cities and municipalities. Counts of households were estimated based on the said structures. These estimates were used to validate the completeness of census coverage in many areas.
The PSA implemented various strategies to enumerate areas which were hard to reach,
remote, upland or mountainous, under military control or with peace and order problem, Chinese communities or exclusive villages with low response rate for reasons of security or other concerns, and areas with boundary disputes. These strategies included the recruitment of ENs who were from the area; coordination with various government agencies and local government units for mobility; coordination with local officials; and coordination with homeowners’ associations in exclusive villages, high-rise condominiums, and in communities inhabited by many foreign nationals and indigenous peoples.

Philippine Statistics Authority E - 1
APPENDIX E
EVALUATION OF POPULATION COUNTS FROM THE POPCEN 2015
Progress monitoring reports were utilized to track the progress of census field operations and evaluate the completeness of census coverage in every barangay/enumeration area (EA). The provincial, regional, and central offices of the Philippine Statistics Authority (PSA) monitored the progress of census enumeration through the Progress Monitoring System (PMS). Information on a completely enumerated area was sent to the Central Office (CO) through Short Messaging Service (SMS) using information from CP Form 1 (Listing Booklet). The Field Offices (FOs) and CO monitored the progress of enumeration through the use of PM reports generated from the PMS.
Evaluation of Population Counts at the PSA Field Offices The Regional Statistical Services Office (RSSO) was responsible for the evaluation of the
2015 Census of Population (POPCEN 2015) counts for the provinces in the region while the Provincial Statistical Office (PO) was responsible for the evaluation of population counts in the cities and municipalities in the province. The computerized reporting through the PMS facilitated the evaluation of population counts at the RSSO and PO. The PMS generated various reports, which include the progress of enumeration by EA with total number of households and total population (PM Report 2). This report showed the EAs, which were completely enumerated as of the date the report was generated. It also showed the percentage of EAs in a barangay, city/municipality or province that has completed the census taking. This report was used to evaluate the acceptability of the reported counts for the following indicators, computed at the barangay level in comparison with the results of the 2010 Census of Population and Housing:
a. Household and population counts b. Demographic indicators
• Annual population growth rate
• Percent change in the number of households
• Average household size c. Difference between 2015 and 2010 institutional population d. Number and percent of EAs completed
The FOs investigated areas with demographically implausible growth rates and
questionable values in any of the above cited indicators. Evaluation of Population Counts at the Central Office
Parallel monitoring and evaluation of population counts were done at the CO, particularly
at the Population and Housing Census Division (PHCD). The information used by the PHCD for evaluation were:
a. POPCEN 2015 counts at the barangay level generated through the PMS;

Appendix E – Evaluation of Population Counts 2015 Census of Population
Philippine Statistics Authority E - 2
b. POPCEN 2015 counts at the barangay level from the Enumeration Area Reference File (EARF) filled up with population counts by the POs after matching and completeness checking of census questionnaires during the manual processing;
c. POPCEN 2015 counts at the barangay level generated from the Quick Count; d. average annual population growth rates for the provinces and cities/municipalities for
the periods 1995-2000, 2000-2007, 1995-2007, 2000-2010, 2007-2010, 2010-2015 and for all geographic levels, that is, including barangay level, for the period 2010-2015;
e. sex ratio for the provinces and cities/municipalities for the year 2010, and for all geographic levels for the year 2015;
f. average household size for all geographic levels for the years 2000, 2007, 2010 and 2015;
g. percent change of population between census years 2000 and 2007, 2000 and 2010, 2007 and 2010, 2007 and 2015, and 2010 and 2015 for all geographic levels; and
h. difference in the total population, household population, and number of households between census years 2000 and 2007, 2000 and 2010, 2007 and 2010, 2007 and 2015, 2010 and 2015 for all geographic levels.
Below are the other sources of information used as inputs for the extrapolation of population counts for 2015. The results of extrapolation were compared with the population counts from 2010 CPH, using the balancing equation assumption:
a. vital registration data on annual births and deaths and estimates of levels of registration based on POPCEN 2007 and 2010 Census of Population and Housing (2010 CPH), for the provinces and cities/municipalities; and
b. number of housing units based on satellite images, for selected provinces and cities/municipalities.
Acceptable or demographically plausible values for the abovementioned indicators, as
well as the expected direction of their changes over time are specified in the Field Operations Manual (FOM) of the POPCEN 2015 (pages 156-157). The demographic indicators for each geographic area were evaluated using the procedures also contained in the FOM. Explanations were sought if a particular indicator fell outside the acceptable range of values, or if the observed change in the indicator deviates from the expected demographic trend. The RSSO submitted to the CO the explanations of the POs in the region for areas with census results that were considered questionable by the CO based on its independent evaluation.
A more thorough procedure of evaluation was employed for barangays suspected of
having census undercoverage or overcoverage. In extreme cases, wherein the results of the evaluation confirmed that underenumeration, padding or fabrication of population were committed, field verification was required.

Philippine Statistics Authority F - 1
APPENDIX F
List of Report No. 1 – Population by Province, City, Municipality, and Barangay
NATIONAL CAPITAL REGION 1 – A
CORDILLERA ADMINISTRATIVE REGION 1 – B
REGION I - ILOCOS 1 – C
REGION II - CAGAYAN VALLEY 1 – D
REGION III - CENTRAL LUZON 1 – E
REGION IVA - CALABARZON 1 – F
MIMAROPA REGION * 1 – G
REGION V - BICOL 1 – H
REGION VI - WESTERN VISAYAS 1 – I
REGION VII - CENTRAL VISAYAS 1 – J
NEGROS ISLAND REGION 1 – K
REGION VIII - EASTERN VISAYAS 1 – L
REGION IX - ZAMBOANGA PENINSULA 1 – M
REGION X - NORTHERN MINDANAO 1 – N
REGION XI - DAVAO 1 – O
REGION XII - SOCCSKSARGEN 1 – P
REGION XIII - CARAGA 1 – Q
AUTONOMOUS REGION IN MUSLIM MINDANAO 1 – R
* Renamed pursuant to Republic Act No. 10879, also known as the MIMAROPA Act,which took effect on 17 July 2016.


![CURRICULUM VITAE Dr.S.VIMALA...Engineering Research, Volume 7, Issue 4, April-2016 1453 ISSN 2229-5518,pg:1453 – 1460(IM P: 3.791) 23. Energy of Fuzzy Labeling Graph [EF (G)]- Part](https://static.fdocuments.in/doc/165x107/60b47e11bafc9b435a4151f0/curriculum-vitae-drsvimala-engineering-research-volume-7-issue-4-april-2016.jpg)