Cisco Connected Mobile Experiences (CMX) Use Case Examples
22
Cisco Connected Mobile Experiences Use Case Examples First Published: September 25, 2015 1 About This Guide, page 3 2 Finding the Average Dwell Time of Clients, page 3 3 Finding the Number of Visitors to a Retail Store Department, page 4 4 Using a Scheduled PDF Report to Analyze Foot Traffic Patterns Across Different Sections of a Retail Space, page 5 5 Comparing Lobby Usage Across Locations of a Hotel Chain, page 6 6 Determining the Correlation and Business Viability Between Adjacent Retail Spaces, page 6 7 Identifying Popular or Trending Stores, page 7 8 Identifying and Capitalizing on Casino Patrons Points of Entry, page 8 9 Identifying and Capitalizing on Traveler Points of Entry at Airport, page 9 10 Identifying Passerby Statistics and Conversion Rate of a Store, page 10 11 Finding the Busiest Day on Average or Over a Specified Period on Time, page 10 12 Determining Visitor Patterns in a Mall, page 11 13 Identifying the Number of Visitors Who Connected to Free Wi-Fi, page 11 14 Finding the Amount of Time Spent by Visitors in a Store, page 12 15 Grouping Stores and Getting a Consolidated View, page 12 16 How to Exclude Employees from Being Counted as Visitors, page 13 17 Generating a PDF Report, page 13 18 Tracking the Performance of Stores in Different Timezones, page 14 19 CMX Network Administration and Client Tracking, page 14 20 Healthcare Asset Tracking with CMX, page 15
Transcript of Cisco Connected Mobile Experiences (CMX) Use Case Examples
Cisco Connected Mobile Experiences Use Case Examples
First Published: September 25, 2015
1 About This Guide, page 3
2 Finding the Average Dwell Time of Clients, page 3
3 Finding the Number of Visitors to a Retail Store Department, page 4
4 Using a Scheduled PDF Report to Analyze Foot Traffic Patterns Across Different Sections of a Retail Space, page 5
5 Comparing Lobby Usage Across Locations of a Hotel Chain, page 6
6 Determining the Correlation and Business Viability Between Adjacent Retail Spaces, page 6
7 Identifying Popular or Trending Stores, page 7
8 Identifying and Capitalizing on Casino Patrons Points of Entry, page 8
9 Identifying and Capitalizing on Traveler Points of Entry at Airport, page 9
10 Identifying Passerby Statistics and Conversion Rate of a Store, page 10
11 Finding the Busiest Day on Average or Over a Specified Period on Time, page 10
12 Determining Visitor Patterns in a Mall, page 11
13 Identifying the Number of Visitors Who Connected to Free Wi-Fi, page 11
14 Finding the Amount of Time Spent by Visitors in a Store, page 12
15 Grouping Stores and Getting a Consolidated View, page 12
16 How to Exclude Employees from Being Counted as Visitors, page 13
17 Generating a PDF Report, page 13
18 Tracking the Performance of Stores in Different Timezones, page 14
19 CMX Network Administration and Client Tracking, page 14
20 Healthcare Asset Tracking with CMX, page 15
21 Tracking the Movement of Store Customers, page 15
22 Measuring the Location Accuracy of a Client, page 15
23 Troubleshooting a Client on the Map, page 16
24 Activating an Inactive Cisco Wireless Controller, page 16
25 Using Customizable Guest Portal to Log In Client to Wi-Fi, page 17
26 Using Social OAuth to Authenticate Clients and Collect Data from Social Media, page 17
27 Using Facebook Page to Log In a Client to Wi-Fi, page 18
28 Using SMS to Authenticate Clients for Wi-Fi Access on Multiple Devices, page 18
29 Translating Portal Text to Multiple Languages, page 19
30 Backing Up Data, page 19
31 Restoring Data, page 20
32 Upgrading Cisco CMX 10.1x to 10.2, page 21
33 Obtaining Documentation and Submitting a Service Request, page 22
2
1 About This GuideThis guide presents a few essential use cases for using Cisco Connected Mobile Experiences (CMX), Release 10.2 and later.
For detailed information about configuring and managing this product, see the Cisco Connected Mobile Experiences Configuration Guide.
The Cisco CMX documentation set is available at: http://www.cisco.com/c/en/us/support/wireless/mobility-services-engine/tsd-products-support-series-home.html.
2 Finding the Average Dwell Time of Clients I changed the marketing strategy at my chain of 100+ retail stores. Now I want to know if the marketing campaign had any effect on customer retention and acquisition. I want to know if the store location is also a significant factor. Knowing the average dwell time between branches can greatly influence business decisions. For example, a branch with a much lower dwell time than others might indicate that a problem exists in that branch either because of the branch layout or poor staffing. Conversely, an excessively high dwell time might indicate long checkout lines or similar delays, which can be addressed. Finally, dwell time statistics provide insight into the impact of marketing campaigns by providing data to establish whether the campaign was successful in achieving its aims.
Step 1 Log in to Cisco CMX.
Step 2 Create zones for your store branches. For details, see the “Creating a Zone” section in the Cisco Connected Mobile Experiences Configuration Guide.
Step 3 Create the dwell time widget, as described in the “The Average Dwell Time Widget” section in the Cisco Connected Mobile Experiences Configuration Guide.
Step 4 Choose Analytics > Dashboard.
Step 5 In the left pane of the Dashboard, click the Add icon next to Reports.
The Create New Report window is displayed.
Step 6 Check the Auto-Generate check box.
Step 7 Select the branches (campuses) that you are interested in.
Step 8 Click Done.
The generated report displays the Average Dwell Time by Campus chart with the average dwell time for each branch. By default, this is displayed in descending order, but can be changed by clicking Edit and selecting in Ascending Order.
Step 9 To track changes, for example, after a marketing campaign, change the date of the report to This Week or This Month, and change the chart to display the dwell data by day or week.
You can then track the changes in dwell time across all the branches over the selected period to assess the impact of your marketing campaign.
3
3 Finding the Number of Visitors to a Retail Store Department As the manager of a retail store chain, I want to see which store gets the most and least number of visitors to the men’s shoe department.The management team of a retail store chain needs a breakdown of the top few performing and underperforming store locations when it comes to attracting customers (foot traffic) to their men's shoe department.
Step 1 Log in to Cisco CMX.
Step 2 Create men’s shoe department zones in each floor map. For details, see the “Creating a Zone” section in the Cisco Connected Mobile Experiences Configuration Guide.
Step 3 Choose Analytics > Dashboard.
Step 4 Create a Visitors report for the week by performing the following steps:
a. In the left pane of the Dashboard, click the Add icon next to Reports.
The Create New Report window is displayed.
b. Click Customize to specify the widget options.
c. In the Visitors widget, click Add Widget to Report and select the number of Visitors widgets as 1.
d. From the Focus Area Filter drop-down list, choose the level Zone, and choose all the men's shoes department zones.
e. In the Date & Time Filters area, select the time range to This Week.
f. Click Done.
The newly created report is displayed.
Step 5 From the Summary drop-down list, choose the Chart view. By default, the widget appears in the Summary view.
Step 6 From the View Visits drop-down list, choose View Unique Devices.
Step 7 From the by Day drop-down list, choose by Zone.
Step 8 From the in Ascending Order drop-down list, choose in Descending Order.
The highest bar in the chart shows the store that had the most visitors for the week. The lowest bar in the chart shows the store that had infrequent customer visits.
Note You can also use a heat map to track the least or most number of visitors. For more information about performing a heat map analysis, see the “Performing Heatmap Analysis” section in the Cisco Connected Mobile Experiences Configuration Guide.
4
4 Using a Scheduled PDF Report to Analyze Foot Traffic Patterns Across Different Sections of a Retail SpaceAs part of the management committee overseeing a mall campus, I want to know which specific areas of the mall attract the most and the least foot traffic, so that I can make informed management decisions such as increasing rent rates in certain parts of the mall. Cisco CMX provides the precise data required to help mall operators make informed decisions. A mall operator can create a report using Cisco CMX Analytics to determine the pattern of shoppers visiting each section of the mall on a daily, weekly, or monthly basis. They can schedule a PDF report, which will be sent to them on a periodic basis to observe the shoppers’ traffic pattern.
Step 1 Log in to Cisco CMX.
Step 2 Create zones of the corridors or the hallways in the mall where store fronts are located. For details, see the “Creating a Zone” section in the Cisco Connected Mobile Experiences Configuration Guide.
Step 3 Choose Analytics > Dashboard.
Step 4 Create a visitors report to show the number of shoppers visiting each zone.
a. In the left pane of the Dashboard, click the Add icon next to Reports.
The Create New Report window is displayed.
b. Click Customize to specify the widget options.
c. In the Visitors widget, click Add Widget to Report and select the number of visitors widgets as 3.
Three widgets are created.
d. At the top right corner of the first widget, click the Edit icon.
e. At the top left corner of the Edit window, choose Summary from the Report Type drop-down list.
f. From the Date drop-down list, choose Today.
g. Click Done.
This widget will display a summary report of visitor traffic for the day.
h. At the top right corner of the second widget, click the Edit icon.
i. At the top left corner of the Edit window, choose Chart from the Report Type drop-down list.
j. From the Date drop-down list, choose Now.
k. Click Done.
This widget will display a chart of visitor traffic for the day.
l. From the Focus Area Filter drop-down list, choose the level Zone, and choose all the mall zones.
m. From the Date & Time Filters drop-down lists, choose the date and time range to Today.
n. Click Done.
The newly created report is displayed.
Step 5 Set a schedule for your newly created report:
a. In the left pane of the Dashboard, click the Down arrow under the name of your newly created report.
b. Click Schedule.
c. Select PDF for the report format.
d. Click Next.
e. Change the report’s logo, header, and footer.
f. Click Next.
5
g. Enter schedule and recipient details for the report.
h. Click Schedule.
For details, see the “Creating Scheduled Custom Reports” section in the Cisco Connected Mobile Experiences Configuration Guide.
5 Comparing Lobby Usage Across Locations of a Hotel Chain As the owner of a hotel chain, I want to compare the lobby usage across all locations and identify the hotel lobbies that attract the most foot traffic. This will help my design team create a template of a profitable lobby layout for future hotel improvements.Cisco CMX enables hotel managers to monitor the density of visitors in a specific area for a specific time or over a specific reason. For example, they can create a widget for dwell time at the hotel reception area. Based on the dwell time, the hotel manager can see how many visitors are in the area at the peak hour. If the dwell time is higher than the number of registration check-ins and check-outs during the peak hour, one possible reason could be that guests are asking for information. The hotel manager can then decide to create an information desk to reduce the number of people at the registration area.
Hotel managers can also monitor the amount of time visitors stay in the hotel lobby. Sometimes, people wait for other people or a tour bus in the lobby. If the average dwell time is more than 10 minutes, the hotel manager can expand the rest area for guests or add a retail space for guests to visit.
Step 1 Log in to Cisco CMX.
Step 2 Create two or more zones in the hotel lobby, for example, one zone for the reception area and another zone for the different areas in the lobby. For details, see the “Creating a Zone” section in the Cisco Connected Mobile Experiences Configuration Guide.
Step 3 Create the dwell time widget, as described in the “The Average Dwell Time Widget” section in the Cisco Connected Mobile Experiences Configuration Guide.
Step 4 Choose Analytics > Dashboard.
Step 5 Choose the hotel lobby zones to see the dwell time for those zones.
Step 6 Select to view the zone by hour or by day to see the dwell time for a specific period of time.
Note You can also use a heat map to track the least or most number of visitors. For more information about performing a heat map analysis, see the “Performing Heatmap Analysis” section in the Cisco Connected Mobile Experiences Configuration Guide.
6 Determining the Correlation and Business Viability Between Adjacent Retail Spaces As a planner for retail space in an airport, I would like to determine if the positioning of adjacent stores (such as flower and gift shops) produces profitable results. If a negative correlation is seen, I can then make the necessary rearrangements. Some areas within a location, such as shops or buildings, should have a certain natural interaction or correlation with each other. This can be based on their related nature, ease of accessibility, or even close proximity with one another. You would expect a strong correlation between a flower shop and a card shop, because customers of a flower shop might also have a need to visit the gift card shop and vice versa.
Using Cisco CMX Analytics Correlation, you can quantify this relationship to confirm your assumptions.
6
Step 1 Log in to Cisco CMX.
Step 2 Create zones for your flower shop and gift card shop. For details, see the “Creating a Zone” section in the Cisco Connected Mobile Experiences Configuration Guide.
Step 3 Choose Analytics > Dashboard.
Step 4 In the left pane of the Dashboard, click the Add icon next to Reports.
The Create New Report window is displayed. In this window, perform the following tasks:
a. Click Customize.
b. Select the flower shop and card shop zones.
c. Select Last Week and All Day for the date and time ranges.
d. In the Correlation area, click Add Widget to Report to add a Correlation widget.
The Correlation widget provides a detailed summary of client device correlation between two locations.
e. From the Focus Area Filter drop-down list, choose a shop.
f. Click Done.
This generates a report with a single Correlation widget.
Step 5 Modify the widget with specific parameters:
a. Select View Absolute Visits to display results by visits (a visit is counted as being seen in an area on a particular day).
b. From the Focus Area Filter drop-down list, choose the location that you want to analyze. The locations will be the gift card shop. Other locations will be the flower shop and other nearby shops.
Step 6 Check the Auto-Generate check box.
Step 7 Click Done.
In the report that is generated, you can determine a correlation between the flower and gift shops. For example, a 25 percent correlation indicates that out of the 100 visits to the card shop in a week, 25 percent were also to the flower shop. This could be due to proximity or signage. After you make improvements to better direct visitors from the card shop to the flower shop, you can check if there is any change in correlation.
7 Identifying Popular or Trending Stores As the owner of a chain of shopping malls, I want analyze and rate the factors (such as location and product segment) that produce more foot traffic across mall locations. Certain stores within a shopping mall attract a higher rate of foot traffic compared to others, which could be attributed to proximity to the entrance, better product selection, or popularity of the product segment. The Correlation Chart tool can help quantify and help you visualize these relationships.
Step 1 Log in to Cisco CMX.
Step 2 Create zones for the stores and entrances in the mall. For details, see the “Creating a Zone” section in the Cisco Connected Mobile Experiences Configuration Guide.
Step 3 Choose Analytics > Dashboard.
Step 4 In the left pane of the Dashboard, click the Add icon next to Reports.
The Create New Report window is displayed. In this window, perform the following tasks:
a. Click Customize.
b. Select zones that equate to stores in the mall.
c. Select Last Week and All Day for the date and time ranges.
d. In the Correlation area, click Add Widget to Report to add a Correlation widget.
The Correlation widget provides a detailed summary of client device correlation between two locations.
7
e. From the Focus Area Filter drop-down list, choose a store.
f. Click Done.
This generates a report with a single Correlation widget.
Step 5 Modify the widget with specific parameters:
a. Select View Absolute Visits to display results by visits (a visit is counted as being seen in an area on a particular day).
b. From the Focus Area Filter drop-down list, choose the location that you want to analyze. The location will be the main entrance to the mall.
Step 6 Check the Auto-Generate check box.
Step 7 Click Done.
From the report that is displayed, you can see that the grocery store that is at the entrance to the mall is the most visited store in the mall by people entering from the main entrance. The second most popular store is the coffee shop, also located at the mall’s main entrance. The popularity of these stores could be associated with proximity, customer needs, signage, ease of access, and other reasons. The chart quantifies the relationship so that you can come to a conclusion based on your findings.
8 Identifying and Capitalizing on Casino Patrons Points of Entry As a casino manager, I want players to be immediately aware of the newly renovated gambling areas in the casino. Certain areas within a location, such as casinos, hold an expected, or sometimes, unexpected, instant attraction to visitors of that location. This can be deliberate or natural, depending on the circumstances and the nature of the location. For example, casinos want to maximize the time visitors spend in the gambling section of their location. Therefore, the layout of the building, as well as signage, advertising, and so on aim to increase the instant attraction. Using the Path Analysis feature of the Cisco CMX Analytics service, you can easily quantify the instant allure of an area from where people enter a building.
Step 1 Log in to Cisco CMX.
Step 2 Create zones for the gambling areas in the casino. For details, see the “Creating a Zone” section in the Cisco Connected Mobile Experiences Configuration Guide.
Step 3 Choose Analytics > Dashboard.
Step 4 In the left pane of the Dashboard, click the Add icon next to Reports.
The Create New Report window is displayed. In this window, perform the following tasks:
a. Click Customize.
b. Select zones that equate to the gambling areas in the casino.
c. Select Last Week and All Day for the date and time ranges.
d. In the Path area, click Add Widget to Report to add a Path Analysis widget.
The Path Analysis widget analyzes the paths taken by visitors (or client devices) before and after visiting a focus location, and provides a graphical representation of the paths.
e. From the Focus Area Filter drop-down list, choose a gambling area.
f. Click Done.
This generates a report with a single Path Analysis widget.
Step 5 Modify the widget with specific parameters:
a. Select Show Top 15 Areas to display results by up to 15 incoming an outgoing areas.
b. from the Focus Area Filter drop-down list, choose the location that you want to analyze. The location will be the reception area in the casino to enable you to see the paths of people who leave the reception area.
8
Step 6 Check the Auto-Generate check box.
Step 7 Click Done.
From the report that is displayed, you can see that 32 percent of visitors who enter the reception, go straight to the card tables. Path Analysis shows immediate visitation. Therefore, you can say that 32 percent of visitors were immediately attracted to the card tables upon entering the reception area. If this is lower than you expected, you can take appropriate action, such as increase advertising, and then measure it for success. If the casino measures this value for 4 weeks, and if each week, the value fluctuates between 30 and 34 percent, immediate visitation can be considered to be 32 percent on an average. You can then go on to place advertising and quantify its effectiveness by measuring when the advertising is still in place. If the visitation goes up to 42 percent on an average, it would indicate that advertising provided a 10 percent improvement.
9 Identifying and Capitalizing on Traveler Points of Entry at Airport As a sales manager in an airport, I want to maximize the visitation to the duty-free shopping areas before passengers reach the departure gates. Some locations within a building, such as an airport, might have multiple points of entry or access routes. For the owners of a building, identifying which entry is utilized the most can provide valuable information. For example, in an airport, nearly all the visitors end up at the departure gates. To maximize the visitation to the duty-free shopping areas before the passengers reach the gate, you might want to restructure the airport layout, improve signage, or run promotions. Using the Path Analysis widget of Cisco CMX Analytics, you can analyze the paths to the duty-free shopping areas in the departure terminal.
Step 1 Log in to Cisco CMX.
Step 2 Create zones for the areas in the airport. For details, see the “Creating a Zone” section in the Cisco Connected Mobile Experiences Configuration Guide.
Step 3 Choose Analytics > Dashboard.
Step 4 In the left pane of the Dashboard, click the Add icon next to Reports.
The Create New Report window is displayed. In this window, perform the following tasks:
a. Click Customize.
b. Select zones that equate to the areas in the departure terminal in an airport.
c. Select Last Week and All Day for the date and time ranges.
d. In the Path area, click Add Widget to Report to add a Path Analysis widget.
The Path Analysis widget analyzes the paths taken by visitors (or client devices) before and after visiting a focus location, and provides a graphical representation of the paths.
e. From the Focus Area Filter drop-down list, choose an airport area.
f. Click Done.
This generates a report with a single Path Analysis widget.
Step 5 Modify the widget with specific parameters:
a. Select Show Top 15 Areas to display results by up to 15 incoming and outgoing areas.
b. From the Focus Area Filter drop-down list, choose the location that you want to analyze. The location would be the departure gates so that you can see the immediate paths taken to arrive there.
Step 6 Check the Auto-Generate check box.
Step 7 Click Done.
From the report that is displayed, you can see that a lot of people go to the flight gates after visiting the duty-free store. This could be due to the layout of the airport, promotions being run, and signage running through the duty-free store.
Using Cisco CMX Analytics, you can measure the results of the changes you make to draw passengers to the duty-free stores.
9
10 Identifying Passerby Statistics and Conversion Rate of a Store As a retail business owner, I want to determine the effects of change to my store window display. Statistics of passerby of the store and the conversion rate are necessary pieces of information for this evaluation. Information about passersby and conversion rate can help you design your store front displays to attract more visitors. A business with only one or two access points (APs) can use the wireless technology to study customer behavior. The Cisco CMX Presence Analytics service uses APs to detect visitor presence based on their mobile devices.
Step 1 Log in to Cisco CMX.
Step 2 Configure Presence Analytics. For details, see the “Installing the Presence Analytics Service” section in the Cisco Connected Mobile Experiences Configuration Guide.
Step 3 Choose Presence Analytics > Dashboard.
The Dashboard shows key performance indicators (KPIs) of the various client mobile devices at your site, such as visitor count, dwell time, peak duration, and passerby-to-visitor conversion rate.
Step 4 Click Conversion Rate.
The display shows the exact number of visitors and passersby.
Step 5 Click Date to display data for a different time period.
11 Finding the Busiest Day on Average or Over a Specified Period on TimeAs the owner of a chain of stores, I want to gather data on the busiest days, busiest hours, and peak days for each of my stores. The ability to get insights into the busiest hour of day and busiest day of week can help you manage staffing and make sure your business has enough staff to help visitors. Insight into the peak day can help you find out the effectiveness of an advertising promotion or campaign.
Step 1 Log in to Cisco CMX.
Step 2 Configure Presence Analytics. For details, see the “Installing the Presence Analytics Service” section in the Cisco Connected Mobile Experiences Configuration Guide.
Step 3 Choose Presence Analytics > Dashboard.
The Dashboard shows key performance indicators (KPIs) of the various client mobile devices at your site, such as visitor count, dwell time, peak hour, and passerby-to-visitor conversion rate.
Step 4 Click Peak Hour.
The display shows the peak hour and the number of customers during that time.
10
12 Determining Visitor Patterns in a MallAs the owner of a shopping mall, I want to know when first-time visitors come to my mall. Getting insights into first-time visitor pattern can help you target campaigns aimed at converting first-time visitors to repeat visitors. It can also help you understand whether your mall is attracting a lot of first-time visitors, besides helping you estimate the number of new visitors (visitors seen for the first time) and repeat visitors (recognized from an earlier visit).
Step 1 Log in to Cisco CMX.
Step 2 Configure Presence Analytics. For details, see the “Installing the Presence Analytics Service” section in the Cisco Connected Mobile Experiences Configuration Guide.
Step 3 Choose Presence Analytics > Dashboard.
The Dashboard shows key performance indicators (KPIs) of the various client mobile devices at your site, such as visitor count, dwell time, peak hour, and passerby-to-visitor conversion rate.
Step 4 Click Insights.
The display shows details about visitor patterns.
Step 5 View the Repeat Visitor graph and Repeat Visitors Distribution chart.
The graph and chart show estimates of the number of new visitors (visitors seen for the first time) and repeat visitors (recognized from an earlier visit).
13 Identifying the Number of Visitors Who Connected to Free Wi-FiAs a store owner, I want to know how many visitors connected to the free Wi-Fi offered in my store. Knowing the number of connected visitors can help you find out if offering Wi-Fi in your business is attracting more visitors and increasing foot traffic.
Step 1 Log in to Cisco CMX.
Step 2 Configure Presence Analytics. For details, see the “Installing the Presence Analytics Service” section in the Cisco Connected Mobile Experiences Configuration Guide.
Step 3 Choose Presence Analytics > Dashboard.
The Dashboard shows key performance indicators (KPIs) of the various client mobile devices at your site, such as visitor count, dwell time, peak hour, and passerby-to-visitor conversion rate.
Step 4 Click Visitors.
The display shows the number of total visitors and the number of connected visitors.
Step 5 View the Proximity graph and Proximity Distribution chart.
The graph and chart show an hourly breakdown of passersby, visitors, and connected devices for the selected site during the specified duration.
11
14 Finding the Amount of Time Spent by Visitors in a StoreAs a store owner, I want to know how much time visitors typically spend in my store. Getting insights into visitor dwell time and average dwell time can help you manage staffing and layout. A low dwell time might indicate that the store has a problem to address, and a high dwell time might indicate that the branch has long checkout lines.
Step 1 Log in to Cisco CMX.
Step 2 Configure Presence Analytics. For details, see the “Installing the Presence Analytics Service” section in the Cisco Connected Mobile Experiences Configuration Guide.
Step 3 Choose Presence Analytics > Dashboard.
The Dashboard shows key performance indicators (KPIs) of the various client mobile devices at your site, such as visitor count, dwell time, peak hour, and passerby-to-visitor conversion rate.
Step 4 Click Average Dwell Time.
The display shows a breakdown of how visitors are spending their time.
Step 5 View the Dwell Time graph and Dwell Time Distribution chart.
The graph and chart provide an hourly breakdown of dwell time.
15 Grouping Stores and Getting a Consolidated ViewAs the owner of a chain of stores, I want to know how to group my stores and have a consolidated view of all my stores.Having a consolidated view of your group of stores provides you with an easy way to summarize visitor activity and provides you with insights into the days on which the stores are busy.
Step 1 Log in to Cisco CMX.
Step 2 Choose Presence Analytics > Manage.
Step 3 Click Site Groups.
Step 4 Click Create Group.
Step 5 Enter the Group Name and Address of the group.
Step 6 Select the stores to add to the group.
Step 7 Click Save.
Step 8 Click Dashboard.
Step 9 From the Site drop-down list, choose a site.
The Dashboard shows the site’s key performance indicators (KPIs) of the various client mobile devices at your site, such as visitor count, dwell time, peak hour, and passerby-to-visitor conversion rate.
12
16 How to Exclude Employees from Being Counted as VisitorsAs a store owner, I want to exclude my employees from being counted as visitors in my analytics reports.To get an accurate count of how many visitors really visited a store and how much time they spent in the store, it would be helpful to filter or exclude employees and contractors so that your analytics reports contain data about only visitors and passersby.
Step 1 Log in to Cisco CMX.
Step 2 Choose Presence Analytics > Manage.
Step 3 Click Filters.
Step 4 Set parameters to avoid employees from being counted as visitors:
• Exclude employees’ device MAC addresses
• Exclude devices associated with a particular Service Set Identifier (SSID)
• Exclude the duration (during week or month) for which employees are present in the store. For example, you can exclude visitors who visit a store 5 days a week or 20 days a month because they will typically be employees.
Note Check the Enable Exclusion Filters check box to exclude the specified data.
For details, see the “Specifying Filter Parameters” section in the Cisco Connected Mobile Experiences Configuration Guide.
Step 5 Click Save.
Step 6 Click Dashboard.
The Dashboard shows the site’s key performance indicators (KPIs) of the various client mobile devices at your site, such as visitor count, dwell time, peak hour, and passerby-to-visitor conversion rate.
17 Generating a PDF ReportAs the store owner, I want to generate a PDF report for my store.Generating a PDF report enables a store owner to share the store summary with co-workers. The PDF reports are archived and available for later use.
Step 1 Log in to Cisco CMX.
Step 2 Choose Presence Analytics > Manager.
Step 3 Click Reports.
To customize the report logo, click Browse and upload the desired logo.
Step 4 Click the download link for the report that you want in PDF.
13
18 Tracking the Performance of Stores in Different TimezonesAs a store owner, I want to see how my stores in New York and San Francisco are doing.Getting insights into customer behavior across timezones is important for businesses.
The CMX Presence Analytics service supports timezones for sites. Timezones are derived from the address or location of the site. Switching sites switch timezones and show data based on the site timezone.
Step 1 Log in to Cisco CMX.
Step 2 Choose Presence Analytics > Manager.
Step 3 Click Sites.
The list of sites are displayed sorted by location, timezone, or access-point count.
19 CMX Network Administration and Client TrackingAs a network administrator, I want to manage the various wireless clients in the building. The CMX Detect and Locate service allows you to view all the access points (APs) deployed in all the buildings of a campus, or to view the APs deployed on the individual floors of each building. You can also locate Wi-Fi tags, rogue APs, Wi-Fi interferers, and Bluetooth low energy (BLE) beacons.
Step 1 Log in to Cisco CMX.
Step 2 Export maps from Cisco Prime Infrastructure and import the maps in to Cisco CMX. For details, see the “Exporting Cisco Prime Infrastructure Maps” section in the Cisco Connected Mobile Experiences Configuration Guide.
Step 3 Verify that the AP positions are correct. For details, see the “Measuring Client Location Accuracy Using the Location Accuracy Test” section in the Cisco Connected Mobile Experiences Configuration Guide.
Step 4 Add a Cisco wireless controller to Cisco CMX and verify that the controller’s status as shown as ACTIVE. For details, see the “Importing Maps and Adding Controllers” section in the Cisco Connected Mobile Experiences Configuration Guide.
Step 5 Verify that the controller is detecting clients.
Step 6 Verify that location, nmsplb, matlabengine, cache_6379 services are enabled. For details, see the “Enabling or Disabling Cisco CMX Services” section in the Cisco Connected Mobile Experiences Configuration Guide.
Step 7 From System > Settings > Tracking Parameters, verify that client tracking is enabled. For details, see the “Setting Device Tracking Parameters” section in the Cisco Connected Mobile Experiences Configuration Guide.
Step 8 Click Detect & Locate and open the floor map. For details, see the “Viewing or Tracking Devices” section in the Cisco Connected Mobile Experiences Configuration Guide.
You should be able to see the clients on the map.
14
20 Healthcare Asset Tracking with CMX As a hospital nurse, I need to track important healthcare assets and equipment in a large, multi-floor medical facility.Cisco CMX Detect and Locate service allows you to view all Wi-Fi tags attached to tracked assets and equipment. CMX notifications then provide movement and location-coordinate updates to 3rd-party applications supporting REST API calls.
Step 1 Log in to Cisco CMX.
Step 2 Click Detect & Locate.
Step 3 From the left pane of the Activity Map window, select the desired building and floor.
The Activity Map window displays a list of icons to the right.
Step 4 Click the Tags icon to show or hide Wi-Fi tags.
Step 5 Set up CMX notifications to obtain movement and location updates for Wi-Fi tags through a REST API. For details, see the “Creating a New Notification” section in the Cisco Connected Mobile Experiences Configuration Guide.
21 Tracking the Movement of Store Customers As a store owner, I want to know the floors customers visit the most. The CMX Client Playback feature enables you to locate and track the movement of customers in a site. You can track the activity of one client at a time.
Step 1 Log in to Cisco CMX.
Step 2 Click Detect & Locate.
Step 3 From the left pane of the Activity Map window, select the desired building and floor.
Step 4 Click the Client Movement History Playback icon.
Step 5 Enter the MAC address of the device in the Search field.
Step 6 Select the date for which you want to view client history.
The Activity Map plays back the client’s movement on the selected date.
22 Measuring the Location Accuracy of a ClientAs an IT administrator managing a CMX deployment, I would use the Location Accuracy Test tool to validate the placement and number of access points to ensure that my CMX deployment is producing the best location accuracy experience. Being confident about the location of a client can help you customize each client’s experience. You can use CMX to perform a location accuracy test for a single device.
Step 1 Log in to Cisco CMX.
Step 2 Click Detect & Locate.
Step 3 Perform the procedure described in the “Measuring Client Location Accuracy Using the Location Accuracy Test” section in the Cisco Connected Mobile Experiences Configuration Guide.
15
23 Troubleshooting a Client on the MapAs a network administrator, I need to check if the Cisco Mobility Services Engine (MSE) is detecting a particular client.
Step 1 Log in to Cisco CMX.
Step 2 Verify that the wireless LAN controller is added to Cisco CMX. For details, see the “Importing Maps and Adding Controllers” section in the Cisco Connected Mobile Experiences Configuration Guide.
Step 3 From the Cisco wireless LAN controller (WLC) GUI or CLI, verify that the client is detected. You can use the show client summary or show client probing command from the wireless LAN controller.
Step 4 Enter the show cmxctl config controllers command to verify that the Cisco WLC Network Mobility Services Protocol (NMSP) is in Active state.
Step 5 Verify that all the access points connected from that Cisco WLC (or the APs detecting this client) are placed on the map and imported to Cisco CMX. For details, see the “Adding Access Points to Sites” section in the Cisco Connected Mobile Experiences Configuration Guide.
Step 6 Choose System > Settings > Filtering, and make sure the Enable Locally Administered MAC Filtering and Enable Location MAC Filtering check boxes are not checked.
Step 7 Enable MAC tracing to check if the Cisco Mobility Services Engine (MSE) is receiving any information from the Cisco WLC, or if location is failing for some reason. For details, see the “MAC Tracing” section in the Location Troubleshooting document at: https://cisco.app.box.com/s/h7d6ol5lb3awtc6cnr0hlcz798ccqvx1.
24 Activating an Inactive Cisco Wireless ControllerAs the network administrator, I need to activate an inactive Cisco Wireless Controller (WLC).
Step 1 Check if you can ping the Cisco WLC.
Step 2 Check if NMSP port 16113 is open on Cisco WLC.
Step 3 Check if SNMP port 161 is open on Cisco WLC.
Step 4 Check if the Cisco WLC is up.
Step 5 Check if the Cisco WLC time is the same or is ahead of Cisco CMX time.
Step 6 Check if the keyhash matches that on the Cisco WLC.
Step 7 Check if the SNMP version and community string are correct.
a. Choose System > Dashboard.
b. For the specific WLC, click Edit.
c. If the SNMP information is not correct, update the version and write community string fields, and click Save.
Step 8 Click Play to see client movement over time.
16
25 Using Customizable Guest Portal to Log In Client to Wi-FiAs a hotel manager, I want to host guest Wi-Fi services. I need an easy-to-use customizable guest portal editor to design portal pages. I want to insert advertisements, and I want to assign different portal pages to different sites. I also want to evaluate the traffic statistics on my Wi-Fi network.You can use Cisco CMX to quickly deploy guest Wi-Fi service with a rich set of features, such as branding logo, background, advertisement banners, video, and image sliders. You can also use Cisco CMX to get an analysis of traffic and network usage of your Wi-Fi network.
Step 1 Log in to Cisco CMX.
Step 2 Choose Connect & Engage > Connect Experiences.
Step 3 Create a portal based on predefined Registration Form templates, or copy a portal from the portal library and then modify it. Your portal can include images of logos, a success page, video or picture slider as advertisements, a redirect URL for clients who log in successfully, and so on.
For details, see the “Setting Up a Custom Portal,” the “Using Portal Library and Image Library,” and the “Enabling SMS-based Authentication in the Custom Portal Page” sections in the Cisco Connected Mobile Experiences Configuration Guide.
Step 4 Assign the portal to an appropriate map location or presence sites or AP groups. For details, see the “Assigning Location-Specific Custom Portal Page” section in the Cisco Connected Mobile Experiences Configuration Guide.
Step 5 Choose Connect & Engage > Dashboard to view visitor counts, data usage, and so on based on location or sites.
26 Using Social OAuth to Authenticate Clients and Collect Data from Social MediaAs a store owner, I want my customers to be authenticated with social media such as Facebook and Foursquare. I also want to display a demographic analysis report of social data such as email, name, and gender of customers who log in to my Wi-Fi network.You can use the Cisco CMX Connect & Engage service to provide social network authentication with Facebook, Instagram, and Foursquare using OAuthentication 2.0. You can also generate demographic reports to gain insight into your customers.
Step 1 Log in to Cisco CMX.
Step 2 Choose Connect & Engage > Connect Experiences.
Step 3 Create a portal based on the predefined Social Login templates, or copy a portal from the portal library and then modify it. For details, see the “Setting Up a Custom Portal” section in the Cisco Connected Mobile Experiences Configuration Guide.
Step 4 From the Visitor Search drop-down list, choose Export All Visitors to download information on the demographics of your customers.
17
27 Using Facebook Page to Log In a Client to Wi-FiAs a store owner, I want my customers to be authenticated with social media such as Facebook. I also want to use Facebook to host a Wi-Fi portal page based on my campus or site civic address, and to use the Facebook page to promote advertisements, coupons, branding logos, and so on. I then want to access from Facebook a demographic analysis report for customers who log in to my Wi-Fi network.You can use the Cisco CMX Connect & Engage service to authenticate guests with Facebook and allow guests to check in or skip. You can also generate demographic reports on Facebook to gain insight into your customers.
Step 1 Use the Facebook developers’ page to create Facebook Wi-Fi portal pages for different locations or addresses.
Step 2 Log in to Cisco CMX.
Step 3 Choose Connect & Engage > Connect Experiences.
Step 4 Assign the Facebook pages to the appropriate location. For details, see the “Assigning a Location-Specific Facebook Page” section in the Cisco Connected Mobile Experiences Configuration Guide.
Step 5 Select Bypass Mode and define the session length and terms. For details, see the “Assigning a System Default Facebook Page” section in the Cisco Connected Mobile Experiences Configuration Guide.
Step 6 Go to Facebook to access the demographic analysis report.
28 Using SMS to Authenticate Clients for Wi-Fi Access on Multiple DevicesAs a store owner, I want customers to provide their phone numbers to identify themselves to access free Wi-Fi. I want to authenticate customers with a simple message through the phone. I want to provide this service globally. Also, once authenticated, my customers should be able to access Wi-Fi on devices other than their mobile phone.Cisco CMX allows you to add SMS-based authentication to a custom portal to provide proof of identity of your customers through their phone numbers and enable them to use any device with Wi-Fi, after authentication.
Step 1 Log in to Cisco CMX.
Step 2 Choose Connect & Engage > Connect Experiences.
Step 3 Create a portal based on the predefined SMS Form templates, or copy a portal from portal library and then modify it. When creating the portal, enable SMS authentication, create a Twilio account, and configure the SMS code expiration period.
For details, see the “Enabling SMS-based Authentication in the Custom Portal Page” section in the Cisco Connected Mobile Experiences Configuration Guide.
18
29 Translating Portal Text to Multiple LanguagesAs a hotel owner, I want to host guest Wi-Fi in different countries or in a venue where guests come from different countries. I want to provide different languages on the hotel portal page.The ability to provide language translation based on customers’ browser locale or what customers select as their preferred language can help you to easily expand your Wi-Fi service to a large range of locations around the world. The language report provides statistics of served languages. This gives you an overview of visitor region distributions, so that you can make changes accordingly.
Step 1 Log in to Cisco CMX.
Step 2 Choose Connect & Engage > Connect Experiences.
Step 3 Create a portal based on predefined templates, or copy a portal from portal library and then modify it. For details, see the “Enabling Multi-language Support in Custom Portals” section in the Cisco Connected Mobile Experiences Configuration Guide.
Step 4 Choose Connect & Engage > Dashboard.
The Languages Used area displays the languages statistics.
30 Backing Up DataAfter you install and run Cisco CMX successfully, we recommend that you perform a back up to avoid loss of data.
Note You must be in non-root user mode to back up data.
You might lose data on your computer if:
• The hard disk in your computer fails.
• The data on your computer is corrupted during upgrading.
Therefore, consider backing up your data so that you can restore your computer to its original state, if necessary.
When Cisco CMX contains huge amounts of saved data, the backup operation might take up extra disk space. In such a scenario, consider the following:
• Back up to an external drive if there is not enough space on the Cisco CMX server.
• After the backup operation, move the backup file (using ftp or scp) to a different server and remove the file from the Cisco CMX server.
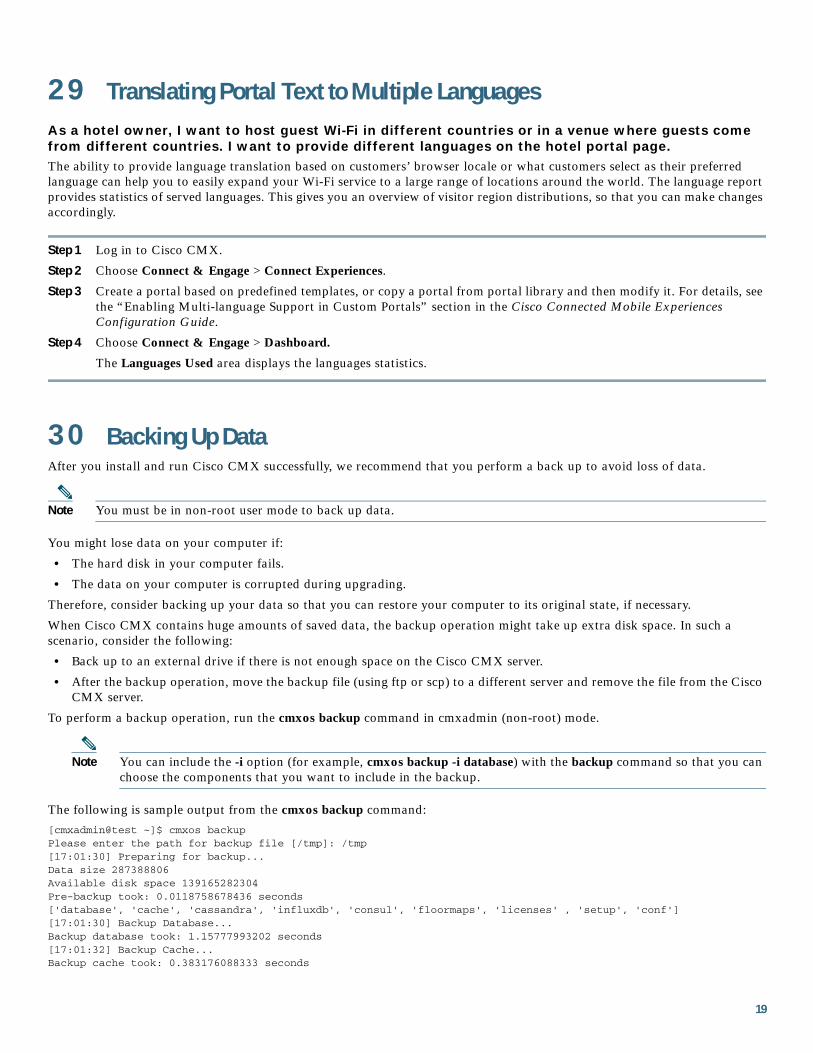
To perform a backup operation, run the cmxos backup command in cmxadmin (non-root) mode.
Note You can include the -i option (for example, cmxos backup -i database) with the backup command so that you can choose the components that you want to include in the backup.
The following is sample output from the cmxos backup command:
[cmxadmin@test ~]$ cmxos backupPlease enter the path for backup file [/tmp]: /tmp[17:01:30] Preparing for backup...Data size 287388806Available disk space 139165282304Pre-backup took: 0.0118758678436 seconds['database', 'cache', 'cassandra', 'influxdb', 'consul', 'floormaps', 'licenses' , 'setup', 'conf'][17:01:30] Backup Database...Backup database took: 1.15777993202 seconds[17:01:32] Backup Cache...Backup cache took: 0.383176088333 seconds
19
[17:01:32] Backup Cassandra...Backup Cassandra DB took: 2.99715185165 seconds[17:01:35] Backup InfluxDb...Backup Influx DB took: 0.0846002101898 seconds[17:01:35] Backup Consul...Backup Consul took: 0.0185141563416 seconds[17:01:35] Backup Floormaps...Backup floor maps took: 0.000938892364502 seconds[17:01:35] Backup licenses...Backup licenses took: 0.000122785568237 seconds[17:01:35] Backup setup...Backup setup took: 0.000464200973511 seconds[17:01:35] Backup node configuration...Backup configuration took: 0.476609945297 seconds[17:01:35] Creating tar file..Post backup took: 16.3115179539 seconds[17:01:52] Done Backup. Created backup file /tmp/cmx_backup_test.cisco.com_2015_07_28_17_01.tar.gz[cmxadmin@test ~]$
31 Restoring DataAfter the backup, you can save the backup file in a safe location. If required, you can restore data from this location.
Note You must be in non-root user mode to restore data.
When you restore data and there is not enough disk space in the Cisco CMX server, try to untar the file from an external drive.
To restore the data, enter the cmxos restore command in cmxadmin (non-root) mode.
Note You can include the -i option (for example, cmxos restore -i database) with the restore command, so that you can choose the components that you want to restore.
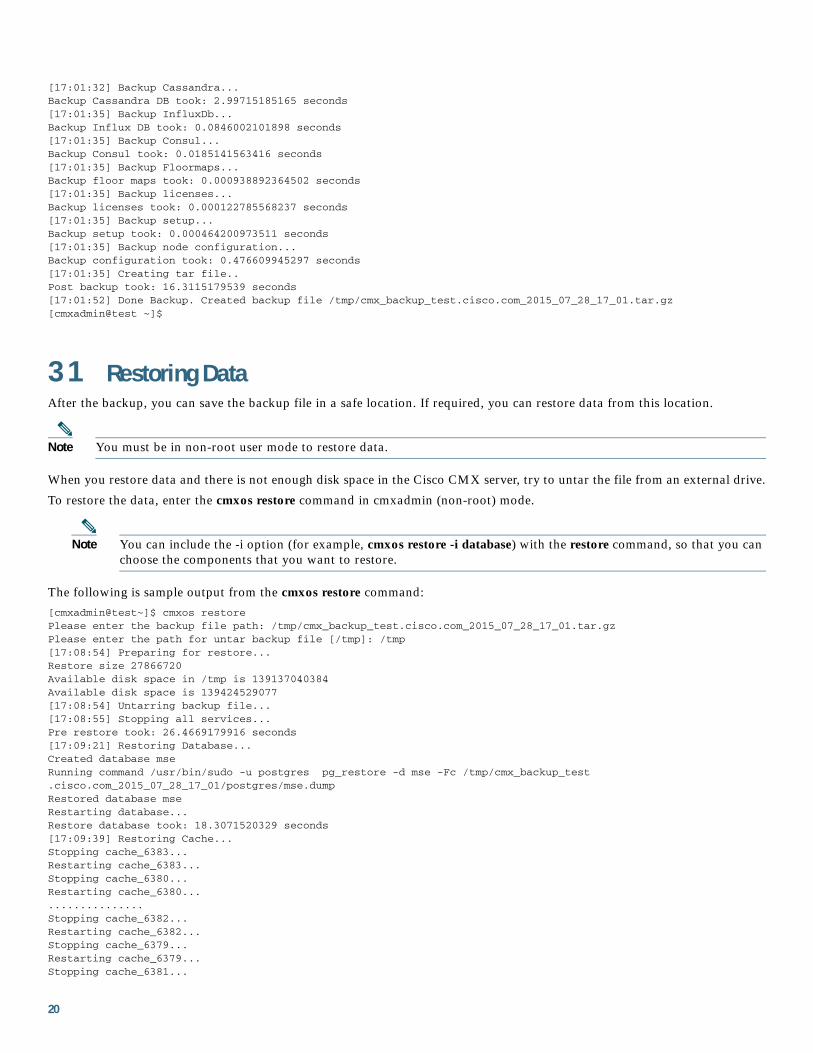
The following is sample output from the cmxos restore command:
[cmxadmin@test~]$ cmxos restorePlease enter the backup file path: /tmp/cmx_backup_test.cisco.com_2015_07_28_17_01.tar.gzPlease enter the path for untar backup file [/tmp]: /tmp[17:08:54] Preparing for restore...Restore size 27866720Available disk space in /tmp is 139137040384Available disk space is 139424529077[17:08:54] Untarring backup file...[17:08:55] Stopping all services...Pre restore took: 26.4669179916 seconds[17:09:21] Restoring Database...Created database mseRunning command /usr/bin/sudo -u postgres pg_restore -d mse -Fc /tmp/cmx_backup_test .cisco.com_2015_07_28_17_01/postgres/mse.dumpRestored database mseRestarting database...Restore database took: 18.3071520329 seconds[17:09:39] Restoring Cache...Stopping cache_6383...Restarting cache_6383...Stopping cache_6380...Restarting cache_6380..................Stopping cache_6382...Restarting cache_6382...Stopping cache_6379...Restarting cache_6379...Stopping cache_6381...
20
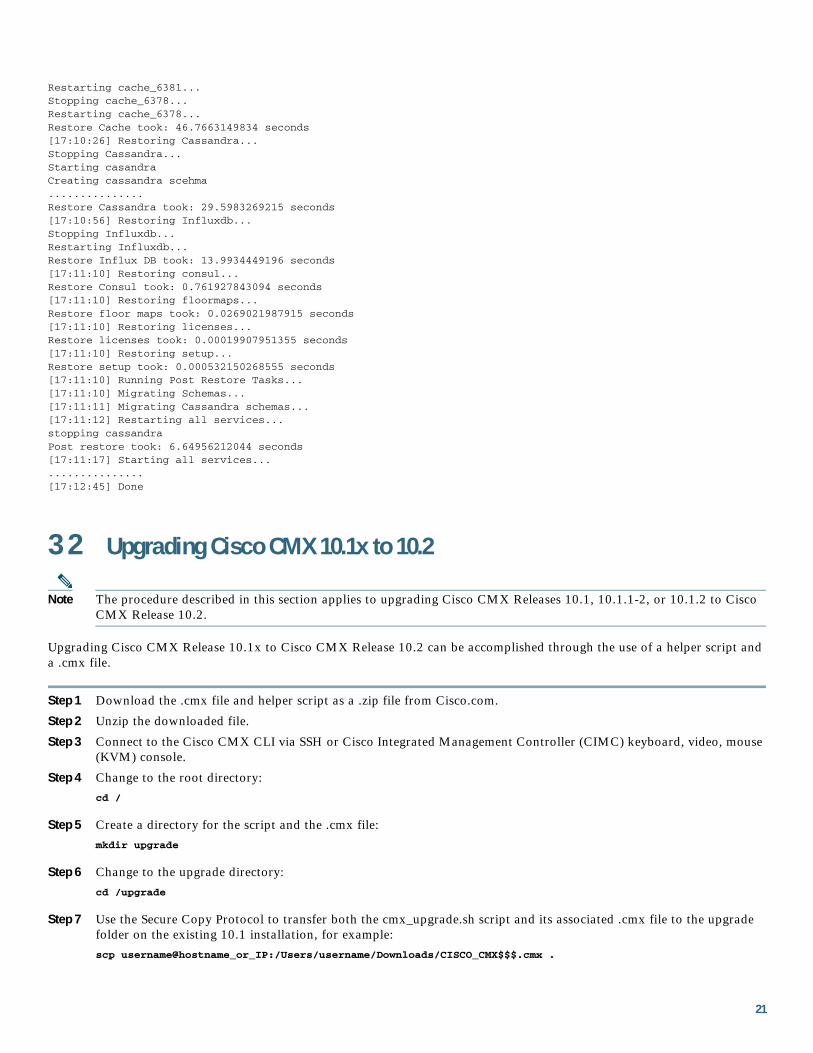
Restarting cache_6381...Stopping cache_6378...Restarting cache_6378...Restore Cache took: 46.7663149834 seconds[17:10:26] Restoring Cassandra...Stopping Cassandra...Starting casandraCreating cassandra scehma...............Restore Cassandra took: 29.5983269215 seconds[17:10:56] Restoring Influxdb...Stopping Influxdb...Restarting Influxdb...Restore Influx DB took: 13.9934449196 seconds[17:11:10] Restoring consul...Restore Consul took: 0.761927843094 seconds[17:11:10] Restoring floormaps...Restore floor maps took: 0.0269021987915 seconds[17:11:10] Restoring licenses...Restore licenses took: 0.00019907951355 seconds[17:11:10] Restoring setup...Restore setup took: 0.000532150268555 seconds[17:11:10] Running Post Restore Tasks...[17:11:10] Migrating Schemas...[17:11:11] Migrating Cassandra schemas...[17:11:12] Restarting all services...stopping cassandraPost restore took: 6.64956212044 seconds[17:11:17] Starting all services..................[17:12:45] Done
32 Upgrading Cisco CMX 10.1x to 10.2
Note The procedure described in this section applies to upgrading Cisco CMX Releases 10.1, 10.1.1-2, or 10.1.2 to Cisco CMX Release 10.2.
Upgrading Cisco CMX Release 10.1x to Cisco CMX Release 10.2 can be accomplished through the use of a helper script and a .cmx file.
Step 1 Download the .cmx file and helper script as a .zip file from Cisco.com.
Step 2 Unzip the downloaded file.
Step 3 Connect to the Cisco CMX CLI via SSH or Cisco Integrated Management Controller (CIMC) keyboard, video, mouse (KVM) console.
Step 4 Change to the root directory:
cd /
Step 5 Create a directory for the script and the .cmx file:
mkdir upgrade
Step 6 Change to the upgrade directory:
cd /upgrade
Step 7 Use the Secure Copy Protocol to transfer both the cmx_upgrade.sh script and its associated .cmx file to the upgrade folder on the existing 10.1 installation, for example:
scp username@hostname_or_IP:/Users/username/Downloads/CISCO_CMX$$$.cmx .
21
Step 8 Make sure that both the script and the .cmx file can be executed by the root user:
chmod +x cmx_upgrade.sh chmod +x <CISCO_CMX$$$.cmx>
Step 9 Run the upgrade script by entering the following at the CLI prompt:
cmx_upgrade.sh <CISCO_CMX$$$.cmx>
33 Obtaining Documentation and Submitting a Service RequestFor information on obtaining documentation, submitting a service request, and gathering additional information, see the monthly What’s New in Cisco Product Documentation, which also lists all new and revised Cisco technical documentation, at:
http://www.cisco.com/en/US/docs/general/whatsnew/whatsnew.html
Subscribe to the What’s New in Cisco Product Documentation as an RSS feed and set content to be delivered directly to your desktop using a reader application. The RSS feeds are a free service. Cisco currently supports RSS Version 2.0.
SUPPLEMENTAL LICENSE AGREEMENT FOR CISCO SYSTEMS NETWORK MANAGEMENT SOFTWARE: CISCO CONNECTED MOBILE EXPERIENCES (CMX)
IMPORTANT - READ CAREFULLY: This Supplemental License Agreement (“SLA”) contains additional limitations on the license to the Software provided to Customerunder the End User License Agreement between Customer and Cisco. Capitalized terms used in this SLA and not otherwise defined herein shall have the meanings assignedto them in the End User License Agreement. To the extent that there is a conflict among any of these terms and conditions applicable to the Software, the terms and conditionsin this SLA shall take precedence.
By installing, downloading, accessing or otherwise using the Software, Customer agrees to be bound by the terms of this SLA. If Customer does not agree to the terms of thisSLA, Customer may not install, download or otherwise use the Software.
ADDITIONAL LICENSE RESTRICTIONS:
Installation and Use. The Software components are provided to Customer solely to install, update, supplement, or replace existing functionality of the applicable NetworkManagement Software product. Customer may install and use the following Software components:
Cisco Connected Mobile Experiences (CMX): May be installed on a server in Customer's network management environment.
For each Software license granted, customers may install and run the Software on a single server to manage the number of network devices and codecs specified in the licensefile provided with the Software, or as specified in the Software License Claim Certificate. Customers whose requirements exceed the network device and codec limits mustpurchase upgrade licenses or additional copies of the Software. The network device and codec limits are enforced by license registration.
Reproduction and Distribution. Customers may not reproduce nor distribute the Software.
DESCRIPTION OF OTHER RIGHTS AND LIMITATIONS.
Refer to the Cisco Systems, Inc. End User License Agreement.
Cisco and the Cisco Logo are trademarks of Cisco Systems, Inc. and/or its affiliates in the U.S. and other countries. A listing of Cisco's trademarks can be found atwww.cisco.com/go/trademarks. Third party trademarks mentioned are the property of their respective owners. The use of the word partner does not imply a partnershiprelationship between Cisco and any other company. (1110R)
Any Internet Protocol (IP) addresses used in this document are not intended to be actual addresses. Any examples, command display output, and figures included in thedocument are shown for illustrative purposes only. Any use of actual IP addresses in illustrative content is unintentional and coincidental.
© 2015 Cisco Systems, Inc. All rights reserved.
22