Understanding VirtualAlloc usage using Windows Performance Analyzer

Circle Track Analyzer v3.6 for Windows
User’s Manual
Performance Trends, Inc.

2
3
Performance Trends, Inc. PO Box 530264, Livonia, MI 48153 Sales & Tech Help for Registered Owners (248) 473-9230 Fax: 248-442-7750 Email: [email protected] Website (tips, correspond with other users, download demos, update schedule, etc.) www.performancetrends.com Copyright Notice Copyright (C) 2009 Performance Trends, Inc. All Rights Reserved These software programs and user's manual are reserved by Performance Trends, Inc. and are intended for the use of the original owner only. Copying or duplicating these products except for the personal use of the original owner is a violation of U. S. Copyright Law and is hereby expressly forbidden. Portions Copyright (C) Microsoft Corp. 1993 All Rights Reserved International Business Machines Corp. makes no warranties, either expressed or implied, regarding the enclosed computer package, its merchantability or its fitness for any particular purpose. IBM PC, XT, and AT are registered trademarks of International Business Machines Corp. MS-DOS is a registered trademark of Microsoft Corp. DISCLAIMER OF WARRANTIES: THE SOFTWARE PROVIDED HEREUNDER IS LICENSED "AS IS" WITHOUT ANY WARRANTIES, EXPRESS OR IMPLIED, INCLUDING BUT NOT LIMITED TO, ANY WARRANTIES FOR MERCHANTABILITY OR FITNESS FOR A PARTICULAR PURPOSE. NO ORAL OR WRITTEN STATEMENTS, REPRESENTATIONS OR OTHER AFFIRMATION OF FACT, INCLUDING BUT NOT LIMITED TO STATEMENTS REGARDING CAPABILITY, CAPACITY, SUITABILITY FOR USE OR PERFORMANCE OF SOFTWARE SHALL BE RELIED UPON BY USER OR BE DEEMED TO BE A WARRANTY OR REPRESENTATION BY PERFORMANCE TRENDS, INC. FOR ANY PURPOSE, OR GIVE RISE TO ANY LIABILITY OF OBLIGATION OF PERFORMANCE TRENDS, INC. WHATSOEVER. USER ACCEPTS ALL RESPONSIBILITY FOR SELECTING THE SOFTWARE TO MEET USER NEEDS OR SPECIFIC PURPOSES. PERFORMANCE TRENDS INC. IS UNDER NO OBLIGATION TO FURNISH USER UPDATES OR ENHANCEMENTS EVEN IF FURNISHED TO OTHER USERS. Continued on next page.
4
LIMITATION Of LIABILITY: If at the time of delivery to the original User only there are any defects in the media on which the Software is provided, User's sole and exclusive remedy shall be the replacement of any media returned to Performance Trends, Inc. within 90 days of the receipt of the Software by User, or at Performance Trends Inc.'s sole option, a refund of the License fees paid to Performance Trends, Inc. by User. IN NO EVENT SHALL PERFORMANCE TRENDS, INC. OR THIRD PARTIES WHO HAVE RIGHTS IN THE SOFTWARE BE LIABLE TO USER FOR LOSS OF PROFITS, INDIRECT, SPECIAL, INCIDENTAL OR CONSEQUENTIAL DAMAGES EVEN IF PERFORMANCE TRENDS, INC. IS AWARE OF THE POSSIBILITY OF SUCH DAMAGES. IN THE EVENT ANY REMEDY HEREUNDER FAILS OF ITS ESSENTIAL PURPOSE, OR IN ANY OTHER EVENT, PERFORMANCE TRENDS INC.'S LIABILITY HEREUNDER SHALL NOT EXCEED ANY AMOUNTS PAID BY USER TO PERFORMANCE TRENDS, INC. UNDER THIS AGREEMENT. Some states do not allow the limitation or exclusion of liability for incidental or consequential damages and some states do not allow the exclusion of implied warranties, so the above limitations or exclusions may not apply to you. No action, regardless of form, arising out of any claimed breach of this agreement or performance under this agreement may be brought by either party more than one year after the affected party learns of the cause of action. Refer to diskette envelope for full license agreement. ********************************** W A R N I N G *********************************** The Circle Track Analyzer makes calculations based on equations and data found in various published and heretofore reliable documents. The program is designed for use by skilled professionals experienced with engines and vehicles. The following processes are hazardous, particularly if done by an unskilled or inexperienced user: - Obtaining data to input to the program - Interpreting the program's results Before making measurements of or modifications to any vehicle, engine or driving situation, DO NOT FAIL TO: - Regard the safety consequences - Consult with a skilled and cautious professional - Read the entire user's manual - Obey all federal, state & local laws - Respect the rights and safety of others

5
Table of Contents
Chapter 1 Introduction 1 1.1 Overview of Features 1 1.2 Before You Start 2 1.3 A Word of Caution 3 1.4 Getting Started (Installation) 4 1.5 Example to Get You Going 5 Chapter 2 Definitions 11 2.0 Basic Program Operation 11 2.1 Preferences 13 2.2 Engine 14 2.3 Vehicle 19 2.4 Front Suspension 27 2.5 Rear Suspension 48 2.6 Calculated Lap Times (Performance) 59 2.6.1 Running Conditions 59 2.6.2 Calculate Performance Test Results 65 2.7 Calculation Menus 70 2.8 Match My Lap Times 90 Chapter 3 Output 93 3.0 Test Results 93 3.1 Analyze Perf. Reports 95 3.2 Graphs 97 3.3 Vehicle (& File) Library 106 3.4 Printer Output 110 3.5 History Log 112 3.6 Analyze Suspension 116
6
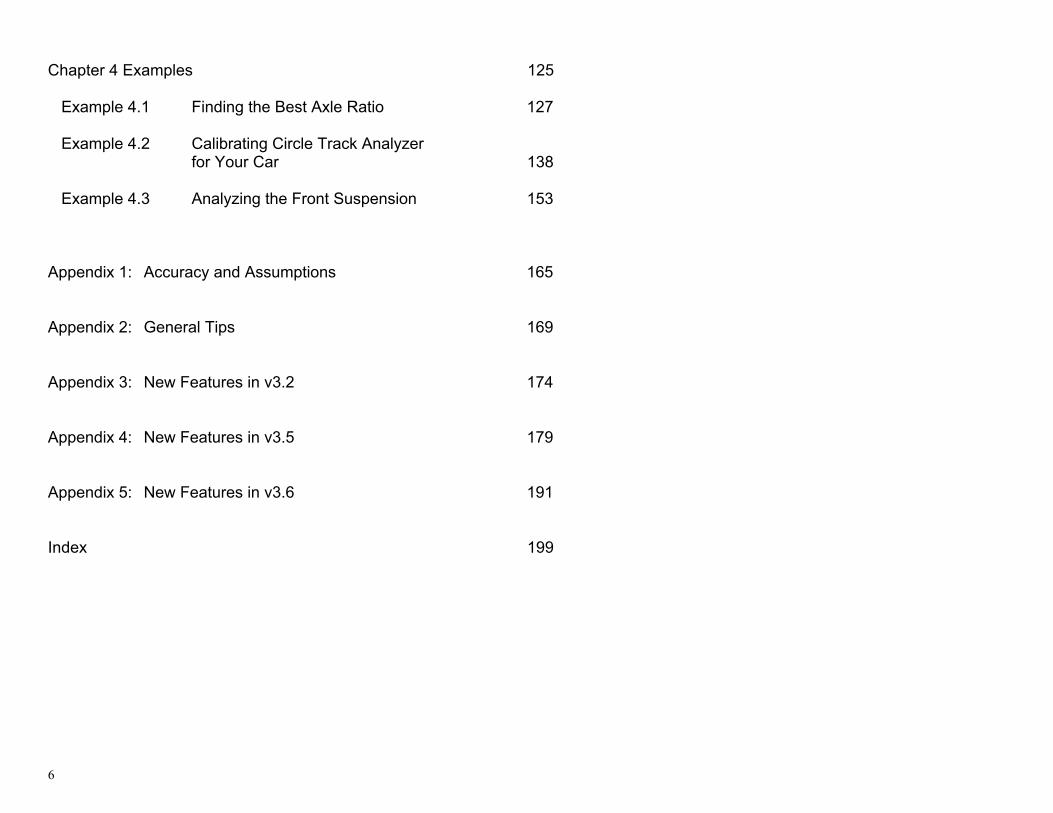
Chapter 4 Examples 125 Example 4.1 Finding the Best Axle Ratio 127 Example 4.2 Calibrating Circle Track Analyzer for Your Car 138 Example 4.3 Analyzing the Front Suspension 153 Appendix 1: Accuracy and Assumptions 165 Appendix 2: General Tips 169 Appendix 3: New Features in v3.2 174 Appendix 4: New Features in v3.5 179 Appendix 5: New Features in v3.6 191 Index 199
(C) Performance Trends Inc 1999 Circle Track Analyzer Chapter 1 Introduction
1
Chapter 1 Introduction
1.1 Overview of Features The Circle Track Analyzer program by Performance Trends, Inc. is a software system to let circle track racers, performance enthusiasts, and even the average driver understand and predict many aspects circle track racing and vehicle handling. The Circle Track Analyzer, Version 2 has been designed to be easier, faster and more accurate. Several new features have been added and other features enhanced. The major changes in Circle Track Analyzer Version 2 are listed below: New Features: • Mouse driven user interface compatible with Windows 98 through Vista for easier operation and
better print capability. • Improved Front Suspension layout screen, very similar to our popular Roll Center Calculator. • Rear Suspension layout screen, for simple analysis of rear suspensions. • Improved suspension and analysis screen to watch front suspension motion while traveling around
the track. • Feature to automatically pick the best gear at a particular track. • Feature which allows the program to adjust critical specs to best match your lap times and highest
and lowest vehicle RPMs at a particular track. • Can print most menus and calculation menus separately. • Keeps log of last 25 tests run, for comparison or recall. You can also select to save up to 10 of these
tests for as long as you wish. You can also select to graph up to 5 of these tests with the current results.
• Advanced file Open and Save commands let you access any drive or directory with standard Windows File Dialog menu.
• Better printing of reports. • Ability to graph the results. These graphs include many options like zoom, shift, line styles, etc. • On screen help by simply clicking on any input spec. If you require more detailed analysis or more features, you may need our upcoming Circle Track Analyzer "Pro". Check Appendices 3-5, pages 165-198 for Features added in Versions 3.2, 3.5 and 3.6. Also, v3.6 can be “unlocked” into 3 different versions, just Roll Center Calculator v3.6 (front suspension only), just Roll Center Calculator Plus v3.6 (front and rear suspension), and the Full Circle Track Analyzer v3.6.
(C) Performance Trends Inc 1999 Circle Track Analyzer Chapter 1 Introduction
2
1.2 Before You Start What you will need:
• 128 Meg of RAM. • Approximately 8 Megabyte of disk space. • Windows 98, Me, XP, 2000, NT, Vista • Printer (optional).
Many terms used by the Circle Track Analyzer and this user's manual are similar to terms used by other publications, like Roll Center, Tire Traction Factor, etc. However, these terms may have different definitions. Therefore, read Chapter 2 to see what these terms mean to the Circle Track Analyzer. Occasionally it will be necessary to identify "typos" in the manual, known "bugs" and their "fixes", etc. which were not known at the time of publication. These will be identified in a file called README.DOC in the Circle Track Analyzer directory or folder.
To read this file, use Windows Explorer to find the Circle Track Analyzer directory, usually CTA20 under PERFTRNS.PTI. Then double click on README.DOC. Wordpad will display the contents.
A new feature has been added to read the README.DOC file from inside the Circle Track Analyzer program. At the main screen, click on Help from the Menu bar, then select “View README.DOC File”. Every effort has been made by Performance Trends, Inc to provide you with an accurate, cost saving, high quality tool at a very reasonable price. We do not copy protect our software, to allow our customers full freedom to make back-up copies for their own personal use. Please respect the programmer's copyright and do NOT give out copies to your friends.
(C) Performance Trends Inc 1999 Circle Track Analyzer Chapter 1 Introduction
3
1.3 A Word of Caution The Circle Track Analyzer is a comprehensive software package which estimates a vehicle's performance based on limited user input. These estimates can be used for analysis of circle track performance. A vehicle is a very complex system, which makes exact calculations of all details impossible. Therefore, several simplifying assumptions are made to reduce the calculations to a manageable level. See the Assumptions in Appendix 1. The user must recognize:
The software can not predict the safety of a vehicle modification or driving situation. Done correctly, with the proper quality parts and safety precautions, extreme vehicle conditions can be safe. Done by inexperienced racers with standard or low quality parts, a race car can be a "disaster waiting to happen". Please read and follow the "Safety Notes" as highlighted in this manual.
The software, like any computer model, can NOT make exact predictions because: • Much of the input data to the software is estimated. • Even if the input data were exactly correct, the simplifying assumptions within the program will
limit the accuracy. • Environmental conditions, driver performance, track conditions, etc. are rarely constant and
repeatable.
The software should be used as a guide to: • Help you understand how an vehicle works; what parameters are important, how parameters
interact, what are the tradeoffs, etc. • Point you in the correct, general direction for making modifications. This direction should be
verified by other sources like known authorities, race results, books, etc. Never trust one "single source" if it does not make sense to you.
• Make you think, not think for you. If unexpected results are obtained, take a minute to: • Double check all your data input. • Refer back to this manual. • Ask someone else skilled and experienced in the particular area. • Give the retailer or Performance Trends Inc's. Tech Help Line a call for an explanation.
(Computer programs are written by normal people who can make mistakes. It's always possible there may be an error in the calculations. Your phone call may help us correct it.)
Please also read the Warranty and Warning at the beginning of this manual and on the diskette envelope.

(C) Performance Trends Inc 1999 Circle Track Analyzer Chapter 1 Introduction
4
1.4 Getting Started (Installation) You must install the Circle Track Analyzer from the distribution CD. To do this, simply place the CD in the CD drive and it will auto-start the Performance Trends Installation Wizard. From this Wizard, you can select to install any of our products as demos, or the Circle Track Analyzer (which is not a demo). The button to install Circle Track Analyzer will be highlighted, probably in the color green. Just click on this button to start the installation, then follow the instructions in the installation program. For most users, just click on OK for each question asked to accept the default answers suggested by the Installation program. Once you have installed the Circle Track Analyzer, there should be a Circle Track Analyzer icon on your desktop for you to click on. Otherwise, use Windows Explorer to find the CTA20 folder (directory) under the PERFTRNS.PTI folder (directory) and click on the CTA.EXE program. (Version 3.6 is installed in the C:\Program Files\Performance Trends\Circle Track Analyzer v3.6 folder.) Entering Registered Owner's Name: During your first setup, the Circle Track Analyzer will ask you to enter your name as the Registered Owner. During this first session, you can modify it until you are satisfied. Once you accept the name, the computer will generate a code # based on the name. To be eligible for Tech Help, you will need both your registered name and code #, and to have sent in your registration card. The name you enter should be very similar to the name you enter on the registration card. Click on About in the Main Menu to review your name and code # .
Figure 1.0 Installation Wizard
Click here to install
(C) Performance Trends Inc 1999 Circle Track Analyzer Chapter 1 Introduction
5
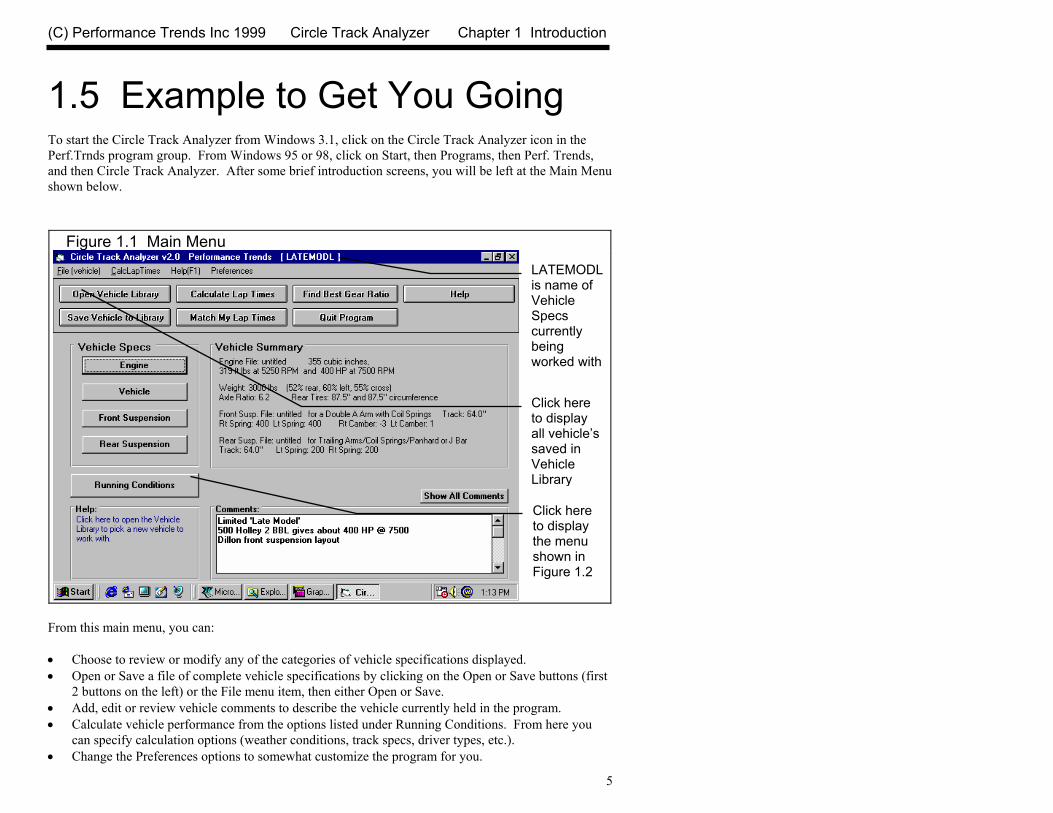
1.5 Example to Get You Going To start the Circle Track Analyzer from Windows 3.1, click on the Circle Track Analyzer icon in the Perf.Trnds program group. From Windows 95 or 98, click on Start, then Programs, then Perf. Trends, and then Circle Track Analyzer. After some brief introduction screens, you will be left at the Main Menu shown below.
From this main menu, you can: • Choose to review or modify any of the categories of vehicle specifications displayed. • Open or Save a file of complete vehicle specifications by clicking on the Open or Save buttons (first
2 buttons on the left) or the File menu item, then either Open or Save. • Add, edit or review vehicle comments to describe the vehicle currently held in the program. • Calculate vehicle performance from the options listed under Running Conditions. From here you
can specify calculation options (weather conditions, track specs, driver types, etc.). • Change the Preferences options to somewhat customize the program for you.
Figure 1.1 Main Menu
Click here to display the menu shown in Figure 1.2
LATEMODLis name of Vehicle Specs currently being worked with
Click here to display all vehicle’s saved in Vehicle Library

(C) Performance Trends Inc 1999 Circle Track Analyzer Chapter 1 Introduction
6
• Get HELP to explain these options by clicking on Help or pressing <F1>. • Quit the program by clicking on File, then Exit, or click on the Quit button. All these options are explained in detail in Chapters 2 and 3. In the Main Menu’s blue title bar you will notice the current Vehicle is [LATEMODL]. The program has descriptions of vehicles saved in the Library right from the factory. The current file from the Vehicle Library is called LATEMODL. To get started, let's examine (but not change) the various categories of specs. Click on a button for one of the categories like Engine, Vehicle, etc. A new menu will appear displaying the various specs and the current values for the LATEMODL vehicle. You can click on the name of any spec and a brief description appears in the Help frame, along with a page # from this manual for more help. You can return to the Main Menu by clicking on OK or clicking on an area outside this menu. Now click on the Calculate Performance button in the Main Menu to calculate performance for this LATEMODL vehicle. The next menu will show you the Calculate Performance Conditions menu as shown in Figure 1.2. For now, leave all the Calculation Conditions as they are and click on the Calculate Performance button. This will start the program calculating performance for the specifications of the LATEMODL stored in
the Vehicle Library with the Calculation Conditions currently displayed. A progress bar graph shows how the calculations are progressing. The calculations may require several seconds on slower computers.
Figure 1.2, Calculation Conditions Menu
Click here to calculate Lap Time performance shown in Figure 1.3

(C) Performance Trends Inc 1999 Circle Track Analyzer Chapter 1 Introduction
7
The final results will appear in a table as in Figure 1.3. The columns are for various types of readings (Time, MPH, etc) which occurred at even time intervals during the run. The results contain much information, some which may not be familiar to you. However, if you look at the Results Summary in the upper right corner, you see a lap time of 16.12 seconds with an average speed of 83.7 MPH. These are results you do understand. If you click on the slide bar button identified in Figure 1.3, and slide the results down to the last row of results, you see a time 8.06 seconds, exactly half of the Lap Time of 16.12 seconds. That is because the program only calculates half of a lap, from turn 2 through the straight through turn 3. The program then assumes the other half lap would be exactly the same and just doubles the time for half a lap.
Figure 1.3 Calculated Results with Lap Time
Summary of important Notes of Interest. Click on Notes button for more info.
Results Summary
Click on slide bar and slide button down to see all test results.
(C) Performance Trends Inc 1999 Circle Track Analyzer Chapter 1 Introduction
8
The menu bar and the command buttons at the top of the screen shows some of the options for various formats for data output: • Analyze Perf will produce a report of performance and safety tips on the test results • Analyze Suspension will show the car traveling around the track and how the corner weights and
front suspension members are changing. • Graph will produce various types of graphs. You can also compare the current results to results of
the previous run, or some other Baseline you have saved. • Print lets you print these results on your printer.
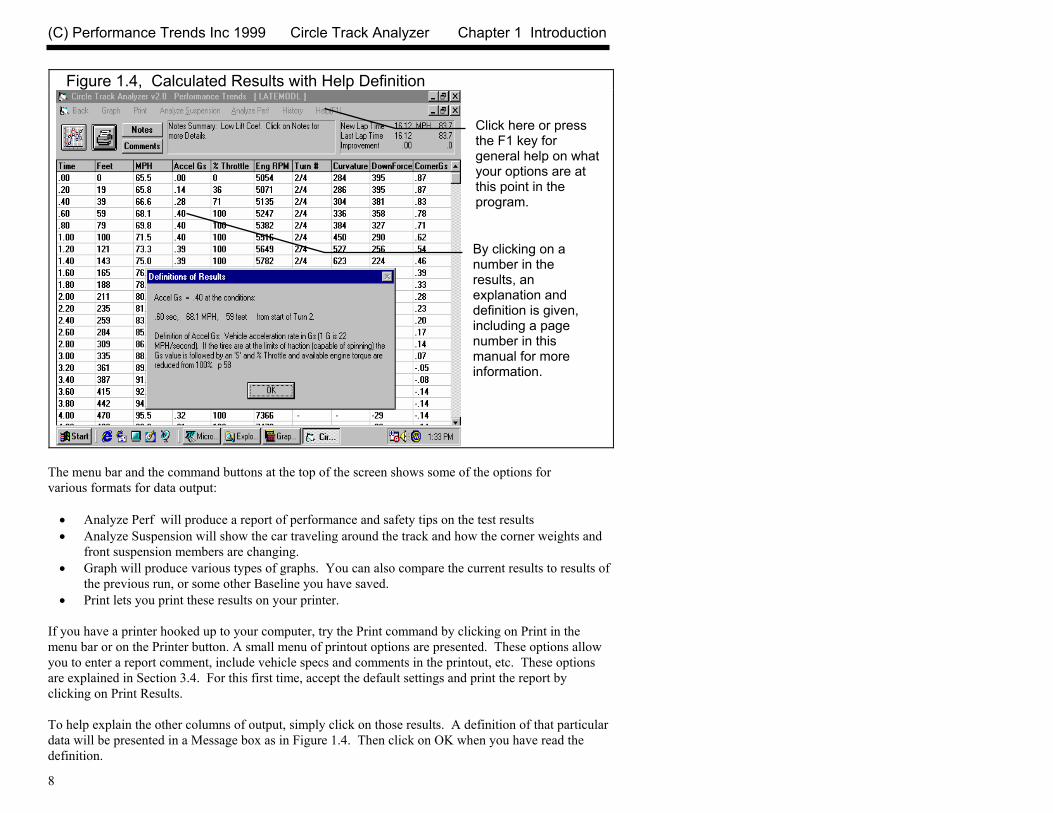
If you have a printer hooked up to your computer, try the Print command by clicking on Print in the menu bar or on the Printer button. A small menu of printout options are presented. These options allow you to enter a report comment, include vehicle specs and comments in the printout, etc. These options are explained in Section 3.4. For this first time, accept the default settings and print the report by clicking on Print Results. To help explain the other columns of output, simply click on those results. A definition of that particular data will be presented in a Message box as in Figure 1.4. Then click on OK when you have read the definition.
Figure 1.4, Calculated Results with Help Definition
By clicking on a number in the results, an explanation and definition is given, including a page number in this manual for more information.
Click here or press the F1 key for general help on what your options are at this point in the program.
(C) Performance Trends Inc 1999 Circle Track Analyzer Chapter 1 Introduction
9
For a detailed explanation of all the results, Calculation Conditions, and output options, go to Section 2.6 and Chapter 3. Clicking on Back or pressing the <ESC> key will return you to the Main Menu. From the Main Menu you can modify the LATEMODL to see the effect on performance. For example you could go into any of the component menus and:
• Change to a different rear axle ratio. • Install ‘stickier’ tires. • Change weather or driving conditions.
The beauty of the program is that it repeats exactly each time. This lets you find differences which would be “clouded” by changes in track conditions or driver variations. Many of the input specifications you see in the various menus may not be familiar to you. For a brief definition of the inputs, simply click on the specification name. The definition will appear in the Help frame with a page # in this manual for more info. Some of the vehicle specifications have “Clc” buttons. One example is Dew Point in the Calculate Performance Conditions menu. “Clc” stands for "calculate". For example, if you want to calculate the Dew Point from wet and dry bulb readings, simply click on the Clc button. The program will display a new menu listing the inputs and the Calc Dew Point from these inputs. For further explanation, click on the Help buttons in these menus. To use the Calc Dew Point calculated from these inputs, click on the Use Calc Value button. Otherwise click on Cancel to return to the Calculate Performance Conditions menu with no change to Dew Point. Section 2.8, Calculation Menus explains all these calculations. Once you feel comfortable changing specifications in the various menus and making various performance calculations, read Section 3.3 of this manual called Vehicle Library to learn how to save a set of vehicle specifications or recall information which has been previously saved. Then you will know all the basic commands to operate the program. For a more in-depth knowledge of using these commands and an explanation of the results, read this entire manual.

(C) Performance Trends Inc 1999 Circle Track Analyzer Chapter 1 Introduction
10
(C) Performance Trends Inc 1999 Circle Track Analyzer Chapter 2 Definitions
11
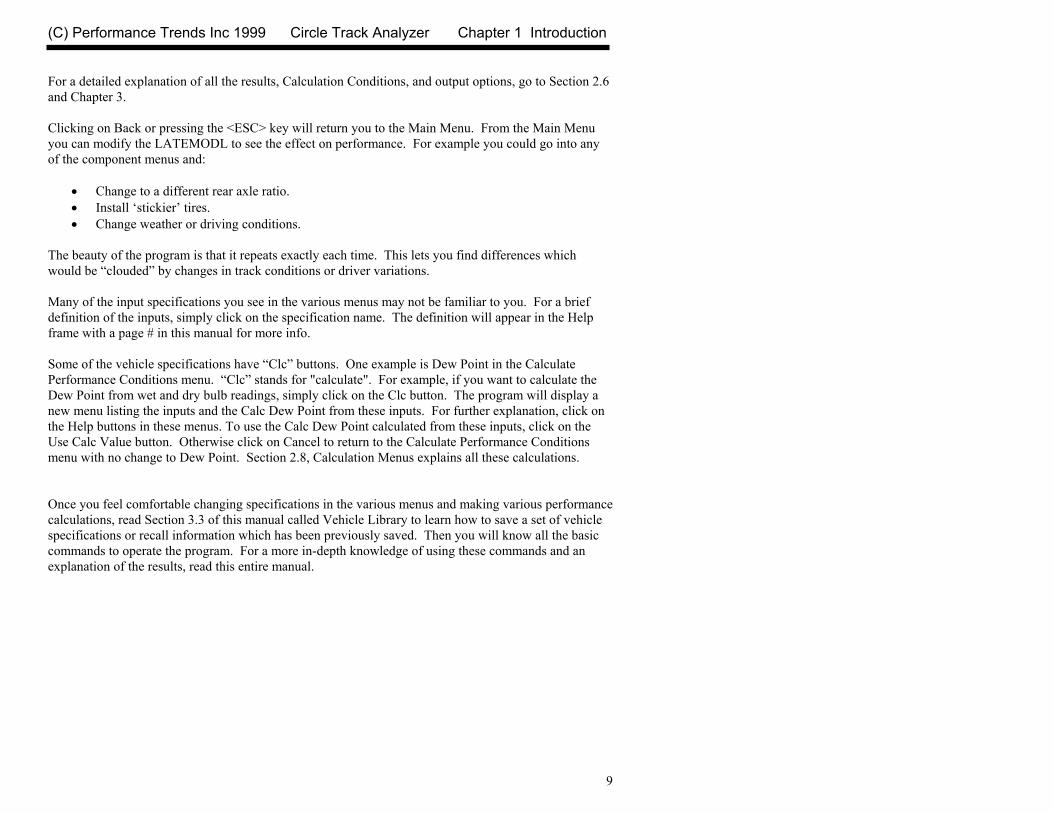
Chapter 2 Definitions 2.0 Basic Program Operation: Figure 2.1 shows the Circle Track Analyzer’s Main Menu with explanations of your options here.
V3.6 can be “unlocked” into 3 different versions, just Roll Center Calculator (front suspension only), just Roll Center Calculator Plus (front and rear suspension), and the Full Circle Track Analyzer v3.6. This can significantly change the appearance of the Main Screen. Check Appendix 5, page 191.
Figure 2.1 Main Menu Options
Enter comments to describe vehicle
Click here to display Running Conditions (weather, track length, etc), and then calculate performance.
Move mouse over an area and a description of the item is given here
This area gives a general description or summary of each of the 4 menus of specs which make up a vehicle
Command buttons to Save or Open a vehicle file, calculate performance, and perform other special calculations
Name of current vehicle file
Menu bar. Click here for “drop down” menus of program options, some being the same as the Command Buttons.
Buttons to display individual menus containing vehicle and driving specs.
(C) Performance Trends Inc 1999 Circle Track Analyzer Chapter 2 Definitions
12
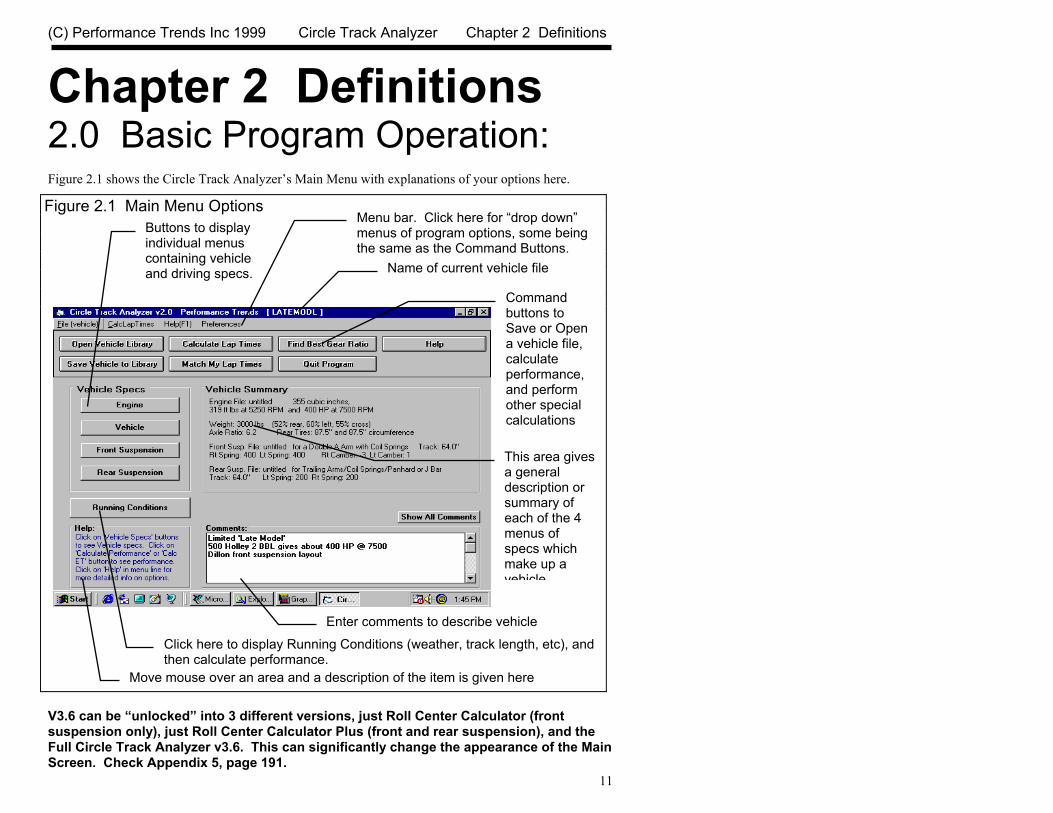
Figure 2.2 shows the Engine menu with explanations of options for most component menus.
Figure 2.2 Explanation of Sections of Typical Menu
Name of specs. Click on them for a description in the menu’s help frame. Help frame giving definition of spec and page # in manual for more info.
Drop down combo box. Click on down arrow button on the right side to pick from a list of possible choices for this spec.
Standard text entry box where you can type in the value of the spec (which will be checked against acceptable limits).
Calculation button which opens up another menu where you can calculate the value of a spec from other inputs
Click on commands in the menu bar to: • Exit this menu • Open (retrieve) a set of example engine specs provided by
Performance Trends, or a set of specs you have previously saved. • Print this screen. • Import an Engine Analyzer power curve. • Display the Engine Comments with other comments describing this
vehicle and front & rear suspension. • Calculate a power curve from simple inputs. • Obtain further help on this screen.

(C) Performance Trends Inc 1999 Circle Track Analyzer Chapter 2 Definitions
13
2.1 Preferences Click on the Preferences item in the menu bar at the top of the Main Menu screen to drop down the Preferences shown in Figure 2.3. Here you can adjust some program items to personalize the program for your needs. Beginner/Experienced Level If you select Beginner, the program will lock out the more complicated features, make more checks on specs assuming you could be making mistakes, and gives more explanation before an action is performed (assuming you may not be familiar it). We strongly recommend this choice to anyone new to computers or this program. Engine Graph - Thick Lines Engine Graph - Thin Lines Lets you customize the way the Full Power Curve graph in the Engine specs menu is displayed and printed. Restart Displaying Help Tips You will notice several tips displayed during running the program, many with a Check Box which says “Don’t Show This Again”. Once you are aware of a tip, you do not want to be shown it again, so click on this check box to “X” it, then click on OK. If you ever want to review a tip, click on this menu item, and all tips will be displayed again at the appropriate time in the program, just as when the program was new, before you checked “Don’t Show This Again”.
Figure 2.3 Preferences Menu Available from Main Menu
(C) Performance Trends Inc 1999 Circle Track Analyzer Chapter 2 Definitions
14
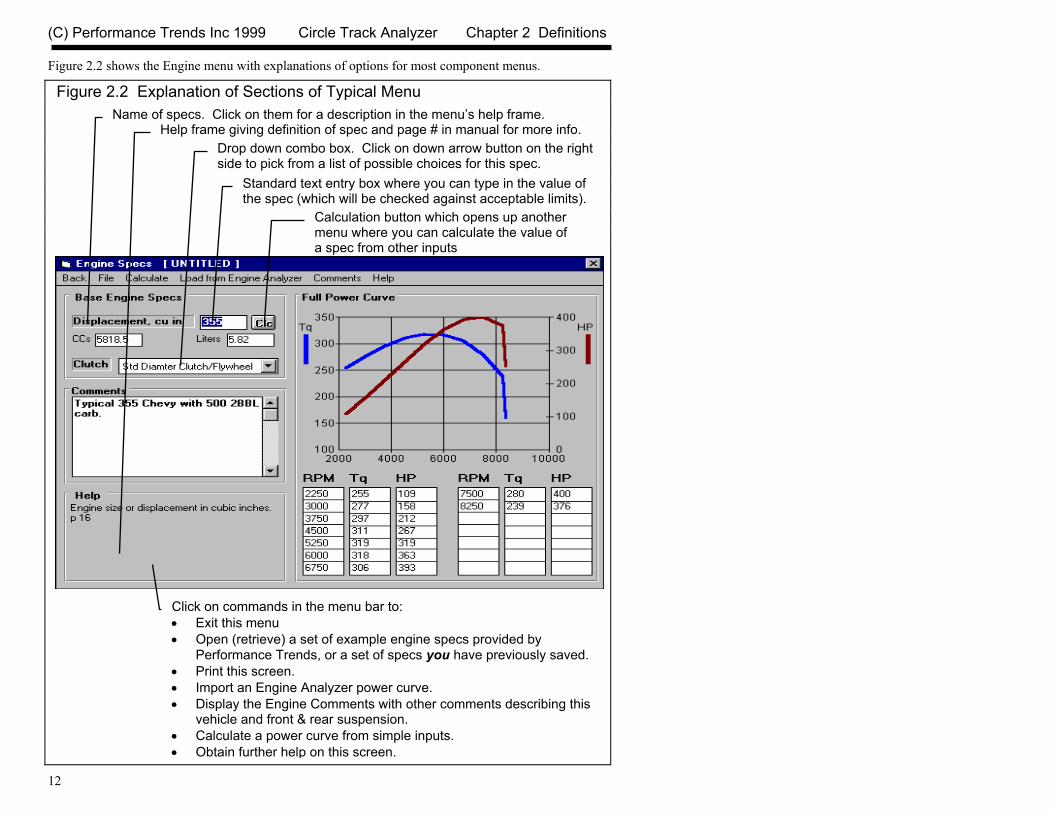
2.2 Engine The Engine specs describe the engine's size in cubic inches, its torque and HP, and what power correction was used for rating the engine’s torque and HP. Figure 2.4 Engine Specs Menu (shown with Full Power Curve)
Click on File, then: • New to blank out the power curve table. • Open Example to pick an example engine provided with the program. • Save to save these engine specs to a name of your choosing. • Print or Windows Printer Setup to print this screen. • here to set the amount of detail you want to give the program about the
power curve
Torque and HP graph based on data in table below it. Note that HP has a separate scale on the right side.
Click here or here to calculate power curve specs from other simple inputs.
Click here to load a power curve from an Engine Analyzer program
Name of current set of Engine Specs. You give the specs a name when you save then
(C) Performance Trends Inc 1999 Circle Track Analyzer Chapter 2 Definitions
15
Displacement, cu in The engine’s cubic inch displacement is used to estimate the amount of rotating inertia * in the engine and clutch/flywheel or converter. Because this spec has a Clc button, Displacement can be calculated from other inputs. See Section 2.7.2. The bigger the cubic inches, the larger the assumed rotating inertia.
* Definition of Engine Inertia: The engine inertia is a measure of how massive the engine's rotating components are and how difficult it is to accelerate or decelerate the engine itself. Most of the engine's inertia is contained in the flywheel/clutch assembly for a manual transmission, or in the torque converter for an automatic transmission. The more massive or the larger the diameter the flywheel or any rotating engine component, the larger the inertia value.
Under this input, the engine’s displacement is shown for CCs and Liters. Clutch Click on the down arrow button to pick a general description of the clutch and flywheel used with this engine. This choice will only affect the rotating Engine Inertia the program assumes. The larger the clutch and flywheel, the more the engine inertia. See Displacement above. Power Curve Data There are several ways to load in RPM, torque and HP data into the table on the right side of the Engine menu. You can: • Pick an Example dyno curve supplied by Performance Trends by clicking on File, the Open
Example Engine. • Pick a set of specs you have previously saved by clicking on File, the Open Saved Engine. • Calculate one based on simple inputs by clicking on Calculate in the Menu at the top. • Load an Example curve, you can load a curve calculated from one of our Windows Engine
Analyzer Programs • Simply type in readings as from a dyno curve. If you type in readings, as soon as there 2 readings
for any set of 3 inputs, the 3rd one is automatically calculated and filled in, and the new point is added to the graph.
The graph always shows a sharp drop in power after the highest RPM point in the table. This is to remind you that this is what the program assumes for calculations, that engine power drops significantly (like it ran into an overspeed) after the highest RPM. If you want the power to not drop so suddenly, then you must add an additional RPM above your current highest RPM, and enter a HP reading which draws the curve like you expect it to look.
(C) Performance Trends Inc 1999 Circle Track Analyzer Chapter 2 Definitions
16
The Circle Track Analyzer assumes all torque and HP numbers entered are recorded at a steady RPM (not accelerating) and corrected to the aftermarket dynamometer standard correction factor. Dynamometers which mostly test racing engines (typical of magazine articles and aftermarket testing companies) generally correct their data to 29.92" Hg, 60 degrees F and approximately 0 degrees F dew point (no humidity). Menu Commands The menu bar at the top provides for several command options, some which are fairly self explanatory: • Back returns you to the main menu. • File opens up several typical Windows options:
• New will blank out all the RPM, torque and HP entries, Displacement, Clutch Type, Engine Comments; and the Engine File name will be called “Untitled”.
• Open Example Engine File will open a typical Circle Track Analyzer “File Open” menu, where you can pick a set of example Engine Specs loaded by Performance Trends.
• Open Saved Engine File will open a typical Circle Track Analyzer “File Open” menu, where you can pick a set of Engine Specs which you have saved, using the Save command in this menu.
• Save Engine File will open a typical Circle Track Analyzer “File Save” menu, where you can save the current set of Engine Specs and Engine Comments under a name of your choosing. This name then appears at the top of the Engine Specs menu. This name should not be confused with the Vehicle Name which appears at the top of the main screen. The Vehicle Name includes the engine specs, and therefore the Engine Name.
• Print lets you print this screen. • Windows Printer Setup lets you change printer selection, paper orientation, etc.
• Calculate will calculate a power curve from simple inputs. See Section 2.7.1 on this Calculation Menu.
• The Load from Engine Analyzer command will be discussed in more detail below. • Help brings up a series of help screens on the Engine Specs menu. Load from Engine Analyzer The Circle Track Analyzer can load engine power curves created by the proper Windows versions of Engine Analyzer EZ, the standard Engine Analyzer, and Engine Analyzer Pro. Generally you will start this process by running the Engine Analyzer program first. Once the Calculated Performance results have been calculated and displayed on the screen, click on the Send button in the Engine Analyzer. This Engine Analyzer menu looks similar to Figure 2.5. It will ask what program do

(C) Performance Trends Inc 1999 Circle Track Analyzer Chapter 2 Definitions
17
you want to send the power curve to, where you could click the Circle Track Analyzer option. There are other options which you can refer to your Engine Analyzer manual. The process of loading Engine Analyzer results into Circle Track Analyzer is nearly automatic and consists of:
1. Once you’ve selected the Circle Track Analyzer as the program to Send the results to, click on the OK/Send button in the Engine Analyzer’s Send menu to leave the Engine Analyzer.
2. The Circle Track Analyzer will be automatically activated and run. 3. When the Circle Track Analyzer stars up the first time, you are given notice that a power curve
is available and can be loaded from the Engine specs menu. You will also notice some new commands on the Main Menu called “Engine Analyzer”. Clicking on these will return to control to the Engine Analyzer program which originally called the Circle Track Analyzer, but will leave the Circle Track Analyzer also running, ready for a new power curve.
4. Important: Once you load the power curve, the old power curve is gone, unless you saved the vehicle specs including power curve with the Save command or saved it as an Example by clicking on the Save Example button at the Engine specs menu.
5. When you are ready to return to the Engine Analyzer, simply click on one of the Engine Analyzer buttons (at the Main Menu or in the Test Results screen) or commands in the Menu bar. You do not have to load the power curve. You can jump between the Engine Analyzer and Circle Track Analyzer as many times as you want.
If an Engine Analyzer program is not currently running and “talking” to the Circle Track Analyzer, you can also start the process by clicking on the Load from Engine Analyzer menu command. You will get the screen of Figure 2.5.
Figure 2.5 Menu to Start Up an Engine Analyzer Program

(C) Performance Trends Inc 1999 Circle Track Analyzer Chapter 2 Definitions
18
Troubleshooting If this process of loading power curves into the Circle Track Analyzer from the Engine Analyzer does not work like described above, consider the following.
• You do not own the correct Windows version of Engine Analyzer program. • You have renamed the Circle Track Analyzer or Engine Analyzer executable (.EXE) file. The
Circle Track Analyzer should be CTA.EXE. • In the Engine Analyzer program, click on the “Look for It” button by the Circle Track Analyzer
option to see if the program can find a correct Windows version. • You are trying to help the programs transfer control to each other. Do not minimize one of the
programs, then activate the other program as this can confuse the process.
Figure 2.6 Optional Engine Analyzer Send Screen To Tell Where Circle Track Analyzer is Located (required for some early Engine Analyzers)
Select the ‘Other’ Option
Type in CTA as the Program NameType in the Full Path where the CTA program is located, usually C:\perftrns.pti\cta20
Program Icon Name is CTA
Click on Send in an Engine Analyzer program to bring up this screen

(C) Performance Trends Inc 1999 Circle Track Analyzer Chapter 2 Definitions
19
2.3 Vehicle Specs The Vehicle specs describe transmission's efficiency, gear ratios, vehicle size, weight, weight distribution, final drive system, tires and aerodynamics.
Figure 2.7 Vehicle Specs Menu
General Vehicle specs. Click on the Clc buttons to calculate inputs from other info, like weight %s from 4 corner weights.
Transmission specs affect engine RPM range and power losses (efficiency).
Aerodynamic specs usually do not have a large effect until vehicle speeds start to exceed 100 MPH.
Tire specs have a large effect on traction, cornering ability and therefore lap times, especially on short tracks
Click here to print this screen.

(C) Performance Trends Inc 1999 Circle Track Analyzer Chapter 2 Definitions
20
General Vehicle Specs Total Weight with Driver, lbs Total vehicle weight in pounds with the driver, ballast, and the amount of fuel you want to analyze. % Rear % Left % Cross These 3 specs describe the vehicle's weight distribution, indicating the % of the vehicle's total weight which is on the rear tires, on the left tires, and the right front + left rear tires. A typical street car (same suspension left and right) are designed for having 50% Left and 50% Cross weight, and only perhaps 42% Rear. Note that the result of these weight percents combined with the Vehicle Weight are displayed as the corner weights next to these inputs. If you know your car’s corner weights but not the percents, click on one of the Clc (calculation) buttons to calculate these percents. See Section 2.7.3. Height of CG Describes the height of the vehicle's center of gravity from level ground. A sports car will have a lower CG than a 4WD truck. Increasing the height of the CG (installing a lift kit) will increase weight transfer from the left to the right when cornering, generally overloading the right tires and reducing lap times. This information is not readily available, but can be estimated by measuring the distance from the ground to a spot approximately 5 inches above the center of the engine's crankshaft at the front of the engine (typical V-8 camshaft level).
Figure 2.8, Estimate of Height of CG
EstimatedHeightof C.G. + 5 inches
Ground Height of Front of Crankshaft
(C) Performance Trends Inc 1999 Circle Track Analyzer Chapter 2 Definitions
21
The Height of C.G. can also be measured by weighing the front and back of the car level, then weighing it again with one of the car raised. This data can be analyzed by clicking on the Clc button and is discussed in Section 2.7.4. Important: The Height of C.G. is used in several calculations, but is VERY difficult to measure exactly, and NOT really critical to know exactly. For that reason it is recommended that you just estimate as 5 inches higher than the crankshaft height off the ground. If you are still not sure, use 20 inches. Wheelbase Is the distance in inches from the center of the front wheels to the center of the rear wheels. Decreasing the wheelbase usually improves cornering ability because it reduces the moment of inertia of the vehicle. For example, it is much harder to spin (turn) an 18 foot 2x4 then a 3 foot 4x12, even they both weigh the same. Rear Axle Ratio For most race cars, this is the rear axle ratio or final drive. For chain drive vehicle's (go carts, motorcycles, etc.) this is the chain ratio. For quick change rear ends, this is the total axle ratio, rear axle ratio (usually 4.88 or 4.56) times the ratio of the spur gears. Click on the Clc button to obtain a menu to calculate Rear Axle Ratio based on number of teeth for your particular situation (Section 2.7.5). Rear Axle Type This specs tells the program how to estimate the power losses in the rear axle. Generally the more heavy duty or the more gears in the rear end, the more the power losses.

(C) Performance Trends Inc 1999 Circle Track Analyzer Chapter 2 Definitions
22
Aerodynamics Type Click on the down arrow key to pick a general body description, or to “Use Specs Below” where you can now enter most any combination of specs you want. Then the other aerodynamic specs become enabled so you can change them. Beginners should pick a general body description Type. Drag Coefficient The coefficient of drag (Cd) is an engineering term used to describe how aerodynamic a vehicle's exterior design is (how easily it "slices" through the wind). A low value for the Cd indicates the car is aerodynamic and requires little power from the engine to overcome wind resistance. Many automotive manufacturers now publish the vehicle's Cd in advertising, since an aerodynamic car is a more fuel efficient car. An aerodynamic car is also a faster car. If the actual Cd of a particular vehicle can not be found, use Table 2.1 to estimate the Cd for different types of vehicles Use Table 2.2 to estimate how much Cd and Cl will change from a modification. Table 2.3 shows examples of changing rear spoiler angle. Table 2.1: Estimate Drag Coefficient (Cd)
Type of Vehicle Cd Motorcycle .70-1.10 Modern Motorcycle (fairings, etc.) .50-.70 Pickup Truck .50-.70 Sedan before 1980 .45-.60 Sports Car before 1980 .45-.55 Open Convertible .50-.70 Modern Aerodynamic Sedan .35-.45 Modern Aerodynamic Sports Car .30-.40 “Best Case" vehicle .11
Table 2.2: Estimate How Modifications Affect Cd and Cl (lift coefficient) Modification Change Cd Change Cl (lift) -4 deg Angle of Attack (vs stock) *1 -.04 -100% +4deg Angle of Attack (vs stock) +.04 +100% Open Side Windows (vs closed) +.02 Open T-Top & Side Windows +.08 4" Flat Air Dam (width of vehicle) *2 -.04 -25% 8" Flat Air Dam (width of vehicle) .00 -50% 12" Flat Air Dam (width of vehicle) +.08 -55% 1" Flat Spoiler (width of vehicle) *3 -.03 -15%

(C) Performance Trends Inc 1999 Circle Track Analyzer Chapter 2 Definitions
23
2" Flat Spoiler (width of vehicle) .00 -25% 4" Flat Spoiler (width of vehicle) +.08 -35% Blocking half radiator air flow -.04 -35% Table 2.3 Changing Spoiler Angle on 94 Winston Cup Car Old Spoiler Angle New Spoiler Angle Change in 20
deg 30 deg
40 deg
50 deg
60 deg
20 deg Cd 0 -.011 -.020 -.028 -.034 Cl 0 .022 .040 .053 .062 30 deg Cd .011 0 -.009 -.017 -.023 Cl -.022 0 .018 .031 .040 40 deg Cd .020 .009 0 -.008 -.013 Cl -.040 -.018 0 .013 .022 50 deg Cd .028 .017 .008 0 .006 Cl -.053 -.031 -.013 0 .009 60 deg Cd .034 .023 .013 .006 0 Cl -.062 -.040 -.022 -.009 0 Notes concerning Table 2.1, 2.2 and 2.3: • Change the vehicle's attitude from the production
attitude 4 degrees, where a negative angle of attack is when the front is lowered and the rear is raised.
• For this table, an air dam is defined as a flat plate the full width of the vehicle projecting vertically down directly below front bumper (based on typical 1970s or earlier design). Most modern, production designs integrate air dams for optimum Cd, therefore adding an air dam to a modern vehicle will likely show an increase in Cd but perhaps a reduction in Cl.
• For this table, a spoiler is defined as a flat plate extending the full width of the vehicle at the top rear edge of the rear deck (trunk) lid, angled back 20 degrees from vertical. See Figure.
• Table 2.2 shows typical effects from modifications. Individual vehicle's can differ considerable. • Advertised Cds are usually the "best case". For a realistic Cd, add .03 to .05 to the advertised Cd for
production vehicles. • Table 2.3 shows effect of changing the spoiler angle on a 94 Winston Cup car. A different body
style and spoiler design would give different results. Changes in the rear spoiler angle affect downforce on the front and rear of the car differently and can significantly affect handling. To use
Spoiler Angle In Table 2.3Spoiler Angle In Table 2.2
Side View of Rear Deck
(C) Performance Trends Inc 1999 Circle Track Analyzer Chapter 2 Definitions
24
Table 2.3, say you were changing the spoiler angle from 40 to 20 degrees on a car with a .38 Cd and a -.12 Cl. Forty (40) would be the Old Spoiler angle and 20 would be the New. This would result in the Drag Coefficient (Cd) decreasing by .020 resulting in .36 and lift coefficient increasing by .040 resulting in a Cl of -.08.
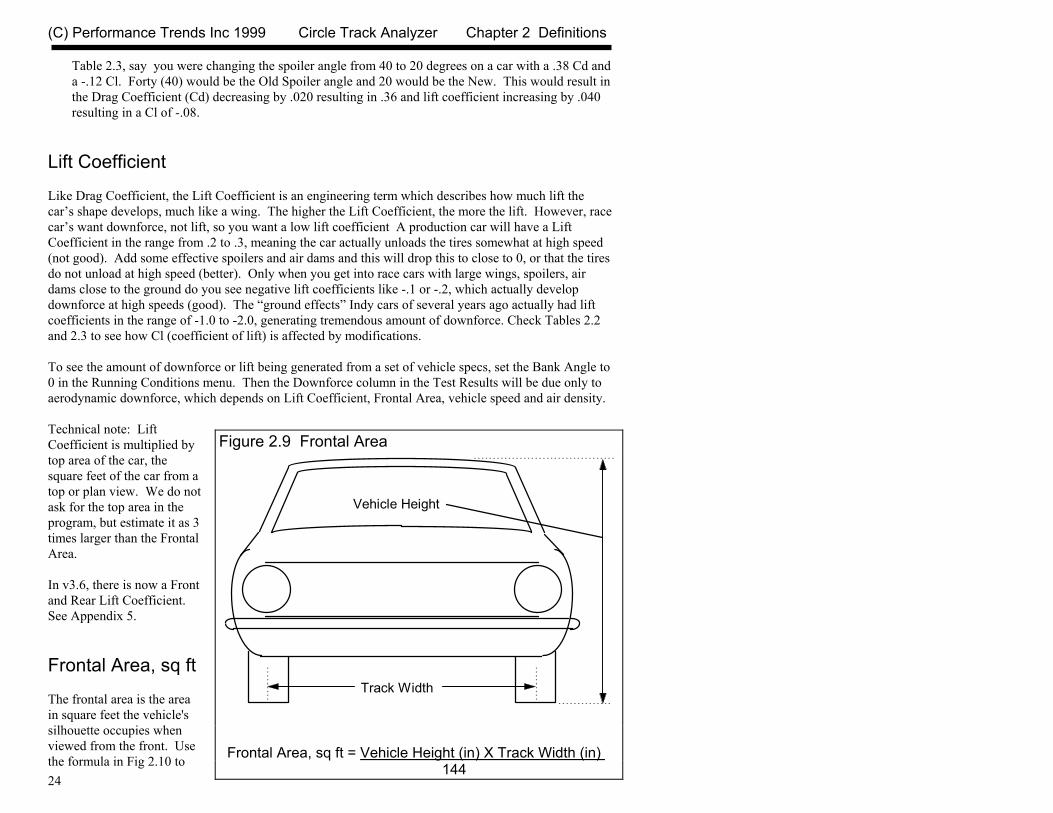
Lift Coefficient Like Drag Coefficient, the Lift Coefficient is an engineering term which describes how much lift the car’s shape develops, much like a wing. The higher the Lift Coefficient, the more the lift. However, race car’s want downforce, not lift, so you want a low lift coefficient A production car will have a Lift Coefficient in the range from .2 to .3, meaning the car actually unloads the tires somewhat at high speed (not good). Add some effective spoilers and air dams and this will drop this to close to 0, or that the tires do not unload at high speed (better). Only when you get into race cars with large wings, spoilers, air dams close to the ground do you see negative lift coefficients like -.1 or -.2, which actually develop downforce at high speeds (good). The “ground effects” Indy cars of several years ago actually had lift coefficients in the range of -1.0 to -2.0, generating tremendous amount of downforce. Check Tables 2.2 and 2.3 to see how Cl (coefficient of lift) is affected by modifications. To see the amount of downforce or lift being generated from a set of vehicle specs, set the Bank Angle to 0 in the Running Conditions menu. Then the Downforce column in the Test Results will be due only to aerodynamic downforce, which depends on Lift Coefficient, Frontal Area, vehicle speed and air density. Technical note: Lift Coefficient is multiplied by top area of the car, the square feet of the car from a top or plan view. We do not ask for the top area in the program, but estimate it as 3 times larger than the Frontal Area. In v3.6, there is now a Front and Rear Lift Coefficient. See Appendix 5. Frontal Area, sq ft The frontal area is the area in square feet the vehicle's silhouette occupies when viewed from the front. Use the formula in Fig 2.10 to
Figure 2.9 Frontal Area
Vehicle Height
Track Width
Frontal Area, sq ft = Vehicle Height (in) X Track Width (in) 144

(C) Performance Trends Inc 1999 Circle Track Analyzer Chapter 2 Definitions
25
estimate frontal area. Frontal areas are in the range of 16 sq ft for a small passenger car to 30 sq ft or more for a full size pick-up truck. Also see Section 2.7.6 for calculating Frontal Area, sq ft by clicking on the Clc button. Transmission Type Click on the down arrow of this combo box to pick a general description of the transmission. This choice only affects power losses. All choices assume a clutch is used between the engine and transmission, not a torque converter, even if an automatic transmission is used. Ratio of Trans Gear Used Is the gear ratio for the single transmission gear used during the race. The Circle Track Analyzer v2.0 assumes the entire race is done in 1 gear. If this is top gear in a “non-overdrive” transmission (3rd for a 3 speed, 4th for a 4 speed, etc), this gear ratio is usually 1. If you are using a Pinto 2.3L SR4 wide ratio transmission in 3rd gear, this could be 1.66. The program also assumes anything different from 1 produces additional power losses. Rear Wheel/Tire Specs Type Click on this combo box to select general tire type. This choice will have a large effect on overall tire traction and cornering ability. Wheels & Tires Wt, lbs This is the weight of one wheel/tire assembly, which can be obtained by weighing the tire mounted on the wheel on a weighing (or bathroom) scale.
(C) Performance Trends Inc 1999 Circle Track Analyzer Chapter 2 Definitions
26
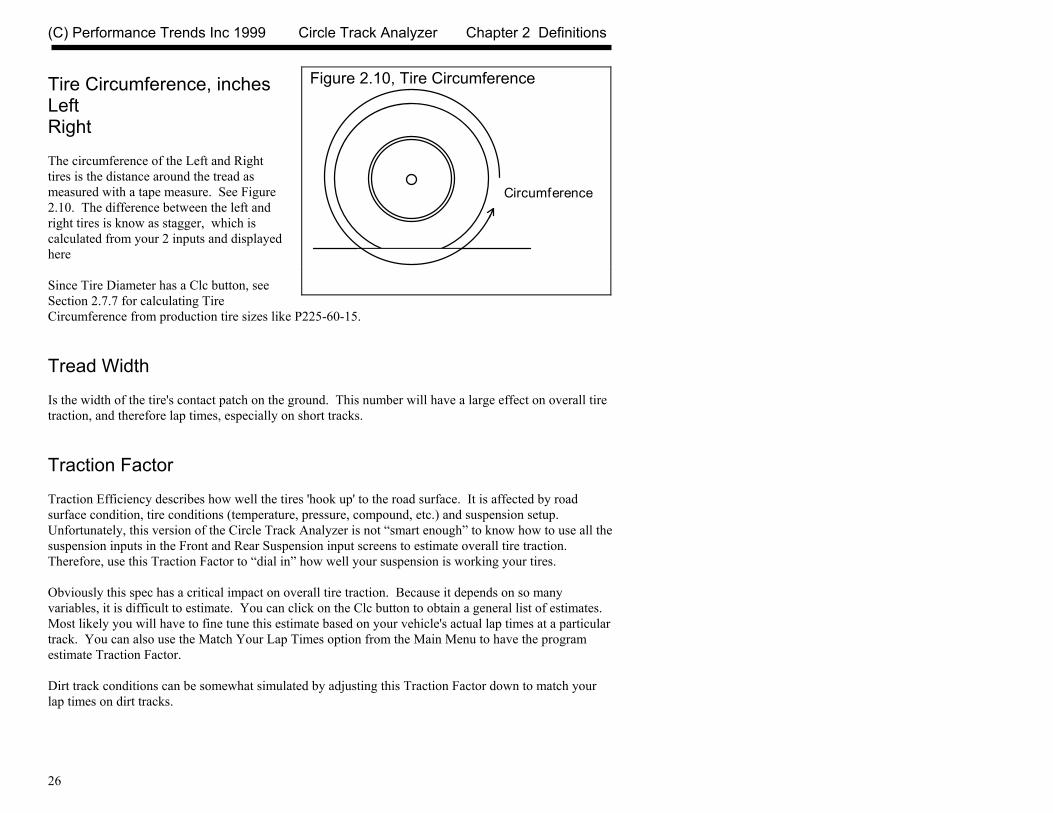
Tire Circumference, inches Left Right The circumference of the Left and Right tires is the distance around the tread as measured with a tape measure. See Figure 2.10. The difference between the left and right tires is know as stagger, which is calculated from your 2 inputs and displayed here Since Tire Diameter has a Clc button, see Section 2.7.7 for calculating Tire Circumference from production tire sizes like P225-60-15. Tread Width Is the width of the tire's contact patch on the ground. This number will have a large effect on overall tire traction, and therefore lap times, especially on short tracks. Traction Factor Traction Efficiency describes how well the tires 'hook up' to the road surface. It is affected by road surface condition, tire conditions (temperature, pressure, compound, etc.) and suspension setup. Unfortunately, this version of the Circle Track Analyzer is not “smart enough” to know how to use all the suspension inputs in the Front and Rear Suspension input screens to estimate overall tire traction. Therefore, use this Traction Factor to “dial in” how well your suspension is working your tires. Obviously this spec has a critical impact on overall tire traction. Because it depends on so many variables, it is difficult to estimate. You can click on the Clc button to obtain a general list of estimates. Most likely you will have to fine tune this estimate based on your vehicle's actual lap times at a particular track. You can also use the Match Your Lap Times option from the Main Menu to have the program estimate Traction Factor. Dirt track conditions can be somewhat simulated by adjusting this Traction Factor down to match your lap times on dirt tracks.
Figure 2.10, Tire Circumference
Circumference
(C) Performance Trends Inc 1999 Circle Track Analyzer Chapter 2 Definitions
27
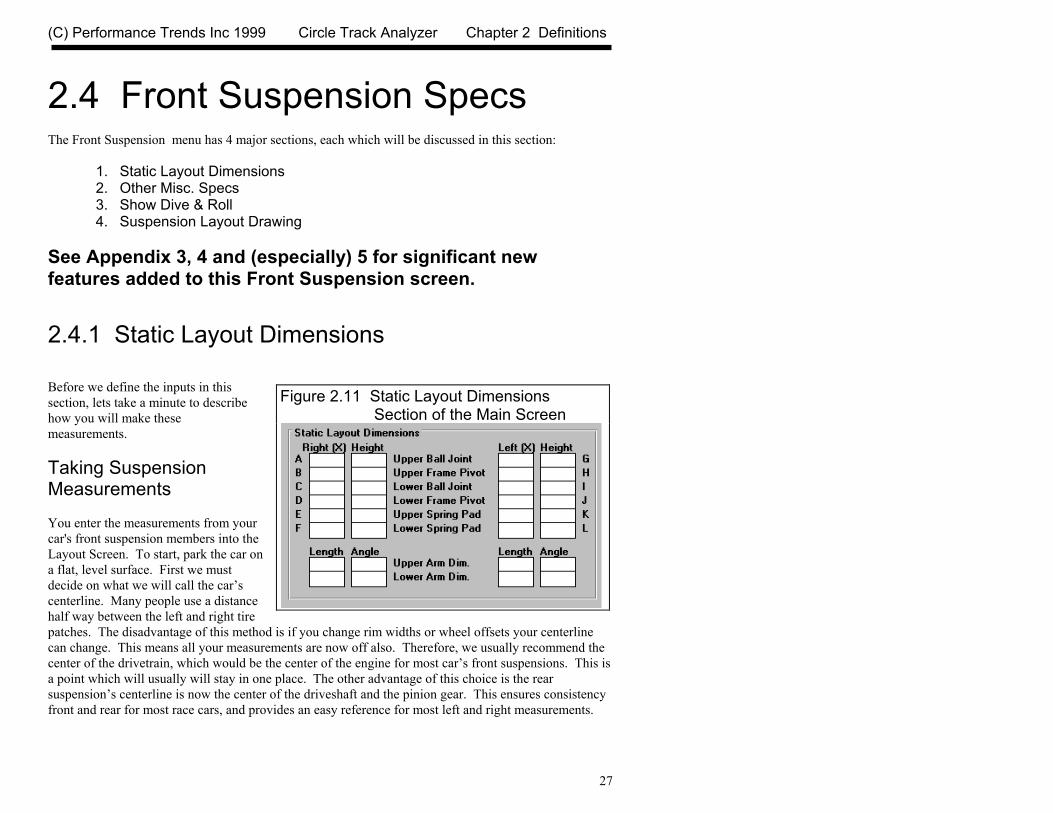
2.4 Front Suspension Specs The Front Suspension menu has 4 major sections, each which will be discussed in this section:
1. Static Layout Dimensions 2. Other Misc. Specs 3. Show Dive & Roll 4. Suspension Layout Drawing
See Appendix 3, 4 and (especially) 5 for significant new features added to this Front Suspension screen.
2.4.1 Static Layout Dimensions Before we define the inputs in this section, lets take a minute to describe how you will make these measurements. Taking Suspension Measurements You enter the measurements from your car's front suspension members into the Layout Screen. To start, park the car on a flat, level surface. First we must decide on what we will call the car’s centerline. Many people use a distance half way between the left and right tire patches. The disadvantage of this method is if you change rim widths or wheel offsets your centerline can change. This means all your measurements are now off also. Therefore, we usually recommend the center of the drivetrain, which would be the center of the engine for most car’s front suspensions. This is a point which will usually will stay in one place. The other advantage of this choice is the rear suspension’s centerline is now the center of the driveshaft and the pinion gear. This ensures consistency front and rear for most race cars, and provides an easy reference for most left and right measurements.
Figure 2.11 Static Layout Dimensions Section of the Main Screen
(C) Performance Trends Inc 1999 Circle Track Analyzer Chapter 2 Definitions
28
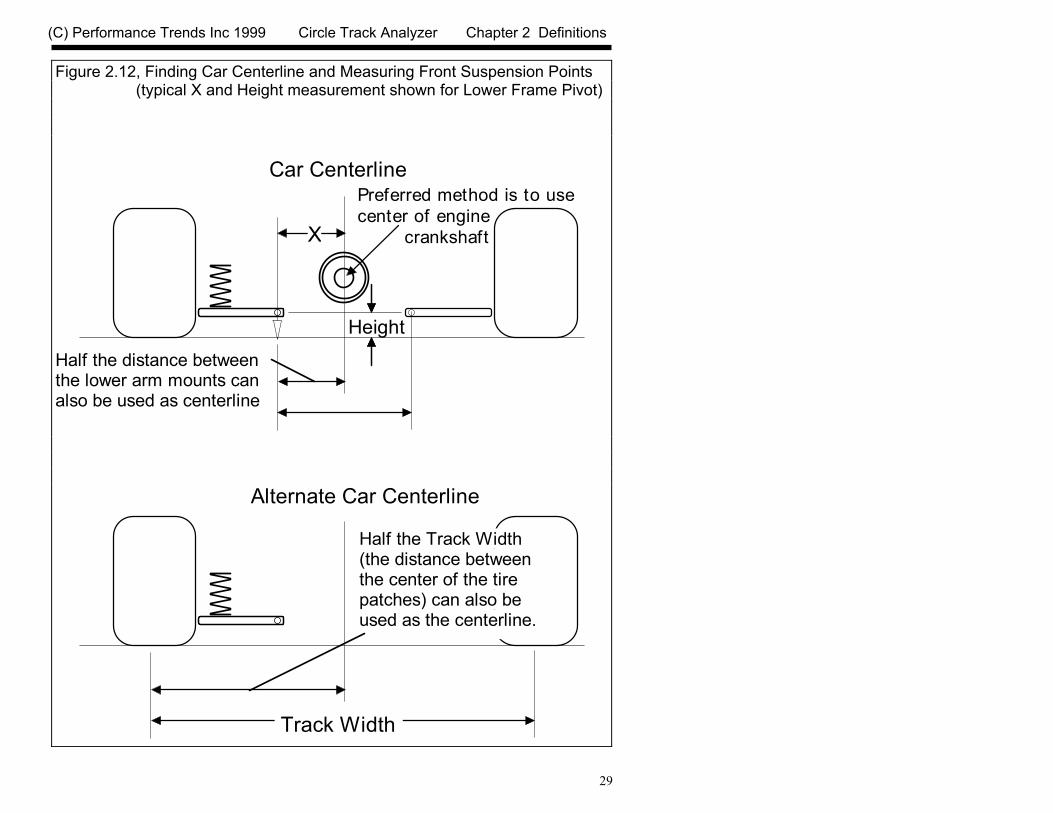
In our Roll Center Calculator program which deals with the front suspension only, we recommend a distance half way between the frame rails, or the frame mounts on the lower arms. This is usually very similar to the center of the drivetrain. On cars without a front engine, rear drive drivetrain layout, use the distance half way between the frame rails, or the frame mounts on the lower arms. Then be sure to project a line straight back, parallel to the frame to mark the rear centerline for the rear suspension. You can also use the center of the front tire patches, being aware of the problem if you change some tire offset specs. Once you’ve decided on the method, either: • Drop a plumb bob (pointed weight on a string) down from the center of the crank pulley. • Use a tape measure to mark a point on the floor which is halfway between the your references. This will now be your car’s centerline and is 0 in the X (horizontal) direction in the Static Layout Dimensions section.
When picking a centerline, the most important thing is to be consistent from front and rear on the same vehicle, and from setup to setup on the same vehicle. Once you decide on a centerline for a particular car, you must make all measurements from this same centerline.
Then with the plumb bob, place the string on the center of a new suspension point to be measured and drop the bob until it just touches the floor. Measure the distance from the car's centerline to where the plumb bob points on the floor. This is the "X" distance for that particular suspension point. You can print a blank worksheet for recording your measurements by clicking on File at the upper left of the screen (in the Menu Bar), then clicking on Print Blank Worksheet. Be sure you have first selected the correct Suspension Type (Double A Arm, McPherson Strut, etc) by clicking on Suspension Type in the Menu Bar to obtain the correct worksheet for your car. Your choice of Suspension Type will have a large effect on what the Front Suspension screen looks like. Because Double A Arm is so popular, it will be discusses first. The other suspension types are discussed only as to what inputs are different than the Double A Arm inputs.
(C) Performance Trends Inc 1999 Circle Track Analyzer Chapter 2 Definitions
29
Figure 2.12, Finding Car Centerline and Measuring Front Suspension Points (typical X and Height measurement shown for Lower Frame Pivot)
Car Centerline Preferred method is to use center of engine crankshaft
Height
X
Half the distance betweenthe lower arm mounts canalso be used as centerline
Alternate Car Centerline
Half the Track Width(the distance betweenthe center of the tirepatches) can also beused as the centerline.
Track Width
(C) Performance Trends Inc 1999 Circle Track Analyzer Chapter 2 Definitions
30
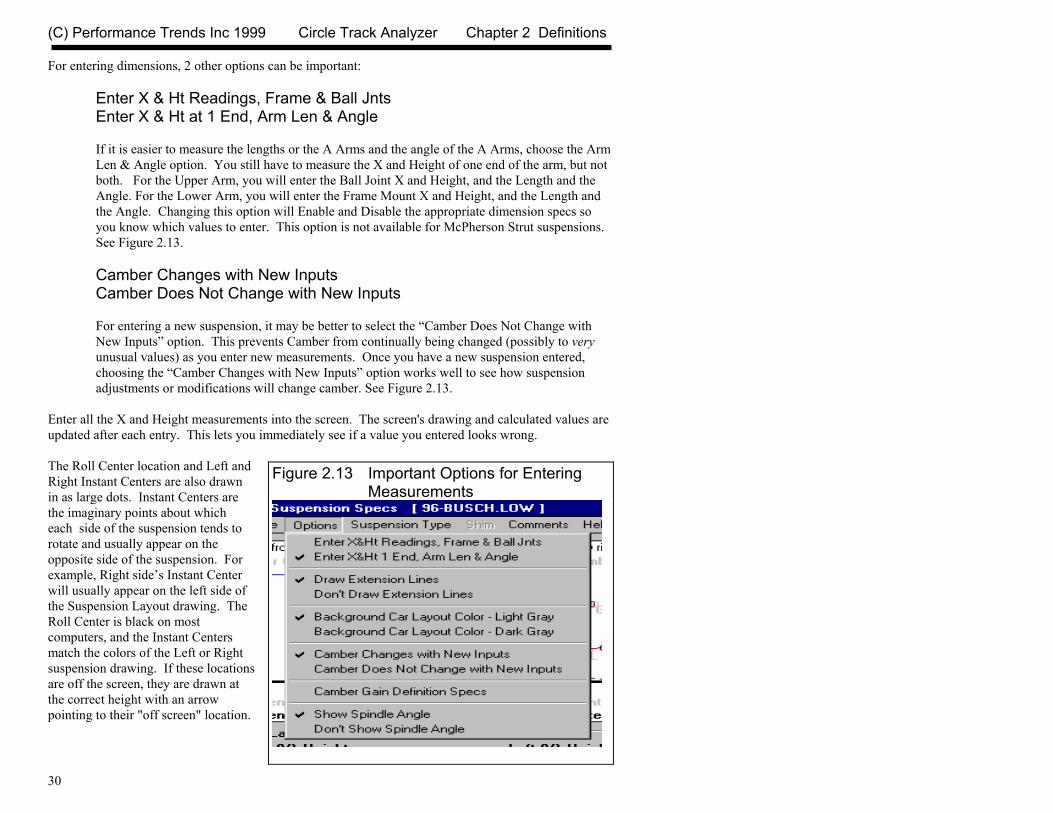
For entering dimensions, 2 other options can be important:
Enter X & Ht Readings, Frame & Ball Jnts Enter X & Ht at 1 End, Arm Len & Angle
If it is easier to measure the lengths or the A Arms and the angle of the A Arms, choose the Arm Len & Angle option. You still have to measure the X and Height of one end of the arm, but not both. For the Upper Arm, you will enter the Ball Joint X and Height, and the Length and the Angle. For the Lower Arm, you will enter the Frame Mount X and Height, and the Length and the Angle. Changing this option will Enable and Disable the appropriate dimension specs so you know which values to enter. This option is not available for McPherson Strut suspensions. See Figure 2.13.
Camber Changes with New Inputs Camber Does Not Change with New Inputs
For entering a new suspension, it may be better to select the “Camber Does Not Change with New Inputs” option. This prevents Camber from continually being changed (possibly to very unusual values) as you enter new measurements. Once you have a new suspension entered, choosing the “Camber Changes with New Inputs” option works well to see how suspension adjustments or modifications will change camber. See Figure 2.13.
Enter all the X and Height measurements into the screen. The screen's drawing and calculated values are updated after each entry. This lets you immediately see if a value you entered looks wrong. The Roll Center location and Left and Right Instant Centers are also drawn in as large dots. Instant Centers are the imaginary points about which each side of the suspension tends to rotate and usually appear on the opposite side of the suspension. For example, Right side’s Instant Center will usually appear on the left side of the Suspension Layout drawing. The Roll Center is black on most computers, and the Instant Centers match the colors of the Left or Right suspension drawing. If these locations are off the screen, they are drawn at the correct height with an arrow pointing to their "off screen" location.
Figure 2.13 Important Options for Entering Measurements
(C) Performance Trends Inc 1999 Circle Track Analyzer Chapter 2 Definitions
31
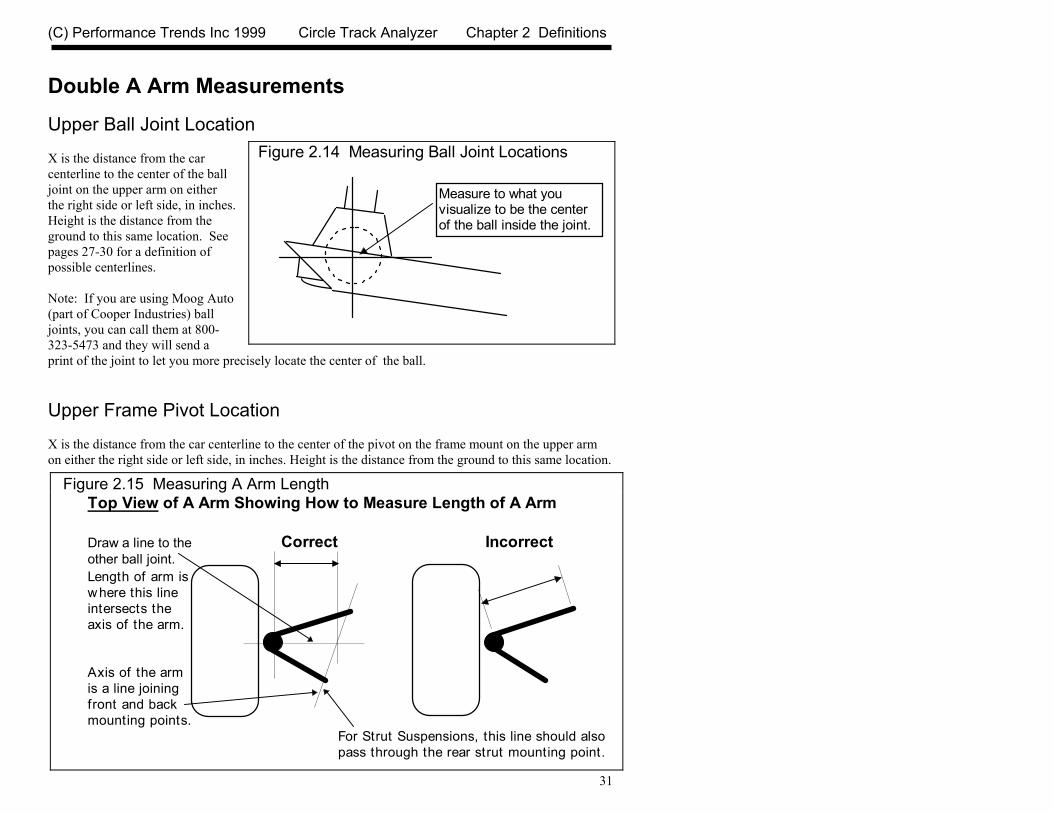
Double A Arm Measurements Upper Ball Joint Location X is the distance from the car centerline to the center of the ball joint on the upper arm on either the right side or left side, in inches. Height is the distance from the ground to this same location. See pages 27-30 for a definition of possible centerlines. Note: If you are using Moog Auto (part of Cooper Industries) ball joints, you can call them at 800-323-5473 and they will send a print of the joint to let you more precisely locate the center of the ball. Upper Frame Pivot Location X is the distance from the car centerline to the center of the pivot on the frame mount on the upper arm on either the right side or left side, in inches. Height is the distance from the ground to this same location.
Figure 2.14 Measuring Ball Joint Locations
Measure to what youvisualize to be the centerof the ball inside the joint.
Figure 2.15 Measuring A Arm Length
Top View of A Arm Showing How to Measure Length of A Arm
Draw a line to the Correct Incorrectother ball joint.Length of arm iswhere this lineintersects theaxis of the arm.
Axis of the armis a line joiningfront and backmounting points. For Strut Suspensions, this line should also pass through the rear strut mounting point.

(C) Performance Trends Inc 1999 Circle Track Analyzer Chapter 2 Definitions
32
See pages 27-30 for a definition of possible centerlines. For arms that have angled mounts as many stock arms do or strut mounts, check Figure 2.15 for the most accurate way to find the arm’s mounting point. See Appendix 5 for a new feature that makes it easier and more accurate to determine exactly where the Frame Mounts should be measured. Lower Ball Joint Location X is the distance from the car centerline to the center of the ball joint on the lower arm on either the right side or left side, in inches. Height is the distance from the ground to this same location. See pages 27-30 for a definition of possible centerlines. Lower Frame Pivot Location X is the distance from the car centerline to the center of the pivot on the frame mount on the lower arm on either the right side or left side, in inches. Height is the distance from the ground to this same location. See pages 27-30 for a definition of possible centerlines. Upper Spring Pad Location X is the distance from the car centerline to the center of the upper mounting pad for the spring, in inches. Height is the distance from the ground to this same location. See pages 27-30 for a definition of possible centerlines. Tip: If you are more interested in shock travel than spring travel, enter the top shock mount location. However, the Wheel Rate calculated from the Spring Rate you enter in the Other Specs section will not be exactly correct. Lower Spring Pad Location X is the distance from the car centerline to the center of the mounting pad for the spring on lower right arm, in inches. Height is the distance from the ground to this same location. See pages 27-30 for a definition of possible centerlines. Tip: If you are more interested in shock travel than spring travel, enter the lower shock mount location. However, the Wheel Rate calculated from the Spring Rate you enter in the Other Specs section will not be exactly correct.
(C) Performance Trends Inc 1999 Circle Track Analyzer Chapter 2 Definitions
33
Upper Arm Length Length of upper right arm from Pivot Center to Ball Joint center as viewed from the front, in inches. This can be shorter than actual length measured along the arm if arm is swept forward or back. See Figure 2.15. This spec is only enabled if you have chosen the ‘Enter X & Ht at 1 End, Arm Len & Angle’ option. Upper Arm Angle Angle of the upper left arm as viewed from the front, in degrees. A positive angle means the arm angles up as the arm goes away from the car centerline, which is typical. Lower Arm Length Lower Arm Angle See Upper Arm Length and Upper Arm Angle explanations above.
McPherson Strut You can select a McPherson Strut front suspension layout by clicking on Suspension Type at the top of the Front Suspension screen, then selecting McPherson Strut. The screen will change somewhat. The Upper Ball Joint and Frame Pivot inputs are changed to Upper and Lower Strut locations. The calculated Upper Arm Dim. specs have been changed to Strut Dim. For inputs not shown in this section, see the definitions in the previous Double A Arm section.
(C) Performance Trends Inc 1999 Circle Track Analyzer Chapter 2 Definitions
34
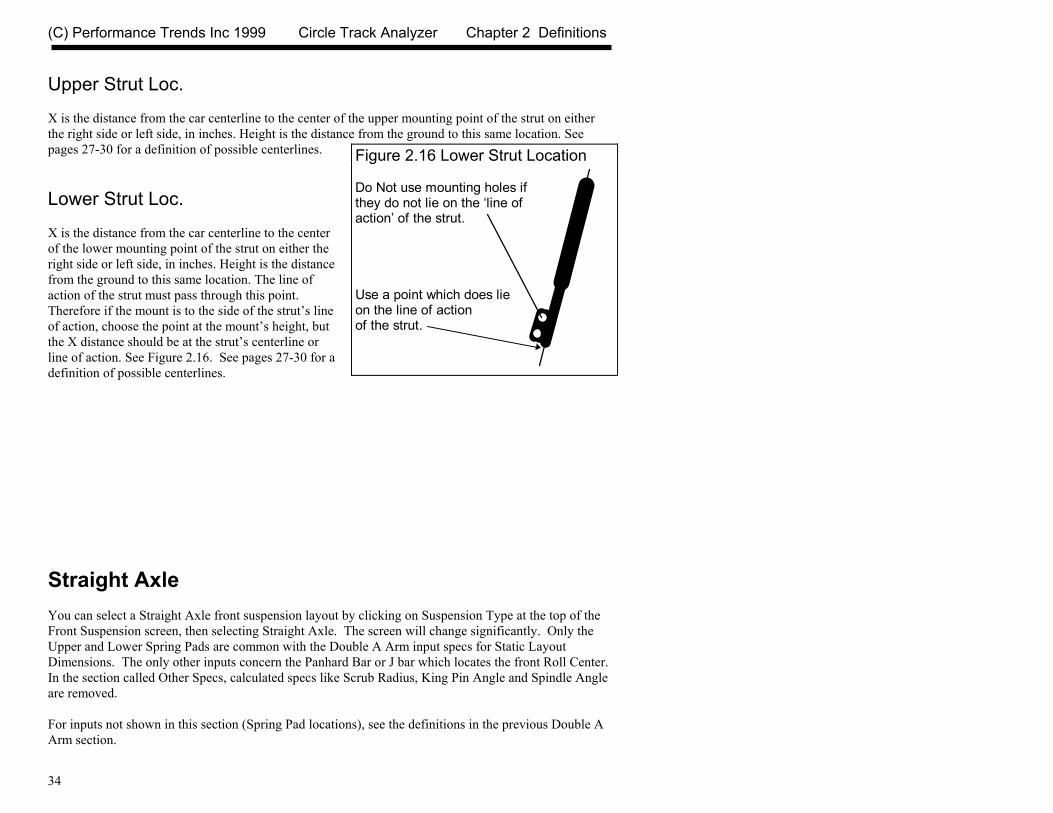
Upper Strut Loc. X is the distance from the car centerline to the center of the upper mounting point of the strut on either the right side or left side, in inches. Height is the distance from the ground to this same location. See pages 27-30 for a definition of possible centerlines. Lower Strut Loc. X is the distance from the car centerline to the center of the lower mounting point of the strut on either the right side or left side, in inches. Height is the distance from the ground to this same location. The line of action of the strut must pass through this point. Therefore if the mount is to the side of the strut’s line of action, choose the point at the mount’s height, but the X distance should be at the strut’s centerline or line of action. See Figure 2.16. See pages 27-30 for a definition of possible centerlines.
Straight Axle You can select a Straight Axle front suspension layout by clicking on Suspension Type at the top of the Front Suspension screen, then selecting Straight Axle. The screen will change significantly. Only the Upper and Lower Spring Pads are common with the Double A Arm input specs for Static Layout Dimensions. The only other inputs concern the Panhard Bar or J bar which locates the front Roll Center. In the section called Other Specs, calculated specs like Scrub Radius, King Pin Angle and Spindle Angle are removed. For inputs not shown in this section (Spring Pad locations), see the definitions in the previous Double A Arm section.
Figure 2.16 Lower Strut Location
Do Not use mounting holes ifthey do not lie on the ‘line ofaction’ of the strut.
Use a point which does lieon the line of actionof the strut.
(C) Performance Trends Inc 1999 Circle Track Analyzer Chapter 2 Definitions
35
Panhard Bar X is the distance from the car centerline to the center of the Panhard Bar mounting points on either the right side or left side, in inches. Height is the distance from the ground to this same location. See pages 27-30 for a definition of possible centerlines. Panhard Bar is Attached to Axle on Which Side: Select the option which identifies which side (end) of the Panhard bar (or J bar) is attached to the straight axle. The other end is then attached to the body.
Double A Arm with Torsion Bars You can select a Double A Arm with Torsion Bars front suspension layout by clicking on Suspension Type at the top of the Front Suspension screen, then selecting Double A Arm with Torsion Bars. The screen will change somewhat. The Spring Pad specs are removed from the Static Layout Dimensions. In the section called Other Specs, calculated specs like Spring Length and Spring Angle are removed, and the Spring Rate input is changed to T. Bar Rate (torsion bar rate).
Note that Torsion Bar Rate can be calculated by clicking on the Clc button next to these inputs. See Section 2.7.9. Torsion Bar Rate depends on the bar and the lower A arm length. Should you calculate a Torsion Bar Rate for a certain lower A arm length, then change dimensions to simulate a different arm length, the program will automatically adjust the Torsion Bar rate for what it would be assuming the same bar is used with the new arm length. However, this may not be what you want to be simulating. Therefore, it is best that you completely layout all the Static Layout Dimensions first. Then calculate the Torsion Bar Rate or enter the rate directly.
For inputs not shown in this section, see the definitions in the previous Double A Arm section.

(C) Performance Trends Inc 1999 Circle Track Analyzer Chapter 2 Definitions
36
T Bar Rate Is the force required to move the ball joint on the lower arm 1 inch, in pounds. The torsion bar is assumed to be linear, that is if 500 lbs compresses the spring (twists the bar) 1", 1000 lbs will compress (twists the bar) the spring 2". See Assumptions in Appendix 1 for limits on bar/spring movement. Click on the Clc button next to these specs to calculate a spring rate (or Torsion Bar Rate from other inputs). See Section 2.7.9.
2.4.2 Other Specs Spring Length Installed or Static length of the spring measured along spring centerline before any Dive or Roll. You can not enter this value directly. This length is calculated from the X and Height for the Upper and Lower Spring Pad Locations. This value is useful to check that your X and Height measurements are entered correctly, as it should closely match your installed spring length. Spring Angle Installed angle of spring measured between spring centerline and vertical, in degrees. You can not enter this value directly. This angle is calculated from the X and Height for the Upper and Lower Spring Pad Locations. This value is useful to check that your X and Height measurements are entered correctly, as it should closely match your installed spring angle. Spring Rate (T. Bar Rate for Torsion Bar Suspensions) Is the force required to compress the uninstalled spring 1 inch, in pounds. The spring is assumed to be linear, that is if 500 lbs compresses the spring 1", 1000 lbs will compress the spring 2". This is an input which you enter and effects the Wheel Rate described below. Click on the Clc button next to these specs to calculate a spring
Figure 2.17 Other Dimensions & Specs Section of Main Screen

(C) Performance Trends Inc 1999 Circle Track Analyzer Chapter 2 Definitions
37
rate (or Torsion Bar Rate from other inputs). See Section 2.7.9. Also see Double A Arm with Torsion Bars suspension type on previous page, and Assumptions in Appendix 1 for limits on bar/spring movement. Wheel Rate The force required to move wheel center 1 inch up while the chassis does not move, in pounds. This is a calculated spec (can not be entered directly) and depends on the Spring Rate and suspension geometry. Scrub Radius The distance from where the king pin axis hits the ground and the center of the tire patch. See Figure 2.18 for King Pin Axis. This is a calculated spec (can not be entered directly). Camber The degrees of tilt of the wheel with respect to the ground as viewed from the front, in degrees. Negative camber means the top of the wheel tilts in towards the car, which is typical of most race cars. This is an input which you enter. See Figure 2.18. Dynamic Camber The new, Dynamic camber of the wheel caused by Dive and Roll. See Camber above. Track, in Track is the distance from the centerline to the center of the tire patch on the ground.
Figure 2.18 Illustration of Camber, King Pin Axis and Scrub Radius Camber AngleVertical (negative angle shown here)
Spindle Angle
King Pin Axis
Scrub Radius
(C) Performance Trends Inc 1999 Circle Track Analyzer Chapter 2 Definitions
38
King Pin Angle King pin axis is the line intersecting the upper and lower ball joints. The angle is the angle between this axis and a vertical line. See Figure 2.18. This is a calculated spec (can not be entered directly). Spindle Angle Spindle Angle is the angle total of the king pin angle and the camber angle. As long as you are using the same spindles, the spindle angle must stay the same as you change arm lengths, mounting points or shim the arms in and out. Spindle Angle is not displayed unless you have selected the Front Suspension option of “Show Spindle Angle”. See Figure 2.18 Roll Bar Rate Is the force required to move one arm of the roll bar 1 inch, in pounds, while the other arm does not move. The bar is assumed to be linear, that is if 500 lbs moves the arm 1", 1000 lbs will move the arm 2". This is an input which you enter and effects the vehicle’s roll stiffness. Click on the Clc button next to this spec to calculate a Roll Bar Rate. See Section 2.7.10. Roll Bar Length Is the length of the roll bar in inches. This length tells the program where the bar attaches to the lower arms, and therefore lets the program determine the motion ratio of the bar
2.4.3 Show Dive & Roll As shown in Figure 2.19, you must first select the Yes option in this section before any of these inputs or command buttons become enabled.

(C) Performance Trends Inc 1999 Circle Track Analyzer Chapter 2 Definitions
39
Dive The amount the car's front end drops compared to its static (standing still) height. To simulate the front end rising, enter a negative (-) number. Roll The amount the car's front end rolls (leans) due to cornering forces, compared to its static (standing still) angle. A positive (+) angle means the car is leaning to the Right, typical of Left turns. Use a negative (-) number to lean Left (Right turns). Draw ‘Big’ This command button lets you select a screen mode where the Suspension Layout is drawn about twice its normal size. In this mode you can see things in more detail. The Draw ‘Big’ mode also displays Spring Deflection, which is not displayed in the Normal Sized screen. Spring Deflection The change in the length of the spring due to Dive or Roll. Negative (-) means spring compression from diving, positive (+) means elongation from rising. Since shocks generally are mounted close to the spring locations, shock travel is very similar to Spring Deflection.
Figure 2.19 Roll & Dive Options
Choose the Yes option to enable Dive and Roll Type in Dive and/or Roll here,
Or click on Arrow buttons to increment automatically
Click here to draw layout big and show spring compression
(C) Performance Trends Inc 1999 Circle Track Analyzer Chapter 2 Definitions
40
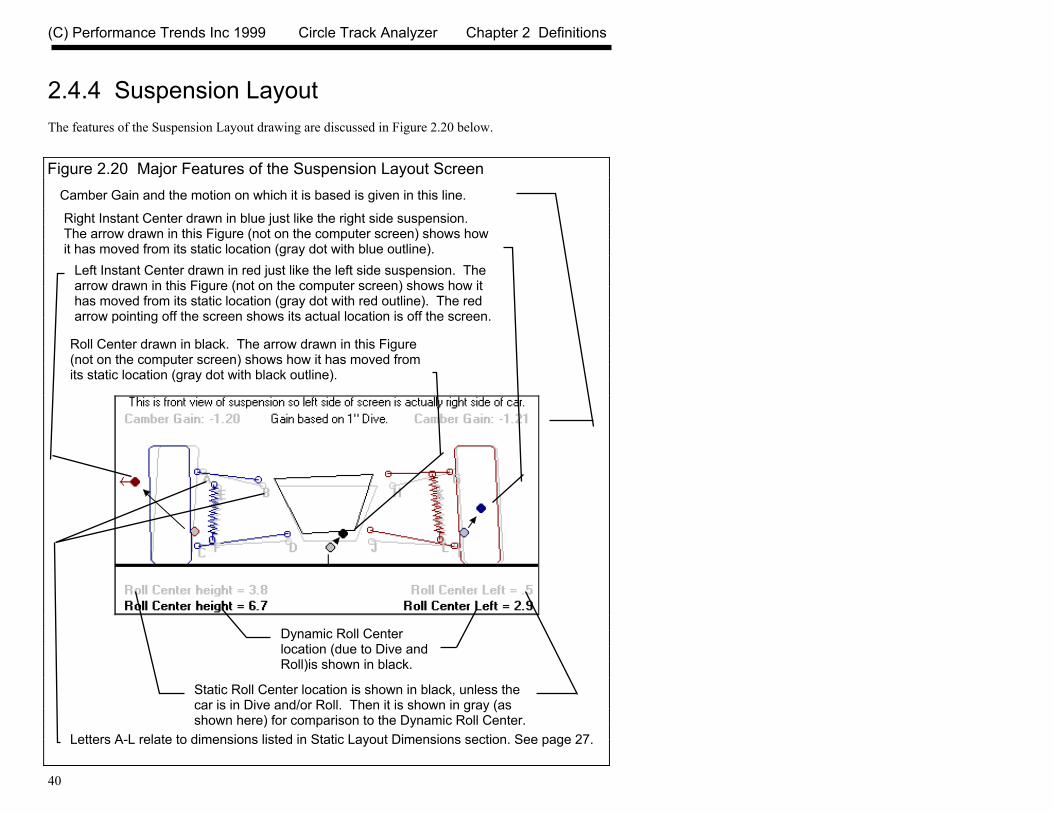
2.4.4 Suspension Layout The features of the Suspension Layout drawing are discussed in Figure 2.20 below.
Figure 2.20 Major Features of the Suspension Layout Screen
Dynamic Roll Center location (due to Dive and Roll)is shown in black.
Static Roll Center location is shown in black, unless the car is in Dive and/or Roll. Then it is shown in gray (as shown here) for comparison to the Dynamic Roll Center.
Camber Gain and the motion on which it is based is given in this line.
Right Instant Center drawn in blue just like the right side suspension. The arrow drawn in this Figure (not on the computer screen) shows how it has moved from its static location (gray dot with blue outline).
Left Instant Center drawn in red just like the left side suspension. The arrow drawn in this Figure (not on the computer screen) shows how it has moved from its static location (gray dot with red outline). The red arrow pointing off the screen shows its actual location is off the screen.
Roll Center drawn in black. The arrow drawn in this Figure (not on the computer screen) shows how it has moved from its static location (gray dot with black outline).
Letters A-L relate to dimensions listed in Static Layout Dimensions section. See page 27.
(C) Performance Trends Inc 1999 Circle Track Analyzer Chapter 2 Definitions
41
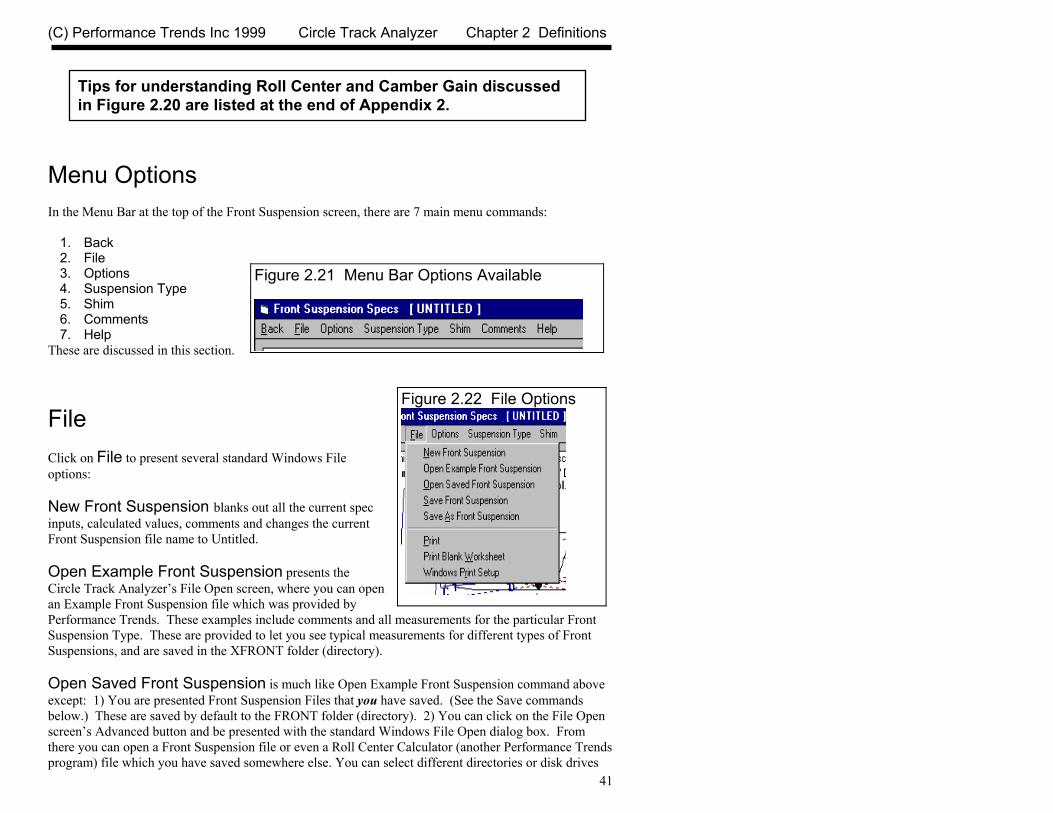
Tips for understanding Roll Center and Camber Gain discussed in Figure 2.20 are listed at the end of Appendix 2.
Menu Options In the Menu Bar at the top of the Front Suspension screen, there are 7 main menu commands:
1. Back 2. File 3. Options 4. Suspension Type 5. Shim 6. Comments 7. Help
These are discussed in this section.
File Click on File to present several standard Windows File options: New Front Suspension blanks out all the current spec inputs, calculated values, comments and changes the current Front Suspension file name to Untitled. Open Example Front Suspension presents the Circle Track Analyzer’s File Open screen, where you can open an Example Front Suspension file which was provided by Performance Trends. These examples include comments and all measurements for the particular Front Suspension Type. These are provided to let you see typical measurements for different types of Front Suspensions, and are saved in the XFRONT folder (directory). Open Saved Front Suspension is much like Open Example Front Suspension command above except: 1) You are presented Front Suspension Files that you have saved. (See the Save commands below.) These are saved by default to the FRONT folder (directory). 2) You can click on the File Open screen’s Advanced button and be presented with the standard Windows File Open dialog box. From there you can open a Front Suspension file or even a Roll Center Calculator (another Performance Trends program) file which you have saved somewhere else. You can select different directories or disk drives
Figure 2.21 Menu Bar Options Available
Figure 2.22 File Options

(C) Performance Trends Inc 1999 Circle Track Analyzer Chapter 2 Definitions
42
for files. You can choose most any file, but if the program senses the file is not a Front Suspension or Roll Center Calculator file, you will be given notice and the file will not be opened. Save saves the current Front Suspension specs to the current file name. This is a shortcut to update the current file with the current specs and measurements. Save As presents the standard Circle Track Analyzer Save screen, where you can save the file to most any name of your choosing. Save As is how you change the name of a Front Suspension file. At this screen you can also click on the Advanced button which presents a standard Windows File Open dialog box (not shown in Beginner Level). Then you can save a Front Suspension file to a name of your choosing. Certain names are not acceptable, including:
• Names with more than 3 characters to the right or 8 characters to the left of a period (.) . • Names over 11 characters long (12 characters if one is a period). • Names which include the characters: / \ [ ] : | < > + = ; , * ? or spaces
You can also select different directories or disk drives for saving files. Print prints the Front Suspension Screen. Print Blank Worksheet prints the Front Suspension screen with blank boxes for all inputs. Windows Print Setup opens the standard Windows menu for selecting the printer, page orientation, etc. Options Click on Options for the list shown in Figure 2.23. Enter X & Ht Readings, Frame & Ball Jnts Enter X & Ht at 1 End, Arm Len & Angle If it is easier to measure the lengths or the A Arms and the angle of the A Arms, choose the Arm Len & Angle option. You still have to measure the X and Height of one end of the arm, but not both. For the Upper Arm, you will enter the Ball Joint X and Height, and the Length and the Angle. For the Lower Arm, you will enter the Frame Mount X and Height, and the Length and the Angle. Changing this option will Enable and Disable the appropriate dimension specs so you know which values to enter. This ‘Len & Angle’ option is not available for McPhErson Strut suspensions. For more details, see the Example 4.3.

(C) Performance Trends Inc 1999 Circle Track Analyzer Chapter 2 Definitions
43
Draw Extension Lines Don’t Draw Extension Lines Lets you choose if imaginary extension lines should be drawn in the Suspension Layout. These extension lines help show how the Instant Centers and Roll Center are arrived at. Background Car Layout Color - Light Gray Background Car Layout Color - Dark Gray Lets you select the color for the background car and suspension drawing in the Layout screen. The Background Car shows the static position of the suspension and car before any Dive and/or Roll. Camber Changes with New Inputs Camber Does Not Change with New Inputs For entering a new suspension, it may be better to select the “Camber Does Not Change with New Inputs” option. This prevents Camber from continually being changed (possibly to very unusual values) as you enter new measurements. Once you have a new suspension entered, choosing the “Camber Changes with New Inputs” option works well to see how suspension adjustments or modifications will change tire camber. Camber Gain Definition Specs Click on this option and you get the menu of Figure 2.24. This menu lets you change the amount of body movement the program uses to determine Camber Gain.
Figure 2.23 Main Screen Options Menu
Figure 2.24 Camber Gain Specs Menu
(C) Performance Trends Inc 1999 Circle Track Analyzer Chapter 2 Definitions
44
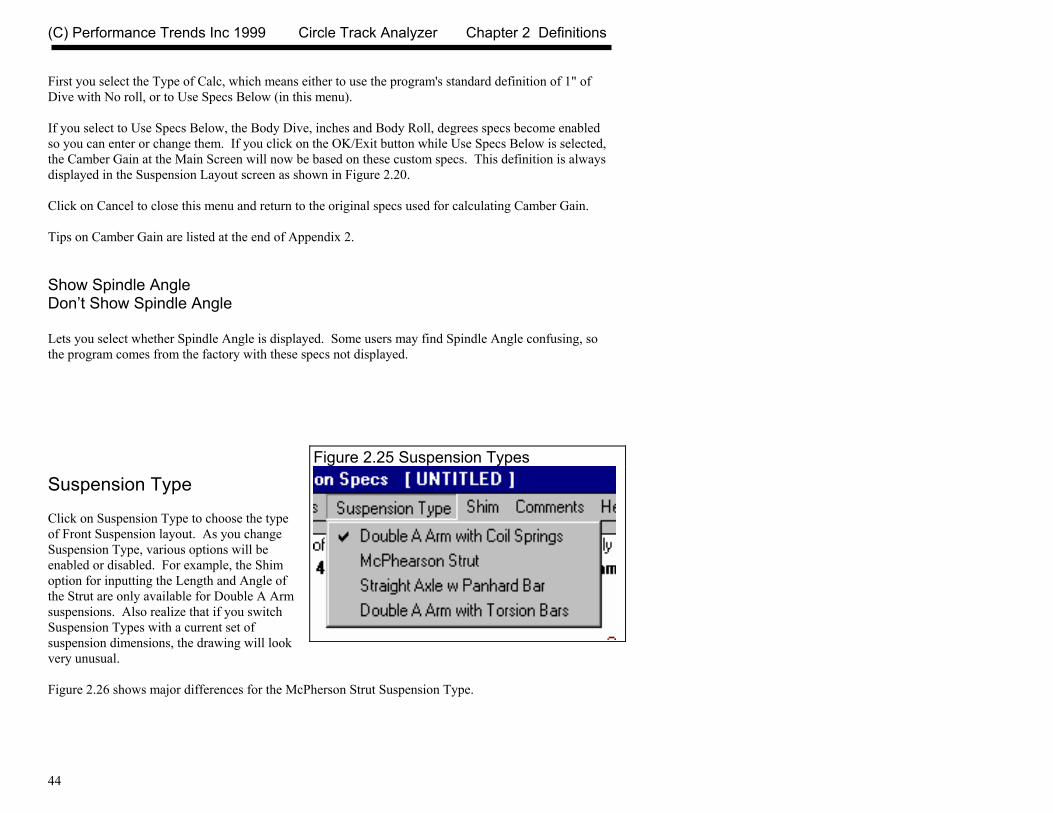
First you select the Type of Calc, which means either to use the program's standard definition of 1" of Dive with No roll, or to Use Specs Below (in this menu). If you select to Use Specs Below, the Body Dive, inches and Body Roll, degrees specs become enabled so you can enter or change them. If you click on the OK/Exit button while Use Specs Below is selected, the Camber Gain at the Main Screen will now be based on these custom specs. This definition is always displayed in the Suspension Layout screen as shown in Figure 2.20. Click on Cancel to close this menu and return to the original specs used for calculating Camber Gain. Tips on Camber Gain are listed at the end of Appendix 2. Show Spindle Angle Don’t Show Spindle Angle Lets you select whether Spindle Angle is displayed. Some users may find Spindle Angle confusing, so the program comes from the factory with these specs not displayed. Suspension Type Click on Suspension Type to choose the type of Front Suspension layout. As you change Suspension Type, various options will be enabled or disabled. For example, the Shim option for inputting the Length and Angle of the Strut are only available for Double A Arm suspensions. Also realize that if you switch Suspension Types with a current set of suspension dimensions, the drawing will look very unusual. Figure 2.26 shows major differences for the McPherson Strut Suspension Type.
Figure 2.25 Suspension Types

(C) Performance Trends Inc 1999 Circle Track Analyzer Chapter 2 Definitions
45
Shim Click on Shim when this option is enabled, and then select from the choices of shimming the left or right arm You are then presented with the menu shown in Figure 2.27. This menu lets you move the Frame Pivot point of the upper A arm in or out, as is usually done by adding or removing shims. The software keeps the length of the arm constant and calculates where the Ball Joint end will be after the adjustment.
Figure 2.26 McPherson Strut Suspension Type
Camber Gain Definition is always shown here
Struts replace the arms drawn for the Double A Arm suspension type.
Strut dimensions replace the Upper Arm dimensions here also. The Shim option or inputing the Length and Angle of the Strut are not available for this suspension type.

(C) Performance Trends Inc 1999 Circle Track Analyzer Chapter 2 Definitions
46
First, select whether you want to Add or Remove shims from the first Combo box. Then select whether you want to use standard sixteenth (1/16) and eighth (1/8) inch shims, or to enter some other 'Custom' shim adjustment. After your selection, the lower inputs will become enabled as appropriate. Selecting 'No Shims' disables the lower inputs. An estimate of the new Camber is given at the top for the shim adjustment currently entered, with the Current Camber also given for comparison. (If you have Not selected the option at the Main Screen that Camber should be adjusted with changing dimensions, you will be asked if you want Camber to be adjusted before it is.) The entries and suspension layout on the Main Screen are not updated until you click on 'Use Calc Value'.
Important: This menu assumes that Adding shims moves the Frame Pivot farther out from the car (reducing negative camber or increasing positive camber). Some chassis (for example: the left side on some Lefthander Chassis) work the opposite, adding shims moves the pivot inward. If your chassis is like this, select 'Remove Shims' if you are actually adding shims or 'Add Shims' if you are actually removing shims.
Figure 2.27 Shimming Menu for Right Side
(C) Performance Trends Inc 1999 Circle Track Analyzer Chapter 2 Definitions
47
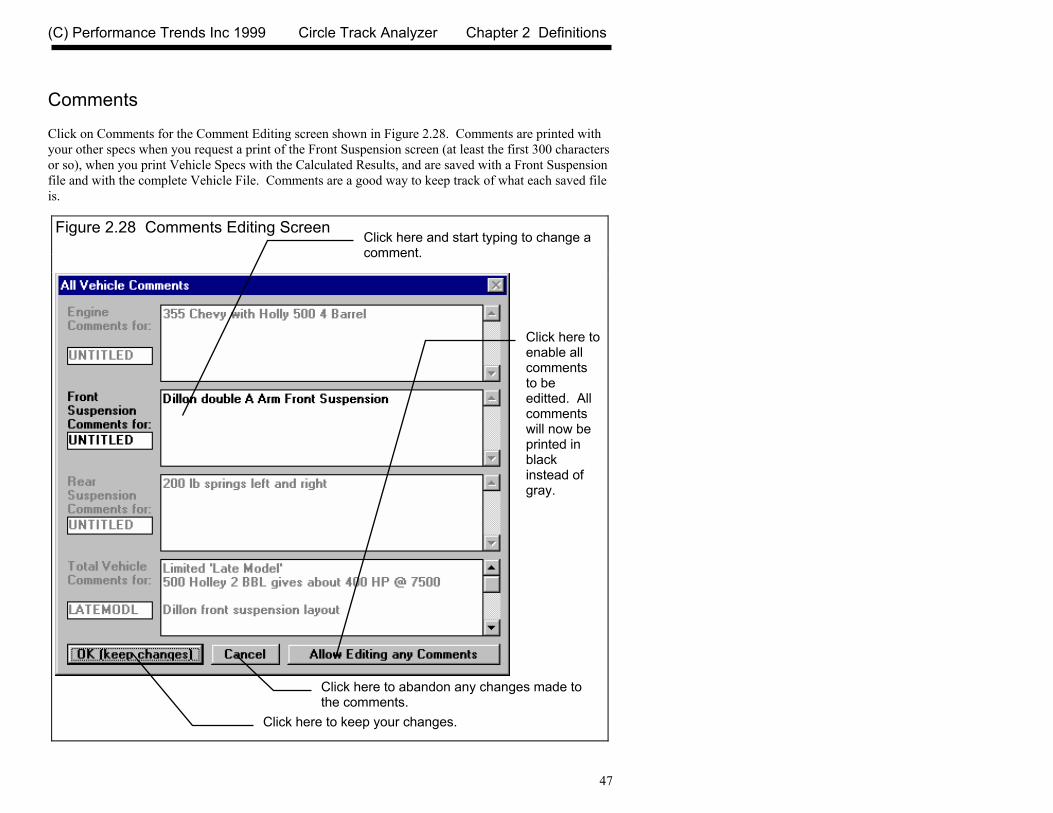
Comments Click on Comments for the Comment Editing screen shown in Figure 2.28. Comments are printed with your other specs when you request a print of the Front Suspension screen (at least the first 300 characters or so), when you print Vehicle Specs with the Calculated Results, and are saved with a Front Suspension file and with the complete Vehicle File. Comments are a good way to keep track of what each saved file is.
Figure 2.28 Comments Editing Screen
Click here and start typing to change a comment.
Click here to enable all comments to be editted. All comments will now be printed in black instead of gray.
Click here to abandon any changes made to the comments.
Click here to keep your changes.

(C) Performance Trends Inc 1999 Circle Track Analyzer Chapter 2 Definitions
48
2.5 Rear Suspension Specs The Rear Suspension menu is similar to the Front Suspension screen described in Section 2.4, but is simpler. It describes the Rear Suspension layout and measurements. The top choice of Rear Suspension Type has a large effect on how this screen looks and what measurements can be entered. Check Appendix 4 for new Rear Suspension types, like Angled 4 Link.
Figure 2.29 Rear Suspension Screen for Suspension Type: Truck Arms
Type is a critical spec which dictates what this screen looks like and what inputs are used.
Menu Commands
Name of current Rear Suspension File
Help box gives brief description of spec you have clicked on.
Layout screen shows how program is using your measurements. This is handy way to spot errors in inputs. Screen also shows calculated results like Wheel Rates and Roll Center Location.
(C) Performance Trends Inc 1999 Circle Track Analyzer Chapter 2 Definitions
49
Taking Suspension Measurements You make measurements and enter them into this screen much as you do for the Front Suspension. Start by parking the car on a flat, level surface. First we must decide on what we will call the car’s centerline. Many people use a distance half way between the left and right tire patches. The disadvantage of this method is if you change rim widths or wheel offsets your centerline can change. This means all your measurements are now off also. Therefore, we usually recommend the center of the drivetrain, which would be the center of the engine for most car’s front suspensions. This is a point which will usually will stay in one place. The other advantage of this choice is the front suspension’s centerline is now the center of the engine. This ensures consistency front and rear for most race cars, and provides an easy reference for most left and right measurements. On cars without a front engine, rear drive drivetrain layout, use the distance half way between the frame rails, or the frame mounts on the lower arms. Then be sure to project a line straight back, parallel to the frame to mark the rear centerline for the rear suspension. You can also use the center of the front tire patches, being aware of the problem if you change some tire offset specs. Once you’ve decided on the method, either: • Drop a plumb bob (pointed weight on a string) down from the center of the driveshaft or pinion gear. • Use a tape measure to mark a point on the floor which is halfway between the your references. This will now be your car’s centerline. All measurements asking for a distance from something to Centerline is a measurement from this centerline our to either the left or the right. For example, Tire to Centerline is the distance from the center of the tire patch on the ground to the car’s centerline.
When picking a centerline, the most important thing is to be consistent from front and rear on the same vehicle, from setup to setup on the same vehicle, and from vehicle to vehicle. Once you decide on a centerline for a particular car, you must make all measurements from this same centerline.
With the plumb bob, place the string on the center of a new suspension point to be measured and drop the bob until it just touches the floor. Measure the distance from the car's centerline to where the plumb bob points on the floor. This is the distance to Centerline for that particular suspension point. You can print a blank worksheet for recording your measurements by clicking on File at the upper left of the screen (in the Menu Bar), then clicking on Print Blank Worksheet. Be sure you have first selected the correct suspension Type (Trailing Arms, Leaf Springs, etc) by clicking on Type at the top of the inputs to obtain the correct worksheet for your car.

(C) Performance Trends Inc 1999 Circle Track Analyzer Chapter 2 Definitions
50
Trailing Arm / Truck Arm Measurements
Figure 2.30 Trailing Arm Rear Suspension Layout
Axle to Front Pivot
Spring to Centerline
Spring to Axle (positive direction, ahead of axle)
Spring to Axle (negative direction, behind axle)
Tire to Centerline
Pnhd Bar to Centerline
Spring Angle
Panhard Bar Heights
Calculated Wheel Rates
Roll Center Location
Drawn Roll Center (black dot)
(C) Performance Trends Inc 1999 Circle Track Analyzer Chapter 2 Definitions
51
Type Click on down arrow button to pick a type of Rear Suspension Layout. Your choice here will have a large effect on how this screen looks and what measurements can be entered. Truck Arms are nearly identical to Trailing Arms except they are usually longer, and they angle in toward the center of the car, usually pointing toward the transmission. Spring Rate Force required to compress the uninstalled spring 1 inch, in pounds. The spring is assumed linear, that if 500 lbs compress the spring 1", 1000 lbs will compress the spring 2". Click on the Clc button to calculate spring rate for either a coil spring, leaf spring or torsion bar. See Section 2.7.9. See Appendix 1 for limits of spring movement. Tire to Centerline, in Distance from car centerline to center of tire patch on the ground, inches. For ease of consistent measurements for front and rear, use the center of the drivetrain (engine, trans, rear axle) as the car's centerline. Spring to Centerline, in Distance from car centerline to center of the spring mount pad, in inches. For ease of consistent measurements for front and rear, use the center of the drivetrain (engine, trans, rear axle) as the car's centerline. Spring Angle, deg Installed angle of spring measured between spring centerline and vertical, in degrees. Positive angles tip in toward car centerline at top. Spring to Axle, in Distance from axle centerline to center of the spring mount pad, in inches. If the spring is behind the axle, enter a negative (-) number.

(C) Performance Trends Inc 1999 Circle Track Analyzer Chapter 2 Definitions
52
Front Pivot to Axle, in Distance from axle centerline to attachment point of the trailing arm on the body, in inches. Pnhd Bar to Centerline, in Distance from car centerline to the Pan Hard bar (or J bar) pivots on the frame, in inches. For ease of consistent measurements for front and rear, use the center of the drivetrain (engine, trans, rear axle) as the car's centerline. Panhard Bar Heights, in Distance from ground to the Pan Hard bar (or J bar) pivots on the frame, in inches.
Leaf Springs If you select Leaf Springs, the Spring Rates and Tire to Centerline are the same as described in the Trailing Arm / Truck Arm section, except you would enter the spring rate calculated for a leaf spring. With Leaf Springs, only measurements from one side are used because the program assumes leaf spring suspensions are symmetrically laid out (same measurements left and right). However, you can still specify a different spring rate and tire track left and right. Spring to Centerline Distance from the center of the leaf spring to the centerline of the car in inches. Spring Front to Axle Distance from axle centerline forward to the leaf spring front mount on the frame, in inches. Spring Front Height Distance from the leaf spring’s front mount down to the ground, in inches.

(C) Performance Trends Inc 1999 Circle Track Analyzer Chapter 2 Definitions
53
Spring Rear to Axle Distance from axle centerline back to the leaf spring’s shackles rear mount on the frame, in inches.
Figure 2.31 Leaf Spring Measurements
Spring to Centerline
Spring Front to Axle
Spring Rear to Axle
Roll Center
Spring Rear Height (measure to where shackles attach to frame)
Spring Front Height

(C) Performance Trends Inc 1999 Circle Track Analyzer Chapter 2 Definitions
54
Spring Rear Height Distance from the leaf spring’s shackles rear mount on the frame, in inches.
Torsion Bars If you select Trailing Arm/Torsion Bars/Panhard Bar for a Suspension Type, the layout is very similar to the Trailing Arm / Truck Arm shown in Figure 2.30. The only difference is the round coil spring is drawn as a torsion bar with an arm the rests on the axle. The input Spring Rate is switched to T.Bar Rates, lb/in. T.Bar Rates, lb/in The spring rate of the Torsion Bar with its lever arm. This can be calculated by clicking on the Clc button, as described in Section 2.7.9. Note that if the effective length of the lever arm changes, the Torsion Bar rate also changes. This includes just moving the torsion bar closer or farther from the axle. T.Bar Arm to Centerline The distance from the center of where the Torsion Bar’s arm rests on the axle housing to the car’s centerline, in inches. See Figure 2.32.
Jacob’s Ladder If you select Trailing Arm/Torsion Bars/Jacobs Ladder for a Suspension Type, the layout is similar to the Trailing Arm / Truck Arm shown in Figure 2.30. The 3 major differences are:
1. The round coil spring is drawn as a torsion bar with an arm the rests on the axle. 2. The input Spring Rate is switched to T.Bar Rates, lb/in. 3. The Panhard Bar (or J bar) specs are replaced by the Jacob’s Ladder inputs shown in Figure 2.32.

(C) Performance Trends Inc 1999 Circle Track Analyzer Chapter 2 Definitions
55
Jacobs Ladder Layout The 2 mounting points on the 2 links of the Jacobs Ladder are identified by the letters A, B, D and E as shown in Figure 2.32. Enter the measurements for each mounting point as described below.
Figure 2.32 Torsion Bar with Jacob’s Ladder Suspension Layout
T. Bar Arm to Centerline
Roll Center Location
“To C/L” measurement for point D. Other measurements done is a similar fashion. If a point lies to the left of the centerline, enter a negative number.
“Ht” measurement for point D. Other measurements done is a similar fashion.
A
E D
B
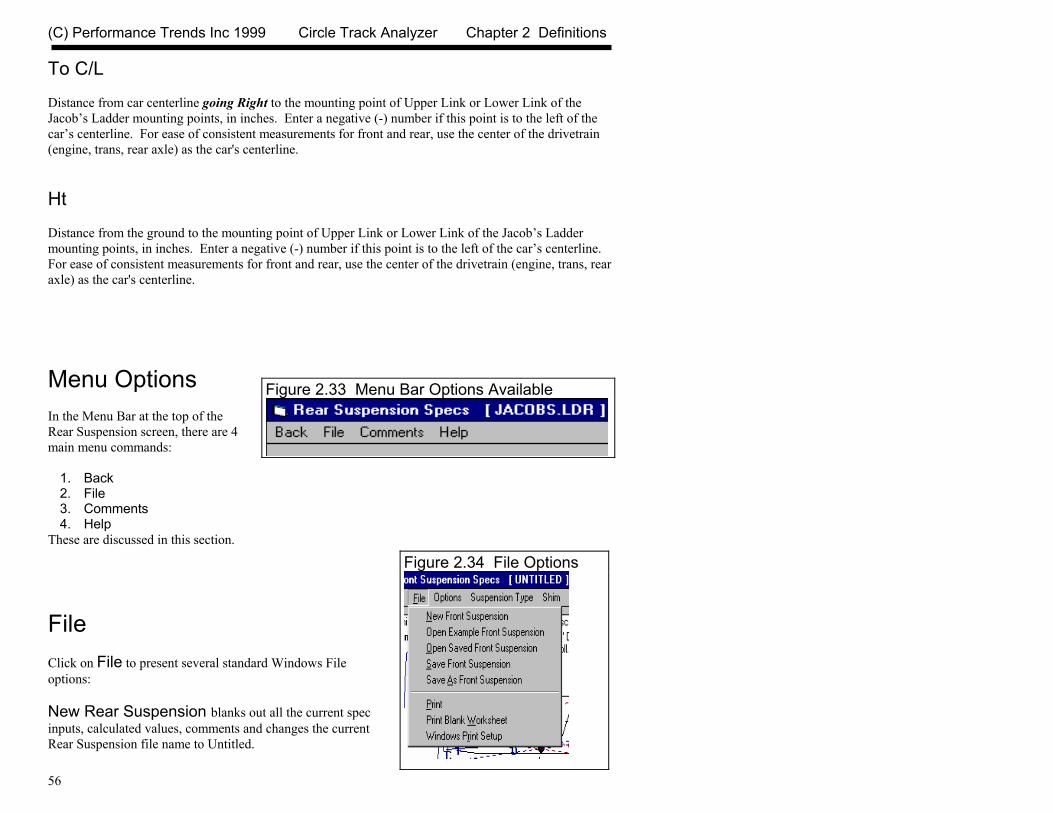
(C) Performance Trends Inc 1999 Circle Track Analyzer Chapter 2 Definitions
56
To C/L Distance from car centerline going Right to the mounting point of Upper Link or Lower Link of the Jacob’s Ladder mounting points, in inches. Enter a negative (-) number if this point is to the left of the car’s centerline. For ease of consistent measurements for front and rear, use the center of the drivetrain (engine, trans, rear axle) as the car's centerline. Ht Distance from the ground to the mounting point of Upper Link or Lower Link of the Jacob’s Ladder mounting points, in inches. Enter a negative (-) number if this point is to the left of the car’s centerline. For ease of consistent measurements for front and rear, use the center of the drivetrain (engine, trans, rear axle) as the car's centerline.
Menu Options In the Menu Bar at the top of the Rear Suspension screen, there are 4 main menu commands:
1. Back 2. File 3. Comments 4. Help
These are discussed in this section.
File Click on File to present several standard Windows File options: New Rear Suspension blanks out all the current spec inputs, calculated values, comments and changes the current Rear Suspension file name to Untitled.
Figure 2.33 Menu Bar Options Available
Figure 2.34 File Options

(C) Performance Trends Inc 1999 Circle Track Analyzer Chapter 2 Definitions
57
Open Example Rear Suspension presents the Circle Track Analyzer’s File Open screen, where you can open an Example Rear Suspension file which was provided by Performance Trends. These examples include comments and all measurements for the particular Rear Suspension Type. These are provided to let you see typical measurements for different types of Rear Suspensions, and are saved in the XREAR folder (directory). Open Saved Rear Suspension is much like Open Example Rear Suspension command above except: 1) You are presented Rear Suspension Files that you have saved. (See the Save commands below.) These are saved by default to the REAR folder (directory). 2) You can click on the File Open screen’s Advanced button and be presented with the standard Windows File Open dialog box. From there you can open a Rear Suspension file which you have saved somewhere else. You can select different directories or disk drives for files. You can choose most any file, but if the program senses the file is not a Rear Suspension file, you will be given notice and the file will not be opened. Save saves the current Rear Suspension specs to the current file name. This is a shortcut to update the current file with the current specs and measurements. Save As presents the standard Circle Track Analyzer Save screen, where you can save the file to most any name of your choosing. Save As is how you change the name of a Rear Suspension file. At this screen you can also click on the Advanced button which presents a standard Windows File Open dialog box (not shown in Beginner Level). Then you can save a Rear Suspension file to a name of your choosing. Certain names are not acceptable, including:
• Names with more than 3 characters to the right or 8 characters to the left of a period (.) . • Names over 11 characters long (12 characters if one is a period). • Names which include the characters: / \ [ ] : | < > + = ; , * ? or spaces
You can also select different directories or disk drives for saving files. Print prints the Rear Suspension Screen. Print Blank Worksheet prints the Rear Suspension screen with blank boxes for all inputs. Windows Print Setup opens the standard Windows menu for selecting the printer, page orientation, etc.
(C) Performance Trends Inc 1999 Circle Track Analyzer Chapter 2 Definitions
58
Comments Click on Comments for the Comment Editing screen shown in Figure 2.28 for the Front Suspension Comments. Comments are printed with your other specs when you request a print of the Rear Suspension screen (at least the first 300 characters or so), when you print Vehicle Specs with the Calculated Results, and are saved with a Front Suspension file and with the complete Vehicle File. Comments are a good way to keep track of what each saved file is.

(C) Performance Trends Inc 1999 Circle Track Analyzer Chapter 2 Definitions
59
2.6 Calculate Performance
2.6.1 Running Conditions At the Main Menu, you can calculate lap time performance by:
1. Clicking on Calculate Performance to open the Running Conditions menu, then clicking on Calculate Performance.
2. Clicking on the Calc Lap Times button at the top of the Main Menu. Figure 2.35 Running Conditions Menu
This combo box lets you select the combination of weather instruments you will use, including an altimeter.
Click on Type and you can pick a typical or specific track, or choose Use Specs Below to design your own track.
Track Specs with general layout showing how track looks
Driver Specs describe how aggressively you drive, or how close you take the car to the limits of the tire’s traction.

(C) Performance Trends Inc 1999 Circle Track Analyzer Chapter 2 Definitions
60
If you click on Calculate Performance, you will first be presented with a menu of conditions which describe how you will "run" this vehicle. These conditions include: • Weather and wind conditions. • How often to report results in the output, for example every 0.5 seconds. • Track specs like length, banking, etc. • How you drive your vehicle with respect to accelerating and braking.
Track Weather The weather conditions affect both the air's oxygen density which affects engine power, and the air's total density which affects aerodynamic drag. Many racers use their own personal “weather stations”. In these cases, be sure you read the Notes on Weather Conditions at the end of this section., page 62. Method of Recording Weather Data Click on the down arrow button of this combo box to be presented with this list of options:
• Radio/TV Report with Rel Hum • Radio/TV Report with Dew Pt • Uncorr. Baro with Rel Hum • Uncorr. Baro with Dew Pt • Pick a typical “day” . This is an easy method to use reasonable weather conditions when you
are not particularly interested in how changes weather conditions will affect performance. If you change the Method, the 4 inputs specs in the Weather section are changed or enabled/disabled as necessary to represent the new Method. In addition, all the input specs are adjusted to what they would be with the new Method. For example, Corr. Barometer of 29.3” at an elevation of 1200 feet is converted to 28.03” Obs Barometer with Elevation disabled. (Elevation is not important when you are using an uncorrected or observed barometer, as this type of barometer shows the actual air pressure at the track.) If you change from “Uncorr Baro” to Radio/TV Report with a “Corr. Baro”, the program will ask for an Elevation for the track, since this is needed to make the Barometer Correction. All these different inputs are explained below.
(C) Performance Trends Inc 1999 Circle Track Analyzer Chapter 2 Definitions
61
Barometric Pressure Corr. Barometer, ''Hg This input is used for either “Radio/TV Report with Rel Hum” or “Radio/TV Report with Dew Pt”. It is the Corrected Barometric Pressure in inches of Mercury you will hear from most any TV or radio weather report. This spec is disabled if you picked a Typical day, but will display the barometer being used. Obs. Barometer, ''Hg This input is used for either “Uncorr. Baro with Rel Hum” or “Uncorr. Baro with Dew Pt”. It is the actual or observed Barometric Pressure in inches of Mercury at the track. These barometers measure the actual air pressure at the track, and will read approximately .1 inches of mercury less than the barometric pressure you will hear from a TV or radio weather report for each 100 feet of elevation. This spec is disabled if you picked a Typical day, but will display the barometer being used. Air Temperature Air Temperature deg F Air temperature in degrees F of the air at the track. This spec is used for all Methods of Recording Weather Data. This spec is disabled if you picked a Typical day, but will display the temperature being used. Humidity Relative Humidity, % Describes the air’s humidity level in percent of humidity the air could hold at its present temperature. Relative Humidity can be calculated from either wet and dry bulb temperatures, or from dew point and air temperature readings by clicking on the Clc button. See Section 2.7.11 and 2.7.12.

(C) Performance Trends Inc 1999 Circle Track Analyzer Chapter 2 Definitions
62
Dew Point, deg F The dew point in degrees F of the air at the track, which describes the air's humidity level. The Dew Point, deg F must be less than the Air Temperature. Dew Point can be calculated from either wet and dry bulb temperatures, or from relative humidity and air temperature readings by clicking on the Clc button. See Section 2.7.11 and 2.7.12. Dew Point is a less confusing way of describing the air's moisture level than relative humidity. Relative humidity readings are only meaningful if the air temperature when the reading was made is also known. However, the air's dew point remains constant even when the air temperature changes. For example, 40 degree air with a 80 % relative humidity has only a 10% relative humidity when the same air is heated to 100 degrees. However, the dew point remains at 36 degrees for both air temperatures. Elevation Elevation, ft The elevation of the track above sea level in feet. This spec is only used if you are using a Corrected Barometer, like from a TV or radio station weather report. If the elevation is below sea level, enter a negative (-) feet for this reading. This spec is disabled if you picked a Typical day, but will display the elevation being used. Notes on Weather Readings and Weather Stations Many racers will use “weather stations”, a collection of temperature, humidity and barometric pressure measuring devices. When using these instruments, here are some things to keep in mind: • Unless you are very close to sea level, an actual (observed or uncorrected) barometer will usually
read less than a TV or radio weather report barometer. For elevations less than 5000 feet, an uncorrected barometer should read approximately 0.1 “ Mercury less for each 100 feet of elevation above sea level. For example, if your barometer instrument is at 850 feet elevation and the closest weather station reports 30.46” barometric pressure, your barometer should read approximately .85” (850/100 x .1) less, or 30.46-.85= 29.61. It is useful to keep records of information like this (what your actual barometer reads versus what this simple calculation says it should approximately read) to see if the comparison is constantly jumping around. If you always make the check at the same place (same elevation) like your home or shop, and the difference is varying high by .1”, than low by .2”, etc., you may want to have the barometer or altimeter checked out.
• If you find that you are making many adjustments to your weather station, you are probably doing something wrong. A barometer which reads low, but consistently reads low is better for predicting performance trends, than one you are trying to keep accurate by constantly adjusting. it.
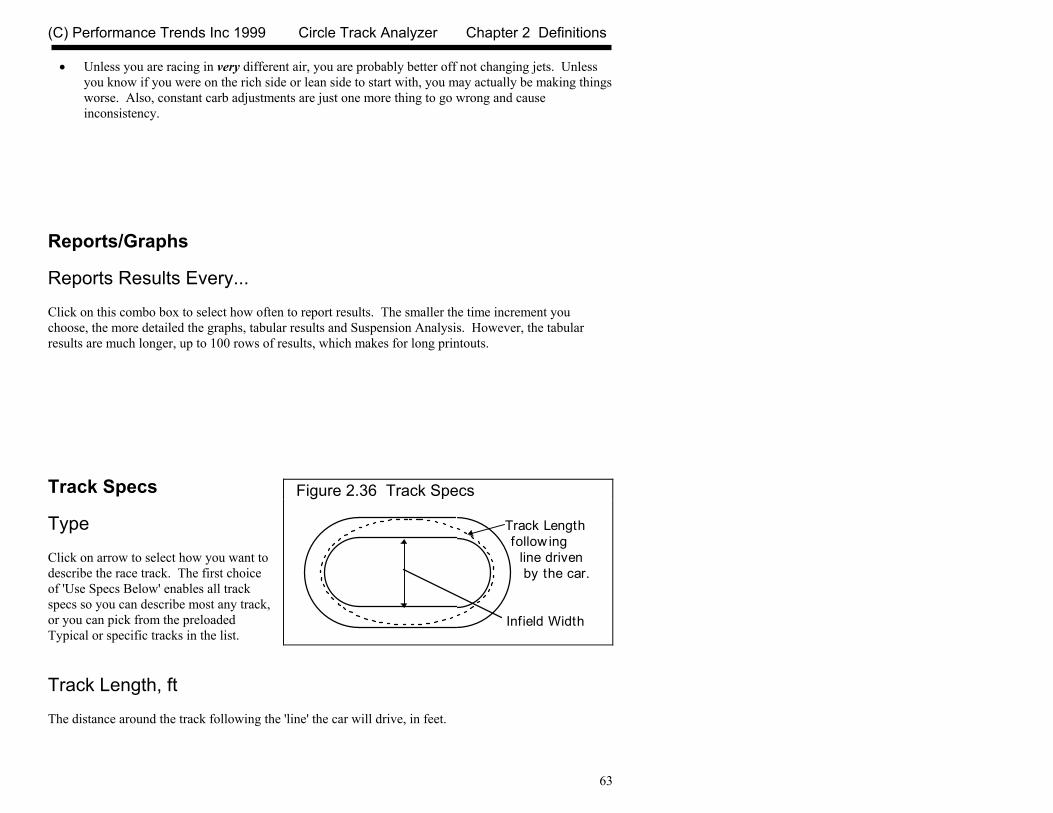
(C) Performance Trends Inc 1999 Circle Track Analyzer Chapter 2 Definitions
63
• Unless you are racing in very different air, you are probably better off not changing jets. Unless you know if you were on the rich side or lean side to start with, you may actually be making things worse. Also, constant carb adjustments are just one more thing to go wrong and cause inconsistency.
Reports/Graphs Reports Results Every... Click on this combo box to select how often to report results. The smaller the time increment you choose, the more detailed the graphs, tabular results and Suspension Analysis. However, the tabular results are much longer, up to 100 rows of results, which makes for long printouts. Track Specs Type Click on arrow to select how you want to describe the race track. The first choice of 'Use Specs Below' enables all track specs so you can describe most any track, or you can pick from the preloaded Typical or specific tracks in the list. Track Length, ft The distance around the track following the 'line' the car will drive, in feet.
Figure 2.36 Track Specs
Track Length follow ing line driven I by the car.
Infield Width

(C) Performance Trends Inc 1999 Circle Track Analyzer Chapter 2 Definitions
64
Infield Width, ft The distance across the infield in feet. This tells the program how tight the turns are. Bank Angle, deg Is the banking of the track in the corners in degrees, for the line the car drives. If the banking is progressive (steeper at the top), enter the banking for where the car drives (low banking if the car stays low). Driver Type Click on arrow to select how you want to describe the driver. The first choice of 'Use Specs Below' enables both Driver specs so you can enter both individually, or you can pick from the preloaded Typical examples in the list. Accel. Aggressiveness Click on arrow to select how quickly the driver gets on the accelerator out of the turn. The more aggressive the rating, the closer the driver keeps the tires to the limits of the 'Friction Circle' (on the edge of 'breaking loose'). Brake Aggressiveness Click on arrow to select how deep the driver goes into the turn before braking, then how hard they brake. The more aggressive the rating, the closer the driver keeps the tires to the limits of the 'Friction Circle' (on the edge of 'breaking loose').

(C) Performance Trends Inc 1999 Circle Track Analyzer Chapter 2 Definitions
65
2.6.2 Calculate Performance Test Results
The Circle Track Analyzer's calculated output is shown in Figure 2.37 above. This screen shows the track performance for the current vehicle. From this screen you can:
Figure 2.37 Calculated Results
Improvement Summary
Tabular Results
Test History (not always shown)
Click here to show History
Commands buttons for analyzing results
Summary of Important Notes

(C) Performance Trends Inc 1999 Circle Track Analyzer Chapter 2 Definitions
66
• Graph or plot the results versus time by clicking on the "Graph" menu command or the "Graph" icon. Additional help is available from the Graph Screen.
• Print the results on a printer by clicking on the "Print" menu command or the "Printer" icon. Under the "Print" menu command, several other options open up for various types of report and printer options.
• View the program's Notes about these results by clicking on the "Notes" button. Notes are • useful for pointing out possible problems with the combination of specs you have selected. A
brief summary of the notes is given in the "Notes Summary" frame. • Display a history of the last 25 runs you have made by clicking on the "History" menu command. • Analyze the suspension by clicking on Analyzer Suspension. This displays a screen showing
several aspects of suspension motion and handling analysis. Several report options are also available at this screen, some to give 'starting point' recommendations for springs, roll bar rates, stagger, etc. These options are a powerful part of the Circle Track Analyzer's analysis.
• Analyze the results in an Analysis Report by clicking on the "Analyze Perf" menu command. The analysis report gives tips on what to look for in the results to improve performance, or warning
• of unsafe conditions to be aware of. • Return to the Main Menu by clicking on the "Back" menu command. • You can obtain definitions for most results by clicking on that area of the screen with the mouse.
For example, click on the column with MPH results, and a definition of MPH appears with a page # in the manual for more info. This also works for the History report in the lower area of the screen, if it is currently being displayed.
Improvement Summary The Improvement Summary section compares the final results of the current run with those of the previous run. This saves you from writing down Lap Times and MPHs to see how much effect a given modification has on performance. Lap Time Is the time for the car to travel around the track. The results only show what happened from start of Turn #2, through the straight away, then through Turn #3. The assumptions is that the other half of the track is exactly the same and those results are not calculated or shown. MPH (Final Velocity in Miles per Hour) Is the vehicle's average velocity around the track in miles per hour.

(C) Performance Trends Inc 1999 Circle Track Analyzer Chapter 2 Definitions
67
Improvement Improvement is simply the difference between the Current Run and the Last Run for which performance was calculated. If the improvement is a positive value:
• The Current Run’s Lap Time was quicker (shorter) than the Last Run’s • The Current Run’s MPH was faster (greater) than the Last Run's
Tabular Results The tabular results gives important vehicle and engine information at significant points during the run:
• At the start of Turn #2. • At every time interval you have requested in the Running Conditions menu as Report Results
Every... spec in the Reports/Graphs section. • At the beginning of braking. • At the end of Turn #3.
Occasionally, two of these conditions may occur very close together. For example 8.0 seconds may occur a couple hundredths of a second before the start of braking. In these cases, you may only get one reading, either the 8.0 second point or the start of braking. The following section defines each data column: Sec Shows the elapsed time since the start of Turn #2. The resolution of the time column can be increased to thousandths of a second by selecting .001 second increments in the Preferences menu MPH Is the vehicle's velocity in MPH.
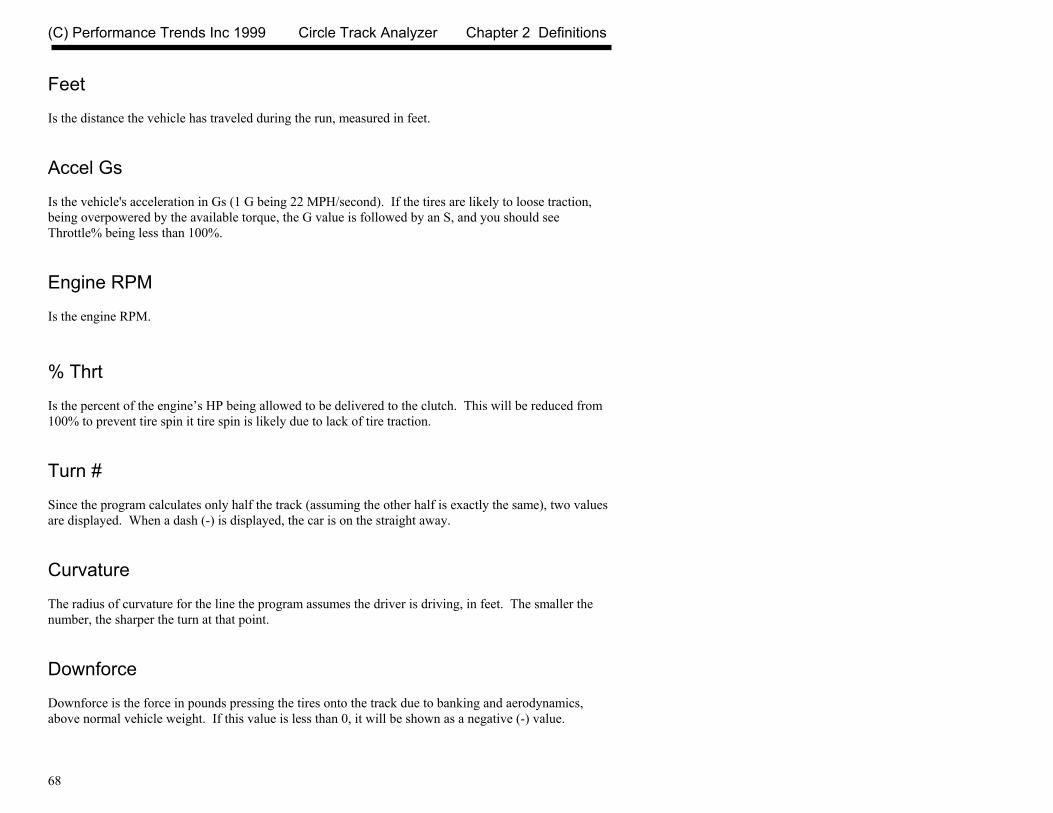
(C) Performance Trends Inc 1999 Circle Track Analyzer Chapter 2 Definitions
68
Feet Is the distance the vehicle has traveled during the run, measured in feet. Accel Gs Is the vehicle's acceleration in Gs (1 G being 22 MPH/second). If the tires are likely to loose traction, being overpowered by the available torque, the G value is followed by an S, and you should see Throttle% being less than 100%. Engine RPM Is the engine RPM. % Thrt Is the percent of the engine’s HP being allowed to be delivered to the clutch. This will be reduced from 100% to prevent tire spin it tire spin is likely due to lack of tire traction. Turn # Since the program calculates only half the track (assuming the other half is exactly the same), two values are displayed. When a dash (-) is displayed, the car is on the straight away. Curvature The radius of curvature for the line the program assumes the driver is driving, in feet. The smaller the number, the sharper the turn at that point. Downforce Downforce is the force in pounds pressing the tires onto the track due to banking and aerodynamics, above normal vehicle weight. If this value is less than 0, it will be shown as a negative (-) value.

(C) Performance Trends Inc 1999 Circle Track Analyzer Chapter 2 Definitions
69
Corner Gs Corner Gs is the cornering force which is throwing the car and the driver to the outside of the turn, measured in Gs.
Figure 2.38 Diagram of Downforce and Corner Gs

(C) Performance Trends Inc 1999 Circle Track Analyzer Chapter 2 Definitions
70
2.7 Calculation Menus: The following section explains the user input for specs listed with Clc buttons (and the “Calculate” power curve menu option in the Engine Specs menu). These specs are ones where you can simply enter a value, or click on the Clc button and the program will present a menu of inputs which will calculate that particular parameter. These menus are like computer “scratch pads” for calculating specs like Final Drive Ratio, Tire Circumference, etc. from other inputs. Notes: The starting values in each calculation menu are usually blanked out when the menu is opened. If there is other information in the program to estimate what one of your input values will be, it may be loaded. As shown in Figure 2.39, the 4 corner weights are already available based on the Vehicle Weight and Weight %s in the Vehicle Specs menu, and these values are loaded into the Calculation Menu. You are free to change them to any other value. Once enough specs have been entered, the calculated value(s) at the top of the menu will be displayed. This calculated value(s) will now be updated each time you change a spec. If you want to use this calculated value, click on Use Calc Value. If the calculated value is within expected limits, it will be loaded into the original menu. If you click on Cancel, you will be returned to the original menu with the original value unchanged. If you click on Help, you will be given a general explanation of calculation menus, and a page # in this section for more info about the particular menu you are using. The input values or calculated values in any calculation menu have NO affect on calculated performance unless you load the Calculated value into the original menu. If you already know a spec in the form required by the program, then you have no need to use the calculation menu. For example, if you know the Relative Humidity is 88%, then you have no need to use a calculation menu to calculate Relative Humidity from , say, wet and dry bulb temperatures.
Figure 2.39 Typical Calculation Menu
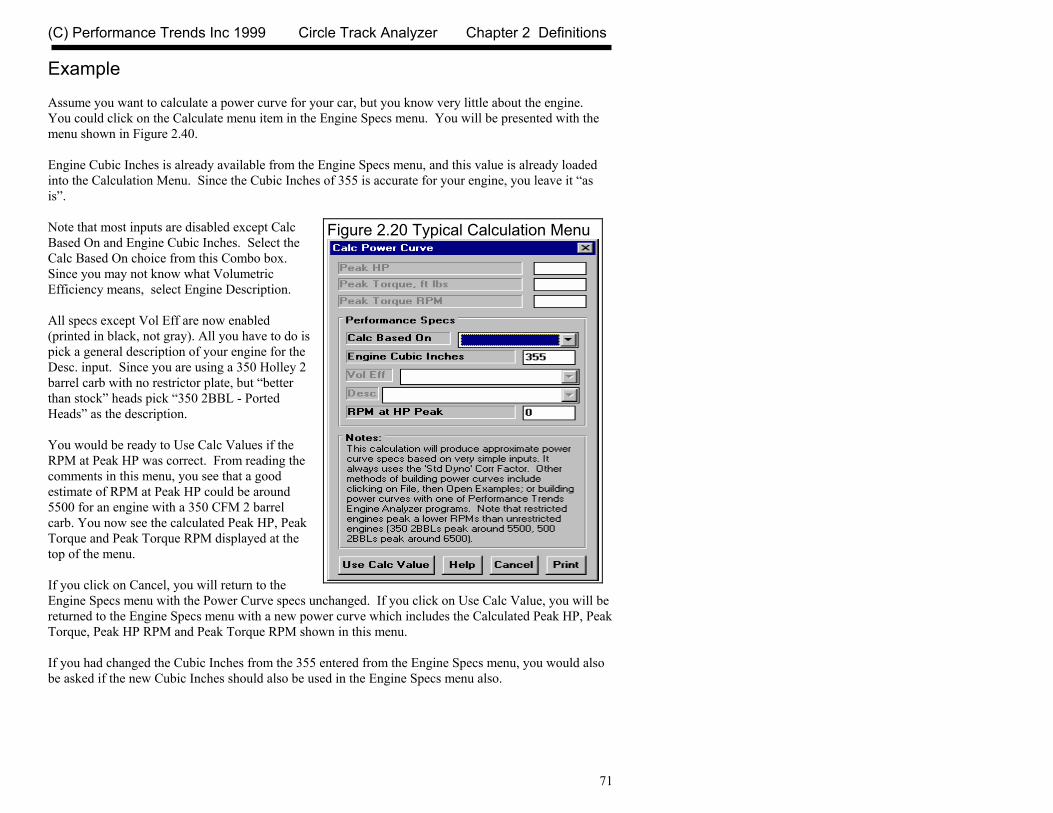
(C) Performance Trends Inc 1999 Circle Track Analyzer Chapter 2 Definitions
71
Example Assume you want to calculate a power curve for your car, but you know very little about the engine. You could click on the Calculate menu item in the Engine Specs menu. You will be presented with the menu shown in Figure 2.40. Engine Cubic Inches is already available from the Engine Specs menu, and this value is already loaded into the Calculation Menu. Since the Cubic Inches of 355 is accurate for your engine, you leave it “as is”. Note that most inputs are disabled except Calc Based On and Engine Cubic Inches. Select the Calc Based On choice from this Combo box. Since you may not know what Volumetric Efficiency means, select Engine Description. All specs except Vol Eff are now enabled (printed in black, not gray). All you have to do is pick a general description of your engine for the Desc. input. Since you are using a 350 Holley 2 barrel carb with no restrictor plate, but “better than stock” heads pick “350 2BBL - Ported Heads” as the description. You would be ready to Use Calc Values if the RPM at Peak HP was correct. From reading the comments in this menu, you see that a good estimate of RPM at Peak HP could be around 5500 for an engine with a 350 CFM 2 barrel carb. You now see the calculated Peak HP, Peak Torque and Peak Torque RPM displayed at the top of the menu. If you click on Cancel, you will return to the Engine Specs menu with the Power Curve specs unchanged. If you click on Use Calc Value, you will be returned to the Engine Specs menu with a new power curve which includes the Calculated Peak HP, Peak Torque, Peak HP RPM and Peak Torque RPM shown in this menu. If you had changed the Cubic Inches from the 355 entered from the Engine Specs menu, you would also be asked if the new Cubic Inches should also be used in the Engine Specs menu also.
Figure 2.20 Typical Calculation Menu

(C) Performance Trends Inc 1999 Circle Track Analyzer Chapter 2 Definitions
72
2.7.1 Calc Power Curve This calculation is available from the Engine specs menu and lets you estimate an engine Power Curve. Initiate this calculation by clicking on the “Calculate” menu item at the top of the Engine Specs Screen Peak HP Peak Torque, ft lbs Peak Torque RPM Are the values calculate from these inputs. If you select Vol Eff, the Peak HP value is calculated using the following assumptions: • 85% mechanical efficiency at RPM at HP
Peak • 35% thermal efficiency • Gasoline as the fuel with an energy content
of 19,000 BTU/lb • Dry air density of .0764 lbs/cu ft (dry air at
29.92” and 60 degrees) . The other Power Curve specs are derived from Peak HP and RPM at HP Peak and an assumed shape of the torque curve based on the Cubic Inches. The RPM at HP Peak input at the bottom of the menu is always loaded back into the Engine specs menu. These calculations are based on power corrected to the standard aftermarket dyno correction factor of 29.92” mercury and 60 degrees dry air. This is the standard assumption used by the Circle Track Analyzer for any power inputs. Calc Based On Click on this combo box to select from:
• Volumetric Efficiency % • Engine Description
Depending on your choice, certain inputs will now be enabled.
Figure 2.41 Calc Power Curve

(C) Performance Trends Inc 1999 Circle Track Analyzer Chapter 2 Definitions
73
Engine Cubic Inches Is the engine’s size in Cubic Inches. This is initially set to the Displacement in the Engine menu, but can be changed to anything you want. Vol Eff Is the engine's volumetric efficiency at the HP peak. Volumetric efficiency means what is the amount of air which this engine pulls in one cycle compared to how much it could under “ideal” conditions. Generally this is less than 100%, but can be up to 130% for highly tuned race engines, or up to 300% on supercharged or turbocharged engines. Generally, this is not the engine's peak volumetric efficiency (which usually occurs at the torque peak) but is close to it. Click on the down arrow of this combo box to select from the following choices:
• 65 Bad Production • 75 Typ Production • 80 Good Production • 85 HiPerf Production • 90 Poor Street/Strip • 95 Typ Street/Strip • 100 Good Street/Strip • 110 Good Race Engine • 115 Very Good Race Engine • 120 Excellent Race Engine • 125 Unrestricted Winston Cup
Desc Is a general description of your engine. Note that the numbers for many descriptions are the CFM rating of the carburetor, not the cubic inches. RPM at HP Peak Is the RPM at which the HP peak occurs. This is initially set to the RPM at HP Peak in the Engine menu, but can be changed to anything you want. Note: Most any modification which increases HP will also increase RPM at HP Peak. If you have no information about your RPM at HP Peak, use an RPM 500 RPM lower than your highest RPM on the track.
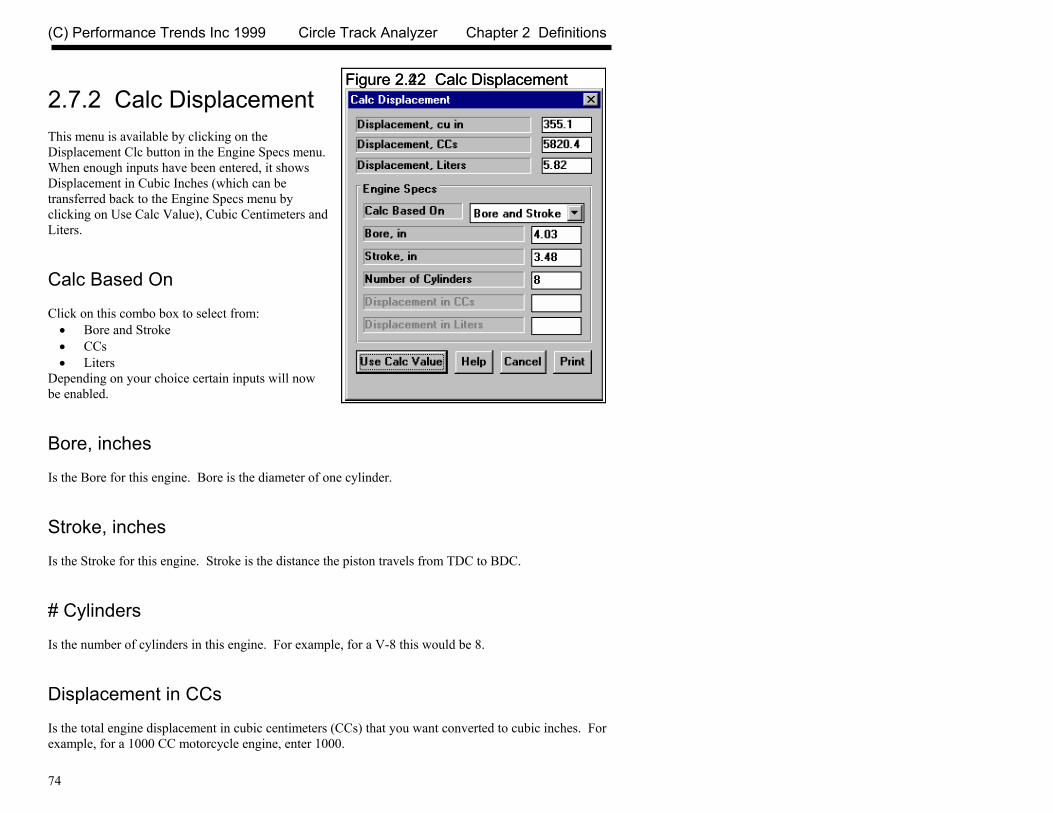
(C) Performance Trends Inc 1999 Circle Track Analyzer Chapter 2 Definitions
74
2.7.2 Calc Displacement This menu is available by clicking on the Displacement Clc button in the Engine Specs menu. When enough inputs have been entered, it shows Displacement in Cubic Inches (which can be transferred back to the Engine Specs menu by clicking on Use Calc Value), Cubic Centimeters and Liters. Calc Based On Click on this combo box to select from: • Bore and Stroke • CCs • Liters
Depending on your choice certain inputs will now be enabled. Bore, inches Is the Bore for this engine. Bore is the diameter of one cylinder. Stroke, inches Is the Stroke for this engine. Stroke is the distance the piston travels from TDC to BDC. # Cylinders Is the number of cylinders in this engine. For example, for a V-8 this would be 8. Displacement in CCs Is the total engine displacement in cubic centimeters (CCs) that you want converted to cubic inches. For example, for a 1000 CC motorcycle engine, enter 1000.
Figure 2.22 Calc Displacement Figure 2.42 Calc Displacement
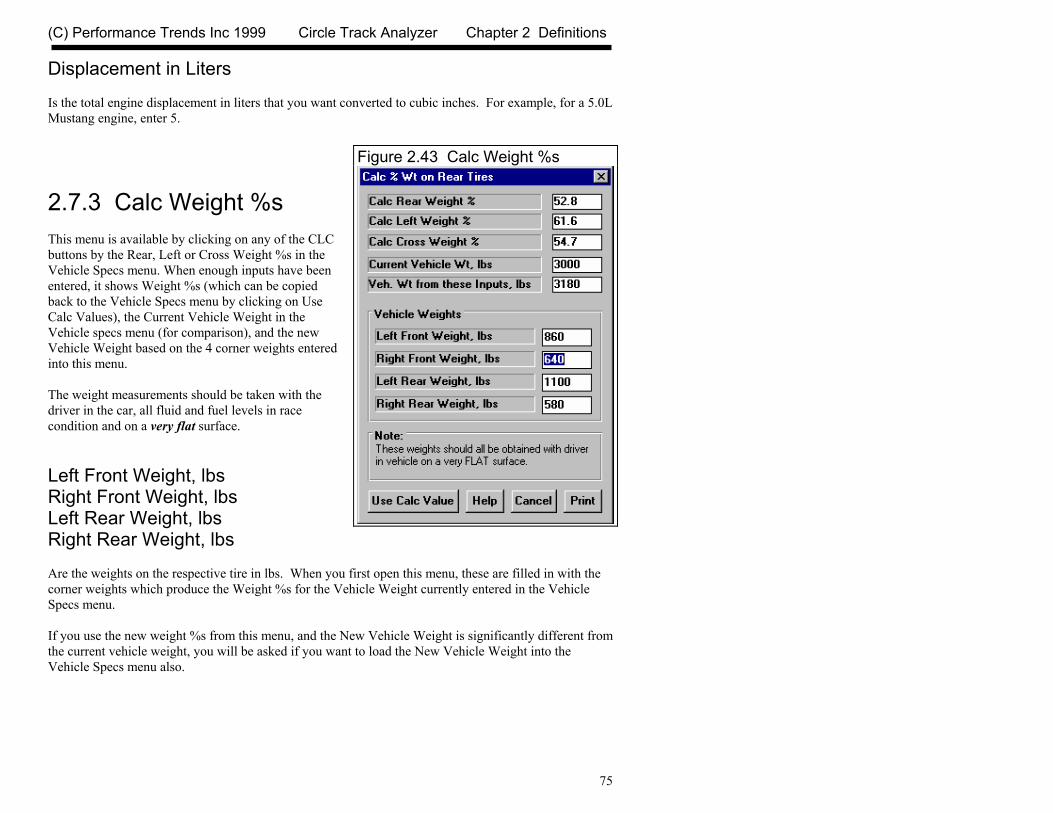
(C) Performance Trends Inc 1999 Circle Track Analyzer Chapter 2 Definitions
75
Displacement in Liters Is the total engine displacement in liters that you want converted to cubic inches. For example, for a 5.0L Mustang engine, enter 5.
2.7.3 Calc Weight %s This menu is available by clicking on any of the CLC buttons by the Rear, Left or Cross Weight %s in the Vehicle Specs menu. When enough inputs have been entered, it shows Weight %s (which can be copied back to the Vehicle Specs menu by clicking on Use Calc Values), the Current Vehicle Weight in the Vehicle specs menu (for comparison), and the new Vehicle Weight based on the 4 corner weights entered into this menu. The weight measurements should be taken with the driver in the car, all fluid and fuel levels in race condition and on a very flat surface. Left Front Weight, lbs Right Front Weight, lbs Left Rear Weight, lbs Right Rear Weight, lbs Are the weights on the respective tire in lbs. When you first open this menu, these are filled in with the corner weights which produce the Weight %s for the Vehicle Weight currently entered in the Vehicle Specs menu. If you use the new weight %s from this menu, and the New Vehicle Weight is significantly different from the current vehicle weight, you will be asked if you want to load the New Vehicle Weight into the Vehicle Specs menu also.
Figure 2.43 Calc Weight %s

(C) Performance Trends Inc 1999 Circle Track Analyzer Chapter 2 Definitions
76
2.7.4 Calc C.G. Height This menu is available by clicking on the C.G. Height Clc button in the Vehicle specs menu. The procedure to determine C.G. height requires one end of the car to be raised while accurately measuring the wheel weights on the other end of the car before and after the car is raised. The suspension must be blocked so the springs do not compress during the process. This can be done by replacing the shocks with solid links that maintain the vehicle’s free standing height. Raising a typical car about 20 inches (quite a lot) will only show a weight increase of 30-60 lbs for most cars. Therefore, this process requires very precise weight measurements. Some tips to improve the accuracy of the procedure include: • Wiggle the car slightly on the scale to ensure it always returns to the same weight. • The higher you raise the car, the more weight difference you will see and the more accurate
results. • The test should be run with the driver and all fluid levels at race conditions. • Do the entire test more than once and average the C.G. height results.
This procedure can be dangerous if not done with care and using good equipment. Take the proper precautions, especially if you raise the car significantly.
Wheelbase, in Wheelbase of the car in inches. Total Vehicle Weight, lbs The total weight of the vehicle, ideally with the driver and all fluid levels at race conditions.
Figure 2.44 Procedure to Measure C.G. Height Block suspension (so springs can not be compressed).
Raise one end of car a significant distance.
Weighing Scale, show ing weight level Block up tire level w ith scale and raised. for accurate “ level car” weight

(C) Performance Trends Inc 1999 Circle Track Analyzer Chapter 2 Definitions
77
Total Front (Rear) Weight, lbs The weight on the front tires (or rear tires if the front of the car is raised) on level ground in pounds, before the car is raised. Raise Front or Rear Choose which end of the car is raised for this test, usually the rear. Front (Rear) Tire Radius, in The radius of the front tire (or rear tire if the front of the car is raised). Distance Raised, in The distance the one end of the car is raised, in inches. New Total Front (Rear) Weight, lbs The new weight on the front tires (or rear tires if the front of the car is raised) when the car has been raised.
Figure 2.45 Calc C.G. Height

(C) Performance Trends Inc 1999 Circle Track Analyzer Chapter 2 Definitions
78
2.7.5 Calc Rear Axle Ratio This menu is available by clicking on the Rear Axle Ratio Clc button in the Vehicle specs menu. Type Click on this combo box to select from: • Ring & Pinion Gear Only (typical of most
rear wheel drive rear axles) • Quick Change with 4.56 Ring & Pinion • Quick Change with 4.88 Ring & Pinion • Chain Drive Only (typical of go carts, most
motorcycles, etc.) • Gear Reduction & Chain Drive (typical of
motorcycles where there is a chain reduction between the engine and the transmission, and then there is the chain ratio between the transmission and rear axle)
Depending on your choice certain inputs will now be enabled, hidden or changed. # Teeth, Pinion Gear This is the number of teeth on the smaller pinion gear (or drive gear which attaches to the driveshaft) in the rear axle. If you selected Gear Reduction & Chain Drive as the Type, this is the # teeth on the sprocket or drive gear on the engine’s crankshaft. In almost all cases, this number will be smaller than # Teeth Ring Gear. # Teeth, Ring Gear This is the number of teeth on the larger ring gear (or driven gear which attaches to the axle shafts through the differential) in the rear axle. If you selected Gear Reduction & Chain Drive as the Type, this is the # teeth on the sprocket or drive gear on the transmission input shaft or clutch shaft. In almost all cases, this number will be larger than # Teeth Pinion Gear.
Figure 2.46 Calc Final Drive Ratio
(C) Performance Trends Inc 1999 Circle Track Analyzer Chapter 2 Definitions
79
# Teeth, Drive Sprocket This is the number of teeth on the smaller drive sprocket on the engine or transmission for chain drive systems. In almost all cases, this number will be smaller than # Teeth Wheel Sprocket. # Teeth, Wheel Sprocket This is the number of teeth on the larger driven sprocket on the wheel or axle for chain drive systems. In almost all cases, this number will be larger than # Teeth Drive Sprocket. Ring and Pinion Ratio This is the ring and pinion ratio for the quick change, usually 4.56 or 4.88, but you can change this to most any ratio. # Teeth, Top Spur Gear This is the number of teeth on the upper (top) spur gear in the quick change. # Teeth, Bottom Spur Gear This is the number of teeth on the lower (bottom) spur gear in the quick change.
2.7.6 Calc Frontal Area This calculation is available from the Vehicle Specs menu and allows you to estimate a vehicle's frontal area.

(C) Performance Trends Inc 1999 Circle Track Analyzer Chapter 2 Definitions
80
Track Width, inches Is the distance from the center of one front tire to the center of the other front tire. This value is initially set to the Rear Track Width in the Body and Axle specs menu, but can be changed to most anything you want. Roof Height, inches The distance in inches from the ground to highest portion of the roof or vehicle in inches which extends nearly the full width of the vehicle. For example, for a truck with a roll bar behind the cab, measure to the top of the roll bar, but not to the top of one of the spot lights mounted on the bar. However, if so many lights are mounted on the bar that they are nearly continuous for the full width of the vehicle, it may be more accurate to then measure to the top of the spot lights.
2.7.7 Tire Circumference Tread Width This calculation is available from the Wheel & Tire Specs menu and allows you to estimate either a front or rear wheel’s Tire Diameter and Tread Width for certain Tire Rating Types. Note: For all Rating Types except Rolling Radius, the Calc Tire Diameter is approximately 3% less than what you would calculate based on the exact dimensions. This is to allow for some tire wear, deformation, and slip.
Figure 2.47 Calc Frontal Area
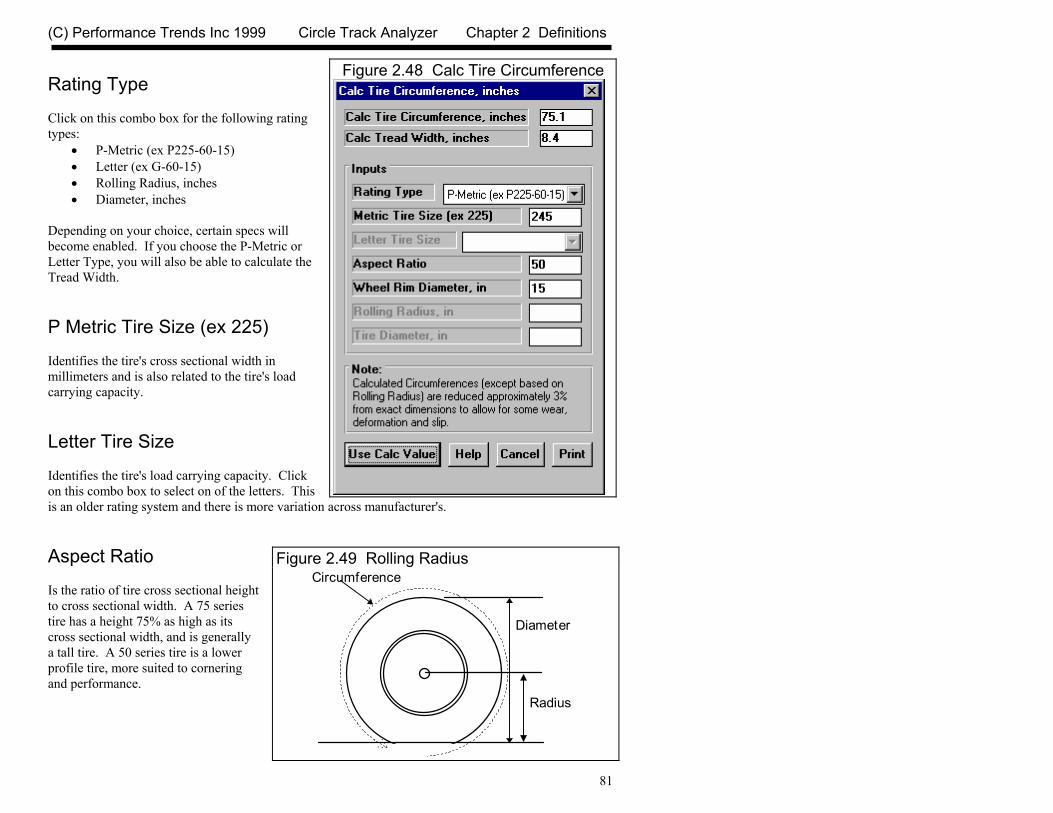
(C) Performance Trends Inc 1999 Circle Track Analyzer Chapter 2 Definitions
81
Rating Type Click on this combo box for the following rating types:
• P-Metric (ex P225-60-15) • Letter (ex G-60-15) • Rolling Radius, inches • Diameter, inches
Depending on your choice, certain specs will become enabled. If you choose the P-Metric or Letter Type, you will also be able to calculate the Tread Width. P Metric Tire Size (ex 225) Identifies the tire's cross sectional width in millimeters and is also related to the tire's load carrying capacity. Letter Tire Size Identifies the tire's load carrying capacity. Click on this combo box to select on of the letters. This is an older rating system and there is more variation across manufacturer's. Aspect Ratio Is the ratio of tire cross sectional height to cross sectional width. A 75 series tire has a height 75% as high as its cross sectional width, and is generally a tall tire. A 50 series tire is a lower profile tire, more suited to cornering and performance.
Figure 2.48 Calc Tire Circumference
Figure 2.49 Rolling Radius
Circumference
Diameter
Radius

(C) Performance Trends Inc 1999 Circle Track Analyzer Chapter 2 Definitions
82
Wheel Rim Diameter Is the diameter of the wheel's rim. Rolling Radius, in Is the tire's radius, measured with the tire mounted on the car, with the tire on the ground with typical vehicle weight on it. Radius is the distance from the center of the tire to the ground. See Figure 2.49. Diameter, in Is the tire's diameter measured in inches. Diameter is the distance across the tire.
2.7.8 Estimated Traction Factors This Calculation menu is available by clicking on the Traction Factor Clc button in the Vehicle specs menu. Click on the combo box to be presented with general choices describing traction, and the corresponding Traction Factor in %. This menu is different than other Calculation menus in that there is not calculation performed, but you are simply picking a Traction Factor from a list of descriptions. The Traction Factors in this list are very general. You will probably have to fine tune this spec based on your vehicle's actual lap times. The program can also determine Traction Factor with the Match My Lap Times command at the Main Menu.
Figure 2.50 Traction Factors

(C) Performance Trends Inc 1999 Circle Track Analyzer Chapter 2 Definitions
83
2.7.9 Calc Spring Rate This Calculation menu is available by clicking on the Spring Rate Clc button in the Front Suspension or Rear Suspension menu. Spring Location Click on this combo box to select which spring location you are calculating a spring rate for, either the Left spring, Right Spring or both springs. Type of Spring Click on the combo box for Type of Spring to change the inputs in this menu for the 4 basic types of springs: • Coil Springs • Leaf Springs • Solid Torsion Bars • Hollow Torsion Bars
These inputs will be discussed in the 3 sections below Coil Springs Wire Diameter, in Is the diameter of the wire which makes up the coils, in inches. Take this measurement carefully as it has a large impact on the results. Inside Diameter of Coil, in Is the inside diameter of the wire coils which makes up the spring, in inches. The coil diameter ranges from 1.5 to 5 inches for most springs.
Figure 2.51 Calc Spring Rate

(C) Performance Trends Inc 1999 Circle Track Analyzer Chapter 2 Definitions
84
Number of Active Coils Is the number of active coils in the spring. Usually the top and bottom coils of a spring do not move (are not active) and do not contribute to the “springiness” of the spring. Therefore the number of active or moving coils is usually 2 less than the total number of coils. For example, for a spring with 12 coils, the Number of Active Coils would be 10. Leaf Springs # of Leaves at Center Is the number of individual leaves at the center of the leaf spring, where the axle attaches. For a single leaf this would be 1. # of Leaves at Ends Is the number of individual leaves within 2 inches of the front and rear mounting points on the vehicle frame. Usually this is 1. Spring Length, in Is the length of the main leaf spring in inches, usually 20 to 60 inches. Thickness of One Leaf, in Is the average thickness of each individual leaf, in inches. Take this measurement carefully, as it has a large impact on the results. Spring Width, in Is the average width of each leaf, in inches. This usually ranges from 1 to 3 inches.
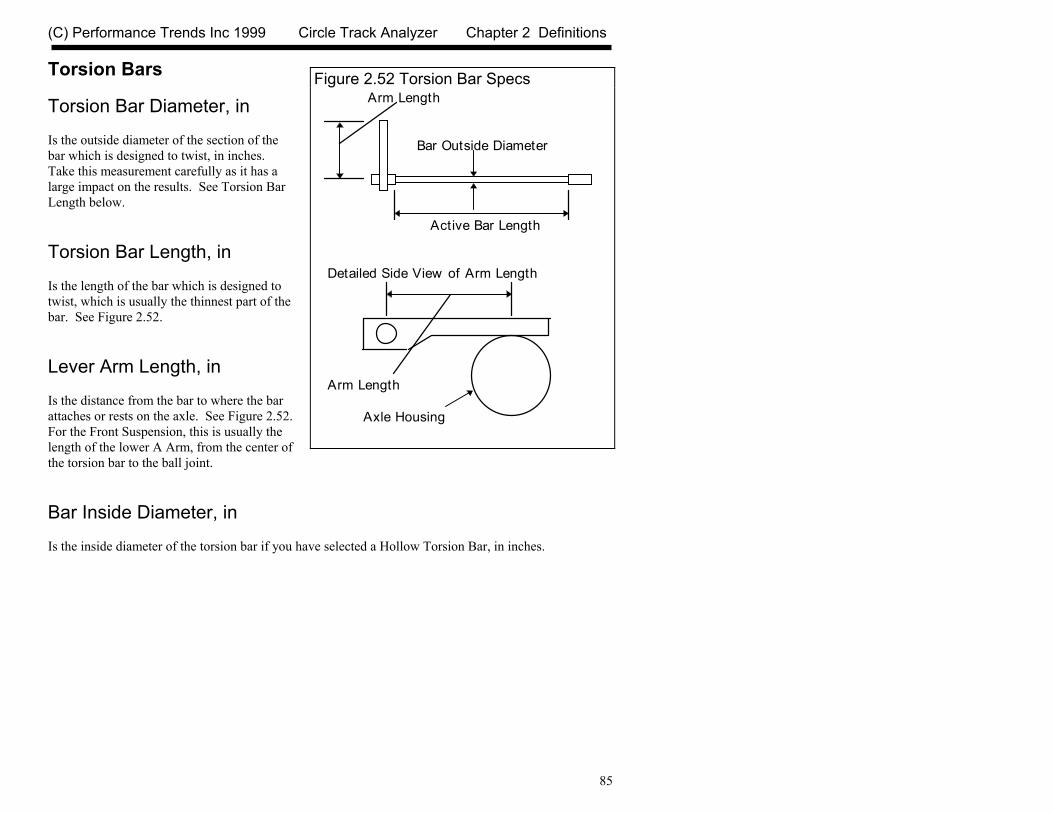
(C) Performance Trends Inc 1999 Circle Track Analyzer Chapter 2 Definitions
85
Torsion Bars Torsion Bar Diameter, in Is the outside diameter of the section of the bar which is designed to twist, in inches. Take this measurement carefully as it has a large impact on the results. See Torsion Bar Length below. Torsion Bar Length, in Is the length of the bar which is designed to twist, which is usually the thinnest part of the bar. See Figure 2.52. Lever Arm Length, in Is the distance from the bar to where the bar attaches or rests on the axle. See Figure 2.52. For the Front Suspension, this is usually the length of the lower A Arm, from the center of the torsion bar to the ball joint. Bar Inside Diameter, in Is the inside diameter of the torsion bar if you have selected a Hollow Torsion Bar, in inches.
Figure 2.52 Torsion Bar Specs Arm Length
Bar Outside Diameter
Active Bar Length
Detailed Side View of Arm Length
Arm Length
Axle Housing

(C) Performance Trends Inc 1999 Circle Track Analyzer Chapter 2 Definitions
86
2.7.10 Calc Roll Bar Rate This Calculation menu is available by clicking on the Roll Bar Rate Clc button in the Front Suspension menu. Type of Bar Click on this combo box to select from the following 3 types of roll bars: • No Sway Bar • Solid Bar • Hollow Bar
Bar Outside Diameter, in Is the outside diameter of the section of the bar which is designed to twist, in inches. Take this measurement carefully as it has a large impact on the results.
Figure 2.53 Calc Roll Bar Rate
Figure 2.54 Roll Bar Measurements Production Style Bar Custom Style Bar
Bar Outside Diameter Bar Outside Diameter Arm Length Arm Length
Active Bar Length Active Bar Length

(C) Performance Trends Inc 1999 Circle Track Analyzer Chapter 2 Definitions
87
Bar Inside Diameter, in Is the inside diameter of the torsion bar if you have selected a Hollow Roll Bar, in inches. Active Bar Length, in Is the length of the bar which is designed to twist, which is usually the thinnest part of the bar. See Figure 2.54. Arm Length, in Is the distance from the bar to where the bar attaches to the suspension. See Figure 2.54.
2.7.11 Calc Dew Point, deg F Depending on your choice of Method of Recording Weather Data, you will be entering either Dew Point or Relative Humidity in the Running Conditions menu. These humidity inputs at all these menus have a Clc button. This is the Calculation Menu you will get if you are using Dew Point. Know Relative Humidity? If you know the relative humidity of the air and the air temperature, select Yes. Otherwise select No to input Wet and Dry bulb temperatures from a psychrometer. Depending on your choice the appropriate inputs are enabled. Outside Air Temp, deg F Is the outside air temperature when the relative humidity measurement was made. For example, if the weather service or weather report gives a relative humidity of 56 % and a temperature of 68 degrees, use 68 degrees.
Figure 2.55 Calc Dew Point

(C) Performance Trends Inc 1999 Circle Track Analyzer Chapter 2 Definitions
88
Outside Rel Humidity, % Is the air's relative humidity as reported by a weather service or measured by humidity instruments. Dry Bulb Temp, deg F Is the temperature of the dry bulb thermometer on the psychrometer in degrees F. This is also the temperature of any thermometer mounted in the shade when the Wet Bulb Temp reading is taken. The Dry Bulb Temp must not be less than the Wet Bulb Temp. Wet Bulb Temp, deg F Is the temperature of the wet bulb thermometer on the psychrometer in degrees F. The wet bulb has a "wick" or cloth covering the bulb which is moistened with water. The dryer the air, the greater the difference between the wet and dry bulb readings. Relative humidity or dew point can be manually read off a Psychometric chart from these two readings. This calculation replaces reading the chart. The Wet Bulb Temp must be less than the Dry Bulb Temp.
2.7.12 Relative Humidity, % Depending on your choice of Method of Recording Weather Data, you will be entering either Dew Point or Relative Humidity in the Running Conditions menu. These humidity inputs at all these menus have a Clc button. This is the Calculation Menu you will get if you are using Relative Humidity.
Figure 2.56 Calc Relative Humidity
(C) Performance Trends Inc 1999 Circle Track Analyzer Chapter 2 Definitions
89
Know Dew Point? If you know the dew point of the air and the air temperature, select Yes. Otherwise select No to input Wet and Dry bulb temperatures from a psychrometer. Depending on your choice the appropriate inputs are enabled. Outside Air Temp, deg F Is the outside air temperature when the Dew Point measurement was made. Dew Point, deg F Is the air's Dew Point in degrees F as reported by a weather service or measured by humidity instruments. Dry Bulb Temp, deg F Is the temperature of the dry bulb thermometer on the psychrometer in degrees F. This is also the temperature of any thermometer mounted in the shade when the Wet Bulb Temp reading is taken. The Dry Bulb Temp must not be less than the Wet Bulb Temp. Wet Bulb Temp, deg F Is the temperature of the wet bulb thermometer on the psychrometer in degrees F. The wet bulb has a "wick" or cloth covering the bulb which is moistened with water. The dryer the air, the greater the difference between the wet and dry bulb readings. Relative humidity or dew point can be manually read off a Psychometric chart from these two readings. This calculation replaces reading the chart. The Wet Bulb Temp must be less than the Dry Bulb Temp.

(C) Performance Trends Inc 1999 Circle Track Analyzer Chapter 2 Definitions
90
2.8 Match My Lap Times The Circle Track Analyzer will automatically 'fine tune' certain critical specs to match a particular vehicle's lap times. See Example 4.2. The Match My Lap Times process consists of:
1. You set all specs to match the vehicle you are building as close as practical. This is very important for accurate results.
2. Click on the Match My Lap Times button at the top of the Main Menu to bring up the Match My Lap Times menu shown in Figure 2.57.
3. Fill in the Match My Lap Times menu with your vehicle's performance. Then click on OK (adjust veh. specs to match performance) to start the process.
4. The program will adjust: • Engine Power Curve • Tire Traction Factor • Tire Type, if it needs more
traction than 100% Traction Factor can provide
• Driver Aggressiveness • Track Bank Angle • Track Infield Width
To find a combination giving the closest match to the vehicle's performance.
If the program can not arrive at acceptable specs in 100 passes around the track, it will give you a notice. You may then want to double check your entries in the Match My Lap Times menu or some of the other specs in the other menus. If the program does arrive at acceptable specs, you will be shown a summary of the new specs the program found and how close the program matched performance, as shown in Figure 2.58. You can then load these specs into the menus for this vehicle. This process can save a good deal of "cut and try" on your part to get your vehicle specs adjusted. Example 4.2 shows the Match My
Figure 2.57 Match My Lap Times Menu

(C) Performance Trends Inc 1999 Circle Track Analyzer Chapter 2 Definitions
91
Lap Times process in more detail. Lowest Engine RPM in Turns Enter the lowest RPM you see in the turns. This gives the program an idea of how slow the car must go to make the turn. Highest RPM Before Braking Enter the highest RPM you see immediately before you brake. This gives the program an idea of how for you get into the corner before you brake, and some idea of the shape of the power curve. Lap Time Enter the car’s lap time for this particular track. Adjust Power Curve if Needed Pick Yes and the program will not only adjust vehicle specs and track specs, but also the engine power curve to match lap times. This is recommended when you do not have a dyno curve for the engine.
Figure 2.58 Results of Match My Lap Times

(C) Performance Trends Inc 1999 Circle Track Analyzer Chapter 3 Output
92
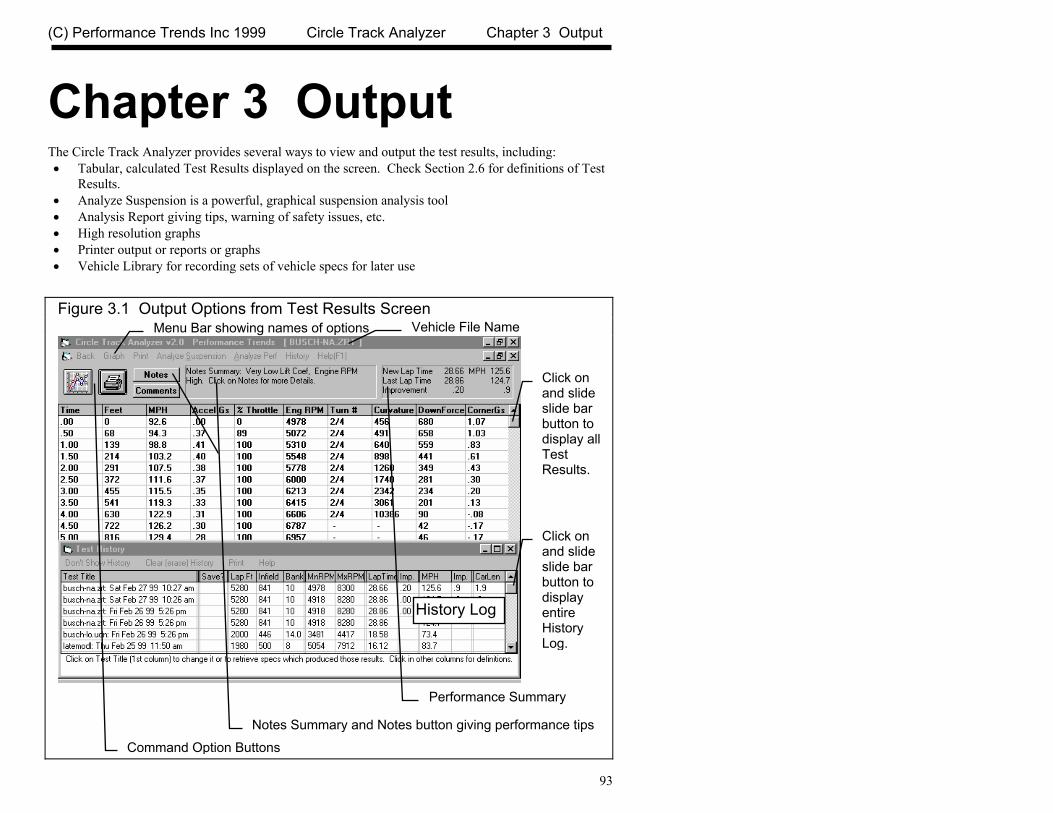
(C) Performance Trends Inc 1999 Circle Track Analyzer Chapter 3 Output
93
Chapter 3 Output The Circle Track Analyzer provides several ways to view and output the test results, including: • Tabular, calculated Test Results displayed on the screen. Check Section 2.6 for definitions of Test
Results. • Analyze Suspension is a powerful, graphical suspension analysis tool • Analysis Report giving tips, warning of safety issues, etc. • High resolution graphs • Printer output or reports or graphs • Vehicle Library for recording sets of vehicle specs for later use
Figure 3.1 Output Options from Test Results Screen
Menu Bar showing names of options Vehicle File Name
Click on and slide slide bar button to display all Test Results.
Click on and slide slide bar button to display entire History Log.
Command Option Buttons
Notes Summary and Notes button giving performance tips
Performance Summary
History Log
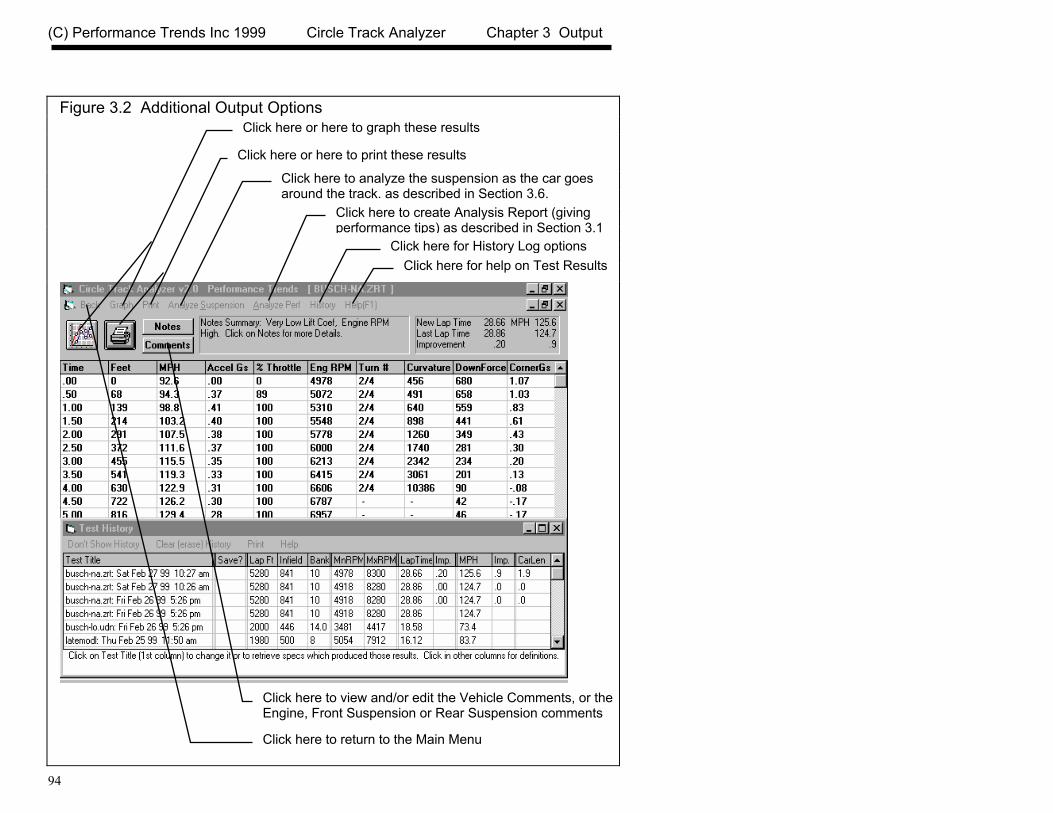
(C) Performance Trends Inc 1999 Circle Track Analyzer Chapter 3 Output
94
Figure 3.2 Additional Output Options
Click here for help on Test Results Click here for History Log options
Click here to create Analysis Report (giving performance tips) as described in Section 3.1
Click here or here to print these results
Click here or here to graph these results
Click here to return to the Main Menu
Click here to view and/or edit the Vehicle Comments, or the Engine, Front Suspension or Rear Suspension comments
Click here to analyze the suspension as the car goes around the track, as described in Section 3.6.

(C) Performance Trends Inc 1999 Circle Track Analyzer Chapter 3 Output
95
3.1 Analyze Perf. Reports When calculated test results are displayed on the screen, you can obtain an Analysis Report by clicking on Analyze Perf. in the menu bar. The Analysis report consists of 1-3 pages of suggestions for improving performance, safety warnings, etc. concerning the performance results calculated. See Figure 3.3 and 3.4 for examples. Figure 3.3 First Portion of Analysis Report

(C) Performance Trends Inc 1999 Circle Track Analyzer Chapter 3 Output
96
IMPORTANT: The Circle Track Analyzer can NOT anticipate all UNSAFE and poor performing situations. Do NOT rely only on the Analysis report to point out problems and SAFETY HAZARDS. You must use your own judgment, expert advice from experienced engine builders and the manufacturer of the components.
Figure 3.4 Another Portion of Analysis Report
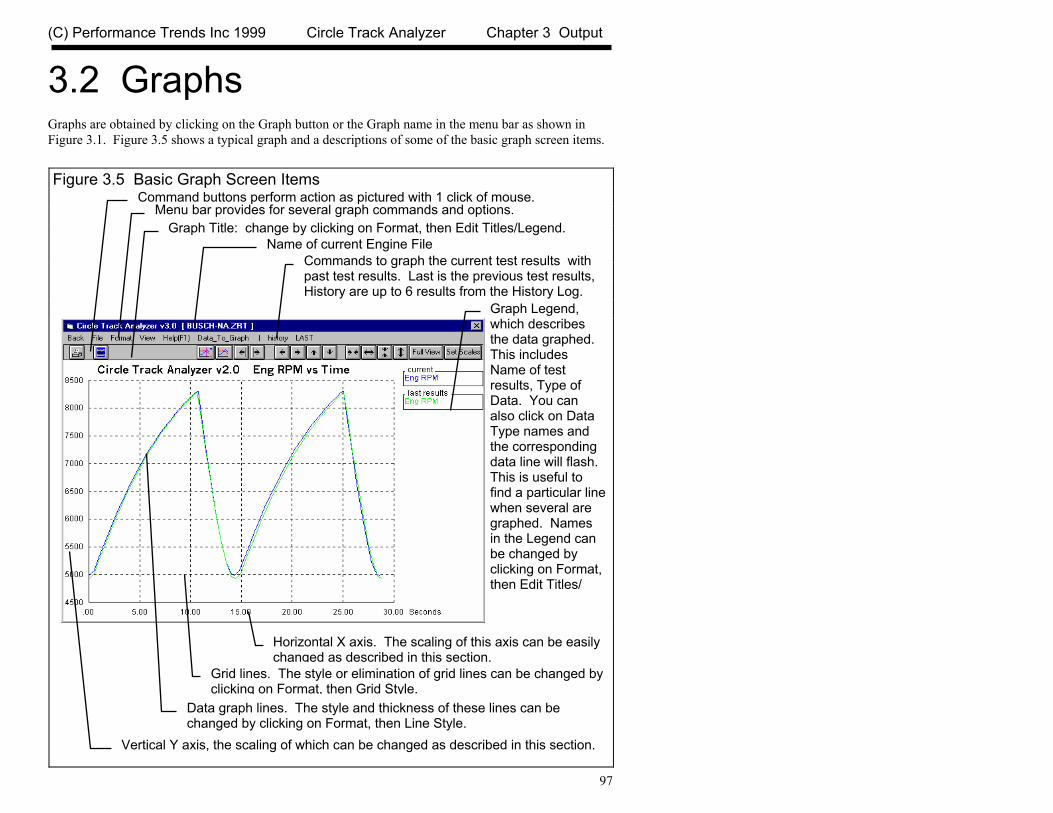
(C) Performance Trends Inc 1999 Circle Track Analyzer Chapter 3 Output
97
3.2 Graphs Graphs are obtained by clicking on the Graph button or the Graph name in the menu bar as shown in Figure 3.1. Figure 3.5 shows a typical graph and a descriptions of some of the basic graph screen items.
Figure 3.5 Basic Graph Screen Items
Command buttons perform action as pictured with 1 click of mouse.Menu bar provides for several graph commands and options.
Graph Title: change by clicking on Format, then Edit Titles/Legend.
Commands to graph the current test results with past test results. Last is the previous test results, History are up to 6 results from the History Log.
Name of current Engine File
Graph Legend, which describes the data graphed. This includes Name of test results, Type of Data. You can also click on Data Type names and the corresponding data line will flash. This is useful to find a particular line when several are graphed. Names in the Legend can be changed by clicking on Format, then Edit Titles/
Vertical Y axis, the scaling of which can be changed as described in this section.
Data graph lines. The style and thickness of these lines can be changed by clicking on Format, then Line Style.
Grid lines. The style or elimination of grid lines can be changed by clicking on Format, then Grid Style.
Horizontal X axis. The scaling of this axis can be easily changed as described in this section.

(C) Performance Trends Inc 1999 Circle Track Analyzer Chapter 3 Output
98
There are 2 basic types of test data which can be graphed:
• MPH • Accel Gs • Engine RPM • % Throttle • Downforce • Cornering Gs
Vs (on X axis), either: • Time in Seconds • Distance if Feet
There are 3 basic types of tests which can be graphed:
• Current test results. These are the test results displayed in the Test Results screen, for the current Vehicle specs.
• Last test results. These are the test results from the previous calculation. By comparing the current calculated results to the last results, you can easily watch how each modification has effected performance.
• Test results from the History Log. The History Log is a list of 25 tests, some of which you have specified you want saved long term, some of which are simply some of the last tests you have run.
Data_To_Graph You can switch between data types as shown in Figure 3.6.
Figure 3.6 Switching between Data Types
Click on Data_to_Graph for drop down menu. Then select type of data to graph, and what to graph against (time or distance for the X axis). Your current choices are shown with check marks.

(C) Performance Trends Inc 1999 Circle Track Analyzer Chapter 3 Output
99
Graphing Current, Last and History Log Test Results The Current and Last Test Results were defined earlier. The History Log is explained in some detail in Section 3.5 starting on page 112. This section will explain how to graph test results for tests in the History Log.
Figure 3.7 History Log (see Section 3.5 for more details)
Click on the History Button or the History menu item todisplay the History Log.
Click in this column to show Yes or remove Yes. Tests marked Yes will be graphed.
This column shows name program will display in graph Legend for this test. Click on name to change it.
Choose a ‘Graph’ option from the menu bar to close the History Log and graph the tests identified by the menu option you pick.
Click and drag slide bar to display entire History Log. Some tests marked Yes may be at the bottom of the Log and not be visible now.

(C) Performance Trends Inc 1999 Circle Track Analyzer Chapter 3 Output
100
Other Graphing Features The graph screen has several features, including:
• Printing • Cursor to pinpoint the value of a particular point on the graph • Changing titles and legend names • Changing the scales • Miscellaneous Format Options to change the appearance of the graph.
These are discussed in this next section. Printing Figure 3.8 shows the options for printing graphs and how to access these options. It also shows the screen for changing the Windows Printer Setup.
Figure 3.8 Printing Graphs
Click on File to display the two print menu options Clicking on the Printer button is the same as clicking on File and then Print.
Click here to print the graph with solid lines. This works best for printing graphs in color.
Click here change the printer or printer driver, page orientation, etc. as shown below.
Windows standard Printer Setup menu
Click here to print the graph with dashed lines. This works best for printing graphs in black and white, where different dashed line styles let you distinguish between different graphs.

(C) Performance Trends Inc 1999 Circle Track Analyzer Chapter 3 Output
101
Cursor The cursor feature is very useful for determining or comparing the value of the graph lines at various places. See Figure 3.9 for explaining the use of the cursor.
Figure 3.9 Cursor Features and Commands
Cursor line, usually pink or green, depending on background
l
Click on these buttons to move the cursor left or right. Hold down the <shift key> while clicking these buttons and the cursor moves farther. You can also enable the cursor by clicking on View, then Turn Cursor On.
The value of each graph line at the cursor is displayed here.
The X value of the cursor is shown here, in this case the RPM of 7.5 seconds
You can also enable the cursor by single clicking on a graph line at a data point. This also provides a quick way to move the cursor from 1 area of the graph to another. (Do not drag the mouse while clicking or you will zoom in on that area.) If you click on a graph line in between data points, the cursor will not appear.
Click here to turn Cursor On Click here to turn Cursor Off

(C) Performance Trends Inc 1999 Circle Track Analyzer Chapter 3 Output
102
Changing titles and legend names Many times you may want to customize a graph by printing labels of your choice. Click on Format and then Edit Titles/Legend to bring up the menu shown in Figure 3.10 which will allow you to do this.
Figure 3.10 Menu to Edit Title and Legend
This is the list of Standard names the program uses unless you click on the Use New Titles button below. Select (click on) a Standard name you want to change. The Standard Name appears in the edit box, along with the current New name if there is one. Once you have selected a name from this list (that row will be highlighted) it is easier to use the up and down arrow keys to select the next item to edit than clicking the item with the mouse.
This is the list of New names the program will use if you click on Use New Titles. If a title in the List of New Names is blank, the program will use the Standard name.
Standard name from row selected.
New name for you to edit. Other options include clicking on the Copy Std Name to New or Blank Out New Name buttons.
Click here to close this menu and use the New names you have entered. Where New names have been left blank, the Standard name will be used.
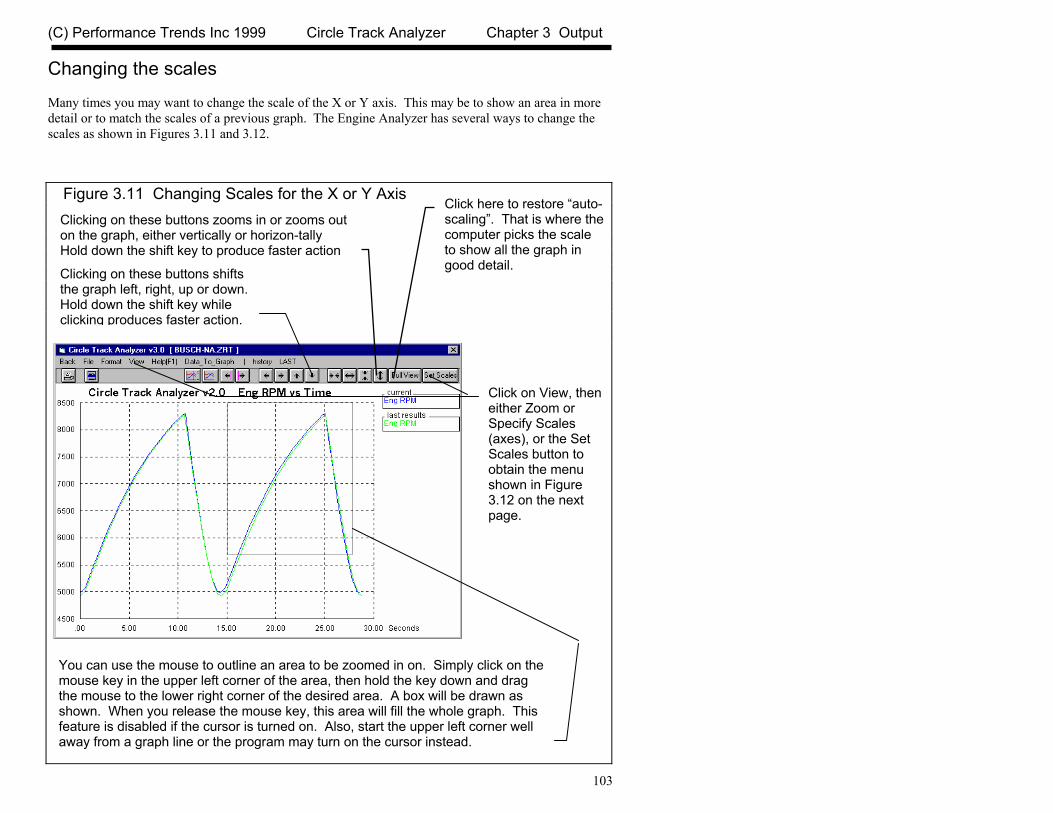
(C) Performance Trends Inc 1999 Circle Track Analyzer Chapter 3 Output
103
Changing the scales Many times you may want to change the scale of the X or Y axis. This may be to show an area in more detail or to match the scales of a previous graph. The Engine Analyzer has several ways to change the scales as shown in Figures 3.11 and 3.12.
Figure 3.11 Changing Scales for the X or Y Axis
Clicking on these buttons zooms in or zooms out on the graph, either vertically or horizon-tally Hold down the shift key to produce faster action
Click here to restore “auto-scaling”. That is where the computer picks the scale to show all the graph in good detail. Clicking on these buttons shifts
the graph left, right, up or down. Hold down the shift key while clicking produces faster action.
You can use the mouse to outline an area to be zoomed in on. Simply click on the mouse key in the upper left corner of the area, then hold the key down and drag the mouse to the lower right corner of the desired area. A box will be drawn as shown. When you release the mouse key, this area will fill the whole graph. This feature is disabled if the cursor is turned on. Also, start the upper left corner well away from a graph line or the program may turn on the cursor instead.
Click on View, then either Zoom or Specify Scales (axes), or the Set Scales button to obtain the menu shown in Figure 3.12 on the next page.

(C) Performance Trends Inc 1999 Circle Track Analyzer Chapter 3 Output
104
Format Options Click on the Format menu item to be presented with several options which will be briefly discussed here. Line Style Click on Line Style to change the thickness of the graph lines. Grid Style Click on Grid Style to change or omit the drawing of grid lines on the graph.
Figure 3.12 Menu to Specify Graph Axes Scales
Figure 3.13 Format Options
This menu can be obtained 2 ways. You can click on View in the menu bar then Specify Scales (axes), or click on the Set Scales button, the right most button on the screen. See Figure 3.11.
The current scale limits are loaded when this menu opens. Change any or all these to most any value you want. Either the left (Time) or right (Distance) section will be enabled depending on what is graphed on the X axis.
Click on OK to have the graph redrawn to these new scale limits
(C) Performance Trends Inc 1999 Circle Track Analyzer Chapter 3 Output
105
Back Color Click on Back Color to change the background color of the graph from white, black or gray.
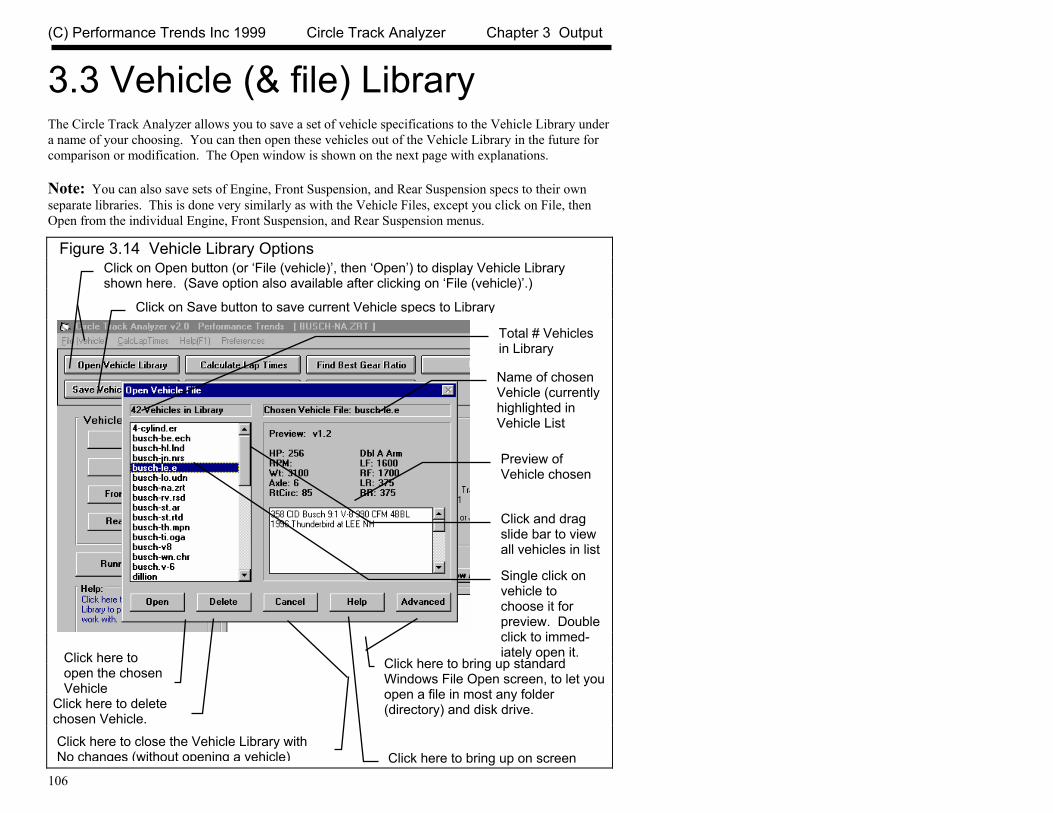
(C) Performance Trends Inc 1999 Circle Track Analyzer Chapter 3 Output
106
3.3 Vehicle (& file) Library The Circle Track Analyzer allows you to save a set of vehicle specifications to the Vehicle Library under a name of your choosing. You can then open these vehicles out of the Vehicle Library in the future for comparison or modification. The Open window is shown on the next page with explanations. Note: You can also save sets of Engine, Front Suspension, and Rear Suspension specs to their own separate libraries. This is done very similarly as with the Vehicle Files, except you click on File, then Open from the individual Engine, Front Suspension, and Rear Suspension menus.
Figure 3.14 Vehicle Library Options
Click on Open button (or ‘File (vehicle)’, then ‘Open’) to display Vehicle Library shown here. (Save option also available after clicking on ‘File (vehicle)’.)
Click on Save button to save current Vehicle specs to Library
Total # Vehicles in Library
Name of chosen Vehicle (currently highlighted in Vehicle List
Preview of Vehicle chosen
Click and drag slide bar to view all vehicles in list
Single click on vehicle to choose it for preview. Double click to immed-iately open it.Click here to
open the chosen Vehicle
Click here to delete chosen Vehicle.
Click here to close the Vehicle Library with No changes (without opening a vehicle) Click here to bring up on screen
Click here to bring up standard Windows File Open screen, to let you open a file in most any folder (directory) and disk drive.

(C) Performance Trends Inc 1999 Circle Track Analyzer Chapter 3 Output
107
Open a Vehicle File To open a vehicle file saved in the Library, either:
• Click on the Open button • Click on the “File (vehicle)” menu item and then on the “Open Vehicle” options from the list.
You will obtain the window shown on the previous page. Single click on one of the vehicles in the list, or click and drag the slide button on the right side of the list to display more vehicles. Once you single click on a vehicle, it is now the Chosen Vehicle File and a preview of the vehicle is given in the Preview section. If the file you chose was not a valid Circle Track Analyzer file, the program will tell you and you can not choose it. Once a vehicle has been chosen, you can delete it by clicking on the Delete button, or Open it by clicking on the Open button in this window. You can also click on a different vehicle to Preview it or close this window and return to the Main Menu without choosing a new vehicle file. If you are sure of the vehicle you want to open, you can simply double click on it from the Vehicle List. This opens the vehicle without a preview and closes this menu.
Figure 3.15 Engine File Options
Click on File in the Engine, Front Suspension or Rear Suspension menus to Open a set of saved specs, or to save the current set of specs in just that screen. This allows you to build libraries of Engines, Front Suspensions and Rear Suspensions for easily building other complete vehicles in the future. • New blanks out the current specs and
comments. • Open Example opens a library of example
specs provided by Performance Trends. • Open Saved opens a library of specs you have
saved. • Save saves the current specs to the same
name as these specs are currently called. • Save As saves the current specs to a new
name that you will enter.
Current Engine File Name
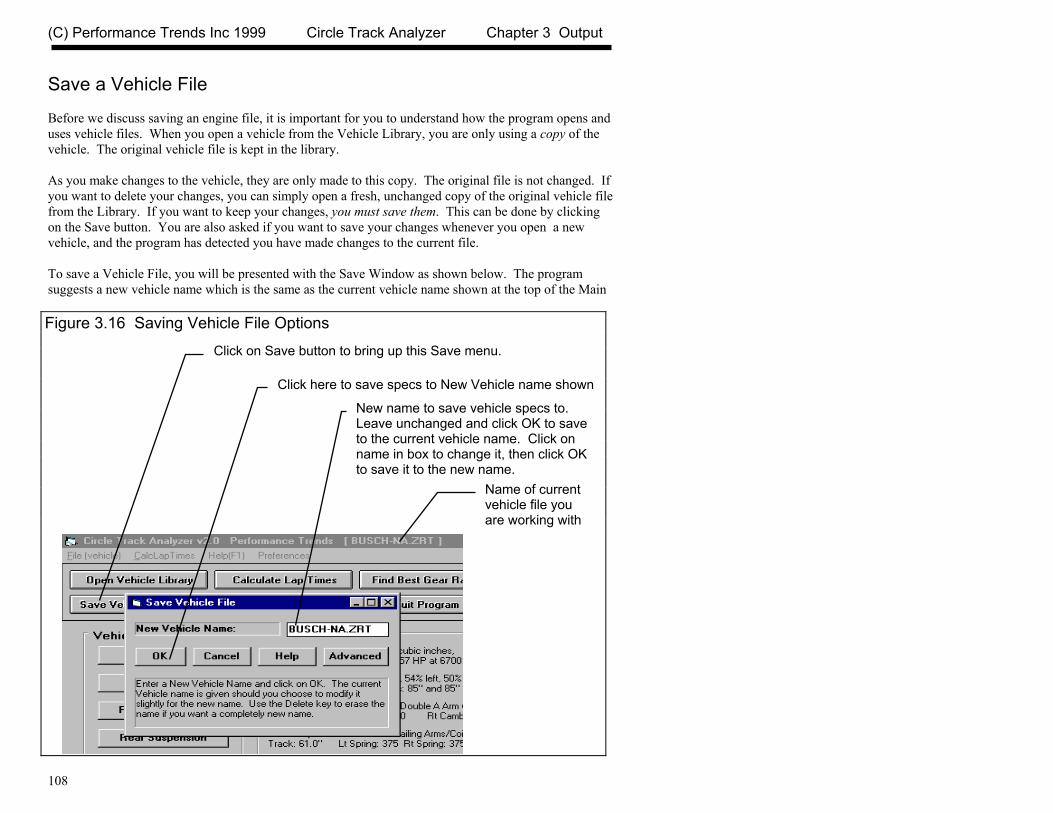
(C) Performance Trends Inc 1999 Circle Track Analyzer Chapter 3 Output
108
Save a Vehicle File Before we discuss saving an engine file, it is important for you to understand how the program opens and uses vehicle files. When you open a vehicle from the Vehicle Library, you are only using a copy of the vehicle. The original vehicle file is kept in the library. As you make changes to the vehicle, they are only made to this copy. The original file is not changed. If you want to delete your changes, you can simply open a fresh, unchanged copy of the original vehicle file from the Library. If you want to keep your changes, you must save them. This can be done by clicking on the Save button. You are also asked if you want to save your changes whenever you open a new vehicle, and the program has detected you have made changes to the current file. To save a Vehicle File, you will be presented with the Save Window as shown below. The program suggests a new vehicle name which is the same as the current vehicle name shown at the top of the Main
Figure 3.16 Saving Vehicle File Options
Name of current vehicle file you are working with
New name to save vehicle specs to. Leave unchanged and click OK to save to the current vehicle name. Click on name in box to change it, then click OK to save it to the new name.
Click here to save specs to New Vehicle name shown
Click on Save button to bring up this Save menu.

(C) Performance Trends Inc 1999 Circle Track Analyzer Chapter 3 Output
109
Menu. If you want to save your changes to the same name, simply click on OK. This will update the current vehicle file with your latest changes. If you want to save the current set of vehicle specs with your changes to a new name (and leave the current vehicle file in the Library unchanged), then click on the suggested file name and modify it as you want. For example, in the window shown on the next page, you may want to add -2 to the current name MUSTANG to create MUSTANG-2 to indicate this is the 2nd revision of MUSTANG. This is the safest way to make changes, because you can always return to an earlier version and see what you had done. Certain file names are not acceptable, including: • Names with more than 3 characters to the right or 8 characters to the left of a period (.) . • Names over 11 characters long (12 characters if one is a period). • Names which include the characters: / \ [ ] : | < > + = ; , * ? or spaces • Names with lower case letters. These letters will be converted to upper case once the file is saved. Vehicle files are saved in the CTADATA subdirectory in the CTA20 subfolder (subdirectory) under PERFTRNS.PTI folder (directory). Unlike earlier DOS Circle Track Analyzer programs, you can copy Windows Circle Track Analyzer files from programs on other computers to this folder (directory) and they will be found by the program. The method of saving Engine, Front Suspension and Rear Suspension files is exactly the same as complete Vehicle Files, except that you access the Save menu by clicking on File at the top of these individual menus, as shown in Figure 3.15. These files are saved to the ENGINE, FRONT or REAR folders (directories),

(C) Performance Trends Inc 1999 Circle Track Analyzer Chapter 3 Output
110
3.4 Printer Output The Circle Track Analyzer can print the tabular test results for a permanent hardcopy by clicking on Print in the menu bar or the Printer button. The menu of options shown in Figure 3.17 will appear. Check the options you want to use for the printout by clicking on any or all of the top for boxes. All options and buttons are discussed in this section.
Include Vehicle Specs Select this options if you want all the current Engine specs, Vehicle specs, etc printed with the results. This will add 1 or more pages to the printed report.
Figure 3.17 Printer Command and Menu of Printer Output Options
Click on Print or the Printer Button for the Printout Options menu shown to the right.
The Windows Printer Setup option lets you choose the printer or printer driver being used by Windows and also the page orientation.
(C) Performance Trends Inc 1999 Circle Track Analyzer Chapter 3 Output
111
Include Vehicle Comments Select this option if you want all the comments for the complete vehicle printed with the results. These are the comments which appear on the Main Screen. Requesting this option may require some results to be printed on a second page. Request Report Comment Select this option if you want to be asked for a comment for each particular report you send to the printer. These "report comments" are useful to identify important points for future reference, like modifications, weather conditions, etc. Requesting this option may require some results to be printed on a second page. Include Eng & Susp Comments Select this option if you want all the comments for the Engine, Front Suspension and Rear Suspension printed with the results. Requesting this option may require some results to be printed on a second page.
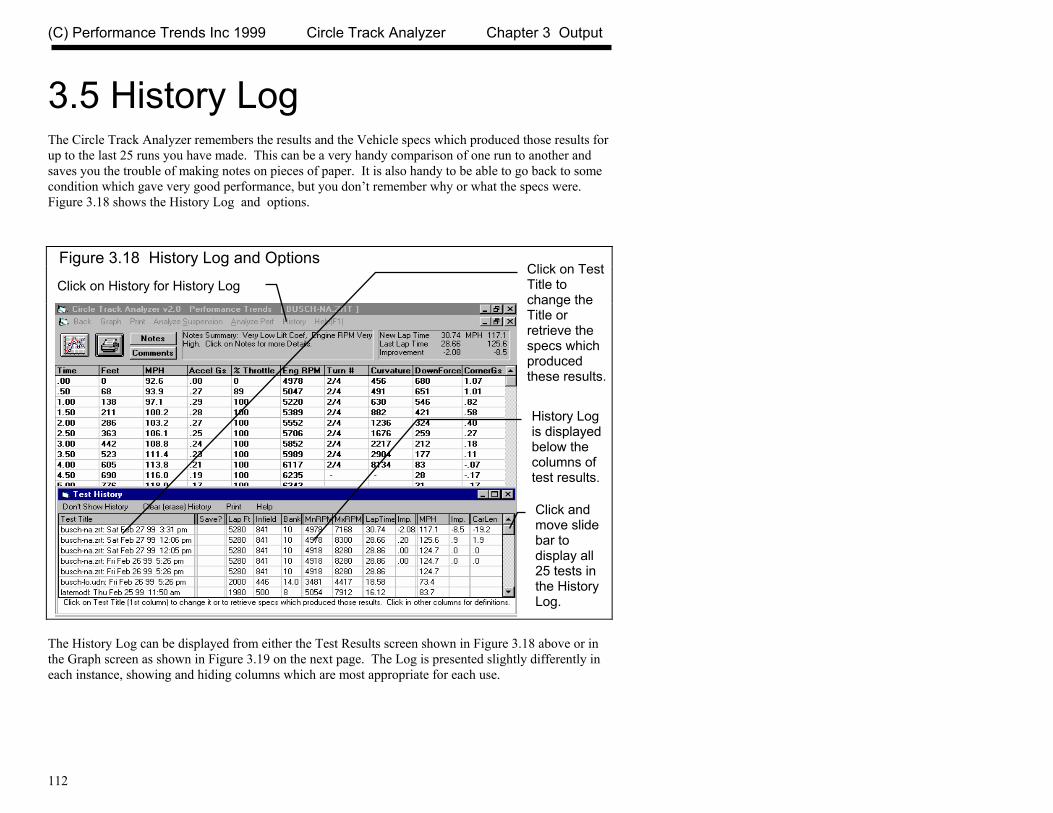
(C) Performance Trends Inc 1999 Circle Track Analyzer Chapter 3 Output
112
3.5 History Log The Circle Track Analyzer remembers the results and the Vehicle specs which produced those results for up to the last 25 runs you have made. This can be a very handy comparison of one run to another and saves you the trouble of making notes on pieces of paper. It is also handy to be able to go back to some condition which gave very good performance, but you don’t remember why or what the specs were. Figure 3.18 shows the History Log and options.
The History Log can be displayed from either the Test Results screen shown in Figure 3.18 above or in the Graph screen as shown in Figure 3.19 on the next page. The Log is presented slightly differently in each instance, showing and hiding columns which are most appropriate for each use.
Figure 3.18 History Log and Options
Click on History for History Log Click on Test Title to change the Title or retrieve the specs which produced these results.
Click and move slide bar to display all 25 tests in the History Log.
History Log is displayed below the columns of test results.
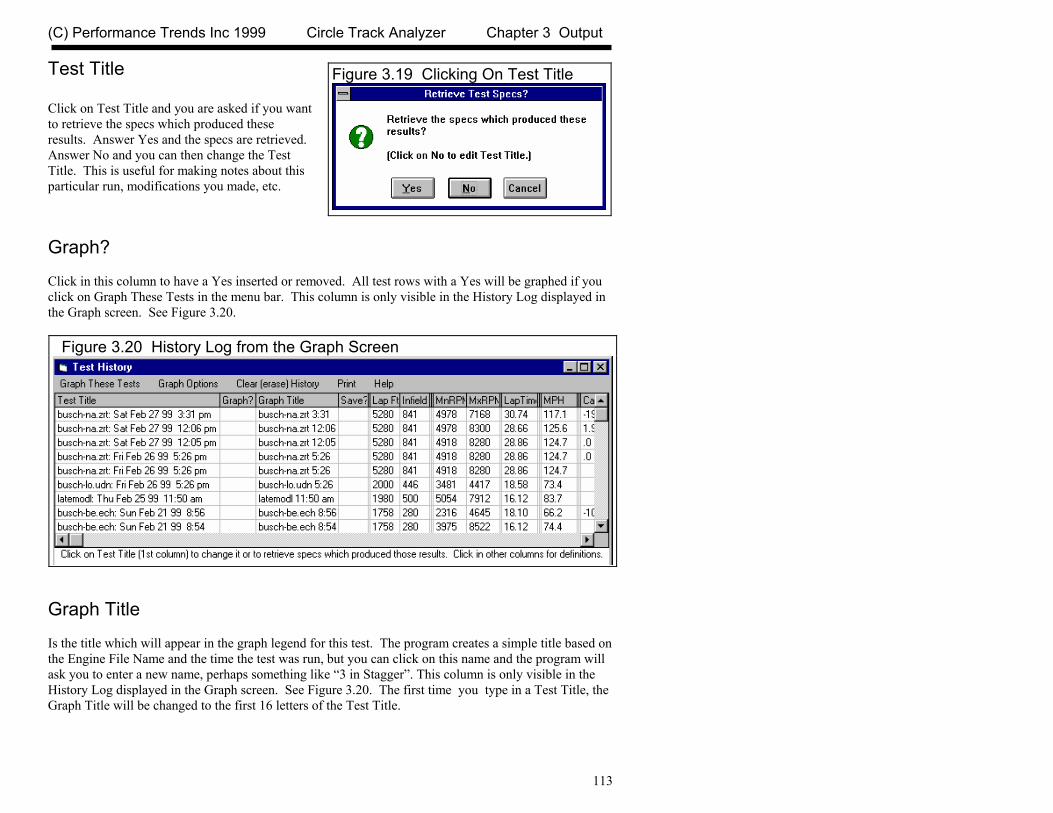
(C) Performance Trends Inc 1999 Circle Track Analyzer Chapter 3 Output
113
Test Title Click on Test Title and you are asked if you want to retrieve the specs which produced these results. Answer Yes and the specs are retrieved. Answer No and you can then change the Test Title. This is useful for making notes about this particular run, modifications you made, etc. Graph? Click in this column to have a Yes inserted or removed. All test rows with a Yes will be graphed if you click on Graph These Tests in the menu bar. This column is only visible in the History Log displayed in the Graph screen. See Figure 3.20.
Graph Title Is the title which will appear in the graph legend for this test. The program creates a simple title based on the Engine File Name and the time the test was run, but you can click on this name and the program will ask you to enter a new name, perhaps something like “3 in Stagger”. This column is only visible in the History Log displayed in the Graph screen. See Figure 3.20. The first time you type in a Test Title, the Graph Title will be changed to the first 16 letters of the Test Title.
Figure 3.19 Clicking On Test Title
Figure 3.20 History Log from the Graph Screen

(C) Performance Trends Inc 1999 Circle Track Analyzer Chapter 3 Output
114
Save? Click in this column to have a Yes inserted or removed. All tests move toward the bottom of the log as new tests are run, and eventually fall off the list. However, tests with a Yes move to the bottom, but do not fall off the list and are saved on the list until you remove the Yes in this column. Tip: If you want to save a test, but do not necessarily want it on the History Log,, click on it to retrieve it and the engine specs which produced it. At the Main Screen, make notes of what this test and engine are. Then save it to the Vehicle Library. Although the test results are not available for graphing, you can open this engine file and recalculate the test results at any time in the future. Lap Ft Is the Lap Distance in feet for these results. This is useful for determining if you are making an “apples and apples” comparison. If the Lap Ft is different, then you should expect different lap times. Infield Is the Infield Width in feet for these results. This is useful for determining if you are making an “apples and apples” comparison. If the Infield Width is different, then you should expect different lap times. MnRPM Is the minimum (or lowest) engine RPM in the turns. MxRPM Is the maximum (or highest) engine RPM right before braking. Lap Time Is the Lap Time is seconds.

(C) Performance Trends Inc 1999 Circle Track Analyzer Chapter 3 Output
115
Imp. Is the improvement in Lap Time for this test compared to the test below it, usually the previous test run. If Lap Time is longer, the Imp. will be negative. MPH Is the average MPH for this test. Imp. Is the improvement in MPH for this test compared to the test below it, usually the previous test run. If MPH is lower (slower), the Imp. will be negative. Car Length Is the improvement in Lap Times expressed in car lengths. The program assumes about 20 feet for a car length. If the Lap Time is longer (slower), the Car Length will be negative.
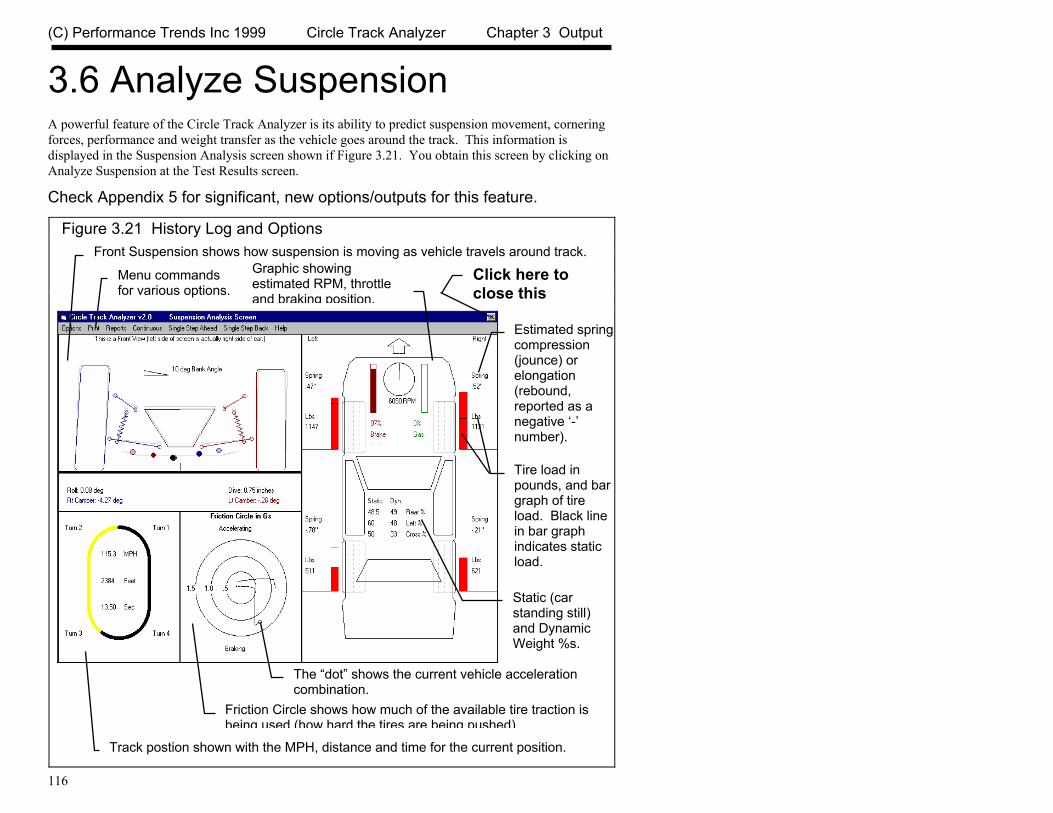
(C) Performance Trends Inc 1999 Circle Track Analyzer Chapter 3 Output
116
3.6 Analyze Suspension A powerful feature of the Circle Track Analyzer is its ability to predict suspension movement, cornering forces, performance and weight transfer as the vehicle goes around the track. This information is displayed in the Suspension Analysis screen shown if Figure 3.21. You obtain this screen by clicking on Analyze Suspension at the Test Results screen.
Check Appendix 5 for significant, new options/outputs for this feature.
Figure 3.21 History Log and Options
Front Suspension shows how suspension is moving as vehicle travels around track.
Track postion shown with the MPH, distance and time for the current position.
Static (car standing still) and Dynamic Weight %s.
Friction Circle shows how much of the available tire traction is being used (how hard the tires are being pushed).
The “dot” shows the current vehicle acceleration combination.
Menu commands for various options.
Graphic showing estimated RPM, throttle and braking position.
Estimated spring compression (jounce) or elongation (rebound, reported as a negative ‘-’ number).
Tire load in pounds, and bar graph of tire load. Black line in bar graph indicates static load.
Click here to close this
(C) Performance Trends Inc 1999 Circle Track Analyzer Chapter 3 Output
117
The only way to return to the program from this screen is by clicking on the [X] button at the upper right corner, or the icon button at the upper left corner. (In Windows 3.1, click on the [-] button in the upper left corner, then select Close.)
This screen is very important to understand how suspension changes will affect suspension motion, tire camber, tire corner rates, roll center motion, all of which are critical for handling and fast lap times. From this screen you can: • Watch the car's performance from the current Test Results. • Compare the current Test Results to a Baseline condition, some previous Test Results you told the
program to save as a Baseline. Baseline conditions are printed or drawn in pink so you can easily see the difference between the Baseline and the Current conditions.
Note that Baseline conditions can only be displayed if the current Test Results and Baseline results are for the same length track and same infield width. This is because the Baseline and current conditions are compared and displayed for the same place on the track. Another important feature of this screen is the Reports option. Reports give summary analysis of the suspension and provide some 'starting point' recommendations for this suspension setup on this particular track. This screen is divided into 4 sections: • Front Suspension (upper left corner) • Total Vehicle (upper right corner) • Track Position (lower left corner) • Friction Circle (middle bottom)
These are discussed below: Front Suspension (upper left corner) This section shows how camber, instant centers, car dive and roll, and roll center change as the car goes around the track. Tire camber is critical to getting the most traction out of your tires which is critical to vehicle handling. If you are also displaying the Baseline condition, the Baseline Roll, Dive and Cambers are printed in pink, and the Baseline Roll Center position is drawn as a Pink dot.

(C) Performance Trends Inc 1999 Circle Track Analyzer Chapter 3 Output
118
Total Vehicle (upper right corner) This section shows how each corner of the car is working: how much weight is on each tire and how much each spring is compressed (from jounce) or elongated (from rebound). The tire weights are displayed with the bar graphs for easy comparisons. Static and dynamic Weight %s are displayed in the center of the screen. Static Weight %s are what you input in the Vehicle Specs menu. Dynamic Weight %s are based on the actual corner weights as the car goes around the track. These depend on aerodynamic downforce, cornering forces, weight transfer, etc. The top of the screen shows bar graphs for the % Brake and Throttle the program assumes the driver is using. A tachometer is displayed showing how RPM is changing, with the actual RPM reading printed below. If you are also displaying the Baseline, Baseline spring compression and tire weights are printed in pink, Baseline tire weights are graphed as a pink outline bar, and Baseline RPM is drawn on the tach and printed. Track Position (lower left corner) This section shows the car's approximate position on the track. The results always start at the beginning of Turn #2, and that is where the Yellow line (indicating the distance the car has traveled) also starts. The position is only approximate because the track is drawn the same even if the actual track is long and narrow (tight) or short and wide (open). Printed inside the track is the MPH, distance in Feet, and elapsed time. If you are also displaying the Baseline condition, the Baseline MPH, Feet, and Time are also printed. Below the track an estimate is made of how far ahead or behind the Baseline condition is from the current Test Results in Car Lengths. Friction Circle (middle bottom) A Friction Circle is a useful way to analyze how hard the tires are working in all 3 directions: accelerating, cornering, and braking. For example, if a tire has enough traction to provide 1 G of acceleration, it probably also has enough traction to provide 1 G of braking and 1 G of cornering. If the driver has enough engine and braking to accelerate and brake at 1 G, and if the driver was using all the available traction from this tire, you would see his current acceleration "dot" somewhere on the 1 G circle. Any time the car was not on the 1 G circle it would be an indication that the car was capable of more performance than what the driver was asking of it.

(C) Performance Trends Inc 1999 Circle Track Analyzer Chapter 3 Output
119
Things the would improve overall vehicle traction will increase the G level which can be sustained on the vehicle, and therefore increase the G level you will see on the Friction Circle. This would include: • More downforce, due to either banking or aerodynamic downforce. • “Stickier” tires. • Keeping the weight between all 4 tires as even as possible (not necessarily the case for dirt cars). • Four wheel drive for accelerating. • Optimum camber (however this is not simulated in this version of Circle Track Analyzer).
If you are also displaying the Baseline condition, the Baseline acceleration is graphed in pink. Menu Options Click on 'Options' to allow extension lines to be drawn or not drawn in the front suspension layout screen, or to display or not display the Baseline conditions. Other options including slowing down or speeding up the Continuous display of the results, or renaming the Baseline condition. Click on 'Print' to print this screen, or change the Windows Printer Setup. Click on 'Continuous' for a continuous display of the vehicle moving around the track. Click on 'Single Step Ahead' or 'Single Step Back' to advance the results ahead or back 1 data point. This allows for more detailed analysis and understanding of the results. When you leave this screen you are asked if you want to save the current Test Results as the Baseline. This is the only way to change the Baseline Condition. Reports One important Menu Option is the ability to produce Suspension Analysis reports, of 4 types: • Suspension Calculations • Suspension Calculations with Comments • ‘Rule of Thumb’ Suggestions • ‘Rule of Thumb’ Adjustments
These are discussed below.

(C) Performance Trends Inc 1999 Circle Track Analyzer Chapter 3 Output
120
Suspension Calculations Suspension Calculations with Comments These reports show calculations concerning the suspension specs (some not found anywhere else in the program) like Roll Stiffness Distribution, Roll Stiffness in degrees per G, etc. Table 3.1 gives definitions of these calculations. The report “with Comments” includes the comments for the Front and Rear Suspensions which you’ve entered at those screens. Table 3.1 Suspension Calculations Definitions Front Suspension Spring Rate, lb/in Front Spring Rate from the Front Suspension Specs menu.
See pages 31-40. Motion Ratio Motion Ratio for Spring is the ratio between an inch of spring
motion to wheel motion. This ratio is corrected for the instant center location, which makes this calculation more accurate and possibly different than what other programs would calculate.
Motion Ratio Squared Motion Ratio squared for Spring. See Motion Ratio above. Spring Angle, deg Spring's installation angle. See Front Suspension Specs
Definitions. See pages 31-40. Wheel Rate, lb/in Spring rate at tire. See list of Definitions in Front Suspension
Specs Screen. See pages 31-40. Instant Center Height, in Height of Instant center of that side of the suspension. See
Front Suspension Specs Screen Definitions. See pages 31-40.
Instant Center Arm from Tire, in Distance from the tire's centerline to the Instant center of that side of the suspension. See Front Suspension Specs Screen Definitions. See pages 31-40.
Scrub Radius, in Tire's scrub radius. See Front Suspension Layout Screen Definitions. See pages 31-40.
Roll Bar Rate, lb/in Is the Roll Bar Rate from the Front Suspension Specs menu. See pages 31-40.
Roll Bar Motion Ratio Is the motion ratio of the roll bar, or what fraction of the tire's motion at its centerline does the roll bar move. Like the spring's motion ratio, this also corrects for the instant center location of the suspension.
Roll Bar Motion Ratio Squared The square of the Roll Bar Motion Ratio. This is the fraction of the Roll Bar Rate which is actually felt at the tires.
Roll Bar Rate at Tires, lb/in Roll Bar Rate times Roll Bar Motion Ratio Squared, or the effective roll bar rate.
Natural Frequency, cycles/sec Is the number of cycles per second the car naturally wants to bounce at. If you removed the shock and jumped on that particular corner of the car, this is the number of bounces you would see in 1 second. Soft sedans have lower

(C) Performance Trends Inc 1999 Circle Track Analyzer Chapter 3 Output
121
frequencies of 1 to 1.3 where race cars have frequencies of 1.8-2.2. Frequencies much higher than this would make the driver's eyes blur and are extremely uncomfortable to the human body.
Roll Center Height, in Roll Center Height. See Front Suspension Layout Screen Definitions. See pages 31-40.
Roll Center Offset, in Roll Center X location. See Front Suspension Specs Definitions. See pages 31-40.
Front Roll Stiffness, ft lbs/deg Is the amount of torque (ft lbs) applied to the car it takes for the front springs to allow the car to roll 1 degree. A real car will roll more than this due to compliance in tires, suspension members, bushings, etc.
% Front Stiffness from Roll Bar The % of the Front Roll Stiffness contributed by the roll bar. % Total Vehicle Roll Stiffness The % of the Total Vehicle's Roll Stiffness contributed by the
front suspension. This usually ends up in the range of 75-85% for front engine/rear drive cars.
Rear Suspension Spring Rate, lb/in Rear Spring Rate from Rear Suspension Specs menu. Natural Frequency, cycles/sec Natural frequency of the rear suspension. See Front
Suspension definitions above. Roll Center Height, in Height of the Rear Roll Center. Most all cars are designed
with the Rear roll center higher than the front, for improved stability.
Rear Roll Stiffness, ft lbs/deg The roll stiffness of the rear suspension. See Front Suspension definitions above.
% Total Vehicle Roll Stiffness The % of the Total Vehicle's Roll Stiffness contributed by the rear suspension. This usually ends up in the range of 15-25% for front engine/rear drive cars.
Total Vehicle Vehicle Roll Stiffness, ft lbs/deg The roll stiffness of the front and rear suspension. See Front
Suspension definitions above. Roll axis to CG ht Moment Arm, in
Is the height of the CG above the roll axis at the CG (center of gravity) location. This is the lever which acts to roll the car as the car corners. The greater this Moment Arm, the more the car will roll. If this height is 0, the car will not roll at all (at least from spring jounce/rebound). See Figure 3.22.
Level ground roll rate, deg/G Is the amount of body roll in degrees produced from spring jounce/rebound when the car corners at 1 G on level ground. The actual car will roll more due to compliance in the tires, suspension members, bushings, etc.
CG Location: Distance Behind Front Axle, in Is the distance toward the rear from the front axle (line
joining the center hubs of the left and right front wheels) where the CG is located based on the Weight% Rear in the
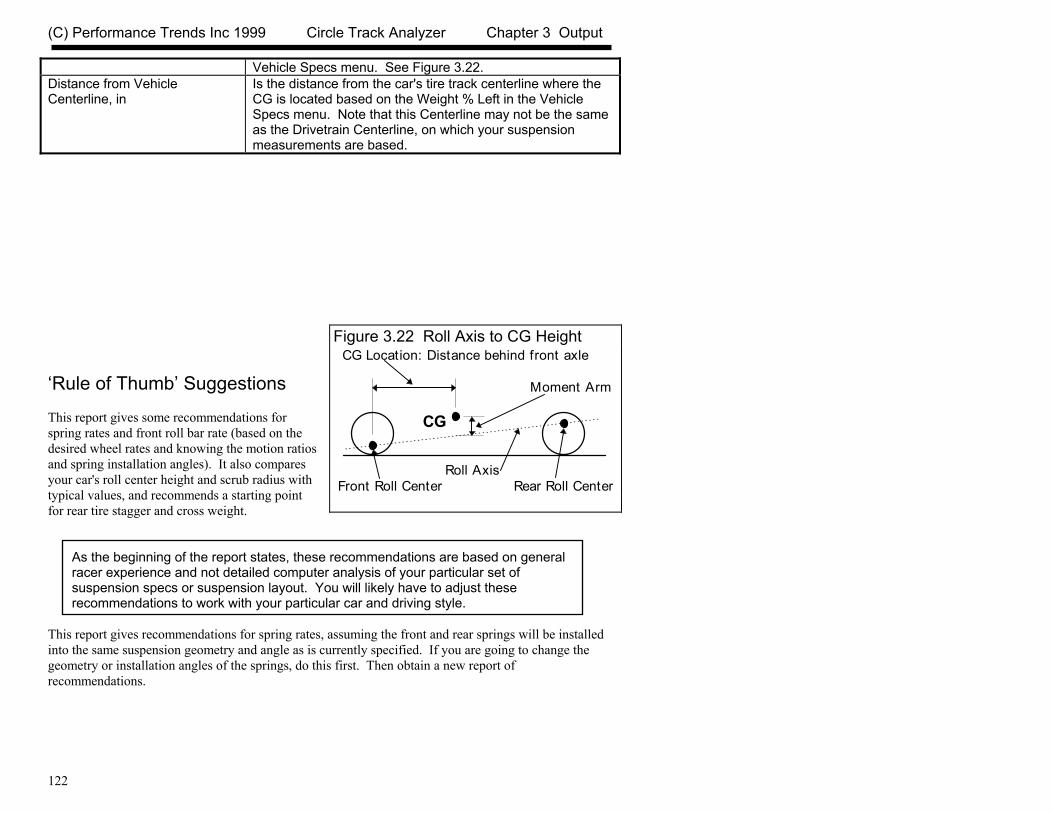
(C) Performance Trends Inc 1999 Circle Track Analyzer Chapter 3 Output
122
Vehicle Specs menu. See Figure 3.22. Distance from Vehicle Centerline, in
Is the distance from the car's tire track centerline where the CG is located based on the Weight % Left in the Vehicle Specs menu. Note that this Centerline may not be the same as the Drivetrain Centerline, on which your suspension measurements are based.
‘Rule of Thumb’ Suggestions This report gives some recommendations for spring rates and front roll bar rate (based on the desired wheel rates and knowing the motion ratios and spring installation angles). It also compares your car's roll center height and scrub radius with typical values, and recommends a starting point for rear tire stagger and cross weight.
As the beginning of the report states, these recommendations are based on general racer experience and not detailed computer analysis of your particular set of suspension specs or suspension layout. You will likely have to adjust these recommendations to work with your particular car and driving style.
This report gives recommendations for spring rates, assuming the front and rear springs will be installed into the same suspension geometry and angle as is currently specified. If you are going to change the geometry or installation angles of the springs, do this first. Then obtain a new report of recommendations.
Figure 3.22 Roll Axis to CG Height CG Location: Distance behind front axle
Moment Arm
CG
Roll Axis Front Roll Center Rear Roll Center
(C) Performance Trends Inc 1999 Circle Track Analyzer Chapter 3 Output
123
‘Rule of Thumb’ Adjustments This report is a handy guide, listing vehicle modifications to correct various handling problems. The modifications are listed with those usually having the most effect first. This report is exactly the same each time it is printed and is based on racer and chassis builder experience. It is NOT based on computer analysis of your particular vehicle or suspension specs. Check Appendix 5 for significant, new options, reports and calculated outputs for this feature.

(C) Performance Trends Inc 1999 Circle Track Analyzer Chapter 3 Output
124
(C) Performance Trends Inc 1999 Circle Track Analyzer Chapter 4 Examples
125
Chapter 4 Examples Each of these examples become progressively more complex, assuming you have performed and understand the preceding example. Section 1.5's example is somewhat more basic than Example 4.1, so it may be a better place to start if Example 4.1 looks complicated.
The results shown in these examples may be somewhat different than what you obtain with your particular version of the program That is due to minor upgrades in the calculations in later versions.

(C) Performance Trends Inc 1999 Circle Track Analyzer Chapter 4 Examples
126
(C) Performance Trends Inc 1999 Circle Track Analyzer Chapter 4 Examples
127
Example 4.1 Changing Axle Ratio Example 4.1 will be fairly simple to get you started. We will simulate a common modification, changing the Rear Axle Ratio. We will see the effect on Lap Times, MPH, engine RPM range, etc. First, start the Circle Track Analyzer program following the procedure in Section 1.4 by either:
• Clicking on the Circle Track Analyzer v2.0 icon in the Perf. Trends program group (Windows 3.1)
• Clicking on Start, Programs, Perf. Trends, then Circle Track Analyzer v2.0 (Windows 95 and 98)
• Clicking on the CTA.EXE (CTA) program under the CTA20 directory (folder) under the PERFTRNS.PTI directory (folder) using File Manager (Windows Explorer). (Terms in parentheses are for Windows 95 and 98.)
You will be shown the Circle Track Analyzer’s Main Menu, Figure 4.1. Notice at the top of the screen that the current Vehicle file is a LATEMODL. Although these specs may not match your car, follow along to see how to use the program’s many features. If it is not LATEMODL.355 (late model with 355 Chevy) or if you think the current car’s specs have been changed, you can Open up this Vehicle file by clicking on the Open button as shown in Figure 4.2. Open the Vehicle file LATEMODL.355 shown in Figure 4.2. If you have made any changes to the vehicle which originally appeared at the top of the Main Menu, the program will first ask you if you want to save these changes. Answer No and you will be returned to the Main Menu with the LATEMODL.355 specs loaded into the program. Click on the different categories of vehicle specs or the Running Conditions button on the Main Menu. Since we want to see the effect of changing the axle ratio on this vehicle, we first need to get a "baseline" test. A "baseline" is a performance test before the modification. Therefore, if you examine the contents of any component menus, leave all current values as they are. Click on the Running Conditions button and you will now be shown the Running Conditions screen. This screen gives the conditions for calculating performance like track weather, the track specs, driver preferences, etc. For now, leave these values as they are.

(C) Performance Trends Inc 1999 Circle Track Analyzer Chapter 4 Examples
128
Proceed with the calculations by clicking on the Running Conditions button in this menu. The program will display the Calculation Progress indicator as calculations progress. When the calculations are finished, the performance results will look like Figure 4.3. You now see a screen with columns of numbers describing the LATEMODL.355's run around half the track. The program assumes the other half is exactly the same as the first half, so only calculates half a lap. At the top in the right corner is a summary of the run and any improvement between the current run and the last run. The Last run can be from the last time you ran the program. (The program remembers results from different sessions, between computer shutdowns and start ups.)
Figure 4.1 Main Menu
Click here to show Running Conditions and then Calculate Performance.
Click here to Calculate Performance in one step.
Name of Vehicle you are working with.
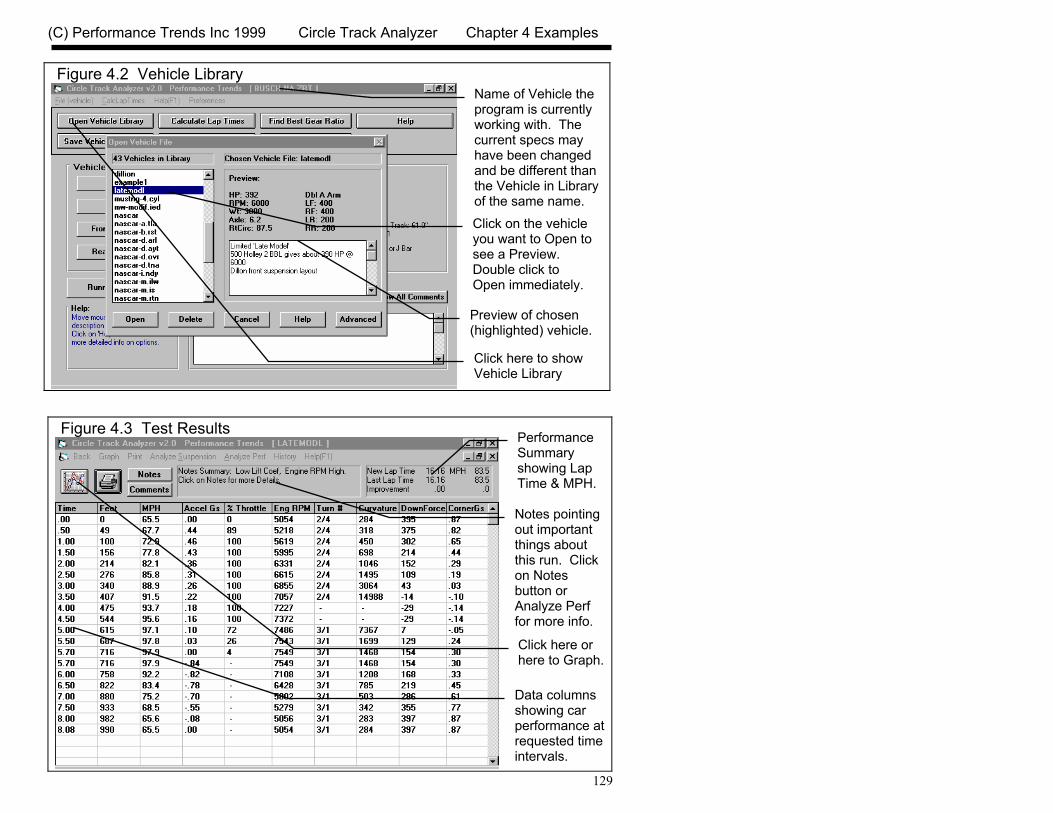
(C) Performance Trends Inc 1999 Circle Track Analyzer Chapter 4 Examples
129
Figure 4.3 Test Results
Figure 4.2 Vehicle Library
Click on the vehicle you want to Open to see a Preview. Double click to Open immediately.
Name of Vehicle the program is currently working with. The current specs may have been changed and be different than the Vehicle in Library of the same name.
Preview of chosen (highlighted) vehicle.
Click here to show Vehicle Library
Performance Summary showing Lap Time & MPH.
Notes pointing out important things about this run. Click on Notes button or Analyze Perf for more info.
Click here or here to Graph.
Data columns showing car performance at requested time intervals.
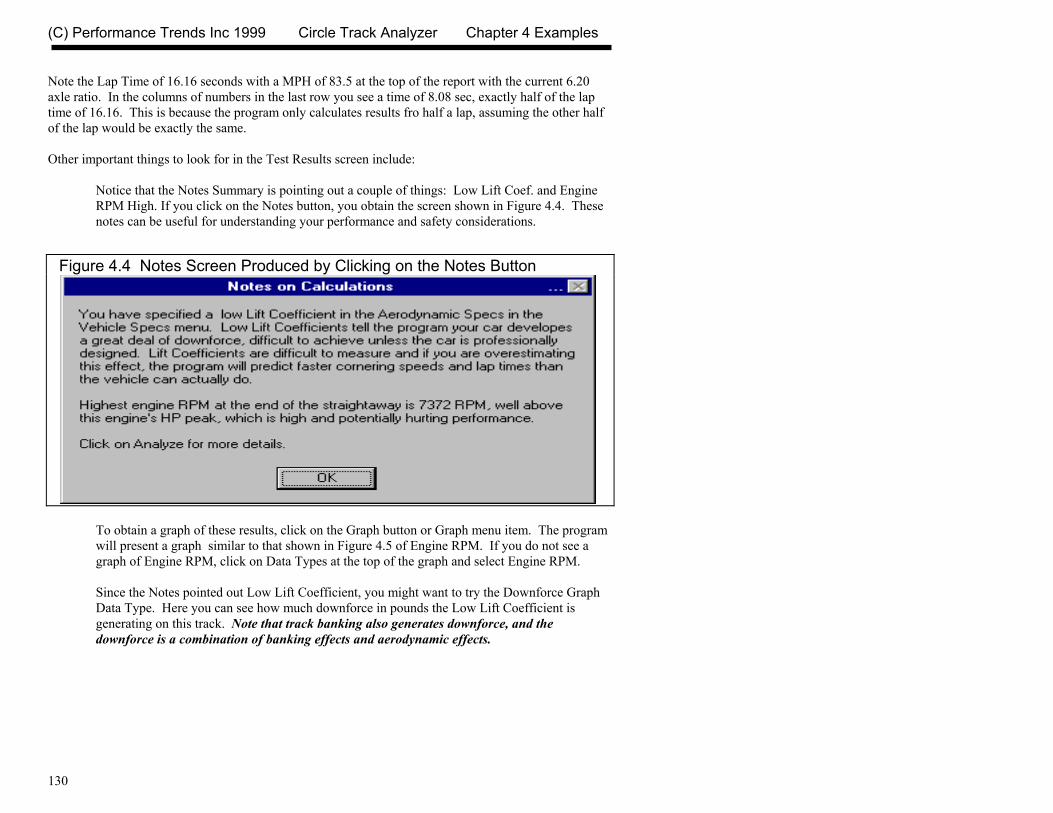
(C) Performance Trends Inc 1999 Circle Track Analyzer Chapter 4 Examples
130
Note the Lap Time of 16.16 seconds with a MPH of 83.5 at the top of the report with the current 6.20 axle ratio. In the columns of numbers in the last row you see a time of 8.08 sec, exactly half of the lap time of 16.16. This is because the program only calculates results fro half a lap, assuming the other half of the lap would be exactly the same. Other important things to look for in the Test Results screen include:
Notice that the Notes Summary is pointing out a couple of things: Low Lift Coef. and Engine RPM High. If you click on the Notes button, you obtain the screen shown in Figure 4.4. These notes can be useful for understanding your performance and safety considerations.
To obtain a graph of these results, click on the Graph button or Graph menu item. The program will present a graph similar to that shown in Figure 4.5 of Engine RPM. If you do not see a graph of Engine RPM, click on Data Types at the top of the graph and select Engine RPM. Since the Notes pointed out Low Lift Coefficient, you might want to try the Downforce Graph Data Type. Here you can see how much downforce in pounds the Low Lift Coefficient is generating on this track. Note that track banking also generates downforce, and the downforce is a combination of banking effects and aerodynamic effects.
Figure 4.4 Notes Screen Produced by Clicking on the Notes Button
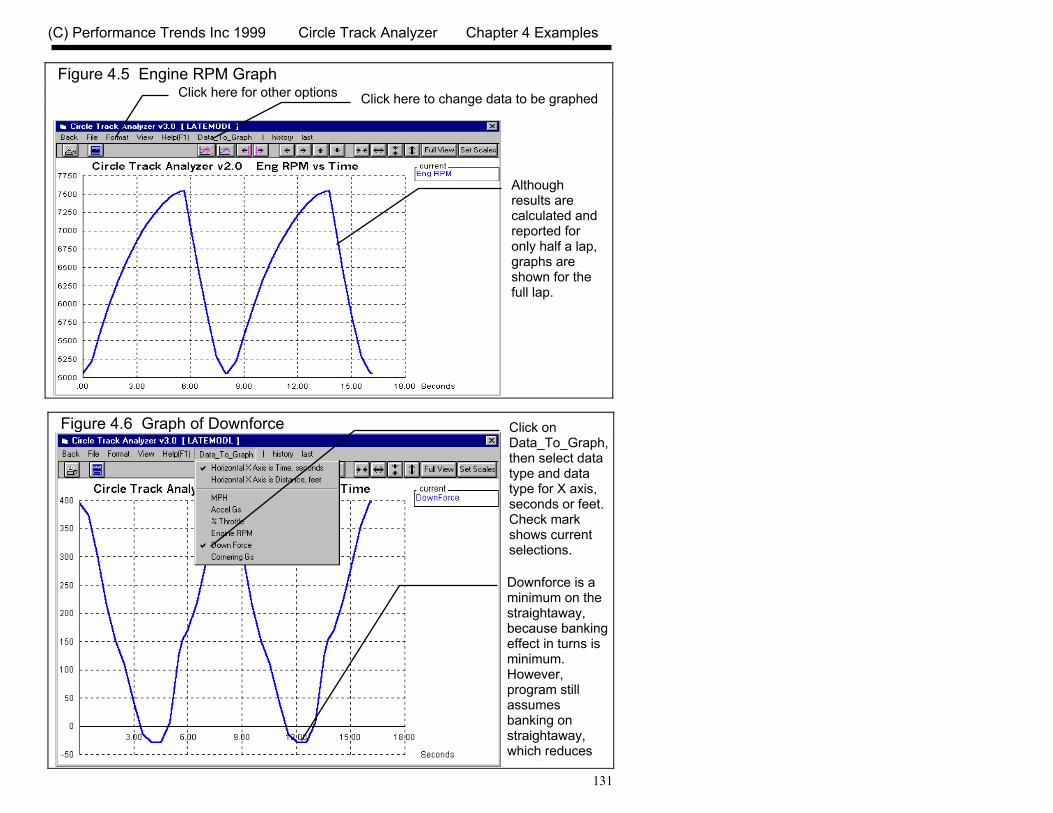
(C) Performance Trends Inc 1999 Circle Track Analyzer Chapter 4 Examples
131
Figure 4.6 Graph of Downforce
Figure 4.5 Engine RPM Graph
Click here to change data to be graphed Click here for other options
Click on Data_To_Graph, then select data type and data type for X axis, seconds or feet. Check mark shows current selections.
Downforce is a minimum on the straightaway, because banking effect in turns is minimum. However, program still assumes banking on straightaway, which reduces
f
Although results are calculated and reported for only half a lap, graphs are shown for the full lap.
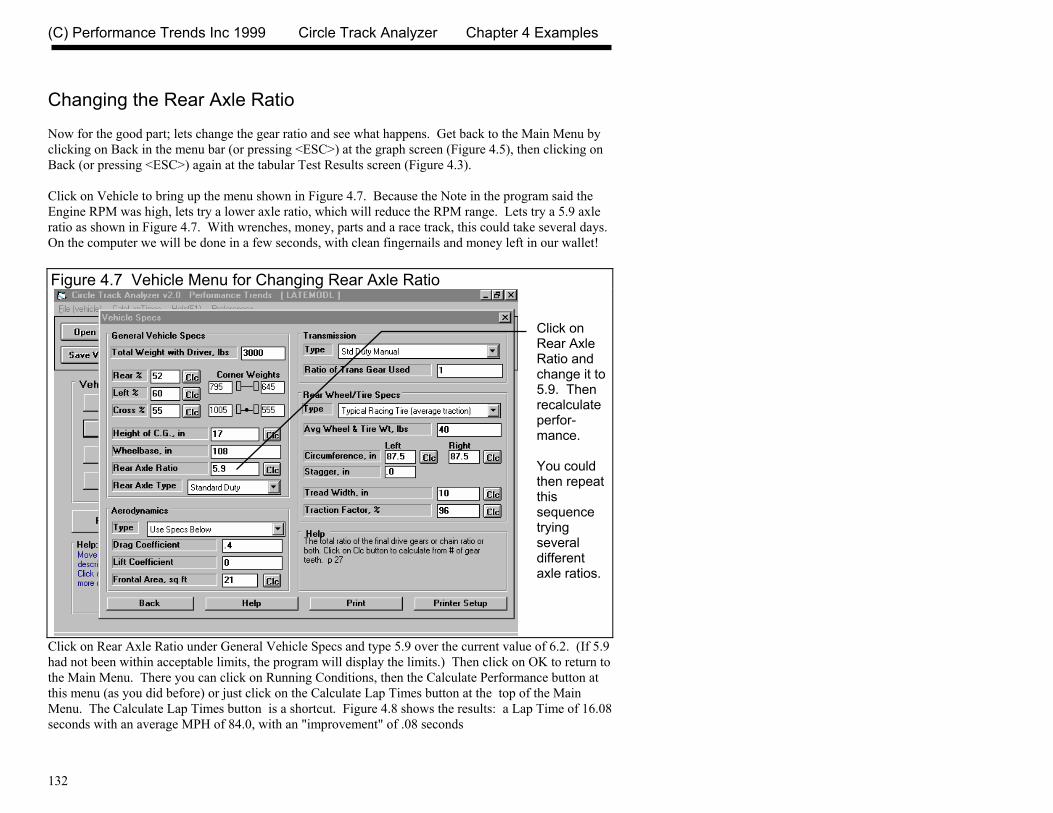
(C) Performance Trends Inc 1999 Circle Track Analyzer Chapter 4 Examples
132
Changing the Rear Axle Ratio Now for the good part; lets change the gear ratio and see what happens. Get back to the Main Menu by clicking on Back in the menu bar (or pressing <ESC>) at the graph screen (Figure 4.5), then clicking on Back (or pressing <ESC>) again at the tabular Test Results screen (Figure 4.3). Click on Vehicle to bring up the menu shown in Figure 4.7. Because the Note in the program said the Engine RPM was high, lets try a lower axle ratio, which will reduce the RPM range. Lets try a 5.9 axle ratio as shown in Figure 4.7. With wrenches, money, parts and a race track, this could take several days. On the computer we will be done in a few seconds, with clean fingernails and money left in our wallet!
Click on Rear Axle Ratio under General Vehicle Specs and type 5.9 over the current value of 6.2. (If 5.9 had not been within acceptable limits, the program will display the limits.) Then click on OK to return to the Main Menu. There you can click on Running Conditions, then the Calculate Performance button at this menu (as you did before) or just click on the Calculate Lap Times button at the top of the Main Menu. The Calculate Lap Times button is a shortcut. Figure 4.8 shows the results: a Lap Time of 16.08 seconds with an average MPH of 84.0, with an "improvement" of .08 seconds
Figure 4.7 Vehicle Menu for Changing Rear Axle Ratio
Click on Rear Axle Ratio and change it to 5.9. Then recalculate perfor-mance. You could then repeat this sequence trying several different axle ratios.
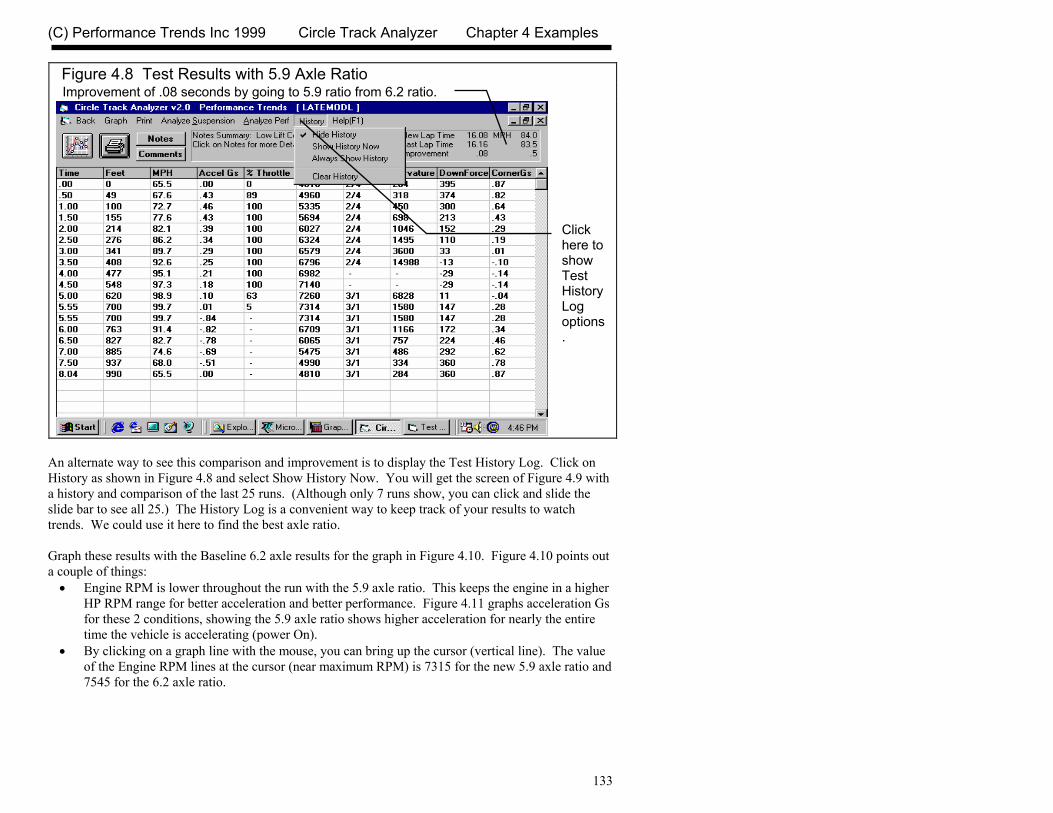
(C) Performance Trends Inc 1999 Circle Track Analyzer Chapter 4 Examples
133
An alternate way to see this comparison and improvement is to display the Test History Log. Click on History as shown in Figure 4.8 and select Show History Now. You will get the screen of Figure 4.9 with a history and comparison of the last 25 runs. (Although only 7 runs show, you can click and slide the slide bar to see all 25.) The History Log is a convenient way to keep track of your results to watch trends. We could use it here to find the best axle ratio. Graph these results with the Baseline 6.2 axle results for the graph in Figure 4.10. Figure 4.10 points out a couple of things: • Engine RPM is lower throughout the run with the 5.9 axle ratio. This keeps the engine in a higher
HP RPM range for better acceleration and better performance. Figure 4.11 graphs acceleration Gs for these 2 conditions, showing the 5.9 axle ratio shows higher acceleration for nearly the entire time the vehicle is accelerating (power On).
• By clicking on a graph line with the mouse, you can bring up the cursor (vertical line). The value of the Engine RPM lines at the cursor (near maximum RPM) is 7315 for the new 5.9 axle ratio and 7545 for the 6.2 axle ratio.
Figure 4.8 Test Results with 5.9 Axle Ratio
Improvement of .08 seconds by going to 5.9 ratio from 6.2 ratio.
Click here to show Test History Log options.

(C) Performance Trends Inc 1999 Circle Track Analyzer Chapter 4 Examples
134
Figure 4.10 Comparing Engine RPM
Figure 4.9 Test Results with Test History Log
“Last” run with 6.2 Axle Ratio
History Log showing 2.0 and 3.08 axle results and “improvement”
Click and move slide bar to view all 25 of the last tests
Note showing additional test History Log options.
Current run with 5.9 Axle Ratio
Click on the graph line to bring up the cursor line.
Engine RPMs at the cursor are shown here.
Click on Last to show pre-vious results

(C) Performance Trends Inc 1999 Circle Track Analyzer Chapter 4 Examples
135
Figure 4.11 Acceleration Gs for the Two Axle Ratios
Figure 4.12 Changing Test Name in History Log
Click on Data_ to_Graph and select Accel Gs for this graph.
5.9 Ratio shows higher acceleration for nearly the entire time the vehicle is accelerating.
High negative acceleration due to braking is about same for both tests.
Click on Test Name in History Log to change the name to something more descriptive than the program’s default name.
Enter name nere, then click OK.

(C) Performance Trends Inc 1999 Circle Track Analyzer Chapter 4 Examples
136
Click on Back to return to the Test Results screen, then click on History and Show History Now. A useful feature of the History Log is the ability to change the Test Title in the first column to anything you want. Click on the Test Title for the 5.9 axle ratio run, then answer No to the question “Retrieve the specs which produced these results?”. You will be shown a test input box like that of Figure 4.12. (You will find the ability to Retrieve specs which produces certain results in the History Log to also be a very useful feature. Another useful feature is to click on History, then Clear History Log. This lets you erase all the History rows, which is useful when you are starting on a new project.) We could continue to try different axle ratios through “cut and try” to find the ratio giving the quickest lap times. However the program has a built in feature to do this automatically. Click on Back at the top of the Test Results screen. Then at the Main Screen, click on Find Best Gear Ratio. The program will automatically try a wide range of axle ratios to see which gives the quickest lap times. For these LATEMODL.355 specs, the program finds the 5.4 axle ratio is the quickest, and it asks you if it should load in that ratio. Answer Yes, and you find that the new lap time is 16.04 seconds, .04 better than 5.9 and .12 seconds better than 6.2. However at a different track, a different axle ratio would be best.
Figure 4.13 Finding Best Axle Ratio
Click here to have program find quickest axle ratio for current specs.
Program will automatically try several different axle ratios to find the one giving quickest lap times.
(C) Performance Trends Inc 1999 Circle Track Analyzer Chapter 4 Examples
137
Conclusions: • The Circle Track Analyzer allows you to easily maneuver between screens and menus with the click
on a mouse. • The program has several useful features like the Performance Summary and History Log to track you
changes, and the Notes and Graphs to understand and analyze your performance. • The Circle Track Analyzer allows you to simulate "real world" modifications by simply typing in
new specifications which simulate the hardware modification. • Like most other vehicle settings, there is no single "best" axle ratio for the LATEMODL.355. The
"best" ratio will change depending on other specs like Track Length and Banking.

(C) Performance Trends Inc 1999 Circle Track Analyzer Chapter 4 Examples
138
Example 4.2 Calibrating Circle Track Analyzer for Your Car When using the Circle Track Analyzer to predict the effect of modifications on a certain vehicle, it is best to first "calibrate" the program to match the vehicle's actual results. "Calibrate" means to fine tune an instrument (the Circle Track Analyzer in this case) to improve its accuracy. Once the program is calibrated, its predictions are more likely to match your vehicle's response to modifications. We will calibrate the program for a Late Model with a 406 motor. The car runs 16 second laps at the local low banked quarter mile track. Ideally you could just go to the Vehicle Library and find an exact match for this car. However there probably is not an exact match for any car already in the library, so we will have to build one by adjusting the specs for a car from the Vehicle Library. You can start with a completely blank screen for all vehicle specs by clicking on File, then New at the Main Screen. You can also blank out just the Engine, Front Suspension or Rear Suspension by clicking on File, then New at their respective screens. However, for most beginners it is recommended you always start with a example vehicle. This way, for specs you don’t know, there is already a spec entered which may be close to matching your vehicle. The LATEMODL.355 in the Vehicle Library would be a logical choice. (It actually doesn’t matter which vehicle you start with. Once you have entered in the specs for your car, you will get the same lap times even if you start with a Quarter Midget or Busch car. The advantage of starting with a car close to your car is that its specs are more likely to be accurate for specs you don’t know. Click on LATEMODL in the Vehicle Library, then click on Open to open it. Now you will start to actually enter specs for your car.

(C) Performance Trends Inc 1999 Circle Track Analyzer Chapter 4 Examples
139
Engine specs Click on Engine specs at the Main Menu to display the current power specs for the Late Model’s 355 Chevy. You could enter the cubic inches, pick a clutch setup and type in a dyno curve for your engine. However, you don’t know your engine’s power curve. Fortunately, there are several options for building a power curve, which include: • Use the current curve which came with the Late Model file. The engine comments show that this
is for a 355 Chevy, so this may not be the best choice. • If you had a complete dyno curve, you could enter the dyno curve in the right hand section of this
screen. This is usually the most accurate method, however be sure the dyno curve covers a wide RPM range. You may have to estimate and enter torque and HP at higher and lower RPMs than was actually run on the dyno. For example, if your dyno run is from 4500 to 7000, estimate and enter data at 3000, 3500, 4000 RPM and 7500 and 8000. This is especially important if you run the engine on the track above or below the RPMs of the dyno curve. The program assumes power drops off rapidly above and below the RPMs for which you have actually entered torque and HP.
• Pick an example power curve supplied be Performance Trends. This is done by clicking on File at the top of the Engine screen, then selecting Open Example Engine. This is a good choice if there is an example which matches your engine fairly closely.
• You could build a power curve in one of Performance Trends’ Windows Engine Analyzer programs, then send it to the Circle Track Analyzer.
Figure 4.14 Engine Examples
Click on File, then Open Example Engine to load in example actual dyno curves.
Click on engines to obtain a preview, where you can tell by the comments if this engine may be similar to your engine.
Click on Calculate to estimate a power curve from only a couple of simple inputs, like cubic inches and a general description.
Click here to load an Engine Analyzer power curve.
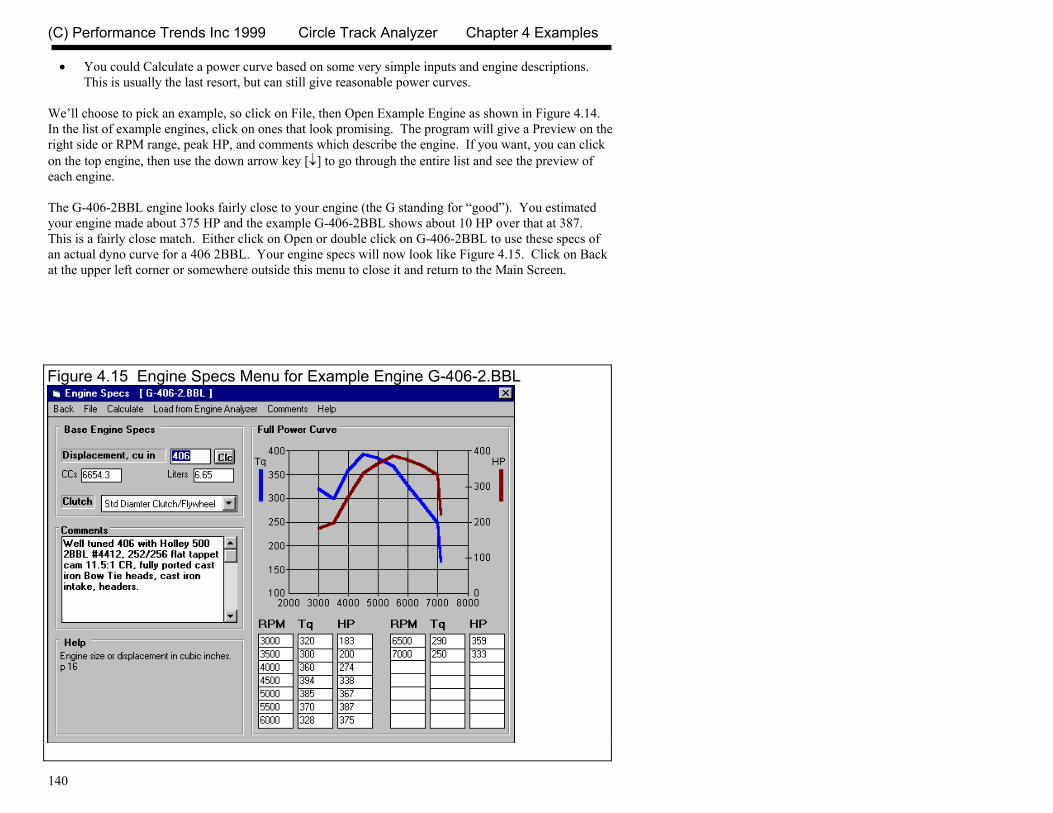
(C) Performance Trends Inc 1999 Circle Track Analyzer Chapter 4 Examples
140
• You could Calculate a power curve based on some very simple inputs and engine descriptions. This is usually the last resort, but can still give reasonable power curves.
We’ll choose to pick an example, so click on File, then Open Example Engine as shown in Figure 4.14. In the list of example engines, click on ones that look promising. The program will give a Preview on the right side or RPM range, peak HP, and comments which describe the engine. If you want, you can click on the top engine, then use the down arrow key [↓] to go through the entire list and see the preview of each engine. The G-406-2BBL engine looks fairly close to your engine (the G standing for “good”). You estimated your engine made about 375 HP and the example G-406-2BBL shows about 10 HP over that at 387. This is a fairly close match. Either click on Open or double click on G-406-2BBL to use these specs of an actual dyno curve for a 406 2BBL. Your engine specs will now look like Figure 4.15. Click on Back at the upper left corner or somewhere outside this menu to close it and return to the Main Screen.
Figure 4.15 Engine Specs Menu for Example Engine G-406-2.BBL

(C) Performance Trends Inc 1999 Circle Track Analyzer Chapter 4 Examples
141
Vehicle Specs Click on Vehicle to open the Vehicle Specs menu shown in Figure 4.16. This is one screen where there are no examples to open. That is because all these specs can vary so much between different cars and different track rules. Go through each specs and enter a number for your car.
General Vehicle Specs Enter the vehicle weight with driver and fuel level you want to simulate. Enter the weight %s if you know them. If you don’t know them, but do know the corner weights, click on one of the Clc (calculate) buttons next to them. They will open up a Calculation menu shown in Figure 4.17. Note that this menu will open up with the corner weights for the current car already entered. You will have to type your weights over these weights. When all 4 of your corner weights have been
Figure 4.16 Vehicle Specs
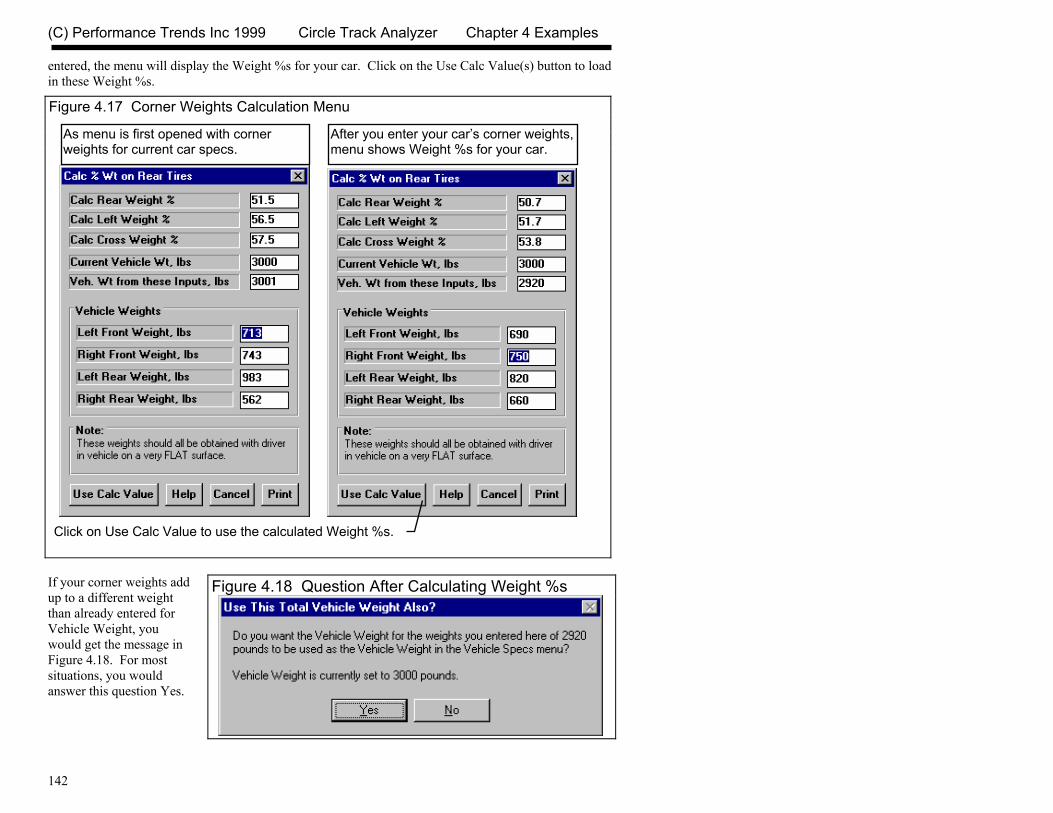
(C) Performance Trends Inc 1999 Circle Track Analyzer Chapter 4 Examples
142
entered, the menu will display the Weight %s for your car. Click on the Use Calc Value(s) button to load in these Weight %s.
If your corner weights add up to a different weight than already entered for Vehicle Weight, you would get the message in Figure 4.18. For most situations, you would answer this question Yes.
Figure 4.17 Corner Weights Calculation Menu
Figure 4.18 Question After Calculating Weight %s
As menu is first opened with corner weights for current car specs.
After you enter your car’s corner weights, menu shows Weight %s for your car.
Click on Use Calc Value to use the calculated Weight %s.
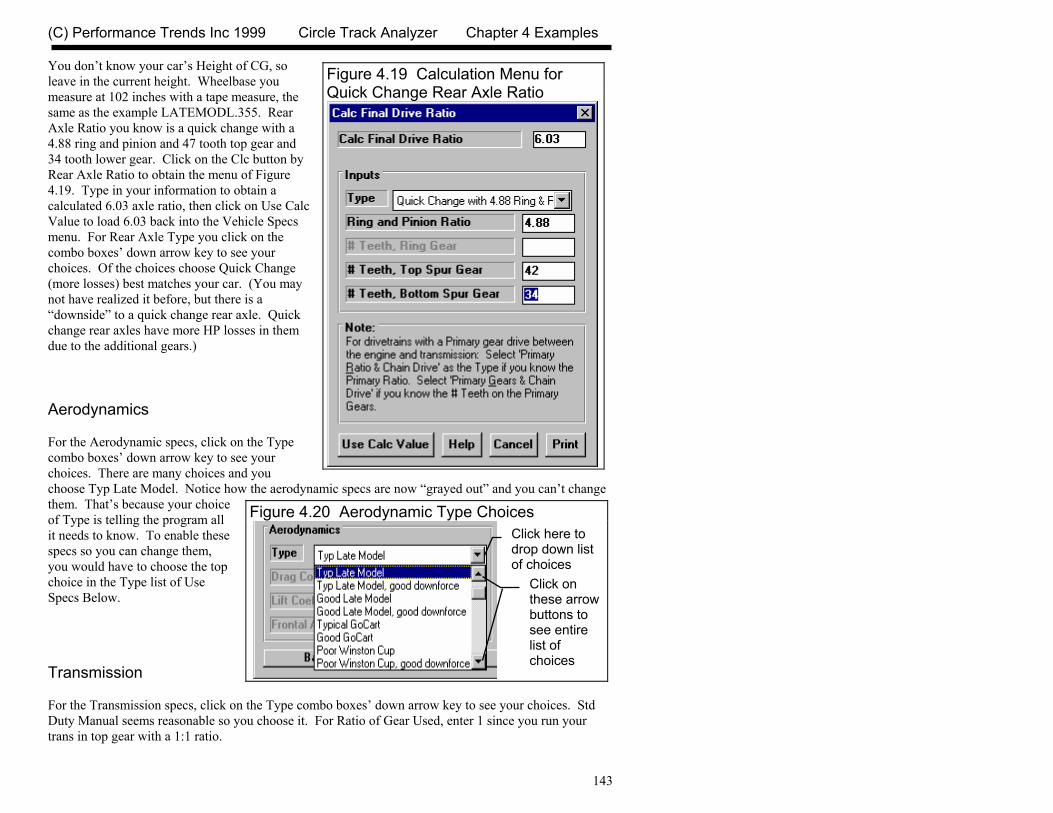
(C) Performance Trends Inc 1999 Circle Track Analyzer Chapter 4 Examples
143
You don’t know your car’s Height of CG, so leave in the current height. Wheelbase you measure at 102 inches with a tape measure, the same as the example LATEMODL.355. Rear Axle Ratio you know is a quick change with a 4.88 ring and pinion and 47 tooth top gear and 34 tooth lower gear. Click on the Clc button by Rear Axle Ratio to obtain the menu of Figure 4.19. Type in your information to obtain a calculated 6.03 axle ratio, then click on Use Calc Value to load 6.03 back into the Vehicle Specs menu. For Rear Axle Type you click on the combo boxes’ down arrow key to see your choices. Of the choices choose Quick Change (more losses) best matches your car. (You may not have realized it before, but there is a “downside” to a quick change rear axle. Quick change rear axles have more HP losses in them due to the additional gears.) Aerodynamics For the Aerodynamic specs, click on the Type combo boxes’ down arrow key to see your choices. There are many choices and you choose Typ Late Model. Notice how the aerodynamic specs are now “grayed out” and you can’t change them. That’s because your choice of Type is telling the program all it needs to know. To enable these specs so you can change them, you would have to choose the top choice in the Type list of Use Specs Below. Transmission For the Transmission specs, click on the Type combo boxes’ down arrow key to see your choices. Std Duty Manual seems reasonable so you choose it. For Ratio of Gear Used, enter 1 since you run your trans in top gear with a 1:1 ratio.
Figure 4.20 Aerodynamic Type Choices
Figure 4.19 Calculation Menu for Quick Change Rear Axle Ratio
Click on these arrow buttons to see entire list of choices
Click here to drop down list of choices

(C) Performance Trends Inc 1999 Circle Track Analyzer Chapter 4 Examples
144
Rear Tires For the Rear Tires specs, click on the Type combo boxes’ down arrow key to see your choices. Typical Racing Tire (average traction) seems the closest match for your 10” tires. You’re not sure of the Wheel & Tire weight, but the current setting of 40 seems about right, so you leave it 40. You enter in your Left and Right rear tires’ circumferences of 87 and 89 and the program shows you the Stagger of 2”. Enter in the Tread Width of 10”. Click on the Clc button by Traction Factor to be shown the Calculation Menu of Figure 4.21. Click on the combo boxes’ down arrow key for your choices and choose Average Suspension Setup. Click on the Back button to return to the Main Screen. Front Suspension Click on Front Suspension to open the Front Suspension Specs menu shown in Figure 4.23. You may first be given an important notice, shown in Figure 4.22. The Circle Track Analyzer can not analyze all details of handling and vehicle performance.
Figure 4.21 Calculation Menu to Help Estimate Tire Traction Factor
Figure 4.22 Tip on Limitations of Circle Track Analyzer
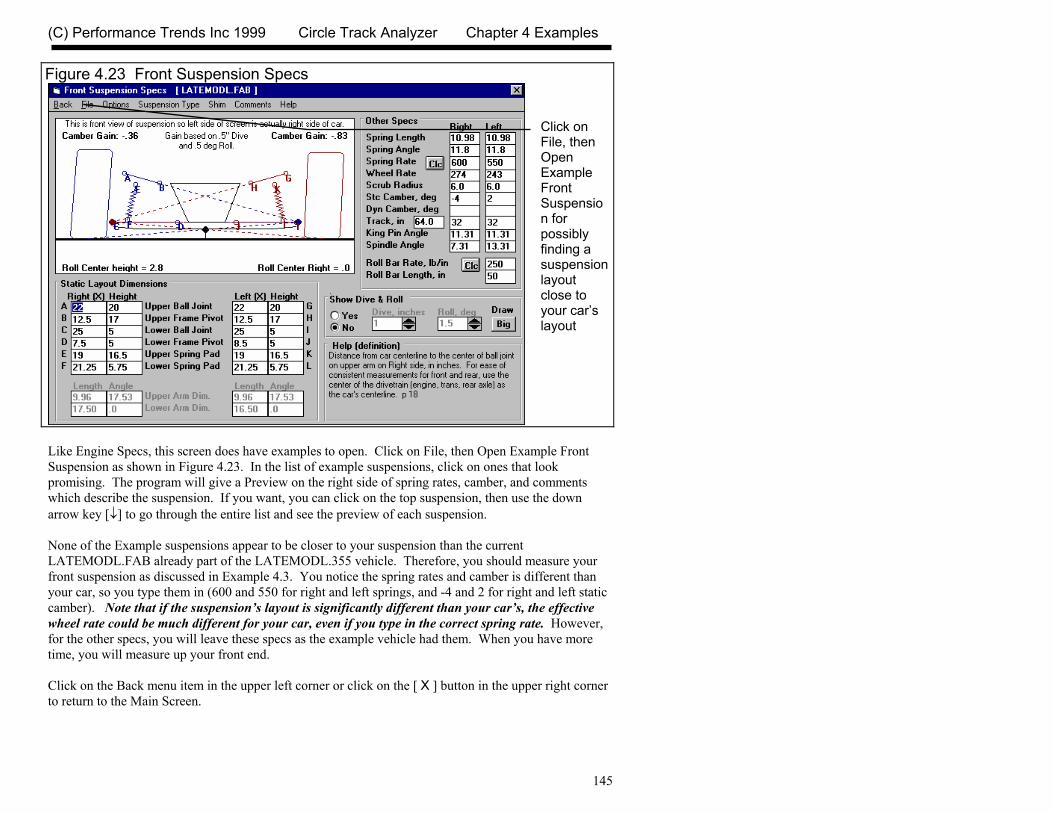
(C) Performance Trends Inc 1999 Circle Track Analyzer Chapter 4 Examples
145
Like Engine Specs, this screen does have examples to open. Click on File, then Open Example Front Suspension as shown in Figure 4.23. In the list of example suspensions, click on ones that look promising. The program will give a Preview on the right side of spring rates, camber, and comments which describe the suspension. If you want, you can click on the top suspension, then use the down arrow key [↓] to go through the entire list and see the preview of each suspension. None of the Example suspensions appear to be closer to your suspension than the current LATEMODL.FAB already part of the LATEMODL.355 vehicle. Therefore, you should measure your front suspension as discussed in Example 4.3. You notice the spring rates and camber is different than your car, so you type them in (600 and 550 for right and left springs, and -4 and 2 for right and left static camber). Note that if the suspension’s layout is significantly different than your car’s, the effective wheel rate could be much different for your car, even if you type in the correct spring rate. However, for the other specs, you will leave these specs as the example vehicle had them. When you have more time, you will measure up your front end. Click on the Back menu item in the upper left corner or click on the [ X ] button in the upper right corner to return to the Main Screen.
Figure 4.23 Front Suspension Specs
Click on File, then Open Example Front Suspension for possibly finding a suspension layout close to your car’s layout
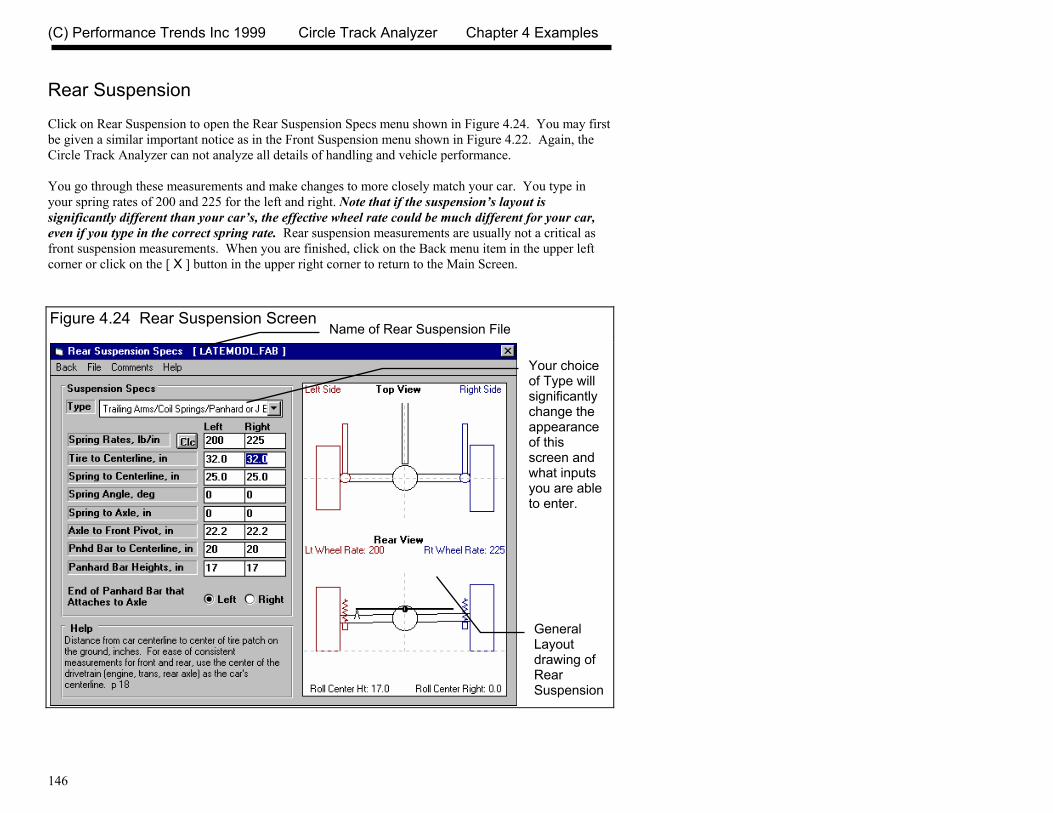
(C) Performance Trends Inc 1999 Circle Track Analyzer Chapter 4 Examples
146
Rear Suspension Click on Rear Suspension to open the Rear Suspension Specs menu shown in Figure 4.24. You may first be given a similar important notice as in the Front Suspension menu shown in Figure 4.22. Again, the Circle Track Analyzer can not analyze all details of handling and vehicle performance. You go through these measurements and make changes to more closely match your car. You type in your spring rates of 200 and 225 for the left and right. Note that if the suspension’s layout is significantly different than your car’s, the effective wheel rate could be much different for your car, even if you type in the correct spring rate. Rear suspension measurements are usually not a critical as front suspension measurements. When you are finished, click on the Back menu item in the upper left corner or click on the [ X ] button in the upper right corner to return to the Main Screen.
Figure 4.24 Rear Suspension Screen Name of Rear Suspension File
General Layout drawing of Rear Suspension
Your choice of Type will significantly change the appearance of this screen and what inputs you are able to enter.
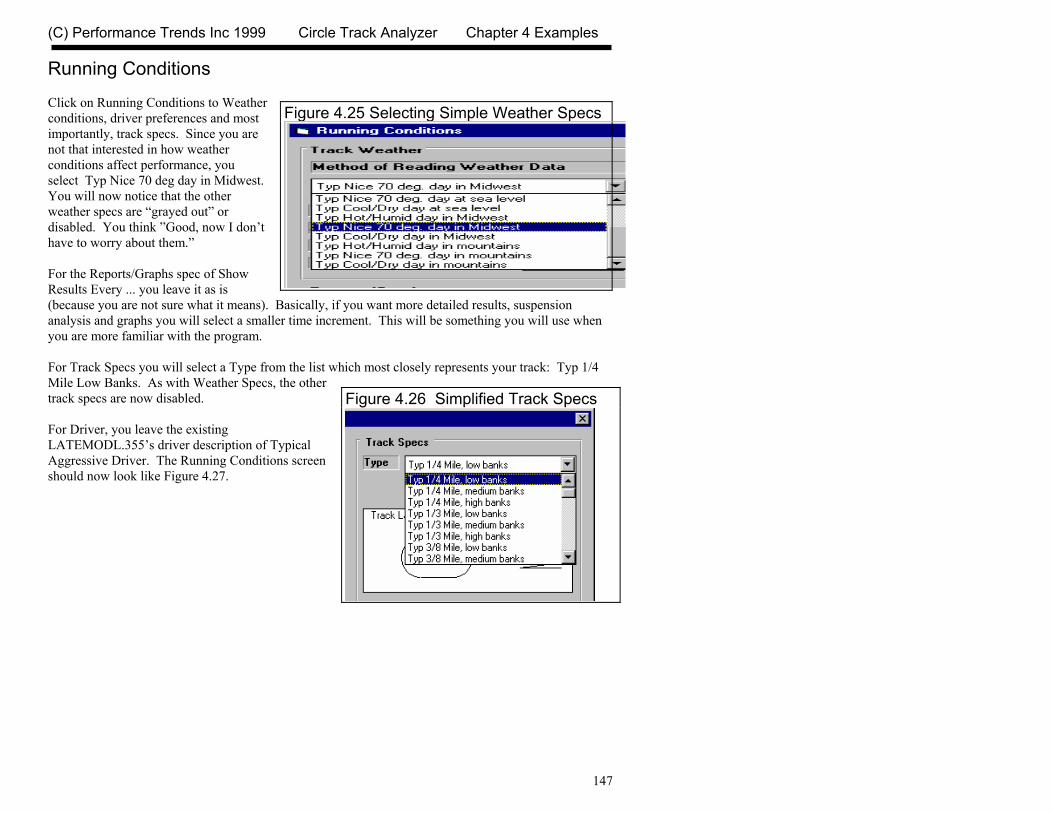
(C) Performance Trends Inc 1999 Circle Track Analyzer Chapter 4 Examples
147
Running Conditions Click on Running Conditions to Weather conditions, driver preferences and most importantly, track specs. Since you are not that interested in how weather conditions affect performance, you select Typ Nice 70 deg day in Midwest. You will now notice that the other weather specs are “grayed out” or disabled. You think ”Good, now I don’t have to worry about them.” For the Reports/Graphs spec of Show Results Every ... you leave it as is (because you are not sure what it means). Basically, if you want more detailed results, suspension analysis and graphs you will select a smaller time increment. This will be something you will use when you are more familiar with the program. For Track Specs you will select a Type from the list which most closely represents your track: Typ 1/4 Mile Low Banks. As with Weather Specs, the other track specs are now disabled. For Driver, you leave the existing LATEMODL.355’s driver description of Typical Aggressive Driver. The Running Conditions screen should now look like Figure 4.27.
Figure 4.25 Selecting Simple Weather Specs
Figure 4.26 Simplified Track Specs

(C) Performance Trends Inc 1999 Circle Track Analyzer Chapter 4 Examples
148
Calculate Lap Time Performance Whew, we’re finally done! Now for the fun stuff, lets see how this car performs. Click on the Calculate Lap Times button in the Running Conditions menu, or click on the Back button to return to the Main Screen, then click on the Calculate Lap Times button at the top of the Main Screen. The program calculates a lap time of 14.04 seconds with a average MPH of 64.1 MPH. The results also show the Mx and Mn (maximum and minimum) RPM during the run as 6537 and 3580. Your car actually drops to a lower RPM in the corners, down to 3400 RPM and revs to 6300 before braking.
Figure 4.27 Running Conditions for Your Car
Notice how most specs are disabled (grayed out) because you chose simple “Types” for Track Weather, Track Specs and Driver catagories
Click here to calculate lap time, or return to Main Screen and click on Calculate Lap Time button there

(C) Performance Trends Inc 1999 Circle Track Analyzer Chapter 4 Examples
149
Match My Lap Times Feature The program is currently predicting your car runs faster than your actual car’s 14.3 second laps. We should fine tune these specs to get a better match between real lap times and what the program predicts. In previous versions of Circle Track Analyzer, this would mean doing a lot of “cut and try”. Adjust a spec, see if you got a better match on, say Mn RPM. If you did, now did you “screw up” your Lap Time, etc. The solution is the Match My Lap Times option, available at the Main Menu. Return to the Main Menu from the Test Results screen of Figure 4.23. Click on the Match My Lap Times button at the top, to display the menu similar to Figure 4.24. Enter in your actual performance, including a description of
Figure 4.28 Results for First Try
Highest and lowest RPMs (Mx and Mn RPM) are shown in the History Log also
Summary shows 14.04 seconds and 64.1 MPH, faster than your car’s 14.5 second laps.
Lowest RPM (minimum or Mn RPM) is shown as the first EngRPM at the start of Turn #2. Mx RPM would be somewhere down in the EngRPM
l
Click here for History Log shown below.
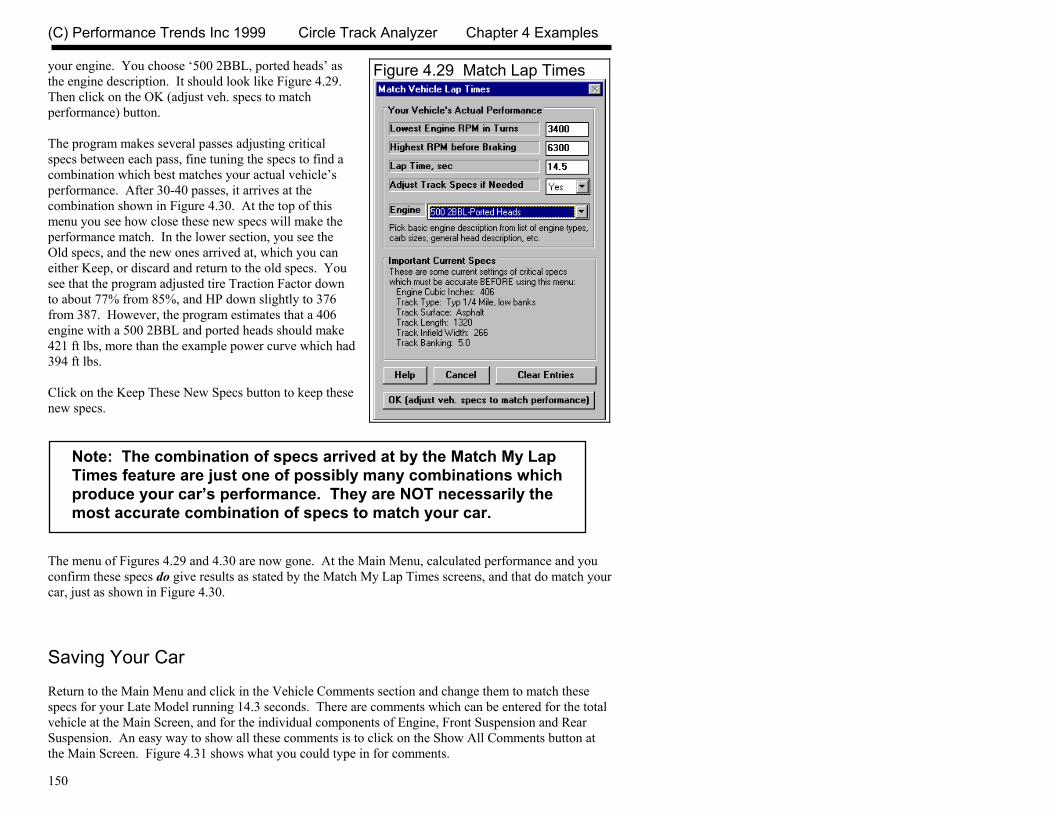
(C) Performance Trends Inc 1999 Circle Track Analyzer Chapter 4 Examples
150
your engine. You choose ‘500 2BBL, ported heads’ as the engine description. It should look like Figure 4.29. Then click on the OK (adjust veh. specs to match performance) button. The program makes several passes adjusting critical specs between each pass, fine tuning the specs to find a combination which best matches your actual vehicle’s performance. After 30-40 passes, it arrives at the combination shown in Figure 4.30. At the top of this menu you see how close these new specs will make the performance match. In the lower section, you see the Old specs, and the new ones arrived at, which you can either Keep, or discard and return to the old specs. You see that the program adjusted tire Traction Factor down to about 77% from 85%, and HP down slightly to 376 from 387. However, the program estimates that a 406 engine with a 500 2BBL and ported heads should make 421 ft lbs, more than the example power curve which had 394 ft lbs. Click on the Keep These New Specs button to keep these new specs.
Note: The combination of specs arrived at by the Match My Lap Times feature are just one of possibly many combinations which produce your car’s performance. They are NOT necessarily the most accurate combination of specs to match your car.
The menu of Figures 4.29 and 4.30 are now gone. At the Main Menu, calculated performance and you confirm these specs do give results as stated by the Match My Lap Times screens, and that do match your car, just as shown in Figure 4.30. Saving Your Car Return to the Main Menu and click in the Vehicle Comments section and change them to match these specs for your Late Model running 14.3 seconds. There are comments which can be entered for the total vehicle at the Main Screen, and for the individual components of Engine, Front Suspension and Rear Suspension. An easy way to show all these comments is to click on the Show All Comments button at the Main Screen. Figure 4.31 shows what you could type in for comments.
Figure 4.29 Match Lap Times
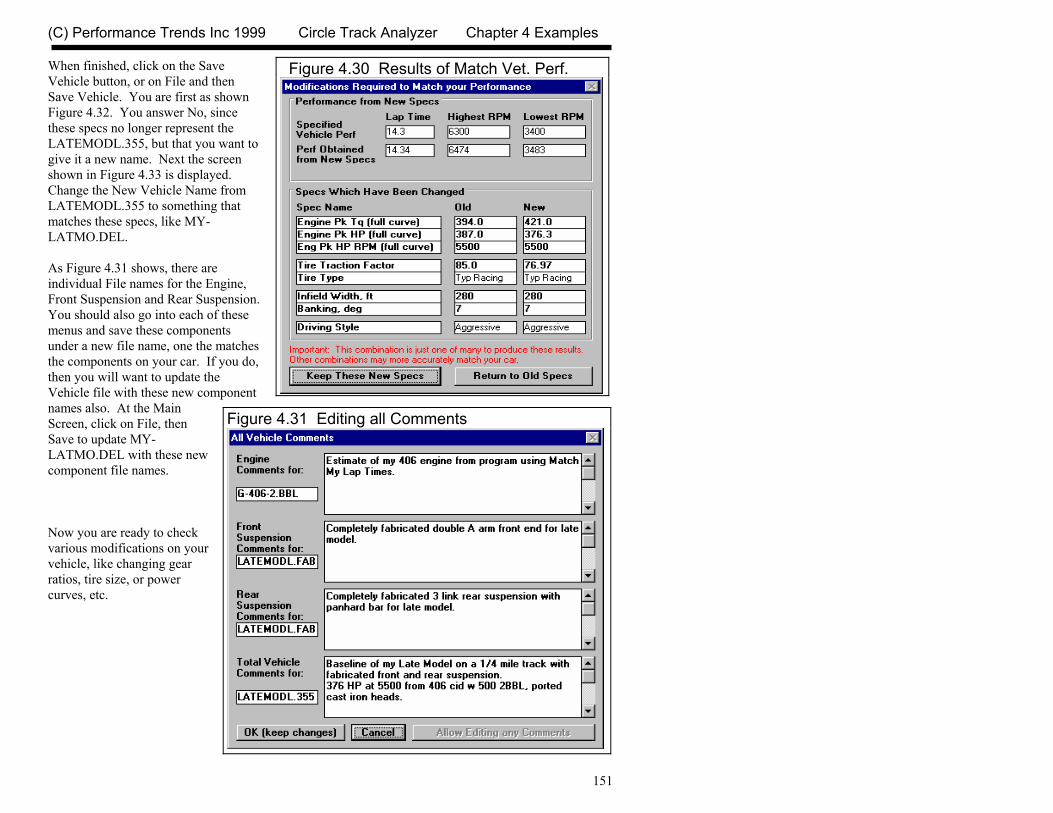
(C) Performance Trends Inc 1999 Circle Track Analyzer Chapter 4 Examples
151
When finished, click on the Save Vehicle button, or on File and then Save Vehicle. You are first as shown Figure 4.32. You answer No, since these specs no longer represent the LATEMODL.355, but that you want to give it a new name. Next the screen shown in Figure 4.33 is displayed. Change the New Vehicle Name from LATEMODL.355 to something that matches these specs, like MY-LATMO.DEL. As Figure 4.31 shows, there are individual File names for the Engine, Front Suspension and Rear Suspension. You should also go into each of these menus and save these components under a new file name, one the matches the components on your car. If you do, then you will want to update the Vehicle file with these new component names also. At the Main Screen, click on File, then Save to update MY-LATMO.DEL with these new component file names. Now you are ready to check various modifications on your vehicle, like changing gear ratios, tire size, or power curves, etc.
Figure 4.31 Editing all Comments
Figure 4.30 Results of Match Vet. Perf.

(C) Performance Trends Inc 1999 Circle Track Analyzer Chapter 4 Examples
152
Conclusions:
• After accurately entering specs, and then fine tuning them with the Match My Lap Times feature, the Circle Track Analyzer's results can closely match the results of most any specific vehicle.
• The program has several options for entering specs, like picking example specs from preloaded examples, preloaded lists, or by calculating them using Calculation menus from other known information or measurements
• You can make most any file from the Vehicle Library match your vehicle's specs following this procedure. Then you can save all these specs under a new name in the library for use at any time in the future.
Figure 4.32 First Screen for Saving Vehicle
Figure 4.33 Screen for Entering New Vehicle Name for Saving
Click on File, then Save As or Save Vehicle button to save specs
Click here to show and edit all comments, Fig 4.xx.
Type in most any name, then click OK.
The program will tell you if it must change it to be a valid file name for the computer, as shown here.
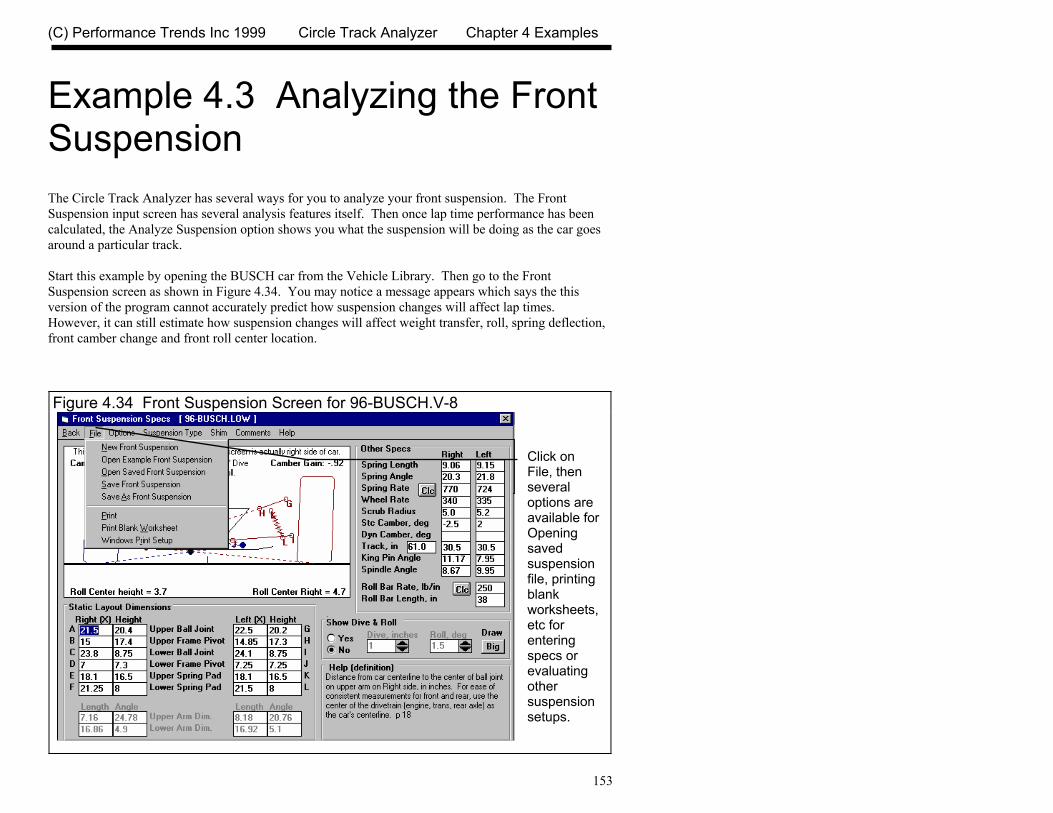
(C) Performance Trends Inc 1999 Circle Track Analyzer Chapter 4 Examples
153
Example 4.3 Analyzing the Front Suspension The Circle Track Analyzer has several ways for you to analyze your front suspension. The Front Suspension input screen has several analysis features itself. Then once lap time performance has been calculated, the Analyze Suspension option shows you what the suspension will be doing as the car goes around a particular track. Start this example by opening the BUSCH car from the Vehicle Library. Then go to the Front Suspension screen as shown in Figure 4.34. You may notice a message appears which says the this version of the program cannot accurately predict how suspension changes will affect lap times. However, it can still estimate how suspension changes will affect weight transfer, roll, spring deflection, front camber change and front roll center location.
Figure 4.34 Front Suspension Screen for 96-BUSCH.V-8
Click on File, then several options are available for Opening saved suspension file, printing blank worksheets, etc for entering specs or evaluating other suspension setups.
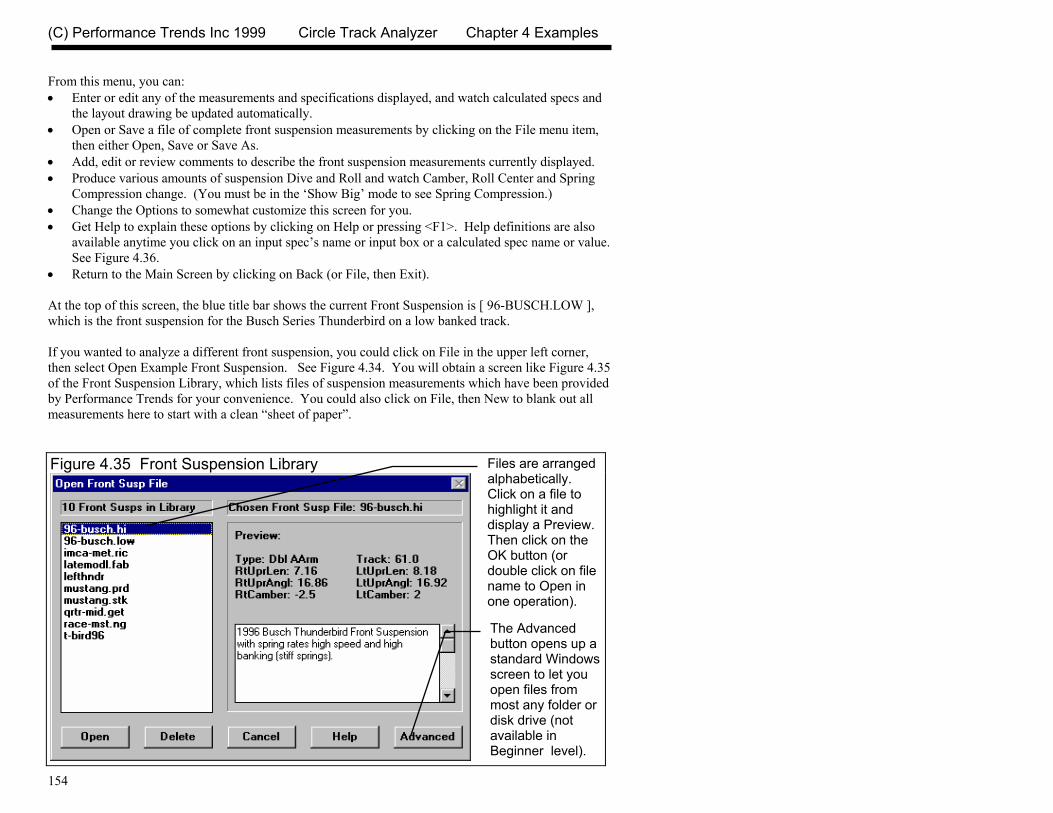
(C) Performance Trends Inc 1999 Circle Track Analyzer Chapter 4 Examples
154
From this menu, you can: • Enter or edit any of the measurements and specifications displayed, and watch calculated specs and
the layout drawing be updated automatically. • Open or Save a file of complete front suspension measurements by clicking on the File menu item,
then either Open, Save or Save As. • Add, edit or review comments to describe the front suspension measurements currently displayed. • Produce various amounts of suspension Dive and Roll and watch Camber, Roll Center and Spring
Compression change. (You must be in the ‘Show Big’ mode to see Spring Compression.) • Change the Options to somewhat customize this screen for you. • Get Help to explain these options by clicking on Help or pressing <F1>. Help definitions are also
available anytime you click on an input spec’s name or input box or a calculated spec name or value. See Figure 4.36.
• Return to the Main Screen by clicking on Back (or File, then Exit). At the top of this screen, the blue title bar shows the current Front Suspension is [ 96-BUSCH.LOW ], which is the front suspension for the Busch Series Thunderbird on a low banked track. If you wanted to analyze a different front suspension, you could click on File in the upper left corner, then select Open Example Front Suspension. See Figure 4.34. You will obtain a screen like Figure 4.35 of the Front Suspension Library, which lists files of suspension measurements which have been provided by Performance Trends for your convenience. You could also click on File, then New to blank out all measurements here to start with a clean “sheet of paper”.
Figure 4.35 Front Suspension Library
Files are arranged alphabetically. Click on a file to highlight it and display a Preview. Then click on the OK button (or double click on file name to Open in one operation).
The Advanced button opens up a standard Windows screen to let you open files from most any folder or disk drive (not available in Beginner level).
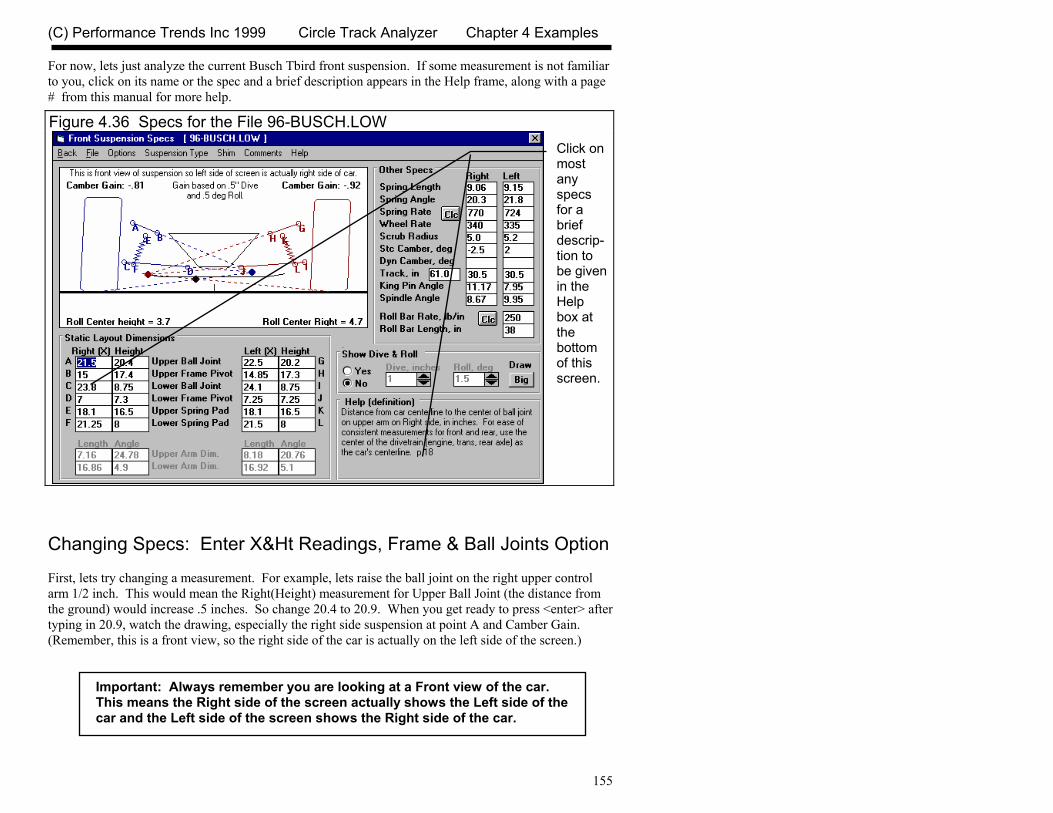
(C) Performance Trends Inc 1999 Circle Track Analyzer Chapter 4 Examples
155
For now, lets just analyze the current Busch Tbird front suspension. If some measurement is not familiar to you, click on its name or the spec and a brief description appears in the Help frame, along with a page # from this manual for more help.
Changing Specs: Enter X&Ht Readings, Frame & Ball Joints Option First, lets try changing a measurement. For example, lets raise the ball joint on the right upper control arm 1/2 inch. This would mean the Right(Height) measurement for Upper Ball Joint (the distance from the ground) would increase .5 inches. So change 20.4 to 20.9. When you get ready to press <enter> after typing in 20.9, watch the drawing, especially the right side suspension at point A and Camber Gain. (Remember, this is a front view, so the right side of the car is actually on the left side of the screen.)
Important: Always remember you are looking at a Front view of the car. This means the Right side of the screen actually shows the Left side of the car and the Left side of the screen shows the Right side of the car.
Figure 4.36 Specs for the File 96-BUSCH.LOW
Click on most any specs for a brief descrip-tion to be given in the Help box at the bottom of this screen.

(C) Performance Trends Inc 1999 Circle Track Analyzer Chapter 4 Examples
156
Table 4.1 Before After Upper Rt BJ Ht 20.4 20.9 Roll Center Ht 3.7 4.0 Roll Center Rt 4.7 7.2 Camber Gain -.81 -.99 Stc Camber -2.5 -2.05 Upper Arm Len 7.16 7.38 Upper Arm Ang 24.78 28.30 Press <enter> and notice how Camber gain changed from -.81 to -.99. See Table 4.1. This minor change will produce slightly more negative Camber Gain, which means the right tire will see slightly more negative camber for the same amount of Dive in the corner or during braking. You will notice that Stc (static) Camber (in the Other Specs at the right side of the screen) changed from -2.5 to -2.05 degrees.
Figure 4.38 Front Suspension Options
Figure 4.37 Front Susp. Screen after Raising Rt Upper Ball Joint to 20.9 “

(C) Performance Trends Inc 1999 Circle Track Analyzer Chapter 4 Examples
157
You will also notice that the Length and Angle of the Upper Arm (printed in light gray in the lower left corner changed from 7.16 inches to 7.38 and 24.78 degrees to 23.30. You might be thinking that the only way for the length of the arm to change is by installing a different arm, which is correct. What we simulated was raising the Upper Ball Joint and adjusting the length and angle of the upper arm so the Frame Pivot would stay in the same spot. If you want to change the height of the Rt Upper Ball Joint, but use the same arm (arm length stays the same), you can start adjusting the Rt Upper Ball Joint X dimension until you get back the original length of 7.16 inches. For example, after a few tries, you’d find that an Upper Ball Joint X of 21.25 inches would produce a length of 7.16 inches. If you click on Options at the top of the Main Screen you will see that the first option (Enter X&Ht Readings, Frame & Ball Joints) is checked. This means you enter the X and Height readings of both ends of the arms, and the length is calculated from those readings. If you select its alternate option (Enter X&Ht at 1 End, Arm Len & Angle), then you could change the Height at the Upper Ball Joint and the mount at the frame would change as necessary to hold the length of the arm and its angle constant. You could then change the Angle of the arm to produce most any X or Height at the Frame Mount. Changing Specs: Enter X&Ht at 1 End, Arm Len & Angle Option Lets try this. Click somewhere outside the menu choices of Figure 1.5 to close these choices without changing them. Then click on the 20.9 and type in 20.4 and press <enter> to return it to its original value. Camber Gain should go back to -.81 and Stc (static) Camber should go back to -2.5. Now click on Options and then on the Enter X&Ht at 1 End, Arm Len & Angle option. You will be given the notice shown in Figure 1.6 and see that the Upper and Lower Arm Dim. (“Dim.” is an abbreviation for “dimensions”) are now enabled so you can enter them directly. The Upper Frame Mount and Lower Ball Joint inputs are disabled (printed in light gray), meaning these values will be calculated from the other inputs. You may notice that the Height of the Lower Ball Joint change slightly, from 8.75 to 8.74 which is due to slightly rounding differences in the math. This hundredth inch difference will not produce any significant error in the results. See Figure 4.40. Now change the Upper Ball Joint Height from 20.4 to 20.9 and press <enter>. Notice how the Length of the arm stays at 7.16 inches and the Angle stays at 24.78 degrees. Frame Pivot X and Height have
Figure 4.39 Notice when Changing Options
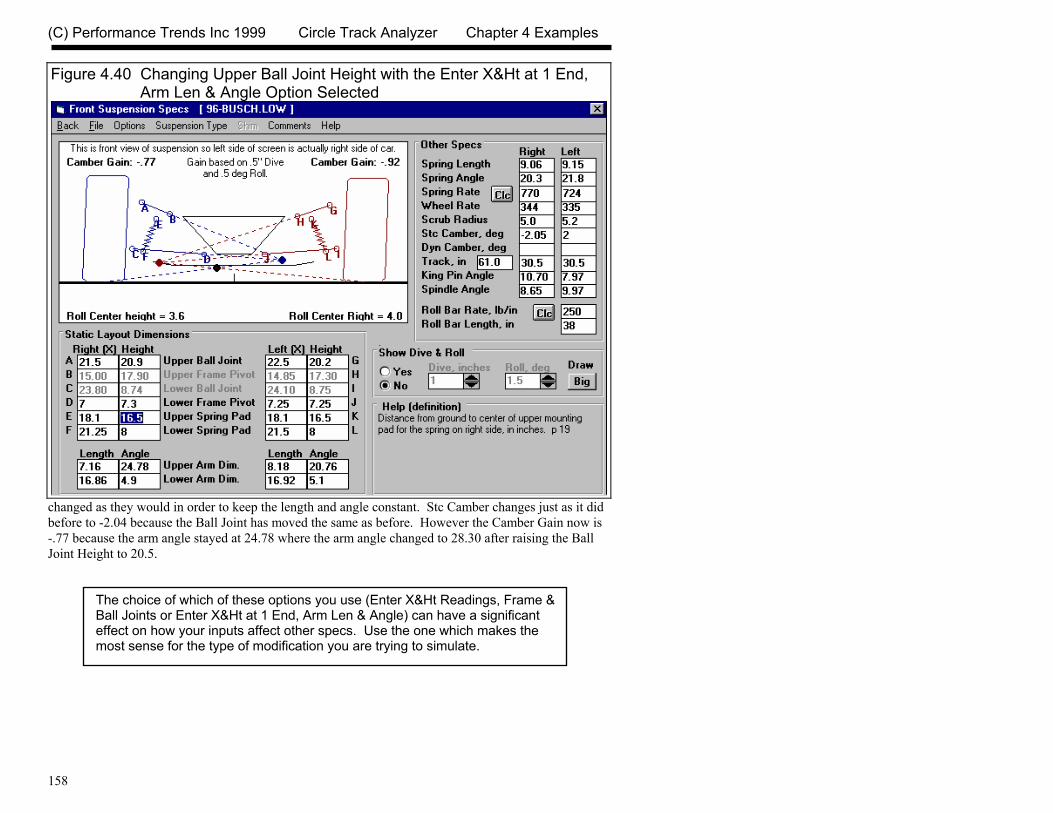
(C) Performance Trends Inc 1999 Circle Track Analyzer Chapter 4 Examples
158
changed as they would in order to keep the length and angle constant. Stc Camber changes just as it did before to -2.04 because the Ball Joint has moved the same as before. However the Camber Gain now is -.77 because the arm angle stayed at 24.78 where the arm angle changed to 28.30 after raising the Ball Joint Height to 20.5.
The choice of which of these options you use (Enter X&Ht Readings, Frame & Ball Joints or Enter X&Ht at 1 End, Arm Len & Angle) can have a significant effect on how your inputs affect other specs. Use the one which makes the most sense for the type of modification you are trying to simulate.
Figure 4.40 Changing Upper Ball Joint Height with the Enter X&Ht at 1 End, Arm Len & Angle Option Selected

(C) Performance Trends Inc 1999 Circle Track Analyzer Chapter 4 Examples
159
Show Dive & Roll This screen lets you simulate the car going through various amounts of dive and roll. To see this feature, click on the Yes option for Show Dive and Roll. You will see the Dive and Roll text and arrow boxes become enabled so you can enter a certain amount of vehicle Dive in inches and Roll in degrees. The arrow boxes let you increment Dive and Roll up and down by clicking on the appropriate arrow. You will also see the suspension drawing move just as it would in the real vehicle. The suspension in the static position is drawn in light gray for comparison (or dark gray if you have chosen that Option). The static Instant Centers and Roll Center are also drawn in light gray so you can see how much they have moved due to Dive and Roll. To the right of the drawing, you will see Dyn Camber also change as you go through various amounts of Dive and Roll.
Figure 4.41 Analyzing the Suspension Motion with Dive and Roll
Dynamic suspension is shown in Black, Blue and Red. Static suspension is shown in gray for comparison. Dynamic
Camber shows how tire camber changes with Dive & Roll.
Click on arrow buttons to increment Dive & Roll up or down, or just type in your desired Dive & Roll
Car is shown diving and rolling to the right (positive Roll), which is what the car would do braking into a left hand turn.
Click here to show more detail, like Figure 4.42
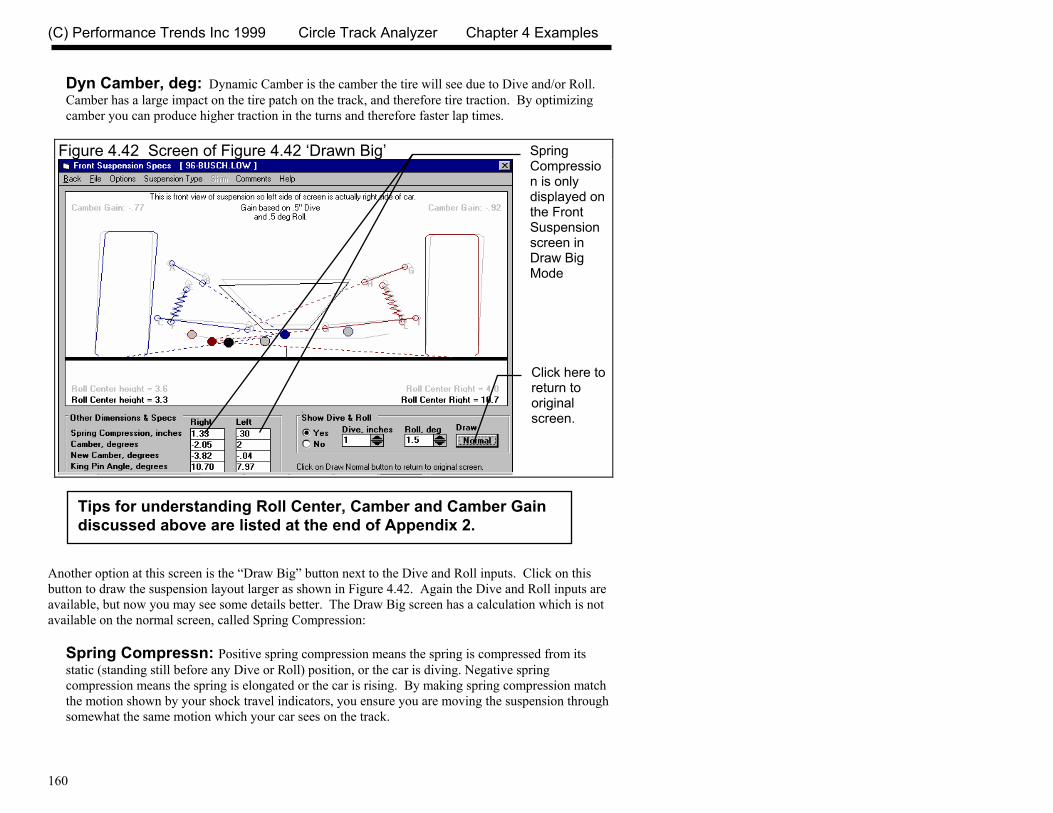
(C) Performance Trends Inc 1999 Circle Track Analyzer Chapter 4 Examples
160
Dyn Camber, deg: Dynamic Camber is the camber the tire will see due to Dive and/or Roll. Camber has a large impact on the tire patch on the track, and therefore tire traction. By optimizing camber you can produce higher traction in the turns and therefore faster lap times.
Tips for understanding Roll Center, Camber and Camber Gain discussed above are listed at the end of Appendix 2.
Another option at this screen is the “Draw Big” button next to the Dive and Roll inputs. Click on this button to draw the suspension layout larger as shown in Figure 4.42. Again the Dive and Roll inputs are available, but now you may see some details better. The Draw Big screen has a calculation which is not available on the normal screen, called Spring Compression:
Spring Compressn: Positive spring compression means the spring is compressed from its static (standing still before any Dive or Roll) position, or the car is diving. Negative spring compression means the spring is elongated or the car is rising. By making spring compression match the motion shown by your shock travel indicators, you ensure you are moving the suspension through somewhat the same motion which your car sees on the track.
Figure 4.42 Screen of Figure 4.42 ‘Drawn Big’ Spring Compression is only displayed on the Front Suspension screen in Draw Big Mode
Click here to return to original screen.
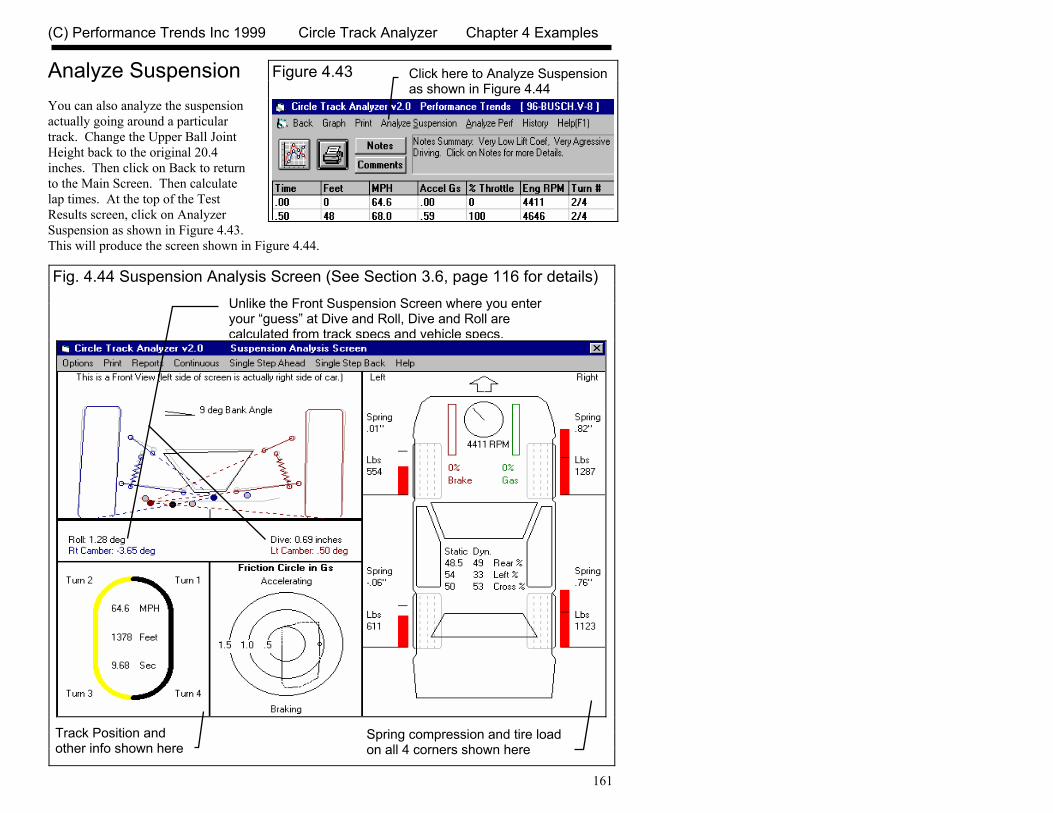
(C) Performance Trends Inc 1999 Circle Track Analyzer Chapter 4 Examples
161
Analyze Suspension You can also analyze the suspension actually going around a particular track. Change the Upper Ball Joint Height back to the original 20.4 inches. Then click on Back to return to the Main Screen. Then calculate lap times. At the top of the Test Results screen, click on Analyzer Suspension as shown in Figure 4.43. This will produce the screen shown in Figure 4.44.
Fig. 4.44 Suspension Analysis Screen (See Section 3.6, page 116 for details)
Figure 4.43
Click here to Analyze Suspension as shown in Figure 4.44
Unlike the Front Suspension Screen where you enter your “guess” at Dive and Roll, Dive and Roll are calculated from track specs and vehicle specs.
Spring compression and tire load on all 4 corners shown here
Track Position and other info shown here

(C) Performance Trends Inc 1999 Circle Track Analyzer Chapter 4 Examples
162
Before entering the Suspension Analysis Screen, you may get a notice like Figure 4.45. The Analysis Screen lets you compare the suspension of the current test results with some previous test results you have saved as a baseline. However, this comparison is only possible if the previous test was run on the same type of track (same Track Length and Infield Width, but Banking can be different). One important feature of Figure 4.44 is watching the Front Suspension go through “computer predicted” Dive and Roll and watching Camber and Roll Center Location of the Front Suspension change. This avoids you having to “guess” at reasonable combinations of Dive and Roll to enter in the Front Suspension screen. The Suspension Analysis screen displays lots of information and has several options. Read Section 3.6 (starting on page 116) to understand all the possibilities. For now, click on the [X] box in the upper right corner, or the [-] box in the upper left corner to close this screen. The program will ask you if you want to save these results as a Baseline. Answer Yes because we will compare this setup to the one where we raised the Right Upper Ball Joint .5 inches. See Figure 4.46. The program will take some times while it saves these results, then it asks you for a name for these results. Enter something meaningful, as shown in Figure 4.47. Click on Back at the Test Results screen to return to the Main Screen. Click on Front Suspension and change the Right Upper Ball Joint Height from 20.4 to 20.9 as we investigated before. Then calculate Lap Times and click on Suspension Analysis. You may not automatically get the Baseline results shown with the new results. If not, click on Options and then Show Baseline.
Figure 4.45 Possible Baseline Notice when Entering Suspension Analysis Screen
Figure 4.46 Baseline Question Asked when Exiting Suspension Analysis Screen
Figure 4.47 Entering Baseline Title

(C) Performance Trends Inc 1999 Circle Track Analyzer Chapter 4 Examples
163
Figure 4.48 Suspension Analysis Comparing Change to Baseline
Click on Options, then Show Baseline to compare saved Baseline to current resultsNote that Roll and Dive have increased, primarily because wheel rate dropped with new Upper Ball Joint Ht (even though roll center increased slightly)
Right spring compression has increased due to drop in wheel rate
Baseline results from previous run (20.4” Upper Ball Joint Ht) for comparison. On computer screen, these Baseline results are shown in bright pink for easy identification.
(C) Performance Trends Inc 1999 Circle Track Analyzer Chapter 4 Examples
164
Conclusions:
The Circle Track Analyzer has several features to analyze suspension effects, especially the front suspension which is usually the most critical. • The Front Suspension input screen has several features itself to analyze camber and roll center
changes. • After Lap Times have been calculated, the Analyze Suspension screen shoes what the
suspension is likely to do actually traveling around a track of a particular design.

(C) Performance Trends Inc 1999 Circle Track Analyzer Chapter 4 Examples
165
Appendix 1: Accuracy and Assumptions Background: The Circle Track Analyzer was developed as a:
• Tool to help predict effects of certain engine and vehicle modifications for engine builders, racers, and performance enthusiasts.
• "Theoretical Race Track" to allow anyone to try things which are too expensive, difficult, dangerous, or impossible with a real vehicle.
• Learning aid for those who want to better understand vehicle dynamics during full power acceleration.
The Circle Track Analyzer will provide you an engineering estimate of what should occur when general modifications are made based on the principles of vehicle dynamics and physics. By seeing all the specifications which go into the calculated results, you may have a false sense that the computer knows your vehicle exactly; what manufacturer's tires you are using, who built the chassis, what your 4 link settings are, etc. Actually the computer does not know if the specifications are for a production Yugo or a Earnhardt’s #3 car. A good analogy to the Circle Track Analyzer is a cylinder head flow bench. A flow bench can not predict exact torque and HP curves, but is still a vital tool for engine development. In the same way, use the Circle Track Analyzer results as a guide or second opinion of how your vehicle should perform under near optimum conditions. Iterations Before we talk about accuracy, it is important for you to understand the types of calculations going on inside the Circle Track Analyzer and other sophisticated simulation programs. A simple program could involve calculating top speed from HP and frontal area: 1/3 Top Speed = K1 x Frontal Area x HP
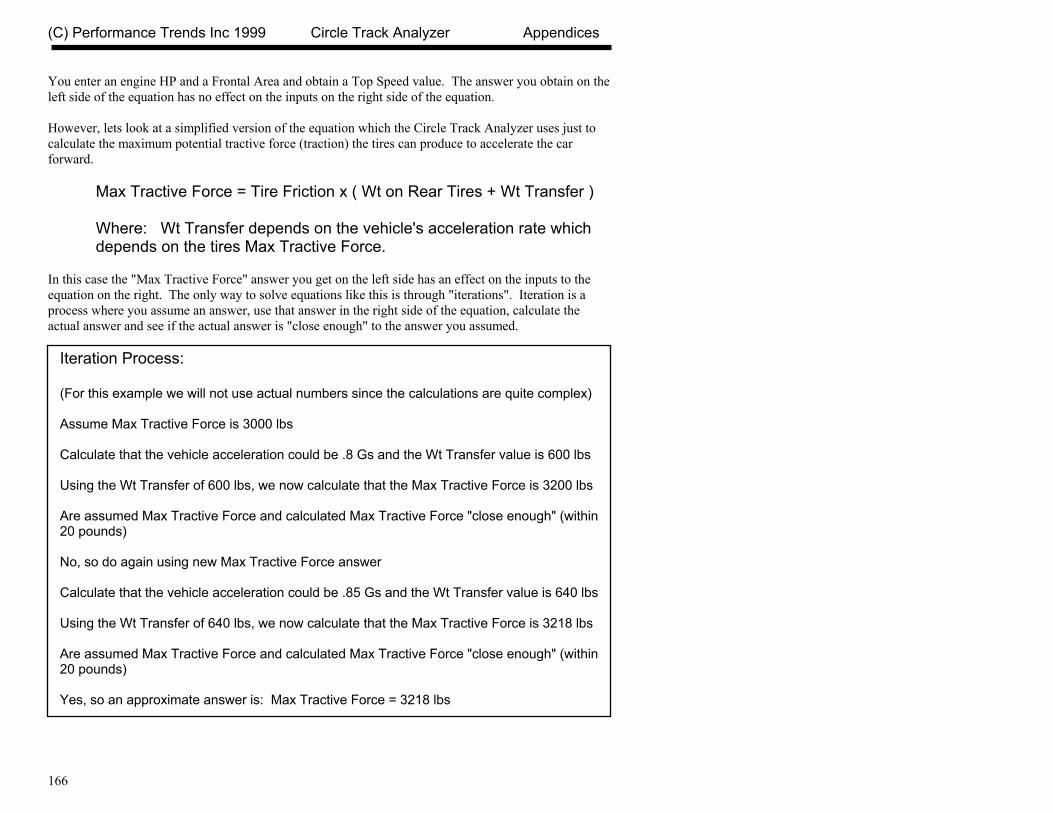
(C) Performance Trends Inc 1999 Circle Track Analyzer Appendices
166
You enter an engine HP and a Frontal Area and obtain a Top Speed value. The answer you obtain on the left side of the equation has no effect on the inputs on the right side of the equation. However, lets look at a simplified version of the equation which the Circle Track Analyzer uses just to calculate the maximum potential tractive force (traction) the tires can produce to accelerate the car forward.
Max Tractive Force = Tire Friction x ( Wt on Rear Tires + Wt Transfer ) Where: Wt Transfer depends on the vehicle's acceleration rate which depends on the tires Max Tractive Force.
In this case the "Max Tractive Force" answer you get on the left side has an effect on the inputs to the equation on the right. The only way to solve equations like this is through "iterations". Iteration is a process where you assume an answer, use that answer in the right side of the equation, calculate the actual answer and see if the actual answer is "close enough" to the answer you assumed.
Iteration Process: (For this example we will not use actual numbers since the calculations are quite complex) Assume Max Tractive Force is 3000 lbs Calculate that the vehicle acceleration could be .8 Gs and the Wt Transfer value is 600 lbs Using the Wt Transfer of 600 lbs, we now calculate that the Max Tractive Force is 3200 lbs Are assumed Max Tractive Force and calculated Max Tractive Force "close enough" (within 20 pounds) No, so do again using new Max Tractive Force answer Calculate that the vehicle acceleration could be .85 Gs and the Wt Transfer value is 640 lbs Using the Wt Transfer of 640 lbs, we now calculate that the Max Tractive Force is 3218 lbs Are assumed Max Tractive Force and calculated Max Tractive Force "close enough" (within 20 pounds) Yes, so an approximate answer is: Max Tractive Force = 3218 lbs

(C) Performance Trends Inc 1999 Circle Track Analyzer Appendices
167
If "close enough" was 200 lbs, our first answer of 3200 lbs would have been good enough. If "close enough" was 1 lb, it may require many more calculations to arrive at an answer which is "close enough". If the equation is very complex and the inputs are an unusual combination, no answer may be reached no matter how many times the calculation is performed. This is called "not converging on a solution". Making the tolerance ("close enough") small will produce more exact answers but will require more calculation time. Performance Trends has selected tolerance bands for iterations which give good accuracy with reasonable calculation times, and allow the process to "converge on a solution". Because many of the equations within the Circle Track Analyzer must be solved by iterations, there is no one exact answer. All calculations are an approximation. Therefore, do not be alarmed if a Lap Time improvement of .02 seconds is shown for changing in Dew Point from 67 to 66, but changing from 66 to 65 showed a .00 second improvement. These results are basically saying lowering the Dew Point results in a very small gain in Lap Time. Major Assumptions To make the Circle Track Analyzer and the specifications which describe the vehicle containable on a personal computer, several simplifying assumptions are made which are listed below. Other approximations and assumptions exist as identified in Section 1.3 A Word of Caution and scattered throughout this manual. Also see Assumptions in the Index. • All vehicle components are assumed to be perfectly stiff, which means that suspension members
do not bend, tires do not deflect (squat or shift), suspension bushings do not deform or move. • All tires behave about the same as far as how cornering ability changes with load on the tires.
Actual tires vary greatly between designs. • Tires can continually handle all the heat buildup caused by pushing them to their limits. • Maximum cornering traction occurs when all 4 tires are evenly loaded. • There is no delay in engine torque getting to the tires due to driveshaft, axle or tire "wrap up". • There are no shock absorber effects. • There are no bumps or roughness in the track. • If spring compression as shown in the Suspension Analysis screen in Section 3.6 exceeds 1.5
inches, additional spring stiffness is added to somewhat simulate the springs coils touching, and to avoid the suspension encountering some impossible situations.
• Tire camber and camber changes are not used to estimate tire traction and cornering ability at different parts of the track.
• Steering inputs and therefore tire slip angle are not used to estimate tire traction and cornering ability at different parts of the track.
• The brakes are assumed to be large enough and capable of dissipating all heat to be able to continually brake at levels capable of the tire’s maximum traction.
• In this version, Roll Center Offset from car centerline (left or right) is not used to predict lap times, traction, corner weights, or suspension motion. Most text books and authorities do not address the effect of Roll Center Offset, but all discuss how Roll Center Height affects vehicle roll.

(C) Performance Trends Inc 1999 Circle Track Analyzer Appendices
168
• There is no change in the Height of CG due to "pitch rotation" or the body lifting or squatting. Accuracy From reading the assumptions above and scattered throughout this manual, it is obvious several important aspects of vehicle performance are "glossed over". Therefore, it is impossible to make exact predictions of what will happen to your vehicle when modifications are made. There are many combinations of vehicle specs which can produce the same lap times (and even the same maximum and minimum engine RPMs). Therefore, do not assume that if you have gotten the lap times to match your car that now you have your car simulated correctly. Also, especially do not assume that you now have the program simulating your suspension motion correctly.
This program should be used as a guide to help you visualize what can happen on your car when you make general (not detailed) modifications. In no way does it exactly simulate your car on a particular track, or can it predict exact changes in handling.
(C) Performance Trends Inc 1999 Circle Track Analyzer Appendices
169
Appendix 2: "General Tips" The following "tips" will show you how to change the Circle Track Analyzer calculations by adjusting various inputs. Calibrating "Tips" Calibration is the process of adjusting the program's inputs to produce results which closely match a certain vehicle's drag strip results. Example 4.2 shows this process in some detail, including the Match My Lap Times feature. Here are some tips on how to adjust vehicle specs to get the computer’s predicted lap times to match your lap times if the Match My Lap Times feature cannot come up with a good solution. Obviously, many inputs affect lap times. Here are the ones which are difficult to measure or know for certain, and have a large effect on lap times. To Decrease Lap Times (faster laps) • More Engine Power (especially long tracks) • Higher Banking • Wider Infield Width • Higher Traction Tire ‘Type’ • Higher Tire Traction Factor • Higher Driver Aggressiveness (Braking and/or Accelerating) • Lower Lift Coefficient (larger negative numbers, especially big tracks) • Lower Drag Coefficient (especially long tracks) • Lower Frontal Area (especially long tracks)
Using Dynamometer Data for Engine Power Curve Specs Engine Power Curve specs are discussed in Section 2.2. Dynamometer tests which measure engine performance can be done in different ways. How the test is done can over-estimate or under-estimate the engine's torque and HP in the vehicle. The Circle Track Analyzer works best if you enter steady state dynamometer results, with the engine equipped exactly as it will be in the vehicle. "Equipped" means with the full exhaust and intake system,
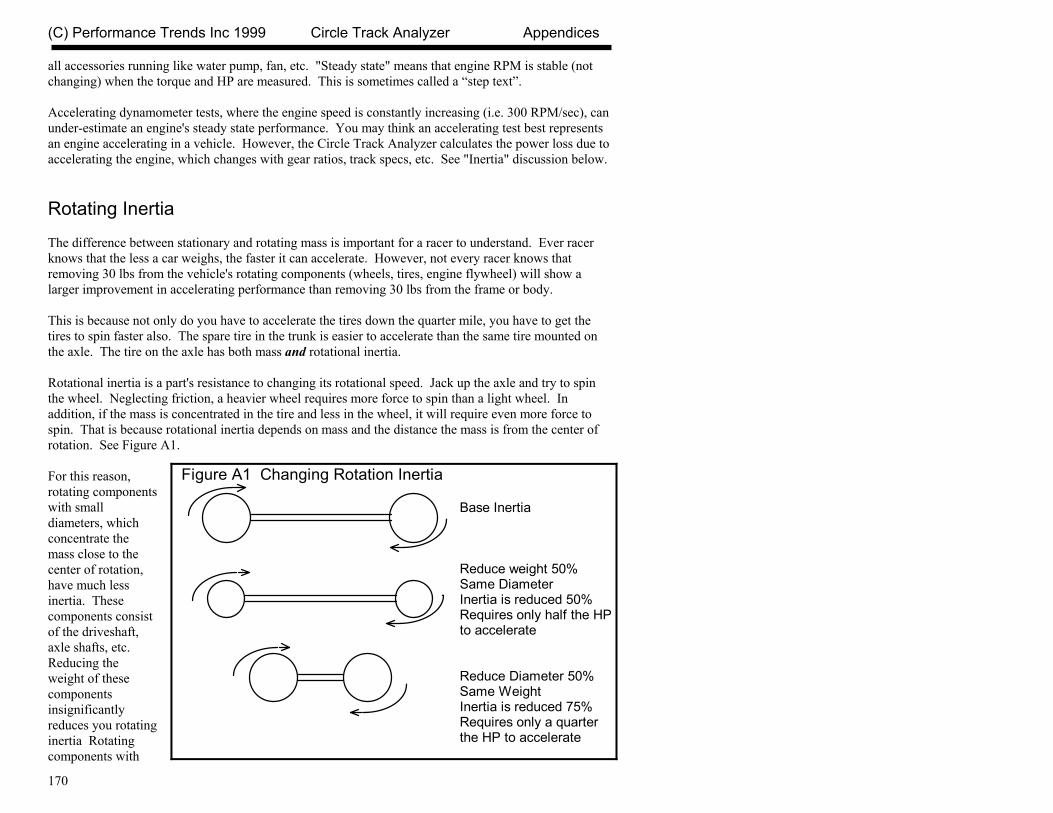
(C) Performance Trends Inc 1999 Circle Track Analyzer Appendices
170
all accessories running like water pump, fan, etc. "Steady state" means that engine RPM is stable (not changing) when the torque and HP are measured. This is sometimes called a “step text”. Accelerating dynamometer tests, where the engine speed is constantly increasing (i.e. 300 RPM/sec), can under-estimate an engine's steady state performance. You may think an accelerating test best represents an engine accelerating in a vehicle. However, the Circle Track Analyzer calculates the power loss due to accelerating the engine, which changes with gear ratios, track specs, etc. See "Inertia" discussion below. Rotating Inertia The difference between stationary and rotating mass is important for a racer to understand. Ever racer knows that the less a car weighs, the faster it can accelerate. However, not every racer knows that removing 30 lbs from the vehicle's rotating components (wheels, tires, engine flywheel) will show a larger improvement in accelerating performance than removing 30 lbs from the frame or body. This is because not only do you have to accelerate the tires down the quarter mile, you have to get the tires to spin faster also. The spare tire in the trunk is easier to accelerate than the same tire mounted on the axle. The tire on the axle has both mass and rotational inertia. Rotational inertia is a part's resistance to changing its rotational speed. Jack up the axle and try to spin the wheel. Neglecting friction, a heavier wheel requires more force to spin than a light wheel. In addition, if the mass is concentrated in the tire and less in the wheel, it will require even more force to spin. That is because rotational inertia depends on mass and the distance the mass is from the center of rotation. See Figure A1. For this reason, rotating components with small diameters, which concentrate the mass close to the center of rotation, have much less inertia. These components consist of the driveshaft, axle shafts, etc. Reducing the weight of these components insignificantly reduces you rotating inertia Rotating components with
Figure A1 Changing Rotation Inertia
Base Inertia
Reduce weight 50%Same DiameterInertia is reduced 50%Requires only half the HPto accelerate
Reduce Diameter 50%Same WeightInertia is reduced 75%Requires only a quarterthe HP to accelerate

(C) Performance Trends Inc 1999 Circle Track Analyzer Appendices
171
larger diameters (flywheel or torque converter, wheels/tires, somewhat in the crankshaft, damper and transmission components) contain most of the vehicle's rotating inertia. These are the components to concentrate on when trying to reduce rotating inertia. For example, removing 1 pound from the engine’s flywheel will have 100 up to 1000 times or more effect on the vehicle’s rotational inertia than removing 1 pound from an axle shaft. Example Try some examples with the Circle Track Analyzer with the 96-BUSCH.V-8. The Baseline 96-BUSCH.V-8 performance is a 19.36 seconds lap time. Now, remove 32 lbs from the Rear Wheels by setting Rear Wheels/Tires Wt = 10 instead of 42 in the Vehicle Specs menu. (The program assumes the front wheels/tires weight the same as the rear.) This modification simulates moving 32 lbs from the all 4 wheels and placing it somewhere on the body, since we did not also reduce Vehicle Weight 128 lbs (4 x 32). Calculate performance an we get a new Lap Time of 19.32 seconds. Nearly a four hundredths (.04) improvement just by moving weight around on the vehicle (not moving it to change traction). Engine Inertia Engine inertia is more complicated than other rotating inertia on the vehicle. However, for cars which do not shift or do not start from a stand still (circle track racing in 1 gear only), it is almost always best to reduce engine inertia to improve acceleration. The Circle Track Analyzer estimates the rotational inertia of the engine and clutch/flywheel or converter and transmission parts based on:
• Displacement in the Engine Specs menu (the higher the displacement, the higher the inertia). • Clutch Description in the Engine Specs menu.
Tips on Simulating Modifications The previous "inertia" examples point out an error most users will make. When you make a modification, always think of how it could affect each specification. The example of removing 32 lbs from the wheels and tires not only affected Wheels/Tires Wt, but also Vehicle Weight and possibly the Weight %s, Rear, Left or Cross. Below is a list of common modifications and the specs they may affect.

(C) Performance Trends Inc 1999 Circle Track Analyzer Appendices
172
Engine Modifications Engine modifications can change all Engine Power Curve specs and Displacement. If the engine is naturally aspirated (not supercharged, turbocharged or uses nitrous oxide) and you increase the HP, generally the RPM where the HP will peak will increase also. Vehicle Weight and % Wt on Rear Tires may also change if you change to aluminum components (less weight) or add a supercharger (more weight), etc. Adding, Removing or Shifting Weight
• Vehicle Weight • Weight %s, Rear, Left and Cross • Front & Rear Wheels/Tires Weight
Changing vehicle height
• Height of CG • Suspension Specs, like heights o f Frame Mounts, Ball Joints, etc • Frontal Area, sq ft
Changing wheels and tires
• All the Wheels/Tires Specs • Vehicle Weight, lbs • Weight %s, Rear, Left and Cross • Suspension Specs, like heights o f Frame Mounts, Ball Joints, etc • Frontal Area, sq ft

(C) Performance Trends Inc 1999 Circle Track Analyzer Appendices
173
Roll Center: Several authorities agree that the static Roll Center (before any Dive or Roll) should be from 2.5" to 4.5" above the ground. For road race cars (turning both left and right) you want to keep the Roll Center near the car's centerline (left or right). The farther the Roll Center is to the Left, the quicker the car will react (more it will Roll) when going into a Left turn. For this reason, many asphalt circle track (left turning) cars locate the Roll Center to the right of center (less Roll) and dirt cars locate the Roll Center to the Left of center (more Roll and hopefully better "bite" at the right front). However, the car is more predictable "all around" if the Roll Center is kept close to the car's centerline. Higher banking (20 degrees or more) usually requires a lower Roll Center, in the 2-3 inch range. The more mass in the front of the car (heavier engine or engine more forward), the higher the Roll Center should be. Some authorities believe a lower Roll Center works better on dirt because the higher body roll produces more "side bite" from the tires. Lower Roll Centers require stiffer springs to control Roll. However, stiff springs hurt traction on bumpy tracks. The less the Roll Center moves during Dive and Roll, the more predictable the car's handling. Most authorities agree that holding the Roll Center position as constant as practical during Dive and Roll is optimum. Camber/Camber Gain: For Circle Track cars (turning left), reasonable Static Camber values (before any Dive or Roll) are: Left Side +1 to +2 degrees, Right Side -2 to -4 degrees, the tighter the turn, the higher the camber. Wider and/or stiffer sidewall tires require less Static Camber. Camber Gain should be in the range of -1.75 for a flat track, -1.25 for a medium banked track (10-15 degrees) and down to -1 for highly banked tracks (over 25 degrees) on the outside tire (right tire in a left turn). For circle track cars (always turning left), the desired camber gain on the left side may be less or even a positive number, depending on track banking and other factors. These Camber Gains are based on the program's standard definition as the amount of Camber Change from 1" of Dive.
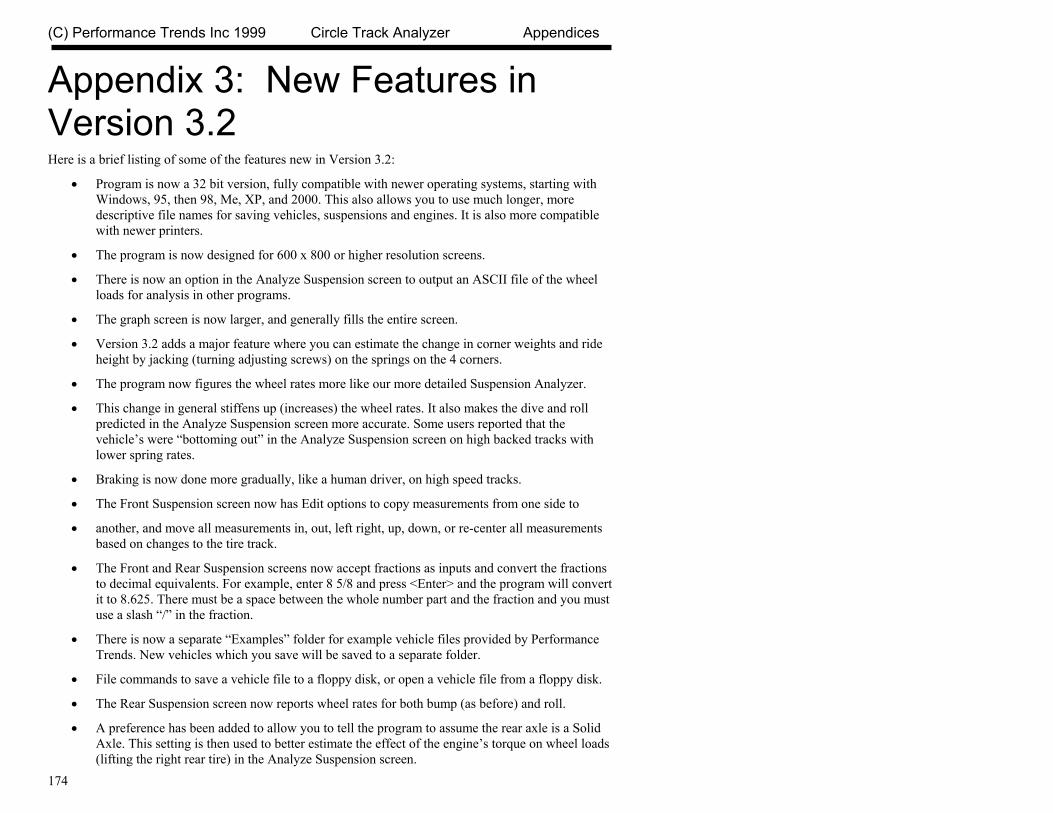
(C) Performance Trends Inc 1999 Circle Track Analyzer Appendices
174
Appendix 3: New Features in Version 3.2 Here is a brief listing of some of the features new in Version 3.2:
• Program is now a 32 bit version, fully compatible with newer operating systems, starting with Windows, 95, then 98, Me, XP, and 2000. This also allows you to use much longer, more descriptive file names for saving vehicles, suspensions and engines. It is also more compatible with newer printers.
• The program is now designed for 600 x 800 or higher resolution screens.
• There is now an option in the Analyze Suspension screen to output an ASCII file of the wheel loads for analysis in other programs.
• The graph screen is now larger, and generally fills the entire screen.
• Version 3.2 adds a major feature where you can estimate the change in corner weights and ride height by jacking (turning adjusting screws) on the springs on the 4 corners.
• The program now figures the wheel rates more like our more detailed Suspension Analyzer.
• This change in general stiffens up (increases) the wheel rates. It also makes the dive and roll predicted in the Analyze Suspension screen more accurate. Some users reported that the vehicle’s were “bottoming out” in the Analyze Suspension screen on high backed tracks with lower spring rates.
• Braking is now done more gradually, like a human driver, on high speed tracks.
• The Front Suspension screen now has Edit options to copy measurements from one side to
• another, and move all measurements in, out, left right, up, down, or re-center all measurements based on changes to the tire track.
• The Front and Rear Suspension screens now accept fractions as inputs and convert the fractions to decimal equivalents. For example, enter 8 5/8 and press <Enter> and the program will convert it to 8.625. There must be a space between the whole number part and the fraction and you must use a slash “/” in the fraction.
• There is now a separate “Examples” folder for example vehicle files provided by Performance Trends. New vehicles which you save will be saved to a separate folder.
• File commands to save a vehicle file to a floppy disk, or open a vehicle file from a floppy disk.
• The Rear Suspension screen now reports wheel rates for both bump (as before) and roll.
• A preference has been added to allow you to tell the program to assume the rear axle is a Solid Axle. This setting is then used to better estimate the effect of the engine’s torque on wheel loads (lifting the right rear tire) in the Analyze Suspension screen.
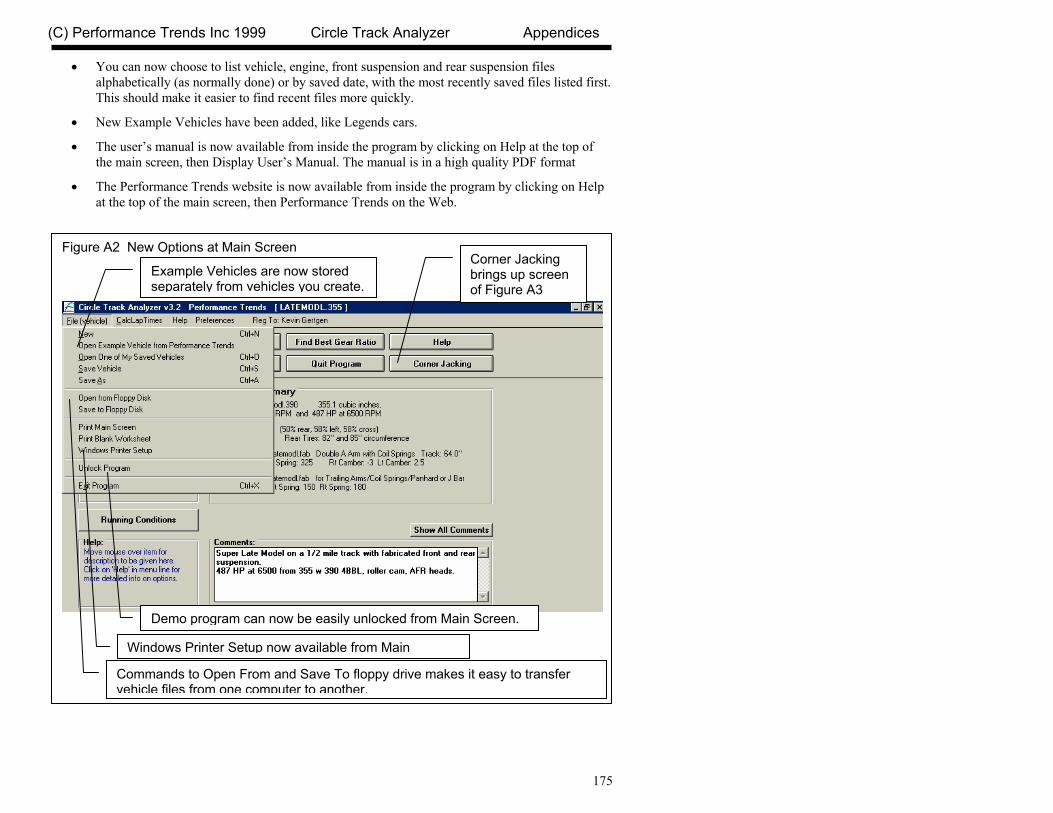
(C) Performance Trends Inc 1999 Circle Track Analyzer Appendices
175
• You can now choose to list vehicle, engine, front suspension and rear suspension files alphabetically (as normally done) or by saved date, with the most recently saved files listed first. This should make it easier to find recent files more quickly.
• New Example Vehicles have been added, like Legends cars.
• The user’s manual is now available from inside the program by clicking on Help at the top of the main screen, then Display User’s Manual. The manual is in a high quality PDF format
• The Performance Trends website is now available from inside the program by clicking on Help at the top of the main screen, then Performance Trends on the Web.
Figure A2 New Options at Main Screen
Example Vehicles are now stored separately from vehicles you create.
Corner Jacking brings up screen of Figure A3
Commands to Open From and Save To floppy drive makes it easy to transfer vehicle files from one computer to another.
Windows Printer Setup now available from Main
Demo program can now be easily unlocked from Main Screen.
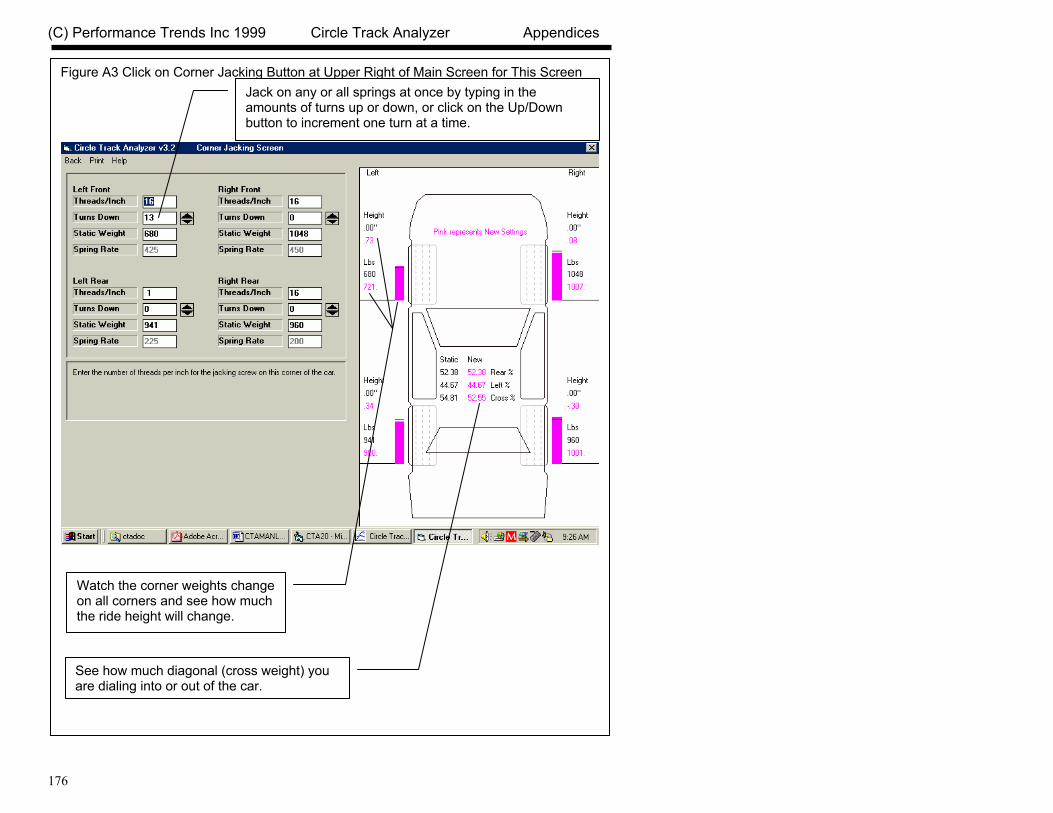
(C) Performance Trends Inc 1999 Circle Track Analyzer Appendices
176
Figure A3 Click on Corner Jacking Button at Upper Right of Main Screen for This Screen
Jack on any or all springs at once by typing in the amounts of turns up or down, or click on the Up/Down button to increment one turn at a time.
Watch the corner weights change on all corners and see how much the ride height will change.
See how much diagonal (cross weight) you are dialing into or out of the car.
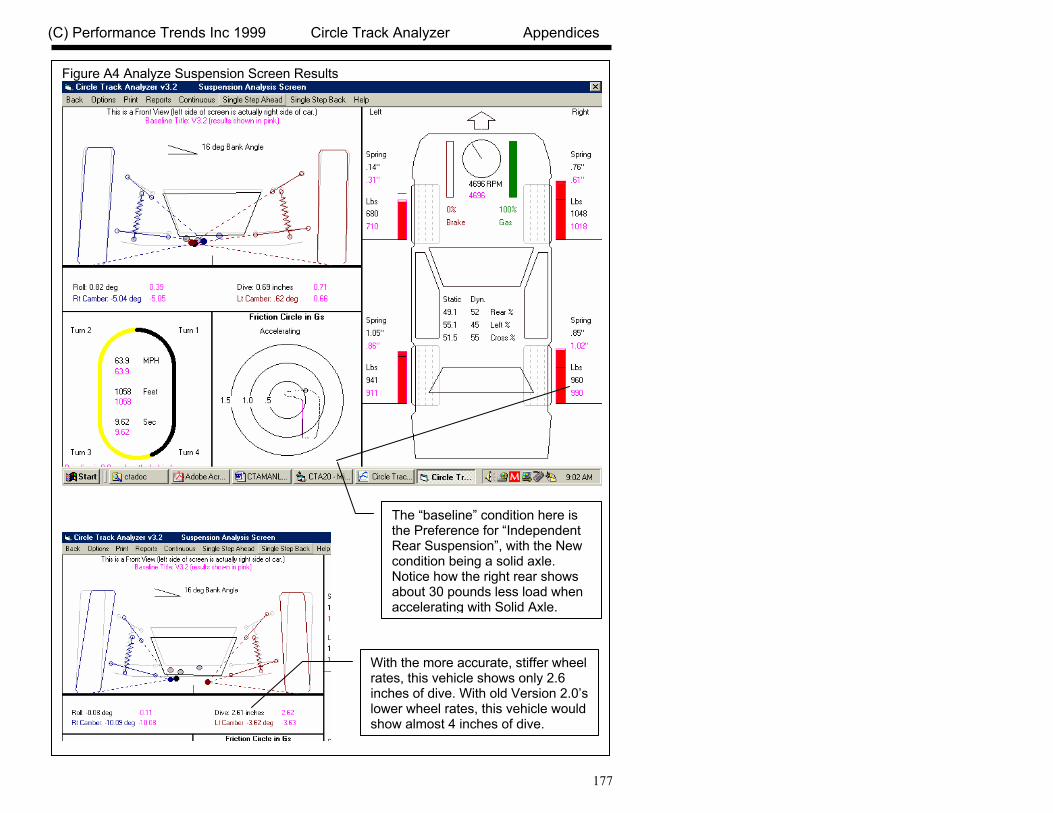
(C) Performance Trends Inc 1999 Circle Track Analyzer Appendices
177
Figure A4 Analyze Suspension Screen Results
The “baseline” condition here is the Preference for “Independent Rear Suspension”, with the New condition being a solid axle. Notice how the right rear shows about 30 pounds less load when accelerating with Solid Axle.
With the more accurate, stiffer wheel rates, this vehicle shows only 2.6 inches of dive. With old Version 2.0’s lower wheel rates, this vehicle would show almost 4 inches of dive.
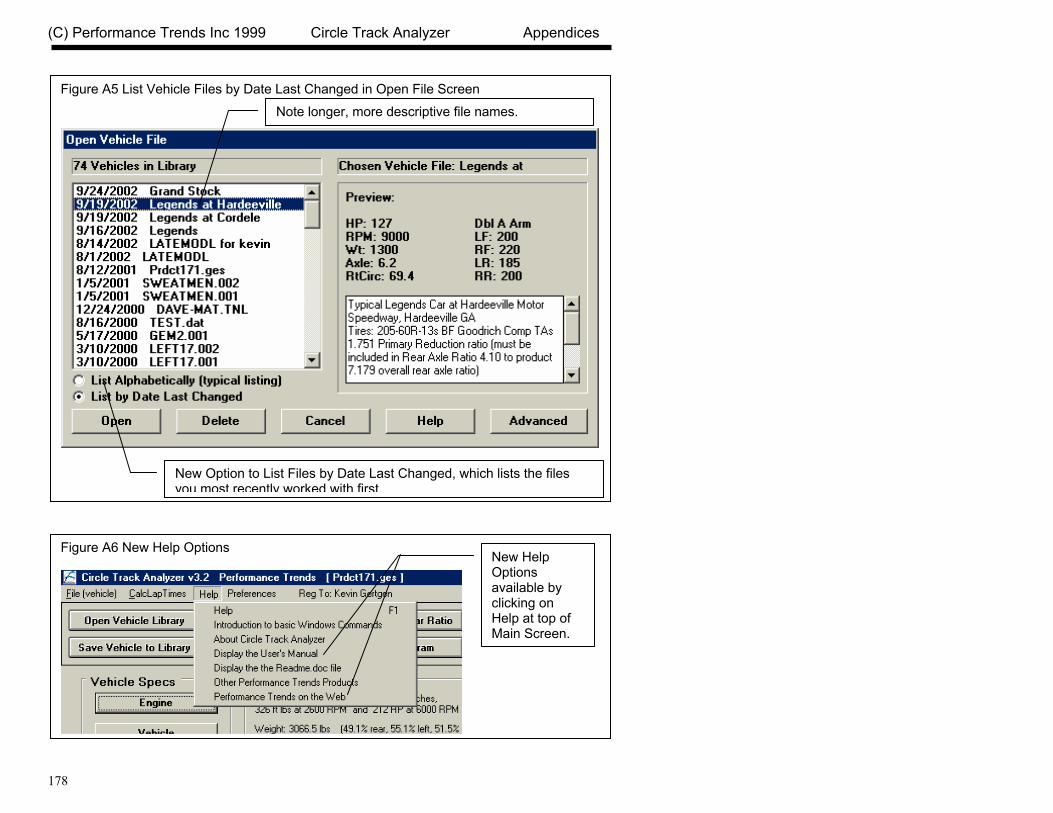
(C) Performance Trends Inc 1999 Circle Track Analyzer Appendices
178
Figure A6 New Help Options New Help
Options available by clicking on Help at top of Main Screen.
Figure A5 List Vehicle Files by Date Last Changed in Open File Screen
New Option to List Files by Date Last Changed, which lists the files you most recently worked with first.
Note longer, more descriptive file names.

(C) Performance Trends Inc 1999 Circle Track Analyzer Appendices
179
Appendix 4: New Features in Version 3.5 Here is a brief listing of some of the features added since v3.2 was released. Some we added to later versions of v3.2 and some are new in Version 3.5:
• A major new feature is the concept of balancing the Front Lateral Load Distribution (FLLD) with the rear lateral load distribution. This concept can be used to find a “balanced” setup by adjusting spring and roll bar rates, and roll center heights. This is discussed in detail below.
• The ‘Rule of Thumb’ Suggestions for a good starting point for a setup now includes a suggestion for the rear roll center height. This is based on obtaining a recommended FLLD. See details below.
• The program can now do an angled, symmetric 4 link rear suspension, as used in the late model Mustangs and GM Metric chassis.
• Added the ability to do Camber Change and Roll Center Migration tables and graphs in the Front Suspension Screen.
• The Front Suspension Screen now calculates and displays 2 additional suspension characteristics: 1) Tire track change (tire scrub) as the front suspension goes through dive and roll. 2) Swing Arm lengths, the length from the tire center to its instant center.
• Changed the name of the Corner Jacking button at top right of main screen to Corner Weights. That’s because 2 new options have been added, letting you do Tire Diameter/Circumference changes and weight/ballast movement to check the affect on corner weights
• Screen colors are now more compatible with Windows XP.
• Added ability to save a vehicle file to or open a vehicle file from a floppy disk or CD, with a default drive letter from A to Z, selectable in Preferences.
• New Example files have been added, like GM Metric 4 Link Rear Suspension..
• Added 'Edit' options to the 'Calculate' menu item in the Engine Specs screen. The new Edit options let you factor the power curves up or down, or re-sort the table if there are blank rows or RPM increments out of order.
FLLD (Front Lateral Load Distribution) When a car makes a turn, weight is transferred from the inside tires to the outside tires. However, how this weight transfer is split between the front and rear has a huge impact on the feel and handling of the car. If more weight transfer occurs on the front of the car, the outside front tire is being “overworked” more than the rear outside tire, causing less cornering traction at the front. This is more likely to produce understeer or a push. Very simplistically, if the Front Lateral Load Distribution is 50%, that means the
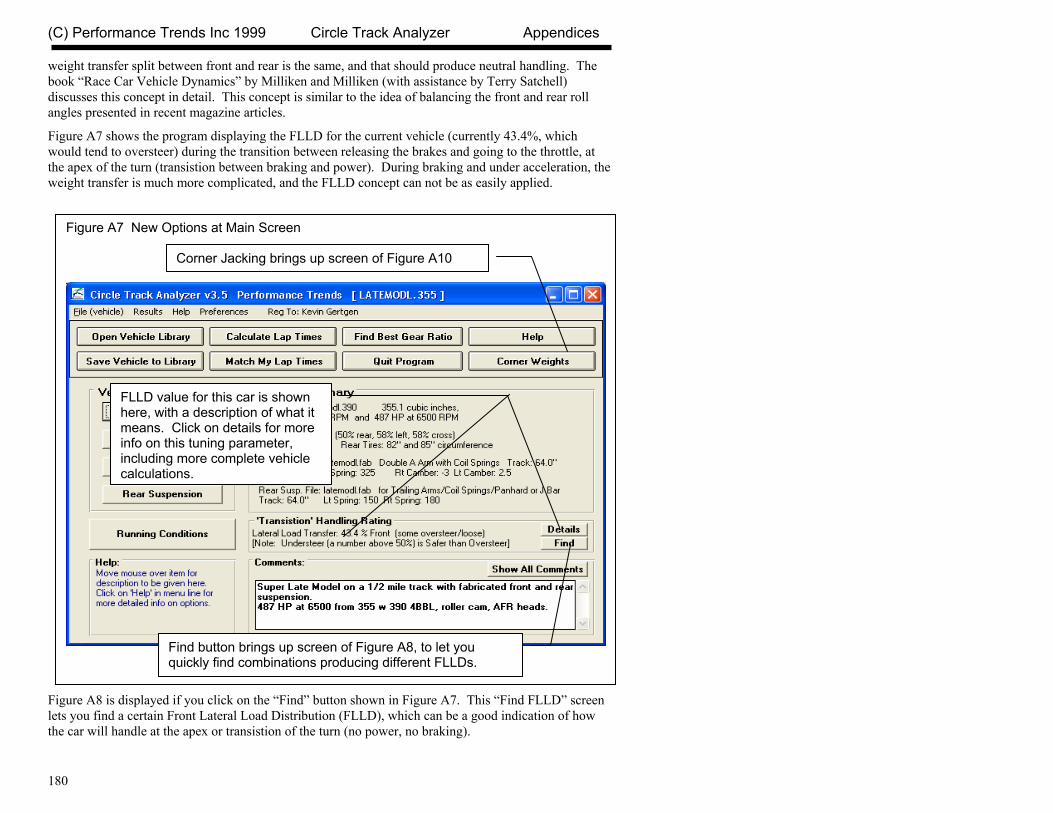
(C) Performance Trends Inc 1999 Circle Track Analyzer Appendices
180
weight transfer split between front and rear is the same, and that should produce neutral handling. The book “Race Car Vehicle Dynamics” by Milliken and Milliken (with assistance by Terry Satchell) discusses this concept in detail. This concept is similar to the idea of balancing the front and rear roll angles presented in recent magazine articles.
Figure A7 shows the program displaying the FLLD for the current vehicle (currently 43.4%, which would tend to oversteer) during the transition between releasing the brakes and going to the throttle, at the apex of the turn (transistion between braking and power). During braking and under acceleration, the weight transfer is much more complicated, and the FLLD concept can not be as easily applied.
Figure A8 is displayed if you click on the “Find” button shown in Figure A7. This “Find FLLD” screen lets you find a certain Front Lateral Load Distribution (FLLD), which can be a good indication of how the car will handle at the apex or transistion of the turn (no power, no braking).
Figure A7 New Options at Main Screen
Corner Jacking brings up screen of Figure A10
Find button brings up screen of Figure A8, to let you quickly find combinations producing different FLLDs.
FLLD value for this car is shown here, with a description of what it means. Click on details for more info on this tuning parameter, including more complete vehicle calculations.

(C) Performance Trends Inc 1999 Circle Track Analyzer Appendices
181
Pick the 'Adjust' factor to tell the program what vehicle component(s) you want to adjust. Enter your desired 'For This FLLD', then click on the 'Find Now' button. For perfect theoretical 'Balance', the FLLD should be 50%. However, from experience, Milliken suggests a target 'starting point' FLLD value of 5 percentage points higher than the percent weight on the front tires (100% - Rear Wt % = Front Wt %). By default, the program will load in this value, but you can change it to anything else you want. Higher FLLDs tend to make the car tighter, with more understeer. Lower FLLDs tend to make the car looser, with more oversteer. There are several ways to obtain a certain Front Lateral Load Distrbution percentage.
The new settings you find using this feature MAY NOT BE THE BEST AND COULD BE UNSAFE. USE YOUR JUDGEMENT when making adjustments based on this concept.
To reduce the possibility of using very strange settings, the program will calculate the average front and rear natural frequencies for the springs. If these frequencies are significantly different than those typically used, the program will warn you. Typically, the front natural frequency will be in the range of 1.4 to 2.0 and the rear will be .1 to .5 points lower than the front. For many vehicle combinations, the program can not find settings to match your requirements. Many times this is due to the Front or especially the Rear roll centers being too high. High roll centers transfer
Figure A8 Find Front Lateral Load Distribution Screen obtained by clicking on Find button in Fig A7.
1) Pick what to Adjust.
2) Select the FLLD you want. The program will default to a typical value based on your car’s weight distribution.
3) Click here to have program find new settings.
4) Click here to have program save these new settings.

(C) Performance Trends Inc 1999 Circle Track Analyzer Appendices
182
more weight laterally through the suspension linkages and less through the springs, making the springs and roll bar have less effect on this tuning factor. You may then want to have the program adjust the Rear Roll Center to find the FLLD you desire. After you adjust the Rear Roll Center and keep this change (click on OK/Keep), then you can go back into this screen and try adjusting springs and/or roll bar and they are likely to have more affect.
If you find settings which you want to keep, click on OK/Keep and they will be loaded back to the vehicle specs screen. For the Front and Rear Roll Center Heights for some suspension types, you must make a mental note of this setting and go back into the Front or Rear Suspension Screen and try various setting to arrive at this height. The program can not make this change automatically for you. Figure A9 shows 2 reports which now also include references and suggestions based on balancing the FLLD.
Fig A9 Other Features using the FLLD Concept
At the top of the Analyze Suspension screen, these 3 reports are all improved using the FLLD concept.
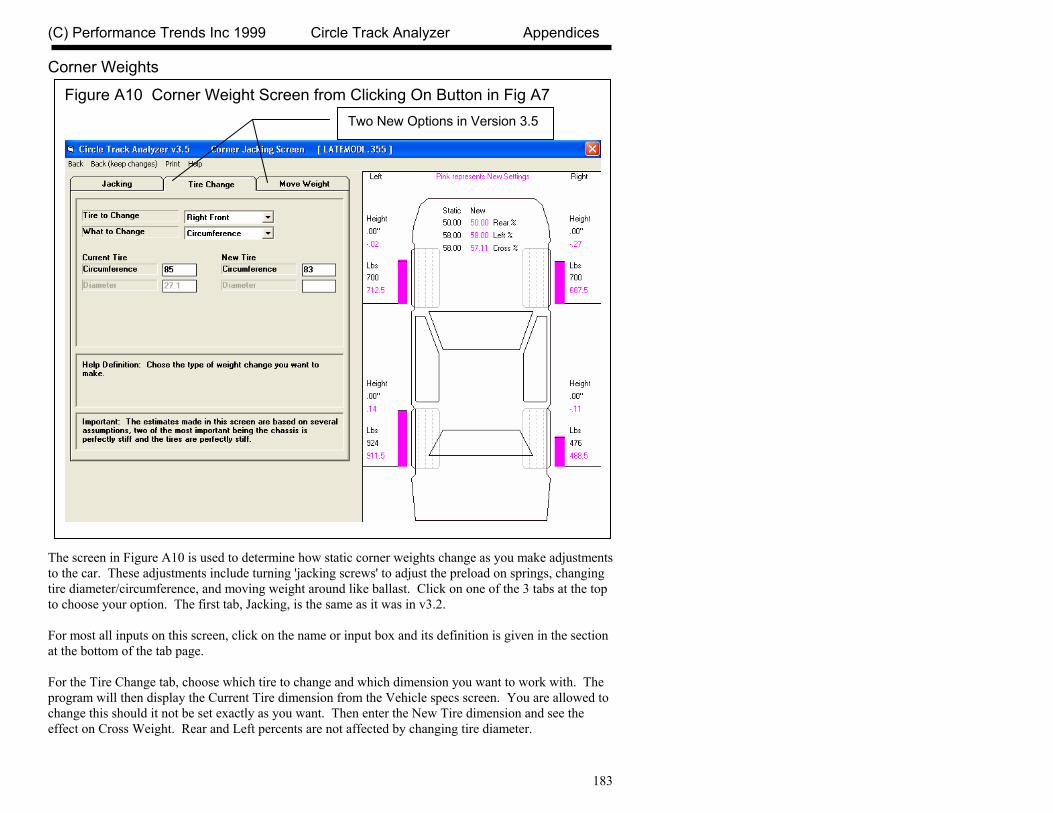
(C) Performance Trends Inc 1999 Circle Track Analyzer Appendices
183
Corner Weights
The screen in Figure A10 is used to determine how static corner weights change as you make adjustments to the car. These adjustments include turning 'jacking screws' to adjust the preload on springs, changing tire diameter/circumference, and moving weight around like ballast. Click on one of the 3 tabs at the top to choose your option. The first tab, Jacking, is the same as it was in v3.2. For most all inputs on this screen, click on the name or input box and its definition is given in the section at the bottom of the tab page. For the Tire Change tab, choose which tire to change and which dimension you want to work with. The program will then display the Current Tire dimension from the Vehicle specs screen. You are allowed to change this should it not be set exactly as you want. Then enter the New Tire dimension and see the effect on Cross Weight. Rear and Left percents are not affected by changing tire diameter.
Figure A10 Corner Weight Screen from Clicking On Button in Fig A7
Two New Options in Version 3.5

(C) Performance Trends Inc 1999 Circle Track Analyzer Appendices
184
For the Move Weight tab, choose the type of weight change, and the amount of weight to change. Then type in the Current Location of the weight and/or the New Location of the weight after the move. Cross, Rear and Left percents can all be affected by moving weight. Click on Back (keep changes) at upper left of this screen to return to the main screen while keeping your changes to corner weights, tire sizes, vehicle weight, etc. Front Suspension Screen
Figure A11 shows some of the new features for the Front Suspension Screen. Figure A12 shows an example of the new “Table & Graph” feature for calculating Roll Center “migration” for various amounts of dive and roll.
Figure A 11 New Front Suspension Screen Features New Table & Graph features are
explained in Figure A12.
Swing Arm Length and Scrub are displayed here.

(C) Performance Trends Inc 1999 Circle Track Analyzer Appendices
185
Lt and Rt Scrub shows in Figure A11 is the amount the tire moves out from the center of the car as it goes through the amount of dive and roll you have specified. Lt and Rt Swing Arm Length is the distance from the center of the wheel/tire to its instant center. Long lengths indicate that camber will change little with dive and/or roll (Camber Gain will be low). Table & Graph If you click on Table & Graph at the Front Suspension Screen, you will obtain a screen similar to to the top picture in Figure A12. This screen shows you 2 tables of Roll Center Height and Roll Center Left (distance left of center) for a set on Dive and Roll combinations. Distances right of center are labeled as “negative”. (Negative in not “bad”, it is just a way to indicate right, the opposite of Left.) You could have also chosen to do a Camber Table. Then the top table would be for the Right side and the bottom would be for the Left side. You can also select to have a Baseline condition displayed in the Table (Show Baseline Data). This is useful to compare 2 different suspension layouts. A Baseline is some previous condition which was shown in the Table. To save the current Table as a Baseline, click on 'Baseline', then 'Save This Data as Baseline'. The program will ask you for a Comment to describe the Baseline condition. This Comment will be printed with the Table when you print it if you are Showing the Baseline condition. This comment can also be edited by clicking on 'Baseline' and then 'Baseline Comment'. After saving a baseline Table, you could close the Table by clicking on Back in the Menu Bar, make a change in the suspension and create the table again by clicking on Table & Graph. You would produce a Table like in the upper left of Figure A12. Click on the Options menu item and select 'Specs for Table Rows & Columns' to change the Dive and Roll increments, and which is used for rows and which is used for columns. You will obtain the menu shown in the upper right of Figure A12. As you change the specs in this menu, the Preview at the bottom changes to show what the Roll and Dive increments, and the general layout of the Camber Table will look like. The program allows only up to 10 rows and 11 columns. Your inputs may be changed if a combination produces more than these limits. When you are satisfied with the Preview, click on OK/Exit. Click on Cancel to close this menu and return to the original Table layout. Note: If you change the Table specs, any previously saved baseline conditions will be lost because that baseline has different increments for columns and rows, which would not match up to the new increments you have selected.

(C) Performance Trends Inc 1999 Circle Track Analyzer Appendices
186
Figure A 12 Roll Center Table and Graph
Click on Graph to make graph as shown below.
Click on Options for screen to the right to choose increments for dive and roll for table.
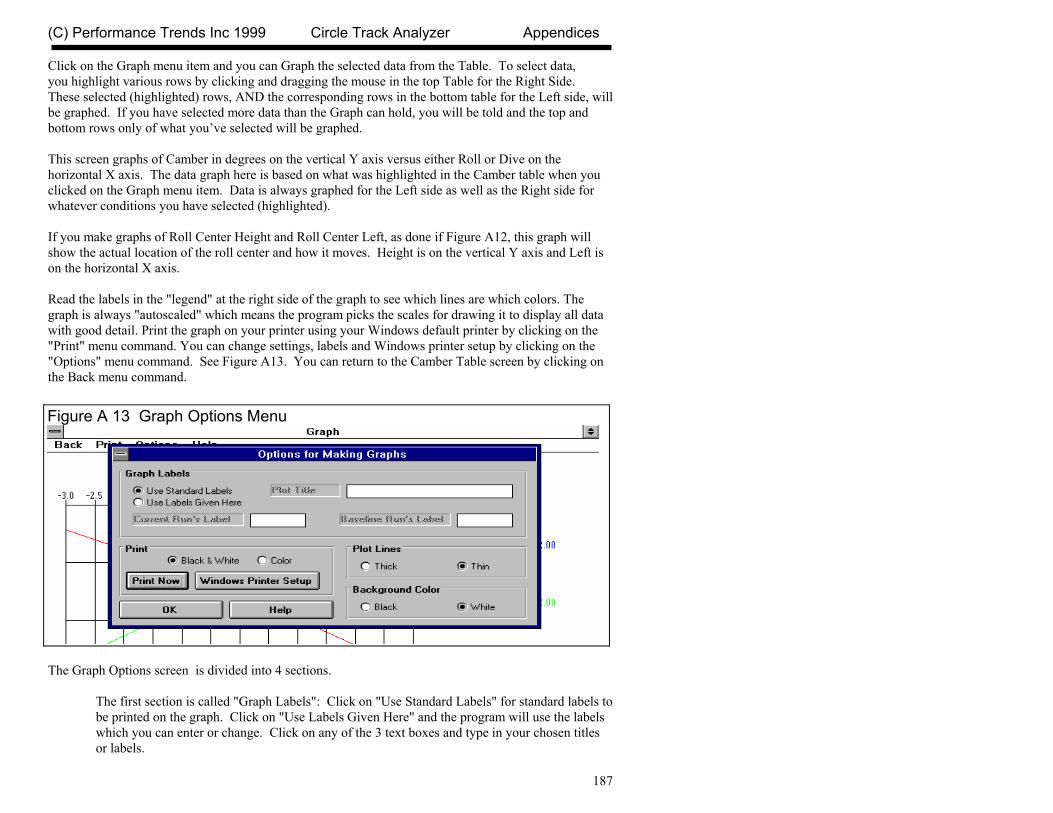
(C) Performance Trends Inc 1999 Circle Track Analyzer Appendices
187
Click on the Graph menu item and you can Graph the selected data from the Table. To select data, you highlight various rows by clicking and dragging the mouse in the top Table for the Right Side. These selected (highlighted) rows, AND the corresponding rows in the bottom table for the Left side, will be graphed. If you have selected more data than the Graph can hold, you will be told and the top and bottom rows only of what you’ve selected will be graphed. This screen graphs of Camber in degrees on the vertical Y axis versus either Roll or Dive on the horizontal X axis. The data graph here is based on what was highlighted in the Camber table when you clicked on the Graph menu item. Data is always graphed for the Left side as well as the Right side for whatever conditions you have selected (highlighted). If you make graphs of Roll Center Height and Roll Center Left, as done if Figure A12, this graph will show the actual location of the roll center and how it moves. Height is on the vertical Y axis and Left is on the horizontal X axis. Read the labels in the "legend" at the right side of the graph to see which lines are which colors. The graph is always "autoscaled" which means the program picks the scales for drawing it to display all data with good detail. Print the graph on your printer using your Windows default printer by clicking on the "Print" menu command. You can change settings, labels and Windows printer setup by clicking on the "Options" menu command. See Figure A13. You can return to the Camber Table screen by clicking on the Back menu command.
The Graph Options screen is divided into 4 sections.
The first section is called "Graph Labels": Click on "Use Standard Labels" for standard labels to be printed on the graph. Click on "Use Labels Given Here" and the program will use the labels which you can enter or change. Click on any of the 3 text boxes and type in your chosen titles or labels.
Figure A 13 Graph Options Menu
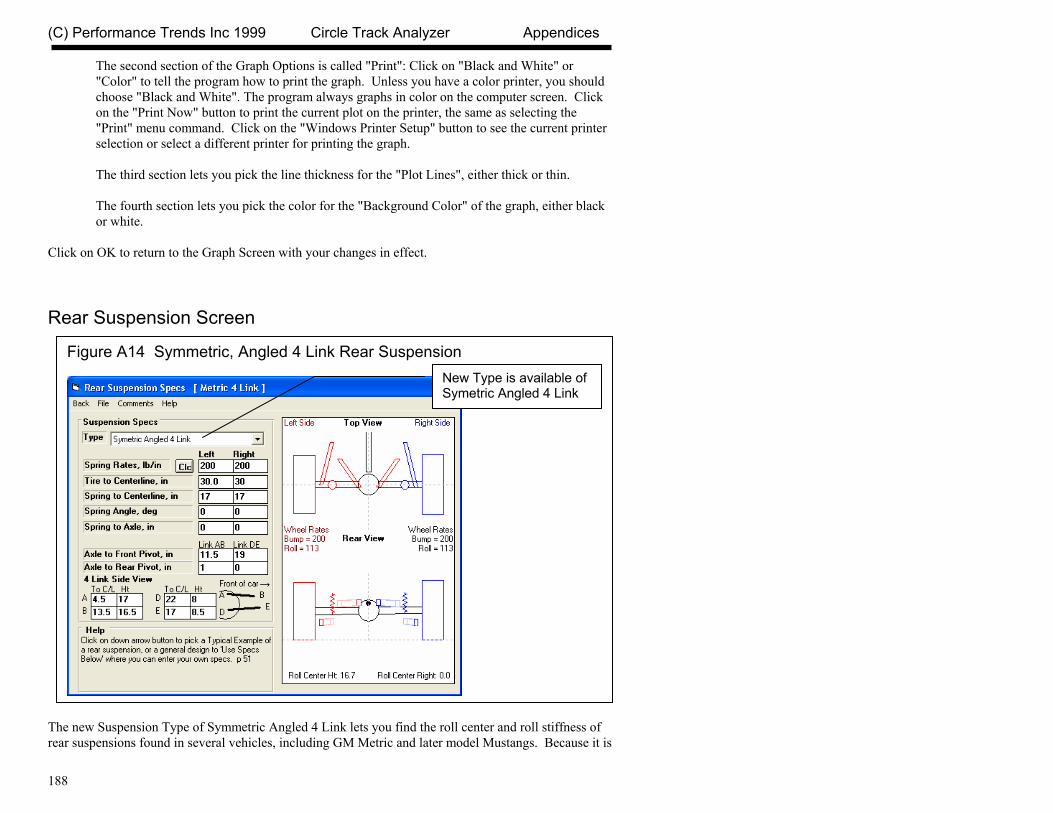
(C) Performance Trends Inc 1999 Circle Track Analyzer Appendices
188
The second section of the Graph Options is called "Print": Click on "Black and White" or "Color" to tell the program how to print the graph. Unless you have a color printer, you should choose "Black and White". The program always graphs in color on the computer screen. Click on the "Print Now" button to print the current plot on the printer, the same as selecting the "Print" menu command. Click on the "Windows Printer Setup" button to see the current printer selection or select a different printer for printing the graph. The third section lets you pick the line thickness for the "Plot Lines", either thick or thin. The fourth section lets you pick the color for the "Background Color" of the graph, either black or white.
Click on OK to return to the Graph Screen with your changes in effect. Rear Suspension Screen
The new Suspension Type of Symmetric Angled 4 Link lets you find the roll center and roll stiffness of rear suspensions found in several vehicles, including GM Metric and later model Mustangs. Because it is
Figure A14 Symmetric, Angled 4 Link Rear Suspension
New Type is available of Symetric Angled 4 Link
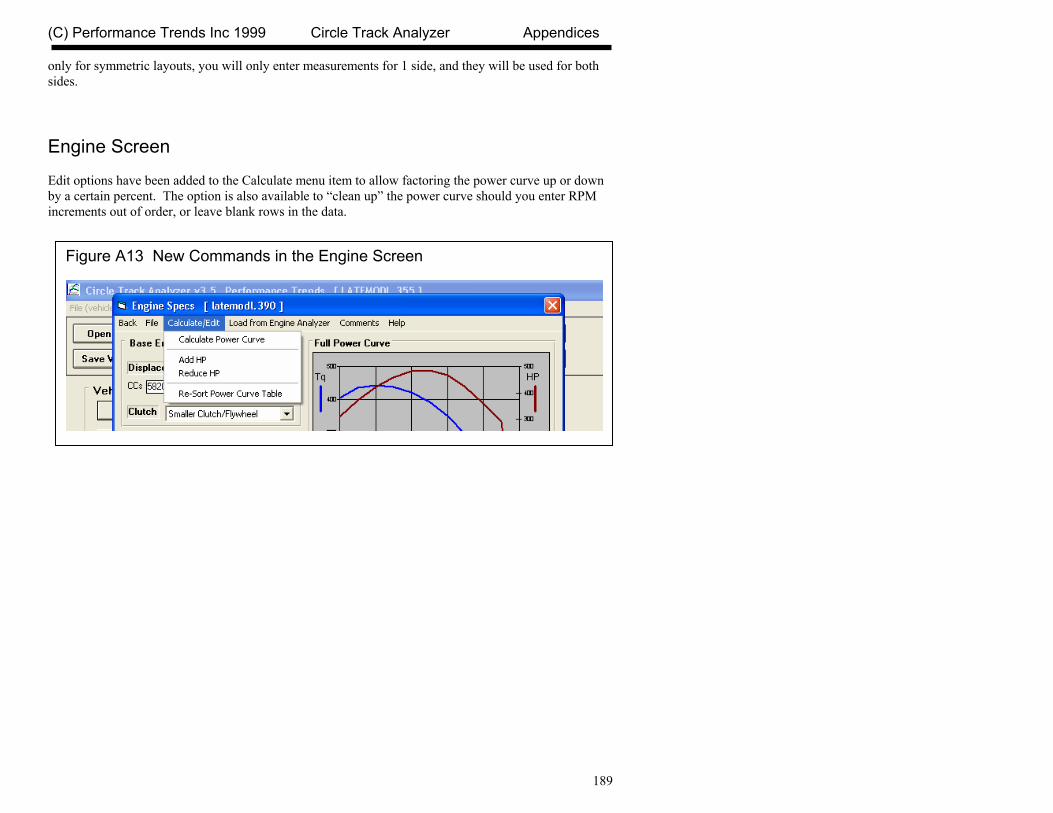
(C) Performance Trends Inc 1999 Circle Track Analyzer Appendices
189
only for symmetric layouts, you will only enter measurements for 1 side, and they will be used for both sides. Engine Screen Edit options have been added to the Calculate menu item to allow factoring the power curve up or down by a certain percent. The option is also available to “clean up” the power curve should you enter RPM increments out of order, or leave blank rows in the data.
Figure A13 New Commands in the Engine Screen
(C) Performance Trends Inc 1999 Circle Track Analyzer Appendices
190

(C) Performance Trends Inc 1999 Circle Track Analyzer Appendices
191
Appendix 5: New Features in Version 3.6 In Version 3.6 we’ve broken the Circle Track Analyzer into 3 different programs:
• Roll Center Calculator (RCC), which does the Front Suspension only.
• Roll Center Calculator Plus (RCC+), which does the Front Suspension and Rear Suspension, plus some front to rear “balance” analysis.
• The full Circle Track Analyzer (CTA), which does everything the old Circle Track Analyzer v3.5 did plus all these new features.
Here is a listing of the major new features added in Version 3.6 of full Circle Track Analyzer. Note that unless these new features specifically mention Roll Center Calculator, they do NOT apply to the Roll Center Calculator versions.
• The program now lets you enter a rear anti-roll bar. This input changes the front to rear roll stiffness, which affects most all of the handling ratings the program will calculate. RCC+, CTA.
• The program now lets you enter both a front and rear aerodynamic Lift Coefficient. Many times when you make an aerodynamic adjustment, you only affect 1 end of the car, like a rear spoiler adjustment. This adjustment not only affects overall “road holding” ability of the car, and therefore lap times, it also affects handling, the tendency to oversteer or understeer. CTA only.
• The program has a new Calculation Menu utility called “Adjust” for the front and rear Lift Coefficient and Drag Coefficient. You can choose a type of vehicle modification, enter the starting and modified condition, and the program shows you how the current lift and drag coefficients would change. This way you have an estimate of how certain vehicle modifications would affect the entire aerodynamics of the vehicle. CTA only.
• You can now enter more details about the front suspension, both for Double A Arms and McPhearson Strut suspensions. This added detail lets you locate both the front and rear A Arm mounts on the frame, and the angle of the McPhearson Strut when viewed from the side. These details let the program more precisely locate where the A Arm attaches to the frame in the 2 dimensional layout. They also determine how much Anti-Dive is built into the front suspension. Anti-Dive is the vehicle’s resistance to diving the front end due to braking. Reasonable starting points for Anti-Dive for most all circle track asphalt cars in the 2000-3500 lb range are 10% on the Right Front and 5% on the Left Front. RCC, RCC+ and CTA.
• We’ve taken the concept of balancing the Front Lateral Load Distribution (FLLD) with the rear lateral load distribution a step farther. We’ve developed a Performance Trends exclusive called Oversteer/Understeer rating. It is based on how evenly the tires on the 4 corners of the car are loaded. If they are equally loaded left to right, and loaded front to back the same as the front to

(C) Performance Trends Inc 1999 Circle Track Analyzer Appendices
192
back weight distribution, we say that is a 0 Oversteer rating, or Neutral handling. Several factors go into this rating, including banking forces, aerodynamic forces, dynamic weight transfer left to right, and front to back. CTA only.
• You can display the actual wheel loads for the car in “transition” on the track, at the point where you are neither braking or accelerating. It is at this point where the program determines the Oversteer/Understeer rating described above. For this “transition” condition, you can also save a “baseline” condition for comparison to some modification you have made to the vehicle. This way you can actually see the effect you modifications will have on wheel loads and the handling rating. CTA only.
• The oversteer/understeer rating is displayed as the car goes around the track on the Analyze Suspension screen. By saving a condition as a Baseline, you can compare your current conditions to a saved Baseline. This is the same as what is described in the preceeding paragraph except it is done at all locations on the track. This is also the same as the “Analyze Suspension” feature in previous versions, except now it includes the front and rear aerodynamic downforce, and the handling rating. CTA only.
• The ‘Rule of Thumb’ Suggestions for a good starting point for a setup now includes suggestions for a “Big Bar Soft Spring” (BBSS) setup. The BBSS theory is you use significantly softer front springs to better handle bumps in the track, and to lower the car in the corners for less aerodynamic drag and less weight transfer inside to outside. Then to counteract the additional roll these soft springs would allow, the anti-roll bar is stiffened significantly. Other adjustments include a much stiffer than typical right rear spring, paying more attention to Anti-Dive and shock valving. CTA only.
• Improved the Tire Scrub calculation for a Double A Arm front suspension (how much sideways tire movement there is during dive and roll). RCC, RCC+ and CTA.
• Refined the calculations for suggested spring rates for “Starting Point Suggestions” report. CTA only.
• Program is now more compatible with Windows Vista and Windows 7. RCC, RCC+ and CTA.
• Program is now better at remembering a printer or printer orientation changes. RCC, RCC+ and CTA.
• Program is now better at find newer versions of Adobe Acrobat and Reader, and other PDF compatible programs for viewing the User’s Manual. RCC, RCC+ and CTA.

(C) Performance Trends Inc 1999 Circle Track Analyzer Appendices
193
Figure A15 Rear Anti-Rollbar
Set to Yes and you can enter rear roll bar specs.
Click here to Calculate a roll bar rate from other inputs
Roll bar drawn to your specs here in green.
You can also find a rear roll bar rate to give a desired handling rating (Front Lateral Load Distribution, FLLD)

(C) Performance Trends Inc 1999 Circle Track Analyzer Appendices
194
Figure A16 Front and Rear Aerodynamic Lift Coefficients
Program now has both a front and rear lift coefficient, to split the aerodynamic down force between the front and rear tires.
Click on the Adjust button for the screen shown below.
Height
Length
Angle
Rear deck of car
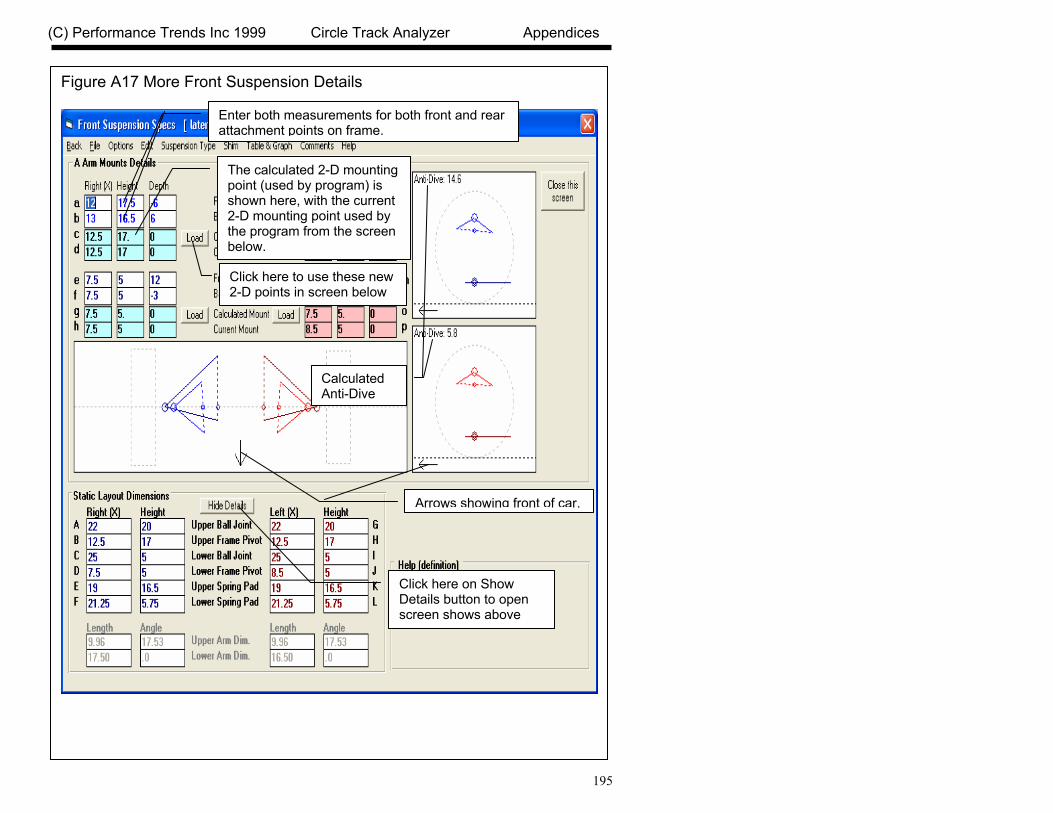
(C) Performance Trends Inc 1999 Circle Track Analyzer Appendices
195
Figure A17 More Front Suspension Details
Click here on Show Details button to open screen shows above
Enter both measurements for both front and rear attachment points on frame.
The calculated 2-D mounting point (used by program) is shown here, with the current 2-D mounting point used by the program from the screen below.
Click here to use these new 2-D points in screen below
Arrows showing front of car.
Calculated Anti-Dive
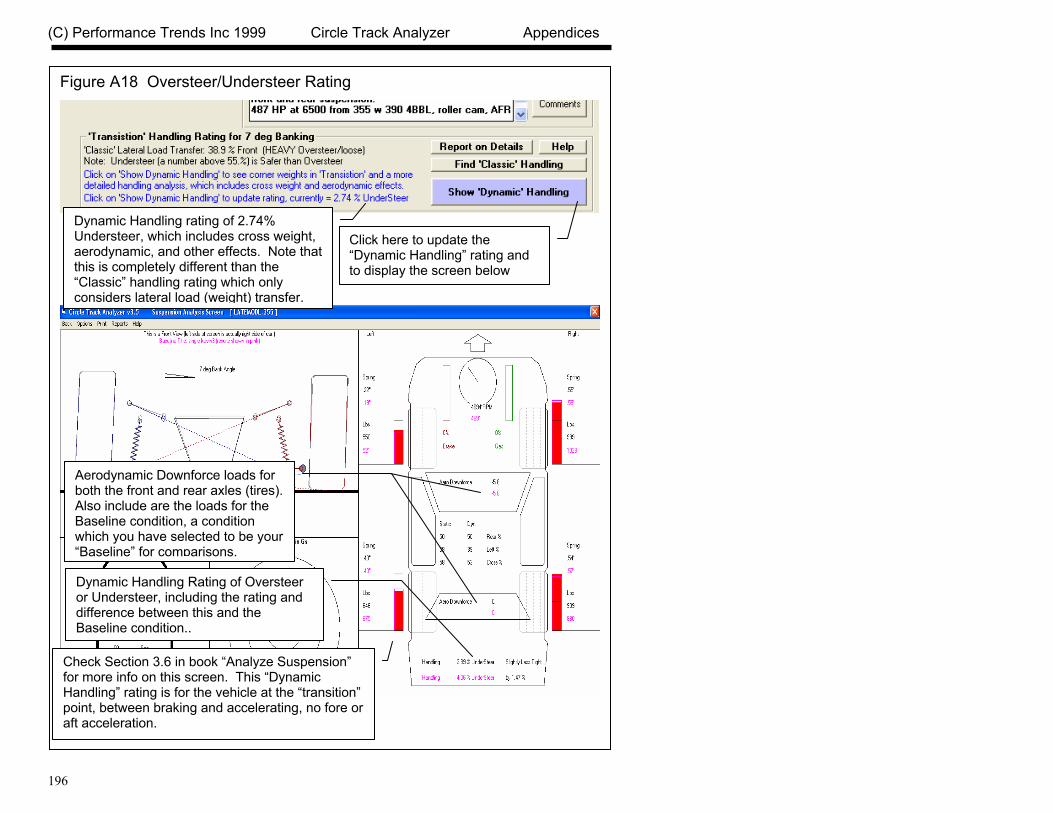
(C) Performance Trends Inc 1999 Circle Track Analyzer Appendices
196
Figure A18 Oversteer/Understeer Rating
Dynamic Handling rating of 2.74% Understeer, which includes cross weight, aerodynamic, and other effects. Note that this is completely different than the “Classic” handling rating which only considers lateral load (weight) transfer.
Click here to update the “Dynamic Handling” rating and to display the screen below
Aerodynamic Downforce loads for both the front and rear axles (tires). Also include are the loads for the Baseline condition, a condition which you have selected to be your “Baseline” for comparisons.
Dynamic Handling Rating of Oversteer or Understeer, including the rating and difference between this and the Baseline condition..
Check Section 3.6 in book “Analyze Suspension” for more info on this screen. This “Dynamic Handling” rating is for the vehicle at the “transition” point, between braking and accelerating, no fore or aft acceleration.
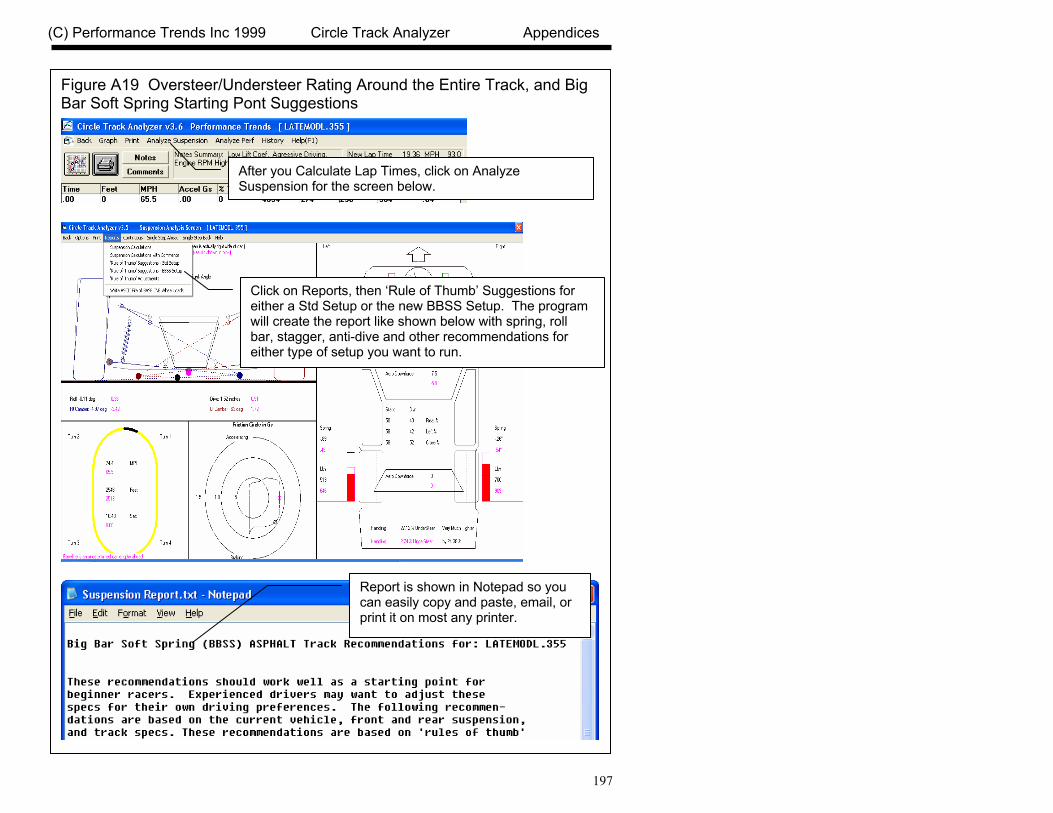
(C) Performance Trends Inc 1999 Circle Track Analyzer Appendices
197
Figure A19 Oversteer/Understeer Rating Around the Entire Track, and Big Bar Soft Spring Starting Pont Suggestions
After you Calculate Lap Times, click on Analyze Suspension for the screen below.
Click on Reports, then ‘Rule of Thumb’ Suggestions for either a Std Setup or the new BBSS Setup. The program will create the report like shown below with spring, roll bar, stagger, anti-dive and other recommendations for either type of setup you want to run.
Report is shown in Notepad so you can easily copy and paste, email, or print it on most any printer.

(C) Performance Trends Inc 1999 Circle Track Analyzer Appendices
198
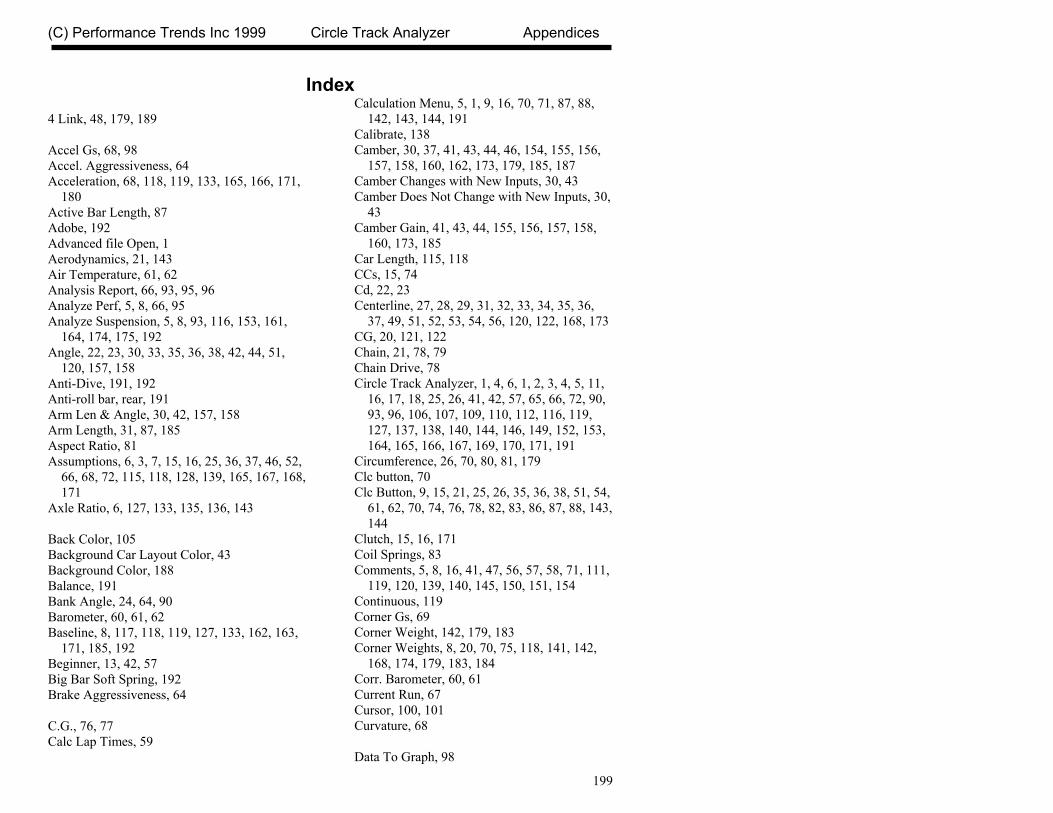
(C) Performance Trends Inc 1999 Circle Track Analyzer Appendices
199
Index
4 Link, 48, 179, 189 Accel Gs, 68, 98 Accel. Aggressiveness, 64 Acceleration, 68, 118, 119, 133, 165, 166, 171,
180 Active Bar Length, 87 Adobe, 192 Advanced file Open, 1 Aerodynamics, 21, 143 Air Temperature, 61, 62 Analysis Report, 66, 93, 95, 96 Analyze Perf, 5, 8, 66, 95 Analyze Suspension, 5, 8, 93, 116, 153, 161,
164, 174, 175, 192 Angle, 22, 23, 30, 33, 35, 36, 38, 42, 44, 51,
120, 157, 158 Anti-Dive, 191, 192 Anti-roll bar, rear, 191 Arm Len & Angle, 30, 42, 157, 158 Arm Length, 31, 87, 185 Aspect Ratio, 81 Assumptions, 6, 3, 7, 15, 16, 25, 36, 37, 46, 52,
66, 68, 72, 115, 118, 128, 139, 165, 167, 168, 171
Axle Ratio, 6, 127, 133, 135, 136, 143 Back Color, 105 Background Car Layout Color, 43 Background Color, 188 Balance, 191 Bank Angle, 24, 64, 90 Barometer, 60, 61, 62 Baseline, 8, 117, 118, 119, 127, 133, 162, 163,
171, 185, 192 Beginner, 13, 42, 57 Big Bar Soft Spring, 192 Brake Aggressiveness, 64 C.G., 76, 77 Calc Lap Times, 59
Calculation Menu, 5, 1, 9, 16, 70, 71, 87, 88, 142, 143, 144, 191
Calibrate, 138 Camber, 30, 37, 41, 43, 44, 46, 154, 155, 156,
157, 158, 160, 162, 173, 179, 185, 187 Camber Changes with New Inputs, 30, 43 Camber Does Not Change with New Inputs, 30,
43 Camber Gain, 41, 43, 44, 155, 156, 157, 158,
160, 173, 185 Car Length, 115, 118 CCs, 15, 74 Cd, 22, 23 Centerline, 27, 28, 29, 31, 32, 33, 34, 35, 36,
37, 49, 51, 52, 53, 54, 56, 120, 122, 168, 173 CG, 20, 121, 122 Chain, 21, 78, 79 Chain Drive, 78 Circle Track Analyzer, 1, 4, 6, 1, 2, 3, 4, 5, 11,
16, 17, 18, 25, 26, 41, 42, 57, 65, 66, 72, 90, 93, 96, 106, 107, 109, 110, 112, 116, 119, 127, 137, 138, 140, 144, 146, 149, 152, 153, 164, 165, 166, 167, 169, 170, 171, 191
Circumference, 26, 70, 80, 81, 179 Clc button, 70 Clc Button, 9, 15, 21, 25, 26, 35, 36, 38, 51, 54,
61, 62, 70, 74, 76, 78, 82, 83, 86, 87, 88, 143, 144
Clutch, 15, 16, 171 Coil Springs, 83 Comments, 5, 8, 16, 41, 47, 56, 57, 58, 71, 111,
119, 120, 139, 140, 145, 150, 151, 154 Continuous, 119 Corner Gs, 69 Corner Weight, 142, 179, 183 Corner Weights, 8, 20, 70, 75, 118, 141, 142,
168, 174, 179, 183, 184 Corr. Barometer, 60, 61 Current Run, 67 Cursor, 100, 101 Curvature, 68 Data To Graph, 98
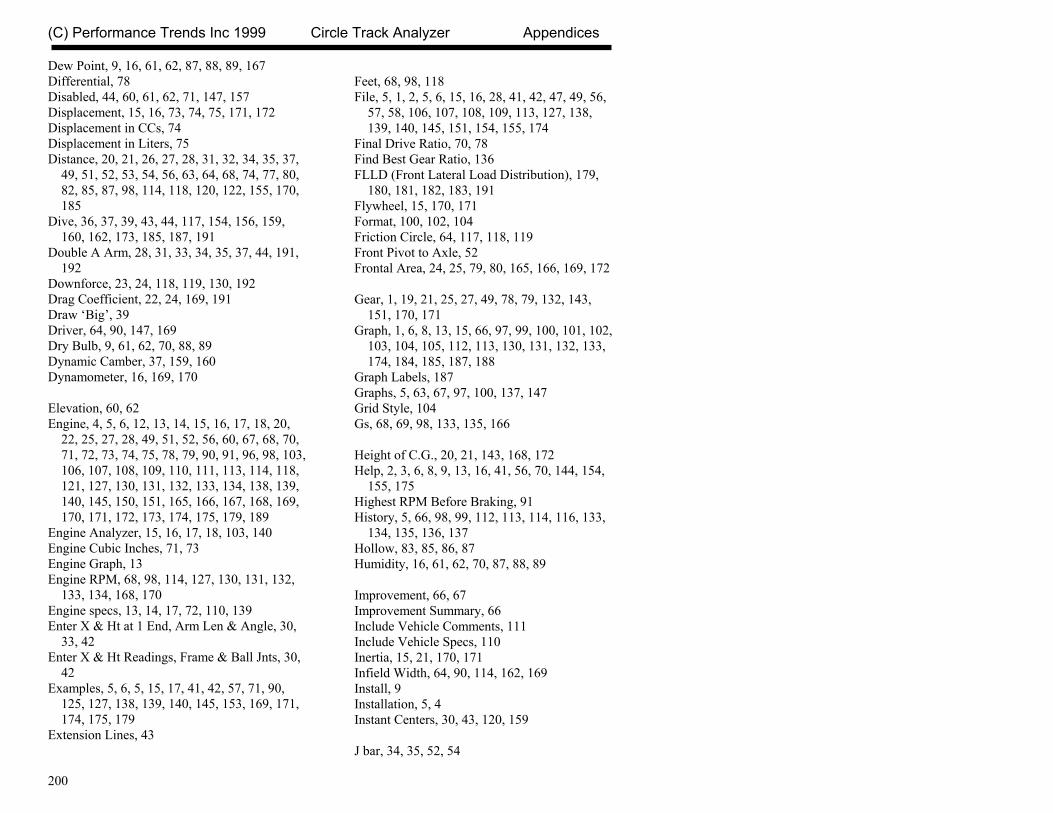
(C) Performance Trends Inc 1999 Circle Track Analyzer Appendices
200
Dew Point, 9, 16, 61, 62, 87, 88, 89, 167 Differential, 78 Disabled, 44, 60, 61, 62, 71, 147, 157 Displacement, 15, 16, 73, 74, 75, 171, 172 Displacement in CCs, 74 Displacement in Liters, 75 Distance, 20, 21, 26, 27, 28, 31, 32, 34, 35, 37,
49, 51, 52, 53, 54, 56, 63, 64, 68, 74, 77, 80, 82, 85, 87, 98, 114, 118, 120, 122, 155, 170, 185
Dive, 36, 37, 39, 43, 44, 117, 154, 156, 159, 160, 162, 173, 185, 187, 191
Double A Arm, 28, 31, 33, 34, 35, 37, 44, 191, 192
Downforce, 23, 24, 118, 119, 130, 192 Drag Coefficient, 22, 24, 169, 191 Draw ‘Big’, 39 Driver, 64, 90, 147, 169 Dry Bulb, 9, 61, 62, 70, 88, 89 Dynamic Camber, 37, 159, 160 Dynamometer, 16, 169, 170 Elevation, 60, 62 Engine, 4, 5, 6, 12, 13, 14, 15, 16, 17, 18, 20,
22, 25, 27, 28, 49, 51, 52, 56, 60, 67, 68, 70, 71, 72, 73, 74, 75, 78, 79, 90, 91, 96, 98, 103, 106, 107, 108, 109, 110, 111, 113, 114, 118, 121, 127, 130, 131, 132, 133, 134, 138, 139, 140, 145, 150, 151, 165, 166, 167, 168, 169, 170, 171, 172, 173, 174, 175, 179, 189
Engine Analyzer, 15, 16, 17, 18, 103, 140 Engine Cubic Inches, 71, 73 Engine Graph, 13 Engine RPM, 68, 98, 114, 127, 130, 131, 132,
133, 134, 168, 170 Engine specs, 13, 14, 17, 72, 110, 139 Enter X & Ht at 1 End, Arm Len & Angle, 30,
33, 42 Enter X & Ht Readings, Frame & Ball Jnts, 30,
42 Examples, 5, 6, 5, 15, 17, 41, 42, 57, 71, 90,
125, 127, 138, 139, 140, 145, 153, 169, 171, 174, 175, 179
Extension Lines, 43
Feet, 68, 98, 118 File, 5, 1, 2, 5, 6, 15, 16, 28, 41, 42, 47, 49, 56,
57, 58, 106, 107, 108, 109, 113, 127, 138, 139, 140, 145, 151, 154, 155, 174
Final Drive Ratio, 70, 78 Find Best Gear Ratio, 136 FLLD (Front Lateral Load Distribution), 179,
180, 181, 182, 183, 191 Flywheel, 15, 170, 171 Format, 100, 102, 104 Friction Circle, 64, 117, 118, 119 Front Pivot to Axle, 52 Frontal Area, 24, 25, 79, 80, 165, 166, 169, 172 Gear, 1, 19, 21, 25, 27, 49, 78, 79, 132, 143,
151, 170, 171 Graph, 1, 6, 8, 13, 15, 66, 97, 99, 100, 101, 102,
103, 104, 105, 112, 113, 130, 131, 132, 133, 174, 184, 185, 187, 188
Graph Labels, 187 Graphs, 5, 63, 67, 97, 100, 137, 147 Grid Style, 104 Gs, 68, 69, 98, 133, 135, 166 Height of C.G., 20, 21, 143, 168, 172 Help, 2, 3, 6, 8, 9, 13, 16, 41, 56, 70, 144, 154,
155, 175 Highest RPM Before Braking, 91 History, 5, 66, 98, 99, 112, 113, 114, 116, 133,
134, 135, 136, 137 Hollow, 83, 85, 86, 87 Humidity, 16, 61, 62, 70, 87, 88, 89 Improvement, 66, 67 Improvement Summary, 66 Include Vehicle Comments, 111 Include Vehicle Specs, 110 Inertia, 15, 21, 170, 171 Infield Width, 64, 90, 114, 162, 169 Install, 9 Installation, 5, 4 Instant Centers, 30, 43, 120, 159 J bar, 34, 35, 52, 54
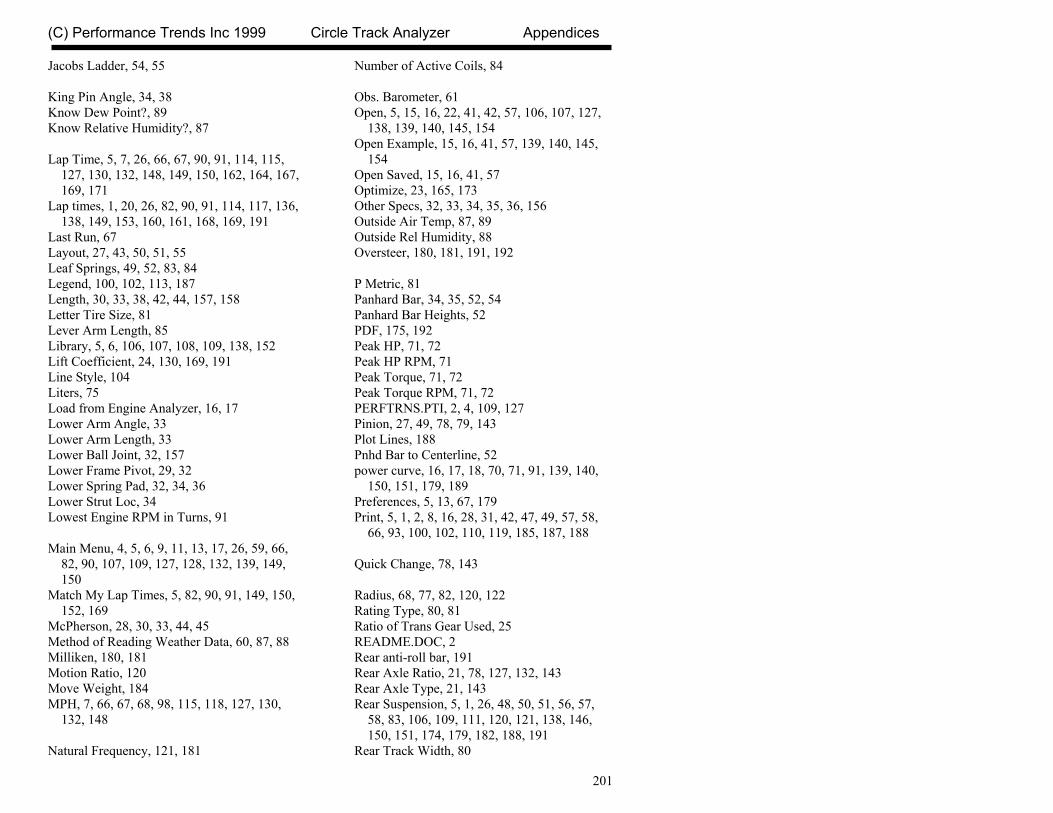
(C) Performance Trends Inc 1999 Circle Track Analyzer Appendices
201
Jacobs Ladder, 54, 55 King Pin Angle, 34, 38 Know Dew Point?, 89 Know Relative Humidity?, 87 Lap Time, 5, 7, 26, 66, 67, 90, 91, 114, 115,
127, 130, 132, 148, 149, 150, 162, 164, 167, 169, 171
Lap times, 1, 20, 26, 82, 90, 91, 114, 117, 136, 138, 149, 153, 160, 161, 168, 169, 191
Last Run, 67 Layout, 27, 43, 50, 51, 55 Leaf Springs, 49, 52, 83, 84 Legend, 100, 102, 113, 187 Length, 30, 33, 38, 42, 44, 157, 158 Letter Tire Size, 81 Lever Arm Length, 85 Library, 5, 6, 106, 107, 108, 109, 138, 152 Lift Coefficient, 24, 130, 169, 191 Line Style, 104 Liters, 75 Load from Engine Analyzer, 16, 17 Lower Arm Angle, 33 Lower Arm Length, 33 Lower Ball Joint, 32, 157 Lower Frame Pivot, 29, 32 Lower Spring Pad, 32, 34, 36 Lower Strut Loc, 34 Lowest Engine RPM in Turns, 91 Main Menu, 4, 5, 6, 9, 11, 13, 17, 26, 59, 66,
82, 90, 107, 109, 127, 128, 132, 139, 149, 150
Match My Lap Times, 5, 82, 90, 91, 149, 150, 152, 169
McPherson, 28, 30, 33, 44, 45 Method of Reading Weather Data, 60, 87, 88 Milliken, 180, 181 Motion Ratio, 120 Move Weight, 184 MPH, 7, 66, 67, 68, 98, 115, 118, 127, 130,
132, 148 Natural Frequency, 121, 181
Number of Active Coils, 84 Obs. Barometer, 61 Open, 5, 15, 16, 22, 41, 42, 57, 106, 107, 127,
138, 139, 140, 145, 154 Open Example, 15, 16, 41, 57, 139, 140, 145,
154 Open Saved, 15, 16, 41, 57 Optimize, 23, 165, 173 Other Specs, 32, 33, 34, 35, 36, 156 Outside Air Temp, 87, 89 Outside Rel Humidity, 88 Oversteer, 180, 181, 191, 192 P Metric, 81 Panhard Bar, 34, 35, 52, 54 Panhard Bar Heights, 52 PDF, 175, 192 Peak HP, 71, 72 Peak HP RPM, 71 Peak Torque, 71, 72 Peak Torque RPM, 71, 72 PERFTRNS.PTI, 2, 4, 109, 127 Pinion, 27, 49, 78, 79, 143 Plot Lines, 188 Pnhd Bar to Centerline, 52 power curve, 16, 17, 18, 70, 71, 91, 139, 140,
150, 151, 179, 189 Preferences, 5, 13, 67, 179 Print, 5, 1, 2, 8, 16, 28, 31, 42, 47, 49, 57, 58,
66, 93, 100, 102, 110, 119, 185, 187, 188 Quick Change, 78, 143 Radius, 68, 77, 82, 120, 122 Rating Type, 80, 81 Ratio of Trans Gear Used, 25 README.DOC, 2 Rear anti-roll bar, 191 Rear Axle Ratio, 21, 78, 127, 132, 143 Rear Axle Type, 21, 143 Rear Suspension, 5, 1, 26, 48, 50, 51, 56, 57,
58, 83, 106, 109, 111, 120, 121, 138, 146, 150, 151, 174, 179, 182, 188, 191
Rear Track Width, 80
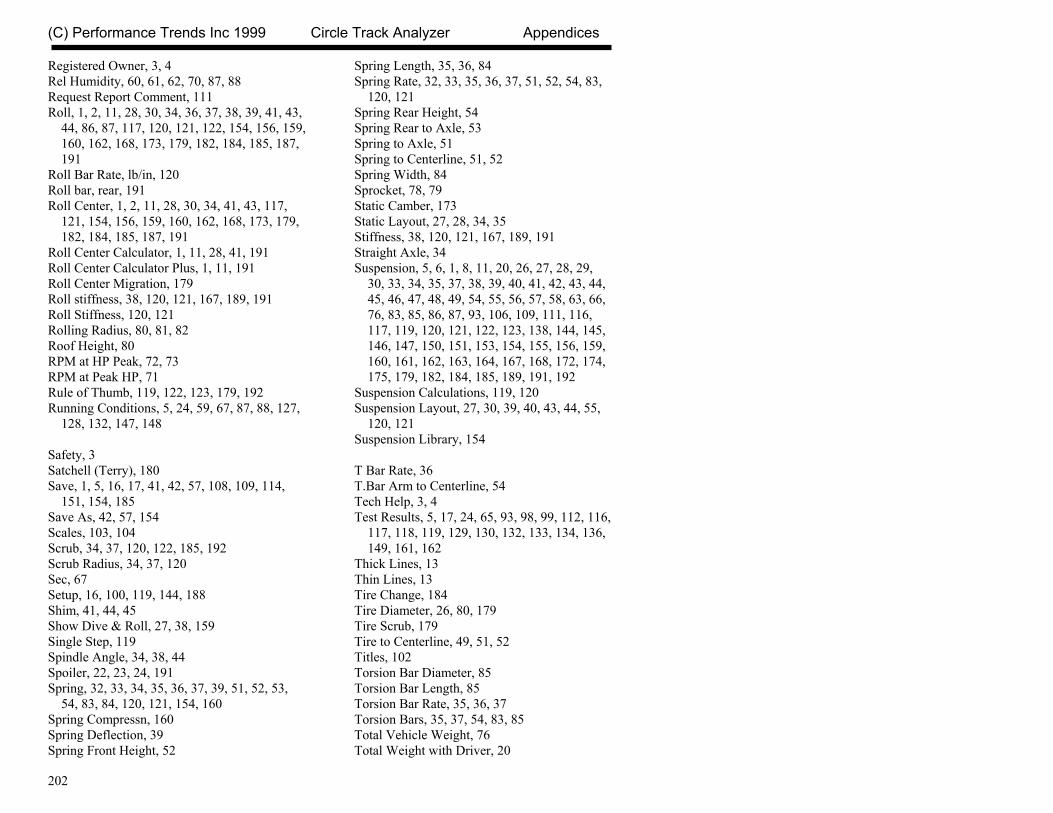
(C) Performance Trends Inc 1999 Circle Track Analyzer Appendices
202
Registered Owner, 3, 4 Rel Humidity, 60, 61, 62, 70, 87, 88 Request Report Comment, 111 Roll, 1, 2, 11, 28, 30, 34, 36, 37, 38, 39, 41, 43,
44, 86, 87, 117, 120, 121, 122, 154, 156, 159, 160, 162, 168, 173, 179, 182, 184, 185, 187, 191
Roll Bar Rate, lb/in, 120 Roll bar, rear, 191 Roll Center, 1, 2, 11, 28, 30, 34, 41, 43, 117,
121, 154, 156, 159, 160, 162, 168, 173, 179, 182, 184, 185, 187, 191
Roll Center Calculator, 1, 11, 28, 41, 191 Roll Center Calculator Plus, 1, 11, 191 Roll Center Migration, 179 Roll stiffness, 38, 120, 121, 167, 189, 191 Roll Stiffness, 120, 121 Rolling Radius, 80, 81, 82 Roof Height, 80 RPM at HP Peak, 72, 73 RPM at Peak HP, 71 Rule of Thumb, 119, 122, 123, 179, 192 Running Conditions, 5, 24, 59, 67, 87, 88, 127,
128, 132, 147, 148 Safety, 3 Satchell (Terry), 180 Save, 1, 5, 16, 17, 41, 42, 57, 108, 109, 114,
151, 154, 185 Save As, 42, 57, 154 Scales, 103, 104 Scrub, 34, 37, 120, 122, 185, 192 Scrub Radius, 34, 37, 120 Sec, 67 Setup, 16, 100, 119, 144, 188 Shim, 41, 44, 45 Show Dive & Roll, 27, 38, 159 Single Step, 119 Spindle Angle, 34, 38, 44 Spoiler, 22, 23, 24, 191 Spring, 32, 33, 34, 35, 36, 37, 39, 51, 52, 53,
54, 83, 84, 120, 121, 154, 160 Spring Compressn, 160 Spring Deflection, 39 Spring Front Height, 52
Spring Length, 35, 36, 84 Spring Rate, 32, 33, 35, 36, 37, 51, 52, 54, 83,
120, 121 Spring Rear Height, 54 Spring Rear to Axle, 53 Spring to Axle, 51 Spring to Centerline, 51, 52 Spring Width, 84 Sprocket, 78, 79 Static Camber, 173 Static Layout, 27, 28, 34, 35 Stiffness, 38, 120, 121, 167, 189, 191 Straight Axle, 34 Suspension, 5, 6, 1, 8, 11, 20, 26, 27, 28, 29,
30, 33, 34, 35, 37, 38, 39, 40, 41, 42, 43, 44, 45, 46, 47, 48, 49, 54, 55, 56, 57, 58, 63, 66, 76, 83, 85, 86, 87, 93, 106, 109, 111, 116, 117, 119, 120, 121, 122, 123, 138, 144, 145, 146, 147, 150, 151, 153, 154, 155, 156, 159, 160, 161, 162, 163, 164, 167, 168, 172, 174, 175, 179, 182, 184, 185, 189, 191, 192
Suspension Calculations, 119, 120 Suspension Layout, 27, 30, 39, 40, 43, 44, 55,
120, 121 Suspension Library, 154 T Bar Rate, 36 T.Bar Arm to Centerline, 54 Tech Help, 3, 4 Test Results, 5, 17, 24, 65, 93, 98, 99, 112, 116,
117, 118, 119, 129, 130, 132, 133, 134, 136, 149, 161, 162
Thick Lines, 13 Thin Lines, 13 Tire Change, 184 Tire Diameter, 26, 80, 179 Tire Scrub, 179 Tire to Centerline, 49, 51, 52 Titles, 102 Torsion Bar Diameter, 85 Torsion Bar Length, 85 Torsion Bar Rate, 35, 36, 37 Torsion Bars, 35, 37, 54, 83, 85 Total Vehicle Weight, 76 Total Weight with Driver, 20
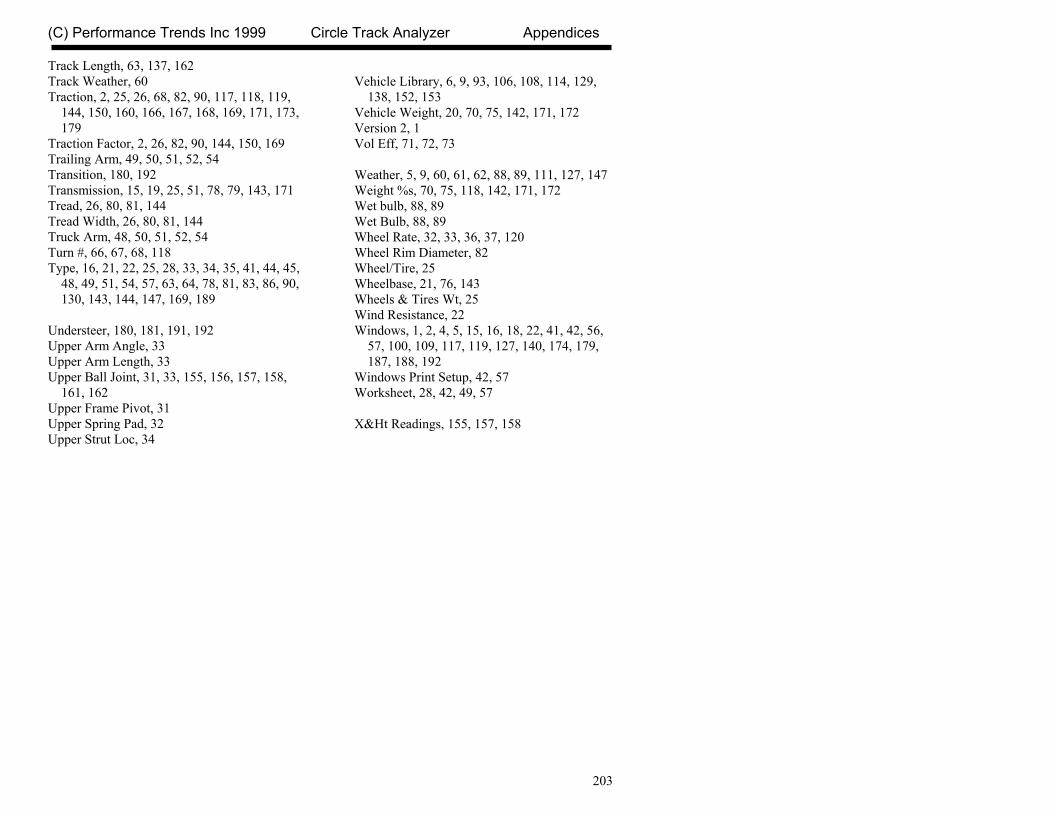
(C) Performance Trends Inc 1999 Circle Track Analyzer Appendices
203
Track Length, 63, 137, 162 Track Weather, 60 Traction, 2, 25, 26, 68, 82, 90, 117, 118, 119,
144, 150, 160, 166, 167, 168, 169, 171, 173, 179
Traction Factor, 2, 26, 82, 90, 144, 150, 169 Trailing Arm, 49, 50, 51, 52, 54 Transition, 180, 192 Transmission, 15, 19, 25, 51, 78, 79, 143, 171 Tread, 26, 80, 81, 144 Tread Width, 26, 80, 81, 144 Truck Arm, 48, 50, 51, 52, 54 Turn #, 66, 67, 68, 118 Type, 16, 21, 22, 25, 28, 33, 34, 35, 41, 44, 45,
48, 49, 51, 54, 57, 63, 64, 78, 81, 83, 86, 90, 130, 143, 144, 147, 169, 189
Understeer, 180, 181, 191, 192 Upper Arm Angle, 33 Upper Arm Length, 33 Upper Ball Joint, 31, 33, 155, 156, 157, 158,
161, 162 Upper Frame Pivot, 31 Upper Spring Pad, 32 Upper Strut Loc, 34
Vehicle Library, 6, 9, 93, 106, 108, 114, 129,
138, 152, 153 Vehicle Weight, 20, 70, 75, 142, 171, 172 Version 2, 1 Vol Eff, 71, 72, 73 Weather, 5, 9, 60, 61, 62, 88, 89, 111, 127, 147 Weight %s, 70, 75, 118, 142, 171, 172 Wet bulb, 88, 89 Wet Bulb, 88, 89 Wheel Rate, 32, 33, 36, 37, 120 Wheel Rim Diameter, 82 Wheel/Tire, 25 Wheelbase, 21, 76, 143 Wheels & Tires Wt, 25 Wind Resistance, 22 Windows, 1, 2, 4, 5, 15, 16, 18, 22, 41, 42, 56,
57, 100, 109, 117, 119, 127, 140, 174, 179, 187, 188, 192
Windows Print Setup, 42, 57 Worksheet, 28, 42, 49, 57 X&Ht Readings, 155, 157, 158